Prevalence of the sickle cell trait in Gabon: a nationwide study
15
Patterns of selection on Plasmodium falciparum erythrocyte-binding antigens after the colonization of the New World ERHAN YALCINDAG,* † 1 VIRGINIE ROUGERON,* ‡ 1 ERIC ELGUERO,* C ELINE ARNATHAU,* PATRICK DURAND,* SYLVAIN BRISSE, § LAURE DIANCOURT, § AGNES AUBOUY, ¶ PIERRE BECQUART,* UMBERTO D’ ALESSANDRO,** DIDIER FONTENILLE,* DIONICIA GAMBOA, †† AMANDA MAESTRE, ‡‡ DIDIER M ENARD, §§ LISE MUSSET, ¶¶ OSCAR NOYA,*** VINCENT VERON, ††† ALBINA WIDE,*** BERNARD CARME, ‡‡‡ ERIC LEGRAND, ¶¶ CHRISTINE CHEVILLON,* FRANCISCO J. AYALA, §§§ FRANC ß OIS RENAUD* 2 and FRANCK PRUGNOLLE* ‡ 2 *MIVEGEC (Laboratoire Maladies Infectieuses et Vecteurs, Ecologie, G en etique, Evolution et Contr^ ole), UMR CNRS 5290/IRD 224, Universit e Montpellier 1, Universit e Montpellier 2, CHRU de Montpellier, 39 Avenue Charles Flahault, 34295 Montpellier, France, †Department of Botany and Zoology, Faculty of Science, Masaryk University, Kotl a rsk a 2, 611 37 Brno, Czech Republic, ‡Centre International de Recherches M edicales de Franceville (CIRMF), BP 769 Franceville, Gabon, §Institut Pasteur, Plate- forme G enotypage des Pathog enes et Sant e Publique, 28 Rue du docteur Roux, 75724 Paris, France, ¶Institut de Recherche pour le D eveloppement (IRD), UMR152, Universit e Paul Sabatier, 35 Chemin des Mara ^ ıchers, 31062 Toulouse, France, **Department of Parasitology, Institute of Tropical Medicine, Antwerp, Belgium, ††Instituto de Medicina Tropical Alexander Von Humboldt, Universidad Peruana Cayetano Heredia, AP 4314, Lima, 100, Peru, ‡‡Grupo Salud y Comunidad, Facultad de Medicina, Universidad de Antioqu ıa, Medell ın, Colombia, §§Molecular Epidemiology Unit, Pasteur Institute of Cambodia, 5 Boulevard Monivong - PO Box 983 Phnom Penh, Cambodia, ¶¶Parasitology laboratory, Institut Pasteur de Guyane, BP6010, 97306 Cayenne Cedex, French Guiana, ***Centro para Estudios Sobre Malaria, Instituto de Altos Estudios en Salud “Dr. Arnoldo Gabald on”-INH, Ministerio del Poder Popular para la Salud, Instituto de Medicina Tropical, Universidad Central de Venezuela, Caracas, Venezuela, †††INRA, equipe NuM eA, 64310 St P ee sur Nivelle, France, ‡‡‡Centre d’Investigation Clinique Epid emiologie Clinique Antilles, Guyane CIC-EC 802, Cayenne General Hospital, Cayenne, French Guiana, §§§Department of Ecology and Evolutionary Biology, University of California, Irvine, CA 92697, USA Abstract Pathogens, which have recently colonized a new host species or new populations of the same host, are interesting models for understanding how populations may evolve in response to novel environments. During its colonization of South America from Africa, Plasmodium falciparum, the main agent of malaria, has been exposed to new conditions in distinctive new human populations (Amerindian and populations of mixed origins) that likely exerted new selective pressures on the parasite’s genome. Among the genes that might have experienced strong selective pressures in response to these environmental changes, the eba genes (erythrocyte-binding antigens genes), which are involved in the invasion of the human red blood cells, constitute good can- didates. In this study, we analysed, in South America, the polymorphism of three eba genes (eba-140, eba-175, eba-181) and compared it to the polymorphism observed in African populations. The aim was to determine whether these genes faced selective pressures in South America distinct from what they experienced in Africa. Patterns of genetic variability of these genes were compared to the patterns observed at two Correspondence: Erhan Yalcindag, Virginie Rougeron, Franc ßois Renaud and Franck Prugnolle, Fax: 0033467416299; E-mails: [email protected], [email protected], francois. [email protected] and [email protected] 1 E.Y. and V.R. Contributed equally to this work. 2 F.P. and F.R. supervised this work. Molecular Ecology (2014) 23, 1979–1993 doi: 10.1111/mec.12696 © 2014 John Wiley & Sons Ltd
-
Upload
independent -
Category
Documents
-
view
2 -
download
0
Transcript of Prevalence of the sickle cell trait in Gabon: a nationwide study
Patterns of selection on Plasmodium falciparumerythrocyte-binding antigens after the colonization of theNew World
ERHAN YALCINDAG,*† 1 VIRGINIE ROUGERON,*‡ 1 ERIC ELGUERO,* C �ELINE ARNATHAU,*
PATRICK DURAND,* SYLVAIN BRISSE,§ LAURE DIANCOURT,§ AGNES AUBOUY,¶ PIERRE
BECQUART,* UMBERTO D’ ALESSANDRO,** DIDIER FONTENILLE,* DIONICIA GAMBOA,† †
AMANDA MAESTRE,‡ ‡ DIDIER M �ENARD,§§ LISE MUSSET,¶¶ OSCAR NOYA,*** VINCENT
VERON,† † † ALBINA WIDE,*** BERNARD CARME,‡ ‡ ‡ ERIC LEGRAND,¶¶ CHRISTINE
CHEVILLON,* FRANCISCO J . AYALA,§§§ FRANC� OIS RENAUD*2 and FRANCK PRUGNOLLE*‡ 2
*MIVEGEC (Laboratoire Maladies Infectieuses et Vecteurs, Ecologie, G�en�etique, Evolution et Controle), UMR CNRS 5290/IRD
224, Universit�e Montpellier 1, Universit�e Montpellier 2, CHRU de Montpellier, 39 Avenue Charles Flahault, 34295 Montpellier,
France, †Department of Botany and Zoology, Faculty of Science, Masaryk University, Kotl�a�rsk�a 2, 611 37 Brno, Czech Republic,
‡Centre International de Recherches M�edicales de Franceville (CIRMF), BP 769 Franceville, Gabon, §Institut Pasteur, Plate-forme G�enotypage des Pathog�enes et Sant�e Publique, 28 Rue du docteur Roux, 75724 Paris, France, ¶Institut de Recherche pourle D�eveloppement (IRD), UMR152, Universit�e Paul Sabatier, 35 Chemin des Maraıchers, 31062 Toulouse, France, **Department
of Parasitology, Institute of Tropical Medicine, Antwerp, Belgium, ††Instituto de Medicina Tropical Alexander Von Humboldt,
Universidad Peruana Cayetano Heredia, AP 4314, Lima, 100, Peru, ‡‡Grupo Salud y Comunidad, Facultad de Medicina,
Universidad de Antioqu�ıa, Medell�ın, Colombia, §§Molecular Epidemiology Unit, Pasteur Institute of Cambodia, 5 Boulevard
Monivong - PO Box 983 Phnom Penh, Cambodia, ¶¶Parasitology laboratory, Institut Pasteur de Guyane, BP6010, 97306
Cayenne Cedex, French Guiana, ***Centro para Estudios Sobre Malaria, Instituto de Altos Estudios en Salud “Dr. Arnoldo
Gabald�on”-INH, Ministerio del Poder Popular para la Salud, Instituto de Medicina Tropical, Universidad Central de Venezuela,
Caracas, Venezuela, †††INRA, �equipe NuM�eA, 64310 St P�ee sur Nivelle, France, ‡‡‡Centre d’Investigation Clinique
Epid�emiologie Clinique Antilles, Guyane CIC-EC 802, Cayenne General Hospital, Cayenne, French Guiana, §§§Department of
Ecology and Evolutionary Biology, University of California, Irvine, CA 92697, USA
Abstract
Pathogens, which have recently colonized a new host species or new populations of
the same host, are interesting models for understanding how populations may evolve
in response to novel environments. During its colonization of South America from
Africa, Plasmodium falciparum, the main agent of malaria, has been exposed to new
conditions in distinctive new human populations (Amerindian and populations of
mixed origins) that likely exerted new selective pressures on the parasite’s genome.
Among the genes that might have experienced strong selective pressures in response
to these environmental changes, the eba genes (erythrocyte-binding antigens genes),
which are involved in the invasion of the human red blood cells, constitute good can-
didates. In this study, we analysed, in South America, the polymorphism of three ebagenes (eba-140, eba-175, eba-181) and compared it to the polymorphism observed in
African populations. The aim was to determine whether these genes faced selective
pressures in South America distinct from what they experienced in Africa. Patterns of
genetic variability of these genes were compared to the patterns observed at two
Correspondence: Erhan Yalcindag, Virginie Rougeron, Franc�oisRenaud and Franck Prugnolle, Fax: 0033467416299; E-mails:
[email protected], [email protected], francois.
[email protected] and [email protected]. and V.R. Contributed equally to this work.2F.P. and F.R. supervised this work.
Molecular Ecology (2014) 23, 1979–1993 doi: 10.1111/mec.12696
© 2014 John Wiley & Sons Ltd
housekeeping genes (adsl and serca) and 272 SNPs to separate adaptive effects from
demographic effects. We show that, conversely to Africa, eba-140 seemed to be under
stronger diversifying selection in South America than eba-175. In contrast, eba-181 did
not show any sign of departure from neutrality. These changes in the patterns of selec-
tion on the eba genes could be the consequence of changes in the host immune
response, the host receptor polymorphisms and/or the ability of the parasite to silence
or express differentially its invasion proteins.
Keywords: adaptation, balancing selection, co-evolution, invasion, malaria
Received 8 August 2013; revision received 29 January 2014; accepted 7 February 2014
Introduction
One way to approach and analyse the adaptation of
parasites to new environments is to analyse past events
of emergence, for example the colonization of a new
host species or a new population (Lee 2002; Pepin et al.
2010). During the evolution of human populations,
emergence of infectious diseases has been highly recur-
rent, and there are now several examples of past emer-
gences that might serve as models to analyse how
pathogens adapted to new environmental conditions.
The malaria agent Plasmodium falciparum is one of these.
P. falciparum is a protozoan parasite responsible for
the most serious form of malaria, killing almost one
million people every year, principally children under
the age of five (Snow et al. 2005; WHO 2012). The num-
ber of clinical cases is estimated between 300 and 500
million per year in the world and is therefore a major
public health concern (WHO 2012). During its life cycle,
P. falciparum successively infects two hosts: a vector
host of the genus Anopheles (mosquito) and the verte-
brate host Homo sapiens sapiens.
During its evolutionary history, P. falciparum has
emerged and colonized new environments several times
(Hume et al. 2003; Tanabe et al. 2010; Yalcindag et al.
2012). One major event of P. falciparum emergence in a
new area occurred in South America during the transat-
lantic slave trade that started 500 years ago from the
African continent and during which millions of African
slaves were forcedly transferred on the American conti-
nent (Conway et al. 2000; Yalcindag et al. 2012). During
this colonization, the parasite encountered new environ-
mental conditions: a new human host environment
(Amerindian, European, and populations of mixed ori-
gins) and a new vector environment. The species com-
plex Anopheles darlingi is the main vector in South
America, while the major species of vectors in Africa
are species of the complex An. gambiae and An. funestus
(Mirabello & Conn 2006).
The environmental changes that occurred during the
colonization of South America by P. falciparum likely
resulted in powerful selective pressures that forced the
parasite to adapt to these new local environmental con-
ditions and evolve towards different phenotypes and
genotypes. Among the genes that might have experienced
strong selective pressures in response to these environ-
mental changes, the eba genes (erythrocyte-binding
antigens genes), which are involved in the invasion
of the human red blood cells, constitute good candi-
dates.
Invasion of erythrocytes by the malaria parasite P. fal-
ciparum is a complex process involving a cascade of
specific protein–protein interactions between the mero-
zoite blood stage and the erythrocyte (Chitnis 2001). In
the parasite, this involves two protein families: the
erythrocyte-binding antigen (eba) (also called the
erythrocyte-binding ligand ebl) and the Plasmodium
falciparum-reticulocyte-binding Homolog (PfRH) gene
families. We focused here on the eba gene family which
consists of five divergent genes in P. falciparum of
which three produce functional proteins: eba-140
(MAL13P1.60), eba-175 (MAL7P1.176) and eba-181
(PFA0125c) (Sim et al. 1990; Adams et al. 2001; Chitnis
2001). The EBA proteins have two cysteine-rich regions,
one located near the N-terminal end of each protein
and another near their C-terminal end (Adams et al.
1992, 2001). The N-terminal cysteine-rich region is
termed ‘Region II’ (Adams et al. 1992) and consists of
two tandem Duffy-binding-like (DBL) domains (called
F1 and F2) that bind to specific receptors at the surface
of the red blood cells. The receptors for eba-175 and
eba-140 are glycophorin A and C, respectively (Camus
& Hadley 1985; Joshua-Tor et al. 2005), while eba-181
binds to a still unknown receptor.
Eba genes are suspected to be under diversifying
selection (Baum et al. 2003; Verra et al. 2006). This
selection is likely of various origins. First, polymor-
phisms at these genes could be maintained by selec-
tion because they provide variable binding affinities to
the polymorphic host glycoproteins (e.g. glycophorin
A and B). Thus, it has been shown that non-synony-
mous polymorphisms in region II of eba-140 and eba-
181 affected their receptor specificity (Mayer et al.
2002, 2004). Another source of selection could be the
1980 E. YALCINDAG ET AL.
© 2014 John Wiley & Sons Ltd

immune system. EBA proteins are known to induce a
protective immune response which could in turn select
for polymorphic amino acids in the target regions
(Tham et al. 2012).
Patterns of selection on eba genes were previously
studied in Africa and Asia, and the strongest traces of
selection were observed for eba-175, thus suggesting
that among eba genes, this gene was the most submitted
to diversifying selection (Baum et al. 2003; Verra et al.
2006; Amambua-Ngwa et al. 2012). In South America,
no studies have been performed so far. Are eba genes
submitted to the same type or same strength of selec-
tion in this area? May selection have changed following
the colonization of the New World? We hypothesize
that the differences in host environment experienced by
the parasites during the colonization of South America
resulted in changes in the strength and types of selec-
tion imposed on eba genes. On this continent, human
populations are indeed different from those on the Afri-
can continent (Zietkiewicz et al. 1997; Rosenberg et al.
2002).
To study selection on eba genes in South America, we
examined the sequence diversity of the eba genes in sev-
eral South American populations and compared it to
the patterns of genetic diversity observed in several
African populations. Because the human environment
encountered by the parasite is heterogeneous on the
South American continent, it is likely that eba genes
may have experienced divergent selection (local adapta-
tion). To take this possibility into account, we analysed
the patterns of selection among P. falciparum popula-
tions living in different host environments. Thus, para-
site populations specifically infecting Amerindians,
Maroons (South American populations descending
directly from African slaves) as well as populations of
mixed origin were collected and studied. Patterns of
genetic variability of the eba genes were compared to
the patterns observed at two housekeeping genes (adsl
and serca) as well as SNPs (single nucleotide polymor-
phisms) distributed all over the genome to separate
adaptive effects from pure demographic effects.
Material and methods
Sample collection
Our study was conducted on two types of sequence
data: (i) sequences produced in this study and (ii)
sequences retrieved from the literature. This concerned
two kind of genes: the eba genes and two housekeeping
genes considered to evolve mostly neutrally (Tanabe
et al. 2010): the sarcoplasmic/endoplasmic Ca²+ -ATPase
(serca) gene and the adenylosuccinate lyase (adsl).
Regarding the first kind of data, P. falciparum-infected
human blood samples were collected from six different
countries: two from Africa and four from South Amer-
ica (Fig. 1 and Table S1, Supporting information). In
South America and in particular in French Guiana, two
populations were collected in villages (Camopi and
Trois Sauts) mainly inhabited by Amerindian persons
(belonging to the Wayampi and Emerillon tribes),
another in a village (Maripasoula) mainly inhabited by
descendants of Maroon people (Boni ethny). Maroons
were African slaves that escaped and formed indepen-
dent settlements together. The other P. falciparum popu-
lations of South America were collected in areas
inhabited by human populations of mixed origins. In
Africa, samples were collected in Benin and Madagas-
car (See Table S1, Supporting information). Infected
blood samples were collected either by venous puncture
(~500 lL) or by finger-prick (~50 lL). All blood samples
were collected after informed consent. Ethical clearance
EBA sequences: this study
ADSL and SERCA sequences: this study
EBA sequences: from literature
ADSL and SERCA sequences: from literature
Trs
Cmp
Per
MarVenColBen
Gha
Nig
Mad
Ken
Tan
Mal Mad 2
Fig. 1 Geographical location of study
sites. In Africa: Ben, Benin; Gha, Ghana;
Ken, Kenya; Mad, Madagascar; Mad 2,
Madagascar2; Mal, Malawi; Nig, Nigeria;
Tan, Tanzania. In South America: Cmp,
Camopi (French Guiana); Col, Colombia;
Mar, Maripasoula (French Guiana); Per,
Peru; Trs, Trois Sauts (French Guiana);
Ven, Venezuela. Indications regarding the
places where eba, adsl and serca sequences
were obtained are provided. For more
information, please refer to Tables S1 and
S2 (Supporting information).
P. FALCIPARUM ADAPTIVE EVOLUTION IN SOUTH AMERICA 1981
© 2014 John Wiley & Sons Ltd
was obtained from local ethic committees in each coun-
try sampled.
For the sequences retrieved from the literature, this
concerned only African populations. Eba sequences as
well as adsl and serca sequences were retrieved. Several
sources of sequences were used (Baum et al. 2003; Verra
et al. 2006; Tanabe et al. 2010). Details regarding the
location of the study sites are given in Fig. 1 and Table
S2 (Supporting information).
DNA extraction, PCR conditions and sequencing
DNA was extracted using the DNeasy blood and tissue
kit (Qiagen, France) according to the manufacturer’s
recommendations and eluted in 100 lL of elution buffer
per 200 lL of whole blood or per filter blot.
From each isolate, the eba-140, eba-175 and eba-181
genes were amplified by a two-step semi-nested PCR
using forward and reverse primers (Table S3, Support-
ing information). PCR amplification was performed on
20 lL volumes containing 0.2 unit of Expand high fidel-
ity GoTAQ enzyme (Promega, Madison, USA), 5 9
Expand reaction buffer, 25 mM MgCl2, 10 pmol/lL of
each primer and 10 ng P. falciparum DNA. The PCR I
cycles were: 94 °C (2 min), [94 °C (30 s), 48 °C for eba-
140, 50 °C for eba-175 and 52 °C for eba-181 (30 s), 72 °C(2 min)] for 35 cycles and 5 min at 72 °C final exten-
sion. The PCR II cycles were 94 °C (2 min), [94 °C(30 s), 50 °C for eba-140 and eba-181, 47 °C for eba-175
(30 s), 72 °C (2 min)] for 35 cycles and 5 min at 72 °Cfinal extension.
Full-length serca and adsl were amplified by PCR
using Takara LA taq polymerase (Takara Bio, Japan) in
a reaction mixture, as previously described (Tanabe
et al. 2010). PCR products were purified by PCR Spin
Column Kits (Qiagen) and sequenced by Eurofins
(MWG, Ebersberg, Germany).
All of the sequences were manually checked and
assembled using CodonCode Aligner software (www.
codoncode.com). Sequences were aligned using CLUSTAL
W with BIOEDIT software version 7.0.9.0.
Additional genetic information
For the same samples as the ones used in this study
(not those obtained from literature), we previously
had obtained some genetic information on a set of
272 SNP and 12 microsatellite markers (please see
Yalcindag et al. (2012) for more information on these
markers). This information, especially that regarding
the SNPs, will be further used to disentangle the
effects of demography from those of selection in
shaping the patterns of genetic variability at eba
genes.
Multiplicity of infections
Blood samples are frequently infected with two or more
haploid clones of P. falciparum, resulting in the detec-
tion of two or more alleles at polymorphic loci. Isolates
with more than one allele at any of the 12 microsatellite
loci were removed from the analyses [see Table S1
(Supporting information) for more details and Yalcin-
dag et al. (2012)]. For Africa, we discarded between 55
to 80% of the samples. For South America, between 20
and 47% of the samples were discarded in each popula-
tion (Table S1 and S2, Supporting information). A sub-
set of these mono-infected samples was sequenced for
each population (Table 1).
Data analyses
The five genes were studied separately. Hence, the
analyses described hereafter were performed for each
gene. Because we could expect changes of selection pat-
terns between Africa and South America, comparisons
between the populations from the two continents were
systematically made.
Genetic diversity and population differentiation
For each population, sequence diversity was estimated
by p, the average nucleotide diversity, using the soft-
ware DNASP V5.10. (Rozas et al. 2003). For each pair of
populations, levels of genetic differentiation were mea-
sured by the Wright fixation index, FST, and departure
from 0 was tested using ARLEQUIN ver.3.1 (Excoffier et al.
1992). Average values were subsequently computed for
all pairs of populations belonging to the same continent
(FST intra).
Tests of neutrality
Several statistics and tests were used to explore the pat-
terns of selection occurring on eba genes in the South
American populations.
Frequency-spectrum-based tests of selection. First of all, Taj-
ima’s D statistics (Tajima 1989) were computed for each
population and compared to the values observed in the
African populations. This statistic detects departures
from neutrality in allele frequency distributions by com-
paring the number of polymorphic sites and the pair-
wise nucleotide diversity, two measures of within
population sequence diversity (Tajima 1989). Under
neutrality, these two measures are similar and the Taj-
ima’s D displays a null value. Under balancing selec-
tion, a positive value is expected, while under positive
selection, a negative one is observed. Departure from 0
1982 E. YALCINDAG ET AL.
© 2014 John Wiley & Sons Ltd
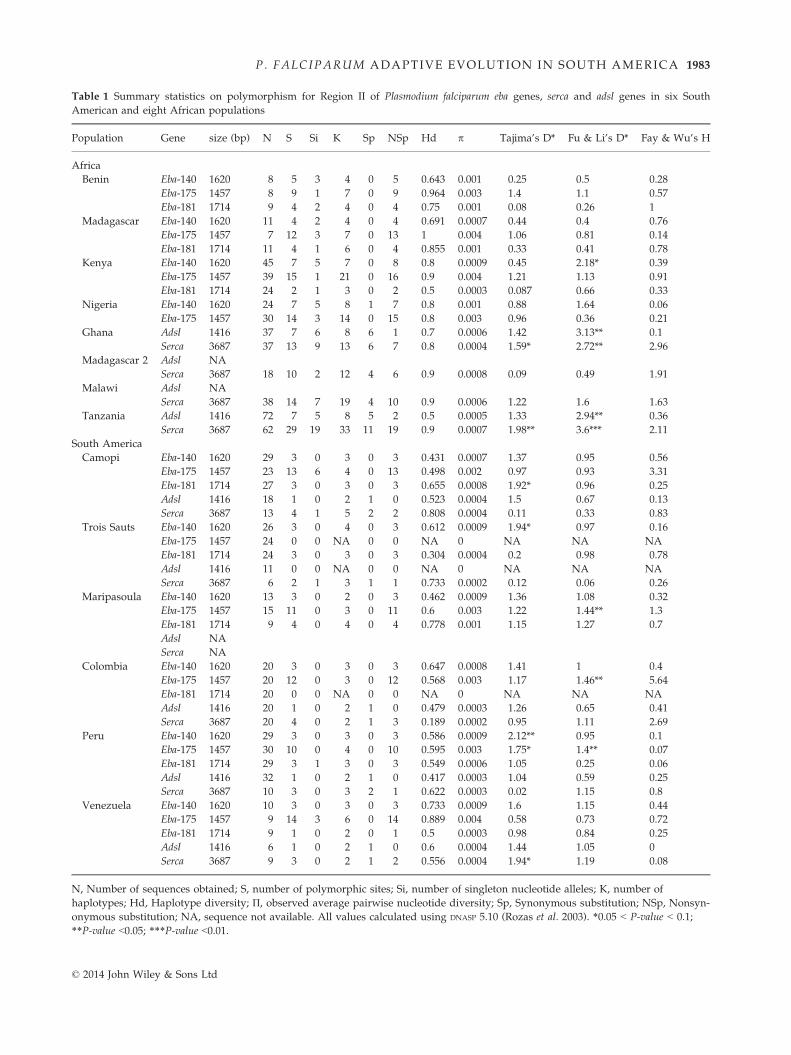
Table 1 Summary statistics on polymorphism for Region II of Plasmodium falciparum eba genes, serca and adsl genes in six South
American and eight African populations
Population Gene size (bp) N S Si K Sp NSp Hd p Tajima’s D* Fu & Li’s D* Fay & Wu’s H
Africa
Benin Eba-140 1620 8 5 3 4 0 5 0.643 0.001 �0.25 �0.5 0.28
Eba-175 1457 8 9 1 7 0 9 0.964 0.003 1.4 1.1 �0.57
Eba-181 1714 9 4 2 4 0 4 0.75 0.001 0.08 �0.26 �1
Madagascar Eba-140 1620 11 4 2 4 0 4 0.691 0.0007 �0.44 �0.4 �0.76
Eba-175 1457 7 12 3 7 0 13 1 0.004 1.06 0.81 �0.14
Eba-181 1714 11 4 1 6 0 4 0.855 0.001 0.33 0.41 0.78
Kenya Eba-140 1620 45 7 5 7 0 8 0.8 0.0009 �0.45 �2.18* �0.39
Eba-175 1457 39 15 1 21 0 16 0.9 0.004 1.21 1.13 0.91
Eba-181 1714 24 2 1 3 0 2 0.5 0.0003 �0.087 �0.66 0.33
Nigeria Eba-140 1620 24 7 5 8 1 7 0.8 0.001 �0.88 �1.64 �0.06
Eba-175 1457 30 14 3 14 0 15 0.8 0.003 0.96 0.36 0.21
Ghana Adsl 1416 37 7 6 8 6 1 0.7 0.0006 �1.42 �3.13** 0.1
Serca 3687 37 13 9 13 6 7 0.8 0.0004 �1.59* �2.72** �2.96
Madagascar 2 Adsl NA
Serca 3687 18 10 2 12 4 6 0.9 0.0008 �0.09 0.49 1.91
Malawi Adsl NA
Serca 3687 38 14 7 19 4 10 0.9 0.0006 �1.22 �1.6 1.63
Tanzania Adsl 1416 72 7 5 8 5 2 0.5 0.0005 �1.33 �2.94** �0.36
Serca 3687 62 29 19 33 11 19 0.9 0.0007 �1.98** �3.6*** �2.11
South America
Camopi Eba-140 1620 29 3 0 3 0 3 0.431 0.0007 1.37 0.95 0.56
Eba-175 1457 23 13 6 4 0 13 0.498 0.002 �0.97 �0.93 �3.31
Eba-181 1714 27 3 0 3 0 3 0.655 0.0008 1.92* 0.96 0.25
Adsl 1416 18 1 0 2 1 0 0.523 0.0004 1.5 0.67 �0.13
Serca 3687 13 4 1 5 2 2 0.808 0.0004 0.11 0.33 0.83
Trois Sauts Eba-140 1620 26 3 0 4 0 3 0.612 0.0009 1.94* 0.97 �0.16
Eba-175 1457 24 0 0 NA 0 0 NA 0 NA NA NA
Eba-181 1714 24 3 0 3 0 3 0.304 0.0004 �0.2 0.98 �0.78
Adsl 1416 11 0 0 NA 0 0 NA 0 NA NA NA
Serca 3687 6 2 1 3 1 1 0.733 0.0002 0.12 0.06 �0.26
Maripasoula Eba-140 1620 13 3 0 2 0 3 0.462 0.0009 1.36 1.08 0.32
Eba-175 1457 15 11 0 3 0 11 0.6 0.003 1.22 1.44** 1.3
Eba-181 1714 9 4 0 4 0 4 0.778 0.001 1.15 1.27 �0.7
Adsl NA
Serca NA
Colombia Eba-140 1620 20 3 0 3 0 3 0.647 0.0008 1.41 1 0.4
Eba-175 1457 20 12 0 3 0 12 0.568 0.003 1.17 1.46** �5.64
Eba-181 1714 20 0 0 NA 0 0 NA 0 NA NA NA
Adsl 1416 20 1 0 2 1 0 0.479 0.0003 1.26 0.65 �0.41
Serca 3687 20 4 0 2 1 3 0.189 0.0002 �0.95 1.11 �2.69
Peru Eba-140 1620 29 3 0 3 0 3 0.586 0.0009 2.12** 0.95 0.1
Eba-175 1457 30 10 0 4 0 10 0.595 0.003 1.75* 1.4** �0.07
Eba-181 1714 29 3 1 3 0 3 0.549 0.0006 1.05 �0.25 0.06
Adsl 1416 32 1 0 2 1 0 0.417 0.0003 1.04 0.59 0.25
Serca 3687 10 3 0 3 2 1 0.622 0.0003 0.02 1.15 0.8
Venezuela Eba-140 1620 10 3 0 3 0 3 0.733 0.0009 1.6 1.15 0.44
Eba-175 1457 9 14 3 6 0 14 0.889 0.004 0.58 0.73 �0.72
Eba-181 1714 9 1 0 2 0 1 0.5 0.0003 0.98 0.84 0.25
Adsl 1416 6 1 0 2 1 0 0.6 0.0004 1.44 1.05 0
Serca 3687 9 3 0 2 1 2 0.556 0.0004 1.94* 1.19 0.08
N, Number of sequences obtained; S, number of polymorphic sites; Si, number of singleton nucleotide alleles; K, number of
haplotypes; Hd, Haplotype diversity; П, observed average pairwise nucleotide diversity; Sp, Synonymous substitution; NSp, Nonsyn-
onymous substitution; NA, sequence not available. All values calculated using DNASP 5.10 (Rozas et al. 2003). *0.05 < P-value < 0.1;
**P-value <0.05; ***P-value <0.01.
P. FALCIPARUM ADAPTIVE EVOLUTION IN SOUTH AMERICA 1983
© 2014 John Wiley & Sons Ltd

was tested using a permutation procedure implemented
by DNASP v.5.10. (Rozas et al. 2003).
Second, we computed the Fu and Li’s D* statistics
(Fu & Li 1993). Similarly to Tajima’s D, this test detects
a departure from neutrality by comparing two estimates
of sequence diversity: one based on the number of sin-
gleton nucleotides and one derived from the number of
segregating sites. Under neutrality, Fu and Li’s D* dis-
plays a value of 0. A negative value of Fu and Li’s D*
indicates an excess of singletons, suggestive of positive
selection. At the opposite, a positive value of this D*
parameter suggests a lack of singletons and of rare
alleles, which is indicative of balancing selection.
We finally computed the Fay and Wu’s H statistic.
Contrarily to Tajima’s D and Fu and Li’s D*, this test
was specifically designed to detect recent events of
selective sweep. This test compares the nucleotide diver-
sity estimated from expected heterozygosity against
nucleotide diversity estimated from the allele frequency
of the derived allele at each position (Fay & Wu 2000).
In this context, a negative value of Fay and Wu’s H
is indicative of an excess of high-frequency-derived
alleles, consistent with recent positive selection. The
determination of the identity of the derived alleles was
done using the orthologous sequences of the five genes
retrieved from the genome of Plasmodium reichenowi, a
close relative of P. falciparum infecting chimpanzees
(Accession nos: eba-140 (AY572433), eba-175 (AJ251848),
eba-181 (AY572435), serca (AB122148) and adsl
(AB519183)).
Population genetic differentiation-based tests of selec-
tion. Selection may affect the degree of differentiation
between populations (Nielsen et al. 2005). When a locus
shows higher levels of genetic differentiation compared
with other loci, this may then be interpreted as evi-
dence for positive selection. In contrast, balancing selec-
tion, which tends to maintain more genetic diversity
within populations, generates lower FST values than
expected under neutrality (Nielsen et al. 2005).
Two approaches based on the analysis of genetic dif-
ferentiation were used to analyse selection in the South
American populations. First, we used the outlier detec-
tion approach implemented by Beaumont and Nichols
(Beaumont & Nichols 1996) and implemented in the
program LOSITAN (Antao et al. 2008). This method
was implemented using the set of 272 SNP markers pre-
viously genotyped in the same South American popula-
tions (Yalcindag et al. 2012) in addition to the SNPs
detected in adsl, serca and the three eba genes. Outlier
values of genetic differentiation at specific loci were
detected by running 10 000 coalescent simulations to
generate the expected distribution of Wright’s coeffi-
cient FST as a function of expected heterozygosity (He)
which corresponds to the average probability of choos-
ing two different alleles at random from two different
demes. The distribution of FST was obtained by simulat-
ing an island model with a distribution centred on the
empirical estimates averaged over loci. This average FSTcannot be assumed to be neutral because (initially
unknown) selected loci may be included in the compu-
tation. We thus first ran LOSITAN to determine a sub-
set of candidate selected loci and then removed them
for the computation of the neutral FST. The value
obtained is likely to be a better approximation of the
neutral FST. The approach is expected to be robust with
respect to variation in mutation rate among loci, sample
size and departure from mutation/drift equilibrium
(Beaumont & Nichols 1996).
Second, using the set of SNPs detected to be neutral in
South America with the Beaumont and Nichols (1996)’s
method, we performed another analysis to study the pat-
terns of selection on eba genes. Under neutrality, FST mea-
sured between several pairs of populations using two
independent sets of markers is expected to be correlated
and equal considering the two sets of markers display
the same mutation rate. Patterns of selection in genes can
thus be searched by (i) estimating the slope of the linear
regression of the FST measured using the SNPs of the tar-
get genes between pairs of populations with those
obtained between the same populations using the set of
SNPs identified as evolving neutrally in South America
and (ii) comparing the slope to the distribution of slopes
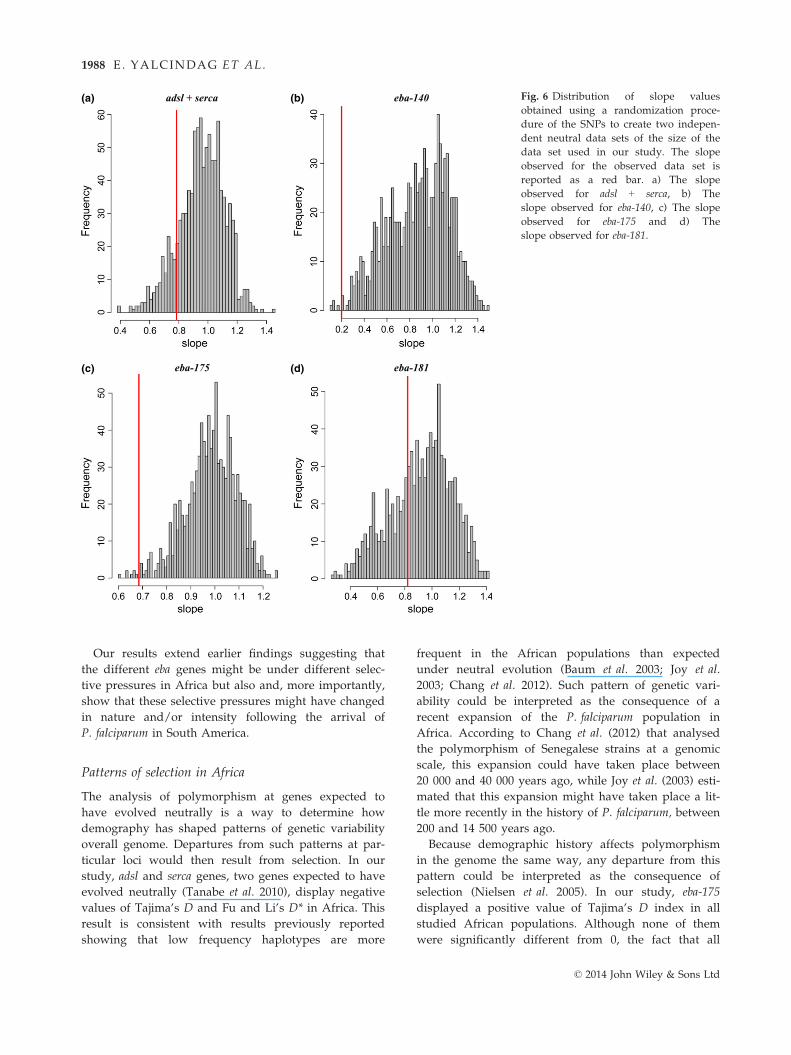
observed under neutral expectations. A resampling test
was used to test the departure of the slopes obtained with
the candidate genes with the expectation under neutral-
ity. Namely, assuming k segregating sites (SNP) were
recorded in the target gene, k SNP were extracted ran-
domly from the neutral data set, FST were computed for
each pair of populations from these k SNP and then
regressed against the FST computed from the whole SNP
data set. This process was repeated 1000 times to yield an
empirical distribution of slopes under the neutrality
hypothesis.
Results
Sequence diversity and genetic differentiation
For eba genes, sequences obtained and analysed in our
study covered 1620 bp of eba-140, 1457 bp of eba-175
and 1714 bp of eba-181. For the housekeeping genes,
adsl and serca, sequences covered 1416 and 3687 bp,
respectively. The total number of sequences obtained
and analysed for each gene and each population is
given in Table 1.
Figure 2 shows the summary statistics computed for
each gene and averaged over all populations in South
1984 E. YALCINDAG ET AL.
© 2014 John Wiley & Sons Ltd
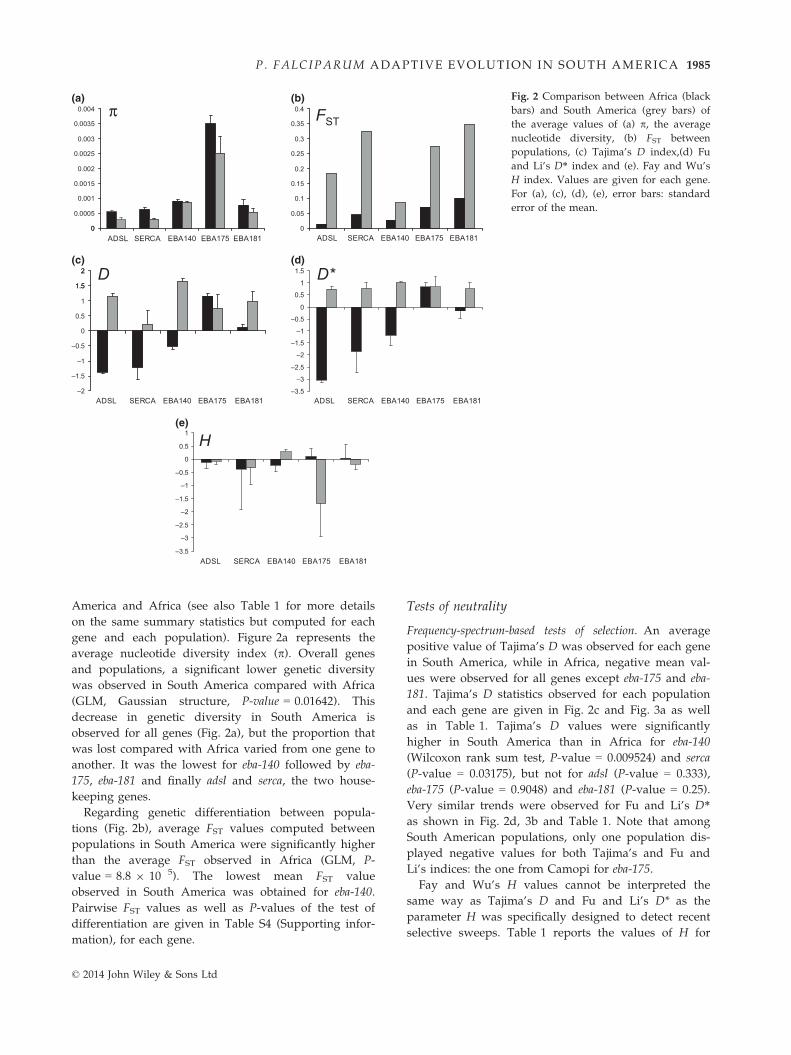
America and Africa (see also Table 1 for more details
on the same summary statistics but computed for each
gene and each population). Figure 2a represents the
average nucleotide diversity index (p). Overall genes
and populations, a significant lower genetic diversity
was observed in South America compared with Africa
(GLM, Gaussian structure, P-value = 0.01642). This
decrease in genetic diversity in South America is
observed for all genes (Fig. 2a), but the proportion that
was lost compared with Africa varied from one gene to
another. It was the lowest for eba-140 followed by eba-
175, eba-181 and finally adsl and serca, the two house-
keeping genes.
Regarding genetic differentiation between popula-
tions (Fig. 2b), average FST values computed between
populations in South America were significantly higher
than the average FST observed in Africa (GLM, P-
value = 8.8 9 10�5). The lowest mean FST value
observed in South America was obtained for eba-140.
Pairwise FST values as well as P-values of the test of
differentiation are given in Table S4 (Supporting infor-
mation), for each gene.
Tests of neutrality
Frequency-spectrum-based tests of selection. An average
positive value of Tajima’s D was observed for each gene
in South America, while in Africa, negative mean val-
ues were observed for all genes except eba-175 and eba-
181. Tajima’s D statistics observed for each population
and each gene are given in Fig. 2c and Fig. 3a as well
as in Table 1. Tajima’s D values were significantly
higher in South America than in Africa for eba-140
(Wilcoxon rank sum test, P-value = 0.009524) and serca
(P-value = 0.03175), but not for adsl (P-value = 0.333),
eba-175 (P-value = 0.9048) and eba-181 (P-value = 0.25).
Very similar trends were observed for Fu and Li’s D*as shown in Fig. 2d, 3b and Table 1. Note that among
South American populations, only one population dis-
played negative values for both Tajima’s and Fu and
Li’s indices: the one from Camopi for eba-175.
Fay and Wu’s H values cannot be interpreted the
same way as Tajima’s D and Fu and Li’s D* as the
parameter H was specifically designed to detect recent
selective sweeps. Table 1 reports the values of H for
0
0.0005
0.001
0.0015
0.002
0.0025
0.003
0.0035
0.004
ADSL SERCA EBA140 EBA175 EBA181
ADSL SERCA EBA140 EBA175 EBA181
ADSL SERCA EBA140 EBA175 EBA181
ADSL SERCA EBA140 EBA175 EBA181
ADSL SERCA EBA140 EBA175 EBA181
π
0
–2
–1.5
–1
–0.5
0
0.5
1
1.5
2 D1.5
2
0
0.05
0.1
0.15
0.2
0.25
0.3
0.35
0.4 FST
–3.5
–3
–2.5
–2
–1.5
–1
–0.5
0
0.5
1
1.5
–3.5
–3
–2.5
–2
–1.5
–1
–0.5
0
0.5
1H
D*
(a) (b)
(c)
(e)
(d)
Fig. 2 Comparison between Africa (black
bars) and South America (grey bars) of
the average values of (a) p, the average
nucleotide diversity, (b) FST between
populations, (c) Tajima’s D index,(d) Fu
and Li’s D* index and (e). Fay and Wu’s
H index. Values are given for each gene.
For (a), (c), (d), (e), error bars: standard
error of the mean.
P. FALCIPARUM ADAPTIVE EVOLUTION IN SOUTH AMERICA 1985
© 2014 John Wiley & Sons Ltd

each gene in each population. Although none of them
significantly depart from 0, it has to be noted that, in
agreement with Tajima’s and Fu and Li’s indices, a
strong negative value was obtained in South America
for eba-175 in the population of Camopi (see Figs 2e
and 3c).
FST-based tests of selection. Two distinct tests of selection
based on the analysis of genetic differentiation between
populations were performed. The first one used the
outlier approach developed by Beaumont & Nichols
(1996) and implemented using a set of 272 SNP mark-
ers previously genotyped in the same South American
populations (Yalcindag et al. 2012) in addition to the
SNPs detected in adsl, serca and the three eba genes.
The test (implemented with the software LOSITAN)
identified five SNPs that fell above the upper 95%
boundary and 12 SNPs that displayed lower estimates
of genetic differentiation than expected under neutral-
ity (data not shown). Regarding the SNPs belonging to
the eba genes, two of three fell below the boundary for
eba-140 (the remaining was very close to the boundary,
P-value = 0.0365), one of 14 for eba-175 and none for
eba-181 (of four). For adsl and serca, all SNPs fell inside
the range of FST values expected under neutrality
(Fig. 4).
The second test of selection compared the FST mea-
sured between pairs of populations in South America
using the neutral set of SNPs (identified in the former
test) and the FST measured using the SNPs from the
studied genes (see Material and Methods for details).
Figure 5 shows the correlations obtained between pair-
wise FST values computed using the neutral set of SNPs
with the FST computed with the housekeeping (adsl and
serca) or the eba genes. The relationships obtained with
the FST computed from the neutral set of SNPs and a
–4
–3
–2
–1
0
1
2
Gh
aT
anG
ha
Mad
2M
alT
anK
enN
igB
enM
adK
enN
igB
enM
adK
enB
enMadCo
l
Ven
Per
Cm
pC
ol
Per
Ven
Cm
p
Cm
p
Ven
Trs
Per M
ar
Co
lM
arP
erV
enC
mp
TrsCo
lM
arP
erV
enC
mp
Trs
Fu
and
Li’s D
*
2.5–2–1.5–1–0.5–00.511.522.5 (a)
(b)
(c)
Tajim
a’s D
Gh
aT
anG
ha
Mad
2M
alT
anK
enN
igB
enM
adK
enN
igB
enM
adK
enB
enM
ad
Co
l
Ven
Per
Cm
pC
ol
Per
Ven Cm
p
Cm
p
Ven
Trs
Per
Mar
Co
lM
arP
erV
enC
mp
Trs
Co
lM
arP
erV
enC
mp
Trs
EBA 140
EBA 175
SERCA
ADSL
EBA 181
–7
–6
–5
–4
–3
–2
–1
0
1
2
3G
ha
Tan
Gh
aM
ad 2
Mal
Tan
Ken
Nig
Ben
MadK
enN
igBen
Mad
Ken
Ben
Mad
Co
l
Ven
Per
Cm
pC
ol
Per
Ven C
mp
Cm
p
Ven
TrsP
erM
ar
Co
lM
arP
erV
enCm
pT
rsC
ol
Mar
PerVen
Cm
p
Trs F
ay and
Wu
’s H
Fig. 3 Comparison between Africa and
South America of (a) Tajima’s D values
obtained for each gene and each popula-
tion, (b) Fu and Li’s D*, and (c) Fay and
Wu’s H. In Africa: Ben, Benin; Gha,
Ghana; Ken, Kenya; Mad, Madagascar;
Mad 2, Madagascar 2; Mal, Malawi; Nig,
Nigeria; Tan, Tanzania. In South Amer-
ica: Cmp: Camopi (French Guiana); Col,
Colombia; Mar, Maripasoula (French
Guiana); Per, Peru; Trs, Trois Sauts
(French Guiana); Ven, Venezuela.
1986 E. YALCINDAG ET AL.
© 2014 John Wiley & Sons Ltd
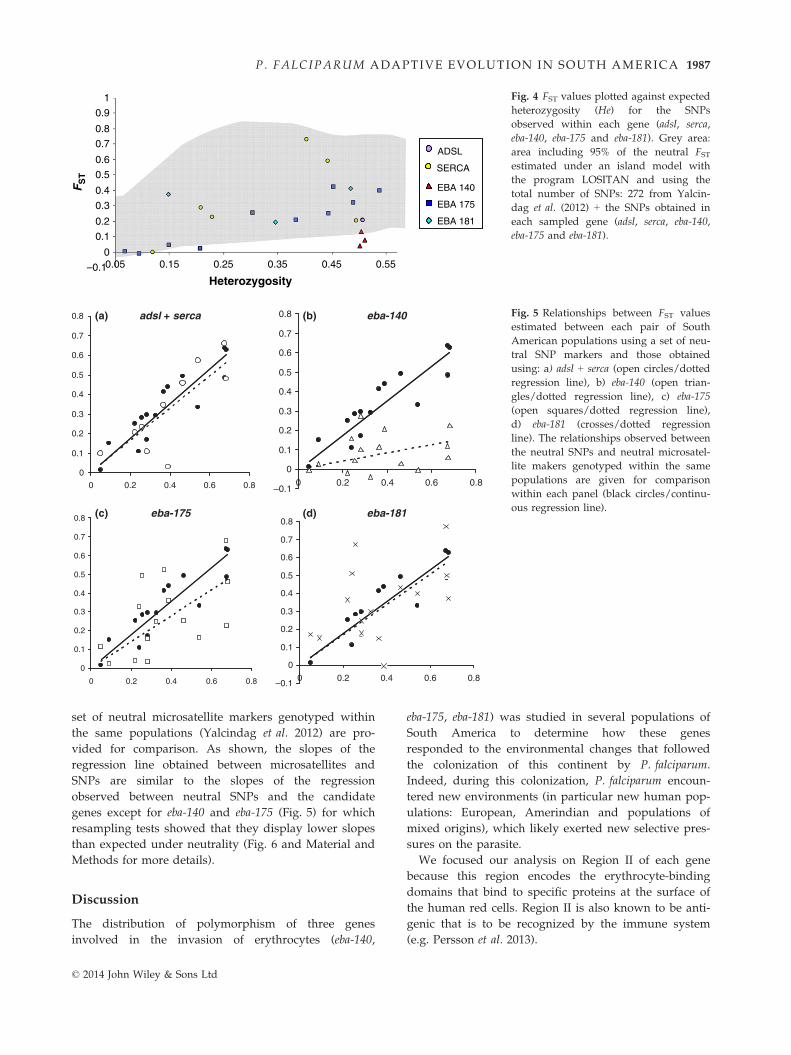
set of neutral microsatellite markers genotyped within
the same populations (Yalcindag et al. 2012) are pro-
vided for comparison. As shown, the slopes of the
regression line obtained between microsatellites and
SNPs are similar to the slopes of the regression
observed between neutral SNPs and the candidate
genes except for eba-140 and eba-175 (Fig. 5) for which
resampling tests showed that they display lower slopes
than expected under neutrality (Fig. 6 and Material and
Methods for more details).
Discussion
The distribution of polymorphism of three genes
involved in the invasion of erythrocytes (eba-140,
eba-175, eba-181) was studied in several populations of
South America to determine how these genes
responded to the environmental changes that followed
the colonization of this continent by P. falciparum.
Indeed, during this colonization, P. falciparum encoun-
tered new environments (in particular new human pop-
ulations: European, Amerindian and populations of
mixed origins), which likely exerted new selective pres-
sures on the parasite.
We focused our analysis on Region II of each gene
because this region encodes the erythrocyte-binding
domains that bind to specific proteins at the surface of
the human red cells. Region II is also known to be anti-
genic that is to be recognized by the immune system
(e.g. Persson et al. 2013).
–0.1
0
0.1
0.2
0.3
0.4
0.5
0.6
0.7
0.8
0.9
1
0.05 0.15 0.25 0.35 0.45 0.55
FS
T
Heterozygosity
EBA 140
EBA 175
SERCA
ADSL
EBA 181
Fig. 4 FST values plotted against expected
heterozygosity (He) for the SNPs
observed within each gene (adsl, serca,
eba-140, eba-175 and eba-181). Grey area:
area including 95% of the neutral FSTestimated under an island model with
the program LOSITAN and using the
total number of SNPs: 272 from Yalcin-
dag et al. (2012) + the SNPs obtained in
each sampled gene (adsl, serca, eba-140,
eba-175 and eba-181).
adsl + serca
0
0.1
0.2
0.3
0.4
0.5
0.6
0.7
0.8
–0.1
0
0.1
0.2
0.3
0.4
0.5
0.6
0.7
0.8
0
0.1
0.2
0.3
0.4
0.5
0.6
0.7
0.8
–0.1
0
0.1
0.2
0.3
0.4
0.5
0.6
0.7
0.8
eba-140
eba-175 eba-181
0 0.2 0.4 0.6 0.8 0 0.2 0.4 0.6 0.8
0 0.2 0.4 0.6 0.8 0 0.2 0.4 0.6 0.8
(a) (b)
(c) (d)
Fig. 5 Relationships between FST values
estimated between each pair of South
American populations using a set of neu-
tral SNP markers and those obtained
using: a) adsl + serca (open circles/dotted
regression line), b) eba-140 (open trian-
gles/dotted regression line), c) eba-175
(open squares/dotted regression line),
d) eba-181 (crosses/dotted regression
line). The relationships observed between
the neutral SNPs and neutral microsatel-
lite makers genotyped within the same
populations are given for comparison
within each panel (black circles/continu-
ous regression line).
P. FALCIPARUM ADAPTIVE EVOLUTION IN SOUTH AMERICA 1987
© 2014 John Wiley & Sons Ltd
Our results extend earlier findings suggesting that
the different eba genes might be under different selec-
tive pressures in Africa but also and, more importantly,
show that these selective pressures might have changed
in nature and/or intensity following the arrival of
P. falciparum in South America.
Patterns of selection in Africa
The analysis of polymorphism at genes expected to
have evolved neutrally is a way to determine how
demography has shaped patterns of genetic variability
overall genome. Departures from such patterns at par-
ticular loci would then result from selection. In our
study, adsl and serca genes, two genes expected to have
evolved neutrally (Tanabe et al. 2010), display negative
values of Tajima’s D and Fu and Li’s D* in Africa. This
result is consistent with results previously reported
showing that low frequency haplotypes are more
frequent in the African populations than expected
under neutral evolution (Baum et al. 2003; Joy et al.
2003; Chang et al. 2012). Such pattern of genetic vari-
ability could be interpreted as the consequence of a
recent expansion of the P. falciparum population in
Africa. According to Chang et al. (2012) that analysed
the polymorphism of Senegalese strains at a genomic
scale, this expansion could have taken place between
20 000 and 40 000 years ago, while Joy et al. (2003) esti-
mated that this expansion might have taken place a lit-
tle more recently in the history of P. falciparum, between
200 and 14 500 years ago.
Because demographic history affects polymorphism
in the genome the same way, any departure from this
pattern could be interpreted as the consequence of
selection (Nielsen et al. 2005). In our study, eba-175
displayed a positive value of Tajima’s D index in all
studied African populations. Although none of them
were significantly different from 0, the fact that all
adsl + serca eba-140
eba-175 eba-181
(a) (b)
(c) (d)
Fig. 6 Distribution of slope values
obtained using a randomization proce-
dure of the SNPs to create two indepen-
dent neutral data sets of the size of the
data set used in our study. The slope
observed for the observed data set is
reported as a red bar. a) The slope
observed for adsl + serca, b) The
slope observed for eba-140, c) The slope
observed for eba-175 and d) The
slope observed for eba-181.
1988 E. YALCINDAG ET AL.
© 2014 John Wiley & Sons Ltd

populations showed similar patterns is consistent with
the hypothesis that this gene is submitted to balancing
(diversifying) selection, as previously suggested (Baum
et al. 2003; Verra et al. 2006; Amambua-Ngwa et al.
2012). This selection was attributed to acquired immu-
nity. Because eba-175 proteins are the target of immune
response and that this response can inhibit invasion,
new alleles of this gene would constantly be selected to
avoid immune detection thus favouring the mainte-
nance of a high diversity of variants (Baum et al. 2003;
Verra et al. 2006).
Eba-140 showed negative values and eba-181 values
close to 0, positive or negative. In the case of eba-140,
these negative values were previously regarded as sug-
gestive of the absence of selection on this gene in Africa
(Baum et al. 2003; Verra et al. 2006). Although this
might indeed be the case, a lower level of diversifying
selection compared with eba-175 is another possibility.
Indeed, despite negative values, it has to be noted that
the Tajima’s and the Fu and Li’s values computed in
the different populations are, on average, higher than
for the housekeeping genes in Africa (Wilcoxon rank
sum test, P-value = 0.057). This could thus be the conse-
quence of balancing selection acting on this gene but at
a lower level than for eba-175. Such a hypothesis would
be more consistent with observations made in natura:
the expression of eba-140 seems to be correlated with
that of eba-175 in African populations (Jennings et al.
2007; Gomez-Escobar et al. 2010) and eba-140 is also
known to induce a protective immune response and
thus to be exposed to the immune system (Tham et al.
2012; Persson et al. 2013). A similar remark can be made
for eba-181. The values close to 0 are not expected under
neutral evolution and could thus be interpreted as a
consequence of immune-mediated selection. Again, the
fact that eba-181 is known to induce an immune
response in the African populations supports this
hypothesis (Ford et al. 2007).
Contrasting patterns of selection in South America
In South America, the patterns of genetic variability
observed among populations are highly different from
what is observed in Africa: on average, genetic diversity
is lower, genetic differentiation between populations is
much larger, and an excess of intermediate frequency
mutations associated with positive Tajima’s and Fu and
Li’s values is observed.
Part of these differences with the African populations
can be attributed to the demographic history of the South
American P. falciparum populations. It is thought that
P. falciparum was first introduced into South America
500 years ago with the arrival of Europeans, and its intro-
duction from Africa occurred during the course of the
transatlantic slave trade. During this introduction,
P. falciparum populations likely experienced severe bot-
tlenecks due to founding events leading to a loss of
genetic diversity compared with the African source pop-
ulations (Yalcindag et al. 2012). This loss is known to con-
cern most preferentially the rare frequency mutations
which tend to generate positive Tajima’s and Fu and Li’s
values (Fay & Wu 1999). Regarding genetic differentia-
tion, lower effective population size as well as multiple
colonization events could explain the stronger geographi-
cal structuring observed between South American popu-
lations (Yalcindag et al. 2012). Indeed, it has been shown
that the colonization of the New World occurred at least
twice independently leading to the establishment of two
genetically distinct populations of P. falciparum in differ-
ent regions of the continent (Yalcindag et al. 2012).
Neutrality tests based on the analysis of the fre-
quency spectrum or genetic differentiation realized on
eba genes and their comparison with observations made
on housekeeping genes or a neutral set of SNP markers
indicate that changes in the nature and/or intensity of
selection could also explain some of the patterns of
genetic variability observed in the South American pop-
ulations. In contrast to Africa where eba-175 seems to be
under the strongest selective pressures, in South Amer-
ica, evidences of selection are the strongest for eba-140.
This gene indeed displays the highest average values of
Tajima’s and Fu and Li’s indices and significantly lower
levels of genetic differentiation between populations
compared with what was observed at neutral markers.
In addition, the loss of genetic variability was the low-
est for eba-140 in South America. All these elements
suggest that, contrary to what happens in Africa, eba-
140 could be under stronger balancing selection in
South America than eba-175 or eba-181.
Several nonexclusive hypotheses could be proposed
to explain these variations in the relative levels of selec-
tion acting on eba genes between South America and
Africa. First of all, this could be due to changes in the
relative levels of expression of these different genes in
South America compared with Africa. The most
expressed genes are the most submitted to the immue-
mediated selection.
Variability in the expression of the proteins involved
in erythrocyte invasion has now been well documented
(see Cortes 2008 and Tham et al. 2012 for review). Sev-
eral experiments with culture adapted parasites or with
field isolates have thus revealed extensive variability in
the level of eba and PfRH gene expression. These varia-
tions were shown to be correlated with variations in the
pathways utilized by P. falciparum to invade the red
blood cells (Bei et al. 2007), and silencing of some genes
was shown to be transmitted epigenetically (Cortes
et al. 2007).
P. FALCIPARUM ADAPTIVE EVOLUTION IN SOUTH AMERICA 1989
© 2014 John Wiley & Sons Ltd

An obvious role of this ability to differentially express
the proteins involved in erythrocyte invasion proteins is
that it may confer flexibility to the parasite to invade
different erythrocyte lines including mutant erythro-
cytes with alterations in the composition of the surface
proteins (Cortes 2008), which may vary from one geo-
graphical location to another (see e.g. Zimmerman et al.
2003). This ability to silence or express different ligands
could also play a role in immune evasion. Because mer-
ozoite surface proteins are the target of invasion-inhibi-
tory antibodies, switching invasion pathways could
mediate escape from the immune system (Cortes 2008).
Merozoite ligand expression could thus be under fre-
quency-dependent selection by the immune response
(Ford et al. 2007).
Several elements support the hypothesis that the rela-
tive levels of expression of EBA proteins as well as the
invasion pathways used by P. falciparum in South
America might indeed have changed following its arri-
val on the continent. Lobo et al. (2004) and more
recently Lopez-Perez et al. (2012) have characterized the
invasion pathways used by field isolates in different
regions of South America and both studies found that,
contrarily to what was observed in several African pop-
ulations (Tham et al. 2012), eba-175-mediated invasion
was not the dominant pathway of invasion for the
majority of the strains. This could thus explain why eba-
175 seems to be less subject to balancing selection in
South America than in Africa. In these experiments,
nothing was carried out regarding eba-140. For eba-181,
Lopez-Perez et al. (2012) have shown that the protein
could be a major pathway for certain isolates, but over-
all was less expressed than eba-175. Some immunologi-
cal studies also provide elements in favour of a change
in the use of the different EBA proteins in South Amer-
ica compared with Africa. Thus, Ford et al. (2007) com-
pared the humoral responses against full-length region
II of eba-175 and eba-140 of two human Brazilian popu-
lations and a Cameroonian one (nothing was carried to
assess the immunoreactivity of the individuals against
eba-181 region II). They demonstrated that the Brazilian
populations had variable ability to recognize P. falcipa-
rum invasion ligands and that these responses were dis-
tinct from those of the African population. Thus, while
most African individuals reacted strongly and similarly
to all region II recombinants, a far lower proportion of
individuals reacted against eba-140 and eba-175 recombi-
nants in South America, and the response was more
prevalent and more intense for eba-140 than for eba-175
(Ford et al. 2007). These observations suggest therefore
that eba-140 could be more highly expressed than eba-
175 in South America and that, as a consequence, the
immune-mediated selection could be stronger in the
American isolates against eba-140 than against eba-175.
Far from us the idea to say that eba-140 is the main
pathway of invasion in South America. It does only
suggest that, most likely, it could be more expressed
than eba-175 and eba-181 and as a consequence could be
more subjected to the immune-mediated selection. Our
results do not mean either that selection on eba genes in
South America is stronger than in Africa. This is even
most likely the opposite. Indeed, as shown by Ford
et al. (2007), the level of immunity against eba genes in
South America is far lower than in the Cameroonian
population, a pattern probably due to the fact that in
low endemic areas (such as the South American region),
the immune system of the host is less frequently
boosted by the parasites and so less efficient in compar-
ison with the one in high endemic areas (such as
Africa).
Another possibility to explain the variations in the
relative levels of selection acting on eba genes in South
America compared with Africa could be linked to
changes in the genetic variability of the erythrocyte
receptors themselves. This could at least explain part of
the selection acting on eba-140 and eba-181, for which it
was demonstrated that the polymorphisms observed in
region II (most of which being nonsynonymous poly-
morphisms) could change the binding affinities of the
protein to their specific receptors (Maier et al. 2009). We
could thus imagine that some of these variants were
selected and maintained within populations because
they provided a better affinity to some of the host
receptor variants. Modifications in the relative diversity
of the host receptors in the South American human
populations compared with the African ones may thus
have changed the levels of diversifying selection acting
on the different genes. A comparison of the genetic
diversity of erythrocyte surface receptors in South
America and Africa could provide an answer.
Overall, it is not easy from the different elements pro-
vided in the literature (that are often contradictory) to
highlight one factor more than another to explain the
variations of selection pressures acting on eba genes
between the New and the Old world. It is very likely
the interplay between the host immune response, the
receptor polymorphisms and the ability of the parasite
to silence or express its invasion proteins that deter-
mines the nature and level of selection acting on eba
genes and hence their level of polymorphism within
populations. This is all the more true that the new
human environment met in South America by the para-
site is not homogeneous.
Amerindian vs. others P. falciparum populations
In our study, two of the P. falciparum populations came
from villages inhabited mainly by Amerindians
© 2014 John Wiley & Sons Ltd
1990 E. YALCINDAG ET AL.

(Camopi and Trois Sauts), another one came from a
village inhabited mainly by Maroons and the others
originated from human populations of mixed origins.
Did this environmental heterogeneity generate local
adaptation? In particular, did populations infecting
Amerindians experience particular patterns of selection
at eba genes? This possibility was considered for several
reasons. Amerindian populations are genetically
strongly differentiated from populations of African and
European origins (Rosenberg et al. 2002; Manica et al.
2005). This differentiation concerns the whole genome
and glycophorin genes, the receptors of eba genes at the
surface of the red cells, are no exception (Tarazona-
Santos et al. 2011). In addition, genetic diversity in
Amerindian populations is lower than in populations of
African origin (Prugnolle et al. 2005a,b). This concerns
in particular the genes of the immune system like those
of the HLA complex that play a role in the recognition
of nonself (Prugnolle et al. 2005a,b), which could thus
limit the level of immune-mediated diversifying selec-
tion acting on eba genes.
Patterns of genetic variability in the two Plasmodium
Amerindian populations are, on average, similar to
what is observed for the other South American popula-
tions except for eba-175 (see Table 1 and Fig. S1, Sup-
porting information). For this gene indeed, no genetic
variability was observed for the population of Trois Sa-
uts and a smaller diversity than in the other popula-
tions for Camopi. In addition to that, negative Tajima’s
D and Fu and Li’s D* values were obtained for Camopi,
in contrast to what was observed for the other popula-
tions for the same gene or for the other genes in Cam-
opi (mostly positive values). The patterns of genetic
variability observed in these two Amerindian popula-
tions could reflect a phenomenon of recent positive
selection acting on eba-175 in these populations. This
possibility needs however to be confirmed by more
thorough analyses, for instance, by genotyping more
genetic markers around the region of eba-175.
Conclusion
Our study shows that the level and or type of selection
acting on eba genes in South America differs from the
one acting on the same genes in Africa. A change in the
relative expression of eba genes and hence of the inva-
sion pathways used by the parasite to infect red blood
cells in South America could, at least partly, explain
these changes in the patterns of selection. This could
also be due to changes in the genetic composition of the
receptors expressed at the surface of the erythrocyte or
in the host immune system. From what we currently
know, we still cannot determine with insurance
which factor is responsible for selection, most likely a
combination of factors, perhaps not the same for the
different genes and certainly variable from one region
of the world to another. Further studies should thus be
performed to clearly identify these factors.
Acknowledgements
This study was funded by ANR Grant MGANE 07 SEST 012
(Programme Sante-Environnement et Sant�e-Travail- Malaria
Genetic Adaptation to a New Environment), the ANR grant
ORIGIN 2012 JCJC, CNRS, IRD, CROUS (Centre R�egional des
Oeuvres Universitaires et Scolaires), Minist�ere des Affaires
Etrang�eres, Institut Kurde de Paris. We thank Institut Pasteur
and Institut de Veille Sanitaire for the samples sequencing. We
also thank the Program of ‘Employment of Newly Graduated
Doctors of Science for Scientific Excellence’ (Grant Number
CZ.1.07/2.3.00/30.009) cofinanced from European Social Fund
and the state of budget of the Czech Republic who partially
supported Erhan Yalcindag. We would like to also thank
Masaryk University, Parasitology Research Group, for their
support. Samples from Peru were collected within a project
funded by the Directorate General for Development Coopera-
tion (DGCD) of the Belgian Government (framework agree-
ment 02, 2003-2007), project 95501 in collaboration with
Dr. Alejandro Llanos-Cuentas. DG is supported by DGCD
(Framework Agreement 03, 2008-2010, project 910000) and U.S.
Public Health Service Grants NIH/NIAID RO1 AI067727 and
ICEMR Grant (1U19AI089681). We thank the programme CNRS-
Amazonie Ecologie de la Sant�e. Thanks to Muriel Dietrich for
her valuable comments during the preparation of this article.
References
Adams JH, Sim BK, Dolan SA, Fang X, Kaslow DC, Miller LH
(1992) A family of erythrocyte binding proteins of malaria
parasites. Proceedings of the National Academy of Sciences, USA,
89, 7085–7089.
Adams JH, Blair PL, Kaneko O, Peterson DS (2001) An expand-
ing ebl family of Plasmodium falciparum. Trends in Parasitol-
ogy, 17, 297–299.Amambua-Ngwa A, Tetteh KKA, Manske M et al. (2012) Popu-
lation genomic scan for candidate signatures of balancing
selection to guide antigen characterization in malaria para-
sites. Plos Genetics, 8, e1002992.
Antao T, Lopes A, Lopes RJ, Beja-Pereira A, Luikart G (2008)
LOSITAN: a workbench to detect molecular adaptation
based on a Fst-outlier method. BMC Bioinformatics, 9, 323.
Baum J, Thomas AW, Conway DJ (2003) Evidence for diversify-
ing selection on erythrocyte-binding antigens of Plasmodium
falciparum and Plasmodium vivax. Genetics, 163, 1327–1336.Beaumont MA, Nichols RA (1996) Evaluation loci for the use
in the genetic analysis of population structure. Proceedings of
the Royal Society B-Biological Sciences, 263, 1619–1626.
Bei AK, Membi CD, Rayner JC et al. (2007) Variant merozoite
protein expression is associated with erythrocyte invasion
phenotypes in Plasmodium falciparum isolates from Tanzania.
Molecular and Biochemical Parasitology, 154, 66–71.Camus D, Hadley TJ (1985) A Plasmodium falciparum antigen
that binds to host erythrocytes and merozoites. Science, 230,
553–556.
© 2014 John Wiley & Sons Ltd
P. FALCIPARUM ADAPTIVE EVOLUTION IN SOUTH AMERICA 1991
Chang HH, Park DJ, Galinsky KJ et al. (2012) Genomic sequenc-
ing of Plasmodium falciparum malaria parasites from Senegal
reveals the demographic history of the population. Molecular
Biology and Evolution, 29, 3427–3439.Chitnis CE (2001) Molecular insights into receptors used by
malaria parasites for erythrocyte invasion. Current Opinion in
Hematology, 8, 85–91.
Conway DJ, Fanello C, Lloyd JM et al. (2000) Origin of Plasmo-
dium falciparum malaria is traced by mitochondrial DNA.
Molecular and Biochemical Parasitology, 111, 163–171.Cortes A (2008) Switching Plasmodium falciparum genes on and
off for erythrocyte invasion. Trends in Parasitology, 24, 517–524.
Cortes A, Carret C, Kaneko O, Lim BYSY, Ivens A, Holder
AA (2007) Epigenetic silencing of Plasmodium falciparum
genes linked to erythrocyte invasion. Plos Pathogens, 3,
1023–1035.
Excoffier L, Smouse PE, Quattro JM (1992) Analysis of molecu-
lar variance inferred from metric distances among DNA
haplotypes: application to human mitochondrial-DNA
restriction data. Genetics, 131, 479–491.
Fay JC, Wu CI (1999) A human population bottleneck can
account for the discordance between patterns of mitochon-
drial versus nuclear DNA variation. Molecular Biology and
Evolution, 16, 1003–1005.
Fay JC, Wu CI (2000) Hitchhiking under positive Darwinian
selection. Genetics, 155, 1405–1413.
Ford L, Lobo CA, Rodriguez M et al. (2007) Differential anti-
body responses to Plasmodium falciparum invasion ligand pro-
teins in individuals living in malaria-endemic areas in Brazil
and Cameroon. The American Journal of Tropical Medicine and
Hygiene, 77, 977–983.
Fu YX, Li WH (1993) Statistical tests of neutrality of mutations.
Genetics, 133, 693–709.
Gomez-Escobar N, Amambua-Ngwa A, Walther M, Okebe J, Eb-
onyi A, Conway DJ (2010) Erythrocyte invasion and merozoite
ligand gene expression in severe and mild Plasmodium falcipa-
rummalaria. The Journal of Infectious Diseases, 201, 444–452.
Hume JCC, Lyons EJ, Day KP (2003) Human migration, mos-
quitoes and the evolution of Plasmodium falciparum. Trends in
Parasitology, 19, 144–149.Jennings CV, Ahouidi AD, Zilversmit M et al. (2007) Molecular
analysis of erythrocyte invasion in Plasmodium falciparum iso-
lates from Senegal. Infection and Immunity, 75, 3531–3538.
Joshua-Tor L, Tolia NH, Enemark EJ, Sim BKL (2005) Struc-
tural basis for the EBA-175 erythrocyte invasion pathway of
the malaria parasite Plasmodium falciparum. Cell, 122, 183–193.Joy DA, Feng XR, Mu JB et al. (2003) Early origin and recent
expansion of Plasmodium falciparum. Science, 300, 318–321.Lee C (2002) Evolutionary genetics of invasive species. Trends
in Ecology and Evolution, 17, 386–391.Lobo CA, de Frazao K, Rodriguez M, Reid M, Zalis M, Lustig-
man S (2004) Invasion profiles of Brazilian field isolates of
Plasmodium falciparum: phenotypic and genotypic analyses.
Infection and Immunity, 72, 5886–5891.Lopez-Perez M, Villasis E, Machado RL et al. (2012) Plasmodium
falciparum field isolates from South America use an atypical
red blood cell invasion pathway associated with invasion
ligand polymorphisms. PLoS ONE, 7, e47913.
Maier AG, Baum J, Smith B, Conway DJ, Cowman AF (2009)
Polymorphisms in erythrocyte binding antigens 140 and
181 affect function and binding but not receptor specificity
in Plasmodium falciparum. Infection and Immunity, 77, 1689–1699.
Manica A, Prugnolle F, Balloux F (2005) Geography is a better
determinant of human genetic differentiation than ethnicity.
Human Genetics, 118, 366–371.Mayer D, Mu J, Feng X, Su X, Miller LH (2002) Polymorphisms
in a Plasmodium falciparum erythrocyte-binding ligand change
its receptor specificity. Molecular Biology of the Cell, 13, 1523–
1528.
Mayer DCG, Mu JB, Kaneko O, Duan JH, Su XZ, Miller LH
(2004) Polymorphism in the Plasmodium falciparum erythro-
cyte-binding ligand JESEBL/EBA-181 alters its receptor speci-
ficity. Proceedings of the National Academy of Sciences, USA, 101,
2518–2523.
Mirabello L, Conn JE (2006) Molecular population genetics of
the malaria vector Anopheles darlingi in Central and South
America. Heredity, 96, 311–321.Nielsen R, Williamson S, Kim Y, Hubisz MJ, Clark AG, Busta-
mante C (2005) Genomic scans for selective sweeps using
SNP data. Genome Research, 15, 1566–1575.
Pepin KM, Lass S, Pulliam JR, Read AF, Lloyd-Smith JO
(2010) Identifying genetic markers of adaptation for sur-
veillance of viral host jumps. Nature Reviews Microbiology,
8, 802–813.
Persson KEM, Fowkes FJI, McCallum FJ et al. (2013) Erythro-
cyte binding antigens of Plasmodium falciparum are targets
of human inhibitory antibodies and function to evade natu-
rally acquired immunity. Journal of Immunology, 191, 785–794.
Prugnolle F, Manica A, Balloux F (2005a) Geography predicts
neutral genetic diversity of human populations. Current Biol-
ogy, 15, R159–R160.Prugnolle F, Manica A, Charpentier M, Guegan JF, Guernier V,
Balloux F (2005b) Pathogen-driven selection and worldwide
HLA class I diversity. Current Biology, 15, 1022–1027.
Rosenberg NA, Pritchard JK, Weber JL, Cann HM, Kidd KK,
Feldman MW (2002) Genetic structure of human popula-
tions. Science, 298, 2381–2385.Rozas J, Sanchez-DelBarrio JC, Messeguer X, Rozas R (2003)
DNASP: DNA polymorphism analyses by the coalescent and
other methods. Bioinformatics, 19, 2496–2497.
Sim BKL, Orlandi PA, Haynes JD et al. (1990) Primary struc-
ture of the 175K Plasmodium falciparum Erythrocyte Binding
Antigen and identification of a peptide which elicits antibod-
ies that inhibit malaria merozoite invasion. Journal of Cell
Biology, 111, 1877–1884.Snow RW, Guerra CA, Noor AM, Myint HY, Hay SI (2005)
The global distribution of clinical episodes of Plasmodium fal-
ciparum malaria. Nature, 434, 214–217.
Tajima F (1989) Statistical method for testing the neutral muta-
tion hypothesis by DNA polymorphism. Genetics, 123, 585–
595.
Tanabe K, Mita T, Jombart T et al. (2010) Plasmodium falciparum
accompanied the human expansion out of Africa. Current
Biology, 20, 1283–1289.
Tarazona-Santos E, Castilho L, Amaral DR et al. (2011) Popula-
tion genetics of GYPB and association study between
GYPB*S/s polymorphism and susceptibility to Plasmodium
falciparum infection in the Brazilian Amazon. PLoS ONE, 6,
e16123.
© 2014 John Wiley & Sons Ltd
1992 E. YALCINDAG ET AL.
Tham WH, Healer J, Cowman AF (2012) Erythrocyte and retic-
ulocyte binding-like proteins of Plasmodium falciparum. Trends
in Parasitology, 28, 23–30.
Verra F, Chokejindachai W, Weedall GD et al. (2006) Contrast-
ing signatures of selection on the Plasmodium falciparum
erythrocyte binding antigen gene family. Molecular and
Biochemical Parasitology, 149, 182–190.
WHO (2012). WHO Global Malaria Programme. World Malaria
Report 2012. World Health Organization, Geneva, pp. 276.
Yalcindag E, Elguero E, Arnathau C et al. (2012) Multiple
independent introductions of Plasmodium falciparum in South
America. Proceedings of the National Academy of Sciences, USA,
109, 511–516.
Zietkiewicz E, Yotova V, Jarnik M et al. (1997) Nuclear DNA
diversity in worldwide distributed human populations. Gene,
205, 161–171.Zimmerman PA, Patel SS, Maier AG, Bockarie MJ, Kazura JW
(2003) Erythrocyte polymorphisms and malaria parasite inva-
sion in Papua New Guinea. Trends in Parasitology, 19, 250–
252.
E.Y., E.E., F.J.A., F.R., and F.P. designed research; E.Y.,
C.A., P.D. and F.P. performed research; S.B., L.D., A.A.,
P.B., U.D., D.F., D.G., A.M., D.M., L.M., O.N., V.V.,
A.W., B.C., E.L. and C.C. contributed new reagents/
analytic tools; E.Y., V.V., E.E., P.D. and F.P. analyzed
data; and E.Y., V.V., E.E., F.J.A., F.R. and F.P. wrote the
paper.
Data accessibility
DNA sequences : GenBank Accession numbers; Eba-140 :
KJ419351 - KJ419496, Eba-175 : KJ419497 -KJ419632,
Eba-181 : KJ419633 - KJ419770, Adsl : KJ419771 -KJ419857
and Serca : KJ419858 - KJ419915.
SNP dataset, sequences alignments of each gene and
sampling details for each population: DRYAD doi:10.
5061/dryad.59645.
Supporting information
Additional supporting information may be found in the online ver-
sion of this article.
Table S1 Characteristics of the Plasmodium falciparum samples
collected in Africa and South America, with their geographical
coordinates, total sample size and mono-infected sample size.
Table S2 Characteristics of the Plasmodium falciparum samples
retrieved from literature, with their geographical coordinates,
total sample size and mono-infected sample size.
Table S3 Primers used for first and second PCR.
Table S4 Estimates of genetic differentiation (FST) obtained
between pairs of populations and P-value of the test of differ-
entiation for each gene.
Fig. S1 Average nucleotide diversity, Tajima’s D, Fu and Li’s
D* and Fay and Wu’s H measured in the P. falciparum popula-
tions collected in South America.
© 2014 John Wiley & Sons Ltd
P. FALCIPARUM ADAPTIVE EVOLUTION IN SOUTH AMERICA 1993