A Nationwide Study of Severe Cutaneous Adverse Reactions ...
Upload
khangminh22Category
view
2download
0
The NATIONWIDE AUDIT of ECD Provisioning in South Africa
Dr.T.Williams
and
Ms. M. L. Samuels
with
Prof. J. Mouton
Mr. K. Ratele
Ms. N. Shabalala
Prof.T. Shefer
Prof.A. Strebel
2001
Publisher The Department of Education, Pretoria, South Africa.
© Department of Education, Pretoria, South Africa, 2001.
® The material contained in this publication and in the accompanying CD, may
be used and reproduced in not-for-profit situations, provided the source is
acknowledged. For use in publications, please obtain written permission
from the Department of Education, Pretoria.
Enquiries The Directorate
Early Childhood Development
Department of Education
Sol Plaatje House
123 Schoeman Street
Pretoria
Private Bag X895
Pretoria 0001
South Africa
Tel: + 27 12 312-5435
Fax: + 27 12 323-0002
e-mail: [email protected]
ISBN 0-7970-3905-8
Design African Watermark
Printing Mortimer Offset
Photography Guy Stubbs
This publication and the research documented herein, has been wholly funded by the
Commission of the European Union under the auspices of the European Union Technical
Support Project to the South African Department of Education. The Technical Support Project
is managed by HEDCO-Ireland.

i
Table of contents
Executive Summary. . . . . . . . . . . . . . . . . . . . . . . . . . . . . . . . . . . . . . . . 1
Chapter 1 Contextualising ECD in South AfricaIntroduction . . . . . . . . . . . . . . . . . . . . . . . . . . . . . . . . . . . . . . . . . . . . .5
The state of the nation’s children . . . . . . . . . . . . . . . . . . . . . . . . . . . . .6
Children as a national priority . . . . . . . . . . . . . . . . . . . . . . . . . . . . . . . .7
Historical foundation of ECD provisioning in South Africa . . . . . . . . . .8
Formalising the ECD sector: 1980 to post 1994 . . . . . . . . . . . . . . . . . .9
Conclusion . . . . . . . . . . . . . . . . . . . . . . . . . . . . . . . . . . . . . . . . . . . . .10
Chapter 2 Current approachesIntroduction . . . . . . . . . . . . . . . . . . . . . . . . . . . . . . . . . . . . . . . . . . . .13
A holistic view of ECD . . . . . . . . . . . . . . . . . . . . . . . . . . . . . . . . . . . .13
ECD as a foundation of democracy and equality . . . . . . . . . . . . . . . . .14
ECD as protecting children’s rights . . . . . . . . . . . . . . . . . . . . . . . . . .14
ECD as community development . . . . . . . . . . . . . . . . . . . . . . . . . . . .15
Structures for policy and programme development . . . . . . . . . . . . . . .15
National ECD policy . . . . . . . . . . . . . . . . . . . . . . . . . . . . . . . . . . . . . .16
Provisioning . . . . . . . . . . . . . . . . . . . . . . . . . . . . . . . . . . . . . . . . . . . . .16
Curriculum . . . . . . . . . . . . . . . . . . . . . . . . . . . . . . . . . . . . . . . . . . . . .17
Accreditation and training of educators . . . . . . . . . . . . . . . . . . . . . . . .17
Employment of ECD educators . . . . . . . . . . . . . . . . . . . . . . . . . . . . . .18
Funding of ECD services . . . . . . . . . . . . . . . . . . . . . . . . . . . . . . . . . . .18
Pilot Projects: testing the theories . . . . . . . . . . . . . . . . . . . . . . . . . . . .19
Current limitations and challenges for an ECD policy framework . . . .20
Chapter 3 MethodologyIntroduction . . . . . . . . . . . . . . . . . . . . . . . . . . . . . . . . . . . . . . . . . . . .21
The rationale for the Audit . . . . . . . . . . . . . . . . . . . . . . . . . . . . . . . . .21
Planning the Audit . . . . . . . . . . . . . . . . . . . . . . . . . . . . . . . . . . . . . . . .22
Surveying the educator training providers . . . . . . . . . . . . . . . . . . . . . .22
Auditing the ECD sites . . . . . . . . . . . . . . . . . . . . . . . . . . . . . . . . . . . .22
Analysis and presentation of the data . . . . . . . . . . . . . . . . . . . . . . . . .24
Conclusion . . . . . . . . . . . . . . . . . . . . . . . . . . . . . . . . . . . . . . . . . . . . .26

Chapter 4 National results . . . . . . . . . . . . . . . . . . . . . . . . . . . . . . . . . . . . . . . . . . 27
General provisioning . . . . . . . . . . . . . . . . . . . . . . . . . . . . . . . . . . . . . . 28
Services and support . . . . . . . . . . . . . . . . . . . . . . . . . . . . . . . . . . . . . . 31
Learner profiles . . . . . . . . . . . . . . . . . . . . . . . . . . . . . . . . . . . . . . . . . . 35
Educator profiles . . . . . . . . . . . . . . . . . . . . . . . . . . . . . . . . . . . . . . . . . 40
Educator training providers . . . . . . . . . . . . . . . . . . . . . . . . . . . . . . . . . 44
Indices . . . . . . . . . . . . . . . . . . . . . . . . . . . . . . . . . . . . . . . . . . . . . . . . . 46
Sustainability . . . . . . . . . . . . . . . . . . . . . . . . . . . . . . . . . . . . . . . . . . . . 52
Salient findings . . . . . . . . . . . . . . . . . . . . . . . . . . . . . . . . . . . . . . . . . . . 54
Chapter 5 Provincial resultsEastern Cape . . . . . . . . . . . . . . . . . . . . . . . . . . . . . . . . . . . . . . . . . . . . 55
Free State . . . . . . . . . . . . . . . . . . . . . . . . . . . . . . . . . . . . . . . . . . . . . . 67
Gauteng. . . . . . . . . . . . . . . . . . . . . . . . . . . . . . . . . . . . . . . . . . . . . . . . 79
KwaZulu-Natal . . . . . . . . . . . . . . . . . . . . . . . . . . . . . . . . . . . . . . . . . . 91
Mpumalanga. . . . . . . . . . . . . . . . . . . . . . . . . . . . . . . . . . . . . . . . . . . . 103
Northern Cape . . . . . . . . . . . . . . . . . . . . . . . . . . . . . . . . . . . . . . . . . 115
Northern Province . . . . . . . . . . . . . . . . . . . . . . . . . . . . . . . . . . . . . . 127
North West . . . . . . . . . . . . . . . . . . . . . . . . . . . . . . . . . . . . . . . . . . . . 139
Western Cape . . . . . . . . . . . . . . . . . . . . . . . . . . . . . . . . . . . . . . . . . . 151
Chapter 6 ConclusionsIntroduction . . . . . . . . . . . . . . . . . . . . . . . . . . . . . . . . . . . . . . . . . . . 163
Resources . . . . . . . . . . . . . . . . . . . . . . . . . . . . . . . . . . . . . . . . . . . . . 163
The nature of sites . . . . . . . . . . . . . . . . . . . . . . . . . . . . . . . . . . . . . . 163
Historical inequalities. . . . . . . . . . . . . . . . . . . . . . . . . . . . . . . . . . . . . 164
Educators . . . . . . . . . . . . . . . . . . . . . . . . . . . . . . . . . . . . . . . . . . . . . 165
Language . . . . . . . . . . . . . . . . . . . . . . . . . . . . . . . . . . . . . . . . . . . . . . 165
Gender . . . . . . . . . . . . . . . . . . . . . . . . . . . . . . . . . . . . . . . . . . . . . . . 166
HIV/Aids . . . . . . . . . . . . . . . . . . . . . . . . . . . . . . . . . . . . . . . . . . . . . . 166
Children with disabilities . . . . . . . . . . . . . . . . . . . . . . . . . . . . . . . . . . 167
Future areas of research . . . . . . . . . . . . . . . . . . . . . . . . . . . . . . . . . . 167
Conclusion . . . . . . . . . . . . . . . . . . . . . . . . . . . . . . . . . . . . . . . . . . . . 168
Annexure 1 CodebookPart 1 Study overview. . . . . . . . . . . . . . . . . . . . . . . . . . . . . . . . . . . 169
Part 2 Enumerator manual (abridged) . . . . . . . . . . . . . . . . . . . . . . . 172
Part 3 Site questionnaire . . . . . . . . . . . . . . . . . . . . . . . . . . . . . . . . . 193
Part 4 Variable lists, names and labels . . . . . . . . . . . . . . . . . . . . . . . 198
Annexure 2 Acknowledgments . . . . . . . . . . . . . . . . . . . . . . . . . . . . . . . . . . . . . . . 205
ii

1
EXECUTIVE SUMMARY
IntroductionIn 2000, the National Department of Education together with the European Union Technical
Support Project conducted an audit of Early Childhood Development (ECD) provisioning
throughout South Africa. The aim of the Audit was to provide accurate information on the
nature and extent of ECD provisioning, services and resources across the country in order to
inform and support ongoing policy and planning initiatives in this crucial and expanding sector.
A wide spectrum of government, non-government and private sector role players were
consulted during the conceptualisation stage of the Audit. One National and nine Provincial
Steering Committees, a Research and Publications Committee, a contracted national
consortium, nine contracted provincial agencies/consortia and nine Provincial Coordinators
were involved with the development, implementation and execution of the Audit.
An initial postal survey of ECD educator training providers was carried out to quantify, identify
and classify the providers throughout the country. Concurrently, ECD sites were identified
through an extensive consultative process with relevant government departments and ECD
stakeholders. Subsequently, over a period of six weeks during May/June 2000, all identifiable
ECD sites in the country were visited. Information was obtained on four broad areas of ECD
provisioning, namely: sites, learners, educators and programmes. Site interviews were
conducted by 854 especially trained enumerators, who were drawn mainly from the ECD sector
and contracted to the provincial agencies/consortia. A 2% stratified random sample of audited
sites were re-visited to verify the integrity of the research process.
Vital statisticsA total of 23,482 sites were audited, in which 1,030,473 learners are enrolled and whose needs
are catered to by 54,503 educators. The data suggests that fewer than one sixth of the 6.4
million children in the 0-7 age cohort in the country are in some form of ECD provisioning,
with just less than half of the 5-6 year age cohort being accommodated (413,000 out of an
estimated 960,000). The gender, population group and language profiles of learners is broadly
consistent with national population figures.
Almost 40% of the identifiable sites are situated in rural areas, and the remainder are in urban
formal and informal areas. Approximately half of all sites are based in community settings, a third
are home based and less than one fifth are based in schools. About two thirds of sites are
registered, mostly with the Departments of Education or Social Development. Over 60% of
sites have been operating for five years or longer. While over half of all sites audited have access
to piped water, flushing toilets and mains electricity, almost a tenth have access to none of these
facilities. Noteworthy too is the relative size of the ECD sector with 23,482 sites, as opposed
to 17,254 schools in the primary sector. The financial base of support of sites does not appear
to be strong. Almost a third of the sites audited charge fees of less than R25/month, and in
about half of all sites, fees are not paid regularly. In addition, more than a quarter of the sites
reported that they had no source of income other than fees.

The mean age of educators is 38 years. Almost all (99%) are women and two thirds are African.
The majority of educators have received their training from NGOs and are thus ‘unqualified’
according to current Department of Education regulations. A further 20% have received no
training while 10% are adequately qualified. There is a strong relationship between experience
and qualifications, with most of those with the highest qualifications having five or more years
experience in the ECD sector. Salary is also linked to qualifications. Almost half of the educators
earn less than R500 per month, and most of these have no training or have been trained by
NGOs. Almost half of agencies providing educator training are NGOs. Only a third of training
providers are accredited. The bulk of income for training of educators comes from trainee fees.
Within each of the categories of site types (school, community and home based), evidence of very
low and high scores on each of the four indices were recorded. With respect to the programme
of activities offered at sites, community and school based sites offer higher rated services than
home based sites. Sites categorised as ‘White’ rate better than those categorised ‘African’.
Racial inequalities are still evident in ECD provisioning. Across all four indices that were
generated (support, infrastructure, programme and educator), African sites rate the lowest,
whereas White sites rate highest. While racial segregation is being diffused by the emergence
of a small number (less than 10%) of sites which accommodate children from a variety of
population groups, the inequitable divisions in wealth distribution are self evident. Such
conditions continue to reproduce a context of stark inequality along the lines of colour in which
the vast majority of African children remain disadvantaged.
Another predictor of inequity is apparent in the rating discrepancies between the various
provinces. At an economic and developmental level, those provinces which the Audit signals as
disadvantaged with respect to ECD provisioning are rural in make-up and encompass high
numbers of areas historically demarcated as ‘bantustans’. A comparative analysis of the
provincially derived infrastructure index scores, identifies the Eastern Cape, KwaZulu-Natal and
the Northern Province as being significantly under-resourced.
Issues emergingA number of issues emerge from the findings which raise questions for ECD policy development,
planning and implementation. A considerable challenge exists to address the legacy of historical
inequalities which are still evident in this sector. Differences between provinces also reflect past
discriminatory practices and access to resources. Another important issue centres around
language practices and the dominance of English as the language of instruction across sites and
provinces, seemingly irrespective of the home languages of the learners. The lack of adequately
qualified and remunerated educators is a central issue as are matters relating to the accreditation
and recognition of qualifications, especially NGO qualifications.
A number of areas worthy of further investigation emerge out of the Audit experience and
findings. An in-depth evaluation of the quality and impact of ECD programmes is necessary. The
impact of HIV/Aids on the learners in the sector needs immediate attention. The extent to
which the needs of children with disabilities are being addressed requires further investigation
to ensure optimal development of such learners within the mainstream education system.
2

3
Format of reportThis publication, The NATIONWIDE AUDIT of ECD Provisioning in South Africa, consists of
the following chapters:
• Chapter 1 discusses ECD in the overall context of South Africa. It details the place and
role of ECD in the process of redressing past inequities and ongoing transformation
processes, especially with respect to the nation’s children. The historical foundations of
ECD provisioning are detailed as a precursor to a discussion on formalising the sector.
• In Chapter 2, the origins of the holistic model of ECD are explained as is its role as a
foundation of democracy and equality, as a protector of children’s rights and as a form of
community development. The structures of policy and programme development are
discussed. Issues relating to the curriculum, the accreditation, training and employment
of educators, and the funding modalities for the sector are elaborated upon.
• Chapter 3 describes the methodology of the Audit, outlining the conceptualisation,
developmental, implementation and analysis stages.
• Extensive results for the nation as a whole, in tabular and graphic format, are presented in
Chapter 4. There then follows a brief textual synopsis of the main national findings. No
attempt is made to deconstruct, analyse and explain each result or group of results.
• In Chapter 5, condensed results for each of the nine provinces are presented.
• In the final chapter, Chapter 6, a brief commentary is given of the main findings and
outcomes of the Audit.
Included with the report is a CD which contains:• SPSS data files.
• An Access database.
• The Codebook for the datafiles.
• A user guide for the database.
• An Acrobat PDF viewer for the user guide and Codebook.
ConclusionThe results detailed in this report are presented in such a way as to inform discussion, not to
pre-empt or dictate it. No extrapolations or conjectures are presented. Given that this is the
first time that this type of quantitative data is available, a conscious decision was taken to allow
the reader to interpret the findings presented.
Overall the Nationwide Audit of ECD Provisioning was conducted successfully, despite the
uncharted and complex nature of the task. For the first time, extensive empirically grounded
information which reflects the nature and state of ECD provisioning in the country is available.
It will prove to be an invaluable resource and reference to all those involved in the planning and
provision of ECD services in South Africa.

4

5
Chapter 1Contextualising ECD in South Africa
IntroductionEarly Childhood Development (ECD) is a relatively new term in the South African vernacular.
It encompasses an ideological and political struggle towards the creation of a society founded
on human rights, which acknowledge the centrality of childhood in human and social
development and children as individuals and citizens. Current attempts to enhance the
development of South African children have to be viewed within a context in which the majority
of the nation’s children are subjected to conditions which are far from conducive to their
development. While there is much that can be noted about the appaling record of childhood
deprivation in South Africa, the current lack of provision bears witness to the legacy of
apartheid. ECD emerged out of the broader democratic struggle against apartheid with the goal
of addressing the lack of a nurturing, educative and supportive environment for the vast majority
of South Africa’s disenfranchised children.
In the years leading up to the first democratic elections in 1994 the term ‘educare’ was adopted
as it encapsulated the ideological belief that the care of young children should involve more than
the mere act of keeping watch over children. Rather it should include the creation of safe,
nurturing environments in which children receive care and educational stimuli in an holistic
model which caters for all their physical, developmental, emotional and cognitive needs. ECD is
currently defined as the provision of physical, emotional, social, spiritual and moral development
for children aged between zero and nine years. The holistic and integrated nature of the South
African model has resulted in a variety of delivery modes at multiple types of sites, across
multiple sectors (Education, Social Development and Health), including links between broader
community development and women’s development and empowerment. The National
Department of Education has been assigned responsibility for the 6 to 9 year cohorts, while the
Department of Health and the Department of Social Development are primarily focused on the
0-5 year cohorts. Inter-sectoral collaboration in policy development and service provision is a
striking feature of the current developments within ECD in South Africa.
Recent and ongoing developments within the sector reflect a global recognition of the
significance of ECD with respect to the recipient children and society as a whole. There is an
expanding body of international empirical research which postulates the benefits of providing
structured and accredited ECD services to pre-school children. Providing appropriate
stimulation, nutrition, care and health services during this critical developmental period results
in: increased primary school enrolment, enhanced school performance, lower repetition and
drop-out rates, reductions in juvenile crime rates, reduced remedial medical and welfare costs
and improved economic and social productivity indicators. These benefits attest to the fact that
the economic returns to private and social investment in ECD far outweigh the returns to any
other form of human capital investment. The South African National Treasury cites international
evidence which endorses this central tenet of educational investment.1
1 Intergovernmental Fiscal Review 2000, National Treasury.

South Africa is presently engaged in a process of dismantling the inherited social, economic and
ideological systems and vast material divisions premised on race, gender and social class. ECD
has been identified as an appropriate vehicle through which the transformation processes can
be advanced. ECD interventions are particularly beneficial to disadvantaged children and
women and are instrumental in breaking the cycle of inter-generational poverty. Not only is
ECD essential for assisting children’s transition to formal schooling, it is pivotal to the
identification of children at risk from learning difficulties and social, behavioural and health
problems. Furthermore, the pre-school years are the ideal phase for the inculcation of
democratic principles and human rights values, including the development of anti-racism and
anti-sexism principles.
The South African government has identified children’s rights as central to the task of
reconstruction and development. The last decade has seen the evolution and ongoing
development of new policies and stratagems aimed at meeting the needs of children. However
the paucity of South African empirical evidence hampered and continues to hamper the
development of informed policy positions and provisioning strategies.
In order to provide a backdrop for understanding the current context of ECD, this chapter
presents a brief overview of the situation of children in South Africa, followed by an abridged
history of education more broadly and an overview of the evolution of ECD.
The state of the nation’s children A major challenge facing the newly elected democratic government in 1994 was the need to
provide holistic care for all South African children. The environment in which the majority of
children found themselves had been rendered developmentally suspect by decades of racially
discriminatory political, social and economic policies and practices. While previous regimes had,
to a certain extent, made some provision for a facilitative growth environment for those
children who were classified as White, African children were rendered increasingly vulnerable
by the discriminatory nature of apartheid laws and policies, such as the migrant labour system
and forced removals. Following the 1976 uprising in which school children became prominent
in the liberation struggle, they were further subjected to state-engineered human rights
violations.
Article 27 of the United Nation’s Convention on the Rights of the Child (CRC) declares that
every child has the right to a standard of living adequate for his or her physical, mental, spiritual,
moral and social development. After the election of the African National Congress (ANC) into
government in 1994, President Mandela pledged that his government would make the needs of
children a priority. However, children’s well-being and development depends, to a large extent,
on their parents’ ability to provide for them. The extent of poverty among African communities
indicates that the well-being of most South African children continues to be at risk. This is borne
out by a perusal of some key indicators on the state of South African children.
In 1998 the Infant Mortality Rate (IMR) was 45/1000 live births, with Africans at 47, Coloureds
at 19 and Whites at 11. The under five Mortality Rate was 64 for Africans, 28 for Coloureds
and 15 for Whites. Nearly a quarter of these children are lagging developmentally and a tenth
6

7
are underweight. Six out of every ten South African children live in poverty, with those in rural
areas more likely than their urban peers to be poor2. South Africa currently has one of the
highest numbers of children living with HIV/Aids. A 1999 Ante-natal Clinic Study3 estimates HIV
prevalence rates of 22% among pregnant women which could result in an additional 40,000 HIV
positive infants per annum and the IMR is expected to increase to 61/1000. Furthermore, an
increasing number of children will be orphaned. The Human Development Index (HDI), a
measure of the socio-economic environment and life opportunities facing children (made up of
longevity, standard of living and educational attainment) stands at a reasonably respectable mid-
range level of 0.677 for South Africa4. However there are racial disparities: Whites and Indians
scoring higher than Africans and Coloureds (0.663 as opposed to 0.5). In addition, an analysis
of provincial differences shows a disparity that indicates that children in predominantly rural
provinces are particularly vulnerable. The Eastern Cape, Free State and North West provinces
have the highest number of children living in poverty (78%, 73% and 73% respectively) while the
Western Cape and Gauteng have the lowest poverty rates (35% and 20%).
That significant numbers of South African children live in poverty cannot be disputed. That
poverty negatively impacts on the lives and development of children cannot be disputed. That
the HIV/Aids pandemic is undermining the developmental and survival prospects of South
African children cannot be disputed. That the majority of children in South Africa continue to
endure the inheritance of apartheid cannot be disputed. In such a context, the value of ECD
and the role it can play in redressing past injustices and addressing current adversities becomes
more apparent.
Children as a national priorityOne aspect of the government’s task of fulfiling its commitment to children entails developing
policies aimed at bettering the conditions under which they live, grow and develop. The United
Nations Conventions on the Rights of the Child5, which is premised on the survival,
development, protection and participation rights of children, was ratified by South Africa in
1995. This paved the way for locating children’s needs at the centre of all government’s
development strategies. Article 4 of the CRC states that governments should ‘undertake all
appropriate legislative, administrative and other measures for the implementation of the rights
recognised in the Convention’.
In January 2000, South Africa also ratified the African Charter on the Rights and Welfare ofthe Child6, developed by the Organisation of African Unity to better reflect African cultural
concerns and other relevant issues not adequately covered by the CRC.
2 Gosa/Unicef Country Programme of Cooperation, 2002-2006, 2000.
3 Department of Health Annual National HIV Sero-prevalence Survey of Women attending Antenatal Clinics,
1999.
4 Poverty and Inequality Report 1998, commissioned study by the Office of the Executive Deputy President and
the Inter-Ministerial Committee for Poverty and Inequality.
5 President’s Report on the State of the Nation’s Children, 1999.
6 GOSA/UNICEF "Country Programme of Cooperation 2002-2006", 2000.

Within South Africa’s own constitution, the Bill of Rights7 firmly locates children’s rights as
paramount. Provision is made in the constitution for children’s socio-economic rights, the right
to basic education and protection from neglect, abuse and exploitation.
A tangible expression of these various commitments was the establishment, in 1996, of the
National Programme of Action (NPA) as a mechanism for coordinated action towards the
progressive realisation of children’s rights. The NPA provides a holistic framework, which
enables all government departments to put children’s issues on their agendas and mechanisms
for coordinated action between non-governmental organisations (NGOs), government and
other relevant entities. The NPA has identified eight priority areas to address the needs of all
South African children: Infrastructure, Special Protection Measures, Basic Education, Child and
Maternal Health, Nutrition, Leisure and Recreation, Social Welfare Development and ECD. The
1996 NPA Working Document8 outlined goals, targets, role-players and national strategies for
each of these priorities. Apart from being identified as a specific priority area, ECD also features
in the Basic Education and Social Welfare Development priority areas, the aim being the
expansion of ECD activities such as low-cost and community-based interventions, access to
basic education and the attainment of at least primary education by 80% of children of school-
going age through formal or equivalent schooling. Within each of these, special attention is given
to children living in difficult circumstances.
It is evident that children are valued in contemporary South Africa and that their needs continue
to be of primary concern throughout government’s policies and strategies for change. Enabling
legislation and national policies have been developed. However, as outlined in a report by the
National Children’s Rights Committee (NCRC) and NGOs on the implementation of the CRC
“South Africa still has a long way to go to effect quality of life for the majority of her children”9.
Historical foundation of ECD provisioning in South AfricaThe precursors of current ECD programmes in South Africa can be traced back to the early
20th century, when they were instituted to address the high infant mortality and morbidity rates
in the country. In 1908 a voluntary organisation, the South African National Council for Child
and Family Welfare began investigating the causes of endemic fatal diseases and provided
support to families and communities. This was followed by the creation of parent and
community initiatives aimed at providing care and education to young children outside the
home. By 1940 the Union Department of Social Welfare was providing a per capita subsidy for
day-care centres while provincial education departments supported nursery schools. The
standards for these services were established by the Nursery School Association of South Africa
(later known as the South African Association for Early Childhood Education (SAAECE)), a body
that was inaugurated in 1939 and was primarily an association of White nursery school teachers.
8
7 The Constitution of the Republic of South Africa, as adopted on 8th May 1996 and amended on 11th October
1996 by the Constitutional Assembly.
8 President’s Report on the State of the Nation’s Children, 1999.
9 GOSA/UNICEF "Country Programme of Cooperation 2002-2006", 2000, p6.

9
In 1940 the Committee of Heads of Education Departments recommended the recognition of
nursery schools as an ‘adjunct to the national system of education’. However, they differentiated
between nursery schools and crèches, the latter being seen as providing primarily a custodial
service as opposed to the educational function of the former. While welfare subsidies were
available for all groups, African nursery schools were not eligible. As running costs increased
without a concomitant increase in subsidies, pre-school centres had to rely more and more on fee
income. This resulted in nursery centres with trained teachers becoming privileged middle-class
institutions while African working class children were given custodial care. Since White parents
could and did pay the escalating fees, the quality of services provided in White establishments
became increasingly better than that provided to the other racial groups.
There were racial discrepancies in the training of pre-school teachers, most of which was
provided by NGOs. While the state did not take responsibility for establishing pre-school
training facilities, it subsidised facilities that were set up by others. However, between 1948 and
1969 there was a decrease in government support for early childhood services, with the little
that was available directed at supporting White children. Provisioning for White children grew
in the 1970s following the passing of the National Education Policy Act (1967), which
empowered White provincial education departments to take responsibility for nursery
education. While there were provincial variations, departments of education facilitated growth
by paying the salaries of qualified White teachers, subsidising those centres which chose to
remain private, establishing pre-primary classes in some schools and introducing teacher
training at many colleges.
In contrast, ECD services for African children were curtailed through various pieces of
legislation. Welfare subsidies for African children were effectively eliminated by setting limits
based on parental incomes. Most training courses for African teachers were restricted
from1958, while those for Whites were allowed to continue, albeit on a smaller scale. Lower
level teacher training courses which were set up by the provincial education departments were
phased out by the end of 1990. Following such indications of the state’s unwillingness to invest
in the development of pre-school services, the bulk of the work was undertaken by community
organisations and NGOs. One of the positive spin-offs of this lack of involvement by the state,
was that the NGO sector flourished in this area, undertaking extremely valuable work with
respect to provision and the training of ECD educators that proliferated in the 1980s and ’90s.
Formalising the ECD sector: 1980 to post 1994It was not until the 1980’s that the state began to acknowledge the relevance of ECD. Noting
the high drop-out and failure rates among African pupils, the 1981 report of the De Lange
Commission emphasised the need for pre-primary education for children from disadvantaged
communities and recommended the creation of a bridging course to prepare children for entry
into formal education. While the government White Paper on the Provision of Education in
South Africa (1983) in principle accepted the idea of a one or two year bridging course, the state
cut back its involvement in ECD as a result of the South African National Education Policy
(SANEP) formula for determining subsidies which did not cater for pre-primary education.
Thus, while the Department of Education and Training saw the value of pre-primary education,
they lacked the resources necessary to implement interventions. State involvement at the time

was characterised as inadequate, segregated, fragmented, uncoordinated and lacking a
comprehensive vision. Parents, communities and the private sector bore the responsibility for
ECD provisioning.
Attempts by the apartheid government to deal with ECD essentially reinforced the
fragmented and inequitable provisioning. The ‘White’ Education Affairs Act of 1988 made
provision for the establishment and maintenance of public pre-primary schools, the
registration of private pre-schools and the provision of subsidies. The Child Care Act (1983),
which applied to all ‘at risk’ children, made provision for the registration of children’s homes
and places of care. While it represented another limited step towards formalised ECD
provisioning, it served to entrench the separation of the notions of ‘care’ and ‘education’ and
the relative downgrading of ‘places of care’ in relation to ‘educational centres’. Private and
public pre-primary schools registered with the Department of Education were able to access
subsidies by registering as pre-primary schools that also provided afternoon care.
Furthermore, while pre-primary schools qualified for tax exemptions and enjoyed special
dispensations in respect of rates, places of care and educare registered with the Department
of Welfare were classified as businesses and denied such benefits.
During this period, inadequate ECD provisioning especially for African children continued. The
Interim ECD Policy document (1996) suggested that only 9 - 11% of all South African children
from birth to six years had access to ECD facilities. The usual racial disparities were evident
with one in three White infants and children receiving ECD services, compared with one in eight
Indian and Coloured children and one in sixteen African children. Furthermore, it appeared that
twice as many urban children were receiving ECD services than their rural counterparts.
The history of racial disparity in the provisioning of ECD in South Africa was also reflected at
an organisational level in terms of the national representation of ECD educators. In the early
1980s the SAAECE began to open its membership to other population groups, but continued
to organise primarily in the urban areas and in relatively advantaged communities. Concurrently,
there were many organisational struggles in the ECD sector that mirrored broader social
struggles in the volatile political climate of the 1980s. Many of the NGOs were active in calling
for children’s rights and in developing alternative systems of provisioning and educator training.
The National Interim Working Committee (NIWC) was launched in 1990 to set about creating
a new representative national organisation. After a gruelling process of negotiation, SAAECE
and NIWC finally amalgamated in 1994 to form the Congress of Early Childhood Development
(SACECD). SACECD plays both a lobbying and organisational role, representing ECD
educators as well as addressing issues related to provisioning.
ConclusionThe history of the majority of children in South Africa is one of deprivation, in which their
development has been negatively impacted by a range of social inequalities and inadequacies. In
particular, the racist practices of apartheid and related socio-economic inequalities created a
childhood of adversity for most African children. Poverty and the consequent low levels of
nutrition, inadequate access to health care and education and a lack of basic community and
household resources, have undermined the development of children at all levels.
10

11
The sector has been marginalised and devalued. Services have been fragmented and an
inadequate subsidy system has reflected broader racial inequities which benefit White, middle-
class children. A positive outcome of the lack of government attention to the sector has been
the growth of a vibrant NGO sector, which continues to play a worthwhile role in the
collaborative development of policy and provisioning stratagems. The proposed National
Qualifications Framework (NQF) now offers an opportunity for those who have been trained
through the NGO sector to be acknowledged and accredited for their training and experience.
Not only has ECD been marginalised and fragmented, but the predominant model of
provisioning has been inherited from White, Euro-centric, middle-class contexts, which may not
be the most appropriate model in the current context. The laissez-faire replication of this
model in disadvantaged communities without sufficient funding and support, results in
questionable provisioning. As will be elaborated on in the next chapter, post 1994 developments
and interventions heralded a new phase in ECD with the development of an approach that is
strongly committed to the holistic development of children and intent on finding creative and
appropriate ways of addressing the developmental needs of all South African children.

12
13
Chapter 2Current approaches
IntroductionGiven the history of ECD and education in South Africa, it is not surprising that the current
context remains one in which there are vast inequities and continued inadequacies in the way
in which ECD services are provided. Nonetheless, there is evidence of progress in the sector.
There is now an acknowledgement of the significance of ECD in the overall approach to
children’s education, development and well-being. There is a clear commitment to the
reconstruction of ECD provisioning as evidenced by ongoing changes in policy and in a
number of interventions and projects that have been set in motion. Emerging national policies
on ECD highlight the guiding principles and vision that have evolved. Many of these principles
and perspectives reflect broader global thinking within progressive frameworks of
intervention and practice. This chapter sketches the current picture of policy development
in ECD, highlighting developments in national policy-making and the implementation of pilot
programmes and projects towards developing a framework for the reconstruction of ECD in
South Africa.
A holistic view of ECDThe historical overview presented in the previous chapter highlights the fundamental inequities
in the developmental environment of the majority of South Africa’s children. They have been,
and continue to be, severely disadvantaged. Global perspectives acknowledge that children’s
development is affected by a complex interaction of environmental factors, the demands of
which cannot be satisfied by merely increasing provisioning services. Rather, it is posited that
ECD must be approached within the wider framework of multiple contexts. ECD organisations
in South Africa have exhibited a strong commitment to extending the care of young children
into a framework of education and development, as captured in the use of the term ‘educare’
which viewed educational interventions as one component of caring for young children. Early
childhood interventions are viewed as needing to incorporate all aspects of children’s
development and as a critical stage for the development of educational abilities and other crucial
aspects of development.
The paradigm shift from educare to ECD has expanded the focus from programmes for children
in the 0 to 6 age cohort, to include children from birth to nine years. The learning patterns of
children from 0 to 9 years vary significantly from those of older children. This further
strengthens the argument for the inclusion of children above the age of six in ECD’s brief and
has also lead to the evolving view of the ‘Foundation Phase’ as a transition between the relatively
informal educare and home learning environments and the more formal environment of
schooling.
The government and the ECD sector are striving to create policy and practice that prioritises
ECD as the central component of the care of young children. Hence the widespread adoption
of the term ECD as the encompassing term for the provision of services of care and education
for young children. ECD is defined as “an umbrella term which applies to the processes by
which children from birth to nine years grow and thrive, physically, mentally, emotionally, morally

and socially”10. The use of the term is therefore founded on an understanding of the complex
nature of children’s development and in particular the interconnection of a wide range of factors
which impact on early child development.
Given the emergence of this holistic view, it is not surprising that the White Paper on Educationand Training (1995) recommended the establishment of an integrated strategy for ECD. The
Paper proposed the establishment of a formal interdepartmental committee on ECD, comprised
of the Departments of Education, Health, Social Development and Population Development. It
recommended that the interdepartmental committee works in collaboration with
representative bodies of ECD educators, trainers, resource specialists, NGOs, development
agencies and the private sector.
ECD as a foundation of democracy and equality Attitudes and prejudices develop very early in the socialisation process of children. The early
years are a crucial period for the inculcation of democratic and human rights values.
Incorporating anti-racist, anti-sexist and human rights programmes in ECD can provide a
primary point of intervention against the prejudices and discrimination that have been endemic
in South African society. Furthermore, in a society that has historically been divided across lines
of colour, culture, and religion; ECD can provide diversity in cultural and religious inputs and
facilitate the development of a more equitable form of multiculturalism.
The Preamble to the Constitution states that we need to “heal the divisions of the past and
establish a society based on democratic values, social justice and fundamental human rights”11.
The Department of Education has integrated this goal through the development of appropriate
guiding values across all levels of education. In a recent report of the working group on values
in education (2000), the key values for promotion through education were identified as: equity,
tolerance, multilingualism, openness, accountability and honour. The identified values are drawn
from the Constitution and the Bill of Rights and from educational philosophy. Two major thrusts
with respect to values in education are detailed. Firstly, the responsibility of centres of learning
to develop the intellectual and critical capacities of all learners and secondly, the goal of
challenging discrimination and prejudice on the grounds of race, gender and culture12.
ECD as protecting children’s rightsThe primary basis for the Government’s current position on, and response to, ECD provisioning
may be found in the Constitution. Here there is a clear imperative to protect the rights of
young children, including their right to basic education, health care, nutrition and security.
Within this overriding goal, policy and programmes are guided by the need to redress the past.
Some of the key considerations emerging from recent policy documents and pilot programmes
include:
14
10 White Paper on Education and Training, 1995, p.33.
11 The Constitution of the Republic of South Africa, 1996, Preamble.
12 The Department of Education of South Africa, Values, Education and Democracy: Report of the Working
Group on Values in Education, 2000.

15
• the prioritisation of historically disadvantaged communities;
• the empowerment of historically disadvantaged parents, families and communities,
especially those with little or no access to basic resources, to foster the care and
development of their children;
• the need for effective, good quality childhood development programmes and an
integrated social response to meet these needs;
• the creation of opportunities for all children, including those who are disabled, to
participate fully and to develop fully to their potential;
• the participation in planning and provisioning debates of all stakeholders including: the
Departments of Education, Heath, Social Development and Population Development and
representatives of parents, NGOs, RTOs, and CBOs;
• the formation of democratic governance structures which involve parents and
communities; and
• the development of allocation policies which aid social and economic reconstruction and
redress.
ECD as community developmentAs part of the holistic view of ECD described above, care and education are seen as integrally
related to other aspects of the child’s environment. The holistic model also acknowledges the
pivotal roles that parents and communities play in the care and education of children.
In the community development model, ECD sites are ideally constructed as community-based,
addressing the children’s needs in an integrated manner. Sites emerge out of community needs
and further invest in the development of the broader community. In this way, ECD sites can play
a role in bringing together different community groupings and organisations and providing an
integrated community service.
This model acknowledges the very tangible links between ECD and the roles of women. The
provision of community-based ECD services is seen as part of the broader goal of women’s
empowerment by allowing women, who have historically been solely responsible for the care
and nurturing of children, the freedom to choose and develop their own lifestyles and careers.
Community-based sites allow for the provision of ECD services and arrangements more
appropriate to family needs and community resources and will, in the longer term, facilitate
increased economic activity and productivity within the community.
Structures for policy and programme developmentThe White Paper (1995) proposed the establishment of a formal interdepartmental committee,
with the Department of Education and its ECD Directorate spearheading the process. An
inaugural meeting of the ad hoc Coordinating Committee for ECD (CCECD) was held in

October 1995. This collaborative body includes the Departments of Education, Health, Social
Development and Labour and its primary role is assisting the ECD Directorate in developing a
framework and policies for ECD. The National Programme of Action for Children (NPA) in the
Office of the President is another body which plays a key role in the development of a
framework for ECD, through its engagement in the task of matching children’s rights to
provisioning. All provinces are active in implementing ECD policy and programmes, although
the form and functioning of provincial structures and responsibilities may differ. All provinces
have been involved, to various degrees, in interdepartmental cooperation. In most cases the
provincial Departments of Education play the key role while the Departments of Health and
Social Development are consistently involved. Some provinces have broadened their
committees to include other provincial departments.
National ECD policyThere are a wide range of national policies and programme interventions relating to ECD which
have been developed in/by the Departments of Social Development, Health,Water Affairs and
Forestry, Justice, Sport and Recreation, Labour, Correctional Services and Local Government.
Issues addressed include the basic welfare of children, disability, primary health care, child
protection (from abuse), as well as issues relating to ECD providers such as the subsidisation of
childcare worker training through the Manpower Training Act. While some of the current legal
and policy frameworks affect children from the ages of 0 to 18, they also apply to the ECD
sector from the ages of 0 to 18, they also apply to the ECD sector. The White Paper on
Education and Training (1995) and the Interim Policy on ECD (1996) paved the way for the
development of culminating policy and legal frameworks. Once the recommendations of the
National Pilot Project on ECD and the findings of the Nationwide Audit of ECD Provisioning
were available, the Department of Education completed the development of its White Paper on
ECD, which was passed by Cabinet in May 2001.
ProvisioningThe government is committed to an holistic approach to the provisioning for ECD and to ten
years of free and compulsory schooling starting with a reception year for 5/6 year olds. The
Interim Policy for ECD (1996), building on the 1995 White Paper, covers children in the 0 to 9
year age cohort and prioritises the phasing in of a reception year for 5 year-olds with a view to
facilitating the transition to formal schooling. This interim policy which has guided a series of
pilot projects, initiated at a national level and implemented throughout the provinces over the
last 3-4 years. Two categories of provisioning are envisaged:
• Provisioning for all children over five years of age in the Reception Year of an integrated
four-year Foundation Phase programme (Grades R, 1, 2 and 3).
• Provisioning for historically disadvantaged and/or at risk (due to factors such as poverty,
ill-health, lack of family support and violence) children under five years of age will emerge
out of a strong collaboration between the Departments of Education, Health, Social
Development, Local Government and others.
16
17
CurriculumChanges to the curriculum are part of the broader goal of improving the quality of ECD
provision and will require a longer term programme of action. Curriculum 2005 provides a
curriculum framework for learners in the Foundation Phase. It focuses on eight learning areas
which replace the previous model of school ‘subjects’. In the Foundation Phase, three broader
‘learning programmes’ are identified. These learning programmes include literacy, numeracy and
life skills. For Grade R, the following guidelines for teachers are provided:13
• encourage problem-solving and decision-making in critical, creative ways;
• encourage learners to work co-operatively with each other;
• affirm learners as individuals in an anti-bias setting;
• encourage communication through art, movement, drama and language;
• ensure active learning through involvement, exploration and discovery on the part of
learners; and
• encourage contextual thinking.
There is currently no formalised curriculum for learners in the 0-5 year age cohort. However
the intention is to ensure a curricular link between early education and the Foundation Phase.
The following central guiding principles have been proposed as a framework for an interim
national curriculum for the ECD sector:14
• the inclusion of knowledge, skills, processes, values and attitudes that are appropriate to
the current context of social, political and economic conditions;
• the drawing on of multicultural experiences and strengths of all the various communities
of South Africa;
• the adoption of a more learner-centred approach in the early learning years; and
• the development of a “pedagogy based on an interactive approach to learning and aimed
at encouraging children’s curiosity, developing confidence in using basic linguistic and
cognitive skills and achieving fundamental literacy and numeracy”.
Accreditation and training of educatorsInterim guidelines for the accreditation of ECD educator training providers have been
developed, and progress is being made in formulating the final accreditation processes and
constituting accreditation bodies. Accreditation will take place at two levels:
• the accreditation of educators will be based on the educator’s required knowledge, skills
and abilities. These will be elaborated upon within the competency structure of the
National Qualifications Framework; and
13 Department of Education: Guidelines for Developing Learning Programmes for Grade R, 1999, p. 32.
14 Department of Education, Interim Policy for ECD, 1996, p.16.

• the accreditation of ECD educator training providers will be based upon their
programmes, their staff, their teaching methodologies and their resources.
The Interim Accreditation Committee (IAC) was appointed in 1997 by the Minister of Education
to provide, in accordance with the NQF, the norms and standards for ECD and to accredit
educators and ECD educator training providers. An ECD Standards Generating Body (SGB)
was established in 2000 and new qualifications for ECD have been registered with SAQA for
Levels 1, 4 and 5. These qualifications are based on unit standards developed during the National
Pilot Project. A quality assurance body to accredit educator training providers has yet to be
appointed. The training of educators is considered a priority, and an assessment of capacity
within both the formal and NGO sectors has been undertaken as part of the Nationwide Audit
of ECD Provisioning and the National Pilot Project. ECD educator training providers have
begun developing their curricula according to the guidelines drawn up by the Interim
Accreditation Committee.
Employment of ECD educatorsECD educators are entitled to certain contract conditions and minimum wages as set down in
the Basic Conditions of Employment Act. In practice the protection of the Act is not afforded
to the majority of ECD educators. The interim policy on ECD suggests that the emphasis on
partnerships in provisioning will continue and that employer bodies from both the public and
private sectors will continue to be active within the sector. This premise means that the rights
and entitlements of ECD educators, as employees in both domains, will have to be safeguarded
within the frameworks of the Education Labour Relations Act, the Labour Relations Act, and the
Educators Employment Act.
Funding of ECD servicesThe interim policy for ECD argues strongly for the public funding of a national ECD programme
and maintains that such funding must be mobilised from national, provincial and local
government revenues. It also argues that employers, in particular, have responsibilities for the
funding of ECD provisioning for their employees’ children. Current funding policies are
premised on:
• a recognition that the funding of ECD services involves partnerships between national,
provincial and local governments, the private sector, organised labour, community
organisations, parents and donor agencies;
• the existence of an enabling legislative environment to encourage the optimum
mobilisation of financial resources;
• investments in the sector being within the framework of a strategy for reconstruction
and development; and
• the adequate and efficient use of resources.
18

19
Following the evaluation of the National Pilot Project there is broad support for funding of the
Reception Year by government. It is argued that to some extent, this is already happening, given
that in some areas nearly 40% of learners in Grade 1 are underage15, and should more
appropriately be in Grade R. Funding is the greatest constraint to the development of ECD. The
“need for creative investigation of special measures/mechanisms to address appropriately the
funding needs of ECD and to increase the existing pool of resources available for ECD
programming”16 remains the greatest challenge facing the sector.
Pilot Projects: testing the theoriesWell grounded, verified and appropriate information and insights are the cornerstones of
responsive policy development and programme implementation. Reliable information on the state
of ECD provisioning has not existed until very recently. Much of what was known about the
nature of ECD provisioning,was gleaned from two pilot projects undertaken during the late 1990s.
The National Pilot ProjectThe National Pilot Project was launched in 1997, spearheaded by the Department of Education and
designed to test the interim ECD policy, particularly that relating to the Reception Year. The main
objectives of the Pilot Project were to:
• research the most effective means of delivering a Reception Year programme;
• build capacity at provincial departmental level in conjunction with educator training providers;
• develop and test innovations related to the: training of educators; accreditation of educators
and training providers; disbursement of subsidies; and other aspects of the interim policy; and
• promote outcomes-based education in line with the NQF.
Provinces were allocated pro-rata funds to: provide subsidies to community based sites and to
contract educator training providers to provide training towards accreditation of educators. The
provinces made commitments to utilise the funds in accordance with the goals of the Pilot Project
and to provide provincial funds for years two and three of the project. In total 2,730 sites reaching
approximately 66,000 learners participated in the Pilot Project.
In an evaluation of the national pilot project, provincial representatives reaffirmed that Grade R
should be made compulsory and phased in over a five year period17. The evaluation report
recommended that a combination of Grade R classes at both primary schools and community-
based sites be developed, and that schools should be strongly encouraged to offer Grade R
classes. With respect to the community based Grade R classes, two models of delivery have
been suggested: community based Grade R classes could be formally linked with a primary
school or they could be registered as independent schools.
15 Khulisa Management Services, 1998, cited in the President’s Report on the State of the Nations Children. 1999.
16 Department of Education, Interim Policy for ECD, 1996, p. 22.
17 Khulisa Management Services, National ECD Pilot Project: Phase Three Research Report. 2000.

The Impilo ProjectThe Gauteng Department of Education’s Impilo Project addressed the needs of the 0-5 year old
children. Impilo, which means ‘life’, was launched in June 1997, aiming to pilot a multi-service
approach to ECD provisioning with a group of children at risk and/or living in poverty, through
partnerships between all government and non-government ECD role-players, as well as through
the participation of families and communities. Impilo was successful in achieving collaboration
between a broad spectrum of educator training providers, NGOs, local government, provincial
government departments, including Health,Welfare, Arts and Culture, and Safety and Security.
Impilo included three linked pilot projects which covered the full ECD age range of 0-9. These
projects were based on the integration of key messages to families, communities and the ECD
sector about children’s basic and developmental needs and the importance of partnership in
meeting these needs.
The conclusions drawn from Impilo included: the need for flexible models of ECD provisioning
and the need for new inter-sectoral, integrated and comprehensive legal frameworks for ECD
in order to ensure coordination at all levels and access to funds that can target those children
most at risk.
Current limitations and challenges for an ECD policy frameworkDespite the various official pronouncements, policy developments and pilot programmes detailed
above, the sector has yet to receive a clear indication of priority status and direction.
Consequently, Departments of Education in some of the more disadvantaged provinces are
directing resources away from ECD provision. Funding to the NGO sector is diminishing which
may eventually hamper the sector’s capacity to make meaningful contributions to ongoing
developments. There are finite funds to ensure provision for all of South African young children.
These financial and resource constraints pose difficult challenges for the development of a
national ECD programme. Concerns have been expressed within the sector about the direction
that policy development is taking. There are those who feel that the prioritisation of the
Reception Year may be at the expense of the earlier years of development. Similarly some feel
that too much focus has been placed on ECD sites, at the expense of developing communities
and families. Linked to this argument is a strong call for an integrated legal framework for ECD
that will facilitate collaborative and holistic networks for community based ECD interventions.
These problems notwithstanding, significant progress has been made in policy development, in
bringing the concerns of the sector to the fore and in establishing the developmental
imperatives of ECD. The pilot projects have developed and tested appropriate provisioning
models. What has been lacking is a comprehensive empirical picture of provisioning in South
Africa. The heretofore marginalisation, nature and evolution of the sector mitigated against
centralised and formal record-keeping. Policy developments and implementation, no matter the
extent to which they are based on sound, social and pedagogical tenets, are likely to fail in the
absence of accurate, broad-based and verified empirical information. Finite resources tend to
undermine fine policies. The ECD Directorate of the National Department of Education being
cognisant of this reality, determined to face the challenges posed by this lack of verified empirical
data. Thus the need to conduct the Nationwide Audit of ECD Provisioning. The following
chapters detail the methodology, results and findings of the Audit.
20

21
Chapter 3Methodology
IntroductionIn May/June 2000, the National Department of Education undertook the Nationwide Audit of
ECD Provisioning. In a period of seven weeks, 23,482 sites, employing 54,503 educators and
providing services to 1,030,473 learners, were audited. This study is noteworthy not only for
its scale and depth but also for generating, for the first time, empirically grounded and rigorous
information and insights with respect to the state of ECD provisioning in South Africa. The
Audit has yielded previously unavailable and invaluable data concerning a range of aspects of
ECD provisioning, including profiles of sites, learners, educators and programmes. An additional
outcome of the Audit is an excellent data base of ECD sites. For the first time within the sector,
rigorous and verified data is now available on which to base the formation of policy and the
implementation of provisioning priorities.
This chapter details the methodology of the Audit, including all aspects of the planning and
implementation of this macro-study. The execution of the Audit included some of the usual
phases of research, such as the identification of aims; the development and testing of the
research questionnaire; and the procedures of data collection, capturing, analysis and reporting.
It also included research capacity building in which 854 enumerators were trained to administer
the questionnaire and gained valuable skills through their involvement in the process.
The rationale for the AuditAs mentioned previously, the lack of comprehensive and rigorous quantitative information
regarding ECD provisioning was a significant trigger for the development of this research
intervention. It had become apparent to all concerned that this lack of data was hindering
informed resource allocation and policy development, as well as the quality of planning for co-
ordinated and regulated services in the sector. The Department of Education prioritised the
acquisition of empirical data in order to better serve the majority of the country’s children.
As part of its 1996 Programme for Reconstruction and Development, the European Union
funded a project titled the “European Union Technical Support to the South African Department
of Education Project”. The main aims of the Project, which commenced in 1998, are to increase
the learning opportunities for illiterate adults and disadvantaged children and to improve the
capacity of the National and Provincial Departments of Education to deliver relevant and
sustainable services to the learners in these sectors. ECD is one of the three areas targeted by
the EU Project. During a review of this Project in August 1998, the ECD Directorate of the
Department of Education expressed the need for a national survey of ECD human and physical
resources, services, educators and learners. The Directorate maintained that empirical research
would, apart from aiding policy development and informing provisioning policies, contribute to
inter- and intra-sectoral co-operation and increased quality assurance. The European Union
agreed to fully fund the Nationwide Audit of ECD Provisioning.

Planning the AuditA hallmark of the Audit was the investment in inclusiveness from its inception. A number of
consultative meetings were held with relevant stakeholders during conceptualisation. In
addition, visits were made to a variety of ECD sites and training centres in Gauteng, Mpumalanga
and the Western Cape. A series of meetings with relevant stakeholders were held; a meeting
of all nine provincial Departments of Education, Health and Social Development was convened
and a public forum on the nature, scope and implementation of the Audit was held in Pretoria.
A National Steering Committee, nine Provincial Steering Committees and a National Research
and Publications Committee were established.
Following a rigorous tendering and selection procedure involving pre-submission briefing
sessions in Pretoria, Durban and Cape Town and the receipt of fifty five tenders, one national
consortium and nine provincial agencies/consortia were contracted. The selected
agencies/consortia were drawn from the NGO, university and private sectors. The national
consortium was responsible for: conducting a postal survey of ECD educator training providers,
identifying and listing ECD sites, developing a questionnaire to be administered at each ECD
site, training provincial core trainers of enumerators, overseeing the Audit process in the
provinces and assisting with the validation of a sample of completed questionnaires. The task
of the nine provincial agencies was to manage the provincial Audit process including the
selection, training and monitoring of the enumerators who would collect the primary data.
Surveying the educator training providersThe first task of the national consortium was to conduct a postal survey of all ECD educator
training providers in order to identify, quantify and classify ECD educator training provision
throughout the country. A questionnaire was developed which focused on the size, location,
classification and distribution of the training providers; profiles of students; the nature, levels,
duration and accreditation of training programmes offered; and the levels and nature of financial
support. A list of 147 training providers was drawn-up following widespread consultation and
verification with NGOs, universities, colleges of education, vocational colleges, Community
Based Organisations (CBOs) and private sector providers. Questionnaires with pre-paid return
envelopes were posted to all. While the initial response to the postal survey was poor, sustained
follow-up calls, letters and visits, resulted in completed questionnaires being received from 112
(76%) ECD educator training providers.
Auditing the ECD sitesFor the purposes of the Audit, an ECD site is defined as any public or private, formal or informal
location wherein ECD services are offered to groups of six or more learners. Existing databases
within the Departments of Education, Health and Social Development, as well as those of
training providers (including some of those identified during the postal survey) were accessed.
NGOs, CBOs, funding organisations and any other possible sources of information were also
asked to submit site lists.
An audit questionnaire was designed to capture information on: demographics, infrastructure,
learners, educators and programmes. Given that this was the first time that base-line data was
being gathered in the ECD sector, pressures were considerable to include questions on as many
22

23
aspects of ECD provisioning as possible. Extremely difficult decisions had to be made regarding
the eventual content of the questionnaire, and compromises were reached between that which
was desirable and that which was attainable. A draft version of the questionnaire was piloted
in early April 2000 in fifty sites in urban, peri-urban, rural and deep rural locations, as well as in
different settings: Grade R classes in schools, community centres and homes. Adjustments were
made to the questionnaire on the basis of the pilot.
Core trainers from each provincial agency were trained by the national consortium in Pretoria
in matters relating to the training of provincial enumerators and the administration of the
questionnaire. An enumerator manual was provided by the national consortium. The final
version of this manual was made available in English, with translations of key sections in the
other ten official languages.
The provincial agencies were required to select suitable enumerators to conduct the Audit. A
total of 854 enumerators were trained during the first week of May 2000. They were drawn
predominantly from the ECD sector: many were trainers and fieldworkers from educator
training providers, others were unemployed ECD educators, a small number were community
workers with relevant experience (like teaching), while still others were post-graduate social
science students with research experience.
The accuracy of the information regarding the location and contact details of sites contained on
the various lists was varied. The model had an in-built bias towards duplication given that some
sites were listed on two or more of the lists submitted to the national consortium. While the
national consortium removed those that were clearly duplicates, cases which differed only
slightly with respect to site name or address were left on the list on the grounds of erring on
the side of inclusion rather than exclusion. Initial lists were sent to the provincial agencies in
mid-April 2000. A total of 30,101 unverified sites were listed by the National Consortium. It
can be assumed that despite the rigorous process of site identification, a negligible number of
sites slipped through the net. Of the 30,101 unverified sites provided on provincial lists, 7,845
were subsequently deleted by the provincial agencies as being duplicates, non-existent or closed,
resulting in a revised total of 22,256.
Provincial agencies were supplied with letters of introduction for visited sites. Data collection
commenced on the 8th May 2000. While the provincial agencies were responsible for
supervising the enumerators, the process was also monitored and facilitated by the national
consortium, the Provincial Steering Committees and the Research and Publications Committee.
The Audit was initially intended to proceed for five weeks. However, given the scope of the
process and some inevitable delays in site visits, fieldwork was extended until 30th June 2000.
Every attempt was made to identify, locate and audit all those on the revised lists and on any
‘supplementary’ lists provided by the Provincial Steering Committees. Provision was also made
for sites ‘discovered’ during the fieldwork process to be added to the lists and audited. Site
information was ultimately assimilated on 23,482 sites.
Feedback from supervisors and monitors was that the process proceeded remarkably smoothly,
with largely positive support and co-operation from the sites. In the few cases where access to

sites was denied (n < 80), objections were raised to what was perceived to be yet another
Departmental exercise or ‘government intrusion’ into their private affairs. The task of the
enumerators was often an extremely daunting one. Physically locating sites was a major
headache, with some having only a name and no further identifying information. There were also
very long distances to be travelled, often on extremely poor roads, sometimes only to find that
the site no longer existed.
Circumstances in some provinces posed further challenges to the Audit. Weather conditions
were less than ideal in parts of the country, resulting in rain storms and flooding, making access
almost impossible. The safety of enumerators and supervisors was also an issue in places, with
transport and gang-related violence making travelling dangerous. There are many examples of
the adverse conditions that enumerators confronted: one enumerator was in a site while
shooting was happening on the premises; another was robbed at gun-point at a site while trying
to pace out the size of the playground. Enumerators sometimes had to deal with suspicion and
hostility within the sites. One enumerator, arriving at a site a day after a burglary, was viewed
as a suspect and followed home for interrogation by the police. Even more extreme was the
experience of another enumerator who spent a whole day in prison on a charge of trespassing
after attempting to visit a site.
A stratified random sample of 2% (n = 465) of sites was selected for verification. The selected
sites were visited to ascertain whether they had in fact been audited and whether the
information was correctly recorded. Verification of the information on the questionnaires was
carried out by the Department of Education and the national consortium. The verification
process established that all sites selected had in fact been audited and that all vital data had been
recorded properly. Minor discrepancies were evident with respect to the more subjective items
on the questionnaire. The data was then captured on an MS Access database. Questionnaires
with missing or obviously incorrect data (n = 163) were returned to the provincial agencies for
completion. In this process of cross-checking of the collected data, no major or consistent
patterns of errors were detected, and the few inaccuracies that were discovered were either
corrected prior to data analysis or otherwise excluded. Specific queries were run on the data
to check for remaining errors and a number of inconsistencies were discovered. These
inconsistencies never exceeded more than 0.1% and did not materially affect the overall
reliability of the data.
Analysis and presentation of the dataThe data was converted from MS Access to the Statistical Package for the Social Sciences
(SPSS) and various levels of statistical analysis undertaken. Descriptive results at national
and provincial levels are presented as are crosstabulations of the major indicators. All results
are reported at the 5% significance level. All percentages shown in brackets are column
percentages and reported to the nearest whole number.
Four indices providing summaries of key aspects of provisioning were constructed by
summating and weighting individual items in the audit questionnaire. The four indices thus
constructed are the:
24

25
Infrastructure index: provides a summated picture of material and infrastructural resources at
the site.
Support index: combines items which refer to the degree of financial and educational
support provided to the site by government, parents and educator
training providers.
Programme index: presents a composite measure of the educational activities and
programmes being implemented at the site.
Educator index: combines information about the highest school grade completed,
qualification and teaching experience of the educators at the site.
The indices were constructed using relevant items and sub-items from the questionnaire. For
example, the infrastructure index included items such as: the type of buildings; the availability of
electricity, toilets and water; the learning and play areas available to learners; the existence of a
kitchen etc. Each item within the index contained sub items: the ‘type of buildings’ item
contained sub-items such as: conventional brick, traditional mortar, shipping container, prefab,
etc. Each sub-item was assigned an intuitive weighting which contributed to the overall index
score which a site could achieve on any one of the four indices.
Three categories of scores were then calculated using the nationally generated median as the
reference. In all cases, one standard deviation above and below the mean was defined as
‘average’. More than one SD below the mean was defined as ‘below average’, while more than
one SD above the mean was defined as ‘above average’. In the Infrastructure Index the mean
was 26 and the SD was 9.7. All sites who scored between 0 and 17 were grouped together as
‘below average’, those between 18 and 35 as ‘average’ and those above 36 as ‘above average’.
Obviously this is a construct which pre-determines that approximately 66% of the sites
measured against any of the indices will fall into the ‘average’ category, while approximately 17%
will be categorised as ‘below average’ and 17% as ‘above average’.
The construct on its own is of little use, however, it provides a very powerful model once it
is cross-tabulated with any other variable. Using the nationally generated median as the
reference, allows for very useful and informative comparative analysis at provincial level and
with respect to key variables. Using the nationally generated median also minimises the
effects of subjectivity.
Finally, data was gathered on the length of time that sites have been operating. The results
generated from this data were interpreted to refer to the ‘sustainability’ of the site. Further
analyses were undertaken to establish which factors are most strongly related to sustainability,
i.e. which factors predict whether a site is more likely to have been in existence for less than a
year compared to, for example, being in existence for more than five years. The CHAID
technique was used. It is a data analysis technique used to establish which ‘predictor’ variables
amongst a list are most strongly related to a categorical dependent variable. It is a form of
regression analysis for categorical data using chi-square tests of significance. Using CHAID, the

following list of factors were tested to determine which are most strongly related to the
sustainability of a site: province; geographical location (urban/rural); type of site
(home/school/community based); and the four indices (infrastructure, support, programme and
educator).
ConclusionAlthough there are some missing values in certain fields in the data-set and unavoidable
subjective judgements underlying certain ratings, the overall quality of the data is of a very high
standard. This assessment is based on the diligence of the data collection process, the
verification of the data collected and the internal consistency of the data-set which emerged
during the statistical analysis.
The next chapter details the national findings while the penultimate chapter provides condensed
findings on each province.
26

27
Chapter 4National results
South Africa
This chapter provides a broad overview of ECD provisioning at a national level. The following
results are presented:
• General provisioning.
• Services and support.
• Learner profiles.
• Educator profiles.
• Educator training providers.
• Indices: infrastructure, support, programme and educator.
• Sustainability.
• Salient findings.

28
South Africa General provisioning
SA1 Number of sites
SA2 Type of sites1
Site type Frequency
School based 3,623 (17)
Community based 10,816 (49)
Home based 7,453 (34)
Total2 21,892
0
5
10
15
20
25
EC FS G KZN M NC NP NW WC
Province Sites (%)
Eastern Cape 3,231 (14)
Free State 1,665 (7)
Gauteng 5,308 (23)
KwaZulu-Natal 5,684 (24)
Mpumalanga 1,367 (6)
Northern Cape 422 (2)
Northern Province 1,987 (8)
North West 1,174 (5)
Western Cape 2,644 (11)
South Africa 23,482
Sites
1 All figures within the brackets in the tables throughout this report represent column percentages.
2 Table totals may differ as some cases are invariably lost when two or more variables are cross-tabulated.

29
South Africa General provisioning
SA3 Geographic location
Location3 Frequency
Urban (formal) 11,225 (49)
Urban (informal) 2,565 (11)
Rural 9,124 (40)
Total 22,914
SA4 Distance to nearest primary school
Kilometres4 Frequency
< 1 16,723 (72)
≥ 1 < 3 4,626 (20)
≥ 3 < 5 1,246 (5)
≥ 5 807 (3)
Total 23,402
3 ‘Urban formal’ ordinary town or city areas with mostly formal dwellings,
‘Urban informal’ ordinary town or city areas with predominantly informal dwellings,
‘Rural’ villages, rural resettlement areas, commercial farms.
4 < less than,
≥ greater than or equal to.

30
South Africa General provisioning
SA5 Availability of mains electricity, flushing toilets and piped water x site type
Resource School Community Home Total
Mains electricity, piped water and flushing toilets 1,819 (51) 5,111 (48) 4,490 (61) 11,420 (53)
Mains electricity and piped water only 371 (10) 1,289 (12) 791 (11) 2,451 (11)
Mains electricity and flushing toilets only 13 (0) 64 (1) 14 (0) 91 (0)
Piped water and flushing toilets only 142 (4) 464 (4) 400 (5) 1,006 (5)
Mains electricity only 34 (1) 144 (1) 66 (1) 244 (1)
Piped water only 954 (27) 2,725 (26) 1,014 (14) 4,693 (22)
Flushing toilets only 5 (0) 10 (0) 5 (0) 20 (0)
None of these resources 239 (7) 860 (8) 570 (8) 1,669 (8)
Totals 3,577 10,667 7,350 21,594
Electricity
91
• None of these resources - 1669
Mains electricity
Pipedwater
Flushingtoilets
244
4,69320
11,420
91
1,006
2,451
CommentThe Nationwide Audit of ECD Provisioning identified, located and administered questionnaires
in 23,482 ECD sites in South Africa. Provincial distribution of sites mirrors population
distribution data.
Nearly half of the sites audited are community based, a third home based and the remainder
school based. Half are situated in formal urban settings, two out of five in rural areas (including
farms) and the remainder in informal urban settings. Although nearly three quarters of the sites
are within one kilometer of a primary school, over 2,000 sites are three kilometers or more
from a primary school.
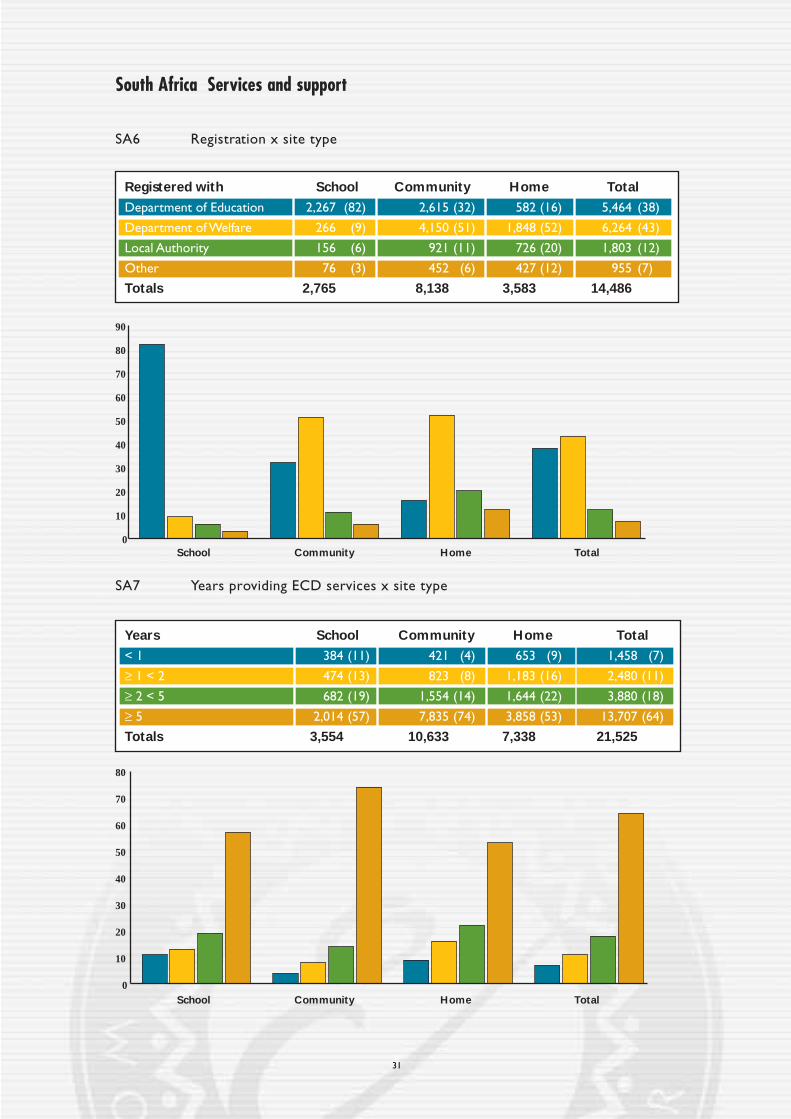
31
South Africa Services and support
SA6 Registration x site type
SA7 Years providing ECD services x site type
Registered with School Community Home Total
Department of Education 2,267 (82) 2,615 (32) 582 (16) 5,464 (38)
Department of Welfare 266 (9) 4,150 (51) 1,848 (52) 6,264 (43)
Local Authority 156 (6) 921 (11) 726 (20) 1,803 (12)
Other 76 (3) 452 (6) 427 (12) 955 (7)
Totals 2,765 8,138 3,583 14,486
Years School Community Home Total
< 1 384 (11) 421 (4) 653 (9) 1,458 (7)
≥ 1 < 2 474 (13) 823 (8) 1,183 (16) 2,480 (11)
≥ 2 < 5 682 (19) 1,554 (14) 1,644 (22) 3,880 (18)
≥ 5 2,014 (57) 7,835 (74) 3,858 (53) 13,707 (64)
Totals 3,554 10,633 7,338 21,525
0
10
20
30
40
50
60
70
80
90
School Community Home Total
0
10
20
30
40
50
60
70
80
School Community Home Total

32
South Africa Services and support
SA9 Hours of operation x site type
SA8 Years providing ECD services x registration
Years Registered Not registered
< 1 566 (4) 924 (4)
≥ 1 < 2 1,142 (8) 1,389 (8)
≥ 2 < 5 2,246 (16) 1,730 (22)
≥ 5 10,153 (72) 3,864 (49)
Totals 14,107 7,907
Hours School Community Home Total
< 5 917 (26) 906 (9) 644 (9) 2,467 (12)
≥ 5 < 10 2,450 (70) 7,643 (73) 4,346 (60) 14,439 (68)
≥ 10 126 (4) 1,922 (18) 2,227 (31) 4,275 (20)
Totals 3,493 10,471 7,217 21,181
0
10
20
30
40
50
60
70
80
School Community Home Total
0
10
20
30
40
50
60
70
80
Registered Not registered

33
South Africa Services and support
SA10 Monthly fee levels5 x site type
School Community Home
0
5
10
15
20
25
30
35
40
45
Total
Rands/month School Community Home Total
< 25 1,451 (44) 3,745 (37) 1,364 (21) 6,560 (33)
≥ 25 < 50 776 (24) 2,484 (25) 1,417 (21) 4,677 (23)
≥ 50 < 75 184 (6) 884 (9) 1,146 (17) 2,214 (11)
≥ 75 864 (26) 2,915 (29) 2,742 (41) 6,521 (33)
Totals 3,275 10,028 6,669 19,972
SA11 Fee payment rates x site type
Payment rate School Community Home Total
0 - 25% 1,007 (29) 2,898 (28) 1,962 (27) 5,867 (27)
26 - 50% 817 (24) 2,713 (26) 1,964 (27) 5,494 (26)
51 - 75% 605 (17) 1,949 (18) 1,530 (21) 4,084 (19)
76 - 100% 1,056 (30) 2,962 (28) 1,860 (25) 5,878 (28)
Totals 3,485 10,522 7,316 21,323
School Community Home
0
5
10
15
20
25
30
Total
5 Fee levels applicable to learners aged three years and over.

34
South Africa Services and support
SA12 Other sources of income x site type
0
5
10
15
20
25
30
Fees only Fundraising DoW DoE Donations DoH Other LA Private
Source School Community Home Total
No other sources6 691 (20) 2,484 (23) 2,804 (40) 5,979 (28)
Fundraising 849 (25) 2,235 (21) 1,102 (16) 4,186 (20)
Dept. of Welfare 186 (5) 2,342 (22) 627 (9) 3,155 (15)
Dept. of Education 941 (28) 865 (8) 297 (4) 2,103 (10)
Donations 250 (7) 937 (9) 533 (8) 1,720 (8)
Dept. of Health 164 (5) 367 (3) 890 (13) 1,421 (7)
Other7 159 (5) 808 (8) 488 (7) 1,455 (7)
Local Authorities 104 (3) 455 (4) 184 (2) 743 (4)
Private sector grant 53 (2) 189 (2) 67 (1) 309 (1)
Totals 3,397 10,682 6,992 21,071
6 No sources of income other than fees.
7 ‘Other’ in this instance refers to a source of income which could not readily be classified, e.g. using the facility
for other services, selling vegetables grown on the land surrounding the site etc.
CommentOf the identifiable sites, approximately two thirds are registered. Most school based sites are registered
with the Department of Education,while the majority of community and home based sites are registered
at the Department of Welfare. Significantly more home based sites stay open for longer than ten hours,
presumably providing after care childminding services. While almost two thirds of the identifiable sites
have been in operation for five years or more,a greater percentage of community based sites have been
in operation longer than the other provisioning models.
Learner fees are the principle source of income within the ECD sector. More than a quarter of the sites
report that they have no source of income other than fees. Almost a third of the sites charge fees of
less than R25/month and while 90% of the sites audited do charge fees, in about half of these, fees are
not paid regularly. The over-dependence on parentally sourced fee income has resulted in the financial
support base of a significant number of sites in a perilous position.
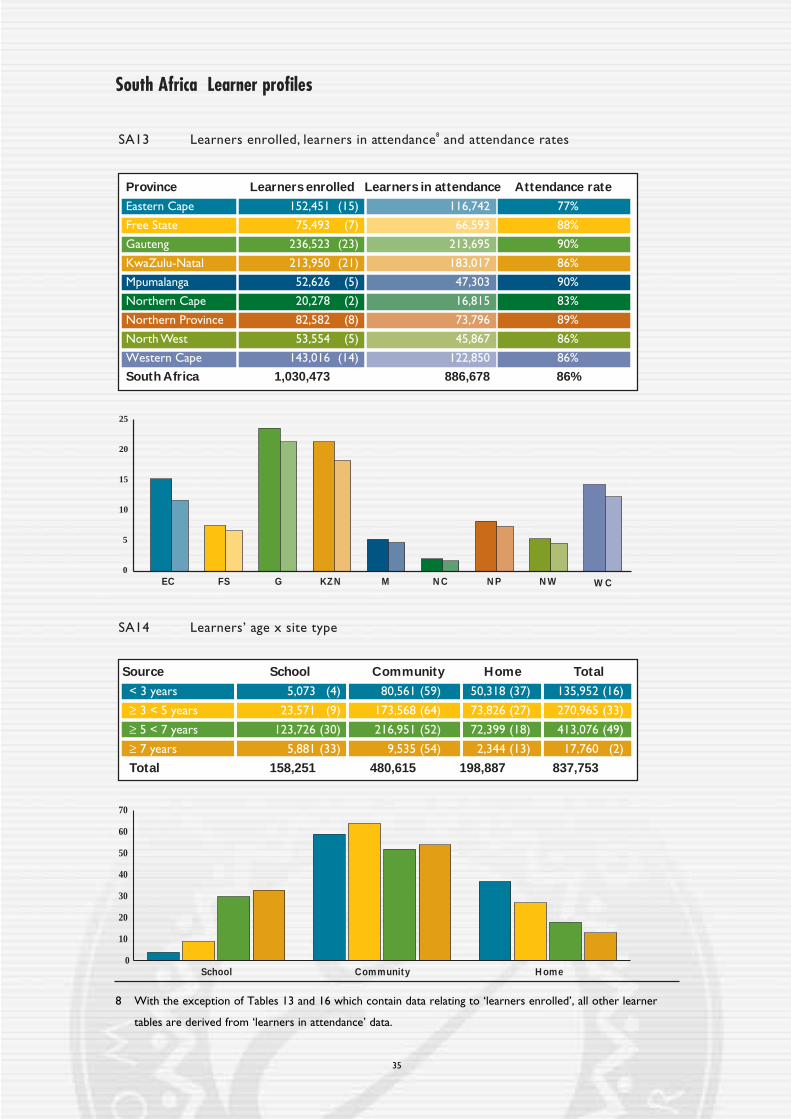
35
South Africa Learner profiles
SA13 Learners enrolled, learners in attendance8 and attendance rates
WCEC0
5
10
15
20
25
FS G KZN M NC NP NW
Province Learners enrolled Learners in attendance Attendance rate
Eastern Cape 152,451 (15) 116,742 77%
Free State 75,493 (7) 66,593 88%
Gauteng 236,523 (23) 213,695 90%
KwaZulu-Natal 213,950 (21) 183,017 86%
Mpumalanga 52,626 (5) 47,303 90%
Northern Cape 20,278 (2) 16,815 83%
Northern Province 82,582 (8) 73,796 89%
North West 53,554 (5) 45,867 86%
Western Cape 143,016 (14) 122,850 86%
South Africa 1,030,473 886,678 86%
SA14 Learners’ age x site type
Source School Community Home Total
< 3 years 5,073 (4) 80,561 (59) 50,318 (37) 135,952 (16)
≥ 3 < 5 years 23,571 (9) 173,568 (64) 73,826 (27) 270,965 (33)
≥ 5 < 7 years 123,726 (30) 216,951 (52) 72,399 (18) 413,076 (49)
≥ 7 years 5,881 (33) 9,535 (54) 2,344 (13) 17,760 (2)
Total 158,251 480,615 198,887 837,753
0
10
20
30
40
50
60
70
School Community Home
8 With the exception of Tables 13 and 16 which contain data relating to ‘learners enrolled’, all other learner
tables are derived from ‘learners in attendance’ data.

36
South Africa Learner profiles
SA15 Learners’ gender
SA16 Learners’ population group
Population group Frequency
African 637,280 (74)
Coloured 89,458 (10)
Indian 18,552 (2)
White 116,770 (14)
Total 862,060
Gender Frequency
Male 439,876 (50)
Female 446,219 (50)
Total 886,095

37
South Africa Learner profiles
SA17 Learners’ home language and languages of instruction
Language Home language Language of instruction9
Afrikaans 143,950 (14) 4,200 (18)
English 120,459 (12) 19,411 (83)
isiNdebele 12,301 (1) 179 (1)
isiXhosa 189,213 (19) 3,885 (17)
isiZulu 241,045 (24) 7,492 (32)
Sepedi 76,629 (8) 2,035 (9)
Sesotho 93,365 (9) 3,167 (13)
Setswana 70,491 (7) 1,859 (8)
SiSwati 22,325 (2) 547 (2)
Tshivenda 13,449 (1) 373 (2)
Xitsonga 24,101 (3) 559 (2)
Total 1,007,328 23,482
0
10
20
30
40
50
60
70
80
90
Afrikaans English Ndebele Xhosa Zulu Sepedi Sesotho Tswana Swati Venda Tsonga
9 The total of these percentages exceeds 100% as in many sites more than one language of instruction is used.
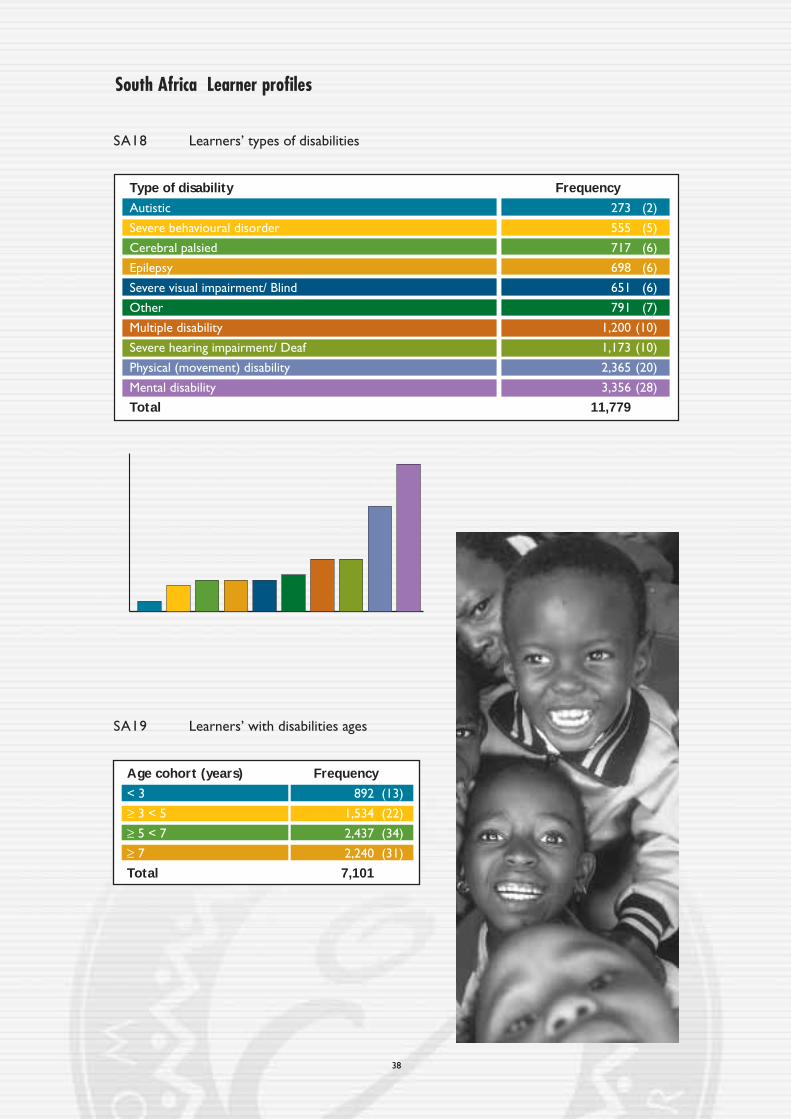
38
South Africa Learner profiles
Type of disability Frequency
Autistic 273 (2)
Severe behavioural disorder 555 (5)
Cerebral palsied 717 (6)
Epilepsy 698 (6)
Severe visual impairment/ Blind 651 (6)
Other 791 (7)
Multiple disability 1,200 (10)
Severe hearing impairment/ Deaf 1,173 (10)
Physical (movement) disability 2,365 (20)
Mental disability 3,356 (28)
Total 11,779
SA18 Learners’ types of disabilities
SA19 Learners’ with disabilities ages
Age cohort (years) Frequency
< 3 892 (13)
≥ 3 < 5 1,534 (22)
≥ 5 < 7 2,437 (34)
≥ 7 2,240 (31)
Total 7,101
Type of disability Frequency
Autistic 273 (2)
Severe behavioural disorder 555 (5)
Cerebral palsied 717 (6)
Epilepsy 698 (6)
Severe visual impairment/ Blind 651 (6)
Other 791 (7)
Multiple disability 1,200 (10)
Severe hearing impairment/ Deaf 1,173 (10)
Physical (movement) disability 2,365 (20)
Mental disability 3,356 (28)
Total 11,779

39
CommentMore than one million learners are enrolled in the identifiable sites, 86% (886,678 cases) of
which were in attendance on the days the sites were audited. The majority (57%) of the learners
are enrolled in community based sites, a quarter in home based and a fifth in school based sites.
The gender, race and age profiles are consistent with the national population distribution figures.
While English is the home language of only 12% of the learners (120,459 cases), it is used as a
language of instruction in 83% of the sites. By the measures employed here, both English and
Afrikaans are over subscribed as languages of instruction vis-à-vis the home languages of the
learners, conversely Xhosa and Zulu are under subscribed.
Half of the learners are in the 5 to 6 years age cohort and most of the remainder are younger
than 5 years. A small proportion (2%) are 7 years or older. Of the total number of learners
enrolled, just over 1% have some form of disability. Of the 7,000 ‘learners with disabilities’ for
whom age cohort data was available, 31% are aged seven years and older. The disproportionate
percentage of ‘overage learners with disabilities’ (31%) when compared to the percentage of
overage learners in the audit population (2%), suggests that the ECD sector may be catering for
learners with disabilities in the absence of them being enrolled in primary schooling.
South Africa Learner profiles

40
South Africa Educator profiles
SA20 Educators, learners enrolled and learner/educator ratio
SA21 Educators in site types
SA22 Educators’ gender
Province Educators Learners enrolled Learner/educator ratio
Eastern Cape 6,354 (12) 152,451 (15) 24/1
Free State 3,964 (7) 75,493 (7) 19/1
Gauteng 15,052 (28) 236,523 (23) 16/1
KwaZulu-Natal 10,603 (19) 213,950 (21) 20/1
Mpumalanga 2,658 (5) 52,626 (5) 20/1
Northern Cape 844 (1) 20,278 (2) 24/1
Northern Province 3,615 (7) 82,582 (8) 23/1
North West 2,910 (5) 53,554 (5) 18/1
Western Cape 8,503 (16) 143,016 (14) 17/1
South Africa 54,503 1,030,473 19/1
0
5
10
15
20
25
30
Site types Frequency
School based 6,828 (13)
Community based 29,156 (57)
Home based 15,497 (30)
Total 51,481
Gender Frequency
Male 484 (1)
Female 54,014 (99)
Total 54,498
EC FS G KZN M NC NP NW WC

41
South Africa Educator profiles
SA23 Educators’ age
Age (years) Frequency
< 20 413 (1)
≥ 20 < 30 11,718 (22)
≥ 30 < 40 19,401 (37)
≥ 40 < 50 13,603 (26)
≥ 50 < 60 5,993 (11)
≥ 60 1,844 (3)
Total 52,972
SA25 Educators’ qualifications10
0
5
10
15
20
25
30
35
40
45
No training NGO training Under-qualified Qualified Non-ECD qual.
SA24 Educators’ population group
Population Group Frequency
African 36,239 (68)
Coloured 5,953 (11)
Indian 1,051 (2)
White 10,365 (19)
Total 53,608
Qualifications No training NGO training Under-qualified Qualified Non-ECD qual. Total
Frequency 11,033 (23) 20,730 (43) 7,563 (15) 5,620 (12) 3,615 (7) 48,561
10 The qualifications clusters detailed are those currently in use by the Department of Education:
‘Under Qualified’ educators who have received training in technical or teacher training colleges (M+2)
‘Qualified’ educators who have received university training (M+3 and more)
‘Non-ECD qualification’ a qualification in an area such as nursing, social work etc.
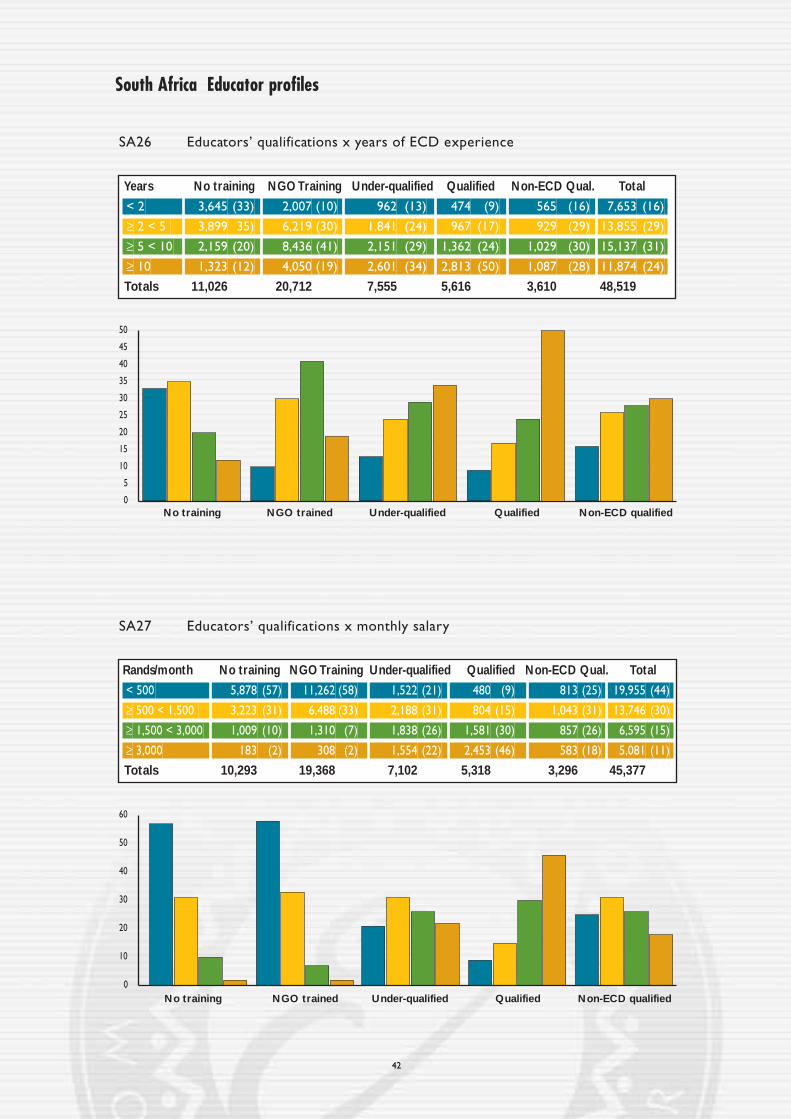
42
South Africa Educator profiles
SA26 Educators’ qualifications x years of ECD experience
SA27 Educators’ qualifications x monthly salary
0
10
20
30
40
50
60
No training NGO trained Under-qualified Qualified Non-ECD qualified
Rands/month No training NGO Training Under-qualified Qualified Non-ECD Qual. Total
< 500 5,878 (57) 11,262 (58) 1,522 (21) 480 (9) 813 (25) 19,955 (44)0
≥ 500 < 1,500 3,223 (31) 6,488 (33) 2,188 (31) 804 (15) 1,043 (31) 13,746 (30)0
≥ 1,500 < 3,000 1,009 (10) 1,310 (7) 1,838 (26) 1,581 (30) 857 (26) 6,595 (15)0
≥ 3,000 183 (2) 308 (2) 1,554 (22) 2,453 (46) 583 (18) 5,081 (11)0
Totals 10,293 19,368 7,102 5,318 3,296 45,377
Years No training NGO Training Under-qualified Qualified Non-ECD Qual. Total
< 2 3,645 (33) 2,007 (10) 962 (13) 474 (9) 565 (16) 7,653 (16)0
≥ 2 < 5 3,899 35) 6,219 (30) 1,841 (24) 967 (17) 929 (29) 13,855 (29)0
≥ 5 < 10 2,159 (20) 8,436 (41) 2,151 (29) 1,362 (24) 1,029 (30) 15,137 (31)0
≥ 10 1,323 (12) 4,050 (19) 2,601 (34) 2,813 (50) 1,087 (28) 11,874 (24)0
Totals 11,026 20,712 7,555 5,616 3,610 48,519
0
5
10
15
20
25
30
35
40
45
50
No training NGO trained Under-qualified Qualified Non-ECD qualified

43
South Africa Educator profiles
Years No training NGO Training Under-qualified Qualified Non-ECD qual. Total
African 7,494(69) 16,771 (82) 4,152 (56) 1,624 (29) 1,788 (50) 31,829 (66)0
Coloured 1,465(13) 2,405 (12) 1,045 (14) 403 (7) 334 (9) 5,652 (12)0
Indian 117 (1) 290 (1) 264 (3) 145 (3) 148 (4) 964 (2)0
White 1,855(17) 946 (5) 2,001 (27) 3,383 (61) 1,302 (37) 9,487 (20)0
Totals 10,931 20,412 7,462 5,555 3,572 47,932
SA28 Educators’ qualifications x population group
No training NGO trained Under-qualified Qualified Non-ECD qualified0
10
20
30
40
50
60
70
80
90
Total
CommentData was analysed on 54,503 educators working within the sector. Their mean age is 38 years,
almost all (99%) are women and two thirds are African. The majority of educators (20,730
cases) have received their training from NGOs and are thus holding qualifications which are not
currently recognised by the Department of Education. A sizable 23% have received no training,
these two cohorts allied to the ‘under-qualified’ cohort, result in almost 90% of the educators
requiring, at the very least, some additional training.
A strong relationship exists between educator qualifications and years of experience within the
ECD sector. Most of those with the highest qualifications having five or more years
experience. Salary is likewise linked to qualifications. Almost half of the educators earn less
than R500 per month, and most of these (85%) have either not received any training or have
been trained by NGOs.
The racially based historical inequalities mentioned in the opening chapters are reflected in the
findings vis-à-vis educators’ qualifications and population group. Almost 70% of Africans have
not received any training, while only 5% of African educators are qualified as compared to 35%
of their White colleagues.

44
South Africa Educator training providers
SA29 Number of educator training providers,11
sites and educators
SA30 Types of educator training providers
Type of provider Frequency
University based institutions 4 (4)
Technikons 2 (2)
Colleges of Education 14 (13)
Voc./Tech. Colleges 26 (25)
NGO sector 52 (49)
Private sector 6 (6)
Community Based Organisations 1 (1)
Total 105
Province Training providers Sites Educators
Eastern Cape 9 (8) 3,231 (14) 6,354 (12)
Free State 11 (10) 1,665 (7) 3,964 (7)
Gauteng 32 (28) 5,308 (23) 15,052 (28)
KwaZulu-Natal 13 (12) 5,684 (24) 10,603 (19)
Mpumalanga 7 (6) 1,367 (6) 2,658 (5)
Northern Cape 5 (4) 422 (2) 844 (1)
Northern Province 9 (8) 1,987 (8) 3,615 (7)
North West 4 (4) 1,174 (5) 2,910 (5)
Western Cape 22 (20) 2,644 (11) 8,503 (16)
South Africa 112 23,482 54,503
0
5
10
15
20
25
30
35
EC FS G KZN M NC NP NW WC
11 The frequencies for training providers reflect the number of providers based in a particular province (112 in
total), it does not take into account a situation whereby a provider based in one province has satellite centres
or offers programmes in other province/s. In the data presented above, each provider is recorded only once.
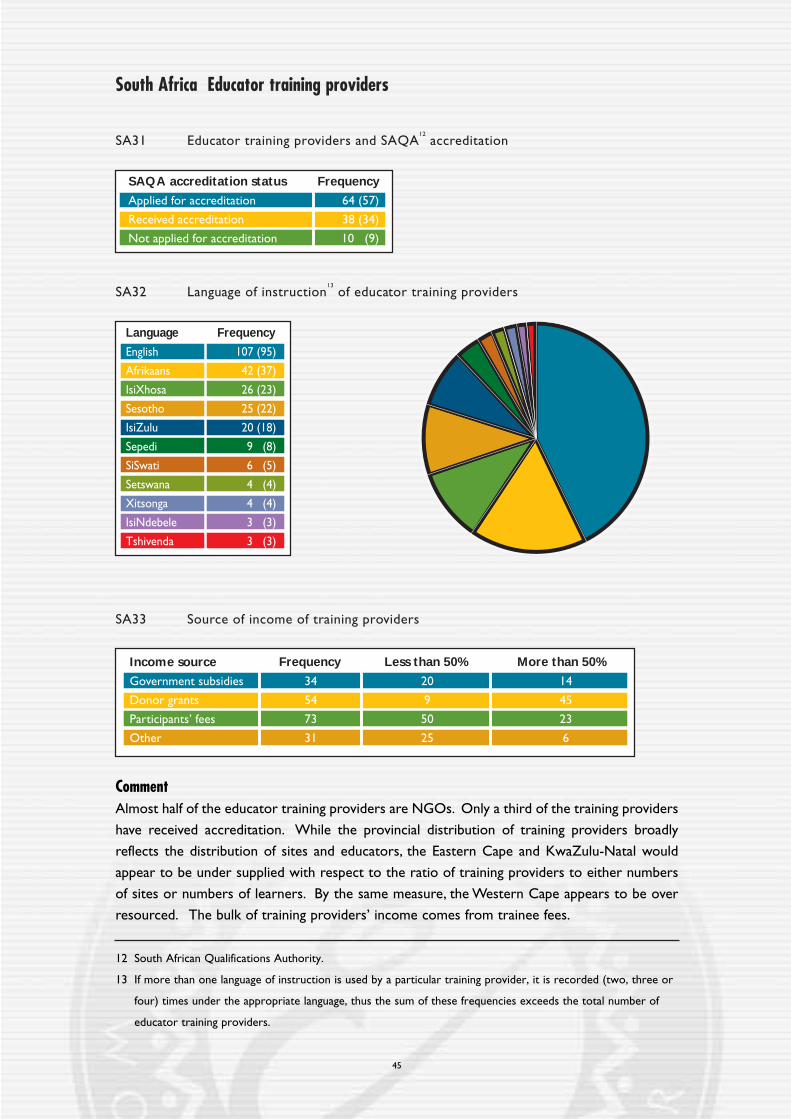
45
South Africa Educator training providers
SA31 Educator training providers and SAQA12 accreditation
SA32 Language of instruction13 of educator training providers
SA33 Source of income of training providers
SAQA accreditation status Frequency
Applied for accreditation 64 (57)
Received accreditation 38 (34)
Not applied for accreditation 10 (9)
Income source
Government subsidies 34 20 14
Donor grants 54 9 45
Participants’ fees 73 50 23
Other 31 25 6
Frequency Less than 50% More than 50%
Language Frequency
English 107 (95)
Afrikaans 42 (37)
IsiXhosa 26 (23)
Sesotho 25 (22)
IsiZulu 20 (18)
Sepedi 9 (8)
SiSwati 6 (5)
Setswana 4 (4)
Xitsonga 4 (4)
IsiNdebele 3 (3)
Tshivenda 3 (3)
CommentAlmost half of the educator training providers are NGOs. Only a third of the training providers
have received accreditation. While the provincial distribution of training providers broadly
reflects the distribution of sites and educators, the Eastern Cape and KwaZulu-Natal would
appear to be under supplied with respect to the ratio of training providers to either numbers
of sites or numbers of learners. By the same measure, the Western Cape appears to be over
resourced. The bulk of training providers’ income comes from trainee fees.
12 South African Qualifications Authority.
13 If more than one language of instruction is used by a particular training provider, it is recorded (two, three or
four) times under the appropriate language, thus the sum of these frequencies exceeds the total number of
educator training providers.
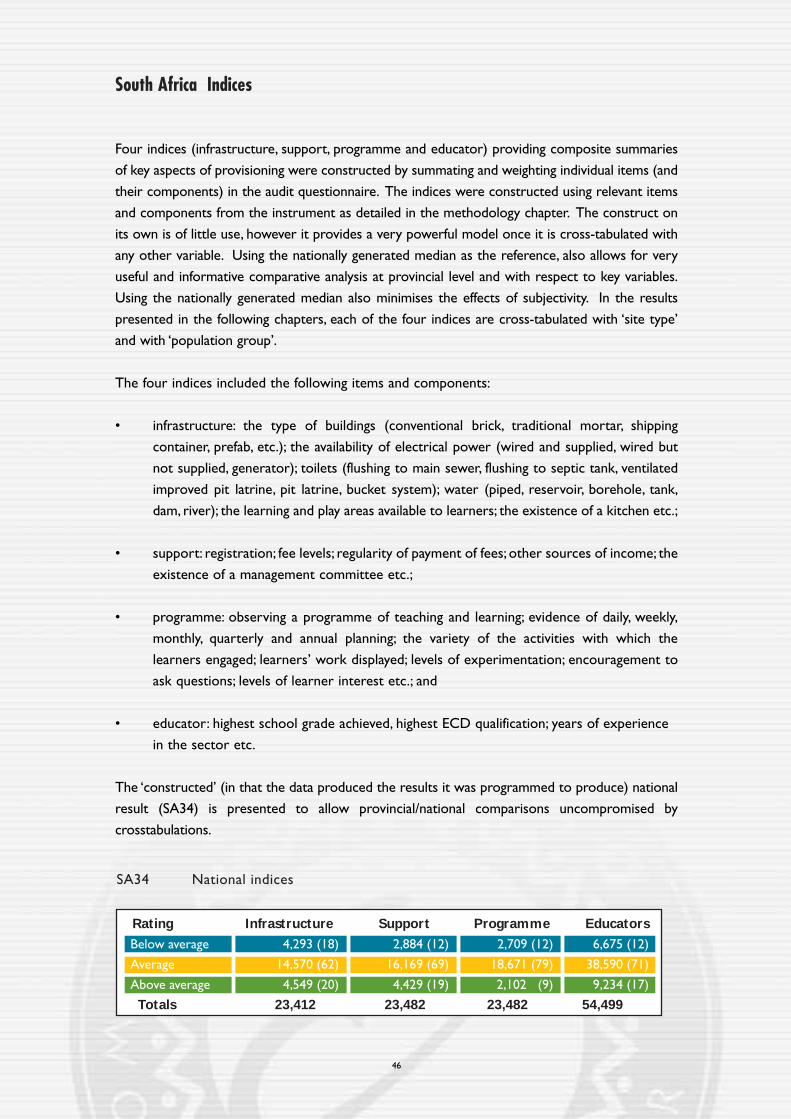
46
South Africa Indices
Four indices (infrastructure, support, programme and educator) providing composite summaries
of key aspects of provisioning were constructed by summating and weighting individual items (and
their components) in the audit questionnaire. The indices were constructed using relevant items
and components from the instrument as detailed in the methodology chapter. The construct on
its own is of little use, however it provides a very powerful model once it is cross-tabulated with
any other variable. Using the nationally generated median as the reference, also allows for very
useful and informative comparative analysis at provincial level and with respect to key variables.
Using the nationally generated median also minimises the effects of subjectivity. In the results
presented in the following chapters, each of the four indices are cross-tabulated with ‘site type’
and with ‘population group’.
The four indices included the following items and components:
• infrastructure: the type of buildings (conventional brick, traditional mortar, shipping
container, prefab, etc.); the availability of electrical power (wired and supplied, wired but
not supplied, generator); toilets (flushing to main sewer, flushing to septic tank, ventilated
improved pit latrine, pit latrine, bucket system); water (piped, reservoir, borehole, tank,
dam, river); the learning and play areas available to learners; the existence of a kitchen etc.;
• support: registration; fee levels; regularity of payment of fees; other sources of income; the
existence of a management committee etc.;
• programme: observing a programme of teaching and learning; evidence of daily, weekly,
monthly, quarterly and annual planning; the variety of the activities with which the
learners engaged; learners’ work displayed; levels of experimentation; encouragement to
ask questions; levels of learner interest etc.; and
• educator: highest school grade achieved, highest ECD qualification; years of experience
in the sector etc.
The ‘constructed’ (in that the data produced the results it was programmed to produce) national
result (SA34) is presented to allow provincial/national comparisons uncompromised by
crosstabulations.
SA34 National indices
Rating Infrastructure Support Programme Educators
Below average 4,293 (18) 2,884 (12) 2,709 (12) 6,675 (12)
Average 14,570 (62) 16,169 (69) 18,671 (79) 38,590 (71)
Above average 4,549 (20) 4,429 (19) 2,102 (9) 9,234 (17)
Totals 23,412 23,482 23,482 54,499

47
SA35 Infrastructure index x site type
SA 36 Infrastructure index x population group
Rating School Community Home Total
Below average 434 (12) 1,772 (16) 1,009 (14) 3,215 (15)
Average 2,378 (66) 6,883 (64) 4,971 (67) 14,232 (65)
Above average 811 (22) 2,161 (20) 1,473 (20) 4,445 (20)
Totals 3,623 10,816 7,453 21,892
Rating African Coloured White Indian Mixed Total
Below average 3,877 (23) 20 (1) 51 (3) 30 (14) 105 (5) 4,083 (18)
Average 11,591 (68) 1,225 (78) 548 (29) 95 (45) 765 (39) 14,224 (62)
Above average 1,660 (10) 329 (21) 1,292 (68) 86 (41) 1,080 (55) 4,447 (20)
Totals 17,128 1,574 1,891 211 1,950 22,754
0
10
20
30
40
50
60
70
School Community Home Total
0
10
20
30
40
50
60
70
80
South Africa Indices

48
South Africa Indices
SA37 Support index x site type
SA38 Support index x population group
0
10
20
30
40
50
60
70
80
School Community Home Total
0
10
20
30
40
50
60
70
80
African Coloured White Indian Mixed
Rating African Coloured White Indian Mixed Total
Below average 2,513 (15) 87 (5) 10 (1) 9 (4) 49 (2) 2,668 (12)
Average 12,159 (71) 1,048 (67) 1,210 (64) 153 (73) 1,200 (62) 15,770 (69)
Above average 2,456 (14) 439 (28) 671 (35) 49 (23) 701 (36) 4,316 (19)
Totals 17,128 1,574 1,891 211 1,950 22,754
Rating School Community Home Total
Below average 568 (16) 994 (9) 887 (12) 2,449 (11)
Average 2,716 (75) 7,201 (67) 5,279 (71) 15,196 (70)
Above average 339 (9) 2,621 (24) 1,287 (17) 4,247 (20)
Totals 3,623 10,816 7,453 21,892
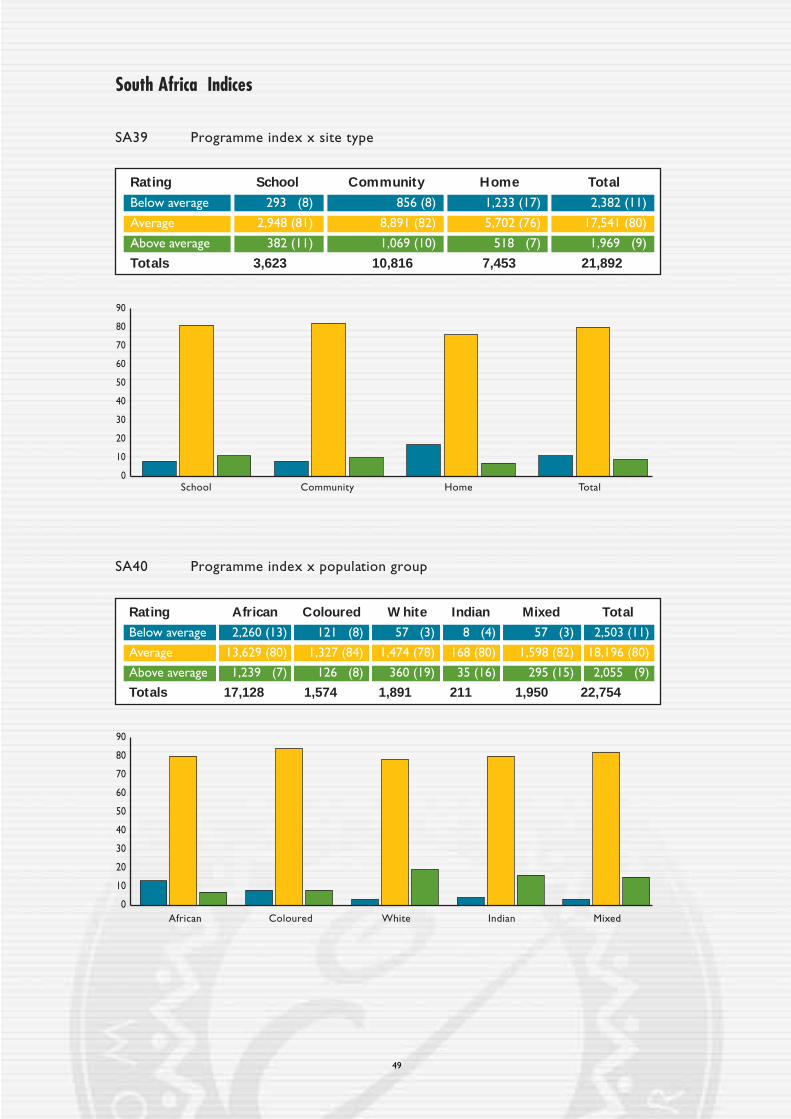
49
South Africa Indices
0
10
20
30
40
50
60
70
80
90
SA39 Programme index x site type
SA40 Programme index x population group
Rating School Community Home Total
Below average 293 (8) 856 (8) 1,233 (17) 2,382 (11)
Average 2,948 (81) 8,891 (82) 5,702 (76) 17,541 (80)
Above average 382 (11) 1,069 (10) 518 (7) 1,969 (9)
Totals 3,623 10,816 7,453 21,892
Rating African Coloured White Indian Mixed Total
Below average 2,260 (13) 121 (8) 57 (3) 8 (4) 57 (3) 2,503 (11)
Average 13,629 (80) 1,327 (84) 1,474 (78) 168 (80) 1,598 (82) 18,196 (80)
Above average 1,239 (7) 126 (8) 360 (19) 35 (16) 295 (15) 2,055 (9)
Totals 17,128 1,574 1,891 211 1,950 22,754
0
10
20
30
40
50
60
70
80
90
School Community Home Total
African Coloured White Indian Mixed

50
South Africa Indices
0
10
20
30
40
50
60
70
80
0
10
20
30
40
50
60
70
80
School Community Home Total
African Coloured White Indian Mixed
SA41 Educator index x site type
SA42 Educator index x population group
Rating School Community Home Total
Below average 206 (6) 1,079 (10) 1,532 (21) 2,817 (13)
Average 1,942 (54) 8,170 (76) 5,386 (73) 15,498 (71)
Above average 1,470 (40) 1,526 (14) 485 (6) 3,481 (16)
Totals 3,618 10,775 7,403 21,796
Rating African Coloured White Indian Mixed Total
Below average 2,509 (15) 175 (11) 87 (5) 11 (5) 119 (6) 2,901 (13)
Average 12,813 (75) 1,078 (69) 1,017 (55) 120 (57) 1,137 (59) 16,165 (71)
Above average 1,768 (10) 310 (20) 749 (40) 79 (38) 686 (35) 3,592 (16)
Totals 17,090 1,563 1,853 210 1,942 22,658

51
South Africa Indices
CommentWithin each of the three categories of site types (school, community and home based), evidence
of very low and very high scores on each of the four indices were recorded. The relationship
between the infrastructure and support indices, and site type, is not particularly revealing.
However, cross-tabulating the programme and educator indices with site type reveals that a
comparatively significant percentage of home based sites are rated ‘below average’ with respect
to these two measures.
When each of the four indices are cross-tabulated with population group, a clear and persistent
pattern emerges. The fact that 75% of the sites are ‘African’ lends a degree of unreliability to
the finding that 95% of all the sites rated ‘below average’ on the infrastructure and support
indices cater to African learners. However, much more illuminative is the finding that the
proportion of African sites receiving a ‘below average’ rating with respect to the infrastructure
and support indices either equals or exceeds the combined proportions of the other four
population groups.

52
South Africa Sustainability14
SA43 Sustainability CHAID15
Site typen=21,525
Educator indexn=10,633
Provincen=3,554
Educator indexn=7,338
1 in operation for < 1 year2 in operation for ≥ 1 year and < 3 years3 in operation for ≥ 3 years and < 5 years4 in operation for ≥ 5 years
National1 07%2 12%3 18%4 63%
n=22,014
Community1 04%2 08%3 14%4 74%
n=10,633
Home1 09%2 16%3 22%4 53%n=7,338
School1 11%2 13%3 19%4 57%n=3,554
Below avg.1 10%2 14%3 22%4 54%n=1,053
Average1 03%2 08%3 15%4 74%n=8,034
Above avg.1 03%2 04%3 08%4 85%n=1,546
Below avg.1 17%2 24%3 26%4 33%n=1,496
Average1 07%2 14%3 22%4 57%n=5,309
Above avg.1 05%2 12%3 17%4 66%n=533
W. Cape1 08%2 11%3 19%4 62%n=467
N. Province & North West1 04%2 06%3 22%4 68%n=311
N. Cape1 02%2 09%3 41%4 48%n=120
Gauteng1 13%2 11%3 14%4 62%n=419
KZN1 17%2 18%3 19%4 46%n=1,430
Mpum.1 03%2 16%3 23%4 58%n=146
E. Cape & Free State1 04%2 08%3 19%4 69%n=661
Comment‘Site type’ emerged as the strongest predictor of sustainability. If one focuses on sites which
have been in existence for five years and longer it is apparent that whereas the national average
is 63%, this increases to 74% when community based sites are reviewed, compared to 53% and
57% for home and school based respectively. Following the CHAID to the next level from
community and home based sites suggests that ‘educator index’ is the next strongest predictor
of sustainability. The effect of the ‘educator index’ on sustainability is significant: in those cases
where the rating is ‘above average’ the effect of the ‘educator index’ on sustainability is
significant: in those cases where the rating is ‘above average’ the sustainability increases from
74% to 85% (community based) and 53% to 66% (home based). Conversely, for those rated
14 As reported earlier (SA8), data was captured concerning the length of time that sites have been in operation.
Subsequent statistical analyses were undertaken to establish which factors are most strongly related to the
‘sustainability’ of the sites, i.e. the predictors of sustainability. Using CHAID the following list of factors were
tested to identify which are the strongest predictors of sustainability: province, geographical location, type of
site, the four indices (infrastructure/support/programme/educator).
15 CHAID is data analysis technique used to establish which “predictor” variables are most strongly related to a
categorical dependent variable. It is a form of regression analysis for categorical data using chi-square tests of
significance.

53
‘below average’ the percentage drops from 74% to 54% (community based) and from 57% to
33% (home based).
For school based sites,‘province’ emerged as the most significant predictor., bearing in mind that
57% of school based sites have been operating for five years or more, there are considerable
provincial disparities: from a low of 46% in KwaZulu-Natal to a high of 69% in the Eastern Cape.
The next level of the CHAID within the provincial groupings (not shown above) identified
‘educator index’ as the next strongest predictor of sustainability.

54
South Africa Salient findings
While a more detailed discussion of issues emerging is presented in the final chapter, thefollowing findings merit mention:
• KwaZulu-Natal and Gauteng recorded the highest number of sites: 5,684 and 5,308.
• The urban/rural divide with respect to site distribution is 60% and 40% respectively.
• Almost three quarters of the sites audited are within a kilometer of a primary school.
• Whereas 53% of sites have mains electricity, piped water and flushing toilets, 8% (1,669
cases) have access to none of these basic services.
• The financial situation of most sites in the country is precarious. Fifty percent of learners
pay less than R50 per month and only a quarter of the fees charged are paid on a regular
basis. For over a quarter of the sites audited, fees are the sole source of income.
• The learners/educator ratio varies from 16:1 (Gauteng) to 24:1 (Eastern and Northern
Cape), averaging at 19:1.
• Approximately 12% of the educators are, from the National Department of Education’s
perspective, adequately qualified. The majority of educators (80%) are inadequately
qualified. While only 5% of African educators are adequately qualified, 23% have not
received any training. There is a strong correlation between qualifications, years of
experience and monthly salary. Almost half of the educators earn less than R500/month.
• Almost half of the educator training providers are NGOs. Only a third of training
providers have received accreditation.
• There is evidence to suggest that both the educational programmes and the educator
variables available in home based sites are comparatively lower than those provided
through the other two provisioning models.
• Sites which cater predominantly to African learners (80% or more), record the greatest
number of ‘below average’ ratings. Pronounced and persistent patterns of racial inequities
emerge: the proportion of African sites receiving a ‘below average’ rating with respect to
the infrastructure and support indices either equals and exceeds the combined
proportions of the other four population groups.
• The two strongest predictors of sustainability are ‘site type’ and ‘educator index’. The
community based model is the strongest predictor. Sites whose educators rated ‘above
average’ have the optimum chance of survival. Differences between ‘site type’, ‘educator
index’ and, to a lesser extent,‘province’ account very well for difference in site sustainability.

55
Chapter 5Provincial results
Eastern Cape
This chapter provides a broad overview of ECD provisioning in the Eastern Cape. The following
results are presented:
• Site profiles.
• Learner profiles.
• Educator profiles.
• Indices: infrastructure, support, programme and educator.
• Salient findings.

56
EC1 Number of sites
Total number of sites 3,231
% of study population 13.8
EC2 Types of sites1
Site type Frequency
School based 406 (13)
Community based 1,742 (56)
Home based 987 (31)
Total2 3,135
EC3 Geographic location of sites
Location Frequency
Urban (formal)3 883 (28)
Urban (informal) 292 (10)
Rural 1,940 (62)
Total 3,115
1 All figures within the brackets in the tables represent column percentages.
2 Table totals may differ as some cases are invariably lost when two or more variables are cross-tabulated.
3 ‘Urban formal’ ordinary town or city areas with mostly formal dwellings,
‘Urban informal’ ordinary town or city areas with predominantly informal dwellings,
‘Rural’ villages, rural resettlement areas, commercial farms.
Eastern Cape Site profiles

Eastern Cape Site profiles
57
EC5 Availability on site of mains electricity, piped water and flushing toilets
EC4 Distance to nearest primary school
Kilometres4 Frequency
< 1 2,197 (69)
≥ 1 < 3 686 (21)
≥ 3 < 5 191 (6)
≥ 5 136 (4)
Total 3,210
Resources Frequency
Mains electricity, piped water and flushing toilets 932 (30)
Mains electricity and piped water only 296 (9)
Mains electricity and flushing toilets only 19 (1)
Piped water and flushing toilets only 112 (4)
Mains electricity only 76 (2)
Piped water only 880 (28)
Flushing toilets only 6 (0)
None of these resources 802 (26)
Total 3,123
• None of these resources - 802
76
6880
932
296
112
Mains electricity
Piped water Flushing toilets
19
4 < less than,
≥ greater than or equal to.

Eastern Cape Site profiles
58
EC6 Hours of operation
Hours Frequency
< 5 828 (28)
≥ 5 < 10 1,936 (66)
≥ 10 186 (6)
Total 2,950
EC7 Years providing ECD services
Years Frequency
< 1 117 (4)
≥ 1 < 3 226 (7)
≥ 3 < 5 479 (16)
≥ 5 2,272 (73)
Total 3,094
EC8 Registration
Registered with Frequency
Department of Education 699 (26)
Department of Welfare 1,592 (58)
Local Authority 283 (10)
Other 170 (6)
Total 2,744
POWER &TOILETS
19
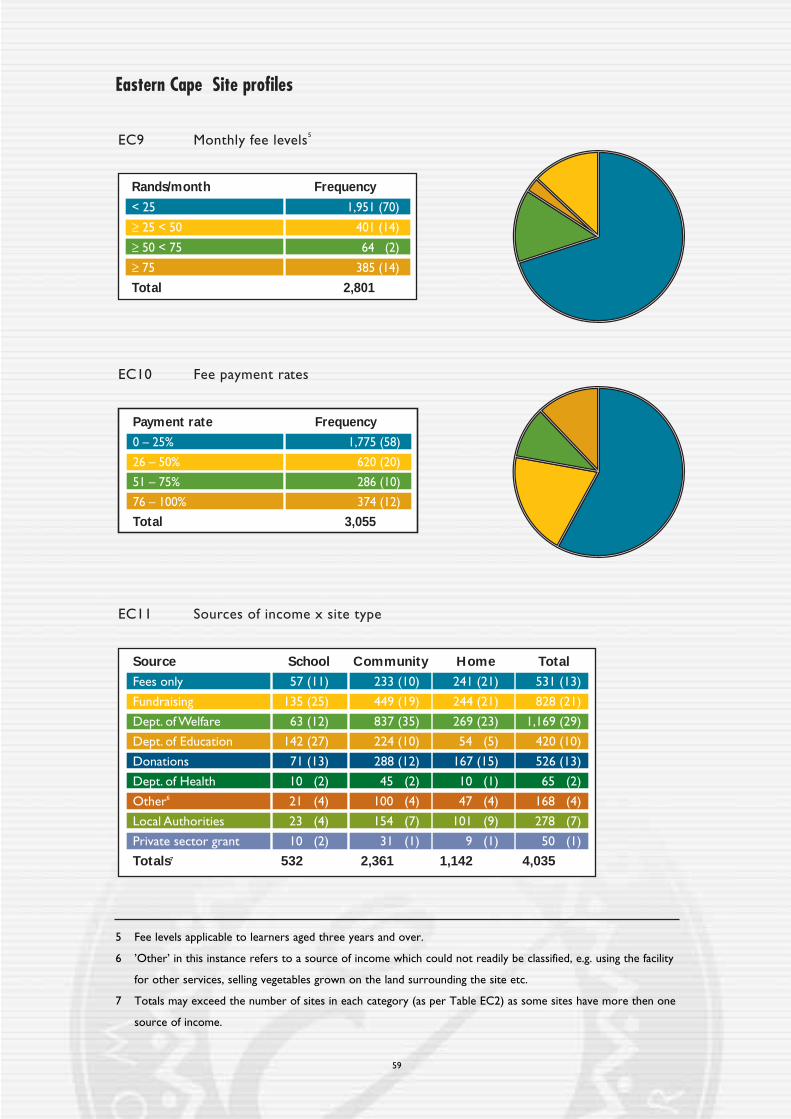
Eastern Cape Site profiles
59
EC11 Sources of income x site type
EC9 Monthly fee levels5
EC10 Fee payment rates
Payment rate Frequency
0 – 25% 1,775 (58)
26 – 50% 620 (20)
51 – 75% 286 (10)
76 – 100% 374 (12)
Total 3,055
Source School Community Home Total
Fees only 57 (11) 233 (10) 241 (21) 531 (13)
Fundraising 135 (25) 449 (19) 244 (21) 828 (21)
Dept. of Welfare 63 (12) 837 (35) 269 (23) 1,169 (29)
Dept. of Education 142 (27) 224 (10) 54 (5) 420 (10)
Donations 71 (13) 288 (12) 167 (15) 526 (13)
Dept. of Health 10 (2) 45 (2) 10 (1) 65 (2)
Other6 21 (4) 100 (4) 47 (4) 168 (4)
Local Authorities 23 (4) 154 (7) 101 (9) 278 (7)
Private sector grant 10 (2) 31 (1) 9 (1) 50 (1)
Totals7 532 2,361 1,142 4,035
Rands/month Frequency
< 25 1,951 (70)
≥ 25 < 50 401 (14)
≥ 50 < 75 64 (2)
≥ 75 385 (14)
Total 2,801
5 Fee levels applicable to learners aged three years and over.
6 ’Other’ in this instance refers to a source of income which could not readily be classified, e.g. using the facility
for other services, selling vegetables grown on the land surrounding the site etc.
7 Totals may exceed the number of sites in each category (as per Table EC2) as some sites have more then one
source of income.
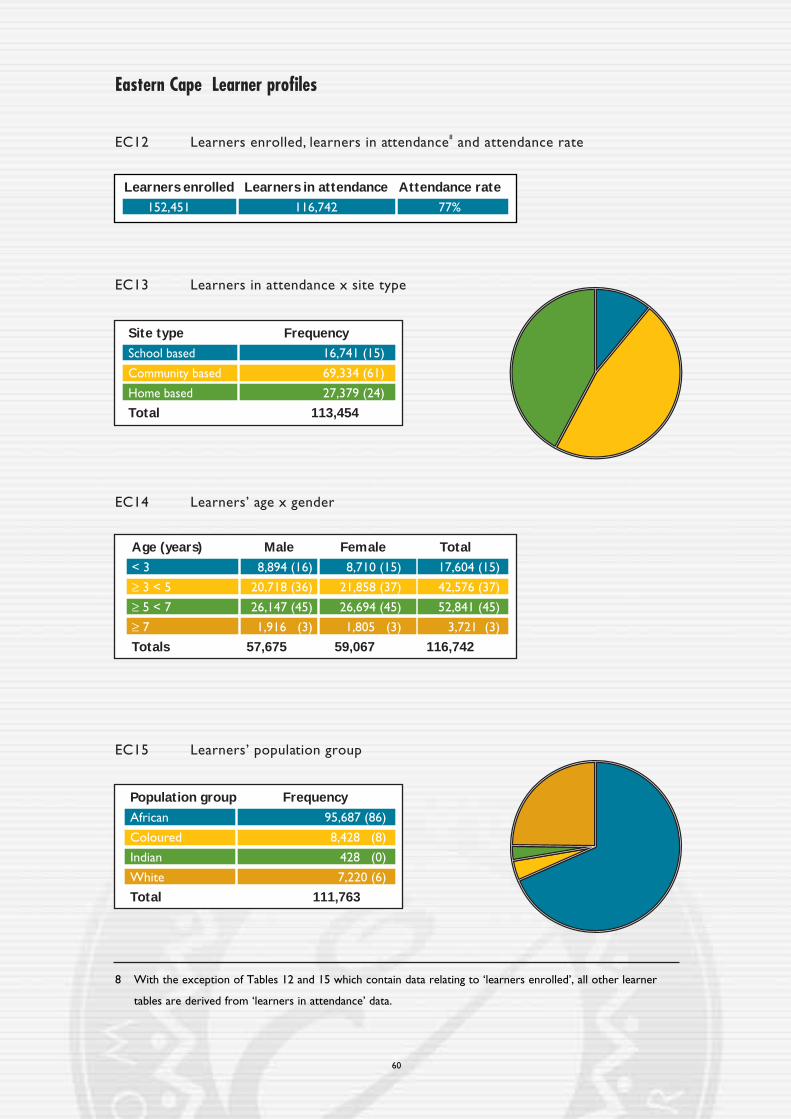
Eastern Cape Learner profiles
60
EC13 Learners in attendance x site type
Site type Frequency
School based 16,741 (15)
Community based 69,334 (61)
Home based 27,379 (24)
Total 113,454
EC14 Learners’ age x gender
Age (years) Male Female Total
< 3 8,894 (16) 8,710 (15) 17,604 (15)
≥ 3 < 5 20,718 (36) 21,858 (37) 42,576 (37)
≥ 5 < 7 26,147 (45) 26,694 (45) 52,841 (45)
≥ 7 1,916 (3) 1,805 (3) 3,721 (3)
Totals 57,675 59,067 116,742
EC15 Learners’ population group
Population group Frequency
African 95,687 (86)
Coloured 8,428 (8)
Indian 428 (0)
White 7,220 (6)
Total 111,763
EC12 Learners enrolled, learners in attendance8 and attendance rate
Learners enrolled Learners in attendance Attendance rate
152,451 116,742 77%
8 With the exception of Tables 12 and 15 which contain data relating to ‘learners enrolled’, all other learner
tables are derived from ‘learners in attendance’ data.

Eastern Cape Learner profiles
61
EC16 Learners’ type of disabilities
EC17 Learners’ home languages and languages of instruction
Type of disability Frequency
Physical (movement) disability 469 (23)
Severe hearing impairment / Deaf 169 (8)
Severe visual impairment / Blind 90 (5)
Mental disability 787 (39)
Cerebral palsied 41 (2)
Severe behavioural disorder 156 (8)
Autistic 33 (2)
Epilepsy 102 (5)
Multiple disability 104 (5)
Other 49 (3)
Total 2,000
Language Home languages Languages of instruction9
IsiXhosa 119,556 (82) 2,625 (83)
Afrikaans 11,660 (8) 373 (12)
English 10,448 (7) 2,745 (87)
Sesotho 2,492 (2) 126 (4)
Other 2,219 (1) 28 (1)
Total 146,375
0
10
20
30
40
50
60
70
80
90
Xhosa Afrikaans English Sesotho Other
9 The total of these percentages exceeds 100% as in many sites more than one language of instruction is used.
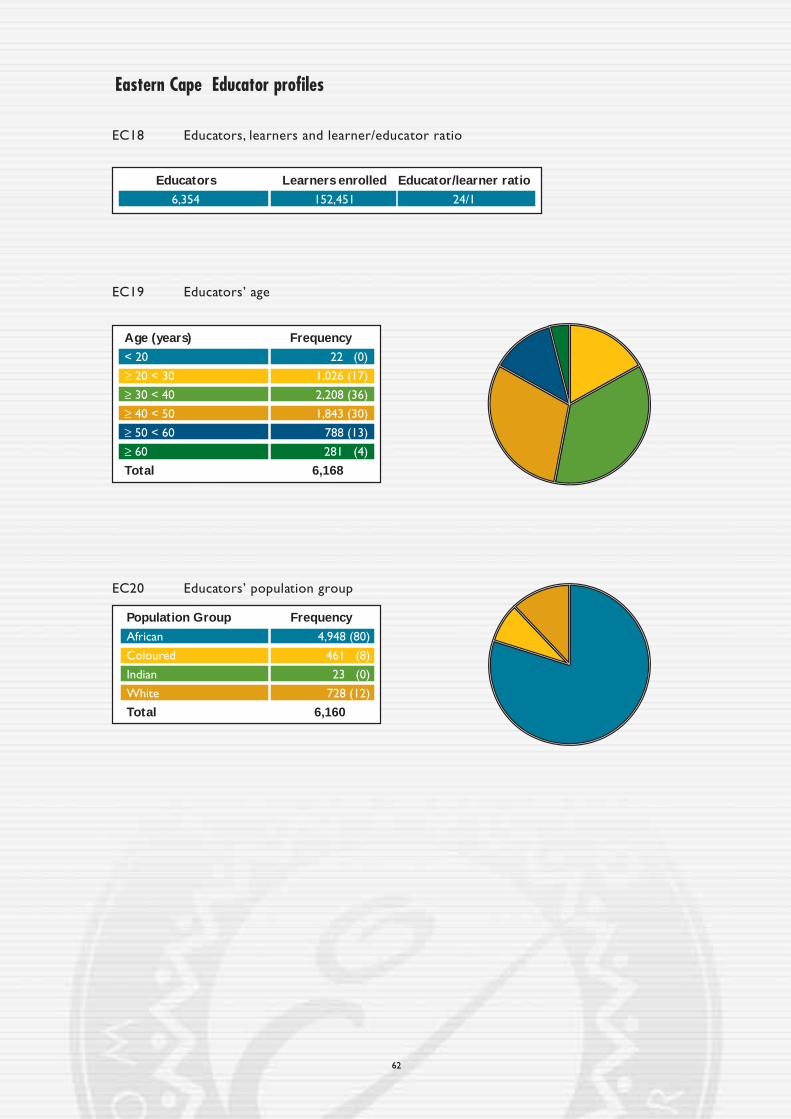
Eastern Cape Educator profiles
62
EC18 Educators, learners and learner/educator ratio
Educators Learners enrolled Educator/learner ratio
6,354 152,451 24/1
EC19 Educators’ age
Age (years) Frequency
< 20 22 (0)
≥ 20 < 30 1,026 (17)
≥ 30 < 40 2,208 (36)
≥ 40 < 50 1,843 (30)
≥ 50 < 60 788 (13)
≥ 60 281 (4)
Total 6,168
EC20 Educators’ population group
Population Group Frequency
African 4,948 (80)
Coloured 461 (8)
Indian 23 (0)
White 728 (12)
Total 6,160

Eastern Cape Educator profiles
63
EC21 Educators’ qualifications10
Qualifications Frequency
No training 480 (9)
NGO training 3,831 (71)
Under-qualified 576 (10)
Qualified 367 (7)
Non-ECD qualification 159 (3)
Total 5,413
EC22 Educator qualifications x years of ECD experience
0
10
20
30
40
50
60
No training NGO training Under-qualified Qualified Total
Years No training NGO Training Under-qualified Qualified Total
< 2 175 (37) 299 (8) 53 (9) 29 (8) 556 (11)
≥ 2 < 5 163 (34) 945 (24) 122 (21) 51 (14) 1,281 (24)
≥ 5 < 10 102 (21) 1,903 (50) 170 (30) 82 (22) 2,257 (43)
≥ 10 37 (8) 678 (18) 229 (40) 202 (56) 1,146 (22)
Totals 477 3,825 574 364 5,240
10 The qualifications clusters detailed are those currently in use by the Department of Education:
‘Under Qualified’ educators who have received training in technical or teacher training colleges (Matriculation
+2 years)
‘Qualified’ educators who have received university training (Matriculation + 3 years and more)
‘Non-ECD qualification’ a qualification in an area such as nursing, social work etc.

64
Eastern Cape Educator profiles
EC23 Educator qualifications x monthly salary
Rands/month No training NGO Training Under-qualified Qualified Total
< 500 284 (69) 2,012 (59) 116 (21) 39 (11) 2,451 (52)
≥ 500 < 1,500 92 (22) 1,124 (33) 179 (33) 74 (22) 1,469 (32)
≥ 1,500 < 3,000 27 (7) 197 (6) 125 (23) 77 (22) 426 (9)
≥ 3,000 6 (2) 54 (2) 126 (23) 155 (45) 341 (7)
Totals 409 3,387 546 345 4,687
No training NGO training Under-qualified Qualified Total0
10
20
30
40
50
60
70
EC24 Educator qualifications x population group
No training NGO training Under-qualified Qualified Total0
10
20
30
40
50
60
70
80
90
Pop. group No training NGO Training Under-qualified Qualified Total
African 355 (74) 3,375 (90) 305 (54) 122 (34) 4,157 (81)
Coloured 37 (8) 205 (6) 105 (19) 33 (9) 380 (8)
Indian 0 (0) 10 (0) 7 (1) 2 (1) 19 (0)
White 84 (18) 149 (4) 143 (26) 200 (56) 576 (11)
Totals 476 3,739 560 357 5,132

65
Eastern Cape Indices
EC25 Indices
0
10
20
30
40
50
60
70
80
90
Infrastructure Support Programme Educators
Rating Infrastructure Support Programme Educators
Below Average 1,123 (35) 604 (19) 231 (7) 699 (11)
Average 1,713 (54) 2,268 (70) 2,799 (87) 4,869 (77)
Above Average 359 (11) 359 (11) 201 (6) 786 (12)
Totals 3,195 3,231 3,231 6,354

Eastern Cape Salient findings
The following salient points have emerged from the results:
• There are significantly more community based sites in the Eastern Cape (56%) than the
national average (49%) which might explain why the majority of sites (58%) are registered
with the Department of Welfare.
• Significantly more sites in the province are based in rural areas (62%) than is the case
nationally (40%).
• Sites in the Eastern Cape are much less developed in terms of basic infrastructure than
the national average. Only 30% of sites have piped water, flushing toilets and mains
electricity.This compares unfavourably with the national scale of 53%.
• The financial situation of most sites in the Province is precarious. Seventy percent of
learners pay less than R25 fees per month. For the majority of sites (58%), receiving fees
on a regular basis is not the norm: typically they receive their fees less than 25% of the
time.
• Learner statistics reflect national population distributions but the number of learners per
educator (24:1) is significantly higher than the national average of (19:1).
• The age distribution of educators shows a slightly ‘older’ profile when compared with the
national profile: 47% of the educators are 40 years or older compared to the national
figure of 39%.
• Given the role that the NGO sector plays in community based sites, it is perhaps not
surprising although very significant, that 71% of the educators in the Province have
received NGO training (the national average is 43%). Educators in the Eastern Cape have
longer teaching experience than the national average (65% having taught for 5 years or
more compared to 55% nationally) and are getting paid less per month: (84% receiving
less than R1,500 per month compared to the national percentage of 74%).
• The indices confirm that sites in the Eastern Cape are less well resourced: 35% rated
‘below average’ compared to 18% nationally. They also receive less support from their
constituencies: 11% rated ‘above average’ compared to 19% nationally.While it is difficult
to draw any definitive conclusions from a comparison of the provincial and national
results with respect to the nature of the programme activities being conducted, a
comparison of the educator indices establishes that there are appreciably fewer ‘above
average’ educators in the Eastern Cape than are found nationally.
66

67
Free StateThis chapter provides a broad overview of ECD provisioning in the Free State. The following
results are presented:
• Site profiles.
• Learner profiles.
• Educator profiles.
• Indices: infrastructure, support, programme and educator.
• Salient findings.

Free State Site profiles
68
FS1 Number of sites
Total number of sites 1,665
% of study population 7.1
FS2 Types of sites1
Site type Frequency
School based 271 (16)
Community based 783 (48)
Home based 586 (36)
Total2 1,640
FS3 Geographic location of sites
Location Frequency
Urban (formal)3 1,223 (74)
Urban (informal) 155 (9)
Rural 279 (17)
Total 1,657
1 All figures within the brackets in the tables represent column percentages.
2 Table totals may differ as some cases are invariably lost when two or more variables are cross-tabulated.
3 ‘Urban formal’ ordinary town or city areas with mostly formal dwellings,
‘Urban informal’ ordinary town or city areas with predominantly informal dwellings,
‘Rural’ villages, rural resettlement areas, commercial farms.

Free State Site profiles
69
FS5 Availability on site of mains electricity, piped water and flushing toilets
FS4 Distance to nearest primary school
Kilometres4 Frequency
< 1 1,181 (71)
≥ 1 < 3 326 (20)
≥ 3 < 5 71 (4)
≥ 5 79 (5)
Total 1,657
Resources Frequency
Mains electricity, piped water and flushing toilets 1,064 (64)
Mains electricity and piped water only 254 (16)
Mains electricity and flushing toilets only 1 (0)
Piped water and flushing toilets only 98 (6)
Mains electricity only 1 (0)
Piped water only 237 (14)
Flushing toilets only 0 (0)
None of these resources 3 (0)
Total 1,658
1
0237
1,064
254
• None of these resources - 3
98
Mains electricity
Piped water Flushing toilets
1
4 < less than,
≥ greater than or equal to.

Free State Site profiles
70
FS6 Hours of operation
Hours Frequency
< 5 106 (7)
≥ 5 < 10 1,161 (72)
≥ 10 347 (21)
Total 1,614
FS7 Years providing ECD services
Years Frequency
< 1 131 (8)
≥ 1 < 3 205 (12)
≥ 3 < 5 283 (17)
≥ 5 1,034 (63)
Total 1,653
FS8 Registration
Registered with Frequency
Department of Education 334 (25)
Department of Welfare 719 (53)
Local Authority 143 (10)
Other 157 (12)
Total 1,353

Free State Site profiles
71
FS11 Sources of income x site type
FS9 Monthly fee levels5
FS10 Fee payment rates
Payment rate Frequency
0 – 25% 229 (14)
26 – 50% 475 (29)
51 – 75% 342 (21)
76 – 100% 595 (36)
Total 1,641
Source School Community Home Total
Fees only 80 (30) 229 (30) 372 (65) 681 (42)
Fundraising 100 (38) 268 (35) 109 (19) 477 (29)
Dept. of Welfare 11 (4) 157 (20) 25 (4) 193 (12)
Dept. of Education 42 (16) 22 (3) 5 (1) 69 (4)
Donations 10 (4) 43 (6) 40 (7) 93 (6)
Dept. of Health 21 (8) 15 (2) 8 (1) 44 (3)
Other6 1 (0) 27 (3) 16 (3) 44 (3)
Local Authorities 0 (0) 3 (0) 0 (0) 3 (0)
Private sector grant 1 (0) 11 (1) 1 (0) 13 (1)
Totals7 266 775 576 1,617
Rands/month Frequency
< 25 357 (22)
≥ 25 < 50 660 (42)
≥ 50 < 75 175 (11)
≥ 75 392 (25)
Total 1,584
5 Fee levels applicable to learners aged three years and over.
6 ’Other’ in this instance refers to a source of income which could not readily be classified, e.g. using the facility
for other services, selling vegetables grown on the land surrounding the site etc.
7 Totals may exceed the number of sites in each category (as per Table FS2) as some sites have more then one
source of income.
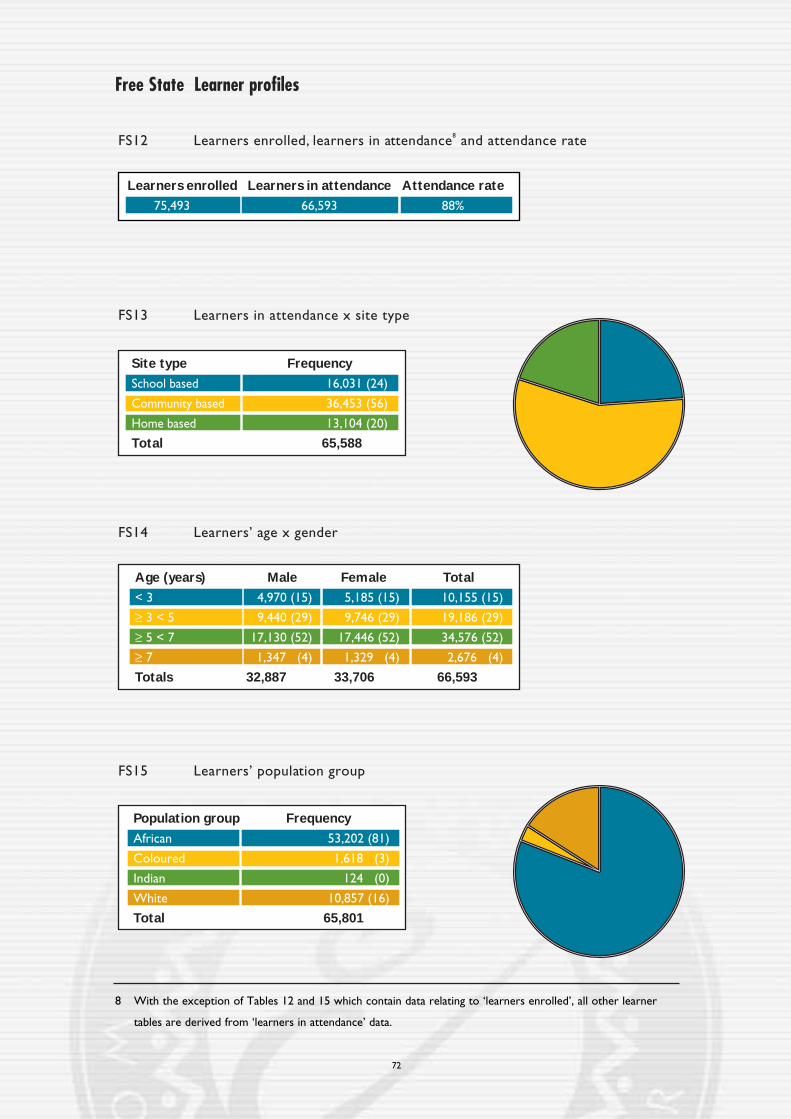
Free State Learner profiles
72
FS13 Learners in attendance x site type
Site type Frequency
School based 16,031 (24)
Community based 36,453 (56)
Home based 13,104 (20)
Total 65,588
FS14 Learners’ age x gender
Age (years) Male Female Total
< 3 4,970 (15) 5,185 (15) 10,155 (15)
≥ 3 < 5 9,440 (29) 9,746 (29) 19,186 (29)
≥ 5 < 7 17,130 (52) 17,446 (52) 34,576 (52)
≥ 7 1,347 (4) 1,329 (4) 2,676 (4)
Totals 32,887 33,706 66,593
FS15 Learners’ population group
Population group Frequency
African 53,202 (81)
Coloured 1,618 (3)
Indian 124 (0)
White 10,857 (16)
Total 65,801
FS12 Learners enrolled, learners in attendance8 and attendance rate
Learners enrolled Learners in attendance Attendance rate
75,493 66,593 88%
8 With the exception of Tables 12 and 15 which contain data relating to ‘learners enrolled’, all other learner
tables are derived from ‘learners in attendance’ data.
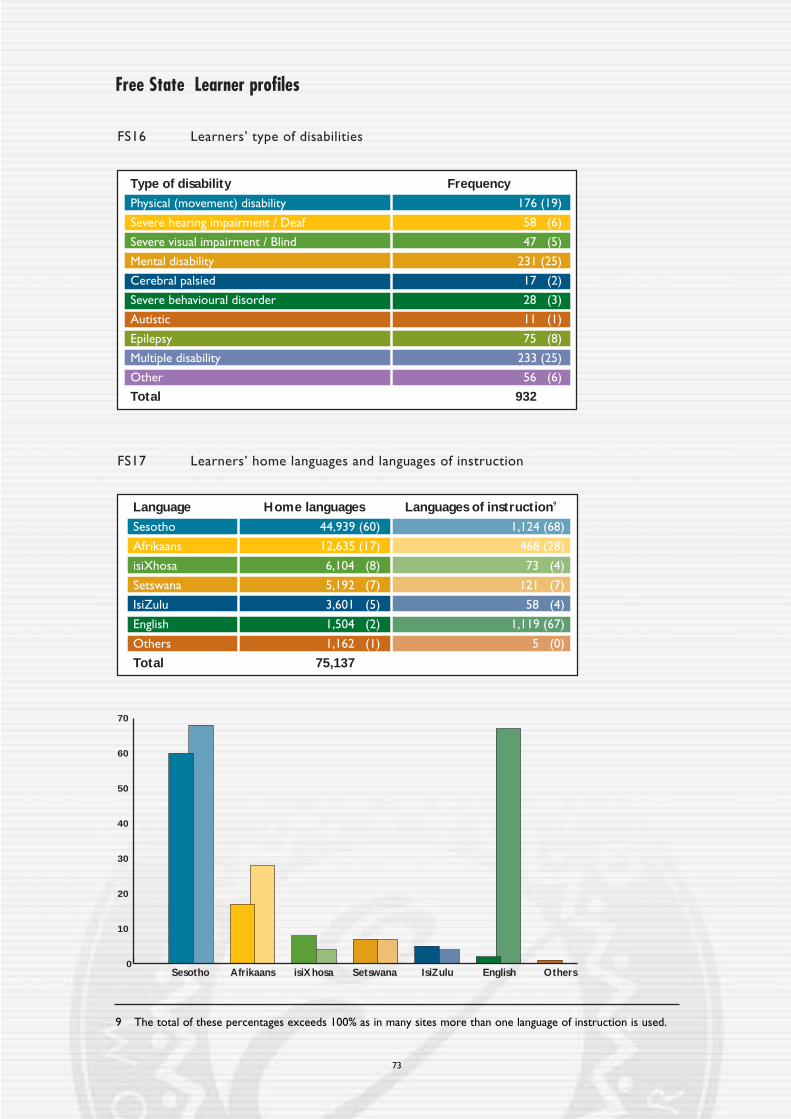
Free State Learner profiles
73
FS16 Learners’ type of disabilities
Type of disability Frequency
Physical (movement) disability 176 (19)
Severe hearing impairment / Deaf 58 (6)
Severe visual impairment / Blind 47 (5)
Mental disability 231 (25)
Cerebral palsied 17 (2)
Severe behavioural disorder 28 (3)
Autistic 11 (1)
Epilepsy 75 (8)
Multiple disability 233 (25)
Other 56 (6)
Total 932
0
10
20
30
40
50
60
70
Sesotho Afrikaans isiXhosa Setswana IsiZulu English Others
FS17 Learners’ home languages and languages of instruction
Language Home languages Languages of instruction9
Sesotho 44,939 (60) 1,124 (68)
Afrikaans 12,635 (17) 468 (28)
isiXhosa 6,104 (8) 73 (4)
Setswana 5,192 (7) 121 (7)
IsiZulu 3,601 (5) 58 (4)
English 1,504 (2) 1,119 (67)
Others 1,162 (1) 5 (0)
Total 75,137
9 The total of these percentages exceeds 100% as in many sites more than one language of instruction is used.

Free State Educator profiles
74
FS18 Educators, learners and learner/educator ratio
Educators Learners enrolled Educator/learner ratio
3,964 75,493 19/1
FS19 Educators’ age
Age (years) Frequency
< 20 25 (1)
≥ 20 < 30 720 (18)
≥ 30 < 40 1,411 (36)
≥ 40 < 50 1,143 (29)
≥ 50 < 60 472 (12)
≥ 60 151 (4)
Total 3,922
FS20 Educators’ population group
Population Group Frequency
African 3,035 (77)
Coloured 80 (2)
Indian 1 (0)
White 842 (21)
Total 3,958

Free State Educator profiles
75
FS21 Educators’ qualifications10
Qualifications Frequency
No training 1,015 (27)
NGO training 1,594 (43)
Under-qualified 469 (13)
Qualified 338 (9)
Non-ECD qualification 316 (8)
Total 3,732
FS22 Educator qualifications x years of ECD experience
Years No training NGO Training Under-qualified Qualified Total
< 2 355 (35) 101 (6) 58 (12) 26 (8) 540 (16)
≥ 2 < 5 333 (33) 471 (30) 90 (19) 50 (15) 944 (28)
≥ 5 < 10 181 (18) 686 (43) 127 (27) 77 (23) 1,071 (31)
≥ 10 146 (14) 336 (21) 194 (41) 185 (54) 861 (25)
Totals 1,015 1,594 469 338 3,416
No training NGO training Under-qualified Qualified Total0
10
20
30
40
50
60
10 The qualifications clusters detailed are those currently in use by the Department of Education:
‘Under Qualified’ educators who have received training in technical or teacher training colleges (Matriculation
+2 years)
‘Qualified’ educators who have received university training (Matriculation + 3 years and more)
‘Non-ECD qualification’ a qualification in an area such as nursing, social work etc.
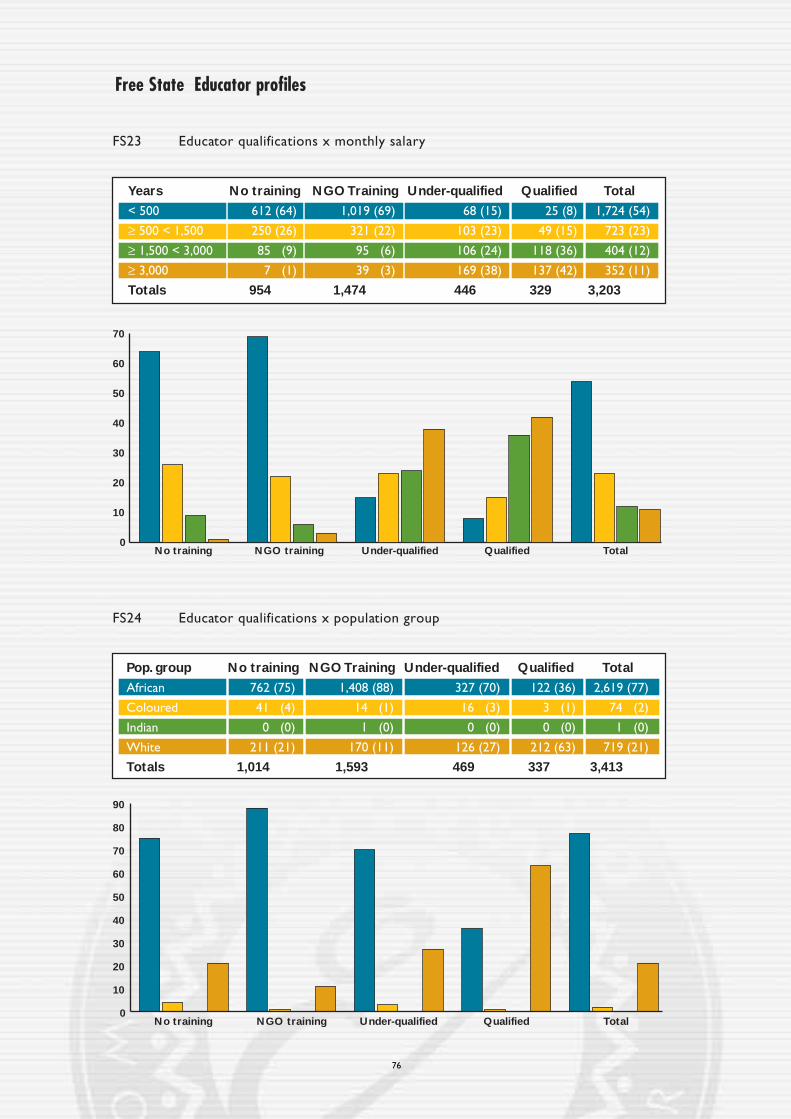
Free State Educator profiles
76
FS23 Educator qualifications x monthly salary
Years No training NGO Training Under-qualified Qualified Total
< 500 612 (64) 1,019 (69) 68 (15) 25 (8) 1,724 (54)
≥ 500 < 1,500 250 (26) 321 (22) 103 (23) 49 (15) 723 (23)
≥ 1,500 < 3,000 85 (9) 95 (6) 106 (24) 118 (36) 404 (12)
≥ 3,000 7 (1) 39 (3) 169 (38) 137 (42) 352 (11)
Totals 954 1,474 446 329 3,203
No training NGO training Under-qualified Qualified Total0
10
20
30
40
50
60
70
FS24 Educator qualifications x population group
Pop. group No training NGO Training Under-qualified Qualified Total
African 762 (75) 1,408 (88) 327 (70) 122 (36) 2,619 (77)
Coloured 41 (4) 14 (1) 16 (3) 3 (1) 74 (2)
Indian 0 (0) 1 (0) 0 (0) 0 (0) 1 (0)
White 211 (21) 170 (11) 126 (27) 212 (63) 719 (21)
Totals 1,014 1,593 469 337 3,413
No training NGO training Under-qualified Qualified Total0
10
20
30
40
50
60
70
80
90

77
Free State Indices
FS25 Indices
Rating Infrastructure Support Programme Educators
Below Average 113 (7) 93 (6) 133 (8) 442 (11)
Average 1,072 (64) 1,225 (73) 1,193 (72) 2,944 (74)
Above Average 479 (29) 347 (21) 339 (20) 578 (15)
Totals 1,664 1,665 1,665 3,964
Infrastructure Support Programme Educators0
10
20
30
40
50
60
70
80

Free State Salient findings
The following salient points have emerged from the results:
• The distribution of sites (community, home and school based) are representative of the
national distribution.
• Significantly more sites in the Province are based in urban areas (74%) than is the case
nationally (49%). This might explain why 70% of sites are within 1 km of the nearest
primary school (this figure is in line with the national figure of 72%).
• Sites in the Free State compare favourably with other provinces in terms of basic
infrastructure. Nearly two thirds of sites (64%) have piped water, flushing toilets and
mains electricity (the national average is 53%).
• The financial situation of most sites in the province compares well with other provinces.
Only 19% of learners pay less than R25 fees per month while 14% of parents contribute
less than 25% of the school fees.
• The number of learners per educator (19:1) is identical to national ratio.
• As far as the educators are concerned, the age distribution shows a slightly ‘older’ profile
when compared with the national profile: 45% of the educators are older than 40
compared to the national proportion of 39%.As far as qualifications are concerned, the
profile for the Free State is very similar to that of the national profile.This also applies to
the provincial figures on teaching experience (56% having taught for more than 5 years
compared to 55% nationally). Their salaries are also consistent with the national picture.
• The summary indices confirm the general picture that has emerged: ECD facilities in
the Free State are generally better resourced (29% are ‘above average’ compared to 20%
nationally on the infrastructure index). More facilities in the province (20%) were rated
‘above average’ on the educational programme index compared to the national
percentage (9%). The distributions on the support and educator indices are consistent
with national figures.
78
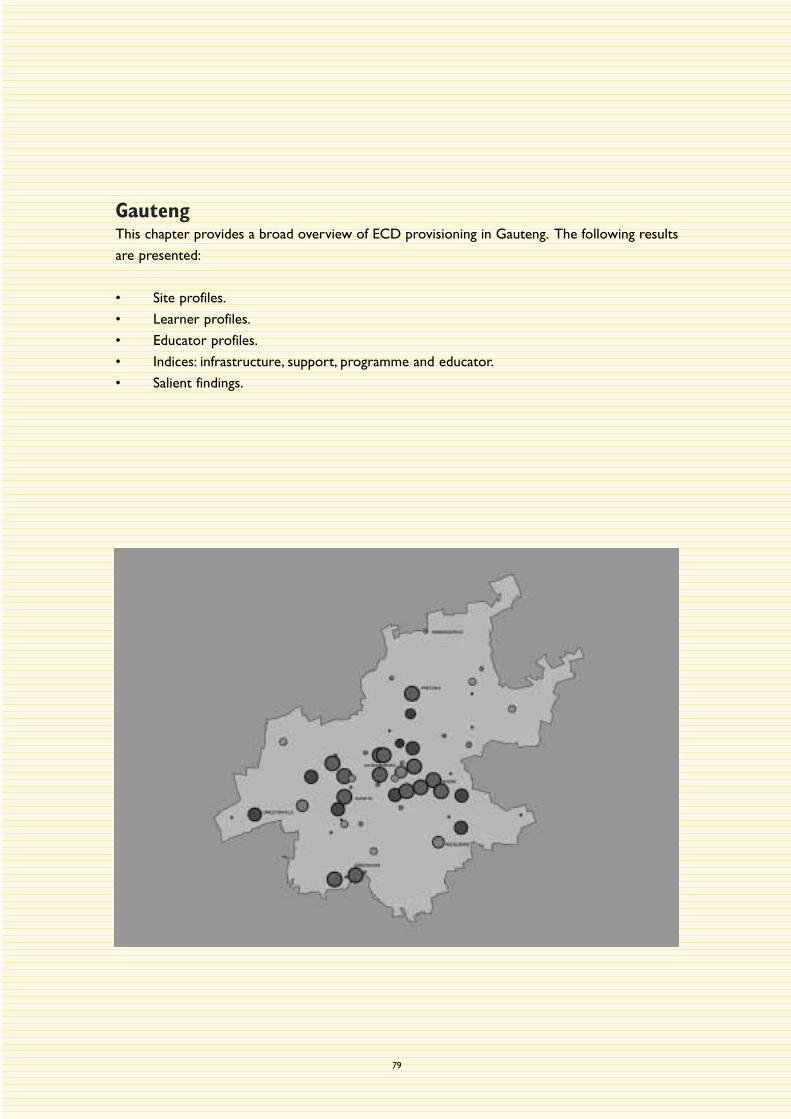
GautengThis chapter provides a broad overview of ECD provisioning in Gauteng. The following results
are presented:
• Site profiles.
• Learner profiles.
• Educator profiles.
• Indices: infrastructure, support, programme and educator.
• Salient findings.
79

Gauteng Site profiles
80
G1 Number of sites
Total number of sites 5,308
% of study population 22.6
G2 Types of sites1
Site type Frequency
School based 442 (8)
Community based 1,649 (32)
Home based 3,097 (60)
Total2 5,168
G3 Geographic location of sites
Location Frequency
Urban (formal)3 4,324 (83)
Urban (informal) 821 (16)
Rural 53 (1)
Total 5,198
1 All figures within the brackets in the tables represent column percentages.
2 Table totals may differ as some cases are invariably lost when two or more variables are cross-tabulated.
3 ‘Urban formal’ ordinary town or city areas with mostly formal dwellings,
‘Urban informal’ ordinary town or city areas with predominantly informal dwellings,
‘Rural’ villages, rural resettlement areas, commercial farms.
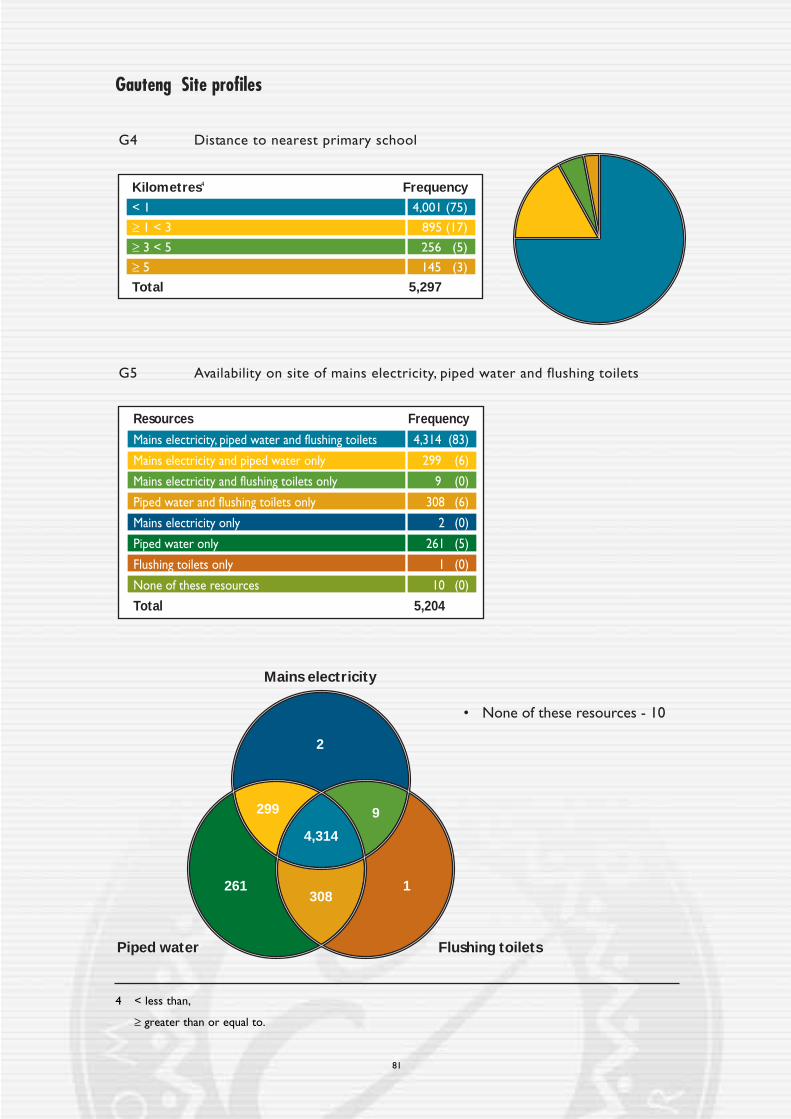
Gauteng Site profiles
81
G5 Availability on site of mains electricity, piped water and flushing toilets
G4 Distance to nearest primary school
Kilometres4 Frequency
< 1 4,001 (75)
≥ 1 < 3 895 (17)
≥ 3 < 5 256 (5)
≥ 5 145 (3)
Total 5,297
Resources Frequency
Mains electricity, piped water and flushing toilets 4,314 (83)
Mains electricity and piped water only 299 (6)
Mains electricity and flushing toilets only 9 (0)
Piped water and flushing toilets only 308 (6)
Mains electricity only 2 (0)
Piped water only 261 (5)
Flushing toilets only 1 (0)
None of these resources 10 (0)
Total 5,204
2
1261
4,314
299
• None of these resources - 10
308
Mains electricity
Piped water Flushing toilets
9
4 < less than,
≥ greater than or equal to.

Gauteng Site profiles
82
G6 Hours of operation
G7 Years providing ECD services
G8 Registration
Hours Frequency
< 5 122 (2)
≥ 5 < 10 2,990 (58)
≥ 10 2,048 (40)
Total 5,160
Years Frequency
< 1 437 (8)
≥ 1 < 3 706 (14)
≥ 3 < 5 1,011 (19)
≥ 5 3,063 (59)
Total 5,217
Registered with Frequency
Department of Education 1,010 (44)
Department of Welfare 686 (30)
Local Authority 284 (13)
Other 295 (13)
Total 2,275

Gauteng Site profiles
83
G11 Sources of income x site type
G9 Monthly fee levels5
G10 Fee payment rates
Payment rate Frequency
0 – 25% 694 (13)
26 – 50% 1,306 (25)
51 – 75% 1,293 (25)
76 – 100% 1,918 (37)
Total 5,211
Source School Community Home Total
Fees only 120 (30) 443 (28) 1,141 (39) 1,704 (35)
Fundraising 140 (35) 459 (29) 367 (13) 966 (20)
Dept. of Welfare 9 (2) 133 (9) 82 (3) 224 (4)
Dept. of Education 62 (15) 101 (7) 204 (7) 367 (7)
Donations 16 (4) 72 (4) 46 (2) 134 (3)
Dept. of Health 16 (4) 175 (11) 771 (26) 962 (20)
Other6 28 (7) 137 (9) 277 (9) 442 (9)
Local Authorities 6 (2) 15 (1) 11 (0) 32 (1)
Private sector grant 5 (1) 29 (2) 16 (1) 50 (1)
Totals7 402 1,564 2,915 4,881
Rands/month Frequency
< 25 60 (1)
≥ 25 < 50 471 (10)
≥ 50 < 75 1,036 (22)
≥ 75 3,244 (67)
Total 4,811
5 Fee levels applicable to learners aged three years and over.
6 ’Other’ in this instance refers to a source of income which could not readily be classified, e.g. using the facility
for other services, selling vegetables grown on the land surrounding the site etc.
7 Totals may exceed the number of sites in each category (as per Table G2) as some sites have more then one
source of income.

Gauteng Learner profiles
84
G13 Learners in attendance x site type
Site type Frequency
School based 22,321 (11)
Community based 98,633 (47)
Home based 87,355 (42)
Total 208,309
G14 Learners’ age x gender
Age (years) Male Female Total
< 3 24,400 (23) 23,807 (22) 28,207 (22)
≥ 3 < 5 35,545 (33) 36,191 (34) 71,736 (34)
≥ 5 < 7 45,549 (43) 45,782 (43) 91,331 (43)
≥ 7 1,267 (1) 1,154 (1) 2,421 (1)
Totals 106,761 106,934 213,695
G15 Learners’ population group
Population group Frequency
African 146,843 (70)
Coloured 6,130 (3)
Indian 3,894 (2)
White 52,285 (25)
Total 209,152
G12 Learners enrolled, learners in attendance8 and attendance rate
Learners enrolled Learners in attendance Attendance rate
236,523 213,695 90%
8 With the exception of Tables 12 and 15 which contain data relating to ‘learners enrolled’, all other learner
tables are derived from ‘learners in attendance’ data.
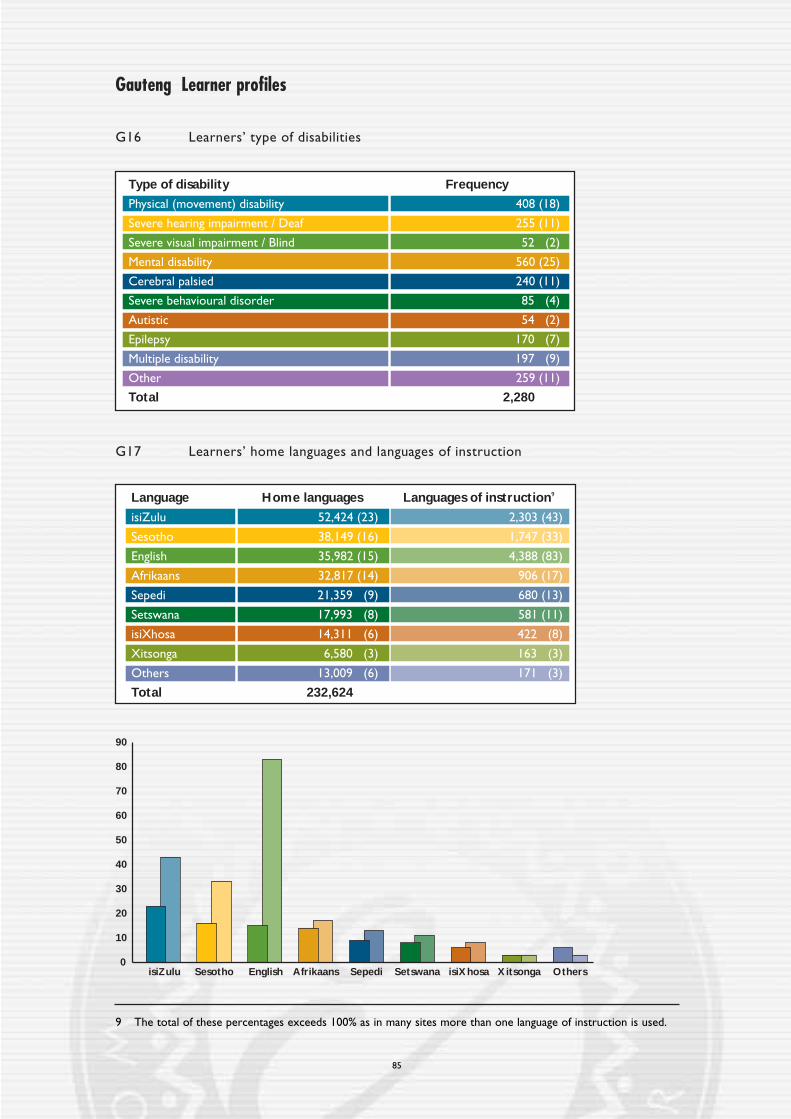
Gauteng Learner profiles
85
G16 Learners’ type of disabilities
G17 Learners’ home languages and languages of instruction
Type of disability Frequency
Physical (movement) disability 408 (18)
Severe hearing impairment / Deaf 255 (11)
Severe visual impairment / Blind 52 (2)
Mental disability 560 (25)
Cerebral palsied 240 (11)
Severe behavioural disorder 85 (4)
Autistic 54 (2)
Epilepsy 170 (7)
Multiple disability 197 (9)
Other 259 (11)
Total 2,280
Language Home languages Languages of instruction9
isiZulu 52,424 (23) 2,303 (43)
Sesotho 38,149 (16) 1,747 (33)
English 35,982 (15) 4,388 (83)
Afrikaans 32,817 (14) 906 (17)
Sepedi 21,359 (9) 680 (13)
Setswana 17,993 (8) 581 (11)
isiXhosa 14,311 (6) 422 (8)
Xitsonga 6,580 (3) 163 (3)
Others 13,009 (6) 171 (3)
Total 232,624
isiZulu0
10
20
30
40
50
60
70
80
90
Sesotho English Afrikaans Sepedi Setswana isiXhosa Xitsonga Others
9 The total of these percentages exceeds 100% as in many sites more than one language of instruction is used.
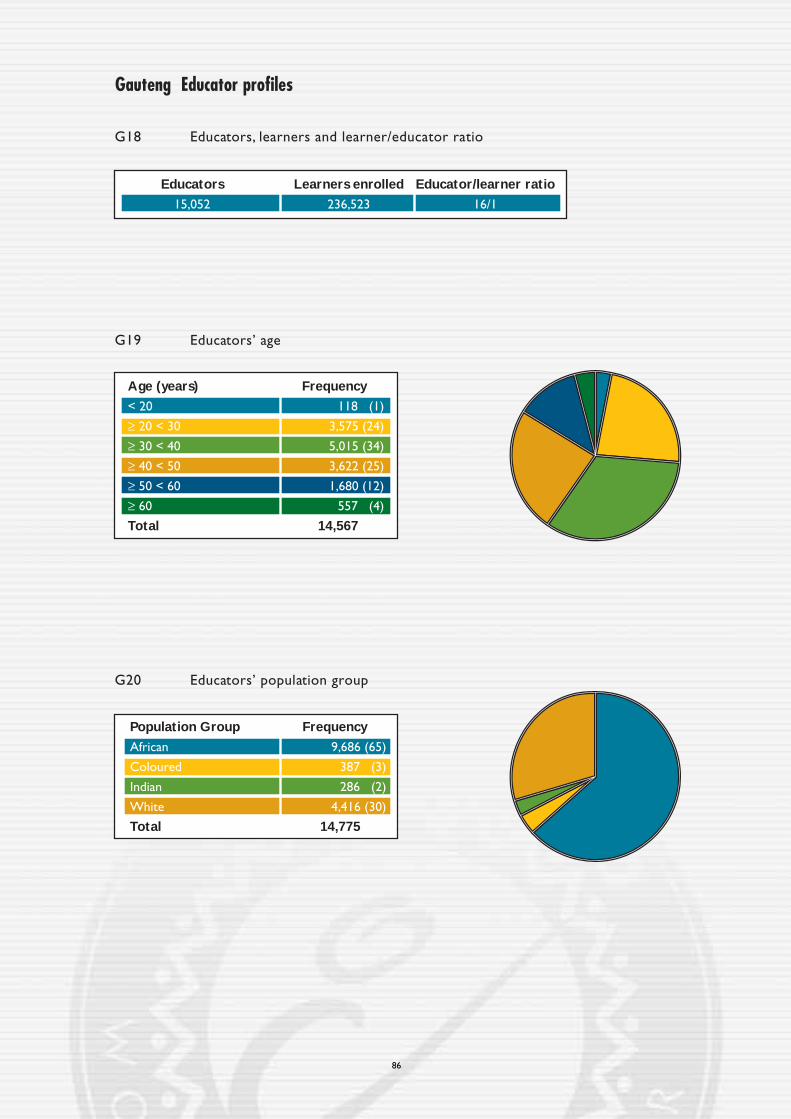
Gauteng Educator profiles
86
G18 Educators, learners and learner/educator ratio
Educators Learners enrolled Educator/learner ratio
15,052 236,523 16/1
G19 Educators’ age
Age (years) Frequency
< 20 118 (1)
≥ 20 < 30 3,575 (24)
≥ 30 < 40 5,015 (34)
≥ 40 < 50 3,622 (25)
≥ 50 < 60 1,680 (12)
≥ 60 557 (4)
Total 14,567
G20 Educators’ population group
Population Group Frequency
African 9,686 (65)
Coloured 387 (3)
Indian 286 (2)
White 4,416 (30)
Total 14,775

Gauteng Educator profiles
87
G21 Educators’ qualifications10
Qualifications Frequency
No training 4,098 (32)
NGO training 4,076 (31)
Under-qualified 1,610 (12)
Qualified 1,895 (15)
Non-ECD qualification 1,265 (10)
Total 12,944
G22 Educator qualifications x years of ECD experience
Years No training NGO Training Under-qualified Qualified Total
< 2 1,335 (33) 454 (11) 208 (13) 140 (7) 2,137 (18)
≥ 2 < 5 1,578 (39) 1,324 (33) 421 (26) 301 (16) 3,624 (31)
≥ 5 < 10 713 (17) 1,484 (36) 433 (27) 388 (21) 3,018 (26)
≥ 10 470 (11) 811 (20) 547 (34) 1,066 (56) 2,894 (25)
Totals 4,096 4,073 1,609 1,895 11,673
No training NGO training Under-qualified Qualified Total0
10
20
30
40
50
60
10 The qualifications clusters detailed are those currently in use by the Department of Education:
‘Under Qualified’ educators who have received training in technical or teacher training colleges (Matriculation
+2 years)
‘Qualified’ educators who have received university training (Matriculation + 3 years and more)
‘Non-ECD qualification’ a qualification in an area such as nursing, social work etc.
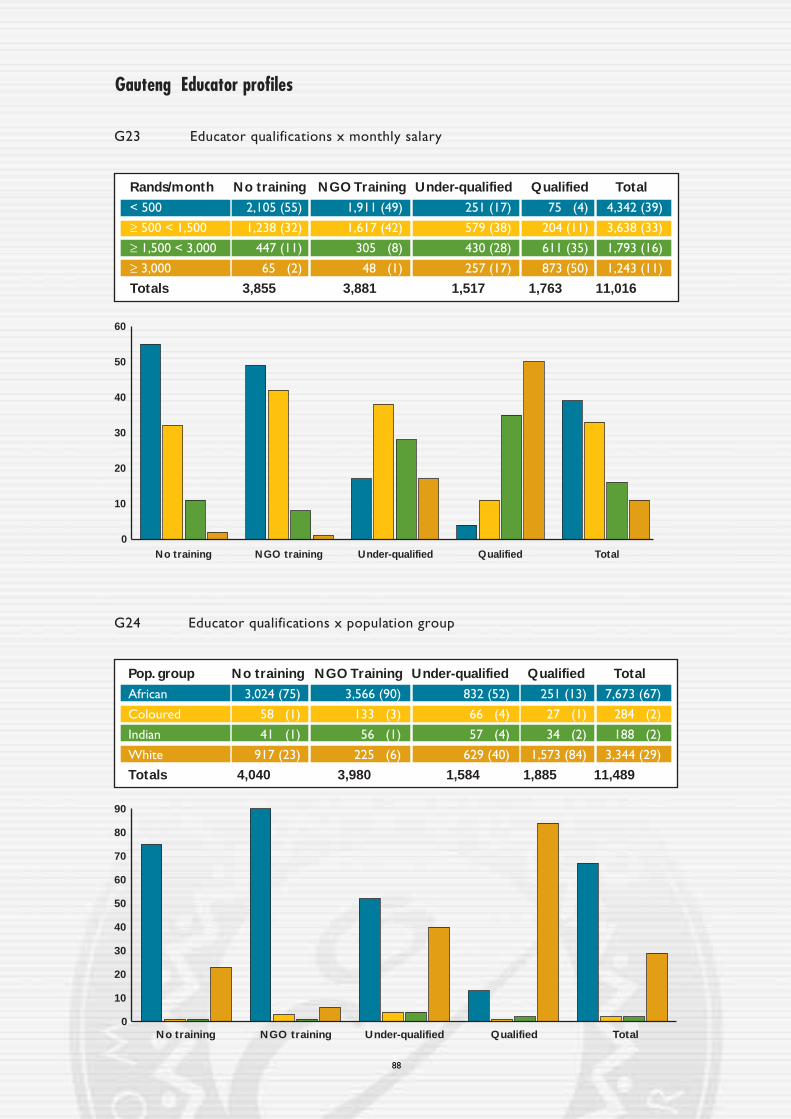
Gauteng Educator profiles
88
G23 Educator qualifications x monthly salary
Rands/month No training NGO Training Under-qualified Qualified Total
< 500 2,105 (55) 1,911 (49) 251 (17) 75 (4) 4,342 (39)
≥ 500 < 1,500 1,238 (32) 1,617 (42) 579 (38) 204 (11) 3,638 (33)
≥ 1,500 < 3,000 447 (11) 305 (8) 430 (28) 611 (35) 1,793 (16)
≥ 3,000 65 (2) 48 (1) 257 (17) 873 (50) 1,243 (11)
Totals 3,855 3,881 1,517 1,763 11,016
G24 Educator qualifications x population group
Pop. group No training NGO Training Under-qualified Qualified Total
African 3,024 (75) 3,566 (90) 832 (52) 251 (13) 7,673 (67)
Coloured 58 (1) 133 (3) 66 (4) 27 (1) 284 (2)
Indian 41 (1) 56 (1) 57 (4) 34 (2) 188 (2)
White 917 (23) 225 (6) 629 (40) 1,573 (84) 3,344 (29)
Totals 4,040 3,980 1,584 1,885 11,489
No training NGO training Under-qualified Qualified Total0
10
20
30
40
50
60
No training NGO training Under-qualified Qualified Total0
10
20
30
40
50
60
70
80
90

89
Gauteng Indices
G25 Indices
Rating Infrastructure Support Programme Educators
Below Average 159 (3) 223 (4) 943 (18) 2,574 (17)
Average 3,137 (59) 3,609 (68) 3,887 (73) 10,059 (67)
Above Average 2,003 (38) 1,476 (28) 478 (9) 2,419 (16)
Totals 5,299 5,308 5,308 15,052
0
10
20
30
40
50
60
70
Infrastructure Support Programme Educators
Gauteng Salient findings
The following salient points have emerged from the results:
• There are significantly more home-based ECD sites in Gauteng (60%) when compared to
the national average (34%). Slightly more sites (44%) are registered with the Department
of Education than the national norm of 38%.
• Nearly all sites are urban (83% formal urban) and 59% have been in operation for more
than 5 years (national average is 63%).
• Sites in the Province are generally very well developed: 83% of sites have piped water,
flushing toilets and mains electricity.This is much higher than the national result of 53%.
• The financial base of most sites in Gauteng compares favourably with the national trend:
74% of learners pay more than R75 fees per month (the national average is 36%) and 37%
of parents contribute to more than 75% of the school fees (national average: 28%).
• The average number of learners per educator (16:1) is the lowest in the country.
• With regard to the educators, the provincial figures conform largely to the national
averages. The only exception concerns qualifications where there are more educators
with no training (32%) when compared to the national figure (23%).
• The summary indices confirm the general picture that has emerged: ECD facilities in
Gauteng are much better resourced as far as basic infrastructure is concerned (38% are
rated ‘above average’ compared to 20% nationally).They also receive more support from
their constituencies (28% in the ‘above average’ category compared to 19% nationally).
The general educator profile shows that 17% of educators were rated ‘below average’
which is higher than the national figure of 12%.
90

91
KwaZulu-NatalThis chapter provides a broad overview of ECD provisioning in KwaZulu-Natal. The following
results are presented:
• Site profiles.
• Learner profiles.
• Educator profiles.
• Indices: infrastructure, support, programme and educator.
• Salient findings.
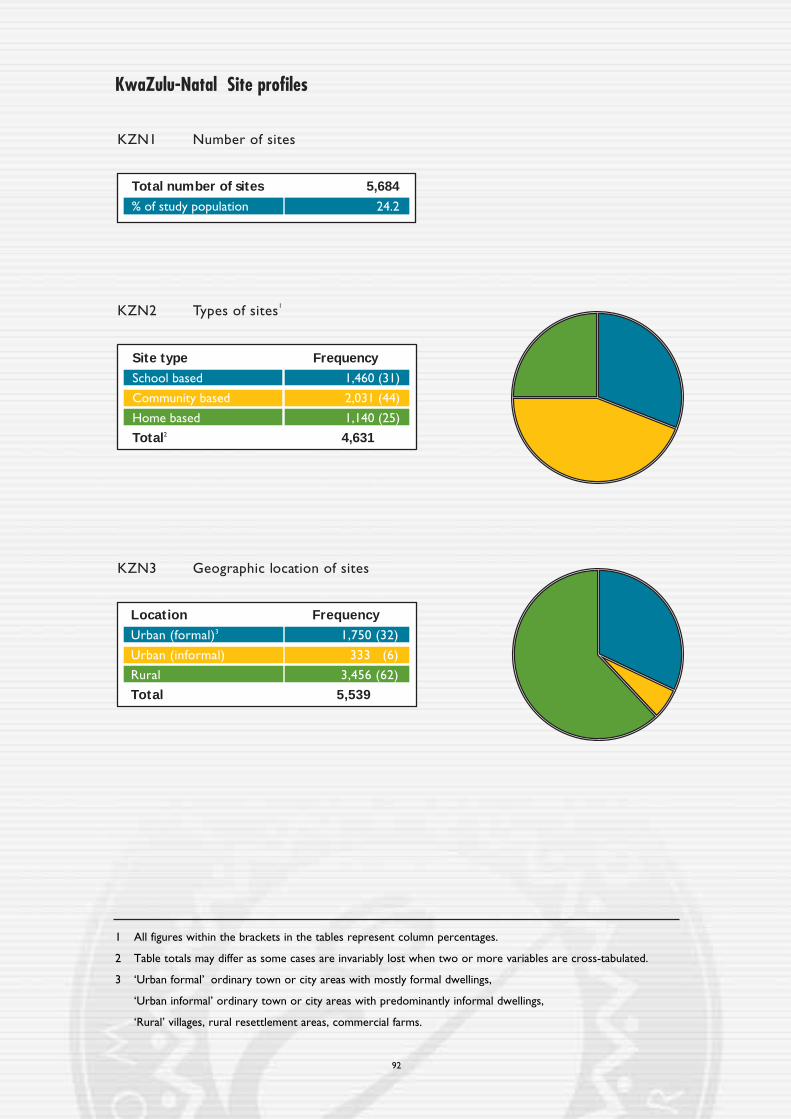
KwaZulu-Natal Site profiles
92
KZN1 Number of sites
Total number of sites 5,684
% of study population 24.2
KZN2 Types of sites1
Site type Frequency
School based 1,460 (31)
Community based 2,031 (44)
Home based 1,140 (25)
Total2 4,631
KZN3 Geographic location of sites
Location Frequency
Urban (formal)3 1,750 (32)
Urban (informal) 333 (6)
Rural 3,456 (62)
Total 5,539
1 All figures within the brackets in the tables represent column percentages.
2 Table totals may differ as some cases are invariably lost when two or more variables are cross-tabulated.
3 ‘Urban formal’ ordinary town or city areas with mostly formal dwellings,
‘Urban informal’ ordinary town or city areas with predominantly informal dwellings,
‘Rural’ villages, rural resettlement areas, commercial farms.

KwaZulu-Natal Site profiles
93
KZN5 Availability on site of mains electricity, piped water and flushing toilets
KZN4 Distance to nearest primary school
Kilometres4 Frequency
< 1 3,697 (65)
≥ 1 < 3 1,337 (24)
≥ 3 < 5 393 (7)
≥ 5 237 (4)
Total 5,664
Resources Frequency
Mains electricity, piped water and flushing toilets 1,463 (31)
Mains electricity and piped water only 584 (13)
Mains electricity and flushing toilets only 3 (0)
Piped water and flushing toilets only 228 (5)
Mains electricity only 62 (1)
Piped water only 1,724 (37)
Flushing toilets only 6 (0)
None of these resources 579 (13)
Total 4,649
62
61,724
1,463
584
• None of these resources - 579
228
Mains electricity
Piped water Flushing toilets
3
4 < less than,
≥ greater than or equal to.

KwaZulu-Natal Site profiles
94
KZN6 Hours of operation
Hours Frequency
< 5 851 (18)
≥ 5 < 10 3,393 (74)
≥ 10 355 (8)
Total 4,599
KZN7 Years providing ECD services
Years Frequency
< 1 430 (9)
≥ 1 < 3 648 (14)
≥ 3 < 5 820 (18)
≥ 5 2,714 (59)
Total 4,612
KZN8 Registration
Registered with Frequency
Department of Education 1,334 (35)
Department of Welfare 1,547 (41)
Local Authority 779 (20)
Other 139 (4)
Total 3,799
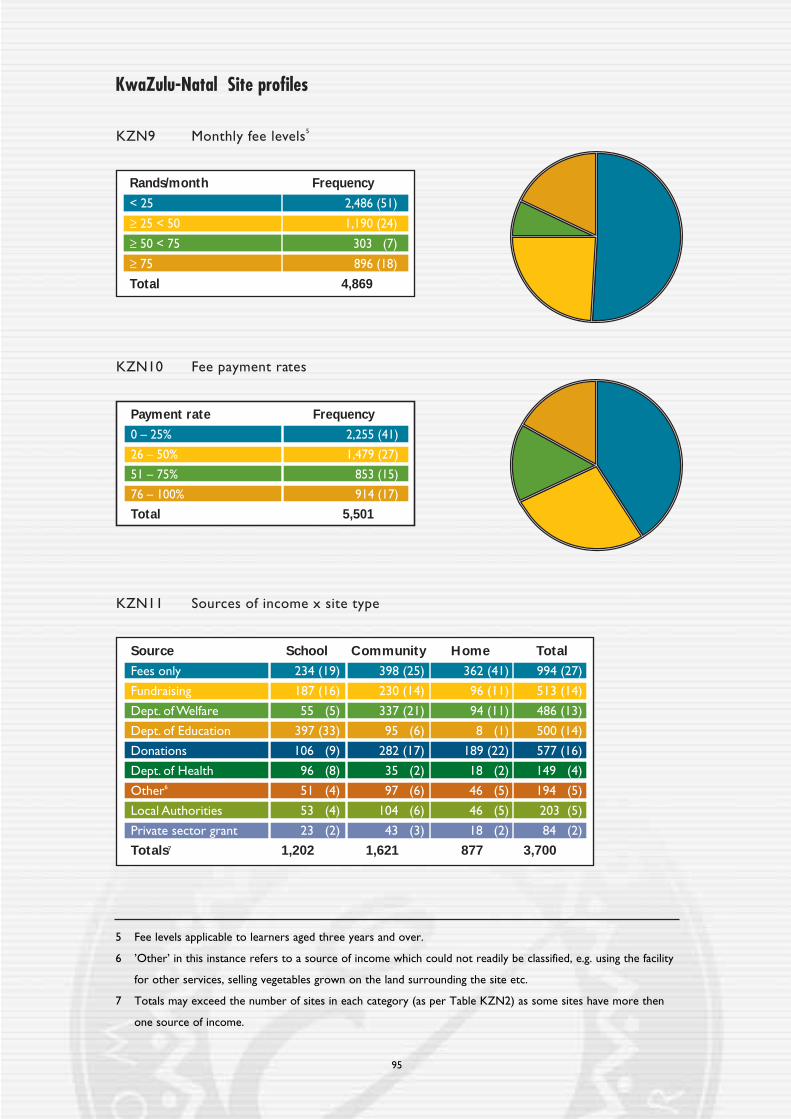
95
KwaZulu-Natal Site profiles
KZN11 Sources of income x site type
KZN9 Monthly fee levels5
KZN10 Fee payment rates
Payment rate Frequency
0 – 25% 2,255 (41)
26 – 50% 1,479 (27)
51 – 75% 853 (15)
76 – 100% 914 (17)
Total 5,501
Source School Community Home Total
Fees only 234 (19) 398 (25) 362 (41) 994 (27)
Fundraising 187 (16) 230 (14) 96 (11) 513 (14)
Dept. of Welfare 55 (5) 337 (21) 94 (11) 486 (13)
Dept. of Education 397 (33) 95 (6) 8 (1) 500 (14)
Donations 106 (9) 282 (17) 189 (22) 577 (16)
Dept. of Health 96 (8) 35 (2) 18 (2) 149 (4)
Other6 51 (4) 97 (6) 46 (5) 194 (5)
Local Authorities 53 (4) 104 (6) 46 (5) 203 (5)
Private sector grant 23 (2) 43 (3) 18 (2) 84 (2)
Totals7 1,202 1,621 877 3,700
Rands/month Frequency
< 25 2,486 (51)
≥ 25 < 50 1,190 (24)
≥ 50 < 75 303 (7)
≥ 75 896 (18)
Total 4,869
5 Fee levels applicable to learners aged three years and over.
6 ’Other’ in this instance refers to a source of income which could not readily be classified, e.g. using the facility
for other services, selling vegetables grown on the land surrounding the site etc.
7 Totals may exceed the number of sites in each category (as per Table KZN2) as some sites have more then
one source of income.

KwaZulu-Natal Learner profiles
96
KZN13 Learners in attendance x site type
Site type Frequency
School based 56,164 (37)
Community based 73,054 (47)
Home based 24,256 (16)
Total 153,474
KZN14 Learners’ age x gender
Age (years) Male Female Total
< 3 11,231 (12) 11,287 (12) 22,518 (12)
≥ 3 < 5 24,869 (27) 25,824 (28) 50,693 (27)
≥ 5 < 7 52,301 (59) 53,653 (58) 105,954 (58)
≥ 7 2,127 (2) 1,725 (2) 3,852 (2)
Totals 90,528 92,489 183,017
KZN15 Learners’ population group
Population group Frequency
African 149,802 (84)
Coloured 3,541 (2)
Indian 12,298 (7)
White 13,398 (7)
Total 179,039
KZN12 Learners enrolled, learners in attendance8 and attendance rate
Learners enrolled Learners in attendance Attendance rate
213,950 183,017 86%
8 With the exception of Tables 12 and 15 which contain data relating to ‘learners enrolled’, all other learner
tables are derived from ‘learners in attendance’ data.
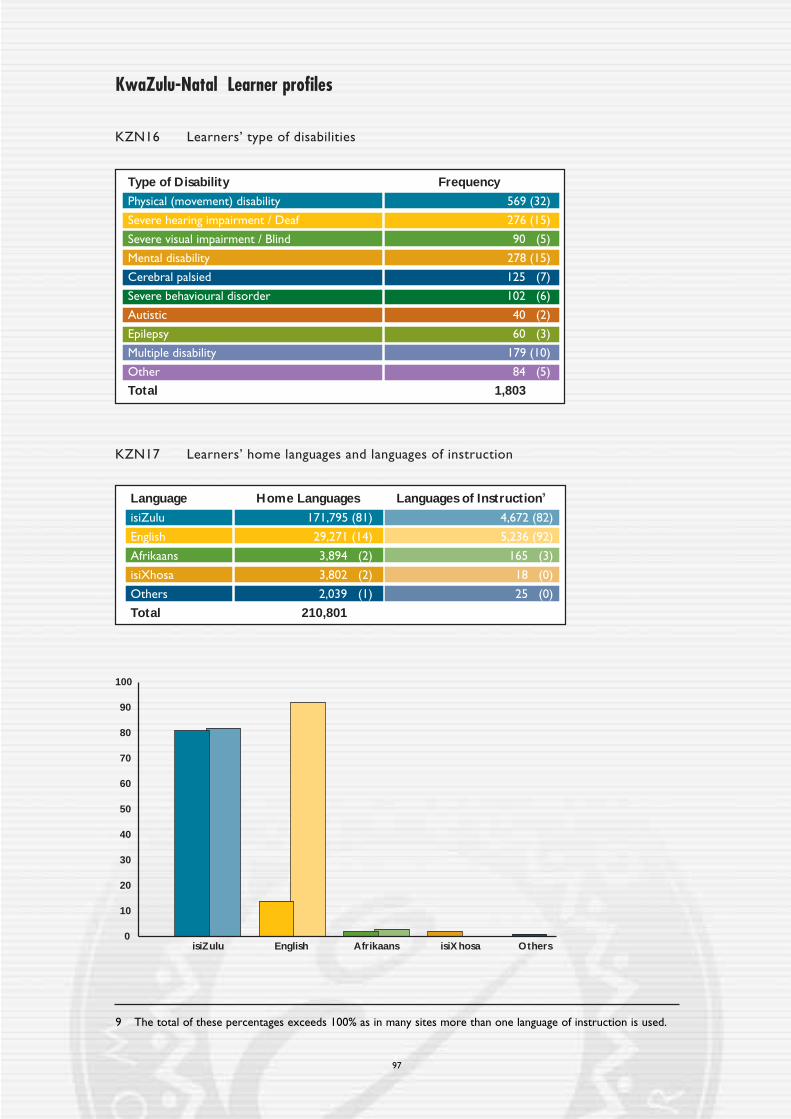
KwaZulu-Natal Learner profiles
97
KZN16 Learners’ type of disabilities
KZN17 Learners’ home languages and languages of instruction
Type of Disability Frequency
Physical (movement) disability 569 (32)
Severe hearing impairment / Deaf 276 (15)
Severe visual impairment / Blind 90 (5)
Mental disability 278 (15)
Cerebral palsied 125 (7)
Severe behavioural disorder 102 (6)
Autistic 40 (2)
Epilepsy 60 (3)
Multiple disability 179 (10)
Other 84 (5)
Total 1,803
0
10
20
30
40
50
60
70
80
90
100
isiZulu English Afrikaans isiXhosa Others
Language Home Languages Languages of Instruction9
isiZulu 171,795 (81) 4,672 (82)
English 29,271 (14) 5,236 (92)
Afrikaans 3,894 (2) 165 (3)
isiXhosa 3,802 (2) 18 (0)
Others 2,039 (1) 25 (0)
Total 210,801
9 The total of these percentages exceeds 100% as in many sites more than one language of instruction is used.

KwaZulu-Natal Educator profiles
98
KZN18 Educators, learners and learner/educator ratio
Educators Learners enrolled Educator/learner ratio
10,603 213,950 20/1
KZN19 Educators’ age
Age (years) Frequency
< 20 73 (1)
≥ 20 < 30 2,326 (23)
≥ 30 < 40 3,724 (36)
≥ 40 < 50 2,513 (25)
≥ 50 < 60 1,159 (11)
≥ 60 431 (4)
Total 10,226
KZN20 Educators’ population group
Population Group Frequency
African 7,968 (76)
Coloured 297 (3)
Indian 674 (7)
White 1,509 (14)
Total 10,448

KwaZulu-Natal Educator profiles
99
KZN21 Educators’ qualifications10
Qualifications Frequency
No training 1,844 (19)
NGO training 4,539 (47)
Under-qualified 1,788 (19)
Qualified 1,002 (10)
Non-ECD qualification 528 (5)
Total 9,701
KZN22 Educator qualifications x years of ECD experience
Years No training NGO Training Under-qualified Qualified Total
< 2 703 (38) 590 (13) 262 (15) 120 (12) 1,675 (18)
≥ 2 < 5 601 (33) 1,443 (32) 377 (21) 176 (18) 2,597 (29)
≥ 5 < 10 381 (21) 1,803 (40) 503 (28) 254 (25) 2,941 (32)
≥ 10 159 (8) 697 (15) 643 (36) 452 (45) 1,951 (21)
Totals 1,844 4,533 1,785 1,002 9,164
No training NGO training Under-qualified Qualified Total0
5
10
15
20
25
30
35
40
45
10 The qualifications clusters detailed are those currently in use by the Department of Education:
‘Under Qualified’ educators who have received training in technical or teacher training colleges (Matriculation
+2 years)
‘Qualified’ educators who have received university training (Matriculation + 3 years and more)
‘Non-ECD qualification’ a qualification in an area such as nursing, social work etc.
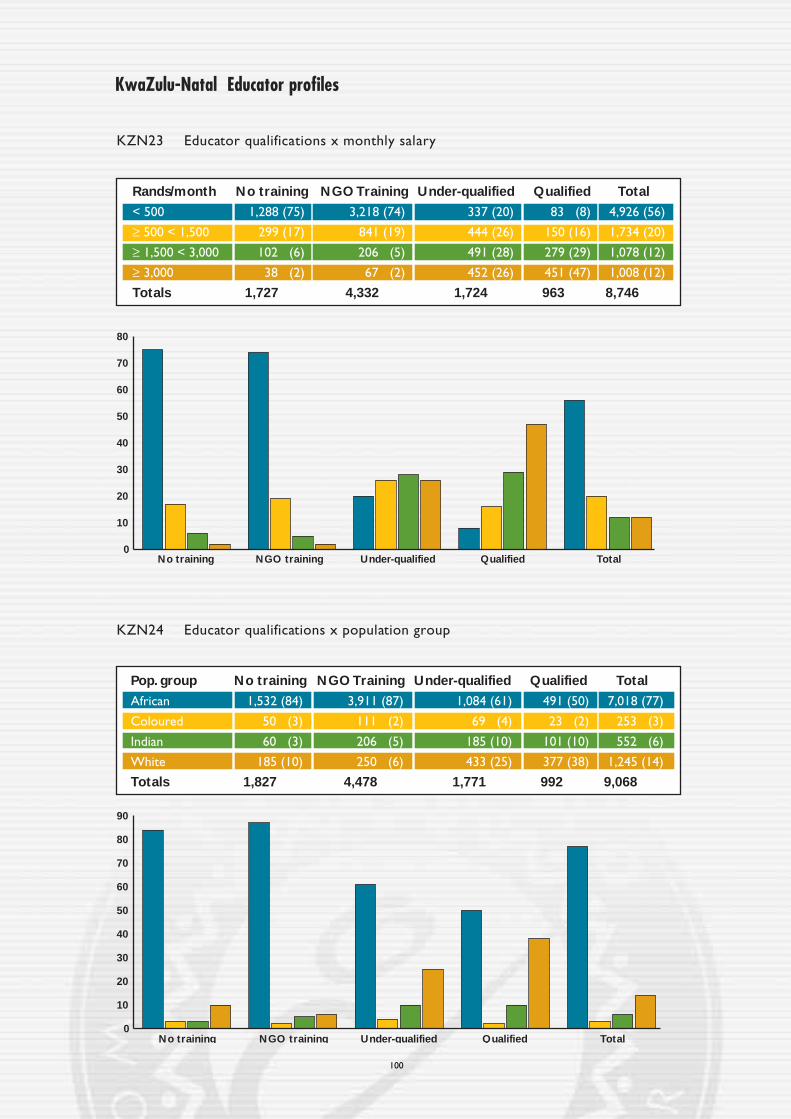
KwaZulu-Natal Educator profiles
100
KZN23 Educator qualifications x monthly salary
Rands/month No training NGO Training Under-qualified Qualified Total
< 500 1,288 (75) 3,218 (74) 337 (20) 83 (8) 4,926 (56)
≥ 500 < 1,500 299 (17) 841 (19) 444 (26) 150 (16) 1,734 (20)
≥ 1,500 < 3,000 102 (6) 206 (5) 491 (28) 279 (29) 1,078 (12)
≥ 3,000 38 (2) 67 (2) 452 (26) 451 (47) 1,008 (12)
Totals 1,727 4,332 1,724 963 8,746
No training NGO training Under-qualified Qualified Total0
10
20
30
40
50
60
70
80
KZN24 Educator qualifications x population group
Pop. group No training NGO Training Under-qualified Qualified Total
African 1,532 (84) 3,911 (87) 1,084 (61) 491 (50) 7,018 (77)
Coloured 50 (3) 111 (2) 69 (4) 23 (2) 253 (3)
Indian 60 (3) 206 (5) 185 (10) 101 (10) 552 (6)
White 185 (10) 250 (6) 433 (25) 377 (38) 1,245 (14)
Totals 1,827 4,478 1,771 992 9,068
No training NGO training Under-qualified Qualified Total0
10
20
30
40
50
60
70
80
90

KwaZulu-Natal Indices
101
KZN25 Indices
Rating Infrastructure Support Programme Educators
Below Average 1,979 (35) 1,288 (23) 701 (12) 1,132 (11)
Average 3,031 (53) 3,830 (67) 4,559 (80) 7,370 (69)
Above Average 664 (12) 566 (10) 424 (8) 2,097 (20)
Totals 5,674 5,684 5,684 10,599
Infrastructure Support Programme Educators0
10
20
30
40
50
60
70
80

KwaZulu-Natal Salient findings
The following salient points have emerged from the results:
• There are significantly more school based sites in KwaZulu-Natal (31%) than the national
average (17%). Nearly 60% of sites have been operating for more than 5 years which is
just below the national norm of 63%.
• Significantly more sites in the province are based in rural areas (62%) than is the case
nationally (40%). This explains why more sites are further than 3 km away from the
nearest primary school: (11%) compared with the national figures (8%).
• Sites in KZN are less developed in terms of basic infrastructure than the national average.
Only 32% of sites have piped water, flushing toilets and mains electricity. This does not
compare well with the national figure of 53%.
• The financial base of most sites in the province is weak with nearly half of the learners
paying less than R25 fees per month and 41% of parents contributing to less than 25% of
the school fees.
• The ratio of learners to educators at 23:1, is significantly higher than the national average
of 19:1.
• As far as the educators are concerned, most of the profiles (age, qualification and teaching
experience) are very similar to the national profiles. The only significant deviation
concerns monthly salary where 56% receive less than R500 per month compared to the
national figure of 44%).
• The summary indices confirm the general picture that has emerged: ECD facilities in the
KwaZulu-Natal are much less well resourced (35% are rated ‘below average’ compared
to 18% nationally).They also receive less support from their constituencies (23% in
the ‘below average’ category compared to 12% nationally). The findings concerning the
nature of the educational activities being conducted in these facilities, as well as the
general educator index, are inline with national averages. In summary: the province has a
weak resource base, with a ‘below average’ educator rating.
102
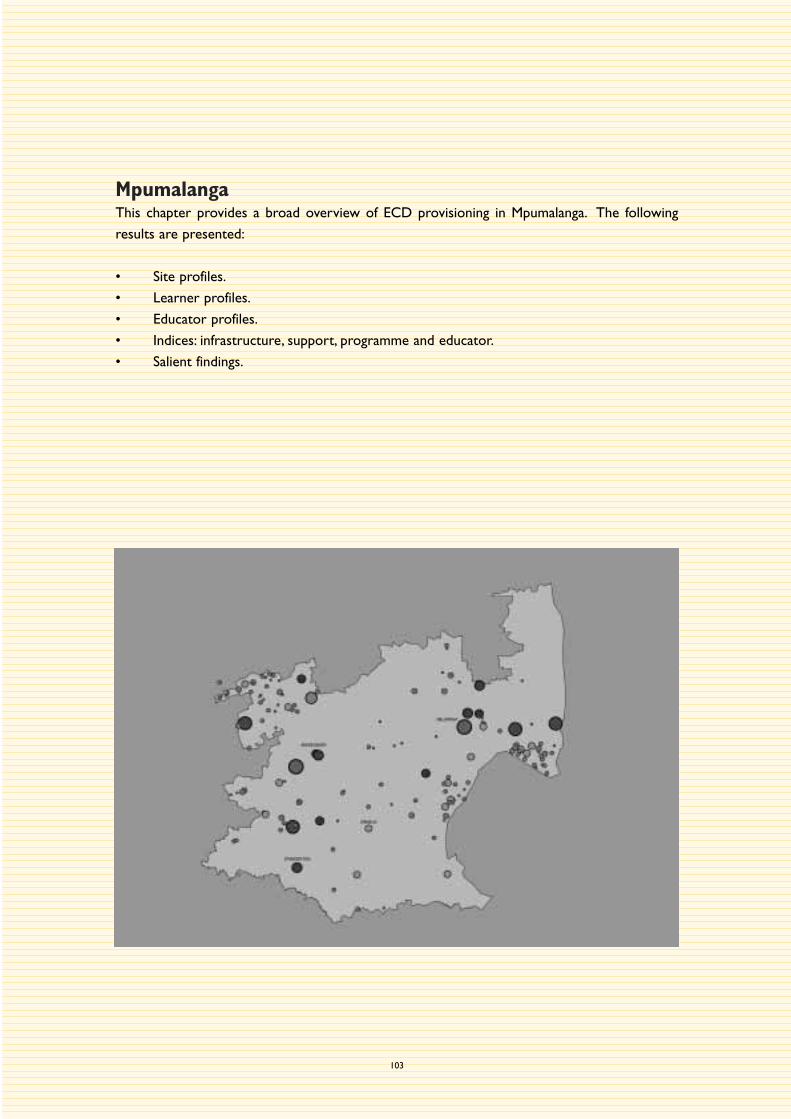
MpumalangaThis chapter provides a broad overview of ECD provisioning in Mpumalanga. The following
results are presented:
• Site profiles.
• Learner profiles.
• Educator profiles.
• Indices: infrastructure, support, programme and educator.
• Salient findings.
103
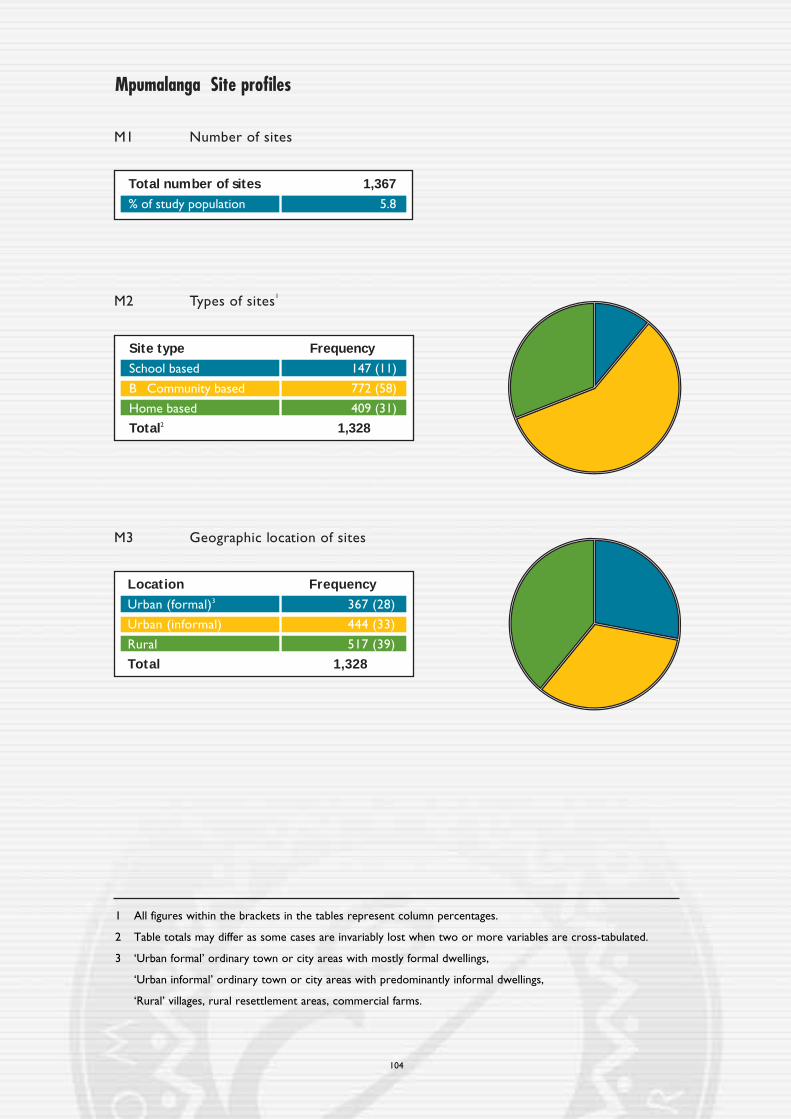
Mpumalanga Site profiles
104
M1 Number of sites
Total number of sites 1,367
% of study population 5.8
M2 Types of sites1
Site type Frequency
School based 147 (11)
B Community based 772 (58)
Home based 409 (31)
Total2 1,328
M3 Geographic location of sites
Location Frequency
Urban (formal)3 367 (28)
Urban (informal) 444 (33)
Rural 517 (39)
Total 1,328
1 All figures within the brackets in the tables represent column percentages.
2 Table totals may differ as some cases are invariably lost when two or more variables are cross-tabulated.
3 ‘Urban formal’ ordinary town or city areas with mostly formal dwellings,
‘Urban informal’ ordinary town or city areas with predominantly informal dwellings,
‘Rural’ villages, rural resettlement areas, commercial farms.

Mpumalanga Site profiles
105
M5 Availability on site of mains electricity, piped water and flushing toilets
M4 Distance to nearest primary school
Kilometres4 Frequency
< 1 1,024 (75)
≥ 1 < 3 266 (20)
≥ 3 < 5 46 (3)
≥ 5 31 (2)
Total 1,367
Resources Frequency
Mains electricity, piped water and flushing toilets 527 (39)
Mains electricity and piped water only 313 (23)
Mains electricity and flushing toilets only 1 (0)
Piped water and flushing toilets only 84 (6)
Mains electricity only 10 (1)
Piped water only 360 (27)
Flushing toilets only 0 (0)
None of these resources 47 (4)
Total 1,342
10
0360
527
313
• None of these resources - 47
84
Mains electricity
Piped water Flushing toilets
1
4 < less than,
≥ greater than or equal to.

Mpumalanga Site profiles
106
M6 Hours of operation
Hours Frequency
< 5 50 (4)
≥ 5 < 10 1,073 (80)
≥ 10 211 (16)
Total 1,334
M7 Years providing ECD services
Years Frequency
< 1 94 (7)
≥ 1 < 3 211 (16)
≥ 3 < 5 299 (22)
≥ 5 744 (55)
Total 1,348
M8 Registration
Registered with Frequency
Department of Education 164 (25)
Department of Welfare 316 (48)
Local Authority 145 (22)
Other 37 (5)
Total 662
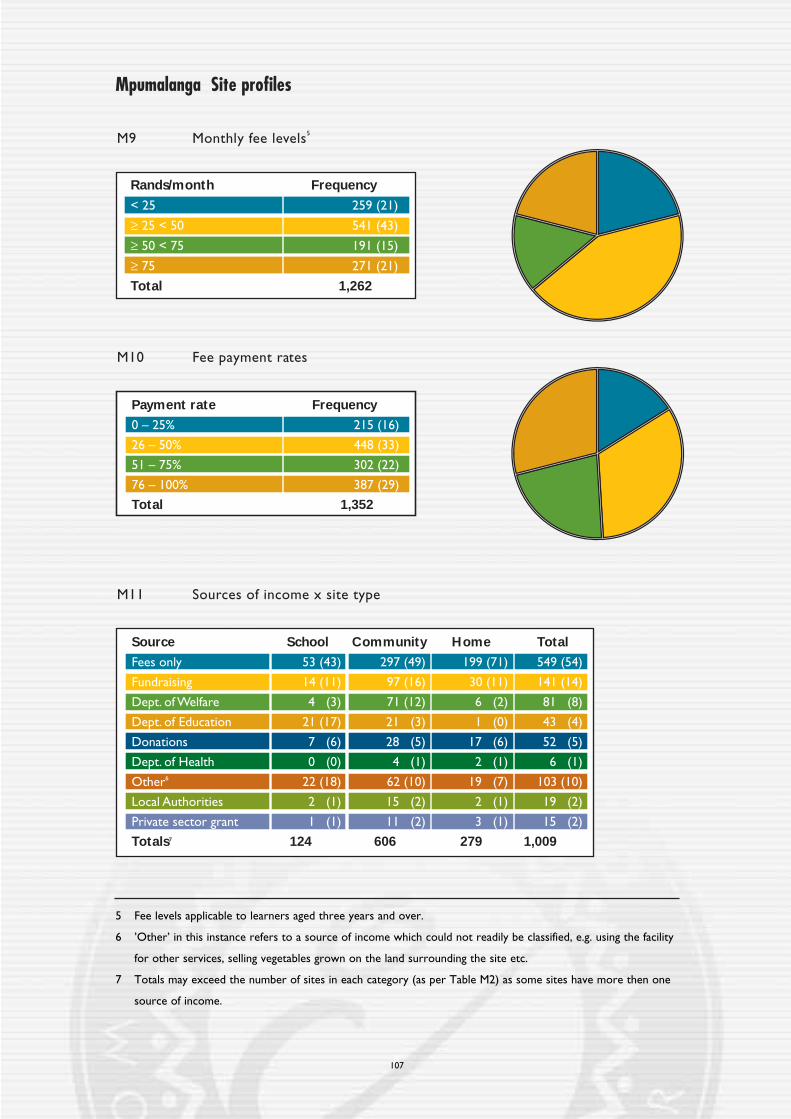
Mpumalanga Site profiles
107
M11 Sources of income x site type
M9 Monthly fee levels5
M10 Fee payment rates
Payment rate Frequency
0 – 25% 215 (16)
26 – 50% 448 (33)
51 – 75% 302 (22)
76 – 100% 387 (29)
Total 1,352
Source School Community Home Total
Fees only 53 (43) 297 (49) 199 (71) 549 (54)
Fundraising 14 (11) 97 (16) 30 (11) 141 (14)
Dept. of Welfare 4 (3) 71 (12) 6 (2) 81 (8)
Dept. of Education 21 (17) 21 (3) 1 (0) 43 (4)
Donations 7 (6) 28 (5) 17 (6) 52 (5)
Dept. of Health 0 (0) 4 (1) 2 (1) 6 (1)
Other6 22 (18) 62 (10) 19 (7) 103 (10)
Local Authorities 2 (1) 15 (2) 2 (1) 19 (2)
Private sector grant 1 (1) 11 (2) 3 (1) 15 (2)
Totals7 124 606 279 1,009
Rands/month Frequency
< 25 259 (21)
≥ 25 < 50 541 (43)
≥ 50 < 75 191 (15)
≥ 75 271 (21)
Total 1,262
5 Fee levels applicable to learners aged three years and over.
6 ’Other’ in this instance refers to a source of income which could not readily be classified, e.g. using the facility
for other services, selling vegetables grown on the land surrounding the site etc.
7 Totals may exceed the number of sites in each category (as per Table M2) as some sites have more then one
source of income.
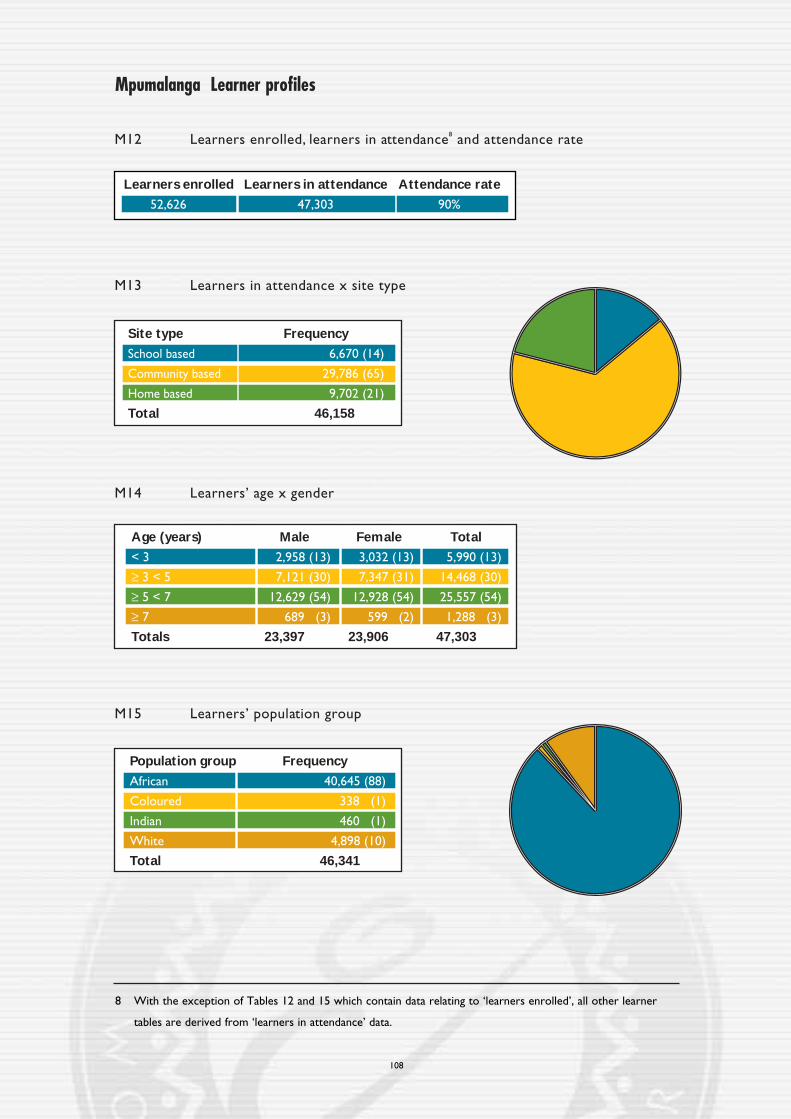
Mpumalanga Learner profiles
108
M13 Learners in attendance x site type
Site type Frequency
School based 6,670 (14)
Community based 29,786 (65)
Home based 9,702 (21)
Total 46,158
M14 Learners’ age x gender
Age (years) Male Female Total
< 3 2,958 (13) 3,032 (13) 5,990 (13)
≥ 3 < 5 7,121 (30) 7,347 (31) 14,468 (30)
≥ 5 < 7 12,629 (54) 12,928 (54) 25,557 (54)
≥ 7 689 (3) 599 (2) 1,288 (3)
Totals 23,397 23,906 47,303
M15 Learners’ population group
Population group Frequency
African 40,645 (88)
Coloured 338 (1)
Indian 460 (1)
White 4,898 (10)
Total 46,341
M12 Learners enrolled, learners in attendance8 and attendance rate
Learners enrolled Learners in attendance Attendance rate
52,626 47,303 90%
8 With the exception of Tables 12 and 15 which contain data relating to ‘learners enrolled’, all other learner
tables are derived from ‘learners in attendance’ data.

Mpumalanga Learner profiles
109
M16 Learners’ type of disabilities
M17 Learners’ home languages and languages of instruction
Type of disability Frequency
Physical (movement) disability 85 (29)
Severe hearing impairment / Deaf 33 (11)
Severe visual impairment / Blind 22 (8)
Mental disability 67 (23)
Cerebral palsied 13 (4)
Severe behavioural disorder 25 (9)
Autistic 7 (2)
Epilepsy 16 (5)
Multiple disability 4 (1)
Other 22 (8)
Total 294
Language Home languages Languages of instruction9
SiSwati 18,799 (36) 500 (36)
isiZulu 11,016 (21) 416 (30)
Afrikaans 5,559 (11) 136 (10)
isiNdebele 5,480 (10) 138 (10)
Sepedi 4,539 (9) 151 (11)
Sesotho 1,990 (4) 27 (2)
Setswana 1,641 (3) 40 (3)
English 1,433 (3) 974 (71)
Others 1,714 (3) 14 (1)
Total 52,171
Siswati Others0
10
20
30
40
50
60
70
80
isiZulu Afrikaans isiNdebele Sepedi Sesotho Setswana English
9 The total of these percentages exceeds 100% as in many sites more than one language of instruction is used.

Mpumalanga Educator profiles
110
M18 Educators, learners and learner/educator ratio
Educators Learners enrolled Educator/learner ratio
2,658 52,626 20/1
M19 Educators’ age
Age (years) Frequency
< 20 18 (1)
≥ 20 < 30 673 (26)
≥ 30 < 40 1,041 (41)
≥ 40 < 50 549 (21)
≥ 50 < 60 222 (9)
≥ 60 63 (2)
Total 2,566
M20 Educators’ population group
Population Group Frequency
African 2,129 (80)
Coloured 20 (1)
Indian 17 (1)
White 472 (18)
Total 2,638
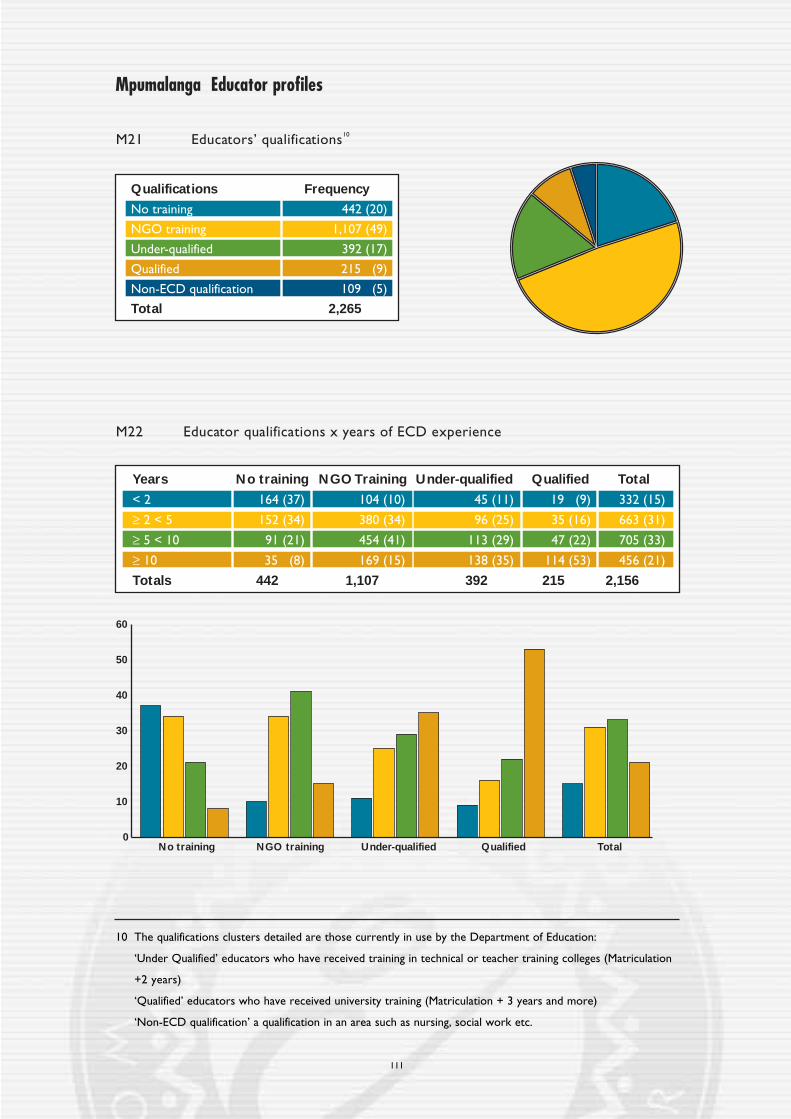
Mpumalanga Educator profiles
111
M21 Educators’ qualifications10
Qualifications Frequency
No training 442 (20)
NGO training 1,107 (49)
Under-qualified 392 (17)
Qualified 215 (9)
Non-ECD qualification 109 (5)
Total 2,265
M22 Educator qualifications x years of ECD experience
Years No training NGO Training Under-qualified Qualified Total
< 2 164 (37) 104 (10) 45 (11) 19 (9) 332 (15)
≥ 2 < 5 152 (34) 380 (34) 96 (25) 35 (16) 663 (31)
≥ 5 < 10 91 (21) 454 (41) 113 (29) 47 (22) 705 (33)
≥ 10 35 (8) 169 (15) 138 (35) 114 (53) 456 (21)
Totals 442 1,107 392 215 2,156
No training NGO training Under-qualified Qualified Total0
10
20
30
40
50
60
10 The qualifications clusters detailed are those currently in use by the Department of Education:
‘Under Qualified’ educators who have received training in technical or teacher training colleges (Matriculation
+2 years)
‘Qualified’ educators who have received university training (Matriculation + 3 years and more)
‘Non-ECD qualification’ a qualification in an area such as nursing, social work etc.

Mpumalanga Educator profiles
112
M23 Educator qualifications x monthly salary
Rands/month No training NGO Training Under-qualified Qualified Total
< 500 278 (66) 736 (69) 75 (20) 19 (9) 1,108 (54)
≥ 500 < 1,500 100 (24) 281 (26) 120 (32) 51 (25) 552 (27)
≥ 1,500 < 13,000 37 (9) 33 (3) 104 (28) 71 (35) 245 (12)
≥ 3,000 5 (1) 16 (2) 73 (20) 62 (31) 156 (7)
Totals 420 1,066 372 203 2,061
No training NGO training Under-qualified Qualified Total0
10
20
30
40
50
60
70
M24 Educator qualifications x population group
Pop. group No training NGO Training Under-qualified Qualified Total
African 368 (84) 1,069 (97) 229 (59) 83 (39) 1,749 (82)
Coloured 2 (0) 8 (1) 5 (1) 2 (1) 17 (1)
Indian 8 (2) 3 (0) 3 (1) 1 (0) 15 (1)
White 62 (14) 22 (2) 150 (39) 127 (60) 361 (16)
Totals 440 1,102 387 213 2,142
No training NGO training Under-qualified Qualified Total0
10
20
30
40
50
60
70
80
90
100
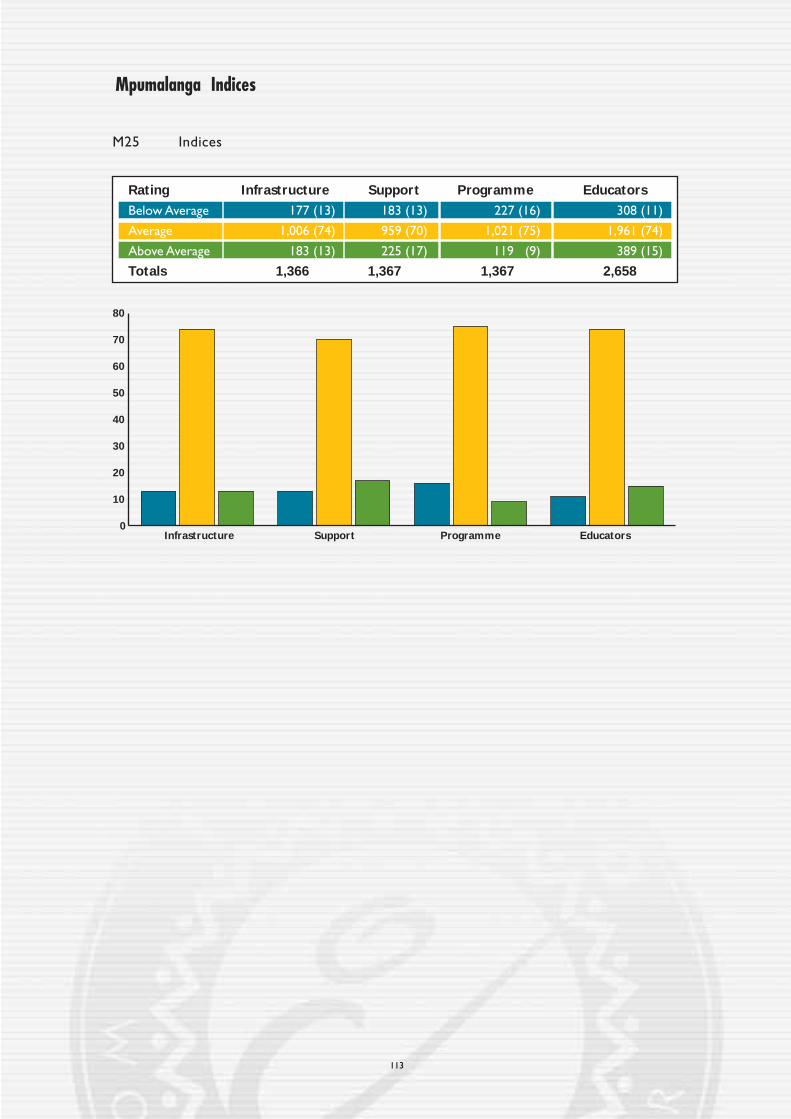
Mpumalanga Indices
113
M25 Indices
Rating Infrastructure Support Programme Educators
Below Average 177 (13) 183 (13) 227 (16) 308 (11)
Average 1,006 (74) 959 (70) 1,021 (75) 1,961 (74)
Above Average 183 (13) 225 (17) 119 (9) 389 (15)
Totals 1,366 1,367 1,367 2,658
0
10
20
30
40
50
60
70
80
Infrastructure Support Programme Educators

Mpumalanga Salient findings
The following salient points have emerged from the results:
• As far as the distribution across the type of site is concerned (school, home or
community based), the picture in the Province looks very much like that at the national
level. There are slightly less sites registered with the Department of Education (25%) than
the national average (38%), but conversely more registered with a Local Authority (22%
compared to 12%). Just over half of the sites (55%) have been operating for more than
5 years which is less than the national figure of 63%.
• The geographical distribution of sites in the province is very similar to the national
distribution; this is also true when one looks at the distance between sites and the
nearest primary school.
• Sites in Mpumalanga are less well-resourced in terms of basic infrastructure than the
national average. Only 39% of sites have piped water, flushing toilets and mains electricity.
This compares unfavourably with the national percentage of 53%.
• The financial situation of most sites in the province is similar to sites nationally.
• The ratio of learners to educators (20:1) also corresponds with the national average of
19:1.
• As far as the educators are concerned, the age distribution shows a slightly ‘younger’
profile when compared with the national profile: 32% of the educators are older than 40
compared to the national proportion of 39%.With regard to qualifications and teaching
experience, educators in the Province conform to national profiles. However, they are
getting slightly less well paid than their colleagues nationally with 54% receiving less than
R500 per month compared to the national score of 44%.
• The summary indices confirm the general picture that has emerged: ECD facilities in
Mpumalanga are very similar to the national profiles on all four indices. However, they do
rate slightly less favourably on infrastructure (13% in the ‘above average’ category
compared to 20% nationally) and they all receive slightly less support (17% compared to
a national figure of 19%).
114
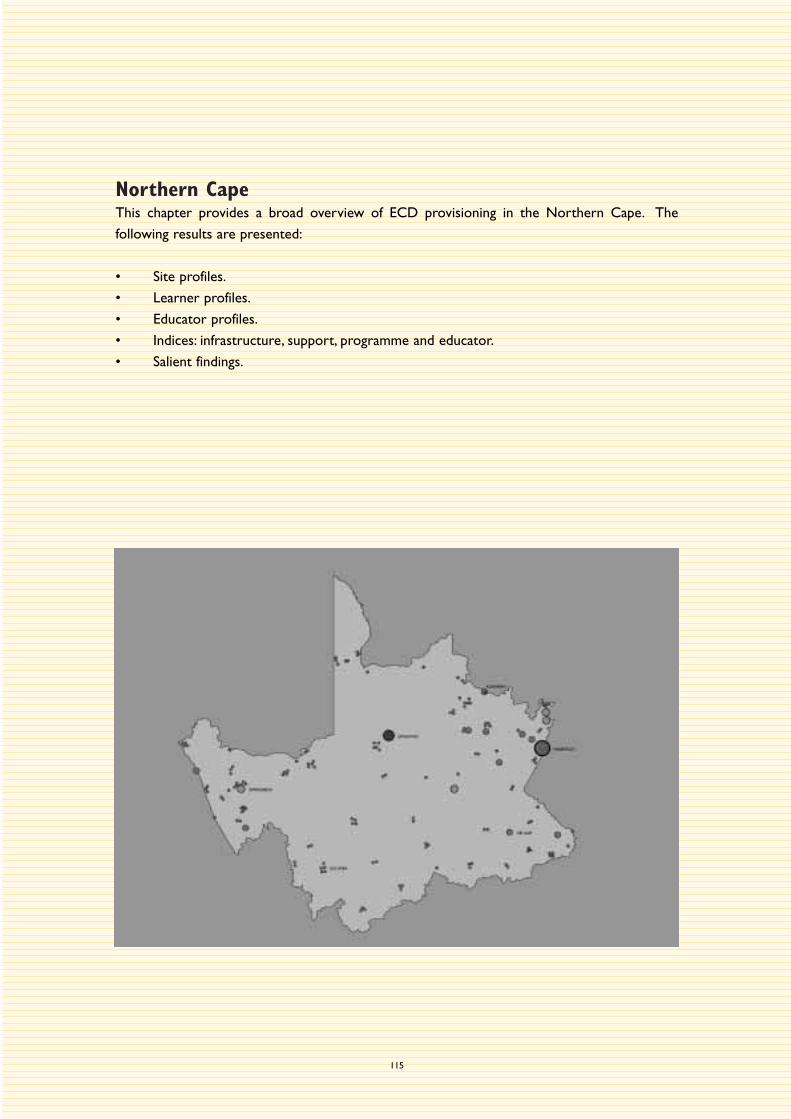
Northern CapeThis chapter provides a broad overview of ECD provisioning in the Northern Cape. The
following results are presented:
• Site profiles.
• Learner profiles.
• Educator profiles.
• Indices: infrastructure, support, programme and educator.
• Salient findings.
115

Northern Cape Site profiles
116
NC1 Number of sites
Total number of sites 422
% of study population 1.8
NC2 Types of sites1
Site type Frequency
School based 121 (30)
Community based 250 (61)
Home based 37 (9)
Total2 408
NC3 Geographic location of sites
Location Frequency
Urban (formal)3 252 (64)
Urban (informal) 30 (8)
Rural 112 (28)
Total 394
1 All figures within the brackets in the tables represent column percentages.
2 Table totals may differ as some cases are invariably lost when two or more variables are cross-tabulated.
3 ‘Urban formal’ ordinary town or city areas with mostly formal dwellings,
‘Urban informal’ ordinary town or city areas with predominantly informal dwellings,
‘Rural’ villages, rural resettlement areas, commercial farms.
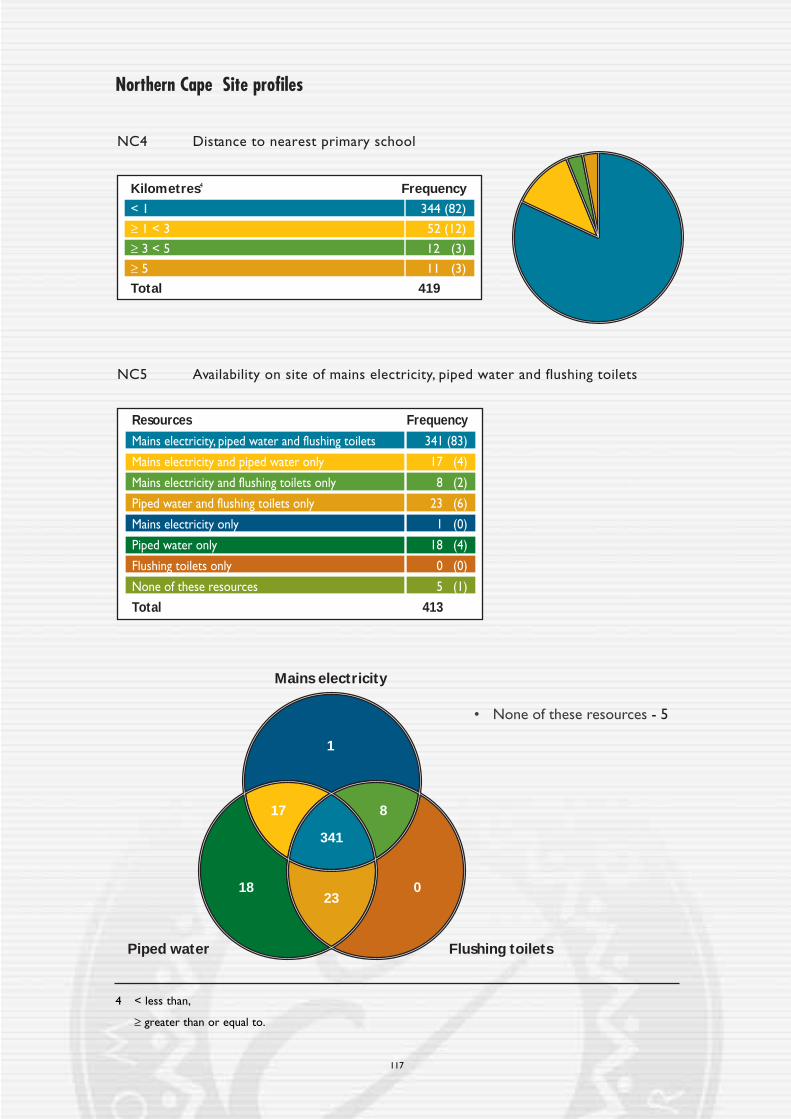
Northern Cape Site profiles
117
NC5 Availability on site of mains electricity, piped water and flushing toilets
NC4 Distance to nearest primary school
Kilometres4 Frequency
< 1 344 (82)
≥ 1 < 3 52 (12)
≥ 3 < 5 12 (3)
≥ 5 11 (3)
Total 419
Resources Frequency
Mains electricity, piped water and flushing toilets 341 (83)
Mains electricity and piped water only 17 (4)
Mains electricity and flushing toilets only 8 (2)
Piped water and flushing toilets only 23 (6)
Mains electricity only 1 (0)
Piped water only 18 (4)
Flushing toilets only 0 (0)
None of these resources 5 (1)
Total 413
1
018
341
17
• None of these resources - 5
23
Mains electricity
Piped water Flushing toilets
8
4 < less than,
≥ greater than or equal to.
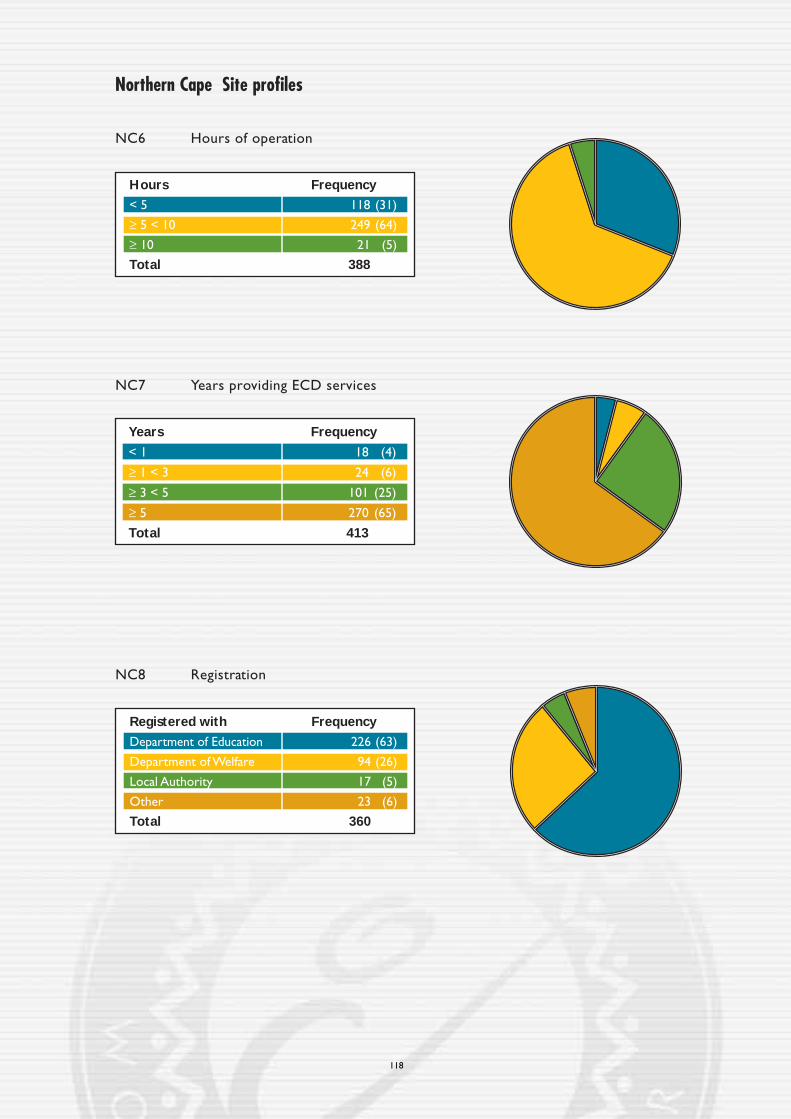
Northern Cape Site profiles
118
NC6 Hours of operation
Hours Frequency
< 5 118 (31)
≥ 5 < 10 249 (64)
≥ 10 21 (5)
Total 388
NC7 Years providing ECD services
Years Frequency
< 1 18 (4)
≥ 1 < 3 24 (6)
≥ 3 < 5 101 (25)
≥ 5 270 (65)
Total 413
NC8 Registration
Registered with Frequency
Department of Education 226 (63)
Department of Welfare 94 (26)
Local Authority 17 (5)
Other 23 (6)
Total 360

Northern Cape Site profiles
119
NC11 Sources of income x site type
NC9 Monthly fee levels5
NC10 Fee payment rates
Payment rate Frequency
0 – 25% 98 (24)
26 – 50% 97 (24)
51 – 75% 83 (20)
76 – 100% 129 (32)
Total 407
Source School Community Home Total
Fees only 3 (3) 9 (4) 6 (19) 404 (5)
Fundraising 47 (42) 98 (38) 9 (28) 154 (38)
Dept. of Welfare 1 (1) 58 (22) 2 (6) 61 (15)
Dept. of Education 42 (37) 49 (19) 4 (12) 95 (24)
Donations 6 (5) 15 (6) 5 (16) 26 (6)
Dept. of Health 4 (4) 1 (0) 1 (3) 6 (1)
Other6 7 (6) 22 (8) 4 (12) 33 (8)
Local Authorities 1 (1) 5 (2) 0 (0) 6 (2)
Private sector grant 1 (1) 3 (1) 1 (3) 5 (1)
Totals7 112 260 32 404
Rands/month Frequency
< 25 168 (43)
≥ 25 < 50 111 (28)
≥ 50 < 75 25 (6)
≥ 75 92 (23)
Total 396
5 Fee levels applicable to learners aged three years and over.
6 ’Other’ in this instance refers to a source of income which could not readily be classified, e.g. using the facility
for other services, selling vegetables grown on the land surrounding the site etc.
7 Totals may exceed the number of sites in each category (as per Table NC2) as some sites have more then
one source of income.
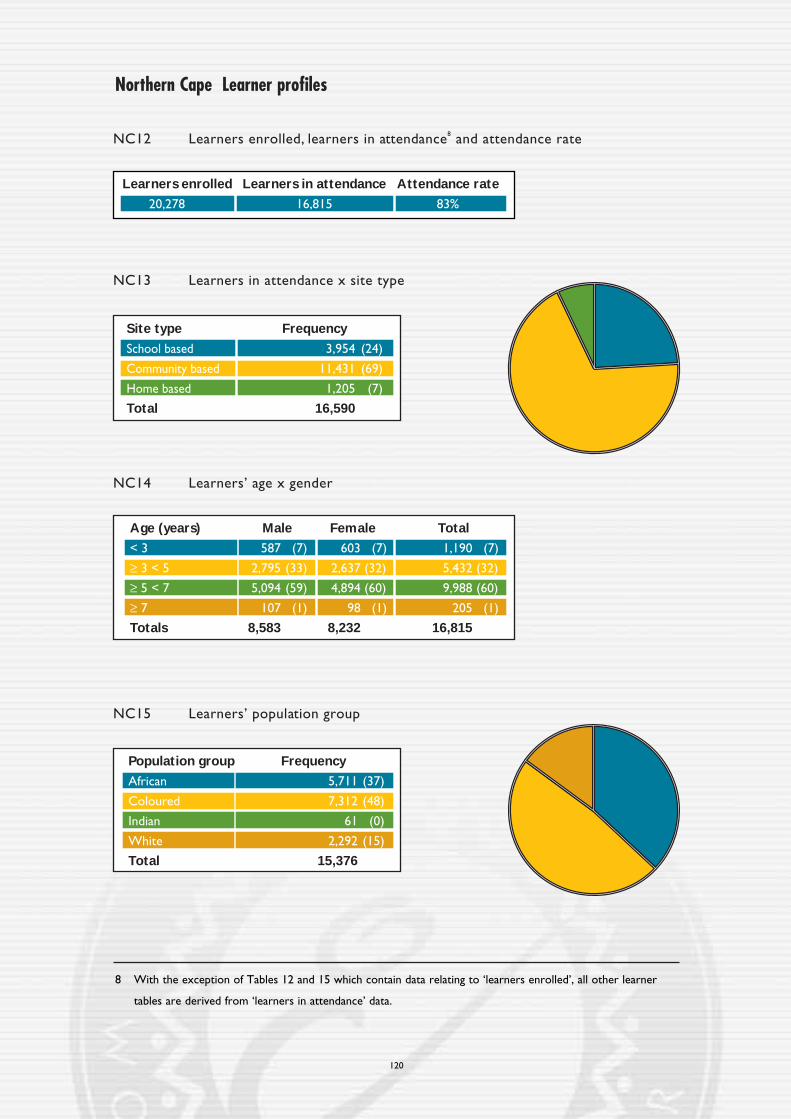
Northern Cape Learner profiles
120
NC13 Learners in attendance x site type
Site type Frequency
School based 3,954 (24)
Community based 11,431 (69)
Home based 1,205 (7)
Total 16,590
NC14 Learners’ age x gender
Age (years) Male Female Total
< 3 587 (7) 603 (7) 1,190 (7)
≥ 3 < 5 2,795 (33) 2,637 (32) 5,432 (32)
≥ 5 < 7 5,094 (59) 4,894 (60) 9,988 (60)
≥ 7 107 (1) 98 (1) 205 (1)
Totals 8,583 8,232 16,815
NC15 Learners’ population group
Population group Frequency
African 5,711 (37)
Coloured 7,312 (48)
Indian 61 (0)
White 2,292 (15)
Total 15,376
NC12 Learners enrolled, learners in attendance8 and attendance rate
Learners enrolled Learners in attendance Attendance rate
20,278 16,815 83%
8 With the exception of Tables 12 and 15 which contain data relating to ‘learners enrolled’, all other learner
tables are derived from ‘learners in attendance’ data.

Northern Cape Learner profiles
121
NC16 Learners’ type of disabilities
Type of disability Frequency
Physical (movement) disability 62 (32)
Severe hearing impairment / Deaf 9 (4)
Severe visual impairment / Blind 9 (4)
Mental disability 17 (9)
Cerebral palsied 19 (10)
Severe behavioural disorder 9 (5)
Autistic 3 (2)
Epilepsy 8 (4)
Multiple disability 35 (18)
Other 24 (12)
Total 195
NC17 Learners’ home languages and languages of instruction
Language Home languages Languages of instruction9
Afrikaans 11,561 (60) 345 (82)
Setswana 4,815 (25) 87 (21)
isiXhosa 1,764 (9) 38 (9)
English 895 (5) 234 (56)
Others 219 (1) 6 (1)
Total 19,254
0
10
20
30
40
50
60
70
80
90
Afrikaans OthersSetswana isiXhosa English
9 The total of these percentages exceeds 100% as in many sites more than one language of instruction is used.
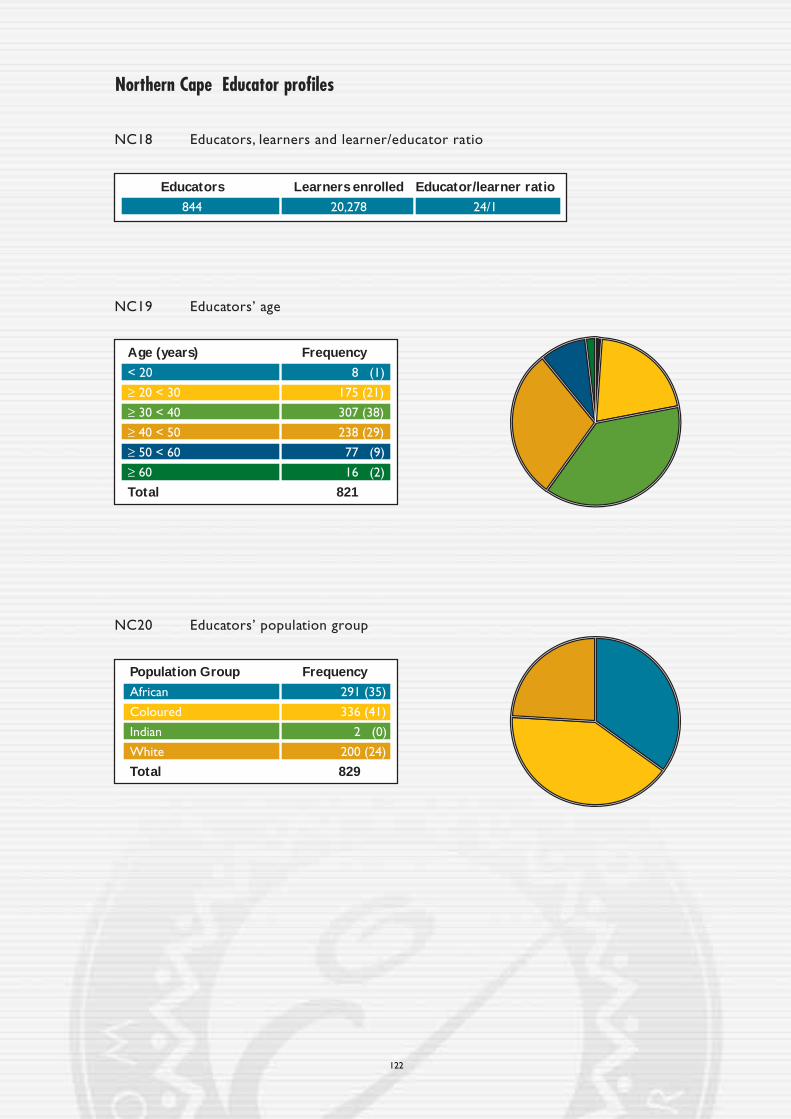
Northern Cape Educator profiles
122
NC18 Educators, learners and learner/educator ratio
Educators Learners enrolled Educator/learner ratio
844 20,278 24/1
NC19 Educators’ age
Age (years) Frequency
< 20 8 (1)
≥ 20 < 30 175 (21)
≥ 30 < 40 307 (38)
≥ 40 < 50 238 (29)
≥ 50 < 60 77 (9)
≥ 60 16 (2)
Total 821
NC20 Educators’ population group
Population Group Frequency
African 291 (35)
Coloured 336 (41)
Indian 2 (0)
White 200 (24)
Total 829

123
Northern Cape Educator profiles
NC21 Educators’ qualifications10
Qualifications Frequency
No training 124 (19)
NGO training 325 (48)
Under-qualified 109 (16)
Qualified 71 (11)
Non-ECD qualification 40 (6)
Total 669
NC22 Educator qualifications x years of ECD experience
Years No training NGO Training Under-qualified Qualified Total
< 2 34 (27) 30 (9) 24 (22) 3 (4) 91 (14)
≥ 2 < 5 44 (36) 106 (33) 25 (23) 15 (21) 190 (30)
≥ 5 < 10 31 (25) 129 (40) 22 (20) 17 (24) 199 (32)
≥ 10 15 (12) 60 (18) 38 (35) 36 (51) 149 (24)
Totals 124 325 109 71 629
0
10
20
30
40
50
60
No training NGO training Under-qualified Qualified Total
10 The qualifications clusters detailed are those currently in use by the Department of Education:
‘Under Qualified’ educators who have received training in technical or teacher training colleges (Matriculation
+2 years)
‘Qualified’ educators who have received university training (Matriculation + 3 years and more)
‘Non-ECD qualification’ a qualification in an area such as nursing, social work etc.

Northern Cape Educator profiles
124
NC23 Educator qualifications x monthly salary
Years No training NGO Training Under-qualified Qualified Total
< 500 65 (57) 144 (49) 5 (5) 3 (4) 217 (37)
≥ 500 < 1,500 35 (31) 126 (43) 25 (24) 16 (23) 202 (35)
≥ 1,500 < 13,000 11 (10) 15 (5) 30 (28) 22 (31) 78 (13)
≥ 3,000 2 (2) 8 (3) 46 (43) 30 (42) 86 (15)
Totals 113 293 106 71 583
0
10
20
30
40
50
60
No training NGO training Under-qualified Qualified Total
NC24 Educator qualifications x population group
Pop. group No training NGO Training Under-qualified Qualified Total
African 40 (32) 162 (50) 10 (9) 7 (10) 219 (35)
Coloured 65 (53) 146 (45) 51 (47) 8 (11) 270 (43)
Indian 0 (0) 0 (0) 2 (2) 0 (0) 2 (0)
White 19 (15) 17 (5) 46 (42) 56 (79) 138 (22)
Totals 124 325 109 71 629
0
10
20
30
40
50
60
70
80
No training NGO training Under-qualified Qualified Total

Northern Cape Indices
125
NC25 Indices
Rating Infrastructure Support Programme Educators
Below Average 12 (3) 31 (7) 33 (8) 146 (17)
Average 298 (71) 328 (78) 300 (71) 575 (68)
Above Average 107 (26) 63 (15) 89 (21) 123 (15)
Totals 417 422 422 844
0
10
20
30
40
50
60
70
80
Infrastructure Support Programme Educators

Northern Cape Salient findings
The following salient points have emerged from the results:
• Although there is a higher than average number of community based ECD sites in the
Northern Cape (61%) when compared to the national average (49%), the Province also
has the largest percentage of sites registered with the Department of Education (63%).
The proportion of sites that have been in operation for more than 5 years (65%) is nearly
identical to the national figure (64%).
• The majority of sites are situated in urban areas or towns (64%) which is significantly
higher than is the case nationally (40%).This correlates with the fact that 82% of sites are
less than 1 km away from the nearest primary school.
• Sites in the Northern Cape compare very favourably with sites nationally in terms of
basic infrastructure: 83% of sites have piped water, flushing toilets and mains electricity
(the national figure is 53%).
• The financial base of most sites in the Province is not particularly strong with learners at
nearly two out of every five sites paying less than R25 per month and 24% of parents
contributing to less than 25% of the school fees.
• The number of learners per educator (24:1) is significantly higher than the national
average of 19:1.
• As far as the educators are concerned, the general profile in terms of age, teaching
experience, qualification and monthly salary is very similar to the national profiles.
• With respect to the infrastructure index, the province rates better than the national
norm in that only 3% of its sites are in the ‘below average’ category as opposed to 18%
of the national cohort. The summary indices show that the province conforms, at least
as far as the support, programme and educator indices are concerned, to the national
pattern.
126

Northern ProvinceThis chapter provides a broad overview of ECD provisioning in the Northern Province. The
following results are presented:
• Site profiles.
• Learner profiles.
• Educator profiles.
• Indices: infrastructure, support, programme and educator.
• Salient findings.
127

Northern Province Site profiles
128
NP1 Number of sites
Total number of sites 1,987
% of study population 8.5
NP2 Types of sites1
Site type Frequency
School based 279 (14)
Community based 1,400 (73)
Home based 252 (13)
Total2 1,931
NP3 Geographic location of sites
Location Frequency
Urban (formal)3 200 (10)
Urban (informal) 92 (5)
Rural 1,638 (85)
Total 1,930
1 All figures within the brackets in the tables represent column percentages.
2 Table totals may differ as some cases are invariably lost when two or more variables are cross-tabulated.
3 ‘Urban formal’ ordinary town or city areas with mostly formal dwellings,
‘Urban informal’ ordinary town or city areas with predominantly informal dwellings,
‘Rural’ villages, rural resettlement areas, commercial farms.

Northern Province Site profiles
129
NP5 Availability on site of mains electricity, piped water and flushing toilets
NP4 Distance to nearest primary school
Kilometres4 Frequency
< 1 1,496 (75)
≥ 1 < 3 336 (17)
≥ 3 < 5 92 (5)
≥ 5 58 (3)
Total 1,982
Resources Frequency
Mains electricity, piped water and flushing toilets 276 (14)
Mains electricity and piped water only 426 (22)
Mains electricity and flushing toilets only 21 (1)
Piped water and flushing toilets only 61 (3)
Mains electricity only 88 (5)
Piped water only 870 (44)
Flushing toilets only 4 (0)
None of these resources 218 (11)
Total 1,964
88
4870
276
426
• None of these resources - 218
61
Mains electricity
Piped water Flushing toilets
21
4 < less than,
≥ greater than or equal to.

Northern Province Site profiles
130
NP6 Hours of operation
Hours Frequency
< 5 31 (2)
≥ 5 < 10 1,739 (90)
≥ 10 165 (8)
Total 1,935
NP7 Years providing ECD services
Years Frequency
< 1 110 (6)
≥ 1 < 3 221 (11)
≥ 3 < 5 463 (24)
≥ 5 1,155 (59)
Total 1,949
NP8 Registration
Registered with Frequency
Department of Education 704 (48)
Department of Welfare 628 (43)
Local Authority 90 (6)
Other 52 (3)
Total 1,474

Northern Province Site profiles
131
NP11 Sources of income x site type
NP9 Monthly fee levels5
NP10 Fee payment rates
Payment rate Frequency
0 – 25% 521 (27)
26 – 50% 550 (29)
51 – 75% 450 (24)
76 – 100% 381 (20)
Total 1,902
Source School Community Home Total
Fees only 89 (38) 447 (37) 123 (54) 659 (40)
Fundraising 10 (4) 70 (6) 17 (7) 97 (6)
Dept. of Welfare 21 (9) 304 (26) 34 (15) 359 (22)
Dept. of Education 67 (29) 107 (9) 2 (1) 176 (11)
Donations 11 (5) 77 (6) 18 (8) 106 (6)
Dept. of Health 7 (3) 36 (3) 2 (1) 45 (3)
Other6 6 (3) 36 (3) 6 (3) 48 (3)
Local Authorities 16 (7) 82 (7) 13 (6) 111 (6)
Private sector grant 5 (2) 35 (3) 11 (5) 51 (3)
Totals7 232 1,194 226 1,652
Rands/month Frequency
< 25 981 (52)
≥ 25 < 50 586 (31)
≥ 50 < 75 162 (9)
≥ 75 158 (8)
Total 1,887
5 Fee levels applicable to learners aged three years and over.
6 ’Other’ in this instance refers to a source of income which could not readily be classified, e.g. using the facility
for other services, selling vegetables grown on the land surrounding the site etc.
7 Totals may exceed the number of sites in each category (as per Table NP2) as some sites have more then one
source of income.
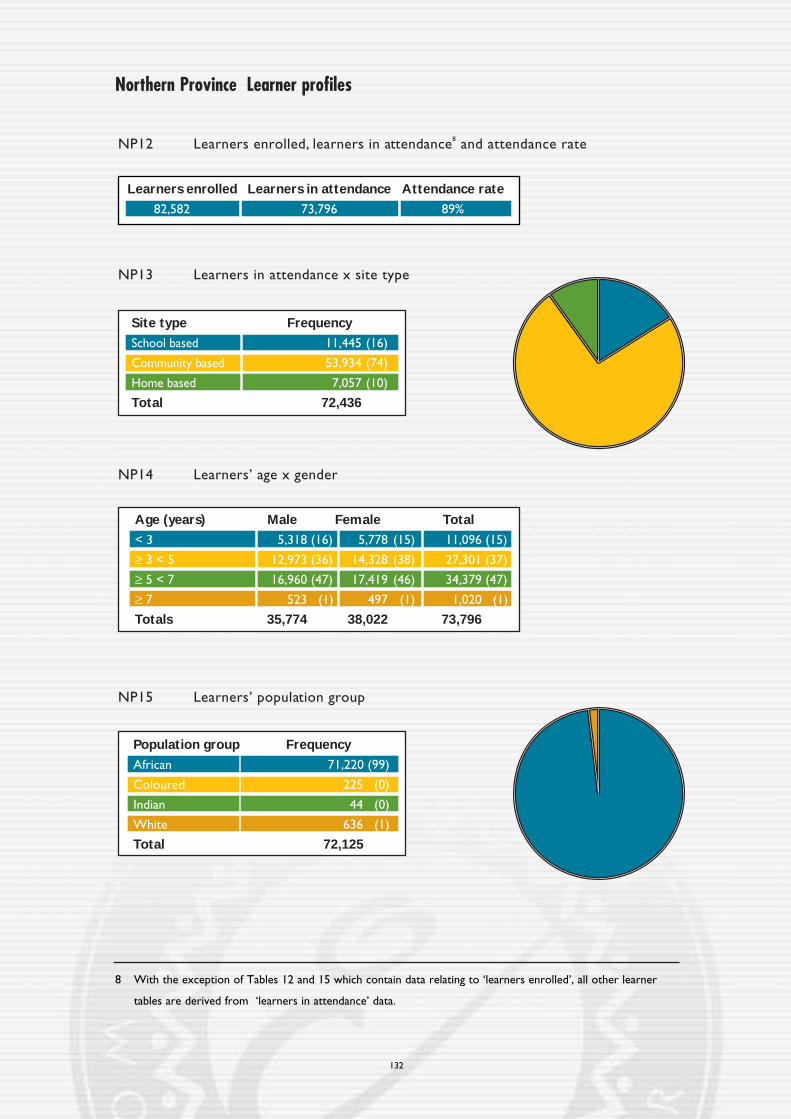
Northern Province Learner profiles
132
NP13 Learners in attendance x site type
Site type Frequency
School based 11,445 (16)
Community based 53,934 (74)
Home based 7,057 (10)
Total 72,436
NP14 Learners’ age x gender
Age (years) Male Female Total
< 3 5,318 (16) 5,778 (15) 11,096 (15)
≥ 3 < 5 12,973 (36) 14,328 (38) 27,301 (37)
≥ 5 < 7 16,960 (47) 17,419 (46) 34,379 (47)
≥ 7 523 (1) 497 (1) 1,020 (1)
Totals 35,774 38,022 73,796
NP15 Learners’ population group
Population group Frequency
African 71,220 (99)
Coloured 225 (0)
Indian 44 (0)
White 636 (1)
Total 72,125
NP12 Learners enrolled, learners in attendance8 and attendance rate
Learners enrolled Learners in attendance Attendance rate
82,582 73,796 89%
8 With the exception of Tables 12 and 15 which contain data relating to ‘learners enrolled’, all other learner
tables are derived from ‘learners in attendance’ data.

Northern Province Learner profiles
133
NP16 Learners’ type of disabilities
NP17 Learners’ home languages and languages of instruction
Type of disability Frequency
Physical (movement) disability 169 (15)
Severe hearing impairment / Deaf 124 (11)
Severe visual impairment / Blind 234 (20)
Mental disability 353 (30)
Cerebral palsied 50 (4)
Severe behavioural disorder 51 (4)
Autistic 17 (2)
Epilepsy 49 (4)
Multiple disability 64 (6)
Other 52 (4)
Total 1,163
Sepedi Xitsonga Tshivenda Sesotho Afrikaans isiNdebele English Other0
10
20
30
40
50
60
70
80
90
100
Language Home languages Languages of instruction9
Sepedi 47,285 (59) 1,194 (60)
Xitsonga 15,736 (20) 383 (19)
Tshivenda 9,906 (12) 284 (14)
Sesotho 3,141 (4) 99 (5)
Afrikaans 897 (1) 44 (2)
isiNdebele 725 (1) 6 (0)
English 647 (1) 1,835 (92)
Others 1,500 (2) 26 (1)
Total 79,837
9 The total of these percentages exceeds 100% as in many sites more than one language of instruction is used.
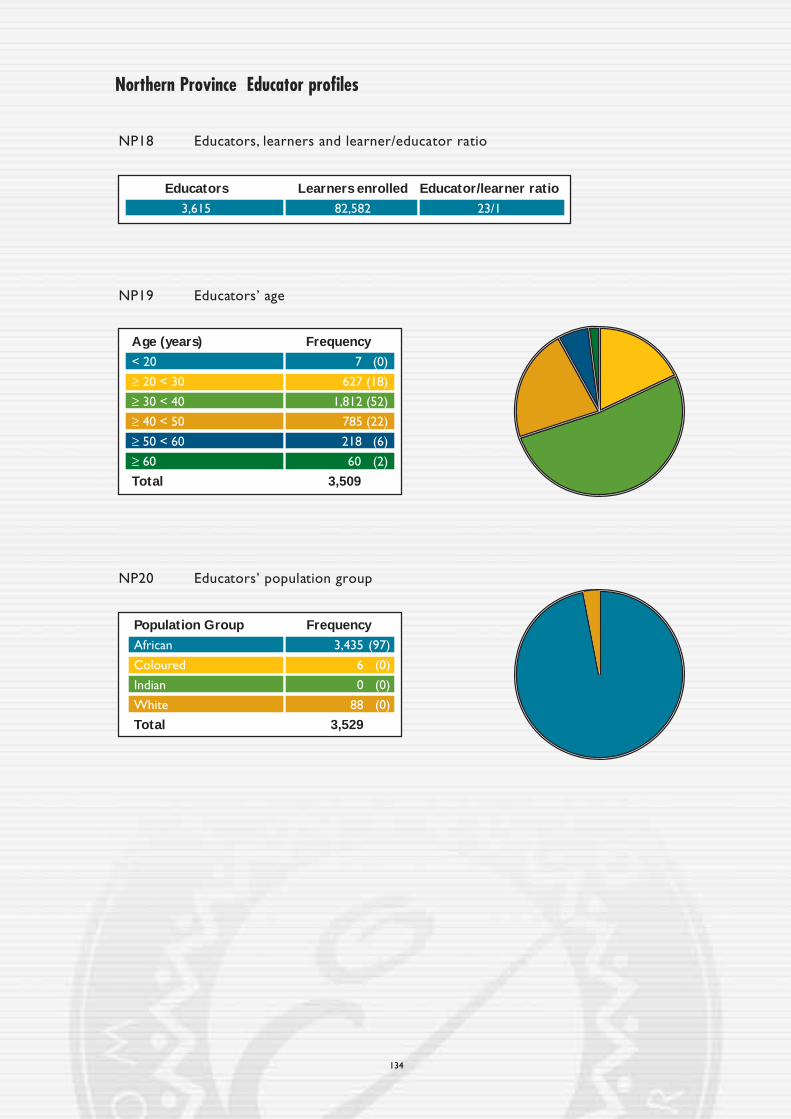
Northern Province Educator profiles
134
NP18 Educators, learners and learner/educator ratio
Educators Learners enrolled Educator/learner ratio
3,615 82,582 23/1
NP19 Educators’ age
Age (years) Frequency
< 20 7 (0)
≥ 20 < 30 627 (18)
≥ 30 < 40 1,812 (52)
≥ 40 < 50 785 (22)
≥ 50 < 60 218 (6)
≥ 60 60 (2)
Total 3,509
NP20 Educators’ population group
Population Group Frequency
African 3,435 (97)
Coloured 6 (0)
Indian 0 (0)
White 88 (0)
Total 3,529
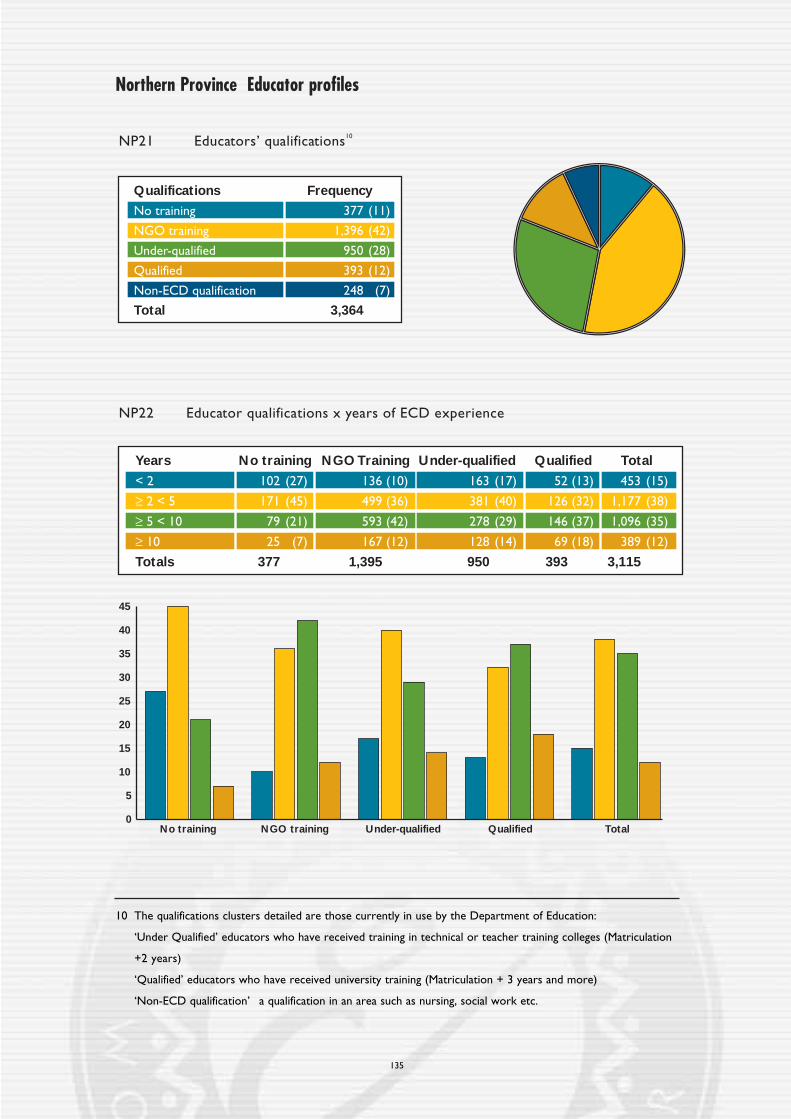
Northern Province Educator profiles
135
NP21 Educators’ qualifications10
Qualifications Frequency
No training 377 (11)
NGO training 1,396 (42)
Under-qualified 950 (28)
Qualified 393 (12)
Non-ECD qualification 248 (7)
Total 3,364
NP22 Educator qualifications x years of ECD experience
Years No training NGO Training Under-qualified Qualified Total
< 2 102 (27) 136 (10) 163 (17) 52 (13) 453 (15)
≥ 2 < 5 171 (45) 499 (36) 381 (40) 126 (32) 1,177 (38)
≥ 5 < 10 79 (21) 593 (42) 278 (29) 146 (37) 1,096 (35)
≥ 10 25 (7) 167 (12) 128 (14) 69 (18) 389 (12)
Totals 377 1,395 950 393 3,115
No training NGO training Under-qualified Qualified Total0
5
10
15
20
25
30
35
40
45
10 The qualifications clusters detailed are those currently in use by the Department of Education:
‘Under Qualified’ educators who have received training in technical or teacher training colleges (Matriculation
+2 years)
‘Qualified’ educators who have received university training (Matriculation + 3 years and more)
‘Non-ECD qualification’ a qualification in an area such as nursing, social work etc.

Northern Province Educator profiles
136
NP23 Educator qualifications x monthly salary
Rands/month No training NGO Training Under-qualified Qualified Total
< 500 274 (90) 1,006 (85) 513 (63) 187 (51) 1,980 (74)
≥ 500 < 1,500 18 (6) 143 (12) 117 (14) 62 (17) 340 (13)
≥ 1,500 < 3,000 5 (2) 26 (2) 66 (8) 52 (14) 149 (6)
≥ 3,000 7 (2) 8 (1) 117 (14) 64 (18) 196 (7)
Totals 304 1,183 813 365 2,665
No training NGO training Under-qualified Qualified Total0
10
20
30
40
50
60
70
80
90
NP24 Educator qualifications x population group
Pop. group No training NGO Training Under-qualified Qualified Total
African 359 (96) 1,369 (100) 904 (98) 360 (93) 2,992 (98)
Coloured 0 (0) 2 (0) 1 (0) 1 (0) 4 (0)
Indian 0 (0) 0 (0) 0 (0) 0 (0) 0 (0)
White 14 (4) 5 (0) 18 (2) 25 (7) 62 (2)
Totals 373 1,376 923 386 3,058
No training NGO training Under-qualified Qualified Total0
10
20
30
40
50
60
70
80
90
100
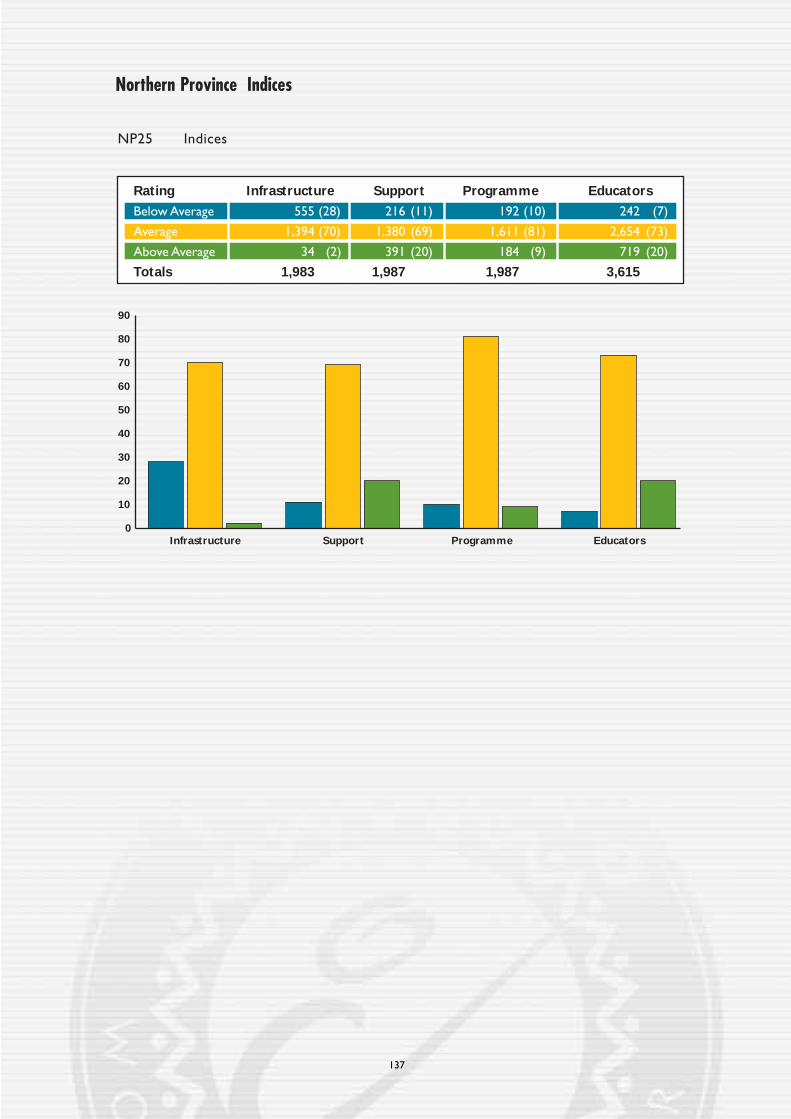
137
Northern Province Indices
NP25 Indices
Rating Infrastructure Support Programme Educators
Below Average 555 (28) 216 (11) 192 (10) 242 (7)
Average 1,394 (70) 1,380 (69) 1,611 (81) 2,654 (73)
Above Average 34 (2) 391 (20) 184 (9) 719 (20)
Totals 1,983 1,987 1,987 3,615
Infrastructure Support Programme Educators0
10
20
30
40
50
60
70
80
90

Northern Province Salient findings
The following salient points have emerged from the results:
• There are significantly more community based ECD sites in the Northern Province (73%)
than the national average (49%). 59% of sites have been operating for more than 5 years
which is just below the national average of 63%.
• A very high proportion (85%) of sites in the province are located in rural areas.
Surprisingly this fact is not reflected in large distances between such facilities and the
nearest primary school. Exactly three quarters of sites are within one km of the nearest
primary school which is higher than the national average (72%).
• The Northern Province is one of the poorest provinces in the country.This is reflected
in various ways in the Audit. A very telling statistic is the fact that a mere 14% of sites in
the province have piped water, flushing toilets and mains electricity (the national figure is
53%).
• The financial base of most of the sites is precarious. Nearly half of all learners pay less
than R25 fees per month, while 27% of parents contribute to less than 25% of the school
fees.
• The ratio of learners per educator (23:1) is one of the highest in the country (the national
average is 19:1).
• The human resource base in the province is arguably one of the weakest in the country:
the age distribution shows a much younger profile when compared with the national
profile: 30% of the educators are older than 40 years compared to the national
proportion of 39%. Many more educators in the province are under-qualified (28%
compared to the national average of 15%) and also have less teaching experience (47%
have more than 5 years compared to 55% nationally).They are also the worst paid: 74%
receive less than R500 per month (the national figure is 44%).
• The infrastructure index confirms the general picture that has emerged: ECD facilities in
the Northern Province are less well resourced (28% are rated ‘below average’ compared
to 18% nationally).The other three indices reveal patterns that are similar to the national
averages.
138
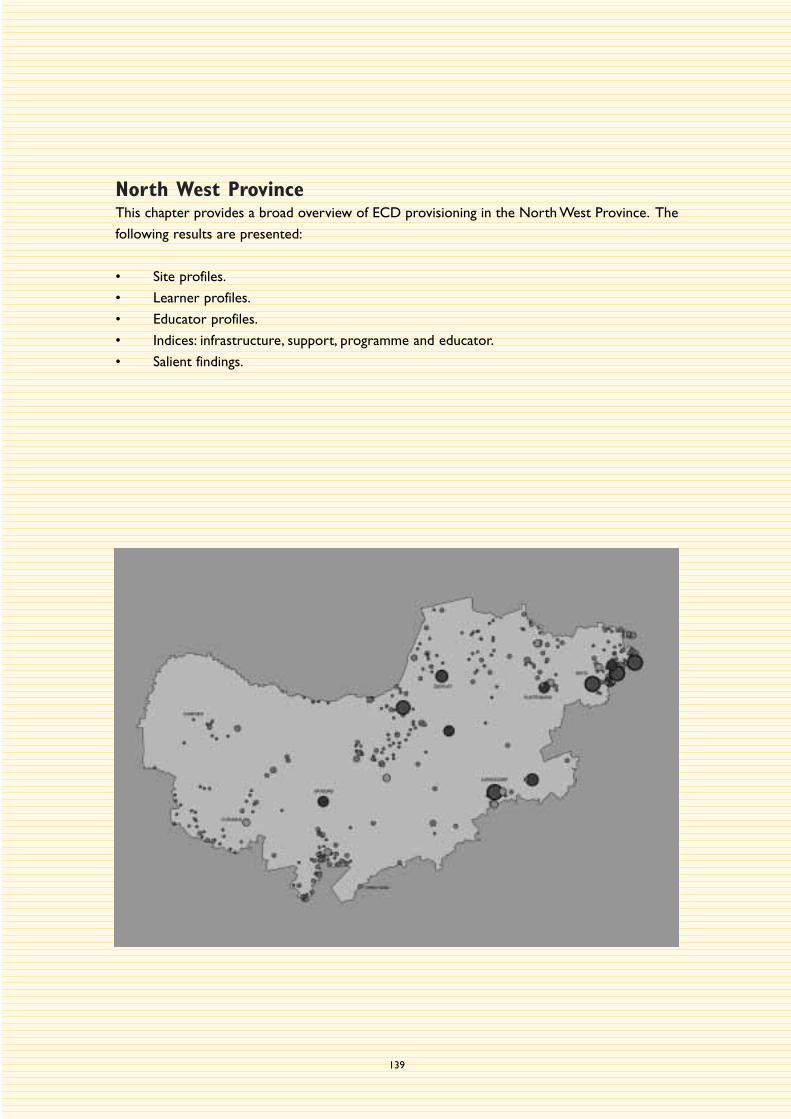
139
North West ProvinceThis chapter provides a broad overview of ECD provisioning in the North West Province. The
following results are presented:
• Site profiles.
• Learner profiles.
• Educator profiles.
• Indices: infrastructure, support, programme and educator.
• Salient findings.

North West Province Site profiles
140
NW1 Number of sites
Total number of sites 1,174
% of study population 4.9
NW2 Types of sites1
Site type Frequency
School based 35 (3)
Community based 867 (76)
Home based 247 (21)
Total2 1,149
NW3 Geographic location of sites
Location Frequency
Urban (formal)3 253 (22)
Urban (informal) 106 (9)
Rural 786 (69)
Total 1,145
1 All figures within the brackets in the tables represent column percentages.
2 Table totals may differ as some cases are invariably lost when two or more variables are cross-tabulated.
3 ‘Urban formal’ ordinary town or city areas with mostly formal dwellings,
‘Urban informal’ ordinary town or city areas with predominantly informal dwellings,
‘Rural’ villages, rural resettlement areas, commercial farms.

North West Province Site profiles
141
NW5 Availability on site of mains electricity, piped water and flushing toilets
NW4 Distance to nearest primary school
Kilometres4 Frequency
< 1 832 (71)
≥ 1 < 3 237 (20)
≥ 3 < 5 76 (7)
≥ 5 29 (2)
Total 1,174
Resources Frequency
Mains electricity, piped water and flushing toilets 418 (36)
Mains electricity and piped water only 263 (22)
Mains electricity and flushing toilets only 2 (0)
Piped water and flushing toilets only 50 (4)
Mains electricity only 8 (1)
Piped water only 404 (35)
Flushing toilets only 2 (0)
None of these resources 19 (2)
Total 1,166
8
2404
418
263
• None of these resources - 19
50
Mains electricity
Piped water Flushing toilets
2
4 < less than,
≥ greater than or equal to.

North West Province Site profiles
142
NW6 Hours of operation
Hours Frequency
< 5 23 (2)
≥ 5 < 10 997 (87)
≥ 10 129 (11)
Total 1,149
NW7 Years providing ECD services
Years Frequency
< 1 34 (3)
≥ 1 < 3 60 (5)
≥ 3 < 5 130 (11)
≥ 5 939 (81)
Total 1,163
NW8 Registration
Registered with Frequency
Department of Education 508 (58)
Department of Welfare 261 (30)
Local Authority 60 (7)
Other 45 (5)
Total 874

North West Province Site profiles
143
NW11 Sources of income x site type
NW9 Monthly fee levels5
NW10 Fee payment rates
Payment rate Frequency
0 – 25% 244 (21)
26 – 50% 420 (36)
51 – 75% 272 (24)
76 – 100% 225 (19)
Total 1,161
Source School Community Home Total
Fees only 9 (21) 255 (26) 121 (46) 385 (30)
Fundraising 10 (23) 146 (15) 35 (13) 191 (15)
Dept. of Welfare 3 (7) 99 (10) 40 (15) 142 (11)
Dept. of Education 8 (19) 125 (13) 2 (1) 135 (10)
Donations 3 (7) 66 (7) 14 (5) 83 (7)
Dept. of Health 2 (5) 15 (1) 0 (0) 17 (1)
Other6 6 (14) 210 (21) 41 (16) 257 (20)
Local Authorities 1 (2) 53 (5) 7 (3) 61 (5)
Private sector grant 1 (2) 15 (1) 2 (1) 18 (1)
Totals7 43 984 262 1,289
Rands/month Frequency
< 25 353 (32)
≥ 25 < 50 380 (34)
≥ 50 < 75 203 (18)
≥ 75 180 (16)
Total 1,116
5 Fee levels applicable to learners aged three years and over.
6 ’Other’ in this instance refers to a source of income which could not readily be classified, e.g. using the facility
for other services, selling vegetables grown on the land surrounding the site etc.
7 Totals may exceed the number of sites in each category (as per Table NW2) as some sites have more then
one source of income.

North West Province Learner profiles
144
NW13 Learners in attendance x site type
Site type Frequency
School based 1,508 (3)
Community based 35,843 (80)
Home based 7,777 (17)
Total 45,128
NW14 Learners’ age x gender
Age (years) Male Female Total
< 3 2,017 (9) 1,907 (8) 3,924 (9)
≥ 3 < 5 7,219 (32) 7,397 (32) 14,616 (32)
≥ 5 < 7 12,749 (56) 13,373 (58) 26,122 (57)
≥ 7 649 (3) 556 (2) 1,205 (2)
Totals 22,634 23,233 45,867
NW15 Learners’ population group
Population group Frequency
African 40,115 (91)
Coloured 346 (1)
Indian 97 (0)
White 3,657 (8)
Total 44,215
NW12 Learners enrolled, learners in attendance8 and attendance rate
Learners enrolled Learners in attendance Attendance rate
53,554 45,867 86%
8 With the exception of Tables 12 and 15 which contain data relating to ‘learners enrolled’, all other learner
tables are derived from ‘learners in attendance’ data.
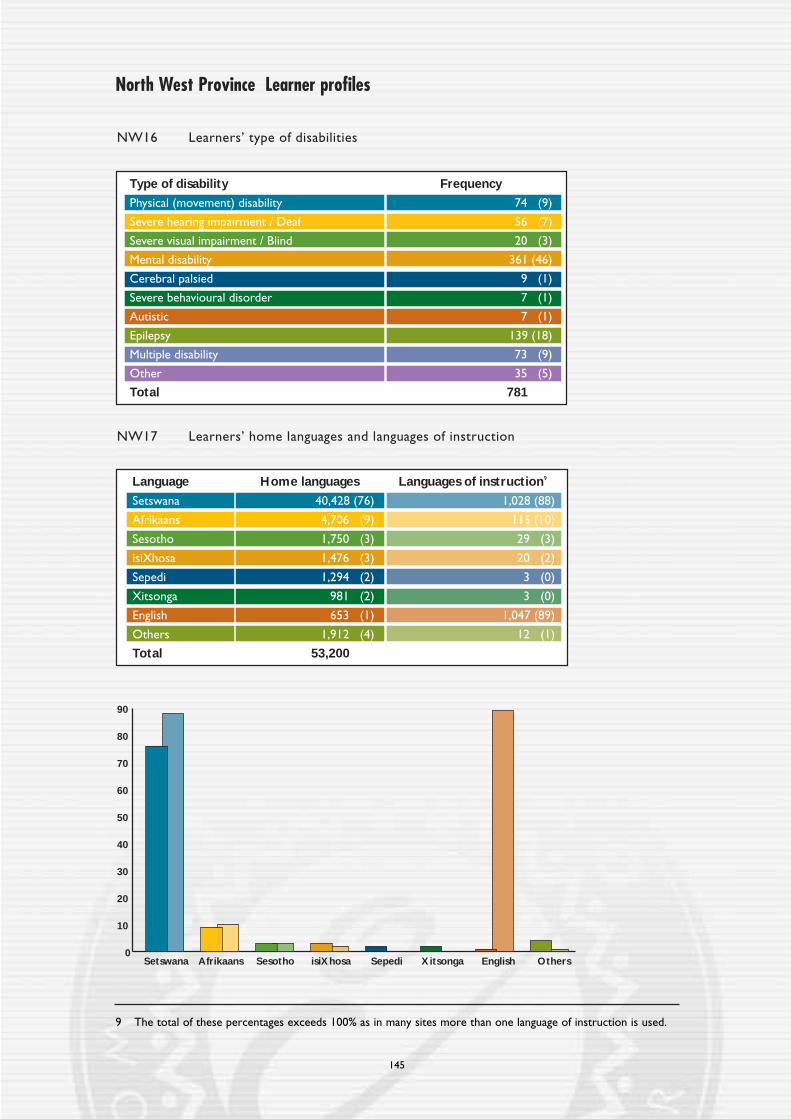
145
North West Province Learner profiles
NW16 Learners’ type of disabilities
NW17 Learners’ home languages and languages of instruction
Type of disability Frequency
Physical (movement) disability 74 (9)
Severe hearing impairment / Deaf 56 (7)
Severe visual impairment / Blind 20 (3)
Mental disability 361 (46)
Cerebral palsied 9 (1)
Severe behavioural disorder 7 (1)
Autistic 7 (1)
Epilepsy 139 (18)
Multiple disability 73 (9)
Other 35 (5)
Total 781
Setswana0
10
20
30
40
50
60
70
80
90
Afrikaans Sesotho isiXhosa Sepedi Xitsonga English Others
Language Home languages Languages of instruction9
Setswana 40,428 (76) 1,028 (88)
Afrikaans 4,706 (9) 116 (10)
Sesotho 1,750 (3) 29 (3)
isiXhosa 1,476 (3) 20 (2)
Sepedi 1,294 (2) 3 (0)
Xitsonga 981 (2) 3 (0)
English 653 (1) 1,047 (89)
Others 1,912 (4) 12 (1)
Total 53,200
9 The total of these percentages exceeds 100% as in many sites more than one language of instruction is used.

North West Province Educator profiles
146
NW18 Educators, learners and learner/educator ratio
Educators Learners enrolled Educator/learner ratio
2,910 53,554 18/1
NW19 Educators’ age
Age (years) Frequency
< 20 17 (1)
≥ 20 < 30 382(14)
≥ 30 < 40 1,168(41)
≥ 40 < 50 829(29)
≥ 50 < 60 343(12)
≥ 60 86 (3)
Total 2,825
NW20 Educators’ population group
Population Group Frequency
African 2,553 (89)
Coloured 22 (1)
Indian 10 (0)
White 285 (10)
Total 2,870
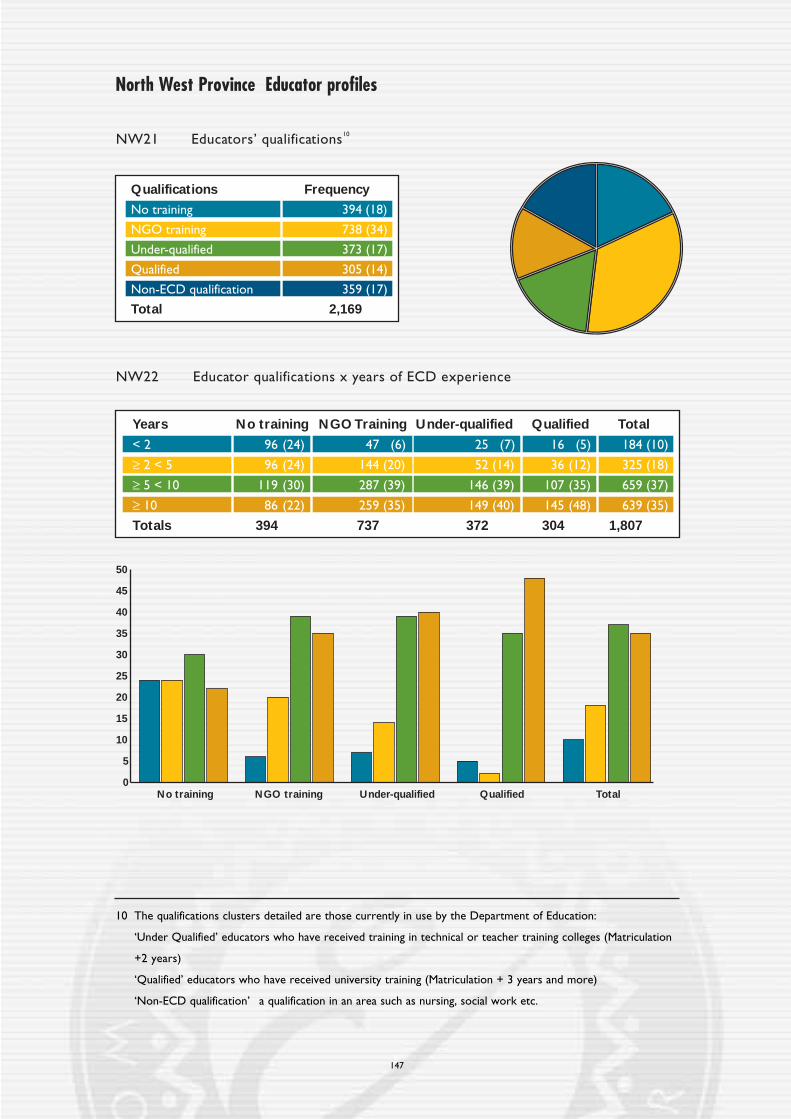
North West Province Educator profiles
147
Qualifications Frequency
No training 394 (18)
NGO training 738 (34)
Under-qualified 373 (17)
Qualified 305 (14)
Non-ECD qualification 359 (17)
Total 2,169
NW22 Educator qualifications x years of ECD experience
Years No training NGO Training Under-qualified Qualified Total
< 2 96 (24) 47 (6) 25 (7) 16 (5) 184 (10)
≥ 2 < 5 96 (24) 144 (20) 52 (14) 36 (12) 325 (18)
≥ 5 < 10 119 (30) 287 (39) 146 (39) 107 (35) 659 (37)
≥ 10 86 (22) 259 (35) 149 (40) 145 (48) 639 (35)
Totals 394 737 372 304 1,807
0
5
10
15
20
25
30
35
40
45
50
No training NGO training Under-qualified Qualified Total
NW21 Educators’ qualifications10
10 The qualifications clusters detailed are those currently in use by the Department of Education:
‘Under Qualified’ educators who have received training in technical or teacher training colleges (Matriculation
+2 years)
‘Qualified’ educators who have received university training (Matriculation + 3 years and more)
‘Non-ECD qualification’ a qualification in an area such as nursing, social work etc.

North West Province Educator profiles
148
NW23 Educator qualifications x monthly salary
Rands/month No training NGO Training Under-qualified Qualified Total
< 500 219 (58) 359 (50) 86 (24) 19 (7) 683 (39)
≥ 500 < 1,500 76 (20) 181 (25) 86 (24) 46 (16) 389 (22)
≥ 1,500 < 3,000 68 (18) 163 (23) 83 (24) 76 (26) 390 (22)
≥ 3,000 15 (4) 13 (2) 97 (28) 149 (51) 274 (16)
Totals 378 716 352 290 1,736
0
10
20
30
40
50
60
No training NGO training Under-qualified Qualified Total
NW24 Educator qualifications x population group
Pop. group No training NGO Training Under-qualified Qualified Total
African 372 (94) 714 (98) 329 (89) 153 (51) 1,568 (87)
Coloured 0 (0) 6 (1) 1 (0) 2 (1) 9 (1)
Indian 2 (1) 0 (0) 2 (1) 0 (0) 4 (0)
White 20 (5) 8 (1) 37 (10) 144 (48) 209 (12)
Totals 394 728 369 299 1,790
0
10
20
30
40
50
60
70
80
90
100
No training NGO training Under-qualified Qualified Total
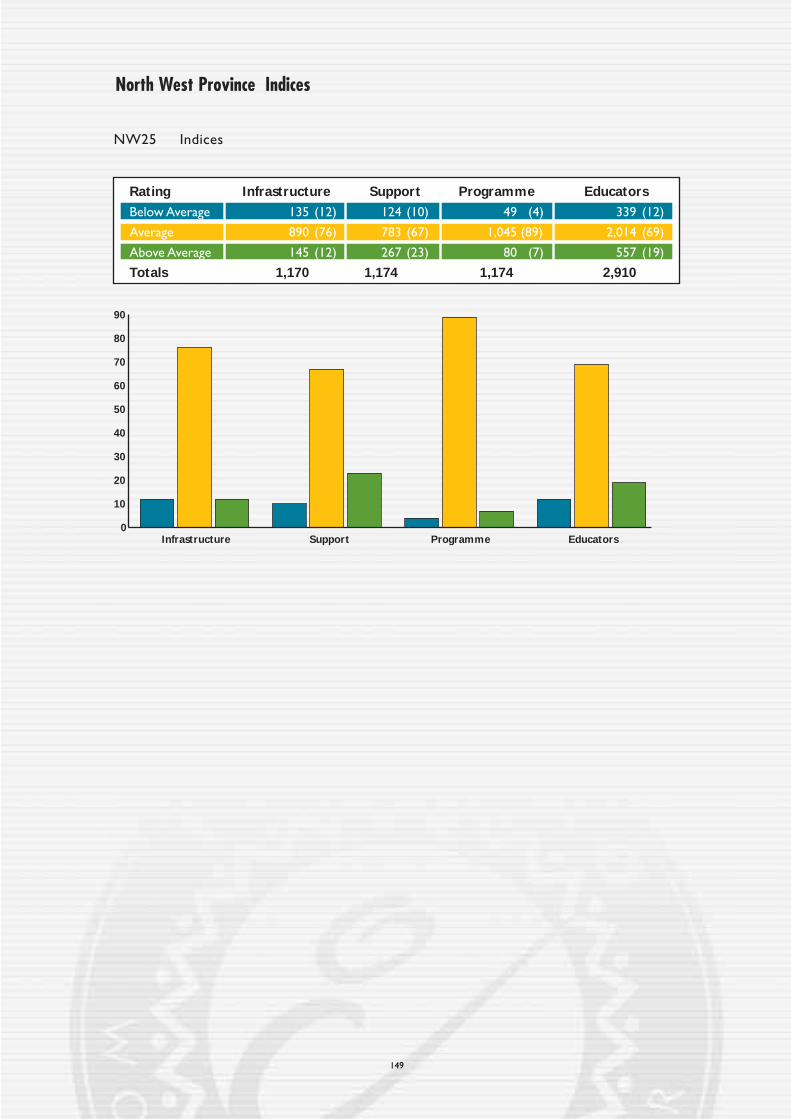
North West Province Indices
149
NW25 Indices
Rating Infrastructure Support Programme Educators
Below Average 135 (12) 124 (10) 49 (4) 339 (12)
Average 890 (76) 783 (67) 1,045 (89) 2,014 (69)
Above Average 145 (12) 267 (23) 80 (7) 557 (19)
Totals 1,170 1,174 1,174 2,910
0
10
20
30
40
50
60
70
80
90
Infrastructure Support Programme Educators

North West Province Salient findings
The following salient points have emerged from the results:
• There are significantly more community based ECD sites in the North West Province
(76%) than the national average (49%).The proportion of sites in existence for more than
5 years (81%) is also significantly higher than the national average (63%).
• Many more sites in the province are based in rural areas (69%) than is the case nationally
(40%). Somewhat surprisingly, the large majority of sites (71%) are within 1 km of a
primary school.
• Sites in the North West Province are much less developed in terms of basic infrastructure
than the national average. Slightly more than a third (36%) of sites have piped water,
flushing toilets and mains electricity. This compares very unfavourably with the national
figure of 53%).
• The financial situation of most sites in the Province compares well with other provinces.
Only 30% of learners pay less than R25 fees per month and 21% of parents contribute to
less than 25% of school fees.
• The average number of learners per educator (18:1) is slightly below the national average
of 19:1.
• As far as the educators are concerned, the age distribution is very similar to the national
profile: 47% of the educators are older than 40 years compared to the national
proportion of 39%. This is also true of the qualification profile of educators in the
Province. However, it is worth pointing out that the proportion of educators with non
ECD qualifications (17%) is more than double that of the national average (7%).They do
get paid better, 61% receiving less than R1500 per month compared to the national
percentage of 74%.
• The summary indices show that ECD provision in the North West Province is very
similar to the national patterns, with no discernable differences emerging.
150

151
Western CapeThis chapter provides a broad overview of ECD provisioning in the Western Cape. The
following results are presented:
• Site profiles.
• Learner profiles.
• Educator profiles.
• Indices: infrastructure, support, programme and educator.
• Salient findings.

Western Cape Site profiles
152
WC1 Number of sites
Total number of sites 2,664
% of study population 11.3
WC2 Types of sites1
Site type Frequency
School based 482 (19)
Community based 1,322 (53)
Home based 698 (28)
Total2 2,502
WC3 Geographic location of sites
Location Frequency
Urban (formal)3 1,973 (76)
Urban (informal) 292 (11)
Rural 343 (13)
Total 2,608
1 All figures within the brackets in the tables represent column percentages.
2 Table totals may differ as some cases are invariably lost when two or more variables are cross-tabulated.
3 ‘Urban formal’ ordinary town or city areas with mostly formal dwellings,
‘Urban informal’ ordinary town or city areas with predominantly informal dwellings,
‘Rural’ villages, rural resettlement areas, commercial farms.

Western Cape Site profiles
153
WC5 Availability on site of mains electricity, piped water and flushing toilets
WC4 Distance to nearest primary school
Kilometres4 Frequency
< 1 1,951 (74)
≥ 1 < 3 491 (19)
≥ 3 < 5 109 (4)
≥ 5 81 (3)
Total 2,632
Resources Frequency
Mains electricity, piped water and flushing toilets 2,393 (93)
Mains electricity and piped water only 46 (2)
Mains electricity and flushing toilets only 31 (1)
Piped water and flushing toilets only 67 (3)
Mains electricity only 4 (0)
Piped water only 29 (1)
Flushing toilets only 1 (0)
None of these resources 2 (0)
Total 2,573
4
129
2,393
46
• None of these resources - 2
67
Mains electricity
Piped water Flushing toilets
31
4 < less than,
≥ greater than or equal to.

Western Cape Site profiles
154
WC6 Hours of operation
Hours Frequency
< 5 395 (16)
≥ 5 < 10 1,197 (47)
≥ 10 943 (37)
Total 2,535
WC7 Years providing ECD services
WC8 Registration
Registered with Frequency
Department of Education 774 (41)
Department of Welfare 799 (43)
Local Authority 198 (10)
Other 105 (6)
Total 1,876

Western Cape Site profiles
155
WC11 Sources of income x site type
WC9 Monthly fee levels5
WC10 Fee payment rates
Payment rate Frequency
0 – 25% 314 (12)
26 – 50% 496 (20)
51 – 75% 451 (18)
76 – 100% 1,264 (50)
Total 2,525
Source School Community Home Total
Fees only 46 (10) 173 (13) 239 (35) 458 (18)
Fundraising 206 (43) 418 (32) 195 (29) 819 (33)
Dept. of Welfare 19 (4) 346 (27) 75 (11) 440 (18)
Dept. of Education 160 (33) 121 (9) 17 (2) 298 (12)
Donations 20 (4) 66 (5) 37 (5) 123 (5)
Dept. of Health 8 (2) 41 (3) 78 (11) 127 (5)
Other6 17 (3) 117 (9) 32 (5) 166 (7)
Local Authorities 2 (0) 24 (2) 4 (1) 30 (1)
Private sector grant 6 (1) 11 (0) 6 (1) 23 (1)
Totals7 484 1,317 683 2,484
Rands/month Frequency
< 25 470 (19)
≥ 25 < 50 640 (25)
≥ 50 < 75 146 (6)
≥ 75 1,252 (50)
Total 2,508
5 Fee levels applicable to learners aged three years and over.
6 ’Other’ in this instance refers to a source of income which could not readily be classified, e.g. using the facility
for other services, selling vegetables grown on the land surrounding the site etc.
7 Totals may exceed the number of sites in each category (as per Table WC2) as some sites have more then
one source of income.

Western Cape Learner profiles
156
WC13 Learners in attendance x site type
Site type Frequency
School based 23,200 (20)
Community based 71,817 (62)
Home based 21,052 (18)
Total 116,069
WC14 Learners’ age x gender
Age (years) Male Female Total
< 3 11,541 (19) 11,024 (18) 22,565 (18)
≥ 3 < 5 20,111 (32) 19,790 (33) 39,901 (33)
≥ 5 < 7 28,855 (47) 28,634 (47) 57,489 (47)
≥ 7 1,493 (2) 1,402 (2) 2,895 (2)
Totals 62,000 60,850 122,850
WC15 Learners’ population group
Population group Frequency
African 34,055 (29)
Coloured 61,520 (52)
Indian 1,146 (1)
White 21,527 (18)
Total 118,248
WC12 Learners enrolled, learners in attendance8 and attendance rate
Learners enrolled Learners in attendance Attendance rate
143,016 122,850 86%
8 With the exception of Tables 12 and 15 which contain data relating to ‘learners enrolled’, all other learner
tables are derived from ‘learners in attendance’ data.

Western Cape Learner profiles
157
WC16 Learners’ type of disabilities
WC17 Learners’ home languages and languages of instruction
Type of disability Frequency
Physical (movement) disability 353 (15)
Severe hearing impairment / Deaf 193 (8)
Severe visual impairment / Blind 87 (4)
Mental disability 702 (30)
Cerebral palsied 203 (9)
Severe behavioural disorder 92 (4)
Autistic 101 (4)
Epilepsy 79 (4)
Multiple disability 311 (13)
Other 210 (9)
Total 2,331
Afrikaans English OthersisiXhosa0
10
20
30
40
50
60
70
Language Home languages Languages of instruction9
Afrikaans 60,221 (42) 1,647 (62)
isiXhosa 41,402 (29) 684 (26)
English 39,626 (28) 1,833 (69)
Others 1,509 (1) 35 (1)
Total 142,758
9 The total of these percentages exceeds 100% as in many sites more than one language of instruction is used.

Western Cape Educator profiles
158
WC18 Educators, learners and learner/educator ratio
Educators Learners enrolled Educator/learner ratio
8,503 143,016 17/1
WC19 Educators’ age
Age (years) Frequency
< 20 125 (1)
≥ 20 < 30 2,214 (27)
≥ 30 < 40 2,715 (33)
≥ 40 < 50 2,081 (25)
≥ 50 < 60 1,034 (12)
≥ 60 199 (2)
Total 8,368
WC20 Educators’ population group
Population Group Frequency
African 2,194 (26)
Coloured 4,344 (52)
Indian 38 (0)
White 1,825 (22)
Total 8,401
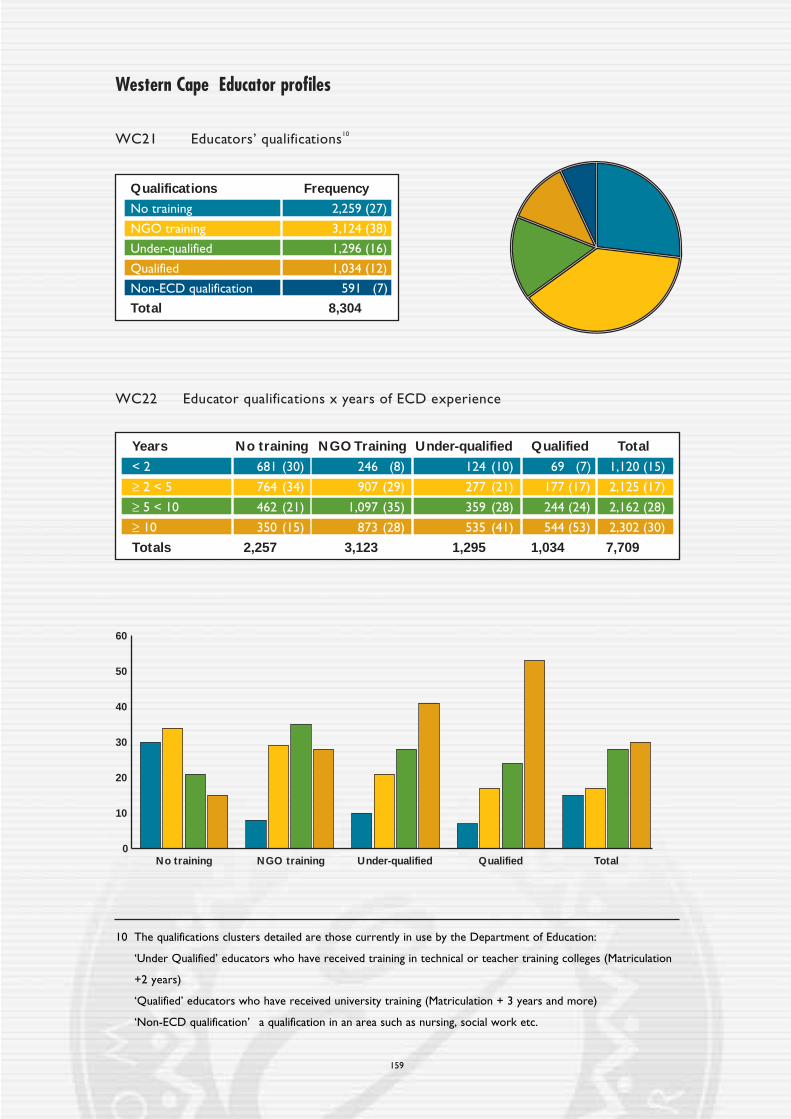
Western Cape Educator profiles
159
WC21 Educators’ qualifications10
Qualifications Frequency
No training 2,259 (27)
NGO training 3,124 (38)
Under-qualified 1,296 (16)
Qualified 1,034 (12)
Non-ECD qualification 591 (7)
Total 8,304
WC22 Educator qualifications x years of ECD experience
Years No training NGO Training Under-qualified Qualified Total
< 2 681 (30) 246 (8) 124 (10) 69 (7) 1,120 (15)
≥ 2 < 5 764 (34) 907 (29) 277 (21) 177 (17) 2,125 (17)
≥ 5 < 10 462 (21) 1,097 (35) 359 (28) 244 (24) 2,162 (28)
≥ 10 350 (15) 873 (28) 535 (41) 544 (53) 2,302 (30)
Totals 2,257 3,123 1,295 1,034 7,709
No training NGO training Under-qualified Qualified Total0
10
20
30
40
50
60
10 The qualifications clusters detailed are those currently in use by the Department of Education:
‘Under Qualified’ educators who have received training in technical or teacher training colleges (Matriculation
+2 years)
‘Qualified’ educators who have received university training (Matriculation + 3 years and more)
‘Non-ECD qualification’ a qualification in an area such as nursing, social work etc.
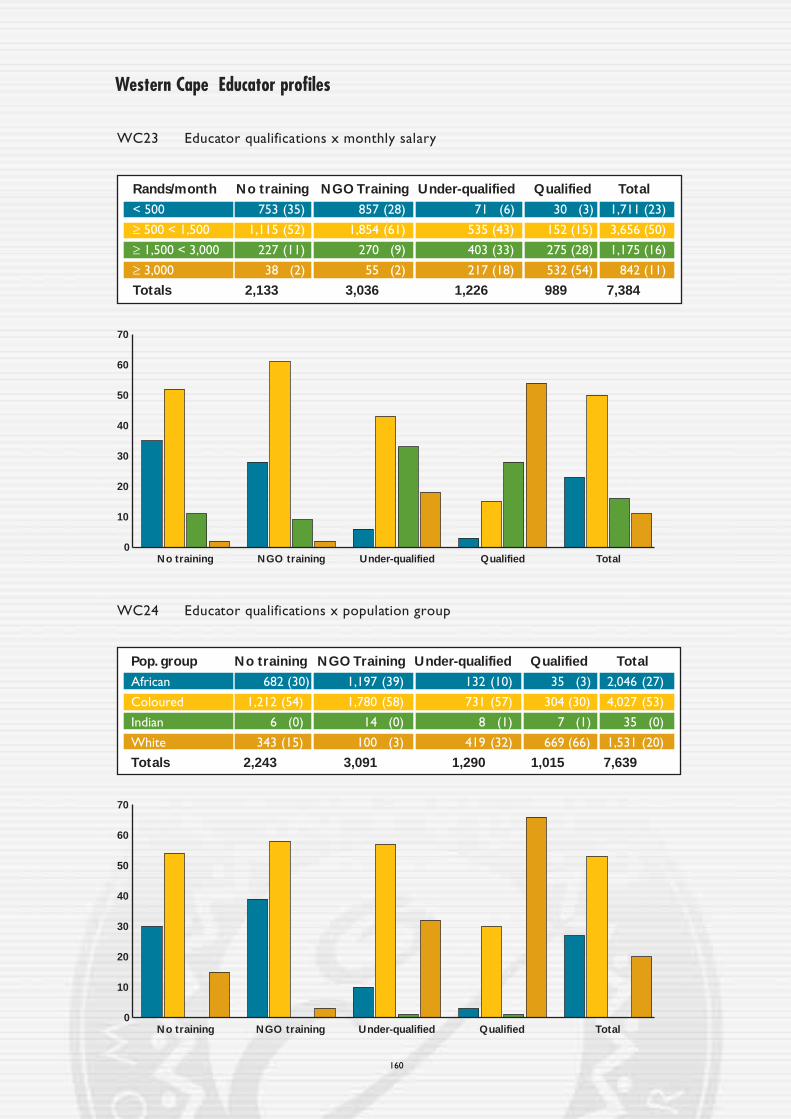
Western Cape Educator profiles
160
WC23 Educator qualifications x monthly salary
Rands/month No training NGO Training Under-qualified Qualified Total
< 500 753 (35) 857 (28) 71 (6) 30 (3) 1,711 (23)
≥ 500 < 1,500 1,115 (52) 1,854 (61) 535 (43) 152 (15) 3,656 (50)
≥ 1,500 < 3,000 227 (11) 270 (9) 403 (33) 275 (28) 1,175 (16)
≥ 3,000 38 (2) 55 (2) 217 (18) 532 (54) 842 (11)
Totals 2,133 3,036 1,226 989 7,384
0
10
20
30
40
50
60
70
No training NGO training Under-qualified Qualified Total
WC24 Educator qualifications x population group
Pop. group No training NGO Training Under-qualified Qualified Total
African 682 (30) 1,197 (39) 132 (10) 35 (3) 2,046 (27)
Coloured 1,212 (54) 1,780 (58) 731 (57) 304 (30) 4,027 (53)
Indian 6 (0) 14 (0) 8 (1) 7 (1) 35 (0)
White 343 (15) 100 (3) 419 (32) 669 (66) 1,531 (20)
Totals 2,243 3,091 1,290 1,015 7,639
No training NGO training Under-qualified Qualified Total0
10
20
30
40
50
60
70
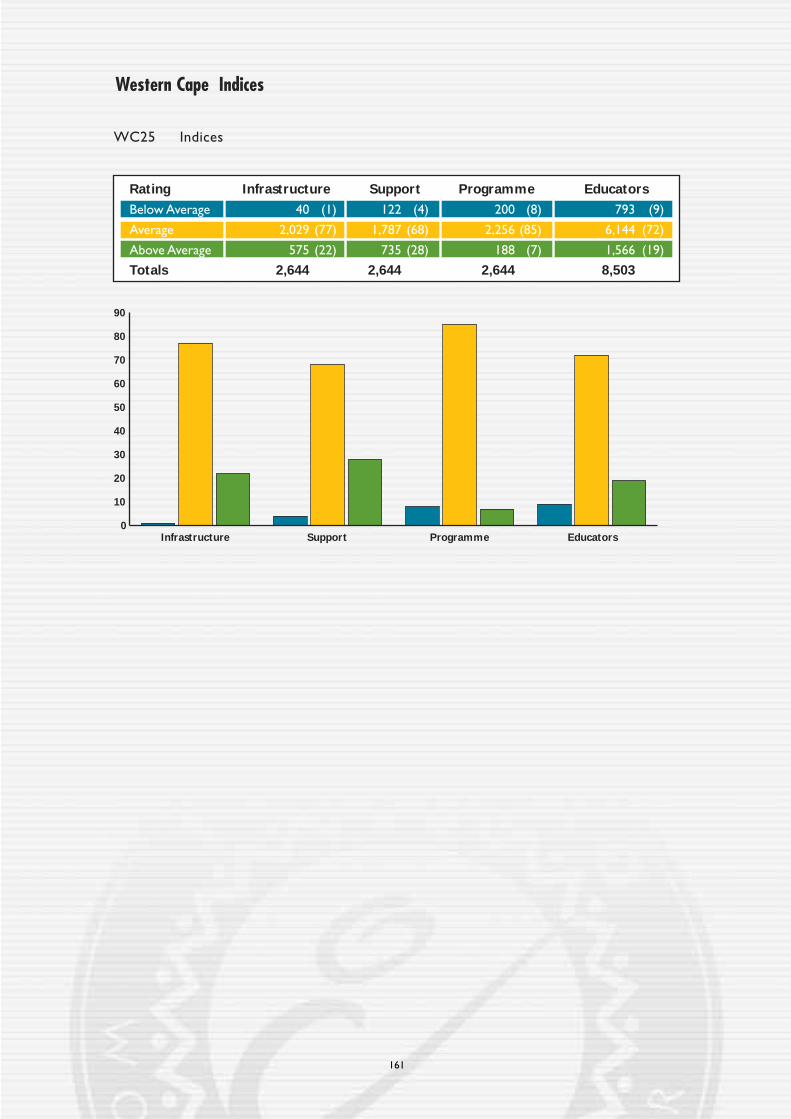
161
Western Cape Indices
WC25 Indices
Rating Infrastructure Support Programme Educators
Below Average 40 (1) 122 (4) 200 (8) 793 (9)
Average 2,029 (77) 1,787 (68) 2,256 (85) 6,144 (72)
Above Average 575 (22) 735 (28) 188 (7) 1,566 (19)
Totals 2,644 2,644 2,644 8,503
0
10
20
30
40
50
60
70
80
90
Infrastructure Support Programme Educators

Western Cape Province Salient findings
The following salient points have emerged from the results:
• As far as site type is concerned, the provincial profile is very similar to the national
pattern with slightly less home based sites (28%) than the national figure (34%). Half as
many sites are registered with the Department of Education (19%) compared to 38%
nationally. Conversely the proportion of sites registered with a Local Authority (28%) are
significantly higher than the national norm (12%). Sites in the Province are more
established than in most other provinces with 71% having been in existence for more
than 5 years compared to 63% nationally.
• Significantly more sites in the Province are based in urban areas (76%) than is the case
nationally (49%).This is consistent with the fact that nearly three quarters of sites are less
than 1 km away from a primary school.
• Sites in the Western Cape are by far the best developed in terms of basic infrastructure:
93% of sites have piped water, flushing toilets and mains electricity. This is significantly
higher than the national average of 53%.
• The financial situation of most sites in the Province is also much healthier than is the case
in most other provinces Fifty percent of learners pay more than R75 fees per month (36%
nationally) while a similar proportion of parents contribute to more than 75% of the
school fees (the national average is 28%).
• The ratio of learners per educator (17:1) is slightly lower than the national average of 19:1.
• The age distribution of educators in the province is identical to that of the national
average: 38% of the educators are older than 40 years.This is also true of the qualification
profile, the teaching experience profile and the figures on monthly salary.
• Sites in the Western Cape are in general better off than sites elsewhere in the country.
This is confirmed by the fact that only 1% of sites were rated ‘below average’ on the
infrastructure index (the national figure is 18%).They also get considerably more support
than sites in other provinces.
162

163
Chapter 6Conclusions
IntroductionIn this chapter, some of the key issues that emerge from the results are discussed. In excess of
four and a half million pieces of information were collected, captured, processed and analysed.
This data-set provides invaluable insights on the current nature and extent of ECD provisioning
nationally and provincially. A selection of the more pertinent issues are discussed in this final
chapter, given that they raise particularly significant questions with respect to current ECD policy
development, planning and practice.
ResourcesOf the estimated 6.4 million South African children in the 0 to 7 year age cohort, slightly over
one million are enrolled in identifiable ECD sites, i.e. fewer than one sixth (16%). Moreover, of
the estimated 960,000 children in the 5-6 year age cohort, 413,000 (43%) are enrolled, which
indicates that less than half of the national cohort are being accommodated. Given the current
focus of ECD policy on the formalisation of provisioning with respect to the Reception Year for
the 5-6 year age cohort, it is clear that the provisioning needs are considerably in excess of
available resources. Also of significance is the comparative size of the ECD and Primary learning
sites: 23,482 ECD sites nationwide in comparison to 17,254 primary schools. This suggests that
ECD is much more than a peripheral activity. This has serious implications for the human and
physical resources required to manage a sector in which there will be considerable growth if
policy goals and national mandates are to be achieved.
Also significant with respect to resourcing the sector are issues pertaining to the financial
support of ECD sites. The findings have established that the sector is, for the most part,
extremely poorly funded. At all levels of functioning, sites appear to have few financial resources
to rely on. While fees are generally low, with an inversely high rate of non-payment, as many as
a quarter of the identifiable sites rely solely on fee income. The inadequate resourcing of the
sector is further reflected in the low salaries that educators receive. The financial resourcing of
ECD sites is clearly a challenge, especially given the context of constraints on spending in
education more broadly. It is however evident that the sector requires better financial support
and the lack of financial resources continues to perpetuate its marginalised status.
The nature of sitesThree different types of sites predominate the sector: those that are attached to schools, those
that are based in communities and those that offer their services from private homes. About half
of the identifiable sites are community based. The findings of the Audit indicate that, as might be
expected, most of the learners under the age of 5 years are at home based sites, while the 5 to
7 year olds tend to be in community based or school based sites. Thus, despite the emphasis of
ECD policy on the Reception Year being primarily located at community and school based sites,
there continue to be ‘Reception Year’ age children (17%) located in home based sites.
Within each of the three categories of site types (school, community and home based), evidence
of very low and very high scores on each of the four indices were recorded. While no

discernable patterns emerged concerning the ratings accorded to site types with respect to the
infrastructure and support indices, a greater percentage of home based sites were rated ‘below
average’ than the combined total percentages of school and community based sites with respect
to the programme and educator indices. Equally interesting is the finding that in home based
sites, fee levels tend to be higher. Thus, while home based sites offer comparatively weaker
programmes and have educators with less experience and lower qualifications, they also tend
to be more expensive. While guarded significance should be placed on the programme index,
given that it was a subjective measure based on individual enumerators’ assessments, there is
nevertheless cause for concern with respect to the combined findings that 75,000 ‘Reception
Year’ age children are attending home based sites wherein ‘below average’ rated educational
programmes are being offered. Given the importance current policy places on ECD as a holistic
service of care and education that promises optimum development of children, any emerging
inadequacies in the provisioning model need to be addressed. While the primary emphasis is
on a structured, preparatory curriculum for the 5 to 6 year age cohort through the Reception
Year, there are equal goals for a broad developmental curriculum for younger children.
The findings regarding the sustainability predictors (using CHAID analysis) identified site type
as the strongest predictor of sustainability. Being a community based site is the strongest
predictor of sustainability, conversely, within the site type variable, school based is the weakest
predictor. While it might have been expected that school-based would have been the strongest
predictor, it should be remembered that many schools only started offering ECD services in the
late 1990s and consequently could not have been operating for five years or more when the
Audit was conducted.
These findings raise important questions concerning the viability of home based sites within the
current policy contexts, particularly with respect to older children in the sector. This is clearly
an area of debate which requires further investigation, given the existing and projected
magnitude of the services required, allied to arguments which hold that home based
provisioning should be prioritised as it is the most cost-effective and nurturing option for
younger children.
Historical inequalitiesChapter One provided some background on the history of colonisation, racial oppression and
apartheid, while Chapter Two highlighted how recent policies and practices are a direct
challenge and response to inherited systems and mindsets. It is not surprising that racial
inequalities are still evident in ECD provisioning. Across all four indices (support, infrastructure,
programme and educator), African sites rate the lowest, whereas White sites rate highest.
While the racial segregation that characterised apartheid is being diffused by the emergence of
a small number (less than 10%) of ECD sites within which learners from across the spectrum
of population groups are accommodated, the divisions in wealth distribution are self evident.
Such conditions continue to reproduce a context of stark inequality along the lines of colour in
which the vast majority of African children remain disadvantaged.
Another predictor of inequity is apparent in the rating discrepancies between the various
provinces. At an economic and developmental level, those provinces which the Audit signals as
164

165
disadvantaged with respect to ECD provisioning are rural in make-up and encompass high
numbers of areas historically demarcated as ‘bantustans’. A comparative analysis of the
provincially derived infrastructure index scores, identifies the Eastern Cape, KwaZulu-Natal and
the Northern Province as being significantly under-resourced. Such differences cannot be
understood outside of the historical contexts which continue to impact on ECD provisioning
and point to the importance of continuing to prioritise those areas of the country and those
groups in South Africa that remain disadvantaged.
EducatorsECD educators are critical to the success of any interventions in the sector. The Audit has
quantified the extent to which a sizable portion of these critical educators have not received
any training (23%) and an even larger portion (58%) who hold qualifications which are not
currently recognised by the Department of Education. The majority of the latter group have
received NGO training, which, at this point, is not accredited. It is imperative that educator
training providers prepare their programmes for registration within the NQF and for
recognition by the Department of Education.
It is significant to note that the salary profiles of those educators with NGO training and those
with no training, are similar: more than half of each group earn less than R500 a month. There
also exists a link between qualifications and length of teaching experience: those who have been
in the profession for ten years and more are also those who are most qualified. The findings
suggest that investing in adequate training of educators results in increased retention of
educators. If the sector is to challenge its marginalised status and gain recognition for the
valuable social, community and educational role it plays, ECD educators need to receive salaries
which reflect their qualifications, experience and service.
LanguageWithin South Africa, indigenous languages and cultures have been marginalised and devalued.
The recent shift in policy and practice towards a multilingual society is evident across sectors
and at all levels of social intervention. Given the importance of the early years in the acquisition
of language, it is not surprising that the ECD sector considers language a priority issue.
Although not unexpected, the extent to which the Audit findings confirm the pre-eminence of
English as a language of instruction, is surprising. English is used as a language of instruction in
83% of the identifiable sites, while it is the home language of only 12% of the learners enrolled
in those sites. It is a language of instruction used by 95% of the educator training providers
audited. Whatever the context, whichever province and whatever the dominant home language,
English is always either the first or second most prominent language of instruction. Even in
provinces where English is spoken by a small minority of children, it is widely used at the sites.
It can be assumed that the privileged position of English is at the expense of the home languages
of the learners. There is much research that points to the importance of home language
education in the cognitive development of younger learners and the fact that multiple languages
are better learned in the early years. One of the goals of current ECD curriculum interventions
is that all children need to learn a second South African language and that all eleven official
languages be given equal value and recognition within the ECD setting.
GenderCaring and helping occupations, including professions such as teaching and nursing, have
historically been female-dominated professions. There has been much analysis of the way in
which the world of work reflects broader social stereotypes of masculine and feminine roles. It
has been well documented that professions where women are over-represented are also those
that are devalued with respect to status and salary. The devaluation of ‘female’ professions
internationally has been found to hold true in this context, given the low salaries that the
educators are paid relative to other professions. In view of the centrality of ECD to the
development of children and society as a whole, it is a cause for concern that the profession has
such low status. It is evident that the pattern of women being assigned to lower valued
professions reflects gender inequalities and sexist practices in society at large. An improvement
in the status of ECD educators through appropriate salary levels and social recognition would
have a positive influence on the sector and would also challenge the devaluation of women in
the world of work and society.
The over representation of women in the sector allied to the fact that the learner population
is equally divided between males and females has implications for the development of
progressive and democratic principles, including anti-racist and anti-sexist values and practices.
Children’s observations of women as the caregivers at ECD sites engenders gender stereotypes
about who is responsible for education and care. This may serve to reinforce the stereotypical
models that children encounter in their own homes and at the broader social level.
There are many arguments for interventions that facilitate an improvement in the status and
value of the profession. These hinge in part around challenging the historical devaluation of
women’s work, but also on the continued marginalisation of the sector itself, and by implication
on the lack of adequate acknowledgement of the impact of children’s early years experiences
not only on their individual future development, but also for broader social development.
HIV/AidsSouth Africa is recognised as one of the countries with the fastest growth rate in the
incidence of HIV/Aids in the world. It can reasonably be assumed that there is a statistically
significant number of children in the ECD sector who are either HIV positive or are living
with Aids. Not according to the findings of the Audit. The number of ECD sites reporting
incidences of learners with HIV/Aids was so minuscule as not to allow reliable analysis and
reportage. This phenomenon highlights the silences and taboos surrounding the pandemic.
More support for the sites and the communities in which they are located is needed to
facilitate increased awareness and enhanced care for HIV positive learners and their families.
There can be little doubt that there are an increasing number of children losing parents, siblings
and friends as a result of the pandemic. Such children will require special support. Educators
will be required to perform counselling functions over and above those which they have
previously experienced or for which they have been trained. This has attendant implications
for educator training programme developers and providers. The sector as a whole, like the
nation, has to begin preparing itself to support and care for children affected and/or infected
with HIV/Aids.
166

167
Children with disabilitiesThere are comparatively few children with disabilities being catered for at ECD sites and almost
a third of those who are attending ECD sites, are over seven years of age. This may indicate
that this older cohort of children remain in ECD as a consequence of being refused entry to
formal schooling, or that parental wishes dictate that they remain in the sheltered and nurturing
environment of the ECD site for as long as is possible. Equally curious is the relative non-
enrolment of younger learners with disabilities. In the light of mainstreaming initiatives, their
absence is a cause for concern. This issue poses a considerable challenge to ECD interventions.
Future areas of researchThe Nationwide Audit has highlighted a number of areas which require further research:
• Quality of teaching and learning programmesGiven that the Audit was focused on quantitative as opposed to qualitative research
questions, it did not comprehensively assess the quality of programmes being presented to
ECD learners. In view of the emphasis that emerging interventions are placing on curricular
matters, a more rigorous analysis of the nature, appropriateness, efficiency and effectiveness
of the learning programmes offered at ECD sites is required. Qualitative investigation of
programmes, and factors affecting them, could form one level of research, while a
longitudinal assessment establishing the effects of various modes and models of ECD
provisioning on subsequent school performance would also be valuable.
• Language and cultureClearly issues concerning ‘languages of learners’ and ‘languages of instruction’ warrant
further investigation. Future research might establish, at a more qualitative level, how
languages are used within sites and how the use of languages of learning and teaching
impacts on learner involvement and attainment.
Furthermore, while the Audit has established the dominance of English as a language of
instruction, little is known concerning the cultural values pervading the sector. Within
current educational values, the representation of a diversity of cultures and traditions is
emphasised, the extent to which this is practised is worthy of further research.
• HIV/AidsWith respect to the issues relating to HIV/Aids mentioned above, there are a number of
research questions which require immediate attention: the levels of educator awareness
and preparedness; establishing educators’ and learners’ attitudes towards the virus and its
consequences; identifying the role of ECD within broader community initiatives targeting
the pandemic; the appropriateness of prevention programmes.
• Gender, racism, democracy and equalityIn view of the emphasis in the curriculum on challenging sexism and racism and on
developing democratic values, there is little evidence as to whether this is happening.
Future research could explore the extent to which programmes and processes adhere to
the current curriculum framework with respect to inculcating democratic principles.

• DisabilityWhile the findings of the Audit established how few disabled learners are currently
enrolled in ECD sites, little is known about these disabled learners. Research focusing
more specifically on learners with disabilities would allow for more responsive and
appropriate provisioning.
• Educator trainingThe Audit has yielded much information about ECD provisioning at site level and a
thumbnail sketch of educator training. The quality and nature of current educator training
programmes need to be established. Accepting the centrality of educators in creating and
delivering programmes of excellence, it is necessary to identify the veracity,
appropriateness and responsiveness of the training programmes on offer. In particular,
there is a need to identify current gaps in educator training programme provision, and to
establish and quantify the impact of training at site level.
ConclusionThe fiscal constraints which curtail the Government’s capacity to fund nationwide ECD
provisioning jeopardises the financial and educational gains of the age-admission and age-grade
norm policies introduced during 200018. While the Nationwide Audit of ECD Provisioning
cannot claim to solve these fiscal constraints, it does signal a significant step forward for ECD
in South Africa. It provides key information relating to ECD provisioning which will inform the
strategic and appropriate development of policies and programmes at provincial, national and
possibly, international levels. A reliable data base and a thorough statistical analysis of the
current situation is now available. Solidly grounded empirical evidence is on hand which will
generate and illuminate informed debate in a sector in which development was sometimes
retarded by inherited conventional wisdoms and the selective use of anecdotal evidence to
further partisan positions. The Audit identifies areas of continuing disadvantage and points to
areas requiring further investigation and prioritisation.
The aim of the Audit was to provide accurate information on the nature and extent of ECD
provisioning, services and resources across the country in order to inform and support ongoing
policy and planning initiatives in the sector. While this aim has been fully achieved, the success of
this intervention will be measured against, not only the conclusion of the research process, but
more critically, against the widespread dissemination of the findings and the willingness of all
concerned to shape future policies and provisioning practices on the basis of the findings of the
Nationwide Audit. An equally important outcome of the Audit is the dawning recognition of the
imperative to prioritise, in a tangible way, the needs of the nation’s children. As ECD moves from
the periphery to the core, it is best positioned to play a crucial role in assisting South Africa’s
children to fully realise their inherent capacities and to enhance the future of the nation.
168
18 The Minister of Education’s Report to the President, October 2000.

169
ANNEXURE 1Codebook
Part 1Study overview
Title of study: The NATIONWIDE AUDIT of ECD Provisioning in South Africa
IntroductionA codebook documents key aspects of surveys and usually contains a study description, a copy
of the questionnaire used in the study and a codelist. This abridged codebook contains a
codelist, an abridged version of the enumerator manual and the full version of the site
questionnaire. The Audit data is made available on a accompanying CD stored in two files
labelled FACILITYDATA and EDUCATORDATA. Both files are stored in two formats: as a SPSS
datafile (.sav) and a SPSS portable file (.por). The latter format allows for easier portability to
programmes other than SPSS (e.g. Excel).
AbstractIn May and June 2000, the South African National Department of Education undertook a Nation
wide Audit of ECD Provisioning. In a period of approximately two months, 23,482 sites,
employing 54,503 educators and providing services to 1,030,473 learners, were audited. Data
concerning a range of aspects of ECD provisioning was collected. At the ECD facility level, key
categories include: registration of the facility and with whom registered, the geographical
location of the site, basic infrastructural information (access to roads, electricity, toilets, water)
and special equipment. Other facility level topics covered include: the financial base of the site,
the nature of the site (school-based, home-based or community based), its sustainability (how
long it has been operating), its operating hours as well as key aspects of the educational activities
at the site. At the educator level, the audit covered basic information about the number of
designations of all educators at the site, their age, highest qualification, gender, race, highest
school grade, monthly salary and teaching experience. Extensive information was also gathered
about the learners at each site including the total number of learners disaggregated by age
group, race and gender. Data was also captured on the number of learners with disabilities and
the nature of such disabilities.
KeywordsEarly childhood provisioning, pre-school education, learners, educators.
UniverseFor the purposes of the audit, an ECD site was defined as any public or private, formal or
informal ECD location wherein the physical, social, emotional, intellectual and spiritual needs of
groups of six or more learners are catered for. Existing databases within the Departments of

Education, Health and Welfare, as well as those of training institutions (including those identified
during the postal survey) were accessed. NGOs, CBOs, funding organisations and any other
possible sources of site information were also asked to submit site lists.
An initial unverified list of 30,101 sites was compiled. Of these 7,845 were subsequently deleted
by the provincial agencies as being duplicates, non-existent or closed, resulting in a revised total
of 22,256. Provision was made for sites ‘discovered’ during the fieldwork process to be added
to the lists and audited. Site information was ultimately assimilated on 23,482 sites.
Date of researchMay and June 2000.
Extent of collection2 data files + electronic documentation
File specificationsNumber of cases: File 1 (Facility Data) 23,483
File 2 (Educator Data) 54,503
Number of records/case: 1
Number of variables: File 1 = 361
File 2 = 24
Number of kilobytes File 1 = 11.7 KB
Number of kilobytes: File 2 = 2.8 KB
FieldworkCore trainers from each provincial agency were trained by the national consortium in Pretoria
in the administration of the questionnaire and the training of provincial enumerators. An
enumerator manual was provided by the national consortium. The final version of this manual
was made available in English, with translations of key sections in the other ten official languages.
Constructed variablesIn addition to the variables that were recoded, four indices were constructed. These indices
provide composite summaries of key aspects of provisioning. They are labelled: infrastructure,
support, programme, and educator. Each index was constructed using relevant items and sub-
items from the questionnaire. The infrastructure index included items such as: the type of
buildings; the availability of electricity, toilets and water; the learning and play areas available to
learners; the existence of a kitchen etc. Each item within the index contained sub-items such
as, within the ‘type of buildings’ item: conventional brick, traditional mortar, shipping container,
prefab, etc. Each sub-item was assigned an intuitive weighting which contributed to the overall
index score. Scores on these items were given different weightings and added up to make a
total score which a site could achieve on any one of the four indices.
170

Three categories of scores were calculated using the nationally generated median as the
reference. One standard deviation at either side of the median was defined as ‘average’. More
than one standard deviation above or below the median was defined as ‘above average’ or
‘below average’ respectively. For example, in the infrastructure index, the maximum score
possible was 34, the median was 26 and the standard deviation equalled 9.7. All sites scoring
between 0 and 17 are grouped as ‘below average’, those between 18 and 26 as ‘average’, and
those above 26 as ‘above average’. Using the nationally generated median as the reference,
allows for very useful and informative comparative analysis at provincial level and with respect
to key variables. Using the nationally generated median also minimises the effects of subjectivity.
171

Part 2Enumerator manual (abridged)
Section A: Performing the Audit
Section B: Guidelines for completing the questionnaire
Section A: Performing the Audit
IntroductionThis manual is to help you complete the site questionnaire. It provides guidelines for what to
do when you arrive at the ECD site and also explains what the terms used in the questions
mean as well as how to go about completing the questionnaire.
General definitions and guide to specific questionsEarly Childhood Development (ECD) is the term used for the physical, social, emotional,
intellectual and spiritual processes of development in young children aged 0 - 9 years.
An ECD site is a place where a group of 6 or more children below school going age are regularly
provided with services, this could be in a home, at a hospital, under a tree, at a school, in a
community hall, or in building designed for the purpose.
An educator is any person providing for the education and supervision of learners at an ECD
site is referred to as an educator. This would include teachers and their assistants, nurses but
not administrators, cooks, ground-staff unless they work directly with children on a regular
basis.
Learners are children of all ages who receive services at an ECD site.
Purpose of the Nationwide AuditThe Department of Education is undertaking a nationwide audit of ECD provisioning. This will
provide information to help the Department to develop policy and plan for the delivery of
services for young children. The audit includes information about learners, educators, training
providers and sites.
The audit is being done in collaboration with:
• Provincial Departments of Education.
• The Office of the President.
• The national and provincial Departments of Welfare.
• The national and provincial Departments of Health.
An ECD site is any place public or private, formal or informal where early childhood services
are provided to six or more children. So, the sites you will be visiting may be very different from
172

each other. This audit is important because we do not know how many learners under school-
going age receive organised ECD services or how many sites there are in different regions and
provinces or what sort of programmes are being offered to learners who attend different sites.
Frequently asked questions
What is an audit?In the context of this ECD audit, audit means the process of collecting information to find out
exactly what services there are for ECD and how many children are being served. Because
audit is generally used and understood to mean a public examination of accounts, it is perhaps
better to refer to what you are doing as a survey. Most people remember the census and you
can explain that the audit is like a census of ECD sites instead of households.
How will the information be used?There is no accurate information about the number and kinds of services available for
children aged 0 - 6 years and this makes it difficult for government departments and others
who are concerned with young children to plan.
Be careful not to raise unrealistic expectations or anxietiesA serious problem when audits are done, especially on behalf of government, is that hopes and
expectations can be raised. Explain that the outcomes of the audit/survey will be to provide
accurate information to help the government plan for ECD services. Do not make promises
about anything, and especially do not mention funding or registration.
Site staff may also be concerned that you will report them if they are not meeting minimum
standards e.g. they have too many children for the space available etc. It is very important to
reassure them that this is not the intention of the audit. If they are fearful they may refuse to
give you access to the site or give you incorrect information.
What if site management asks for your comment on their programme?In our experience many sites are keen to get feedback on how you think they are doing. This
is not the enumerator’s role and you should explain this and avoid being drawn into such
discussions.
May the site have a copy of the questionnaire?Just as in the census copies of the questionnaire will not be left at or sent to sites. However if
they have photocopying equipment on the premises and wish to make a copy for their record,
this is fine.
What if site management refuses to participate in the audit?Participation in the audit is voluntary. If site management is doubtful, explain the importance
of the exercise in helping the government plan services for young children. Explain the
confidentiality and that it is not for inspection purposes. Do not make any promises. If they
still refuse then accept this politely. You will need to record the refusal as follows:
173
• complete the name and address A1 - A4; and
• note the refusal in F9 on the final page of the questionnaire.
What if you find a site that is not on your list?If you are sure that the site is offering a regular service for 6 or more children under school
going age, record its name, address and telephone if there is one. Forward this information to
your provincial agency as soon as possible.
What if the site on your list has fewer than six children?If when you arrive at a site on your list, and there are fewer than 6 children, the questionnaire
should still be completed.
Visiting the site
1. Arranging your visit(This must be done in consultation with your provincial agency.) If at all possible try
and establish contact with the principal/supervisor of the site before your visit. If the site
has a telephone this can be done telephonically. If it doesn’t, try and contact the site by
leaving a message at another site in the area or through a local educare forum or other
organisation or community committee if it exists. The purpose of this contact is to:
• Introduce yourself.
• Explain why the audit is being done and encourage them to participate.
• Explain that you will need to interview a senior staff member and to observe the site and
what the children are doing.
• Explain that they should have records such as the attendance and fees register,
qualifications and salaries of educational staff and programme planning available, if they
have these.
• Check whether you need permission from the chief, headman, local authority,
management committee, owner etc. and if so make direct contact with them.
• Explain that the information from each site is confidential and only the Department of
Education will have access to it. Basic information will be made available to the General
Public.
• Set a date and an early time of the day for your visit.
2. Arrival The best time to see most programme activities at ECD sites is in the morning.
Preferably arrange to arrive at the sites in the early part of the day. Note your name,enumerator code and time of arrival in the space provided on the questionnaire.
174

Introduce yourself to the head of the site and show her/him your official letter of
introduction. If you have been unable to make contact previously, cover the points in 1
above. If the ECD site is part of a public school first report to the Principal’s office.
Spend a few minutes explaining the different things you will be auditing: contact details,
information about the learners, information about the educators, the sites, funding sources
and the programme of activities learners do. If the head of the site would prefer to look at
the questionnaire him or herself show it to her/him. Organise a time when you can
interview her/him.
3. Completing the ECD site questionnaire• Study all the definitions and guide to specific questions before your visit.
• Every question must be completed, as instructed, even if all you can record is that
there was no response or the respondent didn’t know or the question is not
applicable.
• Complete only the relevant blocks of each question.
• Where the question is not applicable mark the whole block clearly with N/A, e.g.
where there is no fax or phone.
• Do not make additional comments on the questionnaire.
• Use a tick (4) and keep it within the block. Do not use a cross(x) as it may look like
a crossed out tick.
• If you make a mistake on the questionnaire, cross it out and use Tippex if necessary.
• Fill in the questionnaire in black pen.
• You will need a notebook for jotting down details in different parts of the site. A
pocket calculator would be useful. In addition, take with you photostat copies of C1
(to be used if there are more than 7 educators at a single site) and D14 (to be used
if there are more than 8 separate groups of learners).
• Conduct the interview in the preferred language of the educators at the site. Some
key sections and words are provided in the translation boxes.
• Questions about population group, gender, age, qualifications, salaries and HIV/Aids can
be sensitive. If you are asked why this is necessary, explain that it is needed for
targeting services to the most under-serviced, for redress and to help plan for training
needs.
• To complete the form you will need to have a tour around the site, time to observe
175

and time to study records and time to interview the most senior educator present
at the site.
4. Tour of the siteAsk for a guided tour around the site, all the indoor and outdoor areas that are used by
learners, and on route, to be introduced to all the educational staff. Explain that you will
be filling in the questionnaire. If the head wishes to fill in the questionnaire explain that
enumerators have been trained to do so in a standardised way. During this tour complete
the following:
• Physical provision and any special equipment for learners with disabilities (B3).
• Place in which the site operates (D2).
• Type and condition of the building (D 6).
• Total area of outdoor playgrounds (D7). If there is more than one playground, make
a note of the area of each separate one and put the total of all the playgrounds in the
block provided.
• Water (D8 a and b).
• Power and Energy (D9).
• Enclosure (D10).
• Toilets (D11 a and b).
• Condition of sanitation, hygiene and safety (D12).
• Cooking area and fuel (D13).
5. Observation of the programme/s Spend at least one hour observing the programme in action. If there is more than one
group of learners and an educator, spend at least 15 - 20 minutes observing each group.
During this observation complete the following questions:
• Physical count of learners in each group (B2).
• The area of the space used by each group of learners (D14).
• Equipment available, sufficiency in terms of the numbers of learners and condition (E1).
• Improvised equipment (E2).
176

• Programme of activities being followed (F3).
• Variety of activities and types of activities (F4).
• Whether learners’ work is displayed (F5).
• Freedom to explore and experiment with activities and equipment provided (F6).
• Encouragement to ask questions (F7).
• Learners’ interest and involvement (F8).
For E1, E2 and F3, 4, 5, 6, 7 and 8, the response box you tick should be for the site as a
whole. If there is more than one group, jot down notes as you go and then after the last
group, tick the category which, in your opinion, best fits the site as a whole.
6. RecordsDuring your meeting with the head or most senior person available at the time of your
visit, check:
• The attendance register for enrolment (B1).
• Fees register for how much the fees are (D16) and what percentage pay them (D17).
• Programme planning records for evidence of a planned programme (F3).
• Many sites have no written records and in this case complete the questions by asking
the person you are interviewing.
7. Interview with Head • Check or complete all identifying details of the ECD site (A1 - A15).
• Ask about the specific disabilities learners have (B3).
• Complete the number of HIV positive learners and those with Aids (B4). If there are no
HIV positive learners or learners with Aids fill in ‘0’.
• The home languages of all the learners enrolled (B5). The total learners in B5 should
equal B1.
• Complete the details of educators (C1). Make a note of anything that the head cannot
complete, for later checking with the educator in question.
• Complete all details to do with the operation and financing of the site.
• Who provides the ECD service (D1).
177

• How long the site has been in operation (D3).
• How often site operates (D4).
• Time site opens and hours of operation (D5 a and b).
• The division of learners, their age and the number of enrolled learners in each group
(D14). This total should equal B1.
• How most learners get to site and distances they walk if applicable (D15 a and b).
• Sources of income/support (D18).
• Support and/or monitoring visits (D19).
• Whether there is a management committee (D20).
• Meals served (F1).
• Languages of teaching and learning (F2).
• Any special circumstances affecting completion of the questionnaire (F9).
8. Departure• Did you visit all the areas of the site, indoor and outdoor, and record the square
meters?
• Did you spend time observing every group of learners?
• Have you recorded an answer to every question, even if it was ‘don’t know’ or
indicated that it was ‘non applicable’?
• Thank all those you spoke with, ask the interviewee to sign and date the questionnaire
as a true record of your visit, sign and date the questionnaire yourself and note the
time of your departure.
178

Section B: Guidelines for completing the questionnaire
Unique Site NumberLeave blank - it is for office use only.
Audit Control NumberIt is the number provided on the site list. Complete this in block provided on the top right
side of every page.
Name of enumeratorAfter your name, write in your enumerator code in brackets. This must be repeated when you
sign your name at the end of the questionnaire, e.g. L. Mzileni (K 32).
In this section write over the instructions given in lighter type.
Be very careful to fill in details in the appropriate block.
A3 Village If a village is only identifiable as part of a district, fill in a block as followse.g. Emambatheni, district of Mahlabatini.
A4 Physical address If the site is freestanding leave this line blank. It is for situations where.
• Site operates from another building e.g. Masisebenzani
Community Resource Centre, St Mary’s Church etc.
• Stand numbers.
• Geographical indications such as ‘along the Cintsa River’.
Some small towns do not have postal codes. Fill in code for
nearest town.
A5 Postal address If the ECD site has a P.O. Box Number fill this in.
A6 Location Urban formal: ordinary town or city areas with mostly formal dwellings.
Urban informal: ordinary town or city area with predominantly
informal dwellings, e.g. squatter camp.
Rural: commercial farms (run as a business).
Rural other: villages and rural resettlement areas - isolated, no
infrastructure, subsistence agriculture, traditional housing and/or
formal dwellings (houses, huts).
179

A13 Registration Sites can be registered in more than one category. ‘Other’ refers
only to government departments e.g. Public Works,Agriculture.
A14 Access road Tick only the box that refers to the immediate access to the site.
Distance is the distance between the site and the point to which a
vehicle has access. In many cases this will be ‘0’ kilometres. A
kilometre is approximately an 8 to 10 minute walk for an adult.
B1/B2 Learners The totals for these two questions will not necessarily be the same
i.e. B1 will be the number of learners recorded in the register
while B2 is the physical count of the number of learners on the day.
B3 Disabilities This refers to the total number of learners with disabilities
enrolled and may not be the same as those reflected in B2. Each
learner with a disability should only be recorded once. Record
learners who are deaf, blind or cerebral palsied in these categories
even if they have multiple disabilities. If a learner is disabled but has
not been diagnosed use the category ‘Don’t know’. Enumerators
are not expected to be able to categorise disabilities. The
information below is to help them label what the educator tells
them, if educators do not use the words on the questionnaire.
Physical, Movement DisabilityThis includes learners with paralysed or deformed body parts or
parts of the body that they can’t control, weak or underdeveloped
muscles (e.g. muscular dystrophy) and balance problems.
Severe Hearing Impairment/DeafThis is identified by noting that the child:
• Does not turn to sounds or when spoken to.
• Does not pay attention.
• Has delayed speech development.
Severe Visual Impairment/BlindSigns of seeing problems include:
• Pupils look grey or white.
• Eyes do not follow objects.
• Child may be clumsy and accident prone.
• Child holds head very close to work.
• Eyes squint, cross or move separately.
Mental DisabilityLearners with mental disabilities are not able to think as well as
other learners and will experience delays in their development.
Some common conditions associated with mental disability are
given below:
180

Down Syndrome. This is the most common form of mental
disability. Signs include:
• Eyes are upward slanting.
• Ears are small and low set.
• Mouth is small with protruding tongue.
• Hands have single crease across the palm.
• Feet have a gap between the first and second toe.
• Low muscle tone, floppy.
Foetal Alcohol Syndrome. Signs include:
• Small eyes.
• Sunken bridge of the nose.
• Flat area between nose and mouth.
• Long smooth upper lip.
• May have congenital abnormalities.
Cerebral PalsyThis is the name given to a group of conditions in which there are
problems associated with movement and posture because of
damage to the developing brain. The damage occurs before, during
or after birth and the signs do not usually show until the infant is a
few months old. Signs are:
• Muscle stiffness or spasticity, limbs are stiff and difficult to
move; one or more limbs may be affected.
• Uncontrolled movement.
• Poor balance.
• Some children may have uncontrolled face muscles and dribble.
Severe Behaviour DisorderThese would include severe and ongoing aggression towards
others; ongoing self-injury, damage to property, severe hyperactivity
(learners who are on the go all the time and cannot settle or
concentrate for more than a few seconds).
AutismThis affects communication and social emotional development.
Characteristics include:
• Poor social interaction.
• Impaired communication: verbal, non-verbal and symbolic play.
• Stereotyped, repetitive movement patterns.
EpilepsyEpilepsy is a condition that regularly causes sudden, usually brief
periods of unconsciousness or changes in mental condition with
seizures/convulsions/fits.
181
Multiple disabilityA number of impairments, often both physical and mental in the
same learner.
Special Equipment Equipment provided at the site and not to equipment such as
wheelchairs, crutches, hearing aids etc. that learners bring with
them. This covers any bought or improvised equipment to assist
learners including something to help learners move
independently, something to keep them steady when they stand
or sit. Examples include a broad support strap to help learners
sit in chairs; a special cup to reduce spills and messing when
eating; picture/ communication boards to help learners with a
hearing impairment to communicate etc.
Provision for learners with disabilities
Physical disabilities Good Special provision made.
Key health and safety issues addressed.
Easy unaided access to all areas of site.
No changes in level, or changes in level have ramps
with manageable gradient/slope (1:20), are protected
with handrails and have tactile warnings.
Doors, access routes all have minimum 900mm
width.
Adequate Some provision made.
Key health and safety issues addressed. Easy access
to most of site.
Inadequate access only to spaces irregularly/ never
used by learners.
Changes of level have ramps but without adequate
safety/warning features.
Doors, access routes all have minimum 900mm
width.
Inadequate No provision made
Poor access to commonly used areas of site.
Steps and large changes in level.
Doors, access routes less than 900mm wide.
182

Visual disabilities Good Special provision made for visual impairment.
Key health and safety issues addressed.
Good contrast between walls, floors, ceilings, doors,
windows, and objects in rooms.
Good, even lighting.
Good physical access (as above).
Adequate Some provision made for visually impaired.
Key health and safety issues addressed.
Some contrast used.
Good physical access (as above).
Inadequate No provision for visually impaired
Numerous hazards.
Hearing disabilities Good Special provision made.
Key health and safety issues addressed.
Surfaces that absorb sounds such as carpeting,
acoustic ceilings, wall coverings.
Little or no background sound from equipment and
use of furniture.
Key health and safety issues addressed.
Adequate Some provision made.
Key health and safety issues addressed.
Finishes limit sound transmission: some absorbent
surfaces such as lino and carpeting.
Limited sound from equipment and use of furniture.
Site in quiet environment.
Inadequate No provision made.
Finishes and furniture don’t absorb sound and
background noise.
Site in highly noisy environment.
B5 Learner languages Fill in the number of enrolled learners according to each home
language category in the relevant age groups. Record only one
dominant home language for each learner. Ensure totals in B5 add
to B1. Check this at the time of the interview and ask the
educator for assistance if necessary.
183

C1 Educator’s Grade
On the questionnaire list the grade number only.
On the questionnaire list the grade number only
Educator's quals. Enter the appropriate code number for each ECD qualification into
column on the table.
• Codes 1,2, 3, 4, 5 and 6 refer to courses offered by the non-governmental ECD
training agencies. Levels 1, 2 and 3 were older courses while Level 1, 4 and 5 have
184
No Education 0Sub A Grade 1Sub B Grade 2Standard 1 Grade 3Standard 2 Grade 4Standard 3 Grade 5Standard 4 Grade 6Standard 5 Grade 7Standard 6 Grade 8Standard 7 Grade 9Standard 8 Grade 10Standard 9 Grade 11Standard 10 Grade 12
Qualification CodeECD Level 1 1ECD Level 2 2ECD Level 3 3ECD Level 1 Draft Unit Standards 4ECD Level 4 Draft Unit Standards 5ECD Level 5 Draft Unit Standards 6Diploma in Education (3 years) 7Higher Diploma in Education 8Bachelor in Pre-primary Education 9N2 - NIC in Educare 10N3 - NSC in Educare 11N4 - Certificate in Educare 12N5 - Certificate in Educare 13N6 - Certificate in Educare 14Diploma in Education (N6 plus practical) 15Masters/PhD in Early Childhood 16Primary Teachers Diploma 17Primary Teachers Certificate 18Nursery School Teachers Certificate 19Nursery School Assistants Certificate 20Pre-primary Teachers Certificate 21Qualification in Social Work 22Qualification in Nursing 23UNISA Reception Year Certificate 24Other 25None 26Don't know 27

been introduced in the last three years as part of the National ECD Pilot Project
though other agencies may be using them. Code such responses as Basic Level
training, Babycare, Homebased; as Level 1.
• Codes 7, 8 and 15 refer to courses at Colleges of Education.
• Codes 9 and 16 are offered by a University.
• Codes 10, 11, 12, 13 and 14 are technical college courses NIC is the National Interim
Certificate, NSC is the National Senior Certificate.
• Code 17 and 18 refers to the old Primary Teachers Certificate, a Standard 8 plus 2
year certificate. Other names for this level of qualification include Lower Primary
Teachers Certificate and Higher Primary Teachers Certificate.
• Codes 19, 21 refer to Pre-primary Training courses which were Standard 8 plus two
years.
• Code 20 was a Standard 8 plus 18 month certificate.
• Code 25 other would include courses such as au pair training, Intec and other
correspondence courses which do not have an identified level and overseas courses
that are neither Diploma nor Degree.
Educators may refer to particular institutions where they received
training but simply find out the level of the course and complete
the column. If they cannot answer use Code 27 'Don't know'.
Codes 4 (ECD Level 1 Draft Unit Standards) was only introduced
in 1998. If there is doubt as to which Level 1 has been done, ask
when the educator was trained.
Experience Give and number to the nearest year e.g. 1, 3, 6
Salaries: If the site refuses to disclose salaries, record this as 'Don't know'.
D1 Providers Who provides the ECD service? Tick only one category.
• Department of EducationSpecial school or Grade R class at a primary school.
• EmployerService is provided by employer as part of services to staff e.g.
farm crèche, Parliament crèche, university crèche, business or
factory run site.
185

• Welfare or service organisation The ECD service is provided by a Welfare Organisation (e.g.
Child Welfare/Sunshine Villages/ACVV) or a Service
Organisation (e.g. an NGO or a Service Club such as Rotary
or Round Table, Church Aid in Need, Kindernothilfe, Union of
Jewish Women, Islamic Early Learning Foundation etc.).
• Private owner The ECD site is the property of an individual who provides a
service for personal profit/gain.
• Community OrganisationThe ECD service is owned by a group of people, usually
parents within a particular community. This may be an informal
grouping or a locally based organisation.
• Church, mosque, temple etc.The ECD service is provided by a particular religious
congregation.
• Other Independent (private) school.
D2 Site situated 'attached' means next to the school in the grounds, or part of the
school buildings.
D4 Site operation 'seasonally' applies to sites catering for learners during e.g. fruit
picking, farm workers during planting or harvesting and fishing
season.
D5a Opening hours Give the starting time e.g. 7H00, 14H00.
D6 Buildings If there is more than one building on the site (e.g. a conventional
brick structure, prefab) fill in the question for the main structure.
Good good condition and structurally sound.
Adequate reasonable condition, may require minor repairs and
maintenance.
Inadequate bad condition and structurally unsound, large cracks.
Requires major repairs and maintenance.
186

D7 Playgrounds The area/s where learners can play and excludes buildings. If it is
not enclosed, ask the educator to show you the point to which
learners are allowed to play and pace this. If there is more than
one playground add the square meters. If there is no outdoor
playground fill in ‘0’ in the square meter box.
Square meter (m2) an area measuring 1 meter long by 1 meter
wide. Some examples for calculating the square meters:
A rectangular or square area.
Pace out length and then breadth. Multiply length by breadth to
get the area.
An L shape
Calculate the larger part of the L and then the other piece and add
the two.
A circular area (e.g. a rondaval)
Pace the widest part (the diameter or D)
To get an estimate of the area multiply 1/2 D x 1/2 D x 3
D8a Water Tapped water refers to tap on site. If there is no water note this
in the other, specify box.
187
10m
4.5m
Area: 10m X 4.5m = 45m2
3m
4m
10m
3.5m
Area: 10m X 3 + 3.5 X 4 = 44m2
Area: 2 X 2 X 3 = 12m2
D = 4m
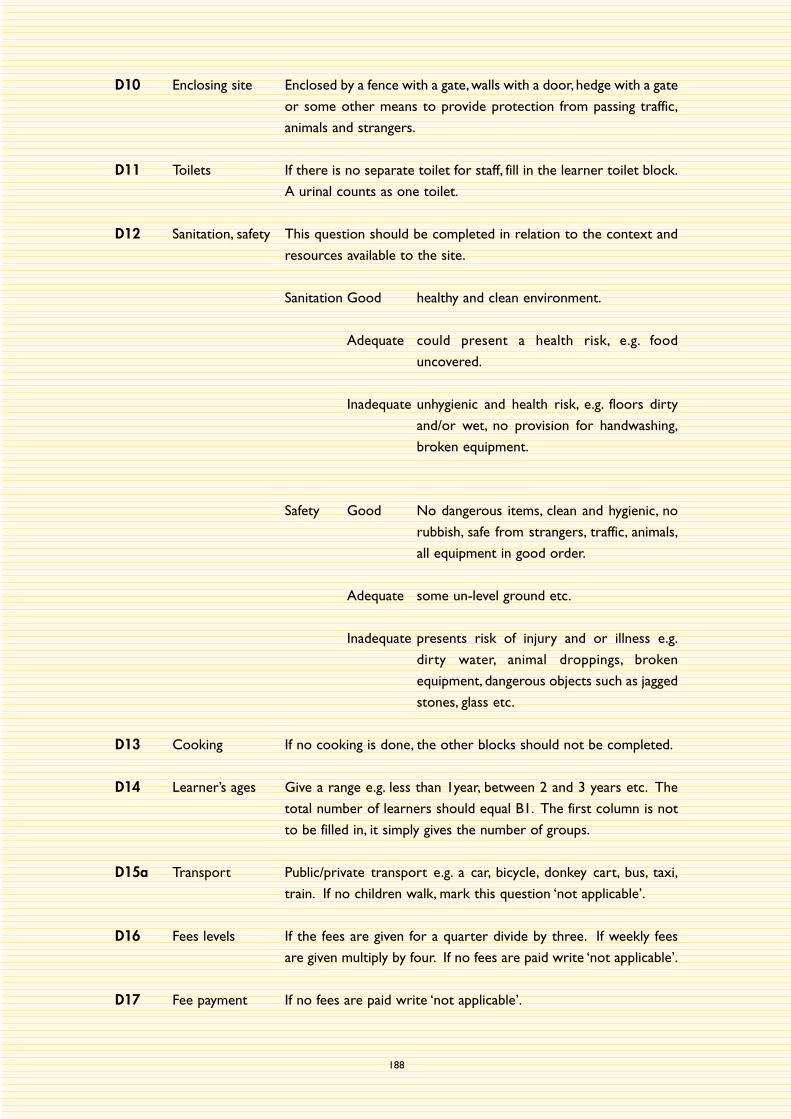
D10 Enclosing site Enclosed by a fence with a gate,walls with a door, hedge with a gate
or some other means to provide protection from passing traffic,
animals and strangers.
D11 Toilets If there is no separate toilet for staff, fill in the learner toilet block.
A urinal counts as one toilet.
D12 Sanitation, safety This question should be completed in relation to the context and
resources available to the site.
Sanitation Good healthy and clean environment.
Adequate could present a health risk, e.g. food
uncovered.
Inadequate unhygienic and health risk, e.g. floors dirty
and/or wet, no provision for handwashing,
broken equipment.
Safety Good No dangerous items, clean and hygienic, no
rubbish, safe from strangers, traffic, animals,
all equipment in good order.
Adequate some un-level ground etc.
Inadequate presents risk of injury and or illness e.g.
dirty water, animal droppings, broken
equipment, dangerous objects such as jagged
stones, glass etc.
D13 Cooking If no cooking is done, the other blocks should not be completed.
D14 Learner’s ages Give a range e.g. less than 1year, between 2 and 3 years etc. The
total number of learners should equal B1. The first column is not
to be filled in, it simply gives the number of groups.
D15a Transport Public/private transport e.g. a car, bicycle, donkey cart, bus, taxi,
train. If no children walk, mark this question ‘not applicable’.
D16 Fees levels If the fees are given for a quarter divide by three. If weekly fees
are given multiply by four. If no fees are paid write ‘not applicable’.
D17 Fee payment If no fees are paid write ‘not applicable’.
188

D18 Income This question refers to the capital: building and equipment and
running costs of the site and not to training and support services
offered to the site. Fill in up to four, ranked according to how
much income they contribute. One for the highest, four for the
lowest. Many different names may be used for government grants.
If you are not sure what the educator means, ask which
department they applied to/get their grant from.
• Department of Welfare crèche subsidy learners qualify on the
basis of parents’ income. It is a different amount in different
provinces and in some provinces a site may get one of three
rates depending on what level of standards it meets.
• Department of Welfare programme/development funding
poverty alleviation funds, the Flagship programme,Working for
Water support to ECD.
• Department of EducationDepartments of Education fund on the basis of salaried posts
and/or per capital grants. Responses such as grant in aid, pilot
subsidy etc. should be coded in this category. Not all classes at
primary schools receive support from the Department of
Education, many are community managed.
• Department of HealthThis is food subsidy money, learners in pre-primary classes at
primary schools may receive food under the Primary School
Nutrition Programme. Other responses in this category may
include NNSDP, Integrated Nutrition Programme, food aid etc.
• Local AuthoritySome Local Authorities supply buildings free and some subsidise
the running costs of ECD programmes. Support from Regional
Support services to be coded in this category.
• Fundraising activitiesInvolving parents and undertaken by/at the site e.g. cake sales,
big walks etc.
• Private sector grantCash donations from a charitable group such as the Nelson
Mandela Children’s Fund, Ithuba, Transitional National
Development Trust.
189

• DonationsThese could be in kind e.g. equipment, toy boxes such as those
provided by Woolworth’s or the Nelson Mandela Children’s
Fund toy trolleys, feeding schemes. This does not include
irregular, small donations in kind.
• OtherPublic Works, Department of Agriculture etc.
D19 Support Quarterly: 4 times a year or every three months.
Half yearly: twice a year, once in 6 months.
Annually: once a year.
Never: less than once a year.
D20 Management The management committee is accountable and responsible for
overseeing the running of the site especially the financial
management and staffing.
E1 Equipment Learner support material refers to any objects, educational games
and toys, books, worksheets, teacher guides, print and other
material which are used as aids to learning.
• First Aid Kit A basic First Aid Kit should include a pair of scissors, tweezers,
plasters, bandages, cotton wool, eye bath, medicine spoon,
baking soda, disposable plastic gloves, gauze, a triangular piece
of material for arm slings, Mercurochrome, Dettol, needle,
thermometer or fever strip and a first aid booklet.
• Floor covering Any covering on floor to make it warm to sit on e.g. carpets
or carpet off-cuts, blanket, pieces of cardboard, newspaper,
woven mats, cork, matted grass.
• Outdoor equipment Sandpit, water container, buckets, spades, scoops, climbing
frames, swings, slides, see-saw, balancing beams, bats, balls,
skipping ropes, hoops, bean bags, bicycles, tricycles, cars, hoops,
skittles, tyres.
• Children’s Books and print material Bought books, improvised books, magazines, cards.
• Construction Equipment Construction games are building activities. Equipment includes
190
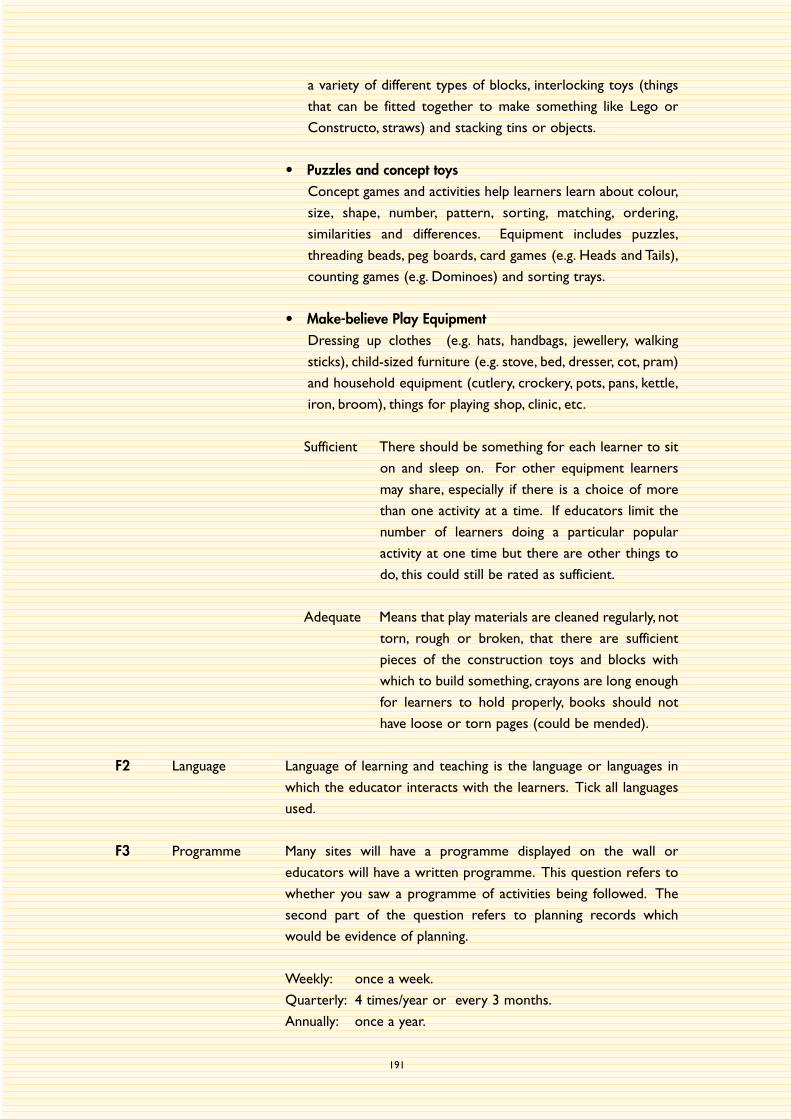
a variety of different types of blocks, interlocking toys (things
that can be fitted together to make something like Lego or
Constructo, straws) and stacking tins or objects.
• Puzzles and concept toys Concept games and activities help learners learn about colour,
size, shape, number, pattern, sorting, matching, ordering,
similarities and differences. Equipment includes puzzles,
threading beads, peg boards, card games (e.g. Heads and Tails),
counting games (e.g. Dominoes) and sorting trays.
• Make-believe Play Equipment Dressing up clothes (e.g. hats, handbags, jewellery, walking
sticks), child-sized furniture (e.g. stove, bed, dresser, cot, pram)
and household equipment (cutlery, crockery, pots, pans, kettle,
iron, broom), things for playing shop, clinic, etc.
Sufficient There should be something for each learner to sit
on and sleep on. For other equipment learners
may share, especially if there is a choice of more
than one activity at a time. If educators limit the
number of learners doing a particular popular
activity at one time but there are other things to
do, this could still be rated as sufficient.
Adequate Means that play materials are cleaned regularly, not
torn, rough or broken, that there are sufficient
pieces of the construction toys and blocks with
which to build something, crayons are long enough
for learners to hold properly, books should not
have loose or torn pages (could be mended).
F2 Language Language of learning and teaching is the language or languages in
which the educator interacts with the learners. Tick all languages
used.
F3 Programme Many sites will have a programme displayed on the wall or
educators will have a written programme. This question refers to
whether you saw a programme of activities being followed. The
second part of the question refers to planning records which
would be evidence of planning.
Weekly: once a week.
Quarterly: 4 times/year or every 3 months.
Annually: once a year.
191

F4 Activities Were there several activities for learners to do?
This question refers to activities in all the playrooms and outdoors.
Outdoor play activities: refers both to supervised free play out of
doors or organised outdoor games such as on-on, ndize ndize/hide
and seek, impuku nekati/ cat and mouse, ball games.
F5 Work displayed Children’s work includes their group or individual drawings,
paintings, cut and stick pictures, plasticine or clay models and
sewing, weavings etc.
F 6 Freedom Explore/experiment means to try out/do/handle things and
activities in different ways.
F7 Asking questions Questions relate to getting information, thinking about things
and not questions asking permission to do things.
F9 Special circumstances Circumstances which might dramatically have affected the
building, programme, attendance on the day of the audit, should
be entered here e.g. violence in the area, storm damage, a
severe outbreak of childhood illness, a recent theft of large
amounts of equipment etc.
If a site refuses to participate note this point here.
192
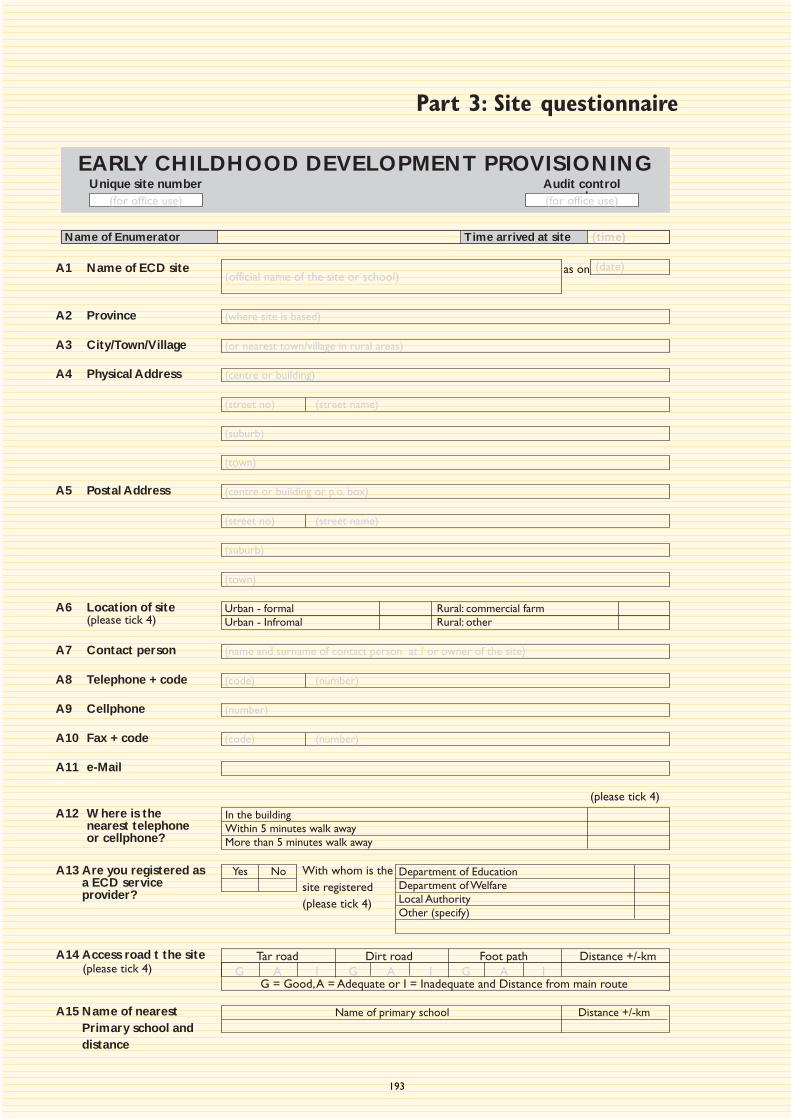
193
(code) (number)
A1 Name of ECD site
EARLY CHILDHOOD DEVELOPMENT PROVISIONINGUnique site number
(for office use)Audit control
number(for office use)
Name of Enumerator Time arrived at site (time)
as on(official name of the site or school)
(date)
(where site is based)A2 Province
(or nearest town/village in rural areas)A3 City/Town/Village
(centre or building)A4 Physical Address
(suburb)
(town)
(centre or building or p.o. box)A5 Postal Address
(street no) (street name)
(suburb)
(town)
Urban - formal Rural: commercial farmUrban - Infromal Rural: other
A6 Location of site (please tick 4)
(name and surname of contact person at / or owner of the site)A7 Contact person
(street no) (street name)
A8 Telephone + code
(number)A9 Cellphone
(code) (number)A10 Fax + code
A11 e-Mail
A12 Where is the nearest telephoneor cellphone?
In the buildingWithin 5 minutes walk awayMore than 5 minutes walk away
(please tick 4)
A13 Are you registered asa ECD service provider?
Yes No Department of EducationDepartment of WelfareLocal AuthorityOther (specify)
With whom is thesite registered(please tick 4)
A14 Access road t the site Tar road Dirt road Foot path Distance +/-kmG A I G A I G A I
G = Good, A = Adequate or I = Inadequate and Distance from main route
A15 Name of nearestPrimary school anddistance
Name of primary school Distance +/-km
(please tick 4)
Part 3: Site questionnaire

194
D6 Type and condition of building in which the site operates (please tick 4)
Department of EducationEmployerWelfare or service organisationPrivate ownerCommunity organisationChurch, mosque, temple etcOther (specify)Don’t know
D1 Who provides the ECD services? (please tick 4)Attached to a primary school?A class in primary school?A separate, freestanding site?At a private home?Housed in a multipurpose building such asa community centre or church hall?Other
D2 is the ECD site :- (please tick 4)
Less than one year1 to 2 years3 to 4 years5 years and overDon’t know
D3 How long has the site been operating? (please tick 4)5 days a week4 days a week3 days a week2 days a week1 day a weekSeasonally
D4 How often does the site operate (please tick 4)
Less than 3 hours3 to 4 hours5 to 6 hours8 to 10 hours10 to 12 hours24 hours when needed
D5a Hours open per day? Starting atYes No
D5b Are these boarding facilities for learners?
Type of building Good Adequate InadequateConventional - brick or block walls with tile or zinc roofTraditional - mortar or mud walls with zinc or thatch roofShipping containerPrefabOther (specify)
Outdoors meter sq.Learner play ground
D7 Area of learner’s play grounds(measure or pace off)
Tapped waterCommunal tap outside the site groundsNot within walking distanceOther (specify)
D8a Water availability (please tick 4)Piped / reservoirBoreholeTanksDams/riverOther (specify)None
D8b Water source (please tick 4)
Wired and supplied with electricityWired but not supplied with electricityNot wired and/or supplied with electricityGeneratorsOther (specify)
D9 Power and energy supply (please tick 4)High wall, hedge, fence with gate (> 1.8m)Low wall, hedge, fence with gate (1 - 1,8m)Wall, hedge or fence but no gateNo wall, hedge or fenceOther (specify)
D10 Is the site enclosed? (please tick 4)
(time)

195
D16 What do learners pay in monthly fees? (please tick 4)
Flush system to main sewerFlush system to septic tankVentilated improved pit (VIP) latrinePit latrineBucket latrineNone
D11aType of toilets? (please tick 4)Type Number Number not
available workingStaff toiletsLearner toiletsDisabled toiletsPotties
D11b Number of toilets (please tick 4)
Good Adequate InadequateOutdoors - learner play areaIndoor - learner spacesToiletsHand washing facilitiesKitchen
D12 General condition of sanitation, hygiene and safety in and around the site (please tick 4)
D13 Is there a separate kitchen or cooking area and what fuel is used? (please tick 4)Yes No Electricity Gas Paraffin Wood or coal No cooking
Room ofseperated Number of learners Age range of learners Number of educators Area
area meter sq.12345678
D14 Division of learners and number of educators for the usual groups (Area of learners spaces - indoors)
NumberWalkPublic/private transportTransport provided by the siteDon’t know
D15aHow do most learners get to the site?
Less than 1 kilometer1 to 2 kilometersMore than 2 kilometersDon’t know
D15aIf they walk, what distance do most of them walk?
Less than R25 R26 to R50 R51 to R75 More than R75Learners up to three yearsLearners three years and over
0 – 25 % 26 – 50% 51 – 75 % 76 – 100% Don’t know
D17 What percentage of learners/parents pay their own fees regularly?
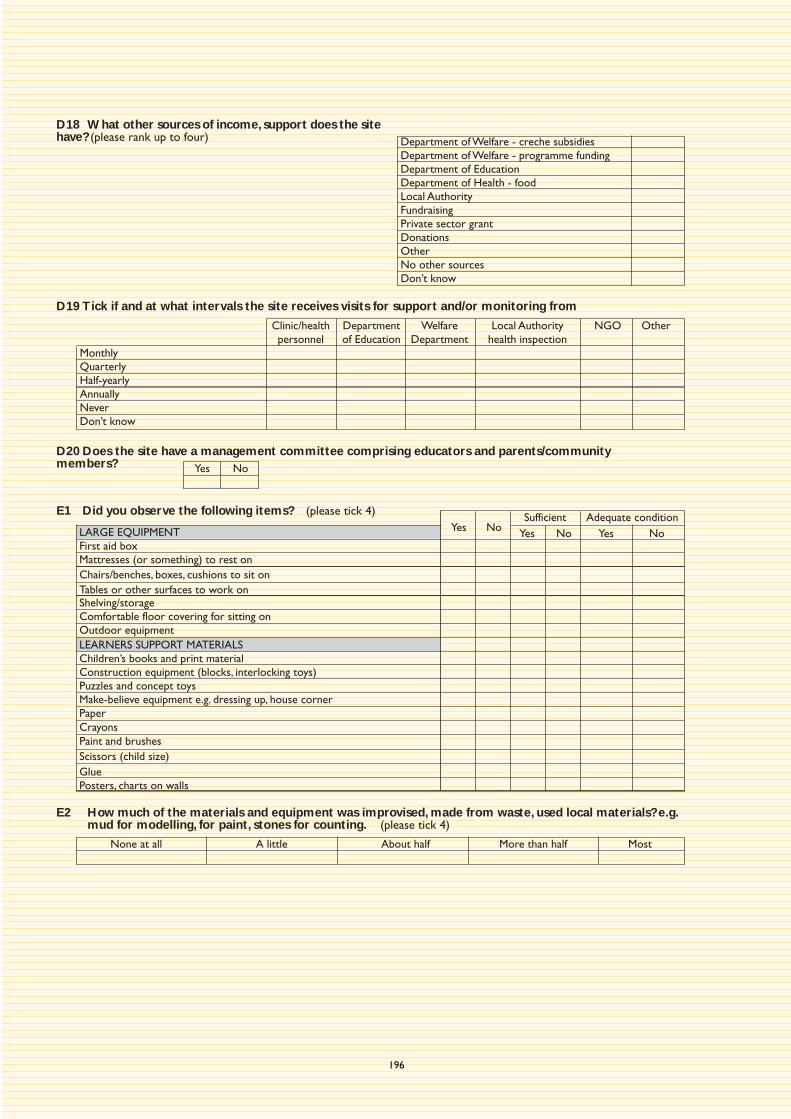
196
D18 What other sources of income, support does the sitehave? (please rank up to four)
D19 Tick if and at what intervals the site receives visits for support and/or monitoring from
Department of Welfare - creche subsidiesDepartment of Welfare - programme fundingDepartment of EducationDepartment of Health - foodLocal AuthorityFundraisingPrivate sector grantDonationsOtherNo other sourcesDon’t know
Clinic/health Department Welfare Local Authority NGO Otherpersonnel of Education Department health inspection
MonthlyQuarterlyHalf-yearlyAnnuallyNeverDon’t know
D20 Does the site have a management committee comprising educators and parents/communitymembers? Yes No
E1 Did you observe the following items? (please tick 4)
None at all A little About half More than half Most
E2 How much of the materials and equipment was improvised, made from waste, used local materials? e.g. mud for modelling, for paint, stones for counting. (please tick 4)
LARGE EQUIPMENTFirst aid boxMattresses (or something) to rest onChairs/benches, boxes, cushions to sit onTables or other surfaces to work onShelving/storageComfortable floor covering for sitting onOutdoor equipmentLEARNERS SUPPORT MATERIALSChildren’s books and print materialConstruction equipment (blocks, interlocking toys)Puzzles and concept toysMake-believe equipment e.g. dressing up, house cornerPaperCrayonsPaint and brushesScissors (child size)GluePosters, charts on walls
Yes No Yes No Yes NoSufficient Adequate condition

197
F1 Indicate which meals are provided and by whom?(please tick 4)Meal Site staff Brough from home
BreakfastMorning snackLunchAfternoon snackOther
F2 What is the language/s of learning and teaching?(please tick 4)
Afr
ikaa
ns
Engl
ish
IsiN
debe
le
IsiX
hosa
IsiZ
ulu
Sepe
di
Seso
tho
Sets
wan
a
SiSw
ati
Tsh
iven
da
Xits
onga
Oth
er
F4 During the visit was there a variety of other activities for learners to do? If yes, which of the following typesof activities did you observe? (please tick 4)
Yes No Routine times like toilet routine, rest, mealsLarge group activities like games, music, storyOutdoor play activitiesIndividual or small group activities
F5 Is the learners work displayed (please tick 4) Yes No
F6 Were the learners given freedom to explore and experiment with the equipment and activities provided?(please tick 4)
Not at all Some of the time Most of the time
F7 Did the educators actively encourage the learners to ask questions during most of the activities?(please tick 4)
Not at all Some of the time Most of the time
F8 Did the programme activities keep the learners interested and involved?(please tick 4)
Not at all Some of the time Most of the time
F3 Did you observe a programme of activities being followed? If yes, is there evidence of advance planning for this programme of activities and at what intervals? (please tick 4)
Yes No Day of the visit Weekly Monthly/Quarterly Annually
F9 Were there any special circumstances on the day of the audit which affected the completion of thisquestionnaire?
Yes No If yes, what?
Person/s at the site who supplied the information:Name Position Signature Date
Signature of Enumerator Time completed site audit(time)
Name of Data Capturer Signature Date(office use) (office use) (office use)Time started data capturing (office use) Time completed data capturing (office use)
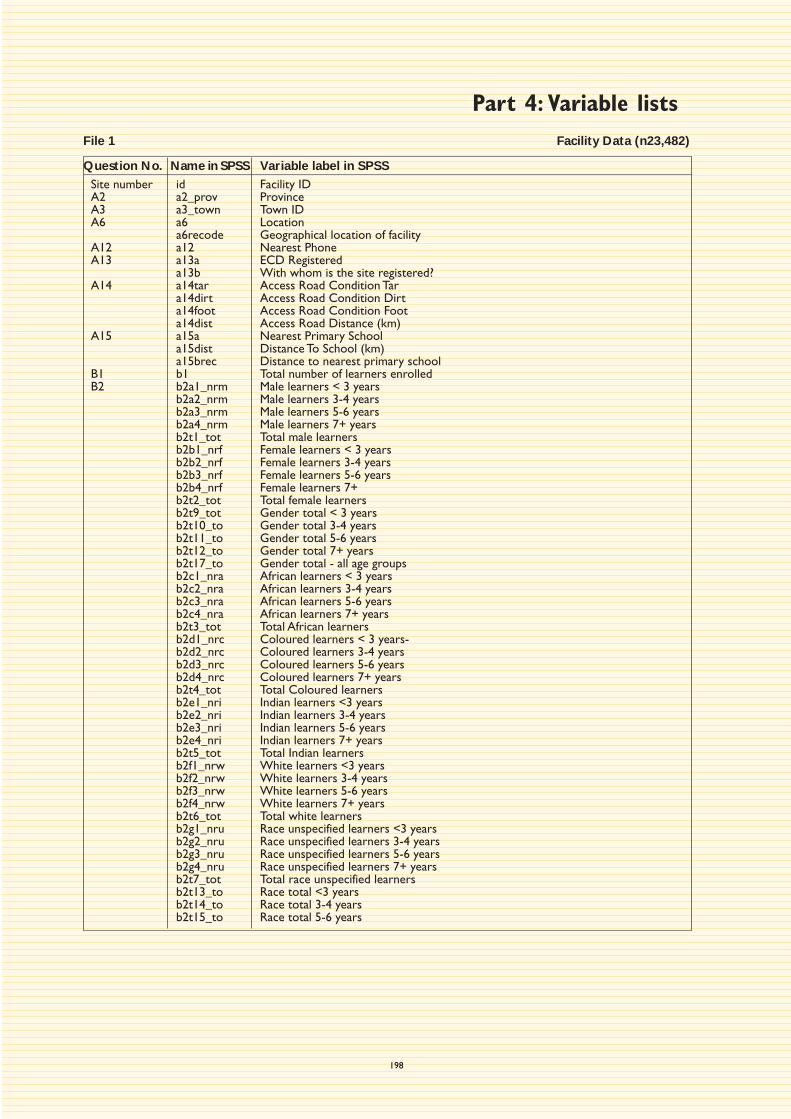
198
Question No. Name in SPSS Variable label in SPSSSite number id Facility IDA2 a2_prov ProvinceA3 a3_town Town IDA6 a6 Location
a6recode Geographical location of facilityA12 a12 Nearest PhoneA13 a13a ECD Registered
a13b With whom is the site registered?A14 a14tar Access Road Condition Tar
a14dirt Access Road Condition Dirta14foot Access Road Condition Foota14dist Access Road Distance (km)
A15 a15a Nearest Primary Schoola15dist Distance To School (km)a15brec Distance to nearest primary school
B1 b1 Total number of learners enrolledB2 b2a1_nrm Male learners < 3 years
b2a2_nrm Male learners 3-4 yearsb2a3_nrm Male learners 5-6 yearsb2a4_nrm Male learners 7+ yearsb2t1_tot Total male learnersb2b1_nrf Female learners < 3 yearsb2b2_nrf Female learners 3-4 yearsb2b3_nrf Female learners 5-6 yearsb2b4_nrf Female learners 7+b2t2_tot Total female learnersb2t9_tot Gender total < 3 yearsb2t10_to Gender total 3-4 yearsb2t11_to Gender total 5-6 yearsb2t12_to Gender total 7+ yearsb2t17_to Gender total - all age groupsb2c1_nra African learners < 3 yearsb2c2_nra African learners 3-4 yearsb2c3_nra African learners 5-6 yearsb2c4_nra African learners 7+ yearsb2t3_tot Total African learnersb2d1_nrc Coloured learners < 3 years-b2d2_nrc Coloured learners 3-4 yearsb2d3_nrc Coloured learners 5-6 yearsb2d4_nrc Coloured learners 7+ yearsb2t4_tot Total Coloured learnersb2e1_nri Indian learners <3 yearsb2e2_nri Indian learners 3-4 yearsb2e3_nri Indian learners 5-6 yearsb2e4_nri Indian learners 7+ yearsb2t5_tot Total Indian learnersb2f1_nrw White learners <3 yearsb2f2_nrw White learners 3-4 yearsb2f3_nrw White learners 5-6 yearsb2f4_nrw White learners 7+ yearsb2t6_tot Total white learnersb2g1_nru Race unspecified learners <3 yearsb2g2_nru Race unspecified learners 3-4 yearsb2g3_nru Race unspecified learners 5-6 yearsb2g4_nru Race unspecified learners 7+ yearsb2t7_tot Total race unspecified learnersb2t13_to Race total <3 yearsb2t14_to Race total 3-4 yearsb2t15_to Race total 5-6 years
File 1 Facility Data (n23,482)
Part 4: Variable lists

199
Question No. Name in SPSS Label in SPSS
B2 continued b2t16_to Race total 7+ yearsb2t18_to Race total - all age groupsclass80 Dominant race of learners (80% cut-off point)b2h1_nrw Learners with disabilities < 3 yearsb2h2_nrw Learners with disabilities 3-4 yearsb2h3_nrw Learners with disabilities 5-6 yearsb2h4_nrw Learners with disabilities 7+ yearslsumdisb Total nr of learners with disabilitiesl3yrs Sites with learners younger than 3 years oldlyrs3_4 Sites with learners 3 and 4 yrs oldlyrs5_6 Sites with learners 5 and 6 years oldlyrs7 Sites with learners 7 years and olderb2tot3yr Learners younger than 3 yrsb2tot3_4 Learners aged 3 and 4b2tot5_6 Learners aged 5 and 6b2tot7 Learners older than 7lrns_att Learners in attendance
B3 b3a Number physical (movement) disability (disabled)b3b Number hearing impairment / deaf (disabled)b3c Number w visual impairment / blind (disabled)b3d Number mental disability (disabled)b3e Number cerebral palsied (disabled)b3f Number Severe Behaviour Disorder (disabled)b3g Number of Autistic (disabled)b3h Number Epileptic (disabled)b3i Number multiple disability (disabled)b3j Number Other disabled (disabled)b3k Number Don't Know (disabled)b3l Special Equipment - Phys (Movement) disabledb3m Special Equipment - Deafb3n Special Equipment - Blindb3o Physical Provision for Phys (Movement) disabledb3p Physical Provision for Deafb3q Physical Provision for Blinddisabl1 B3_1 (Physical movement disability) Recodeddisabl2 B3_2 (Deaf) Recodeddisabl3 B3_3 (Blind) Recodeddisabl4 B3_4 (Mental) Recodeddisabl5 B3_5 (Cerebral palsied) Recodeddisabl6 B3_6 (Severe behavior disorder) Recodeddisabl7 B3_7 (Autistic) Recodeddisabl8 B3_8 (Epileptic) Recodeddisabl9 B3_9 (Multiple) Recodeddisabl10 B3_10 (Other) Recodeddisabl11 B3_11 (DK) Recoded
B4 b4a Aware of leaners with HIV/AIDS?b4b Number of HIV/AIDS learners
B5 b5a1_nra Afrikaans learners <3 yearsb5a2_nra Afrikaans learners 3-4 yearsb5a3_nra Afrikaans learners 5-6 yearsb5a4_nra Afrikaans learners 7+ yearsb5t5_tot Total Afrikaans learnersb5b1_nre English learners <3 yearsb5b2_nre English learners 3-4 yearsb5b3_nre English learners 5-6 yearsb5b4_nre English learners 7+ yearsb5t6_tot Total English learnersb5c1_nri IsiNdebele learners <3 yearsb5c2_nri IsiNdebele learners 3-4 yearsb5c3_nri IsiNdebele learners 5-6 yearsb5c4_nri IsiNdebele learners 7+ years
File 1 Facility Data (n23,482)

200
File 1 Facility Data (n23,482)
B5 continued b5t7_tot Total IsiNdebele learnersb5d1_nri IsiXhosa learners <3 yearsb5d2_nri IsiXhosa learners 3-4 yearsb5d3_nri IsiXhosa learners 5-6 yearsb5d4_nri IsiXhosa learners 7+ learnersb5t8_tot Total IsiXhosa learnersb5e1_nri IsiZulu learners <3 yearsb5e2_nri IsiZulu learners 3-4 yearsb5e3_nri IsiZulu learners 5-6 yearsb5e4_nri IsiZulu learners 7+ yearsb5t9_tot Total IsiZulu learnersb5f1_nrs Sepedi learners <3 yearsb5f2_nrs Sepedi learners 3-4 yearsb5f3_nrs Sepedi learners 5-6 yearsb5f4_nrs Sepedi learners 7+ yearsb5t10_to Total Sepedi learnersb5g1_nrs Sesotho learners <3 yearsb5g2_nrs Sesotho learners 3-4 yearsb5g3_nrs Sesotho learners 5-6 yearsb5g4_nrs Sesotho learners 7+ yearsb5t11_to Total Sesotho learnersb5h1_nrs Setswana learners <3 yearsb5h2_nrs Setswana learners 3-4 yearsb5h3_nrs Setswana learners 5-6 yearsb5h4_nrs Setswana learners 7+ yearsb5t12_to Total Setswana learnersb5i1_nrs Siswati learners <3 yearsb5i2_nrs Siswati learners 3-4 yearsb5i3_nrs Siswati learners 5-6 yearsb5i4_nrs Siswati learners 7+ yearsb5t13_to Total SiSwati learnersb5j1_nrt Tshivenda learners <3 yearsb5j2_nrt Tshivenda learners 3-4 yearsb5j3_nrt Tshivenda learners 5-6 yearsb5j4_nrt Tshivenda learners 7+ yearsb5t14_to Total Tshivenda learnersb5k1_nrx Xitsonga learners <3 yearsb5k2_nrx Xitsonga learners 3-4 yearsb5k3_nrx Xitsonga learners 5-6 yearsb5k4_nrx Xitsonga learners 7+ yearsb5t15_to Total Xitsonga learnersb5l1_nro Other language learners <3 yearsb5l2_nro Other language learners 3-4 yearsb5l3_nro Other language learners 5-6 yearsb5l4_nro Other language learners 7+ yearsb5t16_to Total other language learners
C1 c1male Number of male educatorsc1fem Number of female educatorsc1nogend Number of gender-unknown educatorsc1r_a Number of Educators Popgroup A (Aggregate Data)c1r_c Number of Educators Popgroup C (Aggregate Data)c1r_i Number of Educators Popgroup I (Aggregate Data)c1r_w Number of Educators Popgroup W (Aggregate Data)c1r_u Number of Educators Popgroup Unspecified (Aggregate Data)c1inca Number of educators earning <R500c1incb Number of Educators Earning R501-R1500 (Aggregate Data)c1incc Number of Educators Earning R1501-R3000 (Aggregate Data)c1incd Number of Educators Earning >R3000 (Aggregate Data)c1ince Number of Educators Unspecified, Don't know marked (Aggregate Data)c1totg Number of educatorsc1incu Number of Educators Unspecified, Don't know not marked (Aggregate Data)
Question No. Name in SPSS Label in SPSS

201
File 1 Facility Data (n23,482)
Question No. Name in SPSS Label in SPSS
C1 continued ratiolrn Ratio of learners to educatorD1 d1 Who provides the ECD services?
d1_other Other value (Who provides the ECD services?)D2 d2 What Building
d2_other Other value (Building)d2recode Nature of site
D3 d3 How long has the site been operating?D4 d4 How often does the site operate?D5a d5a1 Starting time
d5a2 Hours open per dayD5b d5b Are there boarding facilities?D6 d6a Type of building
d6b Condition of buildingd6_other Other value (Type of building)
D7 d7 Area of learners' play groundratio1 Ratio of play area by learners presentratioadj Ratio of play area by learners present (adjusted)ratio_2 Ratio categories (median)
D8a d8a Water Availabilityd8a_oth Other value (Water availability)
D8b d8b1 Piped waterd8b2 Boreholed8b3 Tanksd8b4 Dams/riverd8b5 Otherd8b6 Noned8b_oth Other value (water source)nwater Water source (recoded)
D9 d9 Power/Energy supplyd9_oth Other value (power supply)power Power (recoded)nresourc Three resources
D10 d10 Is the site enclosed?d10_oth Other value (Is the site enclosed?)
D11a d11a Type of toiletstoilet Toilets (recoded)
D11b d11b1 Number of staff toiletsd11b2 Number of learner toiletsd11b3 Number of disabled toiletsd11b4 Number of pottiesd11b5 Number of staff toilets not workingd11b6 Number of learner toilets not workingd11b7 Number of disabled toilets not working
D12 d12a General condition - Outdoorsd12b General condition - Indoorsd12c General condition - toiletsd12d General condition - hand washing facilitiesd12e General condition - kitchen
D13 d13a Is there a separate kitchen?d13b Electricity used (kitchen)?d13c Gas used (kitchen)?d13d Paraffin used (kitchen)?d13e Wood or coal used (kitchen)?d13f No cooking
D14 d14ratio Area per learnerd14cat Area per learner (categories)
D15a d15a1 Number walkd15a2 Number public/private transportd15a3 Number site-provided transportd15a4 Number unknown transport

202
File 1 Facility Data (n23,482)
Question No. Name in SPSS Label in SPSS
D15b d15b Distance to walkD16 d16a Fees - Learners up to 3 years
d16b Fees - Learners 3 & overD17 d17 Learners/parents regularly paying their own feesD18 d18a Funding from Department of Welfare - creche subsidies (rank)
d18b Funding from Department of Welfare - programme funding (rank)d18c Funding from Department of Education (rank)d18d Funding from Department of Health - food (rank)d18e Funding from Local Authority (rank)d18f Funding from fundraising activities (rank)d18g Funding from private sector (rank)d18h Funding from Donations (rank)d18i Funding from Other (rank)d18j Funding from No Other Sources (rank)d18k Funding from Don't know (rank)
D19 d19a Visits from Clinic/Health Personneld19b Visits from Department of Educationd19c Visits from Welfare Departmentd19d Visits from Local Authority health inspectiond19e Visits from NGOd19f Visits from Othervisita D19_1 (Health personnel) Recodedvisitb D19_2 (DoE) Recodedvisitc D19_3 (DWelfare) Recodedvisitd D19_4 (Local Authority) Recodedvisite D19_5 (NGO) Recodedvisitf D19_6 (Other) Recoded
D20 d20 Management CommitteeE1 e1a1 Observed first aid box
e1a2 Observed mattressese1a3 Observed chairs/benchese1a4 Observed tablese1a5 Observed shelvinge1a6 Observed floor coveringe1a7 Observed outdoor equipmente1a8 Observed books & printed materiale1a9 Observed construction equipmente1a10 Observed puzzlese1a11 Observed make-believe equipmente1a12 Observed papere1a13 Observed crayonse1a14 Observed paint & brushese1a15 Observed scissorse1a16 Observed gluee1a17 Observed posters & chartse1b1 Sufficient first aid boxe1b2 Sufficient mattressese1b3 Sufficient chairs/benchese1b4 Sufficient tablese1b5 Sufficient shelvinge1b6 Sufficient floor coveringe1b7 Sufficient outdoor equipmente1b8 Sufficient books & printed materiale1b9 Sufficient construction equipmente1b10 Sufficient puzzlese1b11 Sufficient make-believe equipmente1b12 Sufficient papere1b13 Sufficient crayonse1b14 Sufficient paint & brushese1b15 Sufficient scissorse1b16 Sufficient glue
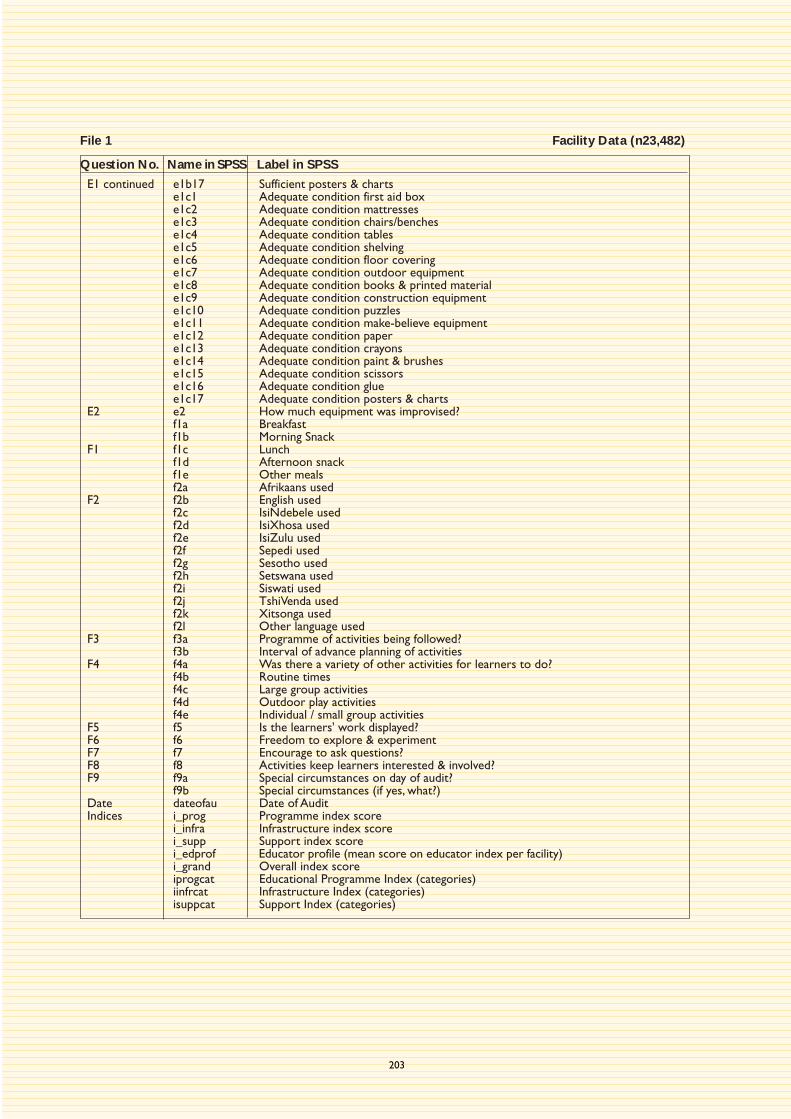
203
File 1 Facility Data (n23,482)
Question No. Name in SPSS Label in SPSS
E1 continued e1b17 Sufficient posters & chartse1c1 Adequate condition first aid boxe1c2 Adequate condition mattressese1c3 Adequate condition chairs/benchese1c4 Adequate condition tablese1c5 Adequate condition shelvinge1c6 Adequate condition floor coveringe1c7 Adequate condition outdoor equipmente1c8 Adequate condition books & printed materiale1c9 Adequate condition construction equipmente1c10 Adequate condition puzzlese1c11 Adequate condition make-believe equipmente1c12 Adequate condition papere1c13 Adequate condition crayonse1c14 Adequate condition paint & brushese1c15 Adequate condition scissorse1c16 Adequate condition gluee1c17 Adequate condition posters & charts
E2 e2 How much equipment was improvised?f1a Breakfastf1b Morning Snack
F1 f1c Lunchf1d Afternoon snackf1e Other mealsf2a Afrikaans used
F2 f2b English usedf2c IsiNdebele usedf2d IsiXhosa usedf2e IsiZulu usedf2f Sepedi usedf2g Sesotho usedf2h Setswana usedf2i Siswati usedf2j TshiVenda usedf2k Xitsonga usedf2l Other language used
F3 f3a Programme of activities being followed?f3b Interval of advance planning of activities
F4 f4a Was there a variety of other activities for learners to do?f4b Routine timesf4c Large group activitiesf4d Outdoor play activitiesf4e Individual / small group activities
F5 f5 Is the learners' work displayed?F6 f6 Freedom to explore & experimentF7 f7 Encourage to ask questions?F8 f8 Activities keep learners interested & involved?F9 f9a Special circumstances on day of audit?
f9b Special circumstances (if yes, what?)Date dateofau Date of AuditIndices i_prog Programme index score
i_infra Infrastructure index scorei_supp Support index scorei_edprof Educator profile (mean score on educator index per facility)i_grand Overall index scoreiprogcat Educational Programme Index (categories)iinfrcat Infrastructure Index (categories)isuppcat Support Index (categories)

204
File 2 Educator Data (n54,503)
Question No. Name in SPSS Variable label in SPSS
Site number id Facility IDA2 prov ProvinceA6 newlocat Geographical location of facilityA13 a13a ECD Registered
a13b With whom is the site registered?C1 designat Designation or job title
age Agenewage Age recoded (between 16 and 80)agecat Age categoriesagerec Age categories recodedageintvl Age intervalsgender Genderrace Raceschoolgr Highest school grade achievedgraderec School grade (categories)ecdquali Highest ECD qualification receivedqualif Qualification (recode)qualif2 Qualification (recode)nryearse Number of years ECD experienceexprec Teaching experience (categories)monthsal Monthly salary (category)sumlrner Total number of learners at facilityd2recode Nature of siteieducat Educator Profile Index (categories)
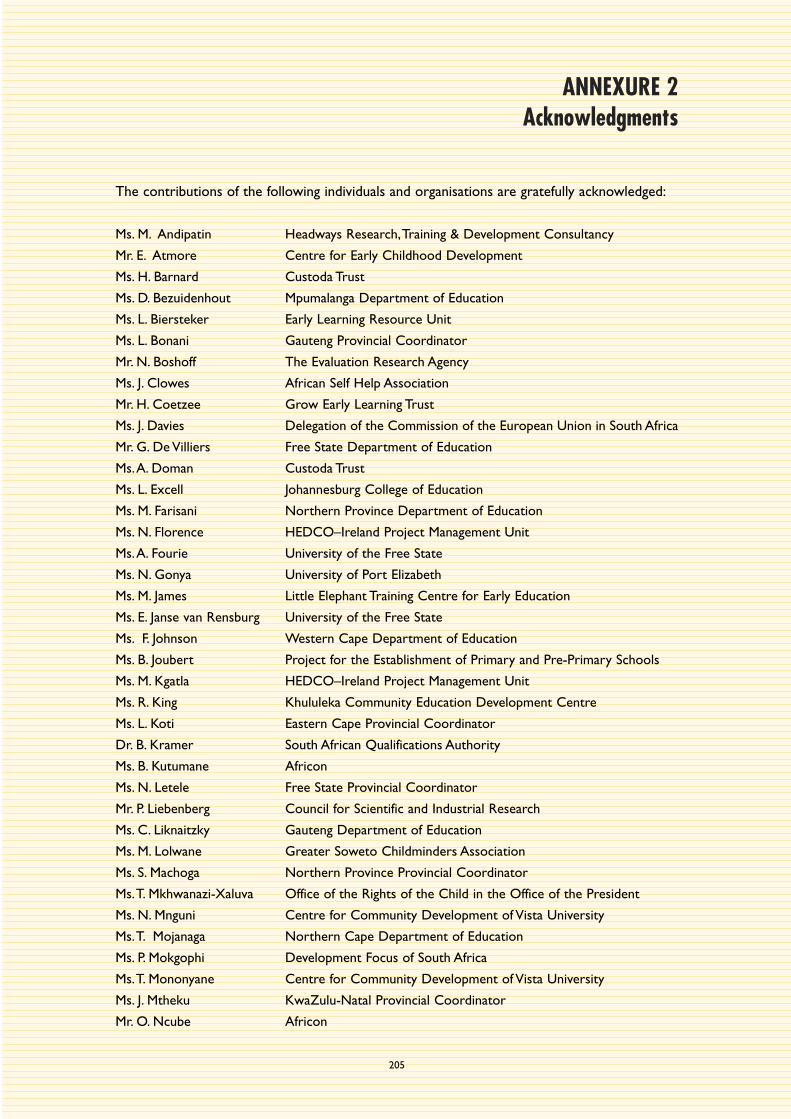
205
ANNEXURE 2Acknowledgments
The contributions of the following individuals and organisations are gratefully acknowledged:
Ms. M. Andipatin Headways Research,Training & Development Consultancy
Mr. E. Atmore Centre for Early Childhood Development
Ms. H. Barnard Custoda Trust
Ms. D. Bezuidenhout Mpumalanga Department of Education
Ms. L. Biersteker Early Learning Resource Unit
Ms. L. Bonani Gauteng Provincial Coordinator
Mr. N. Boshoff The Evaluation Research Agency
Ms. J. Clowes African Self Help Association
Mr. H. Coetzee Grow Early Learning Trust
Ms. J. Davies Delegation of the Commission of the European Union in South Africa
Mr. G. De Villiers Free State Department of Education
Ms.A. Doman Custoda Trust
Ms. L. Excell Johannesburg College of Education
Ms. M. Farisani Northern Province Department of Education
Ms. N. Florence HEDCO–Ireland Project Management Unit
Ms.A. Fourie University of the Free State
Ms. N. Gonya University of Port Elizabeth
Ms. M. James Little Elephant Training Centre for Early Education
Ms. E. Janse van Rensburg University of the Free State
Ms. F. Johnson Western Cape Department of Education
Ms. B. Joubert Project for the Establishment of Primary and Pre-Primary Schools
Ms. M. Kgatla HEDCO–Ireland Project Management Unit
Ms. R. King Khululeka Community Education Development Centre
Ms. L. Koti Eastern Cape Provincial Coordinator
Dr. B. Kramer South African Qualifications Authority
Ms. B. Kutumane Africon
Ms. N. Letele Free State Provincial Coordinator
Mr. P. Liebenberg Council for Scientific and Industrial Research
Ms. C. Liknaitzky Gauteng Department of Education
Ms. M. Lolwane Greater Soweto Childminders Association
Ms. S. Machoga Northern Province Provincial Coordinator
Ms.T. Mkhwanazi-Xaluva Office of the Rights of the Child in the Office of the President
Ms. N. Mnguni Centre for Community Development of Vista University
Ms.T. Mojanaga Northern Cape Department of Education
Ms. P. Mokgophi Development Focus of South Africa
Ms.T. Mononyane Centre for Community Development of Vista University
Ms. J. Mtheku KwaZulu-Natal Provincial Coordinator
Mr. O. Ncube Africon

Mr. M. Ndeya Northern Cape Provincial Coordinator
Mr. B. Ndou Development Focus of South Africa
Ms. P. Picken Training for Resources in Early Education
Ms. P. Pillay New Beginnings Early Childhood Training and Development Project
Dr. C. Potgieter Headways Research,Training & Development Consultancy
Mr. M. Purchase Mpumalanga ECD Resource and Training Organisations Forum
Ms. G. Reddy Mpumalanga ECD Resource and Training Organisations Forum
Dr.A. Rossouw University of Port Elizabeth
Ms. M. Rowlette University of the Free State
Ms. J. Sachs KwaZulu-Natal Department of Education
Ms. S. Seabi North West Province Provincial Coordinator
Ms. J. Seleti HEDCO–Ireland Project Management Unit
Ms. U. Segers Mpumalanga ECD Resource and Training Organisations Forum
Ms. B. Sibisi Hlanganani Pre School Association
Ms. P. Sithole Mpumalanga Provincial Coordinator
Dr. C. Sugrue St. Patrick’s College, Dublin.
Mr. G.Tsibani University of Port Elizabeth
Ms.V. Tsukudu Western Cape Provincial Coordinator
Mr. S. van der Walt Africon
Mr. M. van Schoor The Evaluation Research agency
Ms. J. van Wyk North West Province Department of Education
Mr.V. Weitz National Educare Forum
Ms.A. Witbooi Custoda Trust
Ms. N. Zibi Eastern Cape Department of Education
Ms. M. Zwane Development Focus of South Africa
In addition to the above, the contributions of the members of the National and Provincial
Steering Committees and the Research and Publications Committee are acknowledged and
appreciated.
A special word of thanks is expressed to the 854 enumerators whose perseverance, diligence
and tenacity ensured the success of the Audit: Ngiyabonga, Enkosi, Baie dankie,Thank you, Ke
tlisa ditebogo, Ke ya le leboga, Ke a leboga, Ha’khensa, Ndi ya livhuwa, Siya thokoza.
206

Notes
207

208
Notes
Copyright © 2022 FDOKUMEN