ECD Trends in the Eastern Cape, South Africa
16
56 © Unisa Press ISSN 1727-7140 Commonwealth Youth and Development Vol 8 no 1 2010 pp. 56-71 EARLY CHILDHOOD DEVELOPMENT (ECD) TRENDS in the province of the Eastern Cape, South Africa MOEKETSI LETSEKA 1 ABSTRACT This article interrogates early childhood development (ECD) provisioning in the province of the Eastern Cape, South Africa. It argues that while well-structured and integrated early childhood development (ECD) programmes are at the epicentre of sustainable national human resource development (HRD) strategies, the Eastern Cape’s infant mortality rate (IMR) of 61.2 per 1000 live births is the highest in South Africa. It reaches alarming rates of 99 deaths per 1000 live births in the eastern part of the province where poverty is rife. This scenario mirrors national trends in that while South Africa is rated as an upper middle-income country and a prominent economy that accounts for over 75% of the entire SADC’s GDP, 40% of its young children grow up in abject poverty. It argues that in order for the Eastern Cape to be competitive and sustainable in the long term, the provincial government needs to invest heavily in the well-being of children through well-structured and sustainable ECD programmes. “For every child, health, education, equality, protection and advanced humanity”. (UNICEF 2003) Introduction Integrated early childhood development (ECD) programmes are critical to sustainable national human resource development (HRD) strategies. Nations that invest in successful ECD programmes recognise the significance of the overall health, nutrition, education, psychosocial factors and the welfare of children. They respect international conventions and protocols on the rights, protection and survival of children, and are committed to the attainment of development goals and eradication of poverty. In this article I interrogate provision of ECD in the province of the Eastern Cape. The
-
Upload
unisouthafr -
Category
Documents
-
view
3 -
download
0
Transcript of ECD Trends in the Eastern Cape, South Africa
56 © Unisa Press IssN 1727-7140 Commonwealth Youth and Development Vol 8 no 1 2010 pp. 56-71
EARLY CHILDHOOD DEVELOPMENT (ECD) TRENDs
in the province of the Eastern Cape, south Africa
MOEKETSI LETSEKA1
ABSTRACTThis article interrogates early childhood development (ECD) provisioning in the province of the Eastern Cape, South Africa. It argues that while well-structured and integrated early childhood development (ECD) programmes are at the epicentre of sustainable national human resource development (HRD) strategies, the Eastern Cape’s infant mortality rate (IMR) of 61.2 per 1000 live births is the highest in South Africa. It reaches alarming rates of 99 deaths per 1000 live births in the eastern part of the province where poverty is rife. This scenario mirrors national trends in that while South Africa is rated as an upper middle-income country and a prominent economy that accounts for over 75% of the entire SADC’s GDP, 40% of its young children grow up in abject poverty. It argues that in order for the Eastern Cape to be competitive and sustainable in the long term, the provincial government needs to invest heavily in the well-being of children through well-structured and sustainable ECD programmes.
“For every child, health, education, equality, protection and advanced humanity”. (UNICEF 2003)
IntroductionIntegrated early childhood development (ECD) programmes are critical to sustainable national human resource development (HRD) strategies. Nations that invest in successful ECD programmes recognise the signifi cance of the overall health, nutrition, education, psychosocial factors and the welfare of children. They respect international conventions and protocols on the rights, protection and survival of children, and are committed to the attainment of development goals and eradication of poverty. In this article I interrogate provision of ECD in the province of the Eastern Cape. The
Moeketsi Letseka 57
Eastern Cape is one of the vastly rural and poorest provinces in terms of average monthly household expenditure. It is known for poor infrastructure, limited employment opportunities, large youthful populations and chronic levels of poverty. It has been described as the province most in need of infrastructural development like clean water and sanitation, and improvement of life circumstances such as employment creation and family planning (Statistics South Africa 2000).
This article is divided into four sections. In section two I sketch national trends on ECD. The United Nations Children’s Fund (UNICEF)’s ranking of under-five mortality rates (U5MR) suggests that South Africa performs poorly. 40% of its children grow up in abject poverty. This is notwithstanding that South Africa is a prominent economy in the Southern African Development Community (SADC) and the continent of Africa. In section three I tease out provisions of the Education White Paper Five (5) on Early Childhood Development (WP5),2 which I argue are consistent with ECD goals of UNICEF’s (2001) report, The State of the World’s Children. In section four I examine the Department of Education (DoE) (2001)’s report on the nation-wide audit of ECD provisioning. This is an invaluable document that provides data on ECD sites nation-wide, and highlights the sites’ (in) accessibility to essential services such as electricity, piped water and flushing toilets, their registered status, whether with the DoE, Department of Social Welfare, or local authority. In section five I debate the Eastern Cape province’s capacity to provide sustainable ECD programmes. In section six I provide concluding remarks.
National trends on ECDUNICEF’s The state of the world’s children series challenges governments to prioritise well-planned ECD programmes. Such programmes are solid building blocks for sustainable development of economically viable human resources (Anderson et al 2002, 2003; Evans 2001; Berlin et al 2001; Atmore 2001, 1998). Writing in the foreword to the World Bank’s (2002, v) From early child development to human development, Ramphele observes that
New insights from neuroscience and behavioural and social science underscore the importance of giving children a better chance in life. Nurturing them in their early years is vital for attacking the worst effects of poverty and may be an effective way to break the relentless, vicious cycle of poverty that, too often, crosses generations
Similarly, Young (2002, 1) argues that “early child development (ECD) programmes that comprehensively address children’s basic needs – health, nutrition, and emotional and intellectual development – foster development of capable and productive adults”. South Africa is an upper middle-income country along Brazil and Malaysia (Budlender 1999; Macdonald 2006). Its economy accounts for nearly 70% of SADC’s GDP (Mwambande 2003; Kritzinger-van Niekerk and Moreira 2002; Development Policy

Early childhood development (ECD) trendsEarly childhood development (ECD) trends58
Research Unit 2000; Mills 1998), and it accounted for $10.6 billion of the Middle East and Africa’s $18.2 billion spending on IT in 1999 (Letseka 2001). Yet it performs poorly in UNICEF’s U5MR compared with countries such as Botswana and Namibia.
Writing in the Preface to the WP5, former Education Minister Kadar Asmal recounts the experience of being invited to the launch of UNICEF’s report The state of the world’s children 2001. However, this is dampened by South Africa’s poor performance in the U5MR. The U5MR is a critical indicator of children’s well-being. It measures the end-result of the development process rather than the ‘input’ such as school enrolment level, per capita calorie availability, or the number of doctors per thousand population; it is known to be the result of a wide variety of inputs such as the nutritional health and the health knowledge of mothers; the level of immunization and Oral Rehydration Therapy (ORT) use; the availability of maternal and child health services; income and food availability in the family; the availability of clean water and safe sanitation; the overall safety of the child’s environment, and it is less susceptible to the fallacy of the average. South Africa was ranked 66th behind Botswana, Morocco, Egypt, Algeria, Tunisia, Mauritius, Libya, and Seychelles (see Table 1). My view is that South Africa has the resources and capacity to suffi ciently feed its children, clothe them, and provide access to quality ECD intervention programmes.
Table 1
UNDER-5 MORTALITY RATE
Country Value Rank
South Africa 69 66
Botswana 59 69
Morocco 53 72
Egypt 52 73
Algeria 41 87
Tunisia 30 101
Mauritius 23 119
Libya 22 123
Seychelles 17 139
(Source: UNICEF 2001)
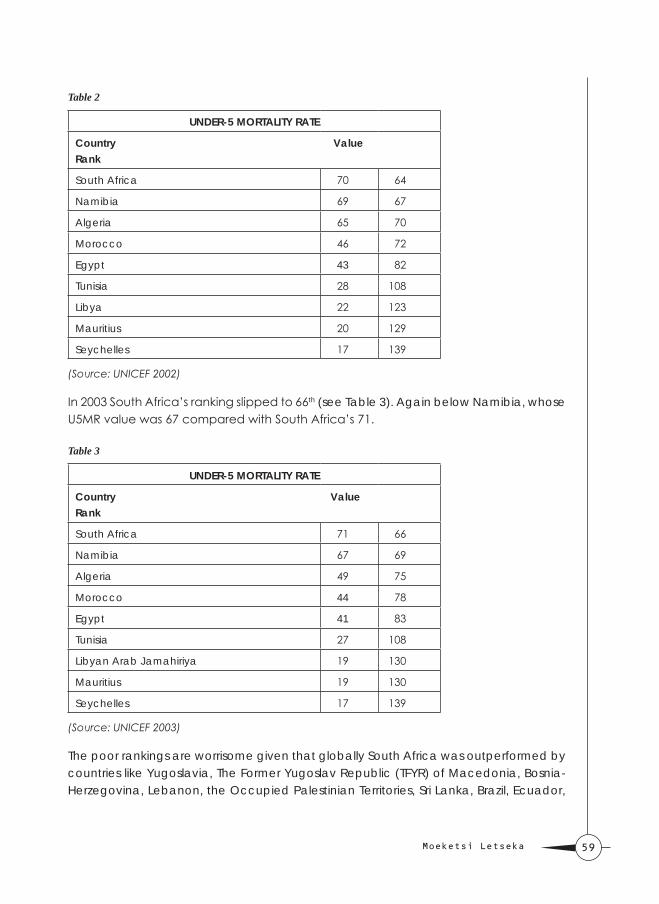
South Africa improved its ranking to 64th in 2002, and had an U5MR value of 70 (see Table 2). But it was outperformed by Namibia whose value was 69. Some might argue that the difference of one point is insignifi cant. But that one point has a huge impact on global rankings and is generously rewarded with respect to investor confi dence.
Moeketsi Letseka 59
Table 2
UNDER-5 MORTALITY RATE
Country Value Rank
South Africa 70 64
Namibia 69 67
Algeria 65 70
Morocco 46 72
Egypt 43 82
Tunisia 28 108
Libya 22 123
Mauritius 20 129
Seychelles 17 139
(Source: UNICEF 2002)
In 2003 South Africa’s ranking slipped to 66th (see Table 3). Again below Namibia, whose U5MR value was 67 compared with South Africa’s 71.
Table 3
UNDER-5 MORTALITY RATE
Country Value Rank
South Africa 71 66
Namibia 67 69
Algeria 49 75
Morocco 44 78
Egypt 41 83
Tunisia 27 108
Libyan Arab Jamahiriya 19 130
Mauritius 19 130
Seychelles 17 139
(Source: UNICEF 2003)
The poor rankings are worrisome given that globally South Africa was outperformed by countries like Yugoslavia, The Former Yugoslav Republic (TFYR) of Macedonia, Bosnia-Herzegovina, Lebanon, the Occupied Palestinian Territories, Sri Lanka, Brazil, Ecuador,
Early childhood development (ECD) trendsEarly childhood development (ECD) trends60
Paraguay, Jamaica, and Argentina. These are countries that were either involved in protracted civil strife and bloody violence or were under severe economic hardships and abject poverty.
If children’s rights and well-being are not suffi ciently addressed by governments and their international partners, development goals will never be met (UNICEF 2003; World Bank 2001, 2002). While the South African government has prioritised ECD in many of its policies and programmes, departments with a key responsibility for ECD have as been unable to direct suffi cient resources to ECD services (Bierksteker 2002). The WP5 acknowledges that approximately 40% of children grow up in conditions of abject poverty and neglect. For Ngwane et al (2001, 201), poverty “connotes a state of deprivation. Deprivation can be based on the comparison of an individual’s economic state with either an absolute norm, in which case it is called ‘absolute deprivation’, or a normative or relative norm, in which case it is called ‘relative deprivation’”. This coheres with the UNDP (1998, 14), for which poverty as “the denial of opportunities and choices most basic to human development to lead a long, healthy, creative life and enjoy a decent standard of living, freedom, dignity, self-esteem and respect from others”. Similarly, the World Bank (2001, 15) defi nes poverty as “pronounced deprivation in well-being”. It argues that to be poor is to be hungry, to lack shelter and clothing, to be sick and not cared for, to be illiterate and not schooled. It further argues that “poor people are particularly vulnerable to adverse events outside their control. They are often treated badly by the institutions of state and society and excluded from voice and power of those institutions”.
Monare (2003) reports on a grandmother who is raising and educating eight grandchildren on a R700 monthly state pension grant. She qualifi es for exemption from fees under provisions of the National Norms and Standards of School Funding (DoE 1998), but she is not made aware of this by the institutions of the state. As a consequence her deprivation continues to worsen. She laments: “If I don’t give them (the schools) anything, I’m likely to meet my grandchildren at the gate returning from school. The schools send them home every payday to get money. They say they must not return until they get the money”. As Ramphele (2002, v) warns, “children who live in poverty cannot go to school, do not learn to read, will have diffi culty fi nding a job, and will have little hope for their, and their children’s future”. The reason for this is that “poverty diminishes people’s spiritual resources, peace of mind, dignity, and freedom to live fully”.
The global picture is also less inspiring: “The world has deep poverty amid plenty. Of the world’s 6 billion people, 2.8 billion - almost half - live on less than $2 a day, and 1.2 billion - a fi fth - live on less than $1 a day” (World Bank 2001, 3). Former World Bank President, James Wolfensohn explains: “Six infants of every 100 do not see their fi rst birthday, and 8 do not survive to their fi fth. Of those who do reach school age, 9 boys in 100, and 14
Moeketsi Letseka 61
girls, do not go to primary school” (World Bank 2001, vi). Contrast this with the fact that US presidential elections in 2008 cost an estimated $5.3 billion (Centre for Responsive Politics 2008). It should be noted notwithstanding this disproportionate cost of elections the rate of child poverty in the United States is substantially higher than that of most other Western industrialised nations, and children are almost twice as likely as any other age group to live in poverty (Anderson et al 2003, 32).
Back to the UNICEF surveys, the best ranked African country was the Seychelles, followed by Mauritius, Libya, Tunisia, Egypt, Morocco, Algeria, Botswana and Namibia. These countries also performed well in the Africa Competitiveness Index. Botswana fell from the rankings in subsequent reports because it is one of sub-Saharan countries that is at the centre of the HIV and AIDS epidemic (UNAIDS 2002; World Bank 2001). However, it bounced back as the highest ranked African country in the World Economic Forum (WEF)’s (2003) Global Competitiveness Index 2003-2004(GCI), while South Africa slipped from 34th to 42nd. For WEF Executive Chairman Klaus Schwab, the GCI contributes to our understanding of the key ingredients of economic growth and prosperity by highlighting the strengths and weaknesses of an economy, and by assisting policymakers and business leaders in their decision-making (Donaldson 2003).
Education White Paper Five (5) on Early Childhood DevelopmentThe WP5 defines ECD as “a comprehensive approach to policies and programmes for children from birth to nine years of age with the active participation of their parents and caregivers. Its purpose is to protect the child’s rights to develop his or her full cognitive, emotional, social and physical potential” (DoE 2001a, 1.3.1). This definition draws on UNICEF’s The state of the world’s children 2001 (2001), which advocates the full involvement of critical stakeholders. The UNICEF argues that “the most effective ECD programmes are integrated and multidimensional, fostering children’s good health and nutrition and their cognitive, social and emotional abilities. Reflecting cultural values, the best of these programmes are deeply rooted within families and communities, blending what is known about the best environments for optimal child development with an understanding of traditional child-rearing practices”. It identifies ten criteria for successful ECD programmes as follows: they incorporate the principles of the Convention on the Rights of the Child, ensuring non-discrimination, the child’s best interests, the right to survival and full development; they eliminate all forms of discrimination against women, recognising that ensuring women’s rights is basic to ensuring child rights; they use existing strength of communities, families and social structures; they encompass multidimensional programmes in health, nutrition and the child’s psychosocial and cognitive development; they are developed with and for families, respecting the rights of women and siblings for schooling and for enjoyment of their own childhood; they are developed with and for communities, respecting cultural values, building local capacity, creating ownership and accountability; they provide
Early childhood development (ECD) trendsEarly childhood development (ECD) trends62
equal access for all children, including girls and those at risk of delayed development and disabilities; they are fl exible and refl ect diversity; they meet the highest quality standards, and they are cost-effective and sustainable (UNICEF 2001, 17).
The WP5 commits to the advancement of the rights of children by embracing provisions of the World Declaration on the Survival, Protection and Development of Children (1.2.3.1). It advocates the freeing of women from the chores of early childhood development for the purpose of raising incomes for families, especially those living in poverty. It argues that this can precipitate dramatic social and economic development in local communities (1.2.3.3). The WP5 proposes an integrated approach to child development, which emphasises the importance of the child’s health, nutrition, education, psychosocial and additional environmental factors within the context of the family and the community (1.3.3). It recognises that community-based services that meet the needs of infants and children are vital to ECD and should include attention to health, nutrition, physical development, curriculum and water and environmental sanitation in homes and communities (1.3.4), and it seeks to ensure that all children aged 5 turning 6 have access to Reception Year (Grade R) programmes. In 2000 the DoE conducted a nation-wide audit of ECD provisioning. Below I briefl y scan this document with the view to understanding ECD nationally, and in the Eastern Cape.
The nationwide audit of ECD provisioning in South AfricaThe DoE and the European Union jointly conducted an audit of ECD to provide “accurate information on the nature and extent of ECD provisioning, services and resources across the country in order to inform and support ongoing policy and planning initiatives in this crucial and expanding sector” (DoE 2001b,1). The audit draws on the White Paper on Education and Training (1995) which conceives of ECD as “an umbrella term which applies to the process by which children from birth to nine years grow and thrive, physically, mentally, emotionally, morally and socially” (DoE 2001b, 13–14). It relies on the Constitution’s provision “to protect the rights of young children including their right to basic education, health care, nutrition and security” (DoE 2001b, 14).
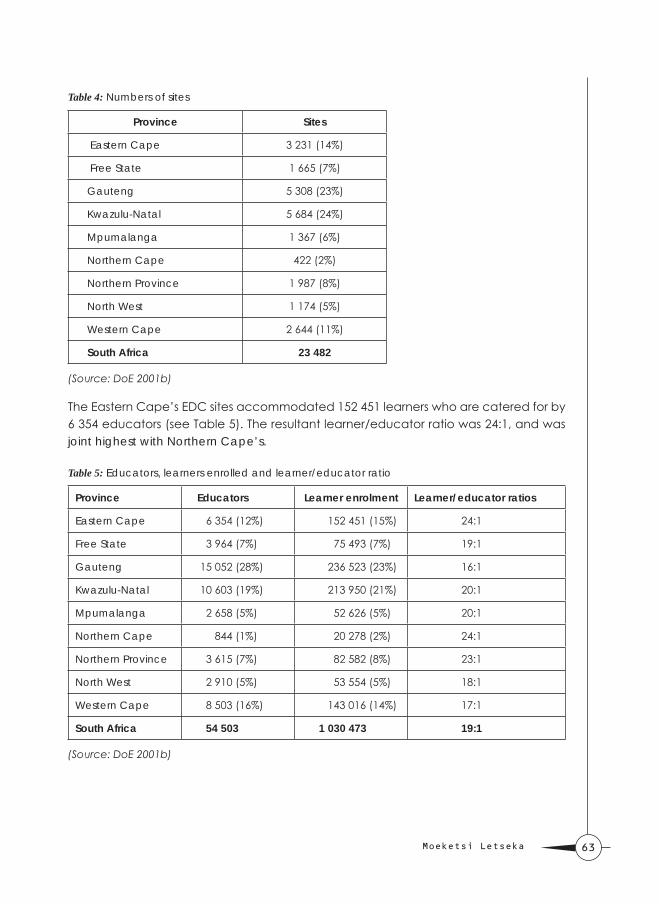
Overall 23 482 ECD sites were audited nationally in which 1, 030, 473 learners were enrolled and catered for by 54, 503 educators (See Tables 4 and 5 below). Out of this overall fi gure the Eastern Cape had 3 231or 14%, third highest after Kwazulu-Natal (5 684) and Gauteng (5 308).
Moeketsi Letseka 63
Table 4: Numbers of sites
Province Sites
Eastern Cape 3 231 (14%)
Free State 1 665 (7%)
Gauteng 5 308 (23%)
Kwazulu-Natal 5 684 (24%)
Mpumalanga 1 367 (6%)
Northern Cape 422 (2%)
Northern Province 1 987 (8%)
North West 1 174 (5%)
Western Cape 2 644 (11%)
South Africa 23 482
(Source: DoE 2001b)
The Eastern Cape’s EDC sites accommodated 152 451 learners who are catered for by 6 354 educators (see Table 5). The resultant learner/educator ratio was 24:1, and was joint highest with Northern Cape’s.
Table 5: Educators, learners enrolled and learner/educator ratio
Province Educators Learner enrolment Learner/educator ratios
Eastern Cape 6 354 (12%) 152 451 (15%) 24:1
Free State 3 964 (7%) 75 493 (7%) 19:1
Gauteng 15 052 (28%) 236 523 (23%) 16:1
Kwazulu-Natal 10 603 (19%) 213 950 (21%) 20:1
Mpumalanga 2 658 (5%) 52 626 (5%) 20:1
Northern Cape 844 (1%) 20 278 (2%) 24:1
Northern Province 3 615 (7%) 82 582 (8%) 23:1
North West 2 910 (5%) 53 554 (5%) 18:1
Western Cape 8 503 (16%) 143 016 (14%) 17:1
South Africa 54 503 1 030 473 19:1
(Source: DoE 2001b)

Early childhood development (ECD) trendsEarly childhood development (ECD) trends64
The province’s ECD learner attendance rate of 77% was the lowest of the nine provinces, and 11 percentage points below the national average of 86 % (see Table 6).
Table 6: Educators, learners enrolled and learner/educator ratio
Province Learner enrolment Learners in attendance
Attendance rate
Eastern Cape 152 451 (15) 111 742 77%
Free State 75 493 (7) 66 593 88%
Gauteng 236 523 (23) 213 695 90%
Kwazulu-Natal 213 950 (21) 183 017 86%
Mpumalanga 52 626 (5) 47 303 90%
Northern Cape 20 278 (2) 16 815 83%
Northern Province 82 582 (8) 73 796 89%
North West 53 554 (5) 45 867 86%
Western Cape 143 016 (14) 122 850 86%
South Africa 1 030 473 886 678 86%
(Source: DoE 2001b)
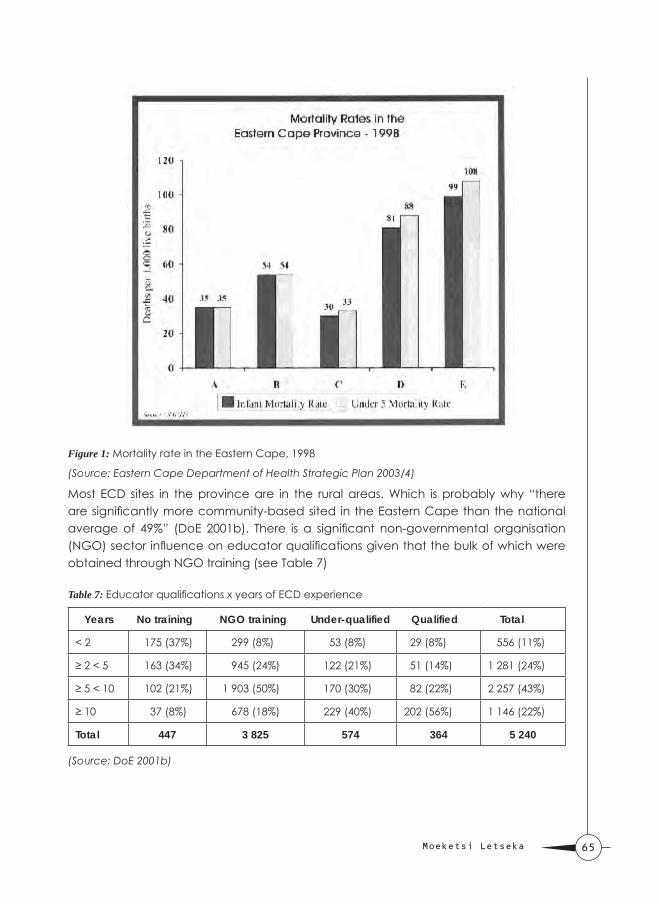
The Eastern Cape (in) capacity for ECD provisioningTwo salient points about the Eastern Cape’s capacity for ECD provisioning stand out. First, it is vastly rural (61.2%), second only to Limpopo (86.7%) (Statistics South Africa 2003a). Second, it is one of the poorest provinces in terms of average monthly household expenditure. The province has a legacy of poor infrastructure, limited employment opportunities, large youthful populations and chronic poverty. It is one of the provinces most in need of infrastructural development like clean water and sanitation, improvement of life circumstances such as employment creation and family planning (Statistics South Africa 2000). The provincial Health Department (2003) acknowledges that infant mortality rate (IMR) of 61.2 per 1000 live births is the highest in South Africa. It notes that in the eastern part of the province where poverty is rife, there is lack of access to safe water for household, lack of proper integrated care of childhood illnesses, and IMR can be as high as 99 deaths per 1000 live births (see Figure 1).
Moeketsi Letseka 65
Figure 1: Mortality rate in the Eastern Cape, 1998
(Source: Eastern Cape Department of Health Strategic Plan 2003/4)
Most ECD sites in the province are in the rural areas. Which is probably why “there are significantly more community-based sited in the Eastern Cape than the national average of 49%” (DoE 2001b). There is a significant non-governmental organisation (NGO) sector influence on educator qualifications given that the bulk of which were obtained through NGO training (see Table 7)
Table 7: Educator qualifications x years of ECD experience
Years No training NGO training Under-qualified Qualified Total
< 2 175 (37%) 299 (8%) 53 (8%) 29 (8%) 556 (11%)
≥ 2 < 5 163 (34%) 945 (24%) 122 (21%) 51 (14%) 1 281 (24%)
≥ 5 < 10 102 (21%) 1 903 (50%) 170 (30%) 82 (22%) 2 257 (43%)
≥ 10 37 (8%) 678 (18%) 229 (40%) 202 (56%) 1 146 (22%)
Total 447 3 825 574 364 5 240
(Source: DoE 2001b)

Early childhood development (ECD) trendsEarly childhood development (ECD) trends66
A large proportion of Eastern Cape ECD sites (58%) are registered with the Department of Welfare (see Table 8). They are less developed and lacking in terms of basic infrastructure. Access to their services is lower than national average (Biersteker and Newman 2003), which is probably why only 30% have piped water, fl ushing toilets and mains electricity compared with national access of 53%. 35% are rated ‘below average’ compared with 18% nationally, and 11% are rated ‘above average’ compared to 19% nationally (DoE 2001b, 66).
Table 8: ECD site registration status
Registered with Frequency
Department of Education 699 (26%)
Department of Welfare 1 592 (58%)
Local Authority 283 (10%)
Other 170 (6%)
Total 2 744
(Source: DoE 2001b)
Sustainable ECD programmes draw on unrestricted buy-in from critical stakeholders - parents, communities, civil society, non-governmental organisation (NGOs), the private sector, and government departments that are associated with children’s issues. This integrated feature is favoured because it is perceived (a) to deliver more services, (b) to cut costs by sharing resources and not duplicating, and (c) to deliver services effi ciently and with fewer diffi culties for clients. This has “considerable relevance for delivering ECD services in South Africa” (DoE 2001c, 7). But as the DoE (2001c, 8) warns, “the notions of integration and intersectoral collaboration can be elusive when one comes to implementation” (DoE 2001c, 8). Barriers include professional training and orientation which leads to the lack of a common language and focus; the diffi culties of protocol and bureaucracy; categorical funding: while joint planning may affect overall savings it has implementation costs which may not be covered in a particular departmental budget; the current budgetary process which leads to competition for funding at provincial and departmental level; particular sectors tending to take the lead in implementation of inter-sectoral programmes, in the process marginalising partners; different departments having different rules on eligibility for services; lack of data; a limited concept of ECD; the (in) compatibility of policy and reality; old policies, which still exist and confl ict; and the absence of effective information dissemination.
The province recognises the signifi cance of ECD. The provincial DoE mission commits to providing “early childhood education at grade R in accordance with White Paper 5” (Eastern Cape Provincial Government 2003, 181). However, the province appears
Moeketsi Letseka 67
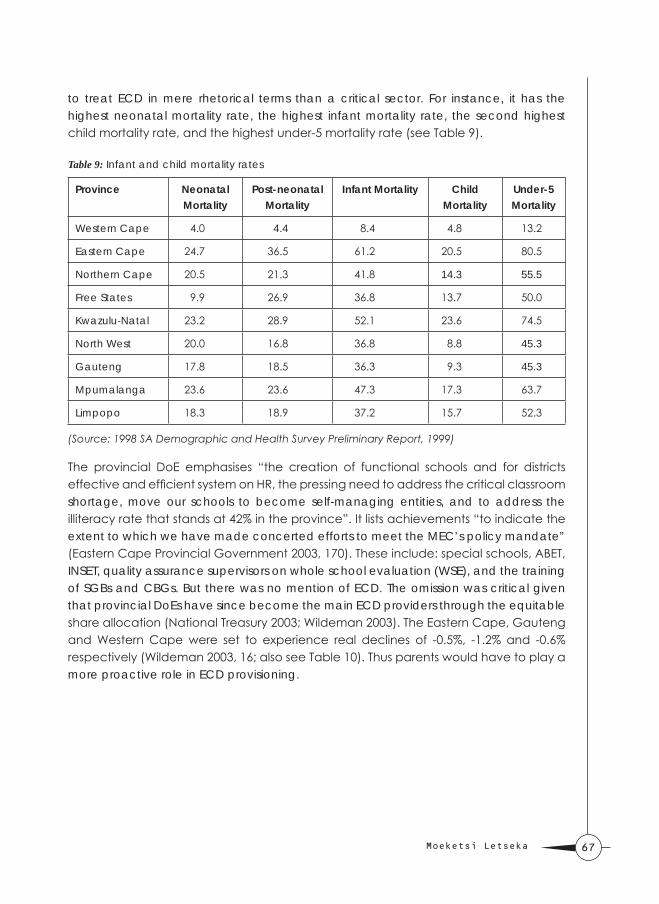
to treat ECD in mere rhetorical terms than a critical sector. For instance, it has the highest neonatal mortality rate, the highest infant mortality rate, the second highest child mortality rate, and the highest under-5 mortality rate (see Table 9).
Table 9: Infant and child mortality rates
Province Neonatal Mortality
Post-neonatal Mortality
Infant Mortality Child Mortality
Under-5 Mortality
Western Cape 4.0 4.4 8.4 4.8 13.2
Eastern Cape 24.7 36.5 61.2 20.5 80.5
Northern Cape 20.5 21.3 41.8 14.3 55.5
Free States 9.9 26.9 36.8 13.7 50.0
Kwazulu-Natal 23.2 28.9 52.1 23.6 74.5
North West 20.0 16.8 36.8 8.8 45.3
Gauteng 17.8 18.5 36.3 9.3 45.3
Mpumalanga 23.6 23.6 47.3 17.3 63.7
Limpopo 18.3 18.9 37.2 15.7 52.3
(Source: 1998 SA Demographic and Health Survey Preliminary Report, 1999)
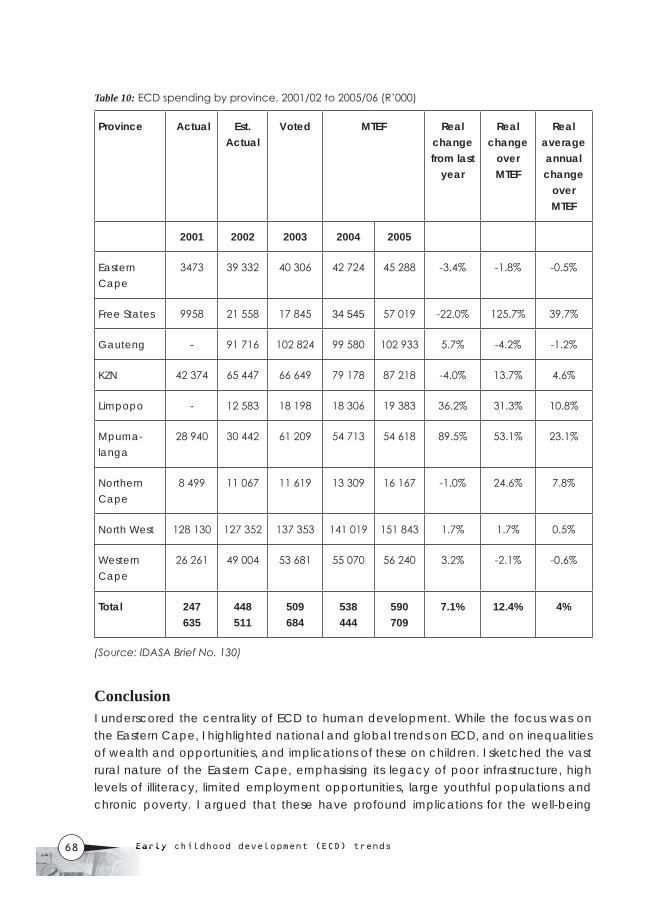
The provincial DoE emphasises “the creation of functional schools and for districts effective and efficient system on HR, the pressing need to address the critical classroom shortage, move our schools to become self-managing entities, and to address the illiteracy rate that stands at 42% in the province”. It lists achievements “to indicate the extent to which we have made concerted efforts to meet the MEC’s policy mandate” (Eastern Cape Provincial Government 2003, 170). These include: special schools, ABET, INSET, quality assurance supervisors on whole school evaluation (WSE), and the training of SGBs and CBGs. But there was no mention of ECD. The omission was critical given that provincial DoEs have since become the main ECD providers through the equitable share allocation (National Treasury 2003; Wildeman 2003). The Eastern Cape, Gauteng and Western Cape were set to experience real declines of -0.5%, -1.2% and -0.6% respectively (Wildeman 2003, 16; also see Table 10). Thus parents would have to play a more proactive role in ECD provisioning.
Early childhood development (ECD) trendsEarly childhood development (ECD) trends68
Table 10: ECD spending by province, 2001/02 to 2005/06 (R’000)
Province Actual Est. Actual
Voted MTEF Real change from last
year
Real change
over MTEF
Real average annual change
over MTEF
2001 2002 2003 2004 2005
Eastern Cape
3473 39 332 40 306 42 724 45 288 -3.4% -1.8% -0.5%
Free States 9958 21 558 17 845 34 545 57 019 -22.0% 125.7% 39.7%
Gauteng - 91 716 102 824 99 580 102 933 5.7% -4.2% -1.2%
KZN 42 374 65 447 66 649 79 178 87 218 -4.0% 13.7% 4.6%
Limpopo - 12 583 18 198 18 306 19 383 36.2% 31.3% 10.8%
Mpuma-langa
28 940 30 442 61 209 54 713 54 618 89.5% 53.1% 23.1%
Northern Cape
8 499 11 067 11 619 13 309 16 167 -1.0% 24.6% 7.8%
North West 128 130 127 352 137 353 141 019 151 843 1.7% 1.7% 0.5%
Western Cape
26 261 49 004 53 681 55 070 56 240 3.2% -2.1% -0.6%
Total 247 635
448 511
509 684
538 444
590 709
7.1% 12.4% 4%
(Source: IDASA Brief No. 130)
Conclusion I underscored the centrality of ECD to human development. While the focus was on the Eastern Cape, I highlighted national and global trends on ECD, and on inequalities of wealth and opportunities, and implications of these on children. I sketched the vast rural nature of the Eastern Cape, emphasising its legacy of poor infrastructure, high levels of illiteracy, limited employment opportunities, large youthful populations and chronic poverty. I argued that these have profound implications for the well-being
Moeketsi Letseka 69
of communities and families, especially children’s health, psychosocial factors, and access to educational opportunities, particularly ECD. I noted that an estimated 40% of South Africa’s children grow up in abject poverty and neglect. I argued that this is inconsistent with South Africa’s position as a prominent African economy that accounts for over 75% of the entire SADC’s GDP. I suggested that governments such as the Eastern Cape’s need to invest heavily in the well-being of children through well-structured and sustainable ECD programmes.
Notes1 Moeketsi Letseka is with the Department of Educational Studies at the University of South
Africa. He can be contacted at [email protected].
2 From now on this policy document shall be referred to as WP5.
ReferencesAnderson. L. M., C. Shinn, M.T. Fullilove, S.C. Scrimshaw, J.E. Fielding, J. Normand and V.G. Carande-
Kulis. 2003. The effectiveness of early childhood development programs. American Journal of Preventive Pedicine 24 (3S): 32–46.
____ . 2002. Community interventions to promote healthy social environments: Early Childhood Development and family housing. A report on recommendations of the Task Force on community preventive services, MMWR Recommendations and Reports-1, Volume 51, 1–8.
Atmore. E. 2001. An assessment of training needs of practitioners in the Early Childhood Development (ECD) sector, paper commissioned by the ETDP SETA.
____ . 1998. Reconstructing Early Childhood Development services in South Africa: From apartheid to democracy. International Journal of Early Years Education 6 (3): 291–298.
Berlin. L.J., J. Brooks-Gunn and J.L. Aber. 2001. Promoting Early Childhood Development through comprehensive community initiatives. Children’s Services: Social Policy Research, and Practice 4 (1): 1–24.
Biersteker. L. and N. Newman. 2003. ECD Sub-Group Discussion Paper: Children’s Bill, ELRU Discussion document.
Budlender. D. 1999. Patterns of poverty in South Africa. Development Southern Africa 16 (2): 197–218.
Centre for Responsive Politics. 2008. U.S. Election Will Cost $5.3 Billion, Centre for Responsive Politics Predicts. Washington, D.C.: Communications Office.
Department of Education. 2001a. Education White Paper 5 on Early Childhood Education. Pretoria: Department of Education: Pretoria.
____ . 2001b. Nationwide audit of ECD Provisioning in South Africa. Pretoria: Department of Education: Pretoria.
____ . 2001c. Report on National ECD Policies and Programs. Pretoria: Department of Education: Pretoria.
____ . 1998. National Norms and Standards for School Funding. Pretoria: Department of Education: Pretoria.
Early childhood development (ECD) trendsEarly childhood development (ECD) trends70
Department of Health. 1999. Preliminary Report on the Demographic and Health Survey, 1998. Department of Health: Pretoria.
Development Policy Research Unit. 2000. Is macroeconomic policy convergence necessary for sustainable SADC free trade area?. DPRU Policy Brief No. 00/PA, July.
Donaldson. A. 2003. SA slips in global economic ranking. Sunday Times 2nd November.
Eastern Cape Department of Health. 2003. Strategic Plan 2003/4, Bisho: Provincial Legislature.
Evans. J. L.2001. Eight is too late: investment in Early Childhood Development. Journal of International Affairs 55(1): 91–109.
Kritzinger-van Niekerk. L and E.P. Moreira. 2002. Regional integration in Southern Africa: Overview of recent development. Washington D.C.: The World Bank.
Letseka. M. 2001. Information and communication technology (ICT) initiatives at the University of Fort Hare: cure or plague? Knowledge, Technology and Policy 14(1): 67–78.
MacDonald. M. 2006. Why race matters in South Africa. Cambridge, MASS: Harvard University Press.
Monare. M. 2003. Poverty hinders a hunger to learn. Sunday Times, 19th October.
Mwambande. L. 2003. SADC trade emphasis to be on added value. The Guardian, 21st August.
Mills. G. 1998. Refl ections on the 1998 Johannesburg SADC – Mercosul Conference, seminar report prepared for the Konrad-Adenauer Stiftug.
Nini. A. 2003. Concern as Bisho spends only R7.5m on child development. Eastern Cape Herald, 7th January.
Ngwane. A., V. Yadavalli and F. Steffens. 2001. Poverty in South Africa – a statistical analysis. Development Southern Africa 18(2): 201–214.
Province of the Eastern Cape. 2003. Budget Statement for the 2003/2004 Provincial Budget. Bisho: Provincial Legislature.
Republic of South Africa. 1996. The Constitution of the Republic of South Africa, Wynberg: Constitutional Assembly.
Statistics South Africa. 2003a. Census 2001, investigation into appropriate defi nitions of urban and rural areas in South Africa: Discussion document, Pretoria: Statistics South Africa.
____ . 2003b. Census 2001 compared with Census 1996: Changes in living conditions and life circumstances, Pretoria: Statistics South Africa.
____ . 2000. Measuring poverty in South Africa, Pretoria: Statistics South Africa..
UNAIDS. 2002. Botswana: Epidemiological Fact Sheet on HIV/AIDS and Sexually Transmitted Infections. Geneva: UNAIDS.
____ . 1998. UNDP poverty report, 1998: overcoming human poverty, New York: UNDP.
UNICEF. 2003. The state of the world’s children 2003, New York: UNICEF Division of Communication.
____ . 2002. The state of the world’s children 2002, New York: UNICEF Division of Communication.
____ . 2001. The state of the world’s children 2001, New York: UNICEF Division of Communication.
Wildeman. R. A. 2003. Reviewing Provincial Education Budgets 2003. IDASA Budget Brief No. 130.
World Bank. 2002. From early child development to human development, proceedings of a World Bank conference on “Investing in our children’s future”, 10-11th April, Washington, D.C.
____ . 2001. World Development Report 2000/2001: attacking poverty, New York: Oxford University Press.
Moeketsi Letseka 71
World Economic Forum. 2003. Global Competitiveness Report 2003–2004, New York: Oxford University Press.
Young. M. E. 2002. Introduction and Overview, in World Bank, From Early Child Development to Human Development, proceedings of a World Bank conference on Investing in our Children’s Future.10–11th April, Washington, D.C.