A rapid review of migration trends in the Western Cape and Cape Winelands
Upload
khangminh22Category
view
0download
0
WC053 Beaufort West
Contact details:
Technical enquiries to the MFMA Helpline at:[email protected]
Data submission enquiries:Elsabé Rossouw National Treasury Tel: (012) 315-5534 Electronic documents: [email protected] on formats: [email protected]
Version 2.3.
Click for Instructions!

2020
Name Votes & Sub-Votes
Preparation Instructions
Printing Instructions
Municipality Name:
Budget for MTREF starting: Budget Year:
Does this municipality have Entities?
If YES: Identify type of report:
CFO Name:
Tel:
E-Mail:
Fax:
Showing / Hiding Columns
Showing / Clearing Highlights
Important documents which provide essential assistance
MFMA Budget Circular 2011/12
MFMA Circular 48
MBRR Budget Formats Guide
MFMA Circular 51
MFMA Return Forms
Click to view
Click to view
Click to view
Click to view
Click to view
Hide Reference columns on all sheets
Hide Pre-audit columns on all sheets
Clear Highlights on all sheets

Organisational structure votes (if required) Organisational structure sub-votes (if required)Vote1 - Municipal Manager Municipal Manager Vote1Vote2 - Director: Corporate Services Municipal ManagerVote3 - Director: Financial Services TourismVote4 - Director: Engineering Services IDP CoordinatorVote5 - Director: Community Services Internal AuditVote6 - Director: Electrical Services Labour RelationsVote7 - Example 7 Subvote example 6Vote8 - Example 8 Subvote example 7Vote9 - Example 9 Subvote example 8Vote10 - Example 10 Subvote example 9Vote11 - Example 11 Subvote example 10Vote12 - Example 12 Director: Corporate Services Vote2Vote13 - Example 13 Corporate ServicesVote14 - Example 14 General ExpensesVote15 - Example 15 Library: Church Street
Library: MimosaLibrary: NelspoortLibrary: MurraysburgSubvote example 7Subvote example 8Subvote example 9Subvote example 10
Director: Financial Services Vote3Financial ServicesRatesKwa Mandlenkosi OfficeKwa Mandlenkosi HallStoresRustdene OfficeRustdene Community HallNelspoort OfficeMurraysburg OfficeSubvote example 10
Director: Engineering Services Vote4Engineering ServicesCemeteriesBuilding ControlTown CommonageMain Road: Voortrekker StreetMechanical WorkshopMunicipal BuildingsRecreation SitesRecreation Sites: MurraysburgSewerage SystemSewerage FarmStreet Works & Storm WaterStreet Works & Storm Water: MurraysburgSwimming Pool: Bird StreetSwimming Pool: NieuveldSwimming Pool: MurraysburgAdmin WaterIrrigation WaterWater PurificationWater ReticulationWater: MurraysburgSubvote example 19Subvote example 20
Director: Community Services Vote5Community ServicesHousing OfficePoundStreet CleaningVacuum ServicesRefuse RemovalRefuse Removal: MurraysburgAdmin Traffic ServicesTraffic CourtFire BrigadeVehicle RegistrationVehicle Test CentreS/E 1 RustdeneS/E 4 RustdeneS/E 8 RustdeneS/E 9 RustdeneSubvote example 15Subvote example 16
Director: Electrical Services Vote6Electricity ServicesService ConnectionsReticulation: Low VoltageReticulation: High VoltagePrivate WorkStreet LightingTraffic LightsElectricity: MurraysburgSubvote example 9Subvote example 10
Example 7 Vote7Subvote example 1Subvote example 2Subvote example 3Subvote example 4Subvote example 5Subvote example 6Subvote example 7Subvote example 8Subvote example 9Subvote example 10
Example 8 Vote8Subvote example 1Subvote example 2Subvote example 3Subvote example 4Subvote example 5Subvote example 6Subvote example 7Subvote example 8Subvote example 9Subvote example 10
Example 9 Vote9Subvote example 1Subvote example 2Subvote example 3Subvote example 4Subvote example 5Subvote example 6Subvote example 7Subvote example 8Subvote example 9Subvote example 10
Example 10 Vote10Subvote example 1Subvote example 2Subvote example 3Subvote example 4Subvote example 5Subvote example 6Subvote example 7Subvote example 8Subvote example 9Subvote example 10
Example 11 Vote11Subvote example 1Subvote example 2Subvote example 3Subvote example 4Subvote example 5Subvote example 6Subvote example 7Subvote example 8Subvote example 9Subvote example 10
Example 12 Vote12Subvote example 1Subvote example 2Subvote example 3Subvote example 4Subvote example 5Subvote example 6Subvote example 7Subvote example 8Subvote example 9Subvote example 10
Example 13 Vote13Subvote example 1Subvote example 2Subvote example 3Subvote example 4Subvote example 5Subvote example 6Subvote example 7Subvote example 8Subvote example 9Subvote example 10
Example 14 Vote14Subvote example 1Subvote example 2Subvote example 3Subvote example 4Subvote example 5Subvote example 6Subvote example 7Subvote example 8Subvote example 9Subvote example 10
Example 15 Vote15Subvote example 1Subvote example 2Subvote example 3Subvote example 4Subvote example 5Subvote example 6Subvote example 7Subvote example 8Subvote example 9Subvote example 10

WC053 Beaufort West - Contact Information
A. GENERAL INFORMATIONMunicipality WC053 Beaufort West Set name on 'Instructions' sheet
Grade 2 1 Grade in terms of the Remuneration of Public Office Bearers Act.
Province WC WESTERN CAPE
Web Address www.beaufortwestmun.co.za
e-mail Address [email protected]
Postal address:P.O. Box Private Bag 582City / Town Beaufort WestPostal Code 6970
Street addressBuildingStreet No. & Name 15 Church StreetCity / Town Beaufort WestPostal Code 6970
General ContactsTelephone number 023 414 8100Fax number 023 414 8105
Speaker:Name NameTelephone number Telephone numberCell number Cell numberFax number Fax numberE-mail address E-mail address
Name NameTelephone number Telephone numberCell number Cell numberFax number Fax numberE-mail address E-mail address
Name NameTelephone number Telephone numberCell number Cell numberFax number Fax numberE-mail address E-mail address
Municipal Manager:Name NameTelephone number Telephone numberCell number Cell numberFax number Fax numberE-mail address E-mail address
Chief Financial OfficerName NameTelephone number Telephone numberCell number Cell numberFax number Fax numberE-mail address E-mail address
NameTelephone numberCell number
Secretary/PA to the Municipal Manager:
C. POLITICAL LEADERSHIPSecretary/PA to the Speaker:
Official responsible for submitting financial information
D. MANAGEMENT LEADERSHIP
Mayor/Executive Mayor:
Secretary/PA to the Chief Financial Officer
Secretary/PA to the Deputy Mayor/Executive Mayor:Deputy Mayor/Executive Mayor:
B. CONTACT INFORMATION
Secretary/PA to the Mayor/Executive Mayor:

Fax numberE-mail address

Description 2007/8 2008/9 2009/10
R thousands Audited Outcome
Audited Outcome
Audited Outcome
Original Budget
Adjusted Budget
Full Year Forecast
Pre-audit outcome
Budget Year 2011/12
Budget Year +1 2012/13
Budget Year +2 2013/14
Financial PerformanceProperty rates 13,448 14,995 17,199 29,256 18,232 18,232 – 20,869 22,490 24,240 Service charges 38,281 47,632 52,397 71,825 66,431 66,431 – 79,723 87,636 99,090 Investment revenue 1,295 1,285 2,091 360 360 360 – 420 424 429 Transfers recognised - operational 34,132 52,969 60,825 44,285 49,095 49,095 – 50,377 57,682 59,737 Other own revenue 18,414 17,189 11,419 11,494 12,058 12,058 – 12,400 13,224 14,274
Total Revenue (excluding capital transfers and contributions)
105,570 134,071 143,930 157,220 146,178 146,178 – 163,789 181,456 197,769
Employee costs 32,525 34,646 40,693 49,988 48,185 48,185 – 55,714 59,778 64,451 Remuneration of councillors 2,429 3,061 3,282 3,575 3,575 3,575 – 3,798 4,107 4,424 Depreciation & asset impairment 8,947 9,403 7,754 11,050 11,050 11,050 – 11,507 12,123 12,902 Finance charges 1,310 2,134 2,591 1,701 1,569 1,569 – 1,968 2,323 1,869 Materials and bulk purchases 20,808 27,770 31,564 38,816 38,303 38,303 – 53,294 63,442 72,752 Transfers and grants 3,960 5,366 – 6,133 834 834 – 890 961 1,038 Other expenditure 42,119 58,051 53,699 55,705 52,408 52,408 – 46,038 48,162 49,863
Total Expenditure 112,098 140,431 139,582 166,967 155,925 155,925 – 173,208 190,896 207,299 Surplus/(Deficit) (6,528) (6,360) 4,348 (9,747) (9,747) (9,747) – (9,419) (9,440) (9,530)
Transfers recognised - capital 13,463 16,251 21,200 44,007 45,135 45,135 – 47,942 21,119 – Contributions recognised - capital & contributed assets – – – – – – – – – –
Surplus/(Deficit) after capital transfers & contributions
6,935 9,891 25,548 34,260 35,388 35,388 – 38,524 11,679 (9,530)
Share of surplus/ (deficit) of associate – – – – – – – – – – Surplus/(Deficit) for the year 6,935 9,891 25,548 34,260 35,388 35,388 – 38,524 11,679 (9,530)
Capital expenditure & funds sourcesCapital expenditure 18,130 24,156 27,447 50,148 55,786 55,786 – 53,443 48,109 26,438
Transfers recognised - capital 12,523 15,845 21,554 44,007 45,145 45,145 – 47,942 21,119 – Public contributions & donations 1,649 677 – – – – – – – – Borrowing 714 2,213 4,310 3,725 8,225 8,225 – 2,870 250 – Internally generated funds 3,245 5,420 1,583 2,416 2,416 2,416 – 2,631 26,740 26,438
Total sources of capital funds 18,130 24,156 27,447 50,148 55,786 55,786 – 53,443 48,109 26,438
Financial positionTotal current assets 34,806 51,709 60,307 41,330 40,071 40,071 – 30,273 23,270 15,269 Total non current assets 112,724 127,385 144,982 194,800 200,438 200,438 – 248,733 284,636 298,277 Total current liabilities 21,425 40,992 42,769 24,389 27,640 27,640 – 26,041 24,131 21,160 Total non current liabilities 11,593 21,776 26,731 34,774 34,774 34,774 – 35,933 34,980 34,051 Community wealth/Equity 114,512 116,326 135,790 176,968 178,095 178,095 – 217,031 248,795 258,335
Cash flowsNet cash from (used) operating 15,090 34,095 24,629 44,872 42,746 42,746 – 50,240 48,379 27,319 Net cash from (used) investing (17,356) (21,810) (26,096) (50,148) (55,786) (55,786) – (52,170) (47,250) (25,695) Net cash from (used) financing 256 (1,483) 4,360 1,602 6,102 6,102 – 1,026 (2,359) (2,694)
Cash/cash equivalents at the year end 14,943 25,746 28,639 10,118 6,854 6,854 13,792 5,950 4,721 3,650
Cash backing/surplus reconciliationCash and investments available 14,943 25,746 28,639 10,118 6,867 6,867 – 5,950 4,721 3,650 Application of cash and investments 16,808 39,980 32,247 12,880 12,413 12,413 – 3,726 4,363 7,052
Balance - surplus (shortfall) (1,864) (14,234) (3,607) (2,762) (5,546) (5,546) – 2,224 358 (3,402)
Asset managementAsset register summary (WDV) 112,676 127,371 140,867 194,800 200,438 200,438 244,746 244,746 281,508 295,892 Depreciation & asset impairment 8,947 9,403 7,754 11,050 11,050 11,050 11,507 11,507 12,123 12,902 Renewal of Existing Assets 652 62 3,222 9,931 14,868 14,868 14,599 14,599 1,195 715 Repairs and Maintenance 9,639 11,533 10,572 12,445 12,107 12,107 14,763 14,763 15,921 17,120
Free servicesCost of Free Basic Services provided 2,707 2,899 3,615 5,187 4,434 4,434 7,021 7,021 7,583 8,189 Revenue cost of free services provided 7,512 7,623 18,066 18,893 18,114 18,114 28,119 28,119 30,368 30,597 Households below minimum service level
Water: - - - - - - - - - - Sanitation/sewerage: - - - - - - - - - - Energy: - - - - - - - - - - Refuse: - - - - - - - - - -
2011/12 Medium Term Revenue & Expenditure FrameworkCurrent Year 2010/11
WC053 Beaufort West - Table A1 Budget Summary

WC053 Beaufort West - Table A2 Budgeted Financial Performance (revenue and expenditure by standard classification)
Standard Classification Description Ref 2007/8 2008/9 2009/10
R thousand 1 Audited Outcome
Audited Outcome
Audited Outcome
Original Budget
Adjusted Budget
Full Year Forecast
Budget Year 2011/12
Budget Year +1 2012/13
Budget Year +2 2013/14
Revenue - StandardGovernance and administration 29,897 35,031 35,568 56,505 46,679 46,679 56,725 61,272 64,679
Executive and council 16,185 20,038 15,920 23,738 23,924 23,924 28,514 33,574 35,712 Budget and treasury office 12,782 14,577 19,271 30,417 20,099 20,099 24,733 26,526 28,584 Corporate services 930 416 376 2,350 2,655 2,655 3,479 1,172 383
Community and public safety 29,133 44,904 30,268 16,943 19,821 19,821 16,121 21,029 16,833 Community and social services 382 443 521 487 488 488 628 296 318 Sport and recreation 278 432 413 127 127 127 157 169 183 Public safety 15,150 12,397 7,618 8,822 9,252 9,252 9,093 14,580 10,021 Housing 13,324 31,633 21,715 7,507 9,955 9,955 6,244 5,983 6,311 Health – – – – – – – – –
Economic and environmental services 5,673 3,260 4,827 12,242 13,312 13,312 20,367 754 814 Planning and development 311 359 704 205 1,108 1,108 33 36 38 Road transport 5,362 2,901 4,122 12,037 12,204 12,204 20,334 718 776 Environmental protection – – – – – – – – –
Trading services 54,329 67,127 94,442 115,538 111,500 111,500 118,518 119,520 115,443 Electricity 30,630 43,642 59,861 61,218 59,959 59,959 77,909 93,493 88,222 Water 10,562 11,127 15,499 39,456 38,967 38,967 25,928 10,172 10,097 Waste water management 10,021 8,312 14,444 10,393 8,624 8,624 9,592 10,359 11,188 Waste management 3,116 4,047 4,637 4,470 3,950 3,950 5,090 5,497 5,936
Other 4 – – 26 – – – – – – Total Revenue - Standard 2 119,032 150,322 165,130 201,227 191,312 191,312 211,732 202,575 197,769
Expenditure - StandardGovernance and administration 22,751 27,770 24,392 41,711 25,940 25,940 31,313 33,408 35,817
Executive and council 12,962 16,067 8,855 14,409 9,369 9,369 10,471 11,337 12,205 Budget and treasury office 4,562 5,344 7,795 18,640 7,893 7,893 13,784 14,570 15,530 Corporate services 5,227 6,359 7,743 8,661 8,677 8,677 7,058 7,501 8,083
Community and public safety 32,897 48,465 40,351 27,734 29,334 29,334 27,686 28,951 31,032 Community and social services 2,538 2,926 3,566 4,206 4,084 4,084 4,723 5,020 5,415 Sport and recreation 4,650 5,170 5,470 5,911 5,560 5,560 6,302 6,728 7,189 Public safety 11,061 8,444 9,100 8,858 8,661 8,661 9,262 9,971 10,769 Housing 14,648 31,924 22,215 8,759 11,029 11,029 7,399 7,232 7,659 Health – – – – – – – – –
Economic and environmental services 12,766 14,486 13,924 18,834 19,643 19,643 21,487 21,827 23,567 Planning and development 1,925 2,415 4,593 2,657 3,414 3,414 3,981 3,592 3,874 Road transport 10,841 12,072 9,331 16,177 16,229 16,229 17,506 18,235 19,693 Environmental protection – – – – – – – – –
Trading services 43,564 49,551 60,783 78,591 80,857 80,857 92,531 106,501 116,699 Electricity 27,143 30,367 42,424 54,665 55,704 55,704 64,167 76,189 84,371 Water 9,317 11,317 10,159 13,286 15,689 15,689 17,237 18,296 19,351 Waste water management 3,201 3,280 3,364 5,090 4,272 4,272 5,116 5,525 5,967 Waste management 3,903 4,588 4,835 5,550 5,191 5,191 6,010 6,491 7,009
Other 4 120 158 132 98 151 151 191 210 183 Total Expenditure - Standard 3 112,098 140,431 139,582 166,967 155,925 155,925 173,208 190,896 207,299 Surplus/(Deficit) for the year 6,935 9,891 25,548 34,260 35,388 35,388 38,524 11,679 (9,530) References1. Government Finance Statistics Functions and Sub-functions are standardised to assist the compilation of national and international accounts for comparison purposes2. Total Revenue by standard classification must reconcile to Total Operating Revenue shown in Budgeted Financial Performance (revenue and expenditure)3. Total Expenditure by Standard Classification must reconcile to Total Operating Expenditure shown in Budgeted Financial Performance (revenue and expenditure)4. All amounts must be classified under a standard classification (modified GFS). The GFS function 'Other' is only for Abbatoirs, Air Transport, Markets and Tourism - and if used must be supported by footnotes. Nothing else may be placed under 'Other'. Assign associate share to relevant classification
Current Year 2010/11 2011/12 Medium Term Revenue & Expenditure Framework

WC053 Beaufort West - Table A2 Budgeted Financial Performance (revenue and expenditure by standard classification)
Standard Classification Description Ref 2007/8 2008/9 2009/10
R thousand 1 Audited Outcome
Audited Outcome
Audited Outcome
Original Budget
Adjusted Budget
Revenue - StandardMunicipal governance and administration 29,897 35,031 35,568 56,505 46,679
Executive and council 16,185 20,038 15,920 23,738 23,924 Mayor and Council 16,131 20,038 15,920 23,738 23,786 Municipal Manager 54 – – – 138
Budget and treasury office 12,782 14,577 19,271 30,417 20,099 Corporate services 930 416 376 2,350 2,655
Human ResourcesInformation TechnologyProperty Services 923 416 376 2,350 2,655 Other Admin 7 – – – –
Community and public safety 29,133 44,904 30,268 16,943 19,821 Community and social services 382 443 521 487 488
Libraries and Archives 169 249 347 296 297 Museums & Art Galleries etc – Community halls and Facilities 27 25 21 23 23 Cemeteries & Crematoriums 155 155 131 155 155 Child Care – Aged Care – Other Community 30 14 23 13 13 Other Social –
Sport and recreation 278 432 413 127 127 Public safety 15,150 12,397 7,618 8,822 9,252
Police 15,106 12,381 7,584 8,795 8,795 Fire 27 18 10 10 Civil Defence – Street Lighting 16 16 16 16 446 Other – –
Housing 13,324 31,633 21,715 7,507 9,955 Health – – – – –
ClinicsAmbulanceOther
Economic and environmental services 5,673 3,260 4,827 12,242 13,312 Planning and development 311 359 704 205 1,108
Economic Development/Planning 77 225 344 40 516 Town Planning/Building enforcement 233 134 361 165 592 Licensing & Regulation
Road transport 5,362 2,901 4,122 12,037 12,204 Roads 4,709 2,320 3,515 11,416 11,583 Public Buses – Parking Garages – Vehicle Licensing and Testing 627 580 607 621 621 Other 27 0 0 – –
Environmental protection – – – – – Pollution ControlBiodiversity & LandscapeOther
Trading services 54,329 67,127 94,442 115,538 111,500 Electricity 30,630 43,642 59,861 61,218 59,959
Electricity Distribution 30,630 43,642 59,861 61,218 59,959 Electricity Generation
Water 10,562 11,127 15,499 39,456 38,967 Water Distribution 10,562 11,127 15,499 39,456 38,967 Water Storage
Waste water management 10,021 8,312 14,444 10,393 8,624 Sewerage 10,021 8,312 14,444 10,393 8,624
Current Year 2010/11

Storm Water ManagementPublic Toilets
Waste management 3,116 4,047 4,637 4,470 3,950 Solid Waste 3,116 4,047 4,637 4,470 3,950
Other – – 26 – – Air TransportAbattoirsTourism 26 ForestryMarkets
Total Revenue - Standard 2 119,032 150,322 165,130 201,227 191,312
Expenditure - StandardMunicipal governance and administration 22,751 27,770 24,392 41,711 25,940
Executive and council 12,962 16,067 8,855 14,409 9,369 Mayor and Council 11,547 14,566 7,368 12,580 7,520 Municipal Manager 1,415 1,501 1,487 1,829 1,849
Budget and treasury office 4,562 5,344 7,795 18,640 7,893 Corporate services 5,227 6,359 7,743 8,661 8,677
Human ResourcesInformation Technology 1,310 1,310 Property Services 2,475 2,847 3,061 3,024 3,218 Other Admin 2,751 3,512 4,682 4,327 4,150
Community and public safety 32,897 48,465 40,351 27,734 29,334 Community and social services 2,538 2,926 3,566 4,206 4,084
Libraries and Archives 1,433 1,622 1,927 2,216 2,030 Museums & Art Galleries etc – Community halls and Facilities 99 133 148 122 114 Cemeteries & Crematoriums 226 273 274 375 435 Child Care – Aged Care – Other Community 781 899 1,216 1,493 1,504 Other Social –
Sport and recreation 4,650 5,170 5,470 5,911 5,560 Public safety 11,061 8,444 9,100 8,858 8,661
Police 9,341 6,425 5,395 6,968 6,882 Fire 229 217 499 879 824 Civil Defence – Street Lighting 1,206 1,456 2,713 461 419 Other 285 345 493 549 535
Housing 14,648 31,924 22,215 8,759 11,029 Health – – – – –
ClinicsAmbulanceOther
Economic and environmental services 12,766 14,486 13,924 18,834 19,643 Planning and development 1,925 2,415 4,593 2,657 3,414
Economic Development/Planning 296 501 649 425 841 Town Planning/Building enforcement 1,630 1,913 3,944 2,233 2,573 Licensing & Regulation
Road transport 10,841 12,072 9,331 16,177 16,229 Roads 9,431 10,565 7,555 14,242 14,227 Public Buses – Parking Garages – Vehicle Licensing and Testing 533 471 531 580 763 Other 877 1,036 1,246 1,355 1,239
Environmental protection – – – – – Pollution ControlBiodiversity & LandscapeOther
Trading services 43,564 49,551 60,783 78,591 80,857 Electricity 27,143 30,367 42,424 54,665 55,704
Electricity Distribution 27,143 30,367 42,424 54,665 55,704

Electricity GenerationWater 9,317 11,317 10,159 13,286 15,689
Water Distribution 9,317 11,317 10,159 13,286 15,689 Water Storage
Waste water management 3,201 3,280 3,364 5,090 4,272 Sewerage 3,201 3,280 3,364 5,090 4,272 Storm Water ManagementPublic Toilets
Waste management 3,903 4,588 4,835 5,550 5,191 Solid Waste 3,903 4,588 4,835 5,550 5,191
Other 120 158 132 98 151 Air TransportAbattoirsTourism 120 158 132 98 151 ForestryMarkets
Total Expenditure - Standard 3 112,098 140,431 139,582 166,967 155,925 Surplus/(Deficit) for the year 6,935 9,891 25,548 34,260 35,388 References1. Government Finance Statistics Functions and Sub-functions are standardised to assist national and international accounts and comparison2. Total Revenue by Standard Classification must reconcile to total operating revenue shown in Financial Performance (revenue and expenditure)3. Total Expenditure by Standard Classification must reconcile to total operating expenditure shown in Financial Performance (revenue and expenditure)
check oprev balance 1 4 -449 - 48 check opexp balance 1 -1 1 - -
4. All amounts must be classified under a Standard (modified GFS) classification. The GFS function 'Other' is only for Abbatoirs, Air Transport, Markets and Tourism - and if used must be supported by footnotes. Nothing else may be placed under 'Other'. Assign associate share to relevant classification

WC053 Beaufort West - Table A2 Budgeted Financial Performance (revenue and expenditure by standard classification)
Full Year Forecast
Budget Year 2011/12
Budget Year +1 2012/13
Budget Year +2 2013/14
46,679 56,725 61,272 64,679 23,924 28,514 33,574 35,712 23,786 28,475 33,574 35,712
138 39 – – 20,099 24,733 26,526 28,584 2,655 3,479 1,172 383
2,655 3,479 1,172 383 – – – –
19,821 16,121 21,029 16,833 488 628 296 318 297 439 92 99 – 23 24 25 27
155 152 164 177 – – 13 13 14 15 –
127 157 169 183 9,252 9,093 14,580 10,021 8,795 8,570 9,256 9,996
10 5 5 6 –
446 518 5,319 19 – – – –
9,955 6,244 5,983 6,311 – – – –
13,312 20,367 754 814 1,108 33 36 38
516 – – – 592 33 36 38
12,204 20,334 718 776 11,583 19,689 22 23
– –
621 645 697 752 – – – – – – – –
111,500 118,518 119,520 115,443 59,959 77,909 93,493 88,222 59,959 77,909 93,493 88,222
38,967 25,928 10,172 10,097 38,967 25,928 10,172 10,097
8,624 9,592 10,359 11,188 8,624 9,592 10,359 11,188
Current Year 2010/11 2011/12 Medium Term Revenue & Expenditure Framework

3,950 5,090 5,497 5,936 3,950 5,090 5,497 5,936
– – – –
– – –
191,312 211,732 202,575 197,769
25,940 31,313 33,408 35,817 9,369 10,471 11,337 12,205 7,520 8,379 9,069 9,769 1,849 2,092 2,268 2,436 7,893 13,784 14,570 15,530 8,677 7,058 7,501 8,083
1,310 3,218 3,235 3,494 3,773 4,150 3,823 4,007 4,310
29,334 27,686 28,951 31,032 4,084 4,723 5,020 5,415 2,030 2,522 2,708 2,918
– 114 118 128 138 435 413 446 482 – –
1,504 1,669 1,738 1,877 –
5,560 6,302 6,728 7,189 8,661 9,262 9,971 10,769 6,882 6,738 7,255 7,836
824 1,358 1,455 1,572 –
419 472 510 551 535 694 750 810
11,029 7,399 7,232 7,659 – – – –
19,643 21,487 21,827 23,567 3,414 3,981 3,592 3,874
841 349 377 407 2,573 3,632 3,215 3,467
16,229 17,506 18,235 19,693 14,227 15,524 16,094 17,381
– –
763 698 753 814 1,239 1,285 1,388 1,499
– – – –
80,857 92,531 106,501 116,699 55,704 64,167 76,189 84,371 55,704 64,167 76,189 84,371

15,689 17,237 18,296 19,351 15,689 17,237 18,296 19,351
4,272 5,116 5,525 5,967 4,272 5,116 5,525 5,967
5,191 6,010 6,491 7,009 5,191 6,010 6,491 7,009
151 191 210 183
151 191 210 183
155,925 173,208 190,896 207,299 35,388 38,524 11,679 (9,530)
48 - - - - - - -
4. All amounts must be classified under a Standard (modified GFS) classification. The GFS function 'Other' is only for Abbatoirs, Air Transport, Markets and Tourism - and if used must be supported by footnotes. Nothing

WC053 Beaufort West - Table A3 Budgeted Financial Performance (revenue and expenditure by municipal vote)
Vote Description Ref 2007/8 2008/9 2009/10
R thousand Audited Outcome
Audited Outcome
Audited Outcome
Original Budget
Adjusted Budget
Full Year Forecast
Budget Year 2011/12
Budget Year +1 2012/13
Budget Year +2 2013/14
Revenue by Vote 1Vote1 - Municipal Manager 131 225 370 40 654 654 39 – – Vote2 - Director: Corporate Services 16,306 20,287 16,267 24,034 24,083 24,083 28,914 33,666 35,811 Vote3 - Director: Financial Services 12,809 14,602 19,292 30,440 20,122 20,122 24,757 26,551 28,611 Vote4 - Director: Engineering Services 26,888 22,882 34,663 64,033 62,674 62,674 59,018 22,082 22,078 Vote5 - Director: Community Services 32,251 48,668 34,661 21,446 23,374 23,374 20,577 21,463 23,029 Vote6 - Director: Electrical Services 30,646 43,658 59,878 61,234 60,406 60,406 78,427 98,812 88,241 Vote7 - Example 7 – – – – – – – – – Vote8 - Example 8 – – – – – – – – – Vote9 - Example 9 – – – – – – – – – Vote10 - Example 10 – – – – – – – – – Vote11 - Example 11 – – – – – – – – – Vote12 - Example 12 – – – – – – – – – Vote13 - Example 13 – – – – – – – – – Vote14 - Example 14 – – – – – – – – – Vote15 - Example 15 – – – – – – – – –
Total Revenue by Vote 2 119,032 150,322 165,130 201,227 191,312 191,312 211,732 202,575 197,769
Expenditure by Vote to be appropriated 1Vote1 - Municipal Manager 1,830 2,161 2,268 2,352 2,840 2,840 2,632 2,855 3,027 Vote2 - Director: Corporate Services 15,731 19,700 13,977 19,123 13,700 13,700 14,724 15,784 16,997 Vote3 - Director: Financial Services 4,661 5,478 7,942 20,072 9,318 9,318 13,902 14,698 15,667 Vote4 - Director: Engineering Services 31,646 36,263 34,905 45,282 47,007 47,007 52,512 54,936 58,839 Vote5 - Director: Community Services 29,880 45,007 35,354 25,012 26,936 26,936 24,797 25,925 27,847 Vote6 - Director: Electrical Services 28,349 31,823 45,137 55,126 56,123 56,123 64,640 76,698 84,922 Vote7 - Example 7 – – – – – – – – – Vote8 - Example 8 – – – – – – – – – Vote9 - Example 9 – – – – – – – – – Vote10 - Example 10 – – – – – – – – – Vote11 - Example 11 – – – – – – – – – Vote12 - Example 12 – – – – – – – – – Vote13 - Example 13 – – – – – – – – – Vote14 - Example 14 – – – – – – – – – Vote15 - Example 15 – – – – – – – – –
Total Expenditure by Vote 2 112,098 140,431 139,582 166,967 155,925 155,925 173,208 190,896 207,299 Surplus/(Deficit) for the year 2 6,935 9,891 25,548 34,260 35,388 35,388 38,524 11,679 (9,530) References1. Insert 'Vote'; e.g. department, if different to standard classification structure2. Must reconcile to Budgeted Financial Performance (revenue and expenditure)3. Assign share in 'associate' to relevant Vote
Current Year 2010/11 2011/12 Medium Term Revenue & Expenditure Framework
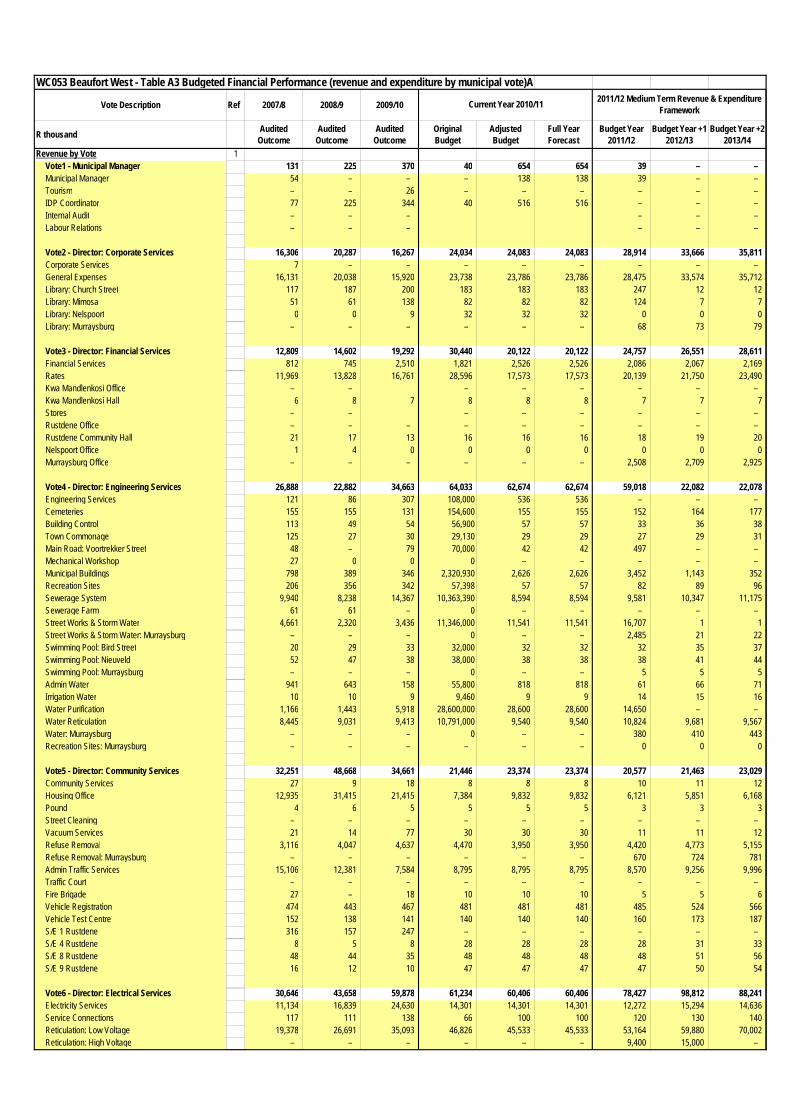
WC053 Beaufort West - Table A3 Budgeted Financial Performance (revenue and expenditure by municipal vote)A
Vote Description Ref 2007/8 2008/9 2009/10
R thousand Audited Outcome
Audited Outcome
Audited Outcome
Original Budget
Adjusted Budget
Full Year Forecast
Budget Year 2011/12
Budget Year +1 2012/13
Budget Year +2 2013/14
Revenue by Vote 1Vote1 - Municipal Manager 131 225 370 40 654 654 39 – – Municipal Manager 54 – – – 138 138 39 – – Tourism – – 26 – – – – – – IDP Coordinator 77 225 344 40 516 516 – – – Internal Audit – – – – – – Labour Relations – – – – – – Vote2 - Director: Corporate Services 16,306 20,287 16,267 24,034 24,083 24,083 28,914 33,666 35,811 Corporate Services 7 – – – – – – – – General Expenses 16,131 20,038 15,920 23,738 23,786 23,786 28,475 33,574 35,712 Library: Church Street 117 187 200 183 183 183 247 12 12 Library: Mimosa 51 61 138 82 82 82 124 7 7 Library: Nelspoort 0 0 9 32 32 32 0 0 0 Library: Murraysburg – – – – – – 68 73 79 Vote3 - Director: Financial Services 12,809 14,602 19,292 30,440 20,122 20,122 24,757 26,551 28,611 Financial Services 812 745 2,510 1,821 2,526 2,526 2,086 2,067 2,169 Rates 11,969 13,828 16,761 28,596 17,573 17,573 20,139 21,750 23,490 Kwa Mandlenkosi Office – – – – – – – – Kwa Mandlenkosi Hall 6 8 7 8 8 8 7 7 7 Stores – – – – – – – – Rustdene Office – – – – – – – – – Rustdene Community Hall 21 17 13 16 16 16 18 19 20 Nelspoort Office 1 4 0 0 0 0 0 0 0 Murraysburg Office – – – – – – 2,508 2,709 2,925 Vote4 - Director: Engineering Services 26,888 22,882 34,663 64,033 62,674 62,674 59,018 22,082 22,078 Engineering Services 121 86 307 108,000 536 536 – – – Cemeteries 155 155 131 154,600 155 155 152 164 177 Building Control 113 49 54 56,900 57 57 33 36 38 Town Commonage 125 27 30 29,130 29 29 27 29 31 Main Road: Voortrekker Street 48 – 79 70,000 42 42 497 – – Mechanical Workshop 27 0 0 0 – – – – – Municipal Buildings 798 389 346 2,320,930 2,626 2,626 3,452 1,143 352 Recreation Sites 206 356 342 57,398 57 57 82 89 96 Sewerage System 9,940 8,238 14,367 10,363,390 8,594 8,594 9,581 10,347 11,175 Sewerage Farm 61 61 – 0 – – – – – Street Works & Storm Water 4,661 2,320 3,436 11,346,000 11,541 11,541 16,707 1 1 Street Works & Storm Water: Murraysburg – – – 0 – – 2,485 21 22 Swimming Pool: Bird Street 20 29 33 32,000 32 32 32 35 37 Swimming Pool: Nieuveld 52 47 38 38,000 38 38 38 41 44 Swimming Pool: Murraysburg – – – 0 – – 5 5 5 Admin Water 941 643 158 55,800 818 818 61 66 71 Irrigation Water 10 10 9 9,460 9 9 14 15 16 Water Purification 1,166 1,443 5,918 28,600,000 28,600 28,600 14,650 – – Water Reticulation 8,445 9,031 9,413 10,791,000 9,540 9,540 10,824 9,681 9,567 Water: Murraysburg – – – 0 – – 380 410 443 Recreation Sites: Murraysburg – – – – – – 0 0 0 Vote5 - Director: Community Services 32,251 48,668 34,661 21,446 23,374 23,374 20,577 21,463 23,029 Community Services 27 9 18 8 8 8 10 11 12 Housing Office 12,935 31,415 21,415 7,384 9,832 9,832 6,121 5,851 6,168 Pound 4 6 5 5 5 5 3 3 3 Street Cleaning – – – – – – – – – Vacuum Services 21 14 77 30 30 30 11 11 12 Refuse Removal 3,116 4,047 4,637 4,470 3,950 3,950 4,420 4,773 5,155 Refuse Removal: Murraysburg – – – – – – 670 724 781 Admin Traffic Services 15,106 12,381 7,584 8,795 8,795 8,795 8,570 9,256 9,996 Traffic Court – – – – – – – – – Fire Brigade 27 – 18 10 10 10 5 5 6 Vehicle Registration 474 443 467 481 481 481 485 524 566 Vehicle Test Centre 152 138 141 140 140 140 160 173 187 S/E 1 Rustdene 316 157 247 – – – – – – S/E 4 Rustdene 8 5 8 28 28 28 28 31 33 S/E 8 Rustdene 48 44 35 48 48 48 48 51 56 S/E 9 Rustdene 16 12 10 47 47 47 47 50 54 Vote6 - Director: Electrical Services 30,646 43,658 59,878 61,234 60,406 60,406 78,427 98,812 88,241 Electricity Services 11,134 16,839 24,630 14,301 14,301 14,301 12,272 15,294 14,636 Service Connections 117 111 138 66 100 100 120 130 140 Reticulation: Low Voltage 19,378 26,691 35,093 46,826 45,533 45,533 53,164 59,880 70,002 Reticulation: High Voltage – – – – – – 9,400 15,000 –
Current Year 2010/11 2011/12 Medium Term Revenue & Expenditure Framework

WC053 Beaufort West - Table A3 Budgeted Financial Performance (revenue and expenditure by municipal vote)A
Vote Description Ref 2007/8 2008/9 2009/10
R thousand Audited Outcome
Audited Outcome
Audited Outcome
Original Budget
Adjusted Budget
Full Year Forecast
Budget Year 2011/12
Budget Year +1 2012/13
Budget Year +2 2013/14
Current Year 2010/11 2011/12 Medium Term Revenue & Expenditure Framework
Private Work 0 0 1 25 25 25 25 27 29 Street Lighting 16 16 16 16 446 446 518 5,319 19 Traffic Lights – – – – – – – – – Electricity: Murraysburg 2,928 3,162 3,415
Total Revenue by Vote 2 119,032 150,322 165,130 201,227 191,312 191,312 211,732 202,575 197,769

WC053 Beaufort West - Table A3 Budgeted Financial Performance (revenue and expenditure by municipal vote)A
Vote Description Ref 2007/8 2008/9 2009/10
R thousand Audited Outcome
Audited Outcome
Audited Outcome
Original Budget
Adjusted Budget
Full Year Forecast
Budget Year 2011/12
Budget Year +1 2012/13
Budget Year +2 2013/14
Current Year 2010/11 2011/12 Medium Term Revenue & Expenditure Framework
Expenditure by Vote 1Vote1 - Municipal Manager 1,830 2,161 2,268 2,352 2,840 2,840 2,632 2,855 3,027 Municipal Manager 1,415 1,501 1,487 1,829 1,849 1,849 1,533 1,665 1,784 Tourism 120 158 132 98 151 151 191 210 183 IDP Coordinator 296 501 649 425 841 841 349 377 407 Internal Audit 317 343 371 Labour Relations 242 261 281 Vote2 - Director: Corporate Services 15,731 19,700 13,977 19,123 13,700 13,700 14,724 15,784 16,997 Corporate Services 2,751 3,512 4,682 4,327 4,150 4,150 3,823 4,007 4,310 General Expenses 11,547 14,566 7,368 12,580 7,520 7,520 8,379 9,069 9,769 Library: Church Street 837 991 1,128 1,248 1,103 1,103 1,228 1,314 1,415 Library: Mimosa 541 576 731 836 840 840 910 979 1,054 Library: Nelspoort 54 55 68 133 87 87 74 80 86 Library: Murraysburg 311 336 362 Vote3 - Director: Financial Services 4,661 5,478 7,942 20,072 9,318 9,318 13,902 14,698 15,667 Financial Services 3,629 4,188 5,808 7,351 7,747 7,747 10,038 10,527 11,165 Rates – – 11,023 – – – – – Kwa Mandlenkosi Office 114 193 224 246 241 241 371 400 431 Kwa Mandlenkosi Hall 47 60 61 54 49 49 52 56 61 Stores 569 751 1,320 935 966 966 1,353 1,461 1,577 Rustdene Office 76 87 192 202 98 98 362 390 420 Rustdene Community Hall 52 73 87 67 65 65 66 71 77 Nelspoort Office 173 126 250 193 152 152 178 192 207 Murraysburg Office – – – – – – 1,482 1,600 1,728 Vote4 - Director: Engineering Services 31,646 36,263 34,905 45,282 47,007 47,007 52,512 54,936 58,839 Engineering Services 1,318 1,489 3,469 1,617 1,994 1,994 2,974 2,504 2,698 Cemeteries 226 273 274 375 435 435 413 446 482 Building Control 312 424 474 616 579 579 658 712 769 Town Commonage 173 102 126 156 119 119 120 130 140 Main Road: Voortrekker Street 61 – 63 88 52 52 622 – – Mechanical Workshop 877 1,036 1,246 1,355 1,239 1,239 1,285 1,388 1,499 Municipal Buildings 2,302 2,745 2,934 2,869 3,098 3,098 3,115 3,364 3,633 Recreation Sites 4,233 4,597 4,850 5,326 5,125 5,125 5,553 5,920 6,316 Sewerage System 1,027 1,273 1,360 2,157 1,670 1,670 2,058 2,223 2,400 Sewerage Farm 2,013 1,868 1,836 2,698 2,396 2,396 2,827 3,053 3,297 Street Works & Storm Water 9,370 10,565 7,492 14,155 14,175 14,175 14,096 15,224 16,441 Street Works & Storm Water: Murraysburg 805 870 939 Swimming Pool: Bird Street 197 251 224 271 184 184 293 316 341 Swimming Pool: Nieuveld 221 322 396 314 250 250 365 394 426 Swimming Pool: Murraysburg 49 53 58 Admin Water 3,890 5,382 2,240 5,953 7,831 7,831 5,763 5,779 5,988 Irrigation Water 29 37 38 60 51 51 66 71 77 Water Purification 2,520 3,001 5,069 3,629 3,576 3,576 6,884 7,604 8,102 Water Reticulation 2,877 2,897 2,812 3,644 4,232 4,232 3,807 4,067 4,348 Water: Murraysburg 717 775 837 Recreation Sites: Murraysburg 42 45 49 Vote5 - Director: Community Services 29,880 45,007 35,354 25,012 26,936 26,936 24,797 25,925 27,847 Community Services 773 881 1,191 1,458 1,475 1,475 1,637 1,703 1,840 Housing Office 14,575 31,864 22,162 8,636 10,907 10,907 7,291 7,114 7,532 Pound 8 17 25 35 29 29 32 35 38 Street Cleaning 488 615 604 1,085 731 731 1,096 1,184 1,278 Vacuum Services 160 138 168 235 207 207 231 250 270 Refuse Removal 3,415 3,973 4,231 4,465 4,460 4,460 3,627 3,917 4,230 Refuse Removal: Murraysburg 1,287 1,390 1,501 Admin Traffic Services 9,341 6,425 5,395 6,968 6,882 6,882 6,738 7,255 7,836 Traffic Court 285 345 493 549 535 535 694 750 810 Fire Brigade 229 217 499 879 824 824 1,358 1,455 1,572 Vehicle Registration 266 303 275 288 332 332 348 376 406 Vehicle Test Centre 267 168 255 292 431 431 350 378 408 S/E 1 Rustdene 8 5 28 28 28 – – – S/E 4 Rustdene 48 44 8 48 48 48 27 29 31 S/E 8 Rustdene 16 12 35 47 47 47 39 42 46 S/E 9 Rustdene 10 43 47 50 Vote6 - Director: Electrical Services 28,349 31,823 45,137 55,126 56,123 56,123 64,640 76,698 84,922 Electricity Services 12,327 11,813 22,290 21,139 22,418 22,418 20,038 22,708 22,395 Service Connections 314 356 287 332 181 181 459 368 354 Reticulation: Low Voltage 12,930 16,517 18,193 30,814 30,843 30,843 38,800 47,856 55,946 Reticulation: High Voltage 1,544 1,645 1,616 2,318 2,199 2,199 2,005 2,166 2,339

WC053 Beaufort West - Table A3 Budgeted Financial Performance (revenue and expenditure by municipal vote)A
Vote Description Ref 2007/8 2008/9 2009/10
R thousand Audited Outcome
Audited Outcome
Audited Outcome
Original Budget
Adjusted Budget
Full Year Forecast
Budget Year 2011/12
Budget Year +1 2012/13
Budget Year +2 2013/14
Current Year 2010/11 2011/12 Medium Term Revenue & Expenditure Framework
Private Work 7 8 0 20 20 20 20 22 23 Street Lighting 1,206 1,456 2,713 461 419 419 472 510 551 Traffic Lights 20 29 38 43 43 43 81 85 90 Electricity: Murraysburg 2,764 2,985 3,224
Total Expenditure by Vote 2 112,098 140,431 139,582 166,967 155,925 155,925 173,208 190,896 207,299
Surplus/(Deficit) for the year 2 6,935 9,891 25,548 34,260 35,388 35,388 38,524 11,679 (9,530) References1. Insert 'Vote'; e.g. Department, if different to standard structure2. Must reconcile to Financial Performance ('Revenue and Expenditure by Standard Classification' and 'Revenue and Expenditure')3. Assign share in 'associate' to relevant Vote

WC053 Beaufort West - Table A4 Budgeted Financial Performance (revenue and expenditure)
Description Ref 2007/8 2008/9 2009/10
R thousand 1 Audited Outcome
Audited Outcome
Audited Outcome
Original Budget
Adjusted Budget
Full Year Forecast
Pre-audit outcome
Budget Year 2011/12
Budget Year +1 2012/13
Budget Year +2 2013/14
Revenue By SourceProperty rates 2 11,969 13,828 16,756 28,596 17,572 17,572 – 20,139 21,750 23,490 Property rates - penalties & collection charges 1,479 1,167 443 660 660 660 730 740 750 Service charges - electricity revenue 2 19,534 26,840 31,551 46,712 45,229 45,229 – 55,526 62,431 72,757 Service charges - water revenue 2 8,514 9,083 8,390 10,824 9,203 9,203 – 10,249 10,140 10,063 Service charges - sanitation revenue 2 7,120 8,182 8,736 9,972 8,202 8,202 – 8,594 9,282 10,024 Service charges - refuse revenue 2 3,113 3,527 3,721 4,317 3,797 3,797 – 5,355 5,783 6,246 Service charges - otherRental of facilities and equipment 636 576 721 483 483 483 536 579 624 Interest earned - external investments 1,295 1,285 2,091 360 360 360 420 424 429 Interest earned - outstanding debtors 647 736 736 736 1,350 1,458 1,575 Dividends received – – Fines 14,879 12,073 7,428 8,606 9,136 9,136 8,303 8,967 9,684 Licences and permits 532 543 625 563 563 563 657 709 766 Agency services 436 407 430 450 450 450 705 761 822 Transfers recognised - operational 34,132 52,969 60,825 44,285 49,095 49,095 50,377 57,682 59,737 Other revenue 2 924 1,314 1,107 654 688 688 – 699 748 801 Gains on disposal of PPE 1,007 2,274 462 2 2 2 150 2 2
Total Revenue (excluding capital transfers and contributions)
105,570 134,071 143,930 157,220 146,178 146,178 – 163,789 181,456 197,769
Expenditure By TypeEmployee related costs 2 32,525 34,646 40,693 49,988 48,185 48,185 – 55,714 59,778 64,451 Remuneration of councillors 2,429 3,061 3,282 3,575 3,575 3,575 3,798 4,107 4,424 Debt impairment 3 4,649 6,239 264 5,477 8,354 8,354 6,277 5,930 5,922 Depreciation & asset impairment 2 8,947 9,403 7,754 11,050 11,050 11,050 – 11,507 12,123 12,902 Finance charges 1,310 2,134 2,591 1,701 1,569 1,569 1,968 2,323 1,869 Bulk purchases 2 11,170 16,238 20,992 26,371 26,196 26,196 – 38,531 47,521 55,632 Other materials 8 9,639 11,533 10,572 12,445 12,107 12,107 14,763 15,921 17,120 Contracted services 7,330 3,682 2,382 3,020 3,007 3,007 – 3,181 3,433 3,706 Transfers and grants 3,960 5,366 6,133 834 834 890 961 1,038 Other expenditure 4, 5 30,140 48,130 51,054 47,207 41,048 41,048 – 36,580 38,799 40,236 Loss on disposal of PPE – – – – –
Total Expenditure 112,098 140,431 139,582 166,967 155,925 155,925 – 173,208 190,896 207,299
Surplus/(Deficit) (6,528) (6,360) 4,348 (9,747) (9,747) (9,747) – (9,419) (9,440) (9,530) Transfers recognised - capital 13,463 16,251 21,200 44,007 45,135 45,135 47,942 21,119 – Contributions recognised - capital 6 – – – – – – – – – – Contributed assets – – – –
Surplus/(Deficit) after capital transfers & contributions
6,935 9,891 25,548 34,260 35,388 35,388 – 38,524 11,679 (9,530)
TaxationSurplus/(Deficit) after taxation 6,935 9,891 25,548 34,260 35,388 35,388 – 38,524 11,679 (9,530)
Attributable to minoritiesSurplus/(Deficit) attributable to municipality 6,935 9,891 25,548 34,260 35,388 35,388 – 38,524 11,679 (9,530)
Share of surplus/ (deficit) of associate 7Surplus/(Deficit) for the year 6,935 9,891 25,548 34,260 35,388 35,388 – 38,524 11,679 (9,530) References1. Classifications are revenue sources and expenditure type2. Detail to be provided in Table SA13. Previously described as 'bad or doubtful debts' - amounts shown should reflect the change in the provision for debt impairment4. Expenditure type components previously shown under repairs and maintenance should be allocated back to the originating expenditure group/item; e.g. employee costs5. Repairs & maintenance detailed in Table A9 and Table SA34c6. Contributions are funds provided by external organisations to assist with infrastructure development; e.g. developer contributions (detail to be provided in Table SA1)7. Equity method
2011/12 Medium Term Revenue & Expenditure FrameworkCurrent Year 2010/11

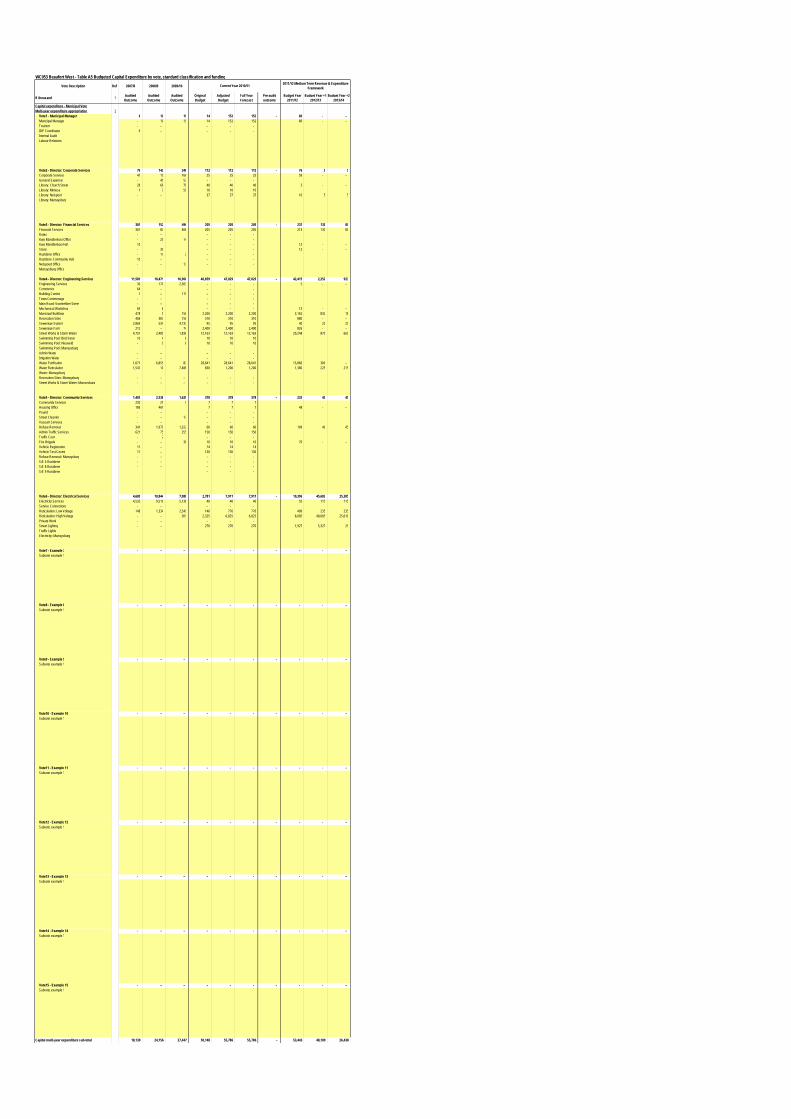
WC053 Beaufort West - Table A5 Budgeted Capital Expenditure by vote, standard classification and funding
Vote Description Ref 2007/8 2008/9 2009/10
R thousand 1 Audited Outcome
Audited Outcome
Audited Outcome
Original Budget
Adjusted Budget
Full Year Forecast
Pre-audit outcome
Budget Year 2011/12
Budget Year +1 2012/13
Budget Year +2 2013/14
Capital expenditure - VoteMulti-year expenditure to be appropriated 2
Vote1 - Municipal Manager 6 10 19 14 152 152 – 86 – – Vote2 - Director: Corporate Services 76 142 348 112 112 112 – 76 5 5 Vote3 - Director: Financial Services 381 152 496 205 205 205 – 237 130 80 Vote4 - Director: Engineering Services 11,581 10,471 16,966 46,659 47,029 47,029 – 42,415 2,252 923 Vote5 - Director: Community Services 1,405 2,538 1,629 378 378 378 – 233 40 45 Vote6 - Director: Electrical Services 4,680 10,844 7,988 2,781 7,911 7,911 – 10,396 45,682 25,385 Vote7 - Example 7 – – – – – – – – – – Vote8 - Example 8 – – – – – – – – – – Vote9 - Example 9 – – – – – – – – – – Vote10 - Example 10 – – – – – – – – – – Vote11 - Example 11 – – – – – – – – – – Vote12 - Example 12 – – – – – – – – – – Vote13 - Example 13 – – – – – – – – – – Vote14 - Example 14 – – – – – – – – – – Vote15 - Example 15 – – – – – – – – – –
Capital multi-year expenditure sub-total 7 18,130 24,156 27,447 50,148 55,786 55,786 – 53,443 48,109 26,438
Single-year expenditure to be appropriated 2Vote1 - Municipal Manager – – – – – – – – – – Vote2 - Director: Corporate Services – – – – – – – – – – Vote3 - Director: Financial Services – – – – – – – – – – Vote4 - Director: Engineering Services – – – – – – – – – – Vote5 - Director: Community Services – – – – – – – – – – Vote6 - Director: Electrical Services – – – – – – – – – – Vote7 - Example 7 – – – – – – – – – – Vote8 - Example 8 – – – – – – – – – – Vote9 - Example 9 – – – – – – – – – – Vote10 - Example 10 – – – – – – – – – – Vote11 - Example 11 – – – – – – – – – – Vote12 - Example 12 – – – – – – – – – – Vote13 - Example 13 – – – – – – – – – – Vote14 - Example 14 – – – – – – – – – – Vote15 - Example 15 – – – – – – – – – –
Capital single-year expenditure sub-total – – – – – – – – – – Total Capital Expenditure - Vote 18,130 24,156 27,447 50,148 55,786 55,786 – 53,443 48,109 26,438
Capital Expenditure - StandardGovernance and administration 886 238 907 2,443 2,581 2,581 – 369 962 98
Executive and council 58 238 14 152 152 86 – – Budget and treasury office 361 152 513 205 205 205 225 962 98 Corporate services 525 28 156 2,225 2,225 2,225 59 – –
Community and public safety 1,696 1,038 575 861 861 861 – 2,960 5 5 Community and social services 343 96 120 94 94 94 30 5 5 Sport and recreation 478 396 169 330 330 330 880 – – Public safety 690 85 285 430 430 430 2,003 – – Housing 186 461 7 7 7 48 – – Health
Economic and environmental services 4,827 2,658 4,258 12,307 12,307 12,307 – 23,417 870 665 Planning and development 43 170 2,422 3,170 – – Road transport 4,784 2,489 1,836 12,307 12,307 12,307 20,248 870 665 Environmental protection
Trading services 10,720 20,222 21,707 34,537 40,037 40,037 – 26,684 46,272 25,670 Electricity 4,680 10,844 7,988 2,511 7,641 7,641 8,469 45,682 25,385 Water 2,618 6,865 7,573 29,471 29,841 29,841 17,240 525 215 Waste water management 3,081 534 4,807 2,495 2,495 2,495 866 25 25 Waste management 341 1,979 1,339 60 60 60 109 40 45
Other 13 – – Total Capital Expenditure - Standard 3 18,130 24,156 27,447 50,148 55,786 55,786 – 53,443 48,109 26,438
Funded by:National Government 5,134 13,163 16,312 39,725 40,565 40,565 44,374 21,119 – Provincial Government 7,389 2,682 4,810 4,282 4,580 4,580 3,569 – – District MunicipalityOther transfers and grants 431
Transfers recognised - capital 4 12,523 15,845 21,554 44,007 45,145 45,145 – 47,942 21,119 – Public contributions & donations 5 1,649 677 Borrowing 6 714 2,213 4,310 3,725 8,225 8,225 2,870 250 – Internally generated funds 3,245 5,420 1,583 2,416 2,416 2,416 2,631 26,740 26,438
Total Capital Funding 7 18,130 24,156 27,447 50,148 55,786 55,786 – 53,443 48,109 26,438 References1. Municipalities may choose to appropriate for capital expenditure for three years or for one year (if one year appropriation projected expenditure required for yr2 and yr3).
5. Must reconcile to Budgeted Financial Performance (revenue and expenditure)6. Include finance leases and PPP capital funding component of unitary payment - total borrowing/repayments to reconcile to changes in Table SA177. Total Capital Funding must balance with Total Capital Expenditure
2011/12 Medium Term Revenue & Expenditure FrameworkCurrent Year 2010/11
8. Include any capitalised interest (MFMA section 46) as part of relevant capital budget
3. Capital expenditure by standard classification must reconcile to the appropriations by vote2. Include capital component of PPP unitary payment. Note that capital transfers are only appropriated to municipalities for the budget year
4. Must reconcile to supporting table SA20 and to Budgeted Financial Performance (revenue and expenditure)
WC053 Beaufort West - Table A5 Budgeted Capital Expenditure by vote, standard classification and funding
Vote Description Ref 2007/8 2008/9 2009/10
R thousand 1 Audited Outcome
Audited Outcome
Audited Outcome
Original Budget
Adjusted Budget
Full Year Forecast
Pre-audit outcome
Budget Year 2011/12
Budget Year +1 2012/13
Budget Year +2 2013/14
Capital expenditure - Municipal VoteMulti-year expenditure appropriation 2
Vote1 - Municipal Manager 6 10 19 14 152 152 – 86 – – Municipal Manager – 10 19 14 152 152 86 – – Tourism – – – – – IDP Coordinator 6 – – – – Internal AuditLabour Relations
Vote2 - Director: Corporate Services 76 142 348 112 112 112 – 76 5 5 Corporate Services 47 19 166 25 25 25 59 – – General Expenses – 49 53 – – – Library: Church Street 28 68 79 40 40 40 2 – – Library: Mimosa 1 7 50 10 10 10 Library: Nelspoort – – 37 37 37 16 5 5 Library: Murraysburg
Vote3 - Director: Financial Services 381 152 496 205 205 205 – 237 130 80 Financial Services 361 84 468 205 205 205 213 130 80 Rates – – – – – Kwa Mandlenkosi Office – 20 14 – – – Kwa Mandlenkosi Hall 10 – – – 12 – – Stores – 30 – – – 12 – – Rustdene Office – 17 2 – – – Rustdene Community Hall 10 – – – – Nelspoort Office – – 13 – – – Murraysburg Office
Vote4 - Director: Engineering Services 11,581 10,471 16,966 46,659 47,029 47,029 – 42,415 2,252 923 Engineering Services 30 170 2,303 – – – 5 – – Cemeteries 64 – – – – Building Control 7 – 119 – – – Town Commonage – – – – – Main Road: Voortrekker Street – – – – – Mechanical Workshop 69 8 – – – 13 – – Municipal Buildings 478 9 156 2,200 2,200 2,200 3,165 832 18 Recreation Sites 468 383 156 310 310 310 880 – – Sewerage System 2,869 534 4,733 95 95 95 40 25 25 Sewerage Farm 212 – 74 2,400 2,400 2,400 826 – – Street Works & Storm Water 4,757 2,489 1,836 12,163 12,163 12,163 20,248 870 665 Swimming Pool: Bird Street 10 4 8 10 10 10 Swimming Pool: Nieuveld – 9 8 10 10 10 Swimming Pool: MurraysburgAdmin Water – – – – – Irrigation Water – – – – – Water Purification 1,071 6,855 87 28,641 28,641 28,641 15,860 300 – Water Reticulation 1,547 10 7,486 830 1,200 1,200 1,380 225 215 Water: MurraysburgRecreation Sites: Murraysburg – – – – – – Street Works & Storm Water: Murraysburg – – – – – –
Vote5 - Director: Community Services 1,405 2,538 1,629 378 378 378 – 233 40 45 Community Services 230 21 5 7 7 7 Housing Office 186 461 7 7 7 48 – – Pound – – – – – Street Cleaning – – 17 – – – Vacuum Services – – – – – Refuse Removal 341 1,979 1,322 60 60 60 109 40 45 Admin Traffic Services 621 75 255 150 150 150 Traffic Court – 2 – – – Fire Brigade – – 30 10 10 10 76 – – Vehicle Registration 11 – 14 14 14 Vehicle Test Centre 17 – 130 130 130 Refuse Removal: Murraysburg – – – – – S/E 4 Rustdene – – – – – S/E 8 Rustdene – – – – – S/E 9 Rustdene – – –
Vote6 - Director: Electrical Services 4,680 10,844 7,988 2,781 7,911 7,911 – 10,396 45,682 25,385 Electricity Services 4,533 9,510 5,138 40 40 40 55 115 115 Service Connections – – – – – Reticulation: Low Voltage 148 1,334 2,549 146 776 776 409 235 235 Reticulation: High Voltage – – 301 2,325 6,825 6,825 8,005 40,005 25,010 Private Work – – – – – Street Lighting – – 270 270 270 1,927 5,327 25 Traffic LightsElectricity: Murraysburg
Vote7 - Example 7 – – – – – – – – – – Subvote example 1
Vote8 - Example 8 – – – – – – – – – – Subvote example 1
Vote9 - Example 9 – – – – – – – – – – Subvote example 1
Vote10 - Example 10 – – – – – – – – – – Subvote example 1
Vote11 - Example 11 – – – – – – – – – – Subvote example 1
Vote12 - Example 12 – – – – – – – – – – Subvote example 1
Vote13 - Example 13 – – – – – – – – – – Subvote example 1
Vote14 - Example 14 – – – – – – – – – – Subvote example 1
Vote15 - Example 15 – – – – – – – – – – Subvote example 1
Capital multi-year expenditure sub-total 18,130 24,156 27,447 50,148 55,786 55,786 – 53,443 48,109 26,438
Current Year 2010/11 2011/12 Medium Term Revenue & Expenditure Framework

WC053 Beaufort West - Table A6 Budgeted Financial Position
Description Ref 2007/8 2008/9 2009/10
R thousand Audited Outcome
Audited Outcome
Audited Outcome
Original Budget
Adjusted Budget
Full Year Forecast
Pre-audit outcome
Budget Year 2011/12
Budget Year +1 2012/13
Budget Year +2 2013/14
ASSETSCurrent assets
Cash 1,952 12 12 12 12 12 12 12 12 Call investment deposits 1 12,991 27,202 30,821 11,689 11,689 11,689 – 8,689 6,689 4,689 Consumer debtors 1 17,498 18,572 24,040 23,612 22,353 22,353 – 16,475 11,358 6,032 Other debtors 970 3,764 3,261 3,027 3,027 3,027 2,751 2,454 1,968 Current portion of long-term receivables 10 1 1 – – – Inventory 2 1,385 2,158 2,172 2,990 2,990 2,990 2,345 2,757 2,568
Total current assets 34,806 51,709 60,307 41,330 40,071 40,071 – 30,273 23,270 15,269
Non current assetsLong-term receivables 48 14 4,115 3,986 3,128 2,385 InvestmentsInvestment property 1,654 1,595 1,536 1,476 1,476 1,476 1,417 1,358 1,299 Investment in AssociateProperty, plant and equipment 3 110,664 125,769 139,258 193,317 198,955 198,955 – 243,262 280,090 294,541 AgriculturalBiologicalIntangible 358 7 74 7 7 7 67 60 53 Other non-current assets
Total non current assets 112,724 127,385 144,982 194,800 200,438 200,438 – 248,733 284,636 298,277 TOTAL ASSETS 147,530 179,094 205,289 236,130 240,509 240,509 – 279,005 307,906 313,546
LIABILITIESCurrent liabilities
Bank overdraft 1 1,468 2,194 1,583 4,834 4,834 2,751 1,981 1,051 Borrowing 4 1,661 1,944 2,207 2,510 2,510 2,510 – 2,958 3,251 3,890 Consumer deposits 734 850 999 747 747 747 794 785 856 Trade and other payables 4 17,726 33,696 33,402 19,549 19,549 19,549 – 15,971 14,224 11,213 Provisions 1,303 3,033 3,967 3,568 3,890 4,151
Total current liabilities 21,425 40,992 42,769 24,389 27,640 27,640 – 26,041 24,131 21,160
Non current liabilitiesBorrowing 8,770 6,890 10,688 16,725 16,725 16,725 – 17,851 15,362 13,259 Provisions 2,823 14,886 16,043 18,049 18,049 18,049 – 18,082 19,618 20,792
Total non current liabilities 11,593 21,776 26,731 34,774 34,774 34,774 – 35,933 34,980 34,051 TOTAL LIABILITIES 33,017 62,768 69,500 59,163 62,414 62,414 – 61,974 59,111 55,211
NET ASSETS 5 114,512 116,326 135,790 176,968 178,095 178,095 – 217,031 248,795 258,335
COMMUNITY WEALTH/EQUITYAccumulated Surplus/(Deficit) 13,459 110,314 129,516 170,588 171,716 171,716 210,483 241,497 250,326 Reserves 4 101,053 6,012 6,274 6,380 6,380 6,380 – 6,549 7,298 8,008 Minorities' interests
TOTAL COMMUNITY WEALTH/EQUITY 5 114,512 116,326 135,790 176,968 178,095 178,095 – 217,031 248,795 258,335 References
2. Include completed low cost housing to be transferred to beneficiaries within 12 months3. Include 'Construction-work-in-progress' (disclosed separately in annual financial statements)4. Detail to be provided in Table SA3. Includes reserves to be funded by statute.5. Net assets must balance with Total Community Wealth/Equity
1. Detail to be provided in Table SA3
2011/12 Medium Term Revenue & Expenditure FrameworkCurrent Year 2010/11

WC053 Beaufort West - Table A7 Budgeted Cash Flows
Description Ref 2007/8 2008/9 2009/10
R thousand Audited Outcome
Audited Outcome
Audited Outcome
Original Budget
Adjusted Budget
Full Year Forecast
Pre-audit outcome
Budget Year 2011/12
Budget Year +1 2012/13
Budget Year +2 2013/14
CASH FLOW FROM OPERATING ACTIVITIESReceipts
Ratepayers and other 64,741 74,832 71,696 91,693 86,841 86,841 121,061 157,625 172,222 Government - operating 1 34,132 52,969 60,825 44,287 49,097 49,097 50,377 57,682 59,737 Government - capital 1 13,463 16,251 21,200 44,007 45,135 45,135 47,942 21,119 – Interest 1,295 1,285 2,738 360 360 360 1,370 1,532 1,921 Dividends
PaymentsSuppliers and employees (97,231) (109,108) (129,239) (133,775) (136,856) (136,856) (168,543) (187,255) (204,693) Finance charges (1,310) (2,134) (2,591) (1,701) (1,832) (1,832) (1,968) (2,323) (1,869) Transfers and Grants 1
NET CASH FROM/(USED) OPERATING ACTIVITIES 15,090 34,095 24,629 44,872 42,746 42,746 – 50,240 48,379 27,319
CASH FLOWS FROM INVESTING ACTIVITIESReceipts
Proceeds on disposal of PPE 1,065 2,303 430 Decrease (Increase) in non-current debtors 998 219 858 743 Decrease (increase) other non-current receivables 59 43 1,054 Decrease (increase) in non-current investments (351)
PaymentsCapital assets (18,130) (24,156) (27,523) (50,148) (55,786) (55,786) (53,443) (48,109) (26,438)
NET CASH FROM/(USED) INVESTING ACTIVITIES (17,356) (21,810) (26,096) (50,148) (55,786) (55,786) – (52,170) (47,250) (25,695)
CASH FLOWS FROM FINANCING ACTIVITIESReceipts
Short term loansBorrowing long term/refinancing 310 (1,599) 6,507 3,725 8,225 8,225 2,870 – – Increase (decrease) in consumer deposits (53) 117 149 (216) (216) (216) 47 (8) 71
PaymentsRepayment of borrowing (2,295) (1,907) (1,907) (1,907) (1,890) (2,351) (2,765)
NET CASH FROM/(USED) FINANCING ACTIVITIES 256 (1,483) 4,360 1,602 6,102 6,102 – 1,026 (2,359) (2,694)
NET INCREASE/ (DECREASE) IN CASH HELD (2,010) 10,803 2,893 (3,674) (6,938) (6,938) – (904) (1,230) (1,070) Cash/cash equivalents at the year begin: 2 16,953 14,943 25,746 13,792 13,792 13,792 13,792 6,854 5,950 4,721 Cash/cash equivalents at the year end: 2 14,943 25,746 28,639 10,118 6,854 6,854 13,792 5,950 4,721 3,650
References1. Local/District municipalities to include transfers from/to District/Local Municipalities2. Cash equivalents includes investments with maturities of 3 months or less
2011/12 Medium Term Revenue & Expenditure FrameworkCurrent Year 2010/11

WC053 Beaufort West - Table A8 Cash backed reserves/accumulated surplus reconciliation
Description Ref 2007/8 2008/9 2009/10
R thousand Audited Outcome
Audited Outcome
Audited Outcome
Original Budget
Adjusted Budget
Full Year Forecast
Pre-audit outcome
Budget Year 2011/12
Budget Year +1 2012/13
Budget Year +2 2013/14
Cash and investments availableCash/cash equivalents at the year end 1 14,943 25,746 28,639 10,118 6,854 6,854 13,792 5,950 4,721 3,650 Other current investments > 90 days – – 0 – 12 12 (13,792) – – – Non current assets - Investments 1 – – – – – – – – – –
Cash and investments available: 14,943 25,746 28,639 10,118 6,867 6,867 – 5,950 4,721 3,650
Application of cash and investmentsUnspent conditional transfers 8,396 21,116 21,748 8,330 8,330 8,330 – 5,330 3,830 1,830 Unspent borrowingStatutory requirements 2Other working capital requirements 3 2,698 12,852 10,499 (1,829) (2,296) (2,296) – (4,195) (2,414) 1,866 Other provisionsLong term investments committed 4 – – – – – – – – – – Reserves to be backed by cash/investments 5 5,714 6,012 6,380 6,380 6,380 2,592 2,947 3,357
Total Application of cash and investments: 16,808 39,980 32,247 12,880 12,413 12,413 – 3,726 4,363 7,052 Surplus(shortfall) (1,864) (14,234) (3,607) (2,762) (5,546) (5,546) – 2,224 358 (3,402) References1. Must reconcile with Budgeted Cash Flows2. For example: VAT, taxation3. Council approval for policy required - include sufficient working capital (e.g. allowing for a % of current debtors > 90 days as uncollectable)4. For example: sinking fund requirements for borrowing5. Council approval required for each reserve created and basis of cash backing of reserves
2011/12 Medium Term Revenue & Expenditure FrameworkCurrent Year 2010/11

WC053 Beaufort West - Table A9 Asset Management
Description Ref 2007/8 2008/9 2009/10
R thousand Audited Outcome
Audited Outcome
Audited Outcome
Original Budget
Adjusted Budget
Full Year Forecast
Budget Year 2011/12
Budget Year +1 2012/13
Budget Year +2 2013/14
CAPITAL EXPENDITURETotal New Assets 1 17,478 24,071 24,224 40,217 40,918 40,918 38,844 10,209 788
Infrastructure - Road transport 4,657 2,489 2,594 6,721 6,721 6,721 5,817 – – Infrastructure - Electricity 4,095 11,832 6,857 – 563 563 10,281 8,767 265 Infrastructure - Water 2,078 1,218 6,674 28,600 28,600 28,600 15,450 95 65 Infrastructure - Sanitation 2,888 534 4,733 2,400 2,400 2,400 726 – – Infrastructure - Other 389 5,142 – 2,000 2,000 2,000 3,230 822 5 Infrastructure 14,107 21,214 20,859 39,721 40,284 40,284 35,503 9,684 335 Community 602 239 – – – – – – – Heritage assets – – – – – – – – – Investment properties – – – – – – – – – Other assets 6 2,769 2,617 3,366 496 634 634 3,341 525 453 Agricultural Assets – – – – – – – – – Biological assets – – – – – – – – – Intangibles – – – – – – – – –
Total Renewal of Existing Assets 2 652 62 3,222 9,931 14,868 14,868 14,599 1,195 715 Infrastructure - Road transport – – 1,351 5,322 5,322 5,322 13,630 800 600 Infrastructure - Electricity 22 – – 2,581 7,148 7,148 – – – Infrastructure - Water 385 36 – 725 1,095 1,095 180 95 65 Infrastructure - Sanitation – – – – – – – – – Infrastructure - Other 128 – 445 165 165 165 765 300 50 Infrastructure 535 36 1,796 8,793 13,729 13,729 14,575 1,195 715 Community – – 157 – – – – – – Heritage assets – – – – – – – – – Investment properties – – – – – – – – – Other assets 6 117 26 1,270 1,139 1,139 1,139 24 – – Agricultural Assets – – – – – – – – – Biological assets – – – – – – – – – Intangibles – – – – – – – – –
Total Capital Expenditure 4 Infrastructure - Road transport 4,657 2,489 3,945 12,043 12,043 12,043 19,448 800 600 Infrastructure - Electricity 4,117 11,832 6,857 2,581 7,711 7,711 10,281 8,767 265 Infrastructure - Water 2,463 1,254 6,674 29,325 29,695 29,695 15,630 190 130 Infrastructure - Sanitation 2,888 534 4,733 2,400 2,400 2,400 726 – – Infrastructure - Other 517 5,142 445 2,165 2,165 2,165 3,995 1,122 55 Infrastructure 14,642 21,250 22,654 48,514 54,013 54,013 50,079 10,879 1,050 Community 602 239 157 – – – – – – Heritage assets – – – – – – – – – Investment properties – – – – – – – – – Other assets 2,886 2,644 4,636 1,634 1,772 1,772 3,364 525 453 Agricultural Assets – – – – – – – – – Biological assets – – – – – – – – – Intangibles – – – – – – – – –
TOTAL CAPITAL EXPENDITURE - Asset class 2 18,130 24,133 27,447 50,148 55,786 55,786 53,443 11,404 1,503
ASSET REGISTER SUMMARY - PPE (WDV) 5 Infrastructure - Road transport 26,089 25,732 29,054 36,735 39,769 39,769 56,985 55,382 53,400 Infrastructure - Electricity 20,156 30,772 32,746 47,635 48,015 48,015 55,209 97,496 119,238 Infrastructure - Water 11,341 11,893 17,969 45,613 46,201 46,201 60,180 58,520 56,700 Infrastructure - Sanitation 9,835 9,653 17,497 15,070 16,314 16,314 15,821 14,527 13,137 Infrastructure - Other 2,851 7,702 6,637 9,260 9,683 9,683 13,673 14,790 14,841
Infrastructure 70,273 85,752 103,904 154,313 159,981 159,981 201,869 240,716 257,315 Community 28,594 27,261 25,837 24,299 24,299 24,299 22,718 21,137 19,555 Heritage assets 582 559 536 512 512 512 489 466 442 Investment properties 1,654 1,595 1,536 1,476 1,476 1,476 1,417 1,358 1,299 Other assets 11,215 12,198 8,982 14,192 14,162 14,162 18,187 17,771 17,228 Agricultural Assets – – – – – – – – – Biological assets – – – – – – – – – Intangibles 358 7 74 7 7 7 67 60 53
TOTAL ASSET REGISTER SUMMARY - PPE (WDV) 5 112,676 127,371 140,867 194,800 200,438 200,438 244,746 281,508 295,892
EXPENDITURE OTHER ITEMSDepreciation & asset impairment 8,947 9,403 7,754 11,050 11,050 11,050 11,507 12,123 12,902 Repairs and Maintenance by Asset Class 3 9,639 11,533 10,572 12,445 12,107 12,107 14,763 15,921 17,120
Infrastructure - Road transport 2,740 2,739 1,735 4,947 4,947 4,947 5,223 5,618 5,992 Infrastructure - Electricity 924 963 1,116 963 963 963 1,557 1,682 1,816 Infrastructure - Water 2,370 1,473 1,747 1,075 1,075 1,075 1,719 1,856 2,005 Infrastructure - Sanitation 97 85 115 258 258 258 682 736 795 Infrastructure - Other 344 941 1,121 523 523 523 879 949 1,025 Infrastructure 6,475 6,201 5,833 7,765 7,765 7,765 10,059 10,841 11,633 Community 616 1,301 1,246 925 925 925 1,083 1,169 1,263 Heritage assets – – – – – – – – – Investment properties – – – – – – – – – Other assets 6, 7 2,548 4,031 3,492 3,754 3,416 3,416 3,621 3,911 4,224
TOTAL EXPENDITURE OTHER ITEMS 18,585 20,935 18,325 23,495 23,157 23,157 26,270 28,045 30,022
Renewal of Existing Assets as % of total capex 3.6% 0.3% 11.7% 19.8% 26.7% 26.7% 27.3% 10.5% 47.6%Renewal of Existing Assets as % of deprecn" 7.3% 0.7% 41.6% 89.9% 134.5% 134.5% 126.9% 9.9% 5.5%R&M as a % of PPE 8.7% 9.2% 7.6% 6.4% 6.1% 6.1% 6.1% 5.7% 5.8%Renewal and R&M as a % of PPE 9.0% 9.0% 10.0% 11.0% 13.0% 13.0% 12.0% 6.0% 6.0%
References1. Detail of new assets provided in Table SA34a2. Detail of renewal of existing assets provided in Table SA34b3. Detail of Repairs and Maintenance by Asset Class provided in Table SA34c4. Must reconcile to total capital expenditure on Budgeted Capital Expenditure5. Must reconcile to 'Budgeted Financial Position' (written down value)6. Donated/contributed and assets funded by finance leases to be allocated to the respective category
Current Year 2010/11 2011/12 Medium Term Revenue & Expenditure Framework

WC053 Beaufort West - Table A10 Basic service delivery measurement
2007/8 2008/9 2009/10
Outcome Outcome Outcome Original Budget
Adjusted Budget
Full Year Forecast
Budget Year 2011/12
Budget Year +1 2012/13
Budget Year +2 2013/14
Household service targets (000) 1Water:
Piped water inside dwellingPiped water inside yard (but not in dwelling)Using public tap (at least min.service level) 2Other water supply (at least min.service level) 4
Minimum Service Level and Above sub-total – – – – – – – – – Using public tap (< min.service level) 3Other water supply (< min.service level) 4No water supply
Below Minimum Service Level sub-total – – – – – – – – – Total number of households 5 – – – – – – – – –
Sanitation/sewerage:Flush toilet (connected to sewerage)Flush toilet (with septic tank)Chemical toiletPit toilet (ventilated)Other toilet provisions (> min.service level)
Minimum Service Level and Above sub-total – – – – – – – – – Bucket toiletOther toilet provisions (< min.service level)No toilet provisions
Below Minimum Service Level sub-total – – – – – – – – – Total number of households 5 – – – – – – – – –
Energy:Electricity (at least min.service level) 2,263 2,274 2,284 2,284 2,289 2,289 2,299 2,949 4,182 Electricity - prepaid (min.service level) 7,136 7,656 8,103 8,103 8,178 8,178 8,178 8,178 8,178
Minimum Service Level and Above sub-total 9,399 9,930 10,387 10,387 10,467 10,467 10,477 11,127 12,360 Electricity (< min.service level)Electricity - prepaid (< min. service level)Other energy sources
Below Minimum Service Level sub-total – – – – – – – – – Total number of households 5 9,399 9,930 10,387 10,387 10,467 10,467 10,477 11,127 12,360
Refuse:Removed at least once a week
Minimum Service Level and Above sub-total – – – – – – – – – Removed less frequently than once a weekUsing communal refuse dumpUsing own refuse dumpOther rubbish disposalNo rubbish disposal
Below Minimum Service Level sub-total – – – – – – – – – Total number of households 5 – – – – – – – – –
Households receiving Free Basic Service 7Water (6 kilolitres per household per month) 3 3 4 4 4 4 4 4 5 Sanitation (free minimum level service) 3 2 3 3 3 3 3 3 4 Electricity/other energy (50kwh per household per month) 3 3 4 4 4 4 4 4 5 Refuse (removed at least once a week) 1 1 1 1 1 1 1 1 2
Cost of Free Basic Services provided (R'000) 8Water (6 kilolitres per household per month) 715 918 408 1,315 1,127 1,127 3,282 3,544 3,828 Sanitation (free sanitation service) 1,001 765 420 1,670 1,482 1,482 1,711 1,847 1,995 Electricity/other energy (50kwh per household per month) 726 874 2,493 1,663 1,475 1,475 1,768 1,909 2,062 Refuse (removed once a week) 265 342 295 538 350 350 261 282 304
Total cost of FBS provided (minimum social package) 2,707 2,899 3,615 5,187 4,434 4,434 7,021 7,583 8,189
Highest level of free service providedProperty rates (R value threshold) 19,000 19,000 19,000 19,000 19,000 19,000 Water (kilolitres per household per month) 6 6 6 6 6 6 6 6 6 Sanitation (kilolitres per household per month) – – Sanitation (Rand per household per month) 49 53 71 62 62 62 66 71 76 Electricity (kwh per household per month) 50 50 50 50 50 50 50 50 50 Refuse (average litres per week) 90 90 90 90 90 90 90 90 90
Revenue cost of free services provided (R'000) 9Property rates (R15 000 threshold rebate) 1,513 1,697 1,697 1,697 2,096 2,264 245 Property rates (other exemptions, reductions and rebates) 2,576 2,751 11,247 11,023 11,023 11,023 18,668 20,161 21,774 Water 2,384 2,388 1,061 1,892 1,621 1,621 2,735 2,953 3,190 Sanitation 1,126 967 531 1,766 1,770 1,770 2,042 2,206 2,382 Electricity/other energy 1,142 1,209 3,449 2,060 1,483 1,483 2,189 2,365 2,554 Refuse 283 308 265 455 521 521 389 420 453 Municipal Housing - rental rebatesHousing - top structure subsidies 6Other
Total revenue cost of free services provided (total social package) 7,512 7,623 18,066 18,893 18,114 18,114 28,119 30,368 30,597 References1. Include services provided by another entity; e.g. Eskom2. Stand distance <= 200m from dwelling3. Stand distance > 200m from dwelling4. Borehole, spring, rain-water tank etc.5. Must agree to total number of households in municipal area6. Include value of subsidy provided by municipality above provincial subsidy level7. Show number of households receiving at least these levels of services completely free8. Must reflect the cost to the municipality of providing the Free Basic Service
Current Year 2010/11 2011/12 Medium Term Revenue & Expenditure Framework
Description Ref

WC053 Beaufort West - Supporting Table SA1 Supportinging detail to 'Budgeted Financial Performance'
2007/8 2008/9 2009/10
Audited Outcome
Audited Outcome
Audited Outcome
Original Budget
Adjusted Budget
Full Year Forecast
Pre-audit outcome
Budget Year 2011/12
Budget Year +1 2012/13
Budget Year +2 2013/14
R thousandREVENUE ITEMS:Property rates 6
Total Property Rates 14,545 16,579 18,270 30,293 19,269 19,269 22,235 24,014 25,935less Revenue Foregone 2,576 2,751 1,513 1,697 1,697 1,697 2,096 2,264 2,445
Net Property Rates 11,969 13,828 16,756 28,596 17,572 17,572 – 20,139 21,750 23,490
Service charges - electricity revenue 6Total Service charges - electricity revenue 19,534 26,840 34,999 46,712 45,229 45,229 57,715 64,795 75,311less Revenue Foregone 3,449 2,189 2,365 2,554
Net Service charges - electricity revenue 19,534 26,840 31,551 46,712 45,229 45,229 – 55,526 62,431 72,757
Service charges - water revenue 6Total Service charges - water revenue 8,514 9,083 9,451 10,824 9,203 9,203 12,983 13,093 13,252less Revenue Foregone 1,061 2,735 2,953 3,190
Net Service charges - water revenue 8,514 9,083 8,390 10,824 9,203 9,203 – 10,249 10,140 10,063
Service charges - sanitation revenueTotal Service charges - sanitation revenue 7,120 8,182 9,266 9,972 8,202 8,202 10,637 11,488 12,407less Revenue Foregone 531 2,042 2,206 2,382
Net Service charges - sanitation revenue 7,120 8,182 8,736 9,972 8,202 8,202 – 8,594 9,282 10,024
Service charges - refuse revenue 6Total refuse removal revenue 3,113 3,527 3,987 4,317 3,797 3,797 5,743 6,203 6,699 Total landfill revenueless Revenue Foregone 265 389 420 453
Net Service charges - refuse revenue 3,113 3,527 3,721 4,317 3,797 3,797 – 5,355 5,783 6,246
Other Revenue by sourceFuel levyOther revenue 3 924 1,314 1,107 654 688 688 699 748 801 Total 'Other' Revenue 1 924 1,314 1,107 654 688 688 – 699 748 801
EXPENDITURE ITEMS:Employee related costs
Salaries and Wages 2 20,379 22,962 29,336 38,176 35,588 35,588 42,411 45,451 49,040 Contributions to UIF, pensions, medical aid 6,535 5,339 5,965 7,764 7,061 7,061 8,286 8,944 9,659 Travel, motor car, accom; & other allowances 938 1,016 1,011 1,056 1,004 1,004 1,144 1,205 1,272 Housing benefits and allowances 258 328 245 239 225 225 230 248 264 Overtime 1,909 2,161 2,894 2,156 3,712 3,712 2,190 2,343 2,491 Performance bonus 207 241 214 407 407 407 442 477 515 Long service awards 45 8 194 19 19 19 277 303 331 Payments in lieu of leave 509 120 835 170 170 170 – – – Post-retirement benefit obligations 4 1,746 2,471 – – – – 734 807 880
sub-total 5 32,525 34,646 40,693 49,988 48,185 48,185 – 55,714 59,778 64,451 Less: Employees costs capitalised to PPE
Total Employee related costs 1 32,525 34,646 40,693 49,988 48,185 48,185 – 55,714 59,778 64,451
Contributions recognised - capitalList contributions by contract
Total Contributions recognised - capital – – – – – – – – – –
Depreciation & asset impairmentDepreciation of Property, Plant & Equipment 8,947 9,368 7,715 11,050 11,050 11,050 11,507 12,123 12,902 Lease amortisationCapital asset impairment 34 39
Total Depreciation & asset impairment 1 8,947 9,403 7,754 11,050 11,050 11,050 – 11,507 12,123 12,902
Bulk purchasesElectricity Bulk Purchases 10,997 15,727 19,640 25,896 25,896 25,896 35,126 43,843 51,660 Water Bulk Purchases 173 511 1,352 475 300 300 3,405 3,677 3,972
Total bulk purchases 1 11,170 16,238 20,992 26,371 26,196 26,196 – 38,531 47,521 55,632
Contracted servicesList services provided by contract 7,330 3,682 2,382 3,020 3,007 3,007 3,181 3,433 3,706
sub-total 1 7,330 3,682 2,382 3,020 3,007 3,007 – 3,181 3,433 3,706 Allocations to organs of state:
ElectricityWaterSanitationOther
Total contracted services 7,330 3,682 2,382 3,020 3,007 3,007 – 3,181 3,433 3,706
Other Expenditure By TypeCollection costs 242 299 329 280 380 380 400 432 467 Contributions to 'other' provisions 2,476 2,476 2,476 2,691 2,465 2,650 Consultant fees – Audit fees 551 961 1,127 1,045 1,722 1,722 1,826 1,954 2,080 General expenses 3 6,796 9,860 7,969 10,883 11,711 11,711 10,767 10,199 11,533 Operating grant expenditure 22,218 37,010 41,628 21,009 24,164 24,164 20,254 23,050 22,792 Impairment losses 332 – Rates rebates 11,023 – – Subsistence & Travelling Allowance 491 595 595 642 699 713
Total 'Other' Expenditure 1 30,140 48,130 51,054 47,207 41,048 41,048 – 36,580 38,799 40,236
Repairs and Maintenance by Expenditure Item 8
Employee related costsOther materialsContracted ServicesOther Expenditure 9,639 11,533 10,572 12,445 12,107 12,107 14,763 15,921 17,120
Total Repairs and Maintenance Expenditure 9 9,639 11,533 10,572 12,445 12,107 12,107 – 14,763 15,921 17,120
check 9,639 11,533 10,572 12,445 12,107 12,107 14,763 15,921 17,120
References1. Must reconcile with 'Budgeted Financial Performance (Revenue and Expenditure)2. Must reconcile to supporting documentation on staff salaries3. Insert other categories where revenue or expenditure is of a material nature (list separate items until 'General expenses' is not > 10% of Total Expenditure)4. Expenditure to meet any 'unfunded obligations'5 This sub-total must agree with the total on SA22, but excluding councillor and board member items6. Include a note for each revenue item that is affected by 'revenue foregone'7. Special consideration may have to be given to including 'goodwill arising' or 'joint venture' budgets where circumstances require this (include separately under relevant notes)
2011/12 Medium Term Revenue & Expenditure FrameworkCurrent Year 2010/11
Description Ref
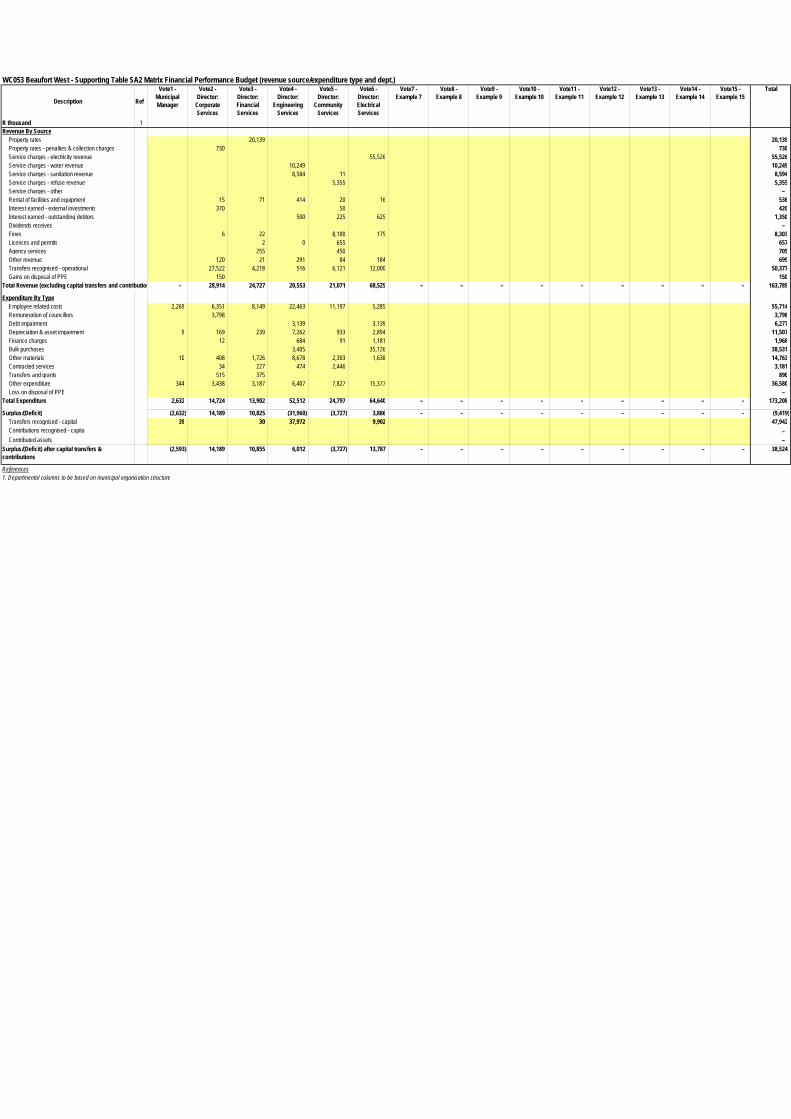
WC053 Beaufort West - Supporting Table SA2 Matrix Financial Performance Budget (revenue source/expenditure type and dept.)
Description Ref
R thousand 1Revenue By Source
Property rates 20,139 20,139 Property rates - penalties & collection charges 730 730 Service charges - electricity revenue 55,526 55,526 Service charges - water revenue 10,249 10,249 Service charges - sanitation revenue 8,584 11 8,594 Service charges - refuse revenue 5,355 5,355 Service charges - other – Rental of facilities and equipment 15 71 414 20 16 536 Interest earned - external investments 370 50 420 Interest earned - outstanding debtors 500 225 625 1,350 Dividends received – Fines 6 22 8,100 175 8,303 Licences and permits 2 0 655 657 Agency services 255 450 705 Other revenue 120 21 291 84 184 699 Transfers recognised - operational 27,522 4,218 516 6,121 12,000 50,377 Gains on disposal of PPE 150 150
Total Revenue (excluding capital transfers and contributions) – 28,914 24,727 20,553 21,071 68,525 – – – – – – – – – 163,789
Expenditure By TypeEmployee related costs 2,269 6,351 8,149 22,463 11,197 5,285 55,714 Remuneration of councillors 3,798 3,798 Debt impairment 3,139 3,139 6,277 Depreciation & asset impairment 9 169 239 7,262 933 2,894 11,507 Finance charges 12 684 91 1,181 1,968 Bulk purchases 3,405 35,126 38,531 Other materials 10 408 1,726 8,678 2,303 1,638 14,763 Contracted services 34 227 474 2,446 3,181 Transfers and grants 515 375 890 Other expenditure 344 3,438 3,187 6,407 7,827 15,377 36,580 Loss on disposal of PPE –
Total Expenditure 2,632 14,724 13,902 52,512 24,797 64,640 – – – – – – – – – 173,208
Surplus/(Deficit) (2,632) 14,189 10,825 (31,960) (3,727) 3,886 – – – – – – – – – (9,419) Transfers recognised - capital 39 30 37,972 9,902 47,942 Contributions recognised - capital – Contributed assets –
Surplus/(Deficit) after capital transfers & contributions
(2,593) 14,189 10,855 6,012 (3,727) 13,787 – – – – – – – – – 38,524
References1. Departmental columns to be based on municipal organisation structure
Vote5 - Director:
Community Services
Vote6 - Director: Electrical Services
Vote1 - Municipal Manager
Vote2 - Director:
Corporate Services
Vote3 - Director: Financial Services
Vote4 - Director:
Engineering Services
Vote15 - Example 15
Total Vote7 - Example 7
Vote8 - Example 8
Vote9 - Example 9
Vote10 - Example 10
Vote11 - Example 11
Vote12 - Example 12
Vote13 - Example 13
Vote14 - Example 14

WC053 Beaufort West - Supporting Table SA3 Supportinging detail to 'Budgeted Financial Position'
2007/8 2008/9 2009/10
Audited Outcome
Audited Outcome
Audited Outcome
Original Budget
Adjusted Budget
Full Year Forecast
Pre-audit outcome
Budget Year 2011/12
Budget Year +1 2012/13
Budget Year +2 2013/14
R thousandASSETSCall investment deposits
Call deposits < 90 days 12,991 27,202 30,821 11,689 11,689 11,689 8,689 6,689 4,689 Other current investments > 90 days
Total Call investment deposits 2 12,991 27,202 30,821 11,689 11,689 11,689 – 8,689 6,689 4,689
Consumer debtorsConsumer debtors 27,893 28,135 30,987 35,182 36,799 36,799 34,212 32,457 30,898 Less: Provision for debt impairment (10,395) (9,564) (6,947) (11,570) (14,446) (14,446) (17,737) (21,098) (24,865)
Total Consumer debtors 2 17,498 18,572 24,040 23,612 22,353 22,353 – 16,475 11,358 6,032
Debt impairment provisionBalance at the beginning of the year 14,521 10,568 9,564 9,545 9,545 9,545 14,446 17,737 21,098 Contributions to the provision 4,718 6,276 317 5,477 8,354 8,354 6,277 5,930 5,922 Bad debts written off (8,843) (7,281) (2,934) (3,453) (3,453) (3,453) (2,987) (2,568) (2,155)
Balance at end of year 10,395 9,564 6,947 11,570 14,446 14,446 – 17,737 21,098 24,865
Property, plant and equipment (PPE)PPE at cost/valuation (excl. finance leases) 187,939 212,130 221,000 300,238 305,876 305,876 359,871 408,821 436,174 Leases recognised as PPE 3 2,221 2,294 3,362 3,513 3,513 3,513 5,333 5,333 5,333 Less: Accumulated depreciation 79,497 88,654 85,104 110,434 110,434 110,434 121,941 134,064 146,966
Total Property, plant and equipment (PPE) 2 110,664 125,769 139,258 193,317 198,955 198,955 – 243,262 280,090 294,541
LIABILITIESCurrent liabilities - Borrowing
Short term loans (other than bank overdraft) 3 3 – – Current portion of long-term liabilities 1,661 1,941 2,204 2,510 2,510 2,510 2,958 3,251 3,890
Total Current liabilities - Borrowing 1,661 1,944 2,207 2,510 2,510 2,510 – 2,958 3,251 3,890
Trade and other payablesTrade and other creditors 6,616 11,244 11,654 9,287 9,287 9,287 10,316 9,871 8,950 Unspent conditional transfers 8,396 21,116 21,748 8,330 8,330 8,330 5,330 3,830 1,830 VAT 2,714 1,336 – 1,933 1,933 1,933 326 524 433
Total Trade and other payables 2 17,726 33,696 33,402 19,549 19,549 19,549 – 15,971 14,224 11,213
Non current liabilities - BorrowingBorrowing 4 8,030 6,762 9,614 15,862 15,862 15,862 16,762 14,404 11,979 Finance leases (including PPP asset element) 740 129 1,074 864 864 864 1,089 958 1,281
Total Non current liabilities - Borrowing 8,770 6,890 10,688 16,725 16,725 16,725 – 17,851 15,362 13,259
Provisions - non-currentRetirement benefits 2,743 13,088 13,863 15,873 15,873 15,873 15,684 16,981 17,890 List other major provision itemsRefuse landfill site rehabilitationOther 80 1,798 2,180 2,176 2,176 2,176 2,398 2,638 2,902
Total Provisions - non-current 2,823 14,886 16,043 18,049 18,049 18,049 – 18,082 19,618 20,792
CHANGES IN NET ASSETSAccumulated Surplus/(Deficit)
Accumulated Surplus/(Deficit) - opening balance 15,819 12,612 104,230 132,848 132,848 132,848 171,716 210,483 223,449 GRAP adjustments (1,843) 88,109 3,690 3,690 3,690 544 19,903 37,288 Restated balance 13,976 100,721 104,230 136,538 136,538 136,538 – 172,259 230,385 260,737 Surplus/(Deficit) 6,935 9,891 25,548 34,260 35,388 35,388 – 38,524 11,679 (9,530) Appropriations to Reserves (17,214) (4,516) (2,322) (2,832) (2,832) (2,832) (2,930) (3,457) (3,981) Transfers from Reserves 3,005 4,218 2,061 2,622 2,622 2,622 2,630 2,890 3,100 Depreciation offsets 6,758 Other adjustments
Accumulated Surplus/(Deficit) 1 13,459 110,314 129,516 170,588 171,716 171,716 – 210,483 241,497 250,326 Reserves
Housing Development Fund 3,256 3,433 3,710 3,820 3,820 3,820 3,957 4,351 4,651 Capital replacement 2,132 2,236 2,139 2,237 2,237 2,237 2,234 2,568 2,900 Capitalisation 2,323 Government grant 91,368 Donations and public contributions 1,649 Self-insurance 325 343 425 323 323 323 358 379 457 Other reserves (list)Revaluation
Total Reserves 2 101,053 6,012 6,274 6,380 6,380 6,380 – 6,549 7,298 8,008 TOTAL COMMUNITY WEALTH/EQUITY 2 114,512 116,326 135,790 176,968 178,095 178,095 – 217,031 248,795 258,335
Total capital expenditure includes expenditure on nationally significant priorities:Provision of basic services2010 World Cup
Description Ref
2011/12 Medium Term Revenue & Expenditure FrameworkCurrent Year 2010/11

WC053 Beaufort West - Supporting Table SA4 Reconciliation of IDP strategic objectives and budget (revenue)
Strategic Objective Goal 2007/8 2008/9 2009/10
R thousandAudited
OutcomeAudited
OutcomeAudited
OutcomeOriginal Budget
Adjusted Budget
Full Year Forecast
Budget Year 2011/12
Budget Year +1 2012/13
Budget Year +2 2013/14
Basic service delivery (Social and Infrastructure development)
To provide basic services and infrastructure to all residents in Beaufort West
88,825 114,932 128,831 144,518 143,525 143,525 154,973 141,267 133,052
Municipal Institutional development and transformation
To create an institution with skilled and informed employees who can provide professional and effective services to its clientele
977 416 376 2,350 2,793 2,793 3,518 1,172 383
Local economic development Promotion of tourism and SMME development
311 359 730 205 1,108 1,108 33 36 38
Municipal financial viablility and management
To achieve a strong financial position to withstand local economic impact in short and long term for the implementation of responsible and sustainable development and economic growth
12,782 14,577 19,271 30,417 20,099 20,099 24,733 26,526 28,584
Good governance and public participation
Ensure accessibility and promote goverance
16,138 20,038 15,920 23,738 23,786 23,786 28,475 33,574 35,712
Total Revenue (excluding capital transfers and contributions) 1 119,032 150,322 165,130 201,227 191,312 191,312 211,732 202,575 197,769 References1. Total revenue must reconcile to Table A4 Budgeted Financial Performance (revenue and expenditure)
Current Year 2010/11 2011/12 Medium Term Revenue & Expenditure Framework
Ref
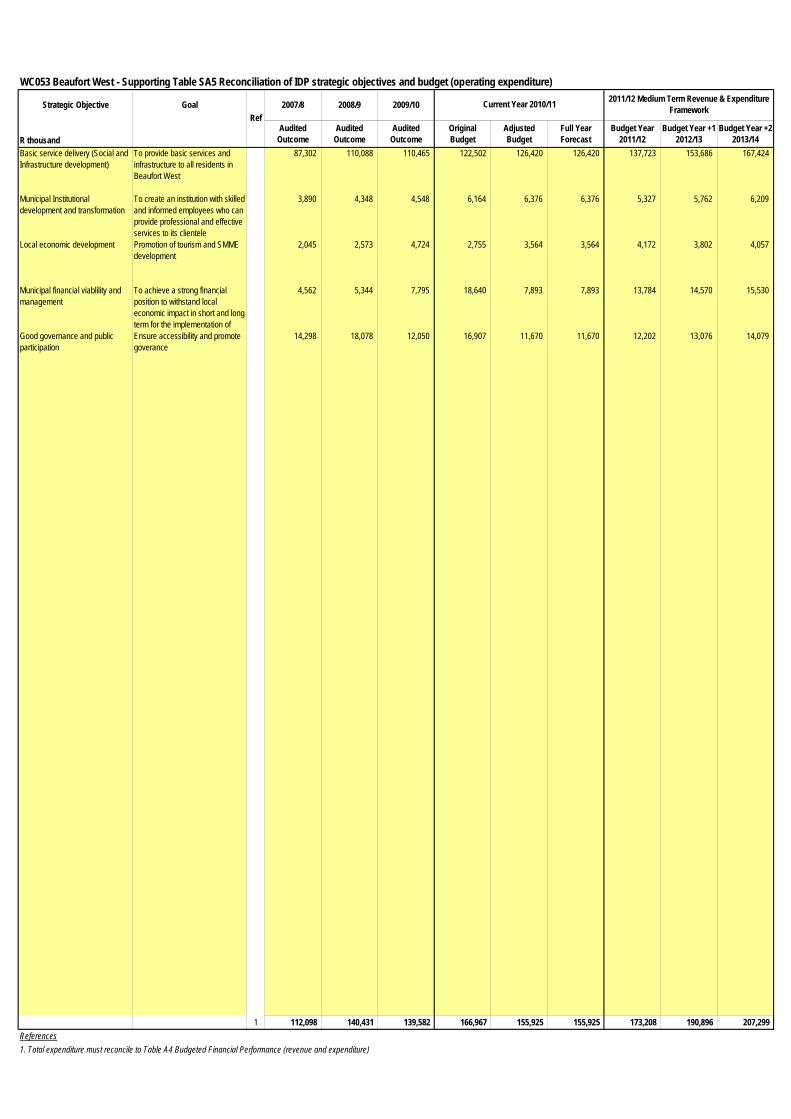
WC053 Beaufort West - Supporting Table SA5 Reconciliation of IDP strategic objectives and budget (operating expenditure)
Strategic Objective Goal 2007/8 2008/9 2009/10
R thousandAudited
OutcomeAudited
OutcomeAudited
OutcomeOriginal Budget
Adjusted Budget
Full Year Forecast
Budget Year 2011/12
Budget Year +1 2012/13
Budget Year +2 2013/14
Basic service delivery (Social and Infrastructure development)
To provide basic services and infrastructure to all residents in Beaufort West
87,302 110,088 110,465 122,502 126,420 126,420 137,723 153,686 167,424
Municipal Institutional development and transformation
To create an institution with skilled and informed employees who can provide professional and effective services to its clientele
3,890 4,348 4,548 6,164 6,376 6,376 5,327 5,762 6,209
Local economic development Promotion of tourism and SMME development
2,045 2,573 4,724 2,755 3,564 3,564 4,172 3,802 4,057
Municipal financial viablility and management
To achieve a strong financial position to withstand local economic impact in short and long term for the implementation of
4,562 5,344 7,795 18,640 7,893 7,893 13,784 14,570 15,530
Good governance and public participation
Ensure accessibility and promote goverance
14,298 18,078 12,050 16,907 11,670 11,670 12,202 13,076 14,079
1 112,098 140,431 139,582 166,967 155,925 155,925 173,208 190,896 207,299 References1. Total expenditure must reconcile to Table A4 Budgeted Financial Performance (revenue and expenditure)
Current Year 2010/11 2011/12 Medium Term Revenue & Expenditure Framework
Ref

WC053 Beaufort West - Supporting Table SA6 Reconciliation of IDP strategic objectives and budget (capital expenditure)
Strategic Objective Goal Goal Code 2007/8 2008/9 2009/10
R thousandAudited
OutcomeAudited
OutcomeAudited
OutcomeOriginal Budget
Adjusted Budget
Full Year Forecast
Budget Year 2011/12
Budget Year +1 2012/13
Budget Year +2 2013/14
Basic service delivery (Social and Infrastructure development)
To provide basic services and infrastructure to all residents in Beaufort West
A 17,211 23,918 26,437 47,705 53,204 53,204 49,894 47,147 26,340
Municipal Institutional development and transformation
To create an institution with skilled and informed employees who can provide professional and effective services to its clientele
B 525 37 341 2,239 2,377 2,377 3,312 832 18
Local economic development Promotion of tourism and SMME development
C 13 – 119 – – – – – –
Municipal financial viablility and management
To achieve a strong financial position to withstand local economic impact in short and long term for the implementation of
D 381 152 496 205 205 205 237 130 80
Good governance and public participation
Ensure accessibility and promote goverance
E – 49 53 – – – – –
F
G
H
I
J
K
L
M
N
O
P
Q
1 18,130 24,156 27,447 50,148 55,786 55,786 53,443 48,109 26,438 References1. Total capital expenditure must reconcile to Budgeted Capital Expenditure2. Goal code must be used on Table A36
Current Year 2010/11 2011/12 Medium Term Revenue & Expenditure Framework
Ref

WC053 Beaufort West - Supporting Table SA7 Measureable performance objectives
2007/8 2008/9 2009/10
Audited Outcome
Audited Outcome
Audited Outcome
Original Budget
Adjusted Budget
Full Year Forecast
Budget Year 2011/12
Budget Year +1 2012/13
Budget Year +2 2013/14
Vote 1 - vote nameFunction 1 - (name)
Sub-function 1 - (name)Insert measure/s description
Sub-function 2 - (name)Insert measure/s description
Sub-function 3 - (name)Insert measure/s description
Function 2 - (name)Sub-function 1 - (name)
Insert measure/s description
Sub-function 2 - (name)Insert measure/s description
Sub-function 3 - (name)Insert measure/s description
Vote 2 - vote nameFunction 1 - (name)
Sub-function 1 - (name)Insert measure/s description
Sub-function 2 - (name)Insert measure/s description
Sub-function 3 - (name)Insert measure/s description
Function 2 - (name)Sub-function 1 - (name)
Insert measure/s description
Sub-function 2 - (name)Insert measure/s description
Sub-function 3 - (name)Insert measure/s description
Vote 3 - vote nameFunction 1 - (name)
Sub-function 1 - (name)Insert measure/s description
Sub-function 2 - (name)Insert measure/s description
Sub-function 3 - (name)Insert measure/s description
Function 2 - (name)Sub-function 1 - (name)
Insert measure/s description
Sub-function 2 - (name)Insert measure/s description
Sub-function 3 - (name)Insert measure/s description
And so on for the rest of the Votes
2. Include all Basic Services performance targets from 'Basic Service Delivery' to ensure Table SA7 represents all strategic responsibilities3. Only include prior year comparative information for individual measures where relevant activity occurred in that year/s
WC053 Beaufort West - Entities measureable performance objectives
2007/8 2008/9 2009/10
Audited Outcome
Audited Outcome
Audited Outcome
Original Budget
Adjusted Budget
Full Year Forecast
Budget Year 2011/12
Budget Year +1 2012/13
Budget Year +2 2013/14
Entity 1 - (name of entity)
Unit of measurementDescriptionCurrent Year 2010/11 2011/12 Medium Term Revenue & Expenditure
Framework
1. Include a measurable performance objective for each revenue source (within a relevant function) and each vote (MFMA s17(3)(b))
Description Unit of measurementCurrent Year 2010/11 2011/12 Medium Term Revenue & Expenditure
Framework
Insert measure/s description
Entity 2 - (name of entity)Insert measure/s description
Entity 3 - (name of entity)Insert measure/s description
And so on for the rest of the Entities
2. Only include prior year comparative information for individual measures where relevant activity occurred in that year/s1. Include a measurable performance objective as agreed with the parent municipality (MFMA s87(5)(d))

WC053 Beaufort West - Supporting Table SA8 Performance indicators and benchmarks
2007/8 2008/9 2009/10
Audited Outcome
Audited Outcome
Audited Outcome
Original Budget
Adjusted Budget
Full Year Forecast
Pre-audit outcome
Budget Year 2011/12
Budget Year +1 2012/13
Budget Year +2 2013/14
Borrowing ManagementBorrowing to Asset Ratio Total Long-Term Borrowing/Total Assets 5.9% 3.8% 5.2% 7.1% 7.0% 7.0% 0.0% 6.4% 5.0% 4.2%Credit RatingCapital Charges to Operating Expenditure Interest & Principal Paid /Operating
Expenditure1.2% 1.5% 3.5% 2.2% 2.2% 2.2% 0.0% 2.2% 2.4% 2.2%
Borrowed funding of 'own' capital expenditure Borrowing/Capital expenditure excl. transfers and grants and contributions
7.8% -21.0% 110.4% 60.7% 77.3% 77.3% 0.0% 52.2% 0.0% 0.0%
Safety of CapitalDebt to Equity Loans, Creditors, Overdraft & Tax Provision/
Funds & Reserves28.8% 54.0% 51.2% 33.4% 35.0% 35.0% 0.0% 28.6% 23.8% 21.4%
Gearing Long Term Borrowing/ Funds & Reserves 8.7% 114.6% 170.3% 262.2% 262.2% 262.2% 0.0% 272.6% 210.5% 165.6%
LiquidityCurrent Ratio Current assets/current liabilities 1.6 1.3 1.4 1.7 1.4 1.4 – 1.2 1.0 0.7 Current Ratio adjusted for aged debtors Current assets less debtors > 90 days/current
liabilities 1.6 1.3 0.9 0.9 0.8 0.8 – 0.5 0.3 0.0
Liquidity Ratio Monetary Assets/Current Liabilities 0.7 0.7 0.7 0.5 0.4 0.4 – 0.3 0.3 0.2 Revenue Management
Annual Debtors Collection Rate (Payment Level %) Last 12 Mths Receipts/Last 12 Mths Billing 93.7% 96.6% 91.0% 91.0% 91.0% 91.0% 90.5% 109.7% 130.0%
Outstanding Debtors to Revenue Total Outstanding Debtors to Annual Revenue 17.5% 16.7% 21.8% 16.9% 17.4% 17.4% 0.0% 14.2% 9.3% 5.3%
Longstanding Debtors Recovered Debtors > 12 Mths Recovered/Total Debtors > 12 Months Old
3.0% 5.0% 2.0% 5.0% 4.0% 4.0% 5.0% 5.0% 5.0%
Creditors ManagementCreditors System Efficiency % of Creditors Paid Within Terms
(within`MFMA' s 65(e))100.0% 100.0% 100.0% 100.0% 100.0% 100.0% 100.0% 100.0% 100.0%
Funding of ProvisionsProvisions not funded - % Unfunded Provns./Total Provisions 100.0% 100.0% 100.0% 100.0% 100.0% 100.0% 100.0% 100.0% 100.0%
Other IndicatorsElectricity Distribution Losses (2) % Volume (units purchased and generated
less units sold)/units purchased and generated
18.3% 15.6% 13.0% 11.0% 11.0% 11.0% 9.0% 7.0% 6.0%
Water Distribution Losses (2) % Volume (units purchased and own source less units sold)/Total units purchased and own source
33.5% 28.4% 31.9% 25.0% 25.0% 25.0% 20.0% 15.0% 10.0%
Employee costs Employee costs/(Total Revenue - capital revenue)
30.8% 25.8% 28.3% 31.8% 33.0% 33.0% 0.0% 34.0% 32.9% 32.6%
Remuneration Total remuneration/(Total Revenue - capital revenue)
33.1% 28.1% 2.3% 33.9% 5.4% 5.3% 35.7% 13.9% 5.8%
Repairs & Maintenance R&M/(Total Revenue excluding capital revenue)
0.0% 0.0% 0.0% 0.0% 0.0% 0.0% 0.0% 0.0% 0.0%
Finance charges & Depreciation FC&D/(Total Revenue - capital revenue) 9.7% 8.6% 7.2% 8.1% 8.6% 8.6% 0.0% 8.2% 8.0% 7.5%
IDP regulation financial viability indicators
i. Debt coverage (Total Operating Revenue - Operating Grants)/Debt service payments due within financial year)
55.6 16.1 36.7 49.8 49.8 49.8 – 29.2 26.4 29.5
ii.O/S Service Debtors to Revenue Total outstanding service debtors/annual revenue received for services
35.3% 35.3% 38.8% 26.2% 29.8% 29.8% 0.0% 19.0% 12.5% 6.5%
iii. Cost coverage (Available cash + Investments)/monthly fixed operational expenditure
2.8 4.3 4.9 1.3 0.9 0.9 – 0.6 0.5 0.3
References1. Consumer debtors > 12 months old are excluded from current assets2. Only include if services provided by the municipality
Description of financial indicator
2011/12 Medium Term Revenue & Expenditure Framework
Basis of calculation
Current Year 2010/11

WC053 Beaufort West - Supporting Table SA9 Social, economic and demographic statistics and assumptionsDescription of economic indicator Basis of calculation 1996 Census 2001 Census 2007 Survey 2007/8 2008/9 2009/10 Current Year
2010/11
DemographicsPopulation Stats SA 37 37 38 38 37 37 Females aged 5 - 14 Stats SA 6 6 Males aged 5 - 14 Stats SA 6 6 Females aged 15 - 34 Stats SA 6 6 Males aged 15 - 34 Stats SA 6 6 Unemployment Stats SA 5 4
Household income (households) (1.)None Stats SAR1 - R4800 Stats SAR4800 - R9600 Stats SA
Poverty profiles (2.)Family of 5 living on less than R1400 per month Stats SA 3469.00 4147.00
Household/demographics (000)Number of people in municipal area Stats SA 37,106 37,090 Number of poor people in municipal area Stats SANumber of households in municipal area Stats SA 8,994 9,149 7,508 7,902 8,690 Number of poor households in municipal area Stats SA 6,608 Definition of poor household (R per month) Stats SA
Housing statistics (3.)Formal Stats SA 8,657 8,896 Informal Stats SA 145 172 Total number of households Stats SA - 8,802 9,068 - - - - - - - Dwellings provided by municipality (4.) Stats SA 144 760 306 Dwellings provided by province/s Stats SADwellings provided by private sector (5.) Stats SATotal new housing dwellings Stats SA - - - 144 760 306 - - - -
Economic (6.)Inflation/inflation outlook (CPIX) 7.6%Interest rate - borrowingInterest rate - investmentRemuneration increasesConsumption growth (electricity)Consumption growth (water)
Collection rates (7.)Property tax/service chargesRental of facilities & equipmentInterest - external investmentsInterest - debtorsRevenue from agency services
References1. Monthly household income threshold2. Show the poverty analysis the municipality uses to determine its indigents policy and the provision of services3. Include total of all housing units within the municipality4. Number of subsidised dwellings to be constructed by the municipality under agency agreement with province5. Provide estimate based on building approval information. Include any non-subsidised dwellings constructed by the municipality6. Insert actual or estimated % increases assumed as a basis for budget calculations7. Insert actual or estimated % collection rate assumed as a basis for budget calculations for each revenue group
2011/12 Medium Term Revenue & Expenditure Framework
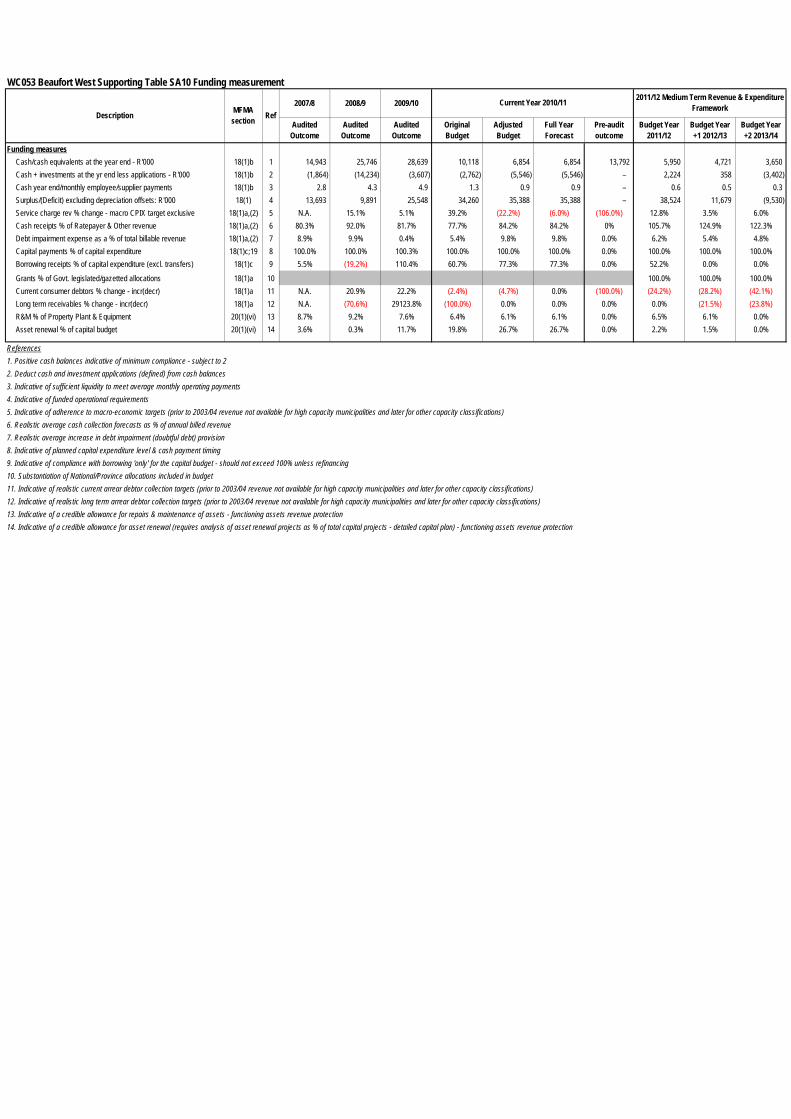
WC053 Beaufort West Supporting Table SA10 Funding measurement
2007/8 2008/9 2009/10
Audited Outcome
Audited Outcome
Audited Outcome
Original Budget
Adjusted Budget
Full Year Forecast
Pre-audit outcome
Budget Year 2011/12
Budget Year +1 2012/13
Budget Year +2 2013/14
Funding measuresCash/cash equivalents at the year end - R'000 18(1)b 1 14,943 25,746 28,639 10,118 6,854 6,854 13,792 5,950 4,721 3,650 Cash + investments at the yr end less applications - R'000 18(1)b 2 (1,864) (14,234) (3,607) (2,762) (5,546) (5,546) – 2,224 358 (3,402) Cash year end/monthly employee/supplier payments 18(1)b 3 2.8 4.3 4.9 1.3 0.9 0.9 – 0.6 0.5 0.3 Surplus/(Deficit) excluding depreciation offsets: R'000 18(1) 4 13,693 9,891 25,548 34,260 35,388 35,388 – 38,524 11,679 (9,530) Service charge rev % change - macro CPIX target exclusive 18(1)a,(2) 5 N.A. 15.1% 5.1% 39.2% (22.2%) (6.0%) (106.0%) 12.8% 3.5% 6.0%Cash receipts % of Ratepayer & Other revenue 18(1)a,(2) 6 80.3% 92.0% 81.7% 77.7% 84.2% 84.2% 0% 105.7% 124.9% 122.3%Debt impairment expense as a % of total billable revenue 18(1)a,(2) 7 8.9% 9.9% 0.4% 5.4% 9.8% 9.8% 0.0% 6.2% 5.4% 4.8%Capital payments % of capital expenditure 18(1)c;19 8 100.0% 100.0% 100.3% 100.0% 100.0% 100.0% 0.0% 100.0% 100.0% 100.0%Borrowing receipts % of capital expenditure (excl. transfers) 18(1)c 9 5.5% (19.2%) 110.4% 60.7% 77.3% 77.3% 0.0% 52.2% 0.0% 0.0%
Grants % of Govt. legislated/gazetted allocations 18(1)a 10 100.0% 100.0% 100.0%Current consumer debtors % change - incr(decr) 18(1)a 11 N.A. 20.9% 22.2% (2.4%) (4.7%) 0.0% (100.0%) (24.2%) (28.2%) (42.1%)Long term receivables % change - incr(decr) 18(1)a 12 N.A. (70.6%) 29123.8% (100.0%) 0.0% 0.0% 0.0% 0.0% (21.5%) (23.8%)R&M % of Property Plant & Equipment 20(1)(vi) 13 8.7% 9.2% 7.6% 6.4% 6.1% 6.1% 0.0% 6.5% 6.1% 0.0%Asset renewal % of capital budget 20(1)(vi) 14 3.6% 0.3% 11.7% 19.8% 26.7% 26.7% 0.0% 2.2% 1.5% 0.0%
References1. Positive cash balances indicative of minimum compliance - subject to 22. Deduct cash and investment applications (defined) from cash balances3. Indicative of sufficient liquidity to meet average monthly operating payments4. Indicative of funded operational requirements5. Indicative of adherence to macro-economic targets (prior to 2003/04 revenue not available for high capacity municipalities and later for other capacity classifications)6. Realistic average cash collection forecasts as % of annual billed revenue7. Realistic average increase in debt impairment (doubtful debt) provision8. Indicative of planned capital expenditure level & cash payment timing9. Indicative of compliance with borrowing 'only' for the capital budget - should not exceed 100% unless refinancing10. Substantiation of National/Province allocations included in budget11. Indicative of realistic current arrear debtor collection targets (prior to 2003/04 revenue not available for high capacity municipalities and later for other capacity classifications)12. Indicative of realistic long term arrear debtor collection targets (prior to 2003/04 revenue not available for high capacity municipalities and later for other capacity classifications)13. Indicative of a credible allowance for repairs & maintenance of assets - functioning assets revenue protection14. Indicative of a credible allowance for asset renewal (requires analysis of asset renewal projects as % of total capital projects - detailed capital plan) - functioning assets revenue protection
Description
2011/12 Medium Term Revenue & Expenditure FrameworkMFMA
section RefCurrent Year 2010/11

WC053 Beaufort West - Supporting Table SA11 Property rates summary
2007/8 2008/9 2009/10
Audited Outcome
Audited Outcome
Audited Outcome
Original Budget
Adjusted Budget
Full Year Forecast
Budget Year 2011/12
Budget Year +1 2012/13
Budget Year +2 2013/14
Valuation: 1Date of valuation: 01/07/2003 01/07/2003 01/07/2003Financial year valuation used 01/07/2003 01/07/2003 01/07/2003 2008 2008Municipal by-laws s6 in place? (Y/N) 2 No NoMunicipal/assistant valuer appointed? (Y/N) No NoMunicipal partnership s38 used? (Y/N)No. of assistant valuers (FTE) 3 1 1 No. of data collectors (FTE) 3 5 5 No. of internal valuers (FTE) 3 2 2 No. of external valuers (FTE) 3 – – No. of additional valuers (FTE) 4Valuation appeal board established? (Y/N) Yes YesImplementation time of new valuation roll (mths) 12 No. of properties 5 10,635 10,691 No. of sectional title values 5No. of unreasonably difficult properties s7(2) 1 1 1 No. of supplementary valuationsNo. of valuation roll amendmentsNo. of objections by rate payers 154 No. of appeals by rate payers 851 No. of successful objections 8 750 No. of successful objections > 10% 8Supplementary valuationPublic service infrastructure value (Rm) 5 53 Municipality owned property value (Rm) 354
Valuation reductions:Valuation reductions-public infrastructure (Rm) 16 Valuation reductions-nature reserves/park (Rm)Valuation reductions-mineral rights (Rm)Valuation reductions-R15,000 threshold (Rm) 146 Valuation reductions-public worship (Rm) 40 Valuation reductions-other (Rm)
Total valuation reductions: – – – 202 – – – – –
Total value used for rating (Rm) 5 761 776 2,575 Total land value (Rm) 5 334 340 Total value of improvements (Rm) 5 427 436 Total market value (Rm) 5 782 798 2,763
Rating:Residential rate used to determine rate for other categories? (Y/N) Yes YesDifferential rates used? (Y/N) 5 No NoLimit on annual rate increase (s20)? (Y/N) No NoSpecial rating area used? (Y/N) No NoPhasing-in properties s21 (number)Rates policy accompanying budget? (Y/N) YesFixed amount minimum value (R'000)Non-residential prescribed ratio s19? (%)
Rate revenue:Rate revenue budget (R '000) 6Rate revenue expected to collect (R'000) 6Expected cash collection rate (%)Special rating areas (R'000) 7
Rebates, exemptions - indigent (R'000)Rebates, exemptions - pensioners (R'000) 2,747 2,655 2,775 89 Rebates, exemptions - bona fide farm. (R'000) 265,205 546,737 7,368 Rebates, exemptions - other (R'000) 6,936 6,986 227,908 6,075 Phase-in reductions/discounts (R'000)
Total rebates,exemptns,reductns,discs (R'000) 9,683 274,846 777,420 – – – 13,532 – –
References1. All numbers to be expressed as whole numbers except FTEs and Rates in the Rand2. To give effect to rates policy3. Full Time Equivalent (FTE) should be expressed to one decimal place and takes into account full time and part time staff4. Required to implement new system (FTE)5. Provide relevant information for historical comparisons. Must reconcile to the total of Table SA126. Current and budget year must reconcile to Table A4 Budgeted Financial Performance (revenue and expenditure)7. Included in rate revenue budget8. In favour of the rate-payer
Current Year 2010/11 2011/12 Medium Term Revenue & Expenditure Framework
RefDescription

WC053 Beaufort West - Supporting Table SA13 Property rates by category (budget year)
Description RefResi. Indust. Bus. &
Comm.Farm props. State-owned Muni props. Public
service infra.Private
owned townsFormal & Informal Settle.
Comm. Land State trust land
Section 8(2)(n) (note
1)
Protect. Areas
National Monum/ts
Public benefit organs.
Mining Props.
Budget Year 2011/12Valuation:
No. of properties 7,686 220 917 72 1,571 132 2 91 No. of sectional title property valuesNo. of unreasonably difficult properties s7(2)No. of supplementary valuationsSupplementary valuation (Rm)No. of valuation roll amendmentsNo. of objections by rate-payersNo. of appeals by rate-payersNo. of appeals by rate-payers finalisedNo. of successful objections 5No. of successful objections > 10% 5Estimated no. of properties not valuedYears since last valuation (select) 4 4 4 4 4 4 4 4 4 4 4 4 4 4 4 4Frequency of valuation (select) 4 4 4 4 4 4 4 4 4 4 4 4 4 4 4 4Method of valuation used (select) Market Market Market Market Market Market Market Market Market Market Market Market Market Market Market MarketBase of valuation (select) Land & impr. Land & impr. Land & impr. Land & impr. Land & impr. Land & impr. Land & impr. Land & impr. Land & impr. Land & impr. Land & impr. Land & impr. Land & impr. Land & impr. Land & impr. Land & impr.Phasing-in properties s21 (number)Combination of rating types used? (Y/N) No No No No No No No No No No No No No No No NoFlat rate used? (Y/N) Yes Yes Yes Yes Yes Yes Yes Yes Yes Yes Yes Yes Yes Yes Yes YesIs balance rated by uniform rate/variable rate? Uniform Uniform Uniform Uniform Uniform Uniform Uniform Uniform Uniform Uniform Uniform Uniform Uniform Uniform Uniform Uniform
Valuation reductions:Valuation reductions-public infrastructure (Rm)Valuation reductions-nature reserves/park (Rm)Valuation reductions-mineral rights (Rm)Valuation reductions-R15,000 threshold (Rm)Valuation reductions-public worship (Rm)Valuation reductions-other (Rm) 2
Total valuation reductions:
Total value used for rating (Rm) 6Total land value (Rm) 6Total value of improvements (Rm) 6Total market value (Rm) 6
Rating:Average rate 3 0.011715 0.017040 0.011715 0.011715 0.011715 0.011715 0.011715 0.011715 Rate revenue budget (R '000)Rate revenue expected to collect (R'000)Expected cash collection rate (%) 4Special rating areas (R'000)
Rebates, exemptions - indigent (R'000)Rebates, exemptions - pensioners (R'000) 89 7,368 Rebates, exemptions - bona fide farm. (R'000) 1,639 2,210 84 184 166 10 1,783 Rebates, exemptions - other (R'000)Phase-in reductions/discounts (R'000)
Total rebates,exemptns,reductns,discs (R'000)
References1. Land & Assistance Act, Restitution of Land Rights, Communual Property Associations2. Include value of additional reductions is 'free' value greater than MPRA minimum.3. Average rate - cents in the Rand. Eg 10.26 cents in the Rand is 0.1026, expressed to 6 decimal places maximum4. Include arrears collections5. In favour of the rate-payer6. Provide relevant information for historical comparisons.
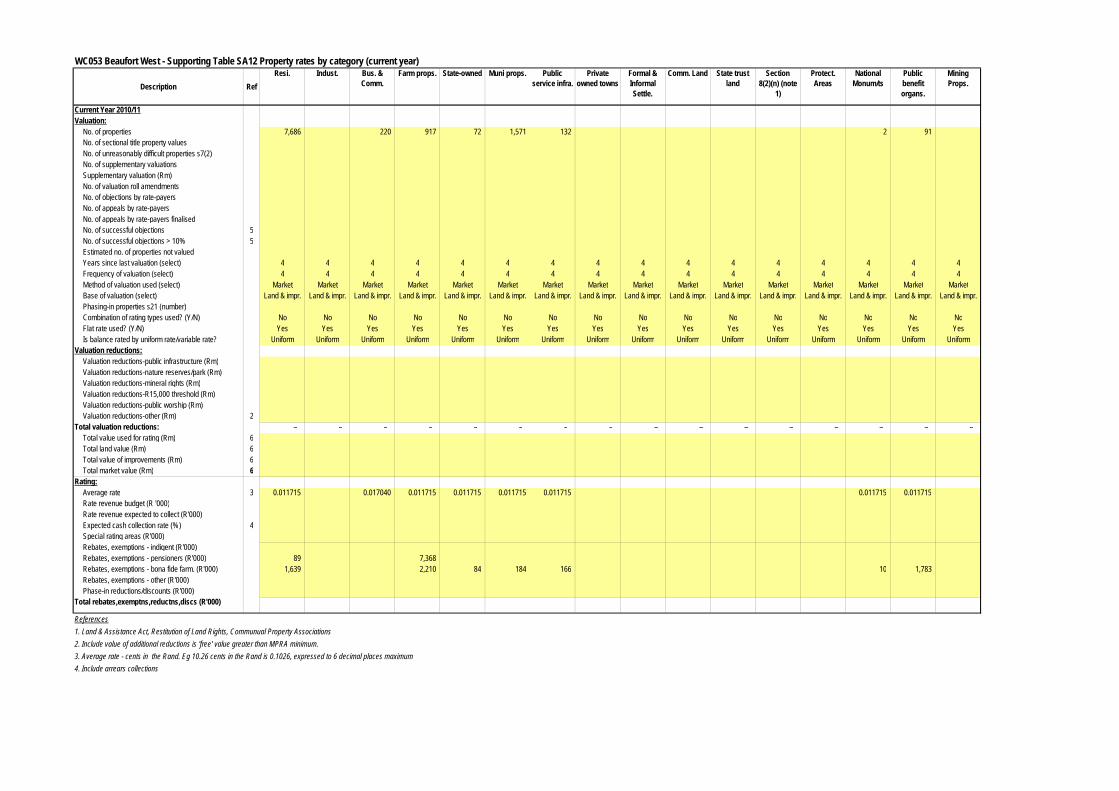
WC053 Beaufort West - Supporting Table SA12 Property rates by category (current year)
Description RefResi. Indust. Bus. &
Comm.Farm props. State-owned Muni props. Public
service infra.Private
owned townsFormal & Informal Settle.
Comm. Land State trust land
Section 8(2)(n) (note
1)
Protect. Areas
National Monum/ts
Public benefit organs.
Mining Props.
Current Year 2010/11Valuation:
No. of properties 7,686 220 917 72 1,571 132 2 91 No. of sectional title property valuesNo. of unreasonably difficult properties s7(2)No. of supplementary valuationsSupplementary valuation (Rm)No. of valuation roll amendmentsNo. of objections by rate-payersNo. of appeals by rate-payersNo. of appeals by rate-payers finalisedNo. of successful objections 5No. of successful objections > 10% 5Estimated no. of properties not valuedYears since last valuation (select) 4 4 4 4 4 4 4 4 4 4 4 4 4 4 4 4Frequency of valuation (select) 4 4 4 4 4 4 4 4 4 4 4 4 4 4 4 4Method of valuation used (select) Market Market Market Market Market Market Market Market Market Market Market Market Market Market Market MarketBase of valuation (select) Land & impr. Land & impr. Land & impr. Land & impr. Land & impr. Land & impr. Land & impr. Land & impr. Land & impr. Land & impr. Land & impr. Land & impr. Land & impr. Land & impr. Land & impr. Land & impr.Phasing-in properties s21 (number)Combination of rating types used? (Y/N) No No No No No No No No No No No No No No No NoFlat rate used? (Y/N) Yes Yes Yes Yes Yes Yes Yes Yes Yes Yes Yes Yes Yes Yes Yes YesIs balance rated by uniform rate/variable rate? Uniform Uniform Uniform Uniform Uniform Uniform Uniform Uniform Uniform Uniform Uniform Uniform Uniform Uniform Uniform Uniform
Valuation reductions:Valuation reductions-public infrastructure (Rm)Valuation reductions-nature reserves/park (Rm)Valuation reductions-mineral rights (Rm)Valuation reductions-R15,000 threshold (Rm)Valuation reductions-public worship (Rm)Valuation reductions-other (Rm) 2
Total valuation reductions: – – – – – – – – – – – – – – – – Total value used for rating (Rm) 6Total land value (Rm) 6Total value of improvements (Rm) 6Total market value (Rm) 6
Rating:Average rate 3 0.011715 0.017040 0.011715 0.011715 0.011715 0.011715 0.011715 0.011715 Rate revenue budget (R '000)Rate revenue expected to collect (R'000)Expected cash collection rate (%) 4Special rating areas (R'000)Rebates, exemptions - indigent (R'000)Rebates, exemptions - pensioners (R'000) 89 7,368 Rebates, exemptions - bona fide farm. (R'000) 1,639 2,210 84 184 166 10 1,783 Rebates, exemptions - other (R'000)Phase-in reductions/discounts (R'000)
Total rebates,exemptns,reductns,discs (R'000)
References1. Land & Assistance Act, Restitution of Land Rights, Communual Property Associations2. Include value of additional reductions is 'free' value greater than MPRA minimum.3. Average rate - cents in the Rand. Eg 10.26 cents in the Rand is 0.1026, expressed to 6 decimal places maximum4. Include arrears collections
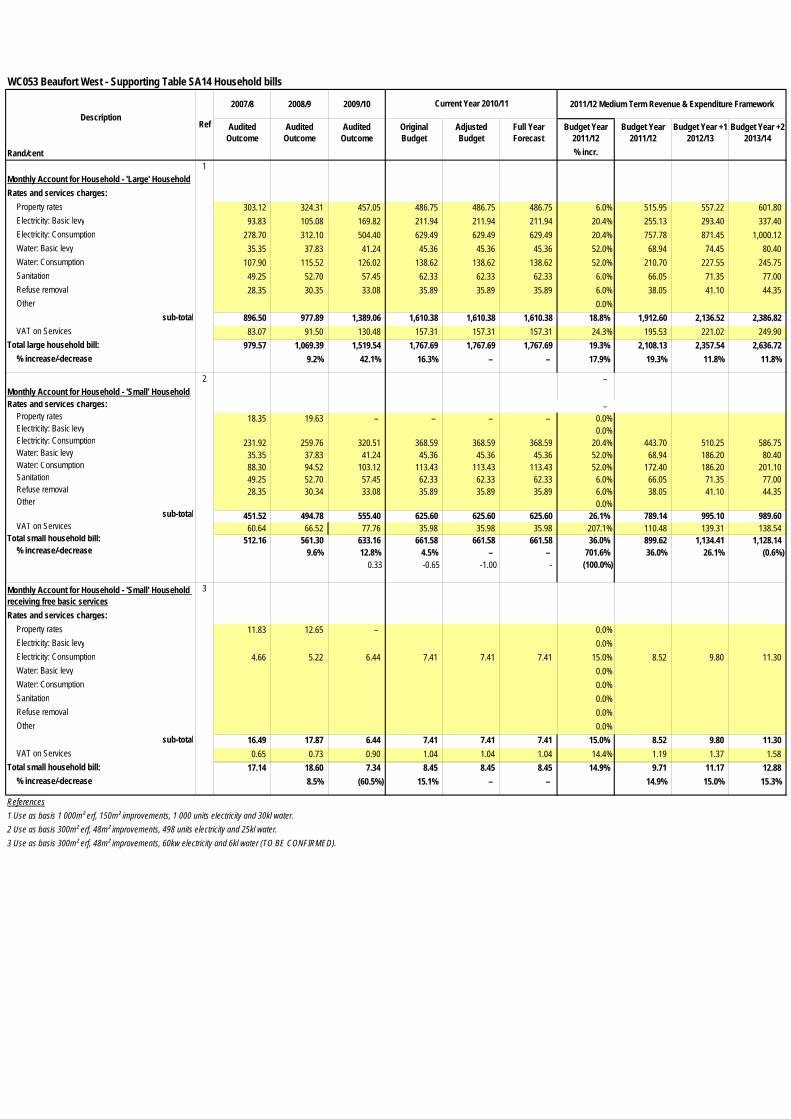
WC053 Beaufort West - Supporting Table SA14 Household bills
2007/8 2008/9 2009/10 2011/12 Medium Term Revenue & Expenditure Framework
Audited Outcome
Audited Outcome
Audited Outcome
Original Budget
Adjusted Budget
Full Year Forecast
Budget Year 2011/12
Budget Year 2011/12
Budget Year +1 2012/13
Budget Year +2 2013/14
Rand/cent % incr.
Monthly Account for Household - 'Large' Household1
Rates and services charges:Property rates 303.12 324.31 457.05 486.75 486.75 486.75 6.0% 515.95 557.22 601.80 Electricity: Basic levy 93.83 105.08 169.82 211.94 211.94 211.94 20.4% 255.13 293.40 337.40 Electricity: Consumption 278.70 312.10 504.40 629.49 629.49 629.49 20.4% 757.78 871.45 1,000.12 Water: Basic levy 35.35 37.83 41.24 45.36 45.36 45.36 52.0% 68.94 74.45 80.40 Water: Consumption 107.90 115.52 126.02 138.62 138.62 138.62 52.0% 210.70 227.55 245.75 Sanitation 49.25 52.70 57.45 62.33 62.33 62.33 6.0% 66.05 71.35 77.00 Refuse removal 28.35 30.35 33.08 35.89 35.89 35.89 6.0% 38.05 41.10 44.35 Other 0.0%
sub-total 896.50 977.89 1,389.06 1,610.38 1,610.38 1,610.38 18.8% 1,912.60 2,136.52 2,386.82 VAT on Services 83.07 91.50 130.48 157.31 157.31 157.31 24.3% 195.53 221.02 249.90
Total large household bill: 979.57 1,069.39 1,519.54 1,767.69 1,767.69 1,767.69 19.3% 2,108.13 2,357.54 2,636.72 % increase/-decrease 9.2% 42.1% 16.3% – – 17.9% 19.3% 11.8% 11.8%
–
Monthly Account for Household - 'Small' Household2 –
Rates and services charges: – Property rates 18.35 19.63 – – – – 0.0%Electricity: Basic levy 0.0%Electricity: Consumption 231.92 259.76 320.51 368.59 368.59 368.59 20.4% 443.70 510.25 586.75 Water: Basic levy 35.35 37.83 41.24 45.36 45.36 45.36 52.0% 68.94 186.20 80.40 Water: Consumption 88.30 94.52 103.12 113.43 113.43 113.43 52.0% 172.40 186.20 201.10 Sanitation 49.25 52.70 57.45 62.33 62.33 62.33 6.0% 66.05 71.35 77.00 Refuse removal 28.35 30.34 33.08 35.89 35.89 35.89 6.0% 38.05 41.10 44.35 Other 0.0%
sub-total 451.52 494.78 555.40 625.60 625.60 625.60 26.1% 789.14 995.10 989.60 VAT on Services 60.64 66.52 77.76 35.98 35.98 35.98 207.1% 110.48 139.31 138.54
Total small household bill: 512.16 561.30 633.16 661.58 661.58 661.58 36.0% 899.62 1,134.41 1,128.14 % increase/-decrease 9.6% 12.8% 4.5% – – 701.6% 36.0% 26.1% (0.6%)
0.33 -0.65 -1.00 - (100.0%)
Monthly Account for Household - 'Small' Household receiving free basic services
3
Rates and services charges:Property rates 11.83 12.65 – 0.0%Electricity: Basic levy 0.0%Electricity: Consumption 4.66 5.22 6.44 7.41 7.41 7.41 15.0% 8.52 9.80 11.30 Water: Basic levy 0.0%Water: Consumption 0.0%Sanitation 0.0%Refuse removal 0.0%Other 0.0%
sub-total 16.49 17.87 6.44 7.41 7.41 7.41 15.0% 8.52 9.80 11.30 VAT on Services 0.65 0.73 0.90 1.04 1.04 1.04 14.4% 1.19 1.37 1.58
Total small household bill: 17.14 18.60 7.34 8.45 8.45 8.45 14.9% 9.71 11.17 12.88 % increase/-decrease 8.5% (60.5%) 15.1% – – 14.9% 15.0% 15.3%
References1 Use as basis 1 000m² erf, 150m² improvements, 1 000 units electricity and 30kl water.2 Use as basis 300m² erf, 48m² improvements, 498 units electricity and 25kl water.3 Use as basis 300m² erf, 48m² improvements, 60kw electricity and 6kl water (TO BE CONFIRMED).
Ref
Current Year 2010/11Description

WC053 Beaufort West - Supporting Table SA15 Investment particulars by type
2007/8 2008/9 2009/10
Audited Outcome
Audited Outcome
Audited Outcome
Original Budget
Adjusted Budget
Full Year Forecast
Budget Year 2011/12
Budget Year +1 2012/13
Budget Year +2 2013/14
R thousandParent municipality
Securities - National GovernmentListed Corporate BondsDeposits - Bank 12,991 27,202 30,821 11,689 11,689 11,689 8,689 6,689 4,689 Deposits - Public Investment CommissionersDeposits - Corporation for Public DepositsBankers Acceptance CertificatesNegotiable Certificates of Deposit - BanksGuaranteed Endowment Policies (sinking)Repurchase Agreements - BanksMunicipal Bonds
Municipality sub-total 1 12,991 27,202 30,821 11,689 11,689 11,689 8,689 6,689 4,689
EntitiesSecurities - National GovernmentListed Corporate BondsDeposits - BankDeposits - Public Investment CommissionersDeposits - Corporation for Public DepositsBankers Acceptance CertificatesNegotiable Certificates of Deposit - BanksGuaranteed Endowment Policies (sinking)Repurchase Agreements - Banks
Entities sub-total – – – – – – – – –
Consolidated total: 12,991 27,202 30,821 11,689 11,689 11,689 8,689 6,689 4,689
References1. Total investments must reconcile to Budgeted Financial Position ('current' call investment deposits plus 'non-current' investments)
Current Year 2010/11 2011/12 Medium Term Revenue & Expenditure Framework
RefInvestment type

WC053 Beaufort West - Supporting Table SA16 Investment particulars by maturity
Investments by Maturity Ref Period of Investment Monetary value Interest to be realised
Name of institution & investment ID 1 Yrs/Months Rand thousandParent municipality
Commercial Banks Call Call Deposit Immediately 8,689
Municipality sub-total 8,689 –
Entities
Entities sub-total – –
TOTAL INVESTMENTS AND INTEREST 1 8,689 –
References1. Total investments must reconcile to all items in Table SA15 for the Current Year (30 June)2. List investments in expiry date order
Type of Investment Expiry date of investment

WC053 Beaufort West - Supporting Table SA17 Borrowing
Borrowing - Categorised by type Ref 2007/8 2008/9 2009/10
R thousand Audited Outcome
Audited Outcome
Audited Outcome
Original Budget
Adjusted Budget
Full Year Forecast
Budget Year 2011/12
Budget Year +1 2012/13
Budget Year +2 2013/14
Parent municipalityLong-Term Loans (annuity/reducing balance) 8,030 6,762 9,614 15,862 15,862 15,862 16,762 14,404 11,979 Long-Term Loans (non-annuity)Local registered stockInstalment CreditFinancial Leases 740 129 1,074 864 864 864 1,089 958 1,281 PPP liabilitiesFinance Granted By Cap Equipment SupplierMarketable BondsNon-Marketable BondsBankers AcceptancesFinancial derivativesOther Securities
Municipality sub-total 1 8,770 6,890 10,688 16,725 16,725 16,725 17,851 15,362 13,259
EntitiesLong-Term Loans (annuity/reducing balance)Long-Term Loans (non-annuity)Local registered stockInstalment CreditFinancial LeasesPPP liabilitiesFinance Granted By Cap Equipment SupplierMarketable BondsNon-Marketable BondsBankers AcceptancesFinancial derivativesOther Securities
Entities sub-total 1 – – – – – – – – –
Total Borrowing 1 8,770 6,890 10,688 16,725 16,725 16,725 17,851 15,362 13,259
References1. Total borrowing must reconcile to Budgeted Financial Position (Borrowing - non-current)
Current Year 2010/11 2011/12 Medium Term Revenue & Expenditure Framework

WC053 Beaufort West - Supporting Table SA18 Transfers and grant receipts
Description Ref 2007/8 2008/9 2009/10
R thousand Audited Outcome
Audited Outcome
Audited Outcome
Original Budget
Adjusted Budget
Full Year Forecast
Budget Year 2011/12
Budget Year +1 2012/13
Budget Year +2 2013/14
RECEIPTS: 1, 2
Operating Transfers and Grants
National Government: 12,612 25,411 43,191 36,259 36,259 36,259 42,996,000 51,399,000 53,114,400 Local Government Equitable Share 11,162 14,260 17,913 22,401 22,401 22,401 28,956,000 34,349,000 36,646,400 Finance Management 250 500 1,000 1,000 1,000 1,000 1,250,000 1,250,000 1,250,000 Municipal Systems Improvement 734 735 735 750 750 750 790,000 800,000 900,000 Department of Water Affairs 346 366 257 DME 9,550 23,286 12,000 12,000 12,000 12,000,000 15,000,000 14,318,000 Department of Land Affairs 120 Municipal Infrastructure Grant 108 108 108 NDPG
Provincial Government: 18,803 33,595 26,926 8,026 8,026 8,026 7,381,300 6,282,900 6,622,800 Local Government Project Preparation Spatial Planning 250 CDW Operational Grant 180 240 240 275 275 275 338,000 354,200 370,900 Library Services 151 238 357 197 197 197 406,300 57,200 61,800 Department of Transport 82 Multi-purpose Community Centre 140 Housing Consumer Education Grant 150 120 100 Soup Kitchens 261 400 Main Road Subsidy 48 70 70 70 516,000 20,500 22,100 Housing 17,541 32,997 25,829 7,384 7,384 7,384 6,121,000 5,851,000 6,168,000 Management Support Grant 100 100 100 Tourism Signs Youth & Gender Central Business District Expanded Public Works Programme Municipal Infrastructure Grant
District Municipality: – – – – – – - - - [insert description]
Other grant providers: 1,214 2,813 1,195 – – – - - - LGSETA 300 Credit Control 218 Housing Nelspoort 339 542 Marathon 28 Farmers - Electricity 70 605 1,331 Beaufort West Mall 1,144 Eskom - Electricity 1,350 873 Capacity Building - DBSA 322
Total Operating Transfers and Grants 5 32,629 61,819 71,312 44,285 44,285 44,285 50,377,300 57,681,900 59,737,200
Capital Transfers and Grants
National Government: 4,312 13,372 – 43,925 43,925 43,925 44,373,600 21,118,600 - Municipal Infrastructure Grant (MIG) 2,092 3,372 11,325 11,325 11,325 17,173,600 10,301,600
Regional Bulk Infrastructure 14,650,000 DME 2,220 10,000 2,000 2,000 2,000 9,400,000 10,000,000 Municipal Drought Relief Grant 28,600 28,600 28,600 NDPG 2,000 2,000 2,000 3,150,000 817,000
Provincial Government: 207 5,000 – 82 82 82 3,568,800 - - Housing 207 PTIP 5,000 3,500,000 Library Grant 82 82 82 68,800
District Municipality: – – – – – – - - - [insert description]
Other grant providers: 1,154 – – – – – - - - Multi-purpose Community Centre 647 Asla - Prepaid Meters 508
Total Capital Transfers and Grants 5 5,673 18,372 – 44,007 44,007 44,007 47,942,400 21,118,600 -
TOTAL RECEIPTS OF TRANSFERS & GRANTS 38,302 80,191 71,312 88,292 88,292 88,292 98,319,700 78,800,500 59,737,200 References1. Each transfer/grant is listed by name as gazetted together with the name of the transferring department or municipality, donor or other organisation2. Amounts actually RECEIVED; not revenue recognised (objective is to confirm grants transferred)3. Replacement of RSC levies4. Housing subsidies for housing where ownership transferred to organisations or persons outside the control of the municipality5. Total transfers and grants must reconcile to Budgeted Cash Flows6. Motor vehicle licensing refunds to be included under 'agency' services (Not Grant Receipts)
Current Year 2010/11 2011/12 Medium Term Revenue & Expenditure Framework

WC053 Beaufort West - Supporting Table SA19 Expenditure on transfers and grant programme
Description Ref 2007/8 2008/9 2009/10
R thousand Audited Outcome
Audited Outcome
Audited Outcome
Original Budget
Adjusted Budget
Full Year Forecast
Budget Year 2011/12
Budget Year +1 2012/13
Budget Year +2 2013/14
EXPENDITURE: 1
Operating expenditure of Transfers and Grants
National Government: 19,781 18,892 35,841 36,259 36,259 36,259 43,703 49,248 50,662 Local Government Equitable Share 11,162 14,260 17,913 22,401 22,401 22,401 28,956 32,081 34,194 Finance Management 357 484 699 1,000 1,000 1,000 1,250 1,250 1,250 Municipal Systems Improvement 534 408 682 750 750 750 790 800 900 Department of Water Affairs 178 50 108 108 108 DME 7,392 3,669 16,309 12,000 12,000 12,000 12,000 15,000 14,318 Department of Land Affairs 97 112 NDPG 350 117 Transformation 8 Expanded Public Works Programme 357 Municipal Infrastructure Grant 60 21 119
Provincial Government: 13,795 31,838 22,995 8,026 8,026 8,026 7,381 6,202 6,532 Local Government Project Preparartion 11 93 Spatial Planning 56 CDW Operational Grant 147 168 275 275 275 338 351 364 Library Services 159 170 221 197 197 197 406 Multi-purpose Community Centre 70 65 16 Housing Consumer Education Grant 76 106 23 Soup Kitchens 30 220 354 Main Road Subsidy 70 70 70 516 Housing 12,988 30,660 21,332 7,384 7,384 7,384 6,121 5,851 6,168 Management Support Grant 100 100 100 Amor Green Ablution Facility 1 Youth & Gender 13 26 44 Central Business District 17 85 Bypass Economic Viability 87 Environment Management Plan 27 Hydroponics 15 16 Refuse Recycling 301 389 442 Upgrade Electricity Network 175 Tourism Signs 26 Municipal Infrastructure Grant
District Municipality: 112 53 – – – – – – – [insert description]Section 78 Investigation 16 51 CDW Operational Grant 95 2
Other grant providers: 2,271 – 1,446 – – – – – – Arts & Crafts 82 Credit Control 495 Tourism Development 25 Marathon 28 Farmers - Electricity 500 1,054 Beaufort West MallCapacity Building - DBSA 322 Housing 26 Eskom - Electricity 1,169 Internship LGSETA 18
Total operating expenditure of Transfers and Grants: 35,959 50,783 60,283 44,285 44,285 44,285 51,084 55,450 57,194
Capital expenditure of Transfers and Grants
National Government: 4,093 13,119 14,134 41,925 41,925 41,925 26,828 9,278 9,050 Municipal Infrastructure Grant (MIG) 1,239 4,205 8,260 11,325 11,325 11,325 16,028 8,578 9,050 Municipal Drought Relief Grant 28,600 28,600 28,600 NDPG 2,000 2,000 2,000 2,800 700 Finance Management 108 Department of Water Affairs 200 60 Municipal Systems Improvement Grant 226 53 DME 2,427 8,913 5,653 8,000
Provincial Government: 7,475 2,671 – 82 82 82 1,697 3,000 3,000 Housing 4,255 1,999 PTIP 3,060 542 1,697 3,000 3,000 Library Grant 69 82 82 82 Housing Consumer Education Grant 9 3 Library ServicesMini MarketArts & CraftsTelemetryPrepaid Water MetersCDW Operational Grant 120 49 Amor Green Ablution Facilities 32 10
District Municipality: 41 – – – – – – – – [insert description]Section 78 Investigation 29 CDW Operational Grant 11
Other grant providers: 2,127 238 – – – – – – – Multi-purpose Community Centre 424 LGSETA 9 Arts & Crafts 9 Beaufort West Mall 1,145 Asla - Electricity 469 Rustdene Sportsgrounds 79 229
Total capital expenditure of Transfers and Grants 13,735 16,028 14,134 42,007 42,007 42,007 28,525 12,278 12,050
TOTAL EXPENDITURE OF TRANSFERS AND GRANTS 49,694 66,811 74,416 86,292 86,292 86,292 79,609 67,728 69,244 References1. Expenditure must be separately listed for each transfer or grant received or recognised
Current Year 2010/11 2011/12 Medium Term Revenue & Expenditure Framework
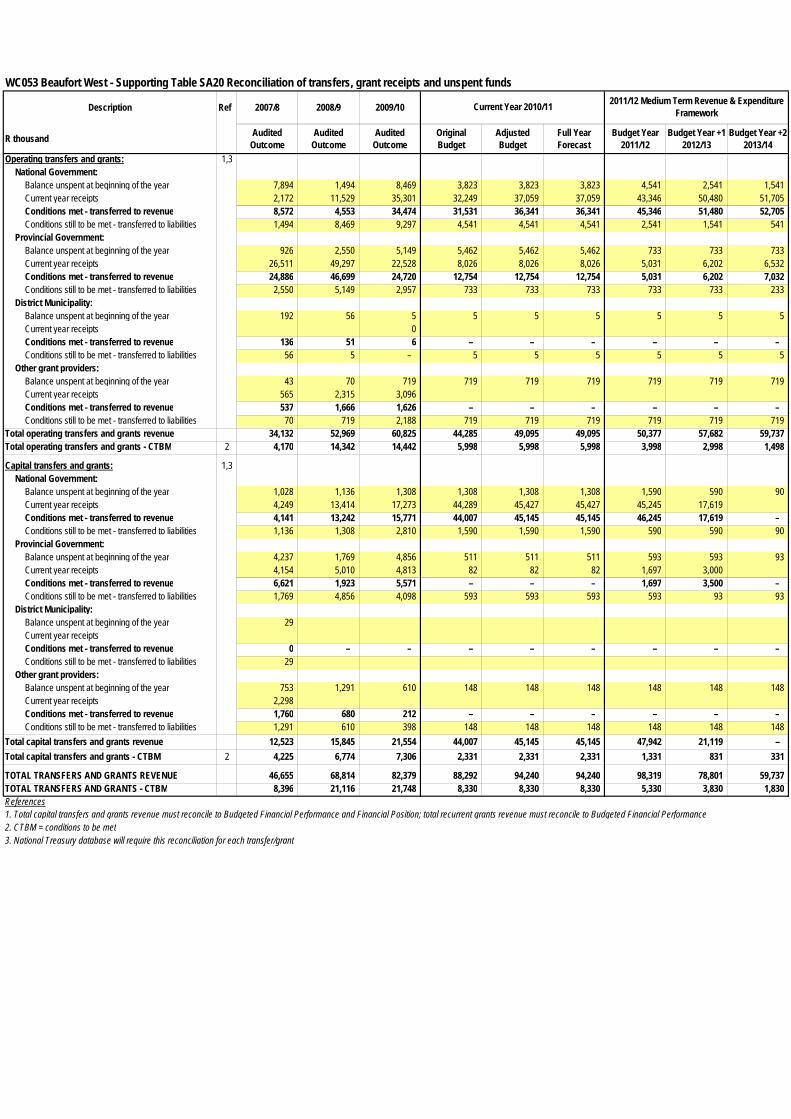
WC053 Beaufort West - Supporting Table SA20 Reconciliation of transfers, grant receipts and unspent funds
Description Ref 2007/8 2008/9 2009/10
R thousand Audited Outcome
Audited Outcome
Audited Outcome
Original Budget
Adjusted Budget
Full Year Forecast
Budget Year 2011/12
Budget Year +1 2012/13
Budget Year +2 2013/14
Operating transfers and grants: 1,3National Government:
Balance unspent at beginning of the year 7,894 1,494 8,469 3,823 3,823 3,823 4,541 2,541 1,541 Current year receipts 2,172 11,529 35,301 32,249 37,059 37,059 43,346 50,480 51,705 Conditions met - transferred to revenue 8,572 4,553 34,474 31,531 36,341 36,341 45,346 51,480 52,705 Conditions still to be met - transferred to liabilities 1,494 8,469 9,297 4,541 4,541 4,541 2,541 1,541 541
Provincial Government:Balance unspent at beginning of the year 926 2,550 5,149 5,462 5,462 5,462 733 733 733 Current year receipts 26,511 49,297 22,528 8,026 8,026 8,026 5,031 6,202 6,532 Conditions met - transferred to revenue 24,886 46,699 24,720 12,754 12,754 12,754 5,031 6,202 7,032 Conditions still to be met - transferred to liabilities 2,550 5,149 2,957 733 733 733 733 733 233
District Municipality:Balance unspent at beginning of the year 192 56 5 5 5 5 5 5 5 Current year receipts 0 Conditions met - transferred to revenue 136 51 6 – – – – – – Conditions still to be met - transferred to liabilities 56 5 – 5 5 5 5 5 5
Other grant providers:Balance unspent at beginning of the year 43 70 719 719 719 719 719 719 719 Current year receipts 565 2,315 3,096 Conditions met - transferred to revenue 537 1,666 1,626 – – – – – – Conditions still to be met - transferred to liabilities 70 719 2,188 719 719 719 719 719 719
Total operating transfers and grants revenue 34,132 52,969 60,825 44,285 49,095 49,095 50,377 57,682 59,737 Total operating transfers and grants - CTBM 2 4,170 14,342 14,442 5,998 5,998 5,998 3,998 2,998 1,498
Capital transfers and grants: 1,3National Government:
Balance unspent at beginning of the year 1,028 1,136 1,308 1,308 1,308 1,308 1,590 590 90 Current year receipts 4,249 13,414 17,273 44,289 45,427 45,427 45,245 17,619 Conditions met - transferred to revenue 4,141 13,242 15,771 44,007 45,145 45,145 46,245 17,619 – Conditions still to be met - transferred to liabilities 1,136 1,308 2,810 1,590 1,590 1,590 590 590 90
Provincial Government:Balance unspent at beginning of the year 4,237 1,769 4,856 511 511 511 593 593 93 Current year receipts 4,154 5,010 4,813 82 82 82 1,697 3,000 Conditions met - transferred to revenue 6,621 1,923 5,571 – – – 1,697 3,500 – Conditions still to be met - transferred to liabilities 1,769 4,856 4,098 593 593 593 593 93 93
District Municipality:Balance unspent at beginning of the year 29 Current year receiptsConditions met - transferred to revenue 0 – – – – – – – – Conditions still to be met - transferred to liabilities 29
Other grant providers:Balance unspent at beginning of the year 753 1,291 610 148 148 148 148 148 148 Current year receipts 2,298 Conditions met - transferred to revenue 1,760 680 212 – – – – – – Conditions still to be met - transferred to liabilities 1,291 610 398 148 148 148 148 148 148
Total capital transfers and grants revenue 12,523 15,845 21,554 44,007 45,145 45,145 47,942 21,119 – Total capital transfers and grants - CTBM 2 4,225 6,774 7,306 2,331 2,331 2,331 1,331 831 331
TOTAL TRANSFERS AND GRANTS REVENUE 46,655 68,814 82,379 88,292 94,240 94,240 98,319 78,801 59,737 TOTAL TRANSFERS AND GRANTS - CTBM 8,396 21,116 21,748 8,330 8,330 8,330 5,330 3,830 1,830 References
3. National Treasury database will require this reconciliation for each transfer/grant
Current Year 2010/11 2011/12 Medium Term Revenue & Expenditure Framework
1. Total capital transfers and grants revenue must reconcile to Budgeted Financial Performance and Financial Position; total recurrent grants revenue must reconcile to Budgeted Financial Performance2. CTBM = conditions to be met

WC053 Beaufort West - Supporting Table SA21 Transfers and grants made by the municipality
Description Ref 2007/8 2008/9 2009/10
R thousand Audited Outcome
Audited Outcome
Audited Outcome
Original Budget
Adjusted Budget
Full Year Forecast
Budget Year 2011/12
Budget Year +1 2012/13
Budget Year +2 2013/14
Transfers to other municipalitiesInsert description 1
TOTAL TRANSFERS TO MUNICIPALITIES: – – – – – – – – –
Transfers to Entities/Other External MechanismsInsert description 2
TOTAL TRANSFERS TO ENTITIES/EMs' – – – – – – – – –
Transfers to other Organs of StateInsert description 3
TOTAL TRANSFERS TO OTHER ORGANS OF STATE: – – – – – – – – –
Grants to Organisations/ Groups of IndividualsInsert description 4
TOTAL GRANTS TO ORGANISATIONS/GROUPS OF INDIVIDUALS: – – – – – – – – –
TOTAL TRANSFERS AND GRANTS 5 – – – – – – – – – References1. Insert description listed by municipal name and demarcation code of recipient2. Insert description of each entity or external mechanism (an external mechanism may be provided with resources to ensure a minimum level of service)3. Insert description of each Organ of State (e.g. transfer to electricity provider to compensate for FBS provided)4. Insert description of each other organisation (e.g. charity)5. All descriptions should separate transfers for 'capital purposes' and 'operating purposes'
Current Year 2010/11 2011/12 Medium Term Revenue & Expenditure Framework

WC053 Beaufort West - Supporting Table SA22 Summary councillor and staff benefits
Summary of Employee and Councillor remuneration Ref 2007/8 2008/9 2009/10
R thousand Audited Outcome
Audited Outcome
Audited Outcome
Original Budget
Adjusted Budget
Full Year Forecast
Budget Year 2011/12
Budget Year +1 2012/13
Budget Year +2 2013/14
1 A B C D E F G H ICouncillors (Political Office Bearers plus Other)
Salary 1,665 2,175 2,295 2,522 2,522 2,541 2,770 2,991 3,230 Pension Contributions 126 153 122 132 132 99 108 116 126 Medical Aid Contributions 24 13 18 18 18 18 Motor vehicle allowance 502 577 664 723 723 662 721 779 841 Cell phone allowance 113 144 182 180 180 173 188 203 219 Housing allowanceOther benefits or allowancesIn-kind benefits
Sub Total - Councillors 2,429 3,061 3,282 3,575 3,575 3,492 3,786 4,089 4,417 % increase 4 26.0% 7.2% 8.9% – (2.3%) 8.4% 8.0% 8.0%
Senior Managers of the Municipality 2Salary 1,677 2,069 2,769 2,769 2,769 3,129 3,380 3,650 Pension Contributions 241 368 510 510 510 563 608 657 Medical Aid Contributions 27 39 49 49 49 51 55 59 Motor vehicle allowance 431 484 504 504 504 504 504 504 Cell phone allowance 35 41 36 36 36 36 36 36 Housing allowancePerformance Bonus 207 241 365 365 365 388 441 485 Other benefits or allowances 49 49 49 63 57 61 In-kind benefits
Sub Total - Senior Managers of Municipality 2,620 3,241 – 4,281 4,281 4,281 4,735 5,081 5,453 % increase 4 23.7% (100.0%) – – – 10.6% 7.3% 7.3%
Other Municipal StaffBasic Salaries and Wages 18,521 20,652 32,913 36,278 Pension Contributions 5,063 4,246 5,447 6,341 Medical Aid Contributions 1,203 686 1,622 954 Motor vehicle allowance 506 532 480 569 Cell phone allowanceHousing allowance 285 328 239 230 Overtime 1,909 2,161 1,308 1,499 16,025 1,692 Performance BonusOther benefits or allowances 2,417 2,800 3,447 4,113 In-kind benefits
Sub Total - Other Municipal Staff 29,905 31,405 – 45,455 – – 49,983 16,025 1,692 % increase 4 5.0% (100.0%) – (100.0%) – – (67.9%) (89.4%)
Total Parent Municipality 34,954 37,708 3,282 53,311 7,856 7,772 58,505 25,196 11,562 7.9% (91.3%) 1,524.4% (85.3%) (1.1%) 652.7% (56.9%) (54.1%)
Board Members of EntitiesSalaryPension ContributionsMedical Aid ContributionsMotor vehicle allowanceCell phone allowancesHousing allowanceBoard FeesOther benefits and allowancesIn-kind benefits
Sub Total - Board Members of Entities – – – – – – – – – % increase 4 – – – – – – – –
Senior Managers of EntitiesSalaryPension ContributionsMedical Aid ContributionsMotor vehicle allowanceCell phone allowancesHousing allowancePerformance BonusOther benefits or allowancesIn-kind benefits
Sub Total - Senior Managers of Entities – – – – – – – – – % increase 4 – – – – – – – –
Other Staff of EntitiesBasic Salaries and WagesPension ContributionsMedical Aid ContributionsMotor vehicle allowanceCell phone allowancesHousing allowanceOvertimePerformance BonusOther benefits or allowancesIn-kind benefits
Sub Total - Other Staff of Entities – – – – – – – – – % increase 4 – – – – – – – –
Total Municipal Entities – – – – – – – – –
TOTAL SALARY, ALLOWANCES & BENEFITS34,954 37,708 3,282 53,311 7,856 7,772 58,505 25,196 11,562
% increase 4 7.9% (91.3%) 1,524.4% (85.3%) (1.1%) 652.7% (56.9%) (54.1%) TOTAL MANAGERS AND STAFF 5 32,525 34,646 – 49,736 4,281 4,281 54,718 21,106 7,145 References1. Include 'Loans and advances' where applicable if any reportable amounts until phased compliance with s164 of MFMA achieved2. s57 of the Systems Act3. If benefits in kind are provided (e.g. provision of living quarters) the full market value must be shown as the cost to the municipality4. B/A, C/B, D/C, E/C, F/C, G/D, H/D, I/D5. Must agree to the sub-total appearing on Table A1 (Employee costs)Column Definitions:A, B and C. Audited actual as per the audited financial statements. If audited amounts are unavailable, unaudited amounts must be provided with a note stating these are unauditedD. The original budget approved by council for the budget year.E. The budget for the budget year as adjusted by council resolution in terms of section 28 of the MFMA.F. An estimate of final actual amounts (pre audit) for the current year at the point in time of preparing the budget for the budget year. This may differ from E.G. The amount to be appropriated for the budget year.H and I. The indicative projection
Current Year 2010/11 2011/12 Medium Term Revenue & Expenditure Framework

WC053 Beaufort West - Supporting Table SA23 Salaries, allowances & benefits (political office bearers/councillors/senior managers)
Disclosure of Salaries, Allowances & Benefits 1. RefSalary Contrib. Allowances Performance
BonusesIn-kind
benefitsTotal Package
Rand per annum 1. 2. 3.Councillors 4
Speaker 5 1 310,316 46,547 138,523 495,386 Chief Whip – Executive Mayor 1 446,081 168,262 614,343 Deputy Executive Mayor 1 356,863 138,522 495,385 Executive Committee 1 290,922 43,638 131,087 465,647 Total for all other councillors 9 1,365,386 17,455 332,871 1,715,712
Total Councillors 9 13 2,769,568 107,640 909,265 3,786,473
Senior Managers of the Municipality 6Municipal Manager (MM) 1 640,107 132,594 179,343 87,601 1,039,646 Chief Finance Officer 1 533,656 115,222 114,000 61,408 824,287 Director: Corporate Services 1 406,858 92,095 78,000 52,489 629,443 Director: Engineering Services 1 530,129 95,425 78,000 64,588 768,143 Director: Community Services 1 525,082 99,819 66,000 61,781 752,683 Director: Electrical Services 1 493,636 88,854 78,000 60,500 720,991
List of each offical with packages >= senior manager– – – – – – – – – – – – –
Total Senior Managers of the Municipality 9 – 6 3,129,468 624,009 593,343 388,367 4,735,193
A Heading for Each Entity 7, 8List each member of board by designation
– – – – – – – – – – – – – – – –
Total for municipal entities 9 – – – – – – –
TOTAL COST OF COUNCILLOR, DIRECTOR and EXECUTIVE REMUNERATION 13 2,769,574 3,237,108 1,533,274 593,343 388,367 8,521,666
References1. Pension and medical aid2. If benefits in kind are provided (e.g. provision of living quarters) the full market value must be shown as the cost to the municipality3. Total package must equal the total cost to the municipality4. List each political office bearer by designation. Provide a total for all other councillors5. Political office bearer is defined in MFMA s 1: speaker, executive mayor, deputy executive mayor, member of executive committee, mayor, deputy mayor, member of mayoral committee, the councillor designated to exercise powers and duties of mayor (MSA s 57)6. Also list each senior manager reporting to MM by designation and each official with package >= senior manager by designation7. List each entity where municipality has an interest and state percentage ownership and control8. List each senior manager reporting to the CEO of an Entity by designation9. Must reconcile to relevant section of Table A2410. Must reconcile to totals shown for the budget year of Table A22
No. 10

WC053 Beaufort West - Supporting Table SA24 Summary of personnel numbers
Summary of Personnel Numbers Ref
Number 1,2 Positions Permanent employees
Contract employees Positions Permanent
employeesContract
employees Positions Permanent employees
Contract employees
Municipal Council and Boards of Municipal EntitiesCouncillors (Political Office Bearers plus Other Councillors)Board Members of municipal entities 4 13 13 13 13 13 13
Municipal employees 5Municipal Manager and Senior Managers 3 6 6 6 6 6 6 Other Managers 7 13 13 11 11 11 11 Professionals 3 3 – 5 5 – 5 5 –
FinanceSpatial/town planningInformation TechnologyRoadsElectricityWaterSanitationRefuseOther 3 3 5 5 5 5
Technicians 8 8 – 5 5 – 5 5 – FinanceSpatial/town planningInformation TechnologyRoadsElectricity 4 4 4 4 4 4 Water 1 1 1 1 1 1 SanitationRefuseOther 3 3
Clerks (Clerical and administrative) 63 62 1 72 71 1 72 71 1 Service and sales workers 9 9 22 22 22 22 Skilled agricultural and fishery workersCraft and related trades 57 57 64 64 64 64 Plant and Machine Operators 28 28 27 27 27 27 Elementary Occupations 133 133 146 146 146 146
TOTAL PERSONNEL NUMBERS 333 332 1 371 370 1 371 370 1 % increase 11.4% 11.4% – – – –
Total municipal employees headcount 6 320 319 1 358 357 1 358 357 1 Finance personnel headcount 8 33 32 1 40 39 1 40 39 1 Human Resources personnel headcount 8 3 3 3 3 3 3
References1. Positions must be funded and aligned to the municipality's current organisational structure2. Full Time Equivalent (FTE). E.g. One full time person = 1FTE. A person working half time (say 4 hours out of 8) = 0.5FTE.3. s57 of the Systems Act4. Include only in Consolidated Statements5. Include municipal entity employees in Consolidated Statements6. Include headcount (number fo persons, Not FTE) of managers and staff only (exclude councillors)7. Managers who provide the direction of a critical technical function8. Total number of employees working on these functions
Current Year 2010/11 Budget Year 2011/122009/10

WC053 Beaufort West - Supporting Table SA25 Budgeted monthly revenue and expenditure
Description Ref
R thousand July August Sept. October November December January February March April May June Budget Year 2011/12
Budget Year +1 2012/13
Budget Year +2 2013/14
Revenue By SourceProperty rates 9,117 1,050 2,100 875 875 875 875 875 875 875 875 872 20,139 21,750 23,490 Property rates - penalties & collection charges 61 61 61 61 61 61 61 61 61 61 61 61 730 740 750 Service charges - electricity revenue 5,474 5,474 4,760 4,760 4,400 4,400 4,200 4,200 4,200 4,200 4,700 4,758 55,526 62,431 72,757 Service charges - water revenue 822 822 822 822 903 950 950 903 827 827 827 777 10,249 10,140 10,063 Service charges - sanitation revenue 680 680 1,200 671 671 671 671 671 671 671 671 670 8,594 9,282 10,024 Service charges - refuse revenue 422 422 620 432 432 432 432 432 432 432 432 433 5,355 5,783 6,246 Service charges - other – – – – Rental of facilities and equipment 45 45 45 45 45 45 45 45 45 45 45 45 536 579 624 Interest earned - external investments 15 180 100 125 420 424 429 Interest earned - outstanding debtors 113 113 113 113 113 113 113 113 113 113 113 113 1,350 1,458 1,575 Dividends received – – – – Fines 690 690 690 690 690 690 710 690 690 690 690 693 8,303 8,967 9,684 Licences and permits 55 55 55 55 55 55 55 55 55 55 55 55 657 709 766 Agency services 59 59 59 59 59 59 59 59 59 59 59 59 705 761 822 Transfers recognised - operational 13,192 1,602 1,500 1,500 11,592 1,500 1,500 1,602 11,668 1,500 1,602 1,621 50,377 57,682 59,737 Other revenue 58 58 58 58 58 58 58 58 58 58 58 58 699 748 801 Gains on disposal of PPE 150 – 150 2 2
Total Revenue (excluding capital transfers and contributions) 30,786 11,129 12,081 10,154 20,132 10,058 9,728 9,762 19,852 9,584 10,186 10,339 163,789 181,456 197,769
Expenditure By TypeEmployee related costs 4,355 4,355 4,355 4,355 7,811 4,355 4,355 4,355 4,355 4,355 4,355 4,355 55,714 59,778 64,451 Remuneration of councillors 317 317 317 317 317 317 317 317 317 317 317 317 3,798 4,107 4,424 Debt impairment 523 523 523 523 523 523 523 523 523 523 523 523 6,277 5,930 5,922 Depreciation & asset impairment 959 959 959 959 959 959 959 959 959 959 959 959 11,507 12,123 12,902 Finance charges 8 8 304 8 7 691 7 7 263 6 6 652 1,968 2,323 1,869 Bulk purchases 4,672 4,672 2,722 2,722 2,722 2,722 2,722 2,722 2,722 2,722 2,722 4,694 38,531 47,521 55,632 Other materials 1,230 1,230 1,230 1,230 1,230 1,230 1,230 1,230 1,230 1,230 1,230 1,230 14,763 15,921 17,120 Contracted services 265 265 265 265 265 265 265 265 265 265 265 266 3,181 3,433 3,706 Transfers and grants 74 74 74 74 74 74 74 74 74 74 74 74 890 961 1,038 Other expenditure 3,048 3,048 3,048 3,048 3,048 3,048 3,048 3,048 3,048 3,048 3,048 3,048 36,580 38,799 40,236 Loss on disposal of PPE – – – –
Total Expenditure 15,451 15,451 13,796 13,500 16,957 14,184 13,500 13,499 13,755 13,499 13,499 16,117 173,208 190,896 207,299
Surplus/(Deficit) 15,335 (4,322) (1,715) (3,346) 3,175 (4,126) (3,772) (3,738) 6,097 (3,915) (3,313) (5,778) (9,419) (9,440) (9,530) Transfers recognised - capital 3,995 3,995 3,995 3,995 3,995 3,995 3,995 3,995 3,995 3,995 3,995 3,995 47,942 21,119 – Contributions recognised - capital – – – – Contributed assets – – – –
Surplus/(Deficit) after capital transfers & contributions 19,330 (327) 2,280 649 7,170 (131) 223 257 10,092 80 682 (1,783) 38,524 11,679 (9,530)
Taxation – – – – Attributable to minorities – – – – Share of surplus/ (deficit) of associate – – – –
Surplus/(Deficit) 1 19,330 (327) 2,280 649 7,170 (131) 223 257 10,092 80 682 (1,783) 38,524 11,679 (9,530) References1. Surplus (Deficit) must reconcile with Budgeted Financial Performance
Budget Year 2011/12 Medium Term Revenue and Expenditure Framework

WC053 Beaufort West - Supporting Table SA26 Budgeted monthly revenue and expenditure (municipal vote)
Description Ref
R thousand July August Sept. October November December January February March April May June Budget Year 2011/12
Budget Year +1 2012/13
Budget Year +2 2013/14
Revenue by VoteVote1 - Municipal Manager 39 – 39 – – Vote2 - Director: Corporate Services 9,638 9,638 9,639 – 28,914 33,666 35,811 Vote3 - Director: Financial Services 11,157 1,050 2,100 875 875 875 875 875 875 875 2,027 2,298 24,757 26,551 28,611 Vote4 - Director: Engineering Services 5,072 5,198 5,616 5,102 5,802 5,365 5,235 5,269 4,195 4,195 4,195 3,774 59,018 22,082 22,078 Vote5 - Director: Community Services 1,735 1,735 1,934 1,746 1,746 1,746 1,746 1,746 1,746 1,746 1,746 1,206 20,577 21,463 23,029 Vote6 - Director: Electrical Services 7,141 7,141 6,427 6,427 6,067 6,067 5,867 5,867 7,393 6,763 6,213 7,056 78,427 98,812 88,241 Vote7 - Example 7 – – – – Vote8 - Example 8 – – – – Vote9 - Example 9 – – – – Vote10 - Example 10 – – – – Vote11 - Example 11 – – – – Vote12 - Example 12 – – – – Vote13 - Example 13 – – – – Vote14 - Example 14 – – – – Vote15 - Example 15 – – – –
Total Revenue by Vote 34,781 15,124 16,077 14,149 24,127 14,053 13,723 13,757 23,847 13,579 14,181 14,334 211,732 202,575 197,769
Expenditure by Vote to be appropriatedVote1 - Municipal Manager 201 201 201 201 420 201 201 201 201 201 201 200 2,632 2,855 3,027 Vote2 - Director: Corporate Services 1,198 1,198 1,198 1,198 1,541 1,198 1,198 1,198 1,198 1,198 1,198 1,199 14,724 15,784 16,997 Vote3 - Director: Financial Services 1,121 1,121 1,121 1,121 1,575 1,121 1,121 1,121 1,121 1,121 1,121 1,121 13,902 14,698 15,667 Vote4 - Director: Engineering Services 4,263 4,263 4,263 4,263 5,620 4,263 4,263 4,263 4,263 4,263 4,263 4,263 52,512 54,936 58,839 Vote5 - Director: Community Services 2,003 2,003 2,003 2,003 2,766 2,003 2,003 2,003 2,003 2,003 2,003 2,003 24,797 25,925 27,847 Vote6 - Director: Electrical Services 6,665 6,665 5,010 4,714 5,034 5,398 4,713 4,713 4,969 4,713 3,225 8,819 64,640 76,698 84,922 Vote7 - Example 7 – – – – Vote8 - Example 8 – – – – Vote9 - Example 9 – – – – Vote10 - Example 10 – – – – Vote11 - Example 11 – – – – Vote12 - Example 12 – – – – Vote13 - Example 13 – – – – Vote14 - Example 14 – – – – Vote15 - Example 15 – – – –
Total Expenditure by Vote 15,451 15,451 13,796 13,500 16,957 14,184 13,500 13,499 13,755 13,499 12,011 17,605 173,208 190,896 207,299
Surplus/(Deficit) before assoc. 19,330 (327) 2,280 649 7,170 (131) 223 257 10,092 80 2,169 (3,270) 38,524 11,679 (9,530)
Taxation – – – – Attributable to minorities – – – – Share of surplus/ (deficit) of associate – – – –
Surplus/(Deficit) 1 19,330 (327) 2,280 649 7,170 (131) 223 257 10,092 80 2,169 (3,270) 38,524 11,679 (9,530) References1. Surplus (Deficit) must reconcile with Budgeted Financial Performance
Budget Year 2011/12 Medium Term Revenue and Expenditure Framework

WC053 Beaufort West - Supporting Table SA27 Budgeted monthly revenue and expenditure (standard classification)
Description Ref
R thousand July August Sept. October November December January February March April May June Budget Year 2011/12
Budget Year +1 2012/13
Budget Year +2 2013/14
Revenue - StandardGovernance and administration 21,136 1,478 2,427 1,246 11,484 1,363 1,233 1,314 11,002 1,231 1,487 1,323 56,725 61,272 64,679
Executive and council 9,505 9,505 9,505 0 28,514 33,574 35,712 Budget and treasury office 11,342 1,189 2,137 956 1,690 1,073 943 1,024 1,208 941 1,197 1,033 24,733 26,526 28,584 Corporate services 290 290 290 290 290 290 290 290 290 290 290 290 3,479 1,172 383
Community and public safety 1,337 1,337 1,337 1,337 1,356 1,356 1,356 1,356 1,337 1,337 1,337 1,337 16,121 21,029 16,833 Community and social services 52 52 52 52 52 52 52 52 52 52 52 52 628 296 318 Sport and recreation 7 7 7 7 25 25 25 25 7 7 7 7 157 169 183 Public safety 758 758 758 758 758 758 758 758 758 758 758 758 9,093 14,580 10,021 Housing 520 520 520 520 520 520 520 520 520 520 520 520 6,244 5,983 6,311 Health – – – –
Economic and environmental services 1,656 1,656 1,656 1,656 1,656 1,656 1,656 1,656 2,153 1,656 1,656 1,656 20,367 754 814 Planning and development 3 3 3 3 3 3 3 3 3 3 3 3 33 36 38 Road transport 1,653 1,653 1,653 1,653 1,653 1,653 1,653 1,653 2,150 1,653 1,653 1,653 20,334 718 776 Environmental protection – – – –
Trading services 10,652 10,652 10,657 9,910 9,631 9,678 9,478 9,431 9,355 9,355 9,855 9,864 118,518 119,520 115,443 Electricity 7,339 7,339 6,625 6,625 6,265 6,265 6,065 6,065 6,065 6,065 6,565 6,624 77,909 93,493 88,222 Water 2,128 2,128 2,128 2,128 2,209 2,257 2,257 2,209 2,133 2,133 2,133 2,084 25,928 10,172 10,097 Waste water management 763 763 1,283 754 754 754 754 754 754 754 754 754 9,592 10,359 11,188 Waste management 422 422 620 403 403 403 403 403 403 403 403 403 5,090 5,497 5,936
Other – – – – Total Revenue - Standard 34,781 15,124 16,077 14,149 24,127 14,053 13,723 13,757 23,847 13,579 14,334 14,181 211,732 202,575 197,769 22,518 22,757 20,830 39,952 20,373 19,843 19,877 39,472 19,700 20,955 Expenditure - Standard
Governance and administration 2,484 2,484 2,484 2,484 3,426 2,484 2,484 2,484 2,484 2,484 2,484 3,043 31,313 33,408 35,817 Executive and council 811 811 811 811 988 811 811 811 811 811 811 1,370 10,471 11,337 12,205 Budget and treasury office 1,111 1,111 1,111 1,111 1,565 1,111 1,111 1,111 1,111 1,111 1,111 1,111 13,784 14,570 15,530 Corporate services 562 562 562 562 874 562 562 562 562 562 562 562 7,058 7,501 8,083
Community and public safety 2,238 2,238 2,238 2,238 2,846 2,237 2,238 2,238 2,238 2,238 2,392 2,303 27,686 28,951 31,032 Community and social services 372 372 372 372 627 372 372 372 372 372 372 372 4,723 5,020 5,415 Sport and recreation 506 506 506 506 730 506 506 506 506 506 506 507 6,302 6,728 7,189 Public safety 749 749 749 749 1,022 749 749 749 749 749 749 749 9,262 9,971 10,769 Housing 610 610 610 610 467 610 611 611 611 611 764 675 7,399 7,232 7,659 Health – – – –
Economic and environmental services 1,732 1,732 1,732 1,732 2,431 1,732 1,732 1,732 1,732 1,732 1,732 1,735 21,487 21,827 23,567 Planning and development 316 316 316 316 496 316 316 316 316 316 316 320 3,981 3,592 3,874 Road transport 1,416 1,416 1,416 1,416 1,935 1,416 1,416 1,416 1,416 1,416 1,416 1,416 17,506 18,235 19,693 Environmental protection – – – –
Trading services 8,981 8,981 7,326 7,030 8,231 7,715 7,029 7,029 7,285 7,028 7,028 8,867 92,531 106,501 116,699 Electricity 6,665 6,665 5,010 4,714 5,034 5,399 4,713 4,713 4,969 4,713 4,713 6,859 64,167 76,189 84,371 Water 1,427 1,427 1,427 1,427 1,637 1,427 1,427 1,427 1,427 1,427 1,427 1,328 17,237 18,296 19,351 Waste water management 412 412 412 412 790 412 412 412 412 412 412 204 5,116 5,525 5,967 Waste management 476 476 476 476 769 476 476 476 476 476 476 476 6,010 6,491 7,009
Other 15 15 15 15 22 15 15 15 15 15 15 15 191 210 183 Total Expenditure - Standard 15,451 15,451 13,796 13,500 16,957 14,184 13,500 13,499 13,755 13,499 13,652 15,964 173,208 190,896 207,299
Surplus/(Deficit) before assoc. 19,330 (327) 2,280 649 7,170 (131) 223 257 10,092 81 682 (1,783) 38,524 11,679 (9,530)
Share of surplus/ (deficit) of associate – – – – Surplus/(Deficit) 1 19,330 (327) 2,280 649 7,170 (131) 223 257 10,092 81 682 (1,783) 38,524 11,679 (9,530) References1. Surplus (Deficit) must reconcile with Budeted Financial Performance
Budget Year 2011/12 Medium Term Revenue and Expenditure Framework

WC053 Beaufort West - Supporting Table SA28 Budgeted monthly capital expenditure (municipal vote)
Description Ref
R thousand July August Sept. October Nov. Dec. January Feb. March April May June Budget Year 2011/12
Budget Year +1 2012/13
Budget Year +2 2013/14
Multi-year expenditure to be appropriated 1Vote1 - Municipal Manager 4 34 10 39 – 86 – – Vote2 - Director: Corporate Services 59 18 – 76 5 5 Vote3 - Director: Financial Services 14 181 42 – 237 130 80 Vote4 - Director: Engineering Services 2,000 1,000 3,746 4,525 4,901 3,950 3,041 6,320 4,933 3,675 2,163 2,163 42,415 2,252 923 Vote5 - Director: Community Services 131 102 – 233 40 45 Vote6 - Director: Electrical Services 8,000 25 250 835 1,286 – 10,396 45,682 25,385 Vote7 - Example 7 – – – – Vote8 - Example 8 – – – – Vote9 - Example 9 – – – – Vote10 - Example 10 – – – – Vote11 - Example 11 – – – – Vote12 - Example 12 – – – – Vote13 - Example 13 – – – – Vote14 - Example 14 – – – – Vote15 - Example 15 – – – –
Capital multi-year expenditure sub-total 2 10,000 1,101 4,210 5,560 6,328 3,950 3,041 6,320 4,933 3,675 2,163 2,163 53,443 48,109 26,438
Single-year expenditure to be appropriatedVote1 - Municipal Manager – – – – Vote2 - Director: Corporate Services – – – – Vote3 - Director: Financial Services – – – – Vote4 - Director: Engineering Services – – – – Vote5 - Director: Community Services – – – – Vote6 - Director: Electrical Services – – – – Vote7 - Example 7 – – – – Vote8 - Example 8 – – – – Vote9 - Example 9 – – – – Vote10 - Example 10 – – – – Vote11 - Example 11 – – – – Vote12 - Example 12 – – – – Vote13 - Example 13 – – – – Vote14 - Example 14 – – – – Vote15 - Example 15 – – – –
Capital single-year expenditure sub-total 2 – – – – – – – – – – – – – – – Total Capital Expenditure 2 10,000 1,101 4,210 5,560 6,328 3,950 3,041 6,320 4,933 3,675 2,163 2,163 53,443 48,109 26,438
References1. Table should be completed as either Multi-Year expenditure appropriation or Budget Year and Forward Year estimates2. Total Capital Expenditure must reconcile to Budgeted Capital Expenditure
Budget Year 2011/12 Medium Term Revenue and Expenditure Framework
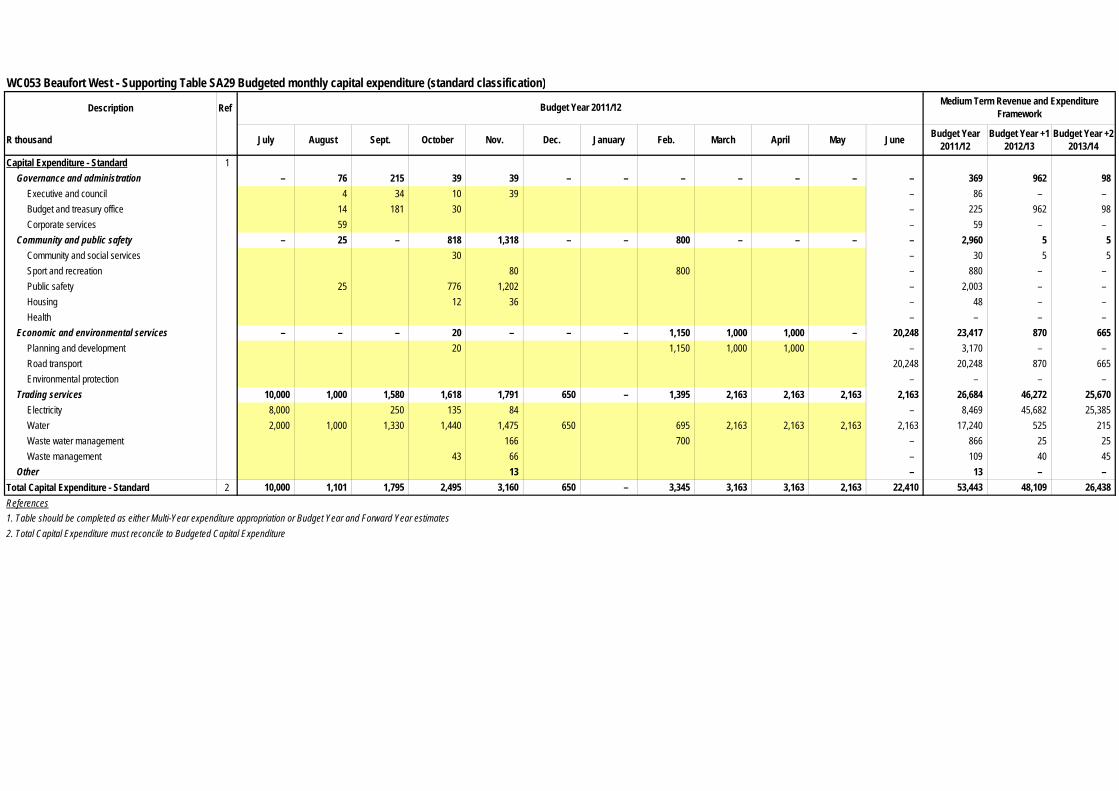
WC053 Beaufort West - Supporting Table SA29 Budgeted monthly capital expenditure (standard classification)
Description Ref
R thousand July August Sept. October Nov. Dec. January Feb. March April May June Budget Year 2011/12
Budget Year +1 2012/13
Budget Year +2 2013/14
Capital Expenditure - Standard 1Governance and administration – 76 215 39 39 – – – – – – – 369 962 98
Executive and council 4 34 10 39 – 86 – – Budget and treasury office 14 181 30 – 225 962 98 Corporate services 59 – 59 – –
Community and public safety – 25 – 818 1,318 – – 800 – – – – 2,960 5 5 Community and social services 30 – 30 5 5 Sport and recreation 80 800 – 880 – – Public safety 25 776 1,202 – 2,003 – – Housing 12 36 – 48 – – Health – – – –
Economic and environmental services – – – 20 – – – 1,150 1,000 1,000 – 20,248 23,417 870 665 Planning and development 20 1,150 1,000 1,000 – 3,170 – – Road transport 20,248 20,248 870 665 Environmental protection – – – –
Trading services 10,000 1,000 1,580 1,618 1,791 650 – 1,395 2,163 2,163 2,163 2,163 26,684 46,272 25,670 Electricity 8,000 250 135 84 – 8,469 45,682 25,385 Water 2,000 1,000 1,330 1,440 1,475 650 695 2,163 2,163 2,163 2,163 17,240 525 215 Waste water management 166 700 – 866 25 25 Waste management 43 66 – 109 40 45
Other 13 – 13 – – Total Capital Expenditure - Standard 2 10,000 1,101 1,795 2,495 3,160 650 – 3,345 3,163 3,163 2,163 22,410 53,443 48,109 26,438 References1. Table should be completed as either Multi-Year expenditure appropriation or Budget Year and Forward Year estimates2. Total Capital Expenditure must reconcile to Budgeted Capital Expenditure
Budget Year 2011/12 Medium Term Revenue and Expenditure Framework

WC053 Beaufort West - Supporting Table SA30 Budgeted monthly cash flow
MONTHLY CASH FLOWS
R thousand July August Sept. October November December January February March April May June Budget Year 2011/12
Budget Year +1 2012/13
Budget Year +2 2013/14
Cash Receipts By Source 1Property rates 9,117 1,050 2,100 875 875 875 875 875 875 875 875 872 20,139 26,750 27,490 Property rates - penalties & collection charges 61 61 61 61 61 61 61 61 61 61 61 61 730 740 750 Service charges - electricity revenue 6,236 6,236 5,522 5,522 5,162 5,162 4,962 4,962 4,962 4,962 5,312 5,520 64,524 81,741 92,520 Service charges - water revenue 822 822 822 821 903 950 950 903 827 827 827 778 10,249 13,140 14,063 Service charges - sanitation revenue 680 680 1,200 671 671 671 671 671 671 671 671 670 8,594 11,282 12,024 Service charges - refuse revenue 422 422 620 432 432 432 432 432 432 432 432 433 5,355 8,783 9,246 Service charges - other – Rental of facilities and equipment 45 45 45 45 45 45 45 45 45 45 45 45 536 579 624 Interest earned - external investments 15 180 100 125 420 424 429 Interest earned - outstanding debtors 114 114 114 114 114 114 114 114 114 114 114 114 1,370 1,532 1,921 Dividends received – Fines 690 690 690 690 690 690 710 690 690 690 690 693 8,303 11,967 12,687 Licences and permits 55 55 55 55 55 55 55 55 55 55 55 55 657 709 766 Agency services 59 59 59 59 59 59 59 59 59 59 59 59 705 761 822 Transfer receipts - operational 13,192 1,602 1,500 1,500 11,592 1,500 1,500 1,602 11,668 1,500 1,602 1,621 50,377 57,682 59,737 Other revenue 58 58 58 58 58 58 58 58 58 58 58 58 699 748 801
Cash Receipts by Source 31,550 11,893 12,846 10,917 20,896 10,672 10,492 10,526 20,616 10,348 10,800 11,104 172,658 216,839 233,880
Other Cash Flows by SourceTransfer receipts - capital 3,995 3,995 3,995 3,995 3,995 3,995 3,995 3,995 3,995 3,995 3,995 3,995 47,942 21,119 Contributions recognised - capital & Contributed assets – Proceeds on disposal of PPE 150 – 150 Short term loans – Borrowing long term/refinancing 2,870 2,870 Increase (decrease) in consumer deposits 47 47 (8) 71 Decrease (Increase) in non-current debtors 219 219 858 743 Decrease (increase) other non-current receivables 1,054 1,054 Decrease (increase) in non-current investments –
Total Cash Receipts by Source 35,545 15,888 16,841 14,913 24,891 14,817 14,487 14,521 24,611 14,343 14,795 19,289 224,940 238,807 234,694
Cash Payments by TypeEmployee related costs 4,355 4,355 4,355 4,355 7,811 4,355 4,355 4,355 4,355 4,355 4,355 4,355 55,714 59,778 64,451 Remuneration of councillors 317 317 317 317 317 317 317 317 317 317 317 317 3,798 4,107 4,424 Collection costs 33 33 33 33 33 33 33 33 33 33 33 33 400 432 467 Interest paid 8 8 304 8 7 691 7 7 263 6 6 652 1,968 2,323 1,869 Bulk purchases - Electricity 4,388 4,388 2,438 2,438 2,438 2,438 2,438 2,438 2,438 2,438 2,438 4,410 35,126 43,556 50,961 Bulk purchases - Water & Sewer 284 284 284 284 284 284 284 284 284 284 284 284 3,405 3,964 4,671 Other materials 1,230 1,230 1,230 1,230 1,230 1,230 1,230 1,230 1,230 1,230 1,230 1,230 14,763 15,921 17,120 Contracted services 265 265 265 265 265 265 265 265 265 265 265 266 3,181 3,433 3,706 Grants and subsidies paid - other municipalities – Grants and subsidies paid - other 687 687 687 687 687 687 687 687 687 687 687 687 8,245 8,905 9,617 General expenses 3,659 3,659 3,659 3,659 3,659 3,659 3,659 3,659 3,659 3,659 3,659 3,659 43,912 47,159 49,276
Cash Payments by Type 15,226 15,226 13,572 13,275 16,732 13,959 13,275 13,275 13,530 13,274 13,274 15,892 170,511 189,578 206,561
Other Cash Flows/Payments by TypeCapital assets 4,454 4,454 4,454 4,454 4,454 4,454 4,454 4,454 4,454 4,454 4,454 4,454 53,443 48,109 26,438 Repayment of borrowing 45 43 474 39 37 255 33 31 488 27 25 397 1,890 2,351 2,765 Other Cash Flows/Payments –
Total Cash Payments by Type 19,724 19,722 18,499 17,767 21,222 18,667 17,761 17,759 18,473 17,754 17,752 20,743 225,844 240,037 235,764
NET INCREASE/(DECREASE) IN CASH HELD 15,821 (3,835) (1,658) (2,855) 3,669 (3,851) (3,274) (3,238) 6,139 (3,411) (2,957) (1,454) (904) (1,230) (1,070) Cash/cash equivalents at the month/year begin: 15,821 11,986 10,328 7,473 11,142 7,291 4,017 779 6,918 3,507 550 – (904) (2,134) Cash/cash equivalents at the month/year end: 15,821 11,986 10,328 7,473 11,142 7,291 4,017 779 6,918 3,507 550 (904) (904) (2,134) (3,204)
Medium Term Revenue and Expenditure FrameworkBudget Year 2011/12

WC053 Beaufort West - NOT REQUIRED - municipality does not have entities
Description 2007/8 2008/9 2009/10
R million Audited Outcome
Audited Outcome
Audited Outcome
Original Budget
Adjusted Budget
Full Year Forecast
Budget Year 2011/12
Budget Year +1 2012/13
Budget Year +2 2013/14
Financial PerformanceProperty ratesService chargesInvestment revenueTransfers recognised - operationalOther own revenueContributions recognised - capital & contributed assets
Total Revenue (excluding capital transfers and contributions) – – – – – – – – – Employee costsRemuneration of Board MembersDepreciation & asset impairmentFinance chargesMaterials and bulk purchasesTransfers and grantsOther expenditure
Total Expenditure – – – – – – – – – Surplus/(Deficit) – – – – – – – – –
Capital expenditure & funds sourcesCapital expenditure
Transfers recognised - operationalPublic contributions & donationsBorrowingInternally generated funds
Total sources – – – – – – – – –
Financial positionTotal current assetsTotal non current assetsTotal current liabilitiesTotal non current liabilitiesEquity
Cash flowsNet cash from (used) operatingNet cash from (used) investingNet cash from (used) financing
Cash/cash equivalents at the year end
Current Year 2010/11 2011/12 Medium Term Revenue & Expenditure Framework
Ref

WC053 Beaufort West - Supporting Table SA32 List of external mechanisms
External mechanism Period of agreement 1.
Monetary value of agreement
2.
Name of organisation Number R thousand
References1. Total agreement period from commencement until end2. Annual value
Service providedExpiry date of service delivery agreement or
contract
Yrs/ Mths

WC053 Beaufort West - Supporting Table SA33 Contracts having future budgetary implications
Description Ref Preceding Years
Current Year 2010/11
Forecast 2014/15
Forecast 2015/16
Forecast 2016/17
Forecast 2017/18
Forecast 2018/19
Forecast 2019/20
Forecast 2020/21
Total Contract
Value
R thousand 1,3 Total Original Budget
Budget Year 2011/12
Budget Year +1 2012/13
Budget Year +2 2013/14 Estimate Estimate Estimate Estimate Estimate Estimate Estimate Estimate
Parent Municipality:Revenue Obligation By Contract 2
Contract 1 – Contract 2 – Contract 3 etc –
Total Operating Revenue Implication – – – – – – – – – – – – –
Expenditure Obligation By Contract 2Contract 1 – Contract 2 – Contract 3 etc –
Total Operating Expenditure Implication – – – – – – – – – – – – –
Capital Expenditure Obligation By Contract 2Contract 1 – Contract 2 – Contract 3 etc –
Total Capital Expenditure Implication – – – – – – – – – – – – –
Total Parent Expenditure Implication – – – – – – – – – – – – –
Entities:Revenue Obligation By Contract 2
Contract 1 – Contract 2 – Contract 3 etc –
Total Operating Revenue Implication – – – – – – – – – – – – –
Expenditure Obligation By Contract 2Contract 1 – Contract 2 – Contract 3 etc –
Total Operating Expenditure Implication – – – – – – – – – – – – –
Capital Expenditure Obligation By Contract 2Contract 1 – Contract 2 – Contract 3 etc –
Total Capital Expenditure Implication – – – – – – – – – – – – –
Total Entity Expenditure Implication – – – – – – – – – – – – – References1. Total implication for all preceding years to be summed and total stated in 'Preceding Years' column2. List all contracts with future financial obligations beyond the three years covered by the MTREF (MFMA s33)
2011/12 Medium Term Revenue & Expenditure Framework

WC053 Beaufort West - Supporting Table SA34a Capital expenditure on new assets by asset class
Description Ref 2007/8 2008/9 2009/10
R thousand 1 Audited Outcome
Audited Outcome
Audited Outcome
Original Budget
Adjusted Budget
Full Year Forecast
Budget Year 2011/12
Budget Year +1 2012/13
Budget Year +2 2013/14
Capital expenditure on new assets by Asset Class/Sub-class
Infrastructure 14,107 21,214 20,859 39,721 40,284 40,284 35,503 9,684 335 Infrastructure - Road transport 4,657 2,489 2,594 6,721 6,721 6,721 5,817 – –
Roads, Pavements & Bridges 3,734 2,594 Storm water 923 2,489 6,721 6,721 6,721 5,817 – –
Infrastructure - Electricity 4,095 11,832 6,857 – 563 563 10,281 8,767 265 GenerationTransmission & Reticulation 3,720 10,786 6,857 563 563 8,354 8,240 240 Street Lighting 375 1,046 1,927 527 25
Infrastructure - Water 2,078 1,218 6,674 28,600 28,600 28,600 15,450 95 65 Dams & ReservoirsWater purification 5,317 28,600 28,600 28,600 15,450 – – Reticulation 2,078 1,218 1,357 95 65
Infrastructure - Sanitation 2,888 534 4,733 2,400 2,400 2,400 726 – – Reticulation 2,869 534 4,733 500 – – Sewerage purification 19 2,400 2,400 2,400 226 – –
Infrastructure - Other 389 5,142 – 2,000 2,000 2,000 3,230 822 5 Waste ManagementTransportation 2GasOther 3 389 5,142 2,000 2,000 2,000 3,230 822 5
Community 602 239 – – – – – – – Parks & gardensSportsfields & stadia 169 239 Swimming poolsCommunity hallsLibrariesRecreational facilities 433 Fire, safety & emergencySecurity and policingBuses 7ClinicsMuseums & Art GalleriesCemeteriesSocial rental housing 8Other
Heritage assets – – – – – – – – – BuildingsOther 9
Investment properties – – – – – – – – – Housing developmentOther
Other assets 2,769 2,617 3,366 496 634 634 3,341 525 453 General vehicles 1,869 138 138 1,230 110 110 Specialised vehicles 10 959 Plant & equipment 2,168 2,100 354 280 280 280 1,857 285 263 Computers - hardware/equipment 318 63 122 54 54 54 176 130 80 Furniture and other office equipment 284 411 61 162 162 162 78 AbattoirsMarketsCivic Land and BuildingsOther BuildingsOther LandSurplus Assets - (Investment or Inventory)Other 45
Agricultural assets – – – – – – – – – List sub-class
Biological assets – – – – – – – – – List sub-class
Intangibles – – – – – – – – – Computers - software & programmingOther (list sub-class)
Total Capital Expenditure on new assets 1 17,478 24,071 24,224 40,217 40,918 40,918 38,844 10,209 788
Specialised vehicles – – 959 – – – – – – Refuse 959 FireConservancyAmbulances
References1. Total Capital Expenditure on new assets (SA34a) plus Total Capital Expenditure on renewal of existing assets (SA34b) must reconcile to total capital expenditure in Budgeted Capital Expenditure2. Airports, Car Parks, Bus Terminals and Taxi Ranks3. For example - technology backbones (e.g. fibre optic, WIFI infrastructure) for economic development purposes4. Work-in-progress/under construction to be budgeted under the respective item5. Infrastructure includes 'land and buildings required' by that infrastructure and vehicles/plant & equipment used by the service generated by that infrastructure6. Donated/contributed & leased assets to be included within the respective sub-class
Current Year 2010/11 2011/12 Medium Term Revenue & Expenditure Framework
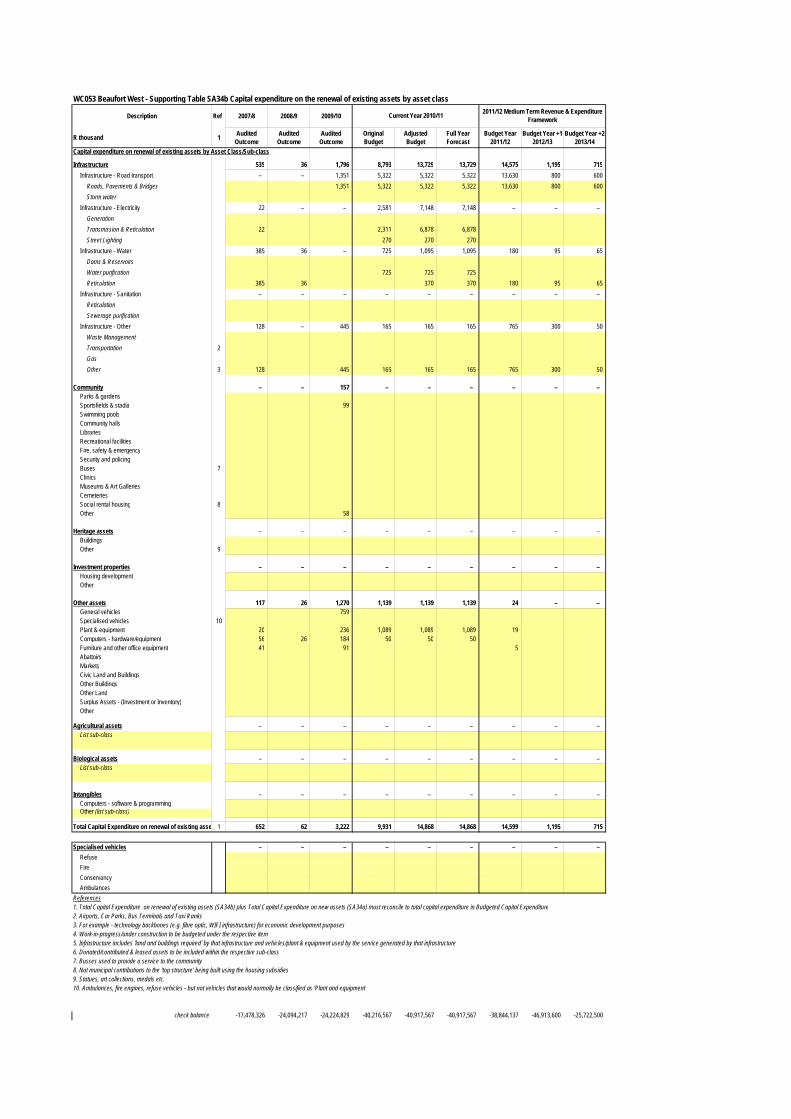
WC053 Beaufort West - Supporting Table SA34b Capital expenditure on the renewal of existing assets by asset class
Description Ref 2007/8 2008/9 2009/10
R thousand 1 Audited Outcome
Audited Outcome
Audited Outcome
Original Budget
Adjusted Budget
Full Year Forecast
Budget Year 2011/12
Budget Year +1 2012/13
Budget Year +2 2013/14
Capital expenditure on renewal of existing assets by Asset Class/Sub-class
Infrastructure 535 36 1,796 8,793 13,729 13,729 14,575 1,195 715 Infrastructure - Road transport – – 1,351 5,322 5,322 5,322 13,630 800 600
Roads, Pavements & Bridges 1,351 5,322 5,322 5,322 13,630 800 600 Storm water
Infrastructure - Electricity 22 – – 2,581 7,148 7,148 – – – GenerationTransmission & Reticulation 22 2,311 6,878 6,878 Street Lighting 270 270 270
Infrastructure - Water 385 36 – 725 1,095 1,095 180 95 65 Dams & ReservoirsWater purification 725 725 725 Reticulation 385 36 370 370 180 95 65
Infrastructure - Sanitation – – – – – – – – – ReticulationSewerage purification
Infrastructure - Other 128 – 445 165 165 165 765 300 50 Waste ManagementTransportation 2GasOther 3 128 445 165 165 165 765 300 50
Community – – 157 – – – – – – Parks & gardensSportsfields & stadia 99 Swimming poolsCommunity hallsLibrariesRecreational facilitiesFire, safety & emergencySecurity and policingBuses 7ClinicsMuseums & Art GalleriesCemeteriesSocial rental housing 8Other 58
Heritage assets – – – – – – – – – BuildingsOther 9
Investment properties – – – – – – – – – Housing developmentOther
Other assets 117 26 1,270 1,139 1,139 1,139 24 – – General vehicles 759 Specialised vehicles 10Plant & equipment 20 236 1,089 1,089 1,089 19 Computers - hardware/equipment 56 26 184 50 50 50 Furniture and other office equipment 41 91 5 AbattoirsMarketsCivic Land and BuildingsOther BuildingsOther LandSurplus Assets - (Investment or Inventory)Other
Agricultural assets – – – – – – – – – List sub-class
Biological assets – – – – – – – – – List sub-class
Intangibles – – – – – – – – – Computers - software & programmingOther (list sub-class)
Total Capital Expenditure on renewal of existing assets 1 652 62 3,222 9,931 14,868 14,868 14,599 1,195 715
Specialised vehicles – – – – – – – – – RefuseFireConservancyAmbulances
References1. Total Capital Expenditure on renewal of existing assets (SA34b) plus Total Capital Expenditure on new assets (SA34a) must reconcile to total capital expenditure in Budgeted Capital Expenditure2. Airports, Car Parks, Bus Terminals and Taxi Ranks3. For example - technology backbones (e.g. fibre optic, WIFI infrastructure) for economic development purposes4. Work-in-progress/under construction to be budgeted under the respective item5. Infrastructure includes 'land and buildings required' by that infrastructure and vehicles/plant & equipment used by the service generated by that infrastructure6. Donated/contributed & leased assets to be included within the respective sub-class7. Busses used to provide a service to the community8. Not municipal contributions to the 'top structure' being built using the housing subsidies9. Statues, art collections, medals etc.10. Ambulances, fire engines, refuse vehicles - but not vehicles that would normally be classified as 'Plant and equipment'
check balance -17,478,326 -24,094,217 -24,224,829 -40,216,567 -40,917,567 -40,917,567 -38,844,137 -46,913,600 -25,722,500
Current Year 2010/11 2011/12 Medium Term Revenue & Expenditure Framework

WC053 Beaufort West - Supporting Table SA34c Repairs and maintenance expenditure by asset class
Description Ref 2007/8 2008/9 2009/10
R thousand 1 Audited Outcome
Audited Outcome
Audited Outcome
Original Budget
Adjusted Budget
Repairs and maintenance expenditure by Asset Class/Sub-class
Infrastructure 6,475 6,201 5,833 7,765 7,765 Infrastructure - Road transport 2,740 2,739 1,735 4,947 4,947
Roads, Pavements & Bridges 2,740 2,739 1,735 4,947 4,947 Storm water
Infrastructure - Electricity 924 963 1,116 963 963 GenerationTransmission & Reticulation 833 823 957 853 853 Street Lighting 91 140 159 110 110
Infrastructure - Water 2,370 1,473 1,747 1,075 1,075 Dams & ReservoirsWater purification 1,657 524 891 549 549 Reticulation 713 949 856 526 526
Infrastructure - Sanitation 97 85 115 258 258 Reticulation 50 31 57 63 63 Sewerage purification 47 54 58 195 195
Infrastructure - Other 344 941 1,121 523 523 Waste Management 344 941 1,121 523 523 Transportation 2GasOther 3
Community 616 1,301 1,246 925 925 Parks & gardensSportsfields & stadia 375 447 706 469 469 Swimming pools 114 133 179 153 153 Community halls 9 11 17 13 13 Libraries 22 77 84 32 32 Recreational facilitiesFire, safety & emergency 36 54 152 81 81 Security and policingBuses 7ClinicsMuseums & Art GalleriesCemeteries 17 46 39 70 70 Social rental housing 8 43 534 70 107 107 Other
Heritage assets – – – – – BuildingsOther 9
Investment properties – – – – – Housing developmentOther
Other assets 2,548 4,031 3,492 3,754 3,416 General vehicles 1,216 1,523 979 2,237 1,991 Specialised vehicles 10Plant & equipment 364 1,375 1,076 995 970 Computers - hardware/equipment 715 871 545 300 300 Furniture and other office equipment 46 33 56 56 56 Abattoirs
Current Year 2010/11

MarketsCivic Land and BuildingsOther Buildings 207 229 837 166 99 Other LandSurplus Assets - (Investment or Inventory)Other
Agricultural assets – – – – – List sub-class
Biological assets – – – – – List sub-class
Intangibles – – – – – Computers - software & programmingOther (list sub-class)
Total Repairs and Maintenance Expenditure 1 9,639 11,533 10,572 12,445 12,107
Specialised vehicles – – – – – RefuseFireConservancyAmbulances
References1. Total Repairs and Maintenance Expenditure by Asset Category must reconcile to total repairs and maintenance expenditure on Table SA12. Airports, Car Parks, Bus Terminals and Taxi Ranks3. For example - technology backbones (e.g. fibre optic, WIFI infrastructure) for economic development purposes4. Work-in-progress/under construction to be budgeted under the respective item5. Infrastructure includes 'land and buildings required' by that infrastructure and vehicles/plant & equipment used by the service generated by that infrastructure6. Donated/contributed & leased assets to be included within the respective sub-class7. Busses used to provide a service to the community8. Not municipal contributions to the 'top structure' being built using the housing subsidies9. Statues, art collections, medals etc.10. Ambulances, fire engines, refuse vehicles - but not vehicles that would normally be classified as 'Plant and equipment'
check balance -0 - - - -

Full Year Forecast
Budget Year 2011/12
Budget Year +1 2012/13
Budget Year +2 2013/14
7,765 10,059 10,841 11,633 4,947 5,223 5,618 5,992 4,947 5,223 5,618 5,992
963 1,557 1,682 1,816
853 1,434 1,549 1,673 110 123 133 143
1,075 1,719 1,856 2,005
549 957 1,034 1,117 526 761 822 888 258 682 736 795 63 72 77 84
195 610 659 712 523 879 949 1,025 523 879 949 1,025
925 1,083 1,169 1,263
469 547 591 638 153 256 277 299 13 18 19 21 32 41 44 47
81 116 125 135
70 76 82 89 107 30 32 35
– – – –
– – – –
3,416 3,621 3,911 4,224 1,991 2,346 2,533 2,736
970 897 969 1,047 300 215 233 251 56 74 79 86
Current Year 2010/11 2011/12 Medium Term Revenue & Expenditure Framework

99 90 97 105
– – – –
– – – –
– – – –
12,107 14,763 15,921 17,120
– – – –
5. Infrastructure includes 'land and buildings required' by that infrastructure and vehicles/plant & equipment used by the service generated by that infrastructure
- 14,762,960 1,158,440 1,198,400

WC053 Beaufort West - Supporting Table SA35 Future financial implications of the capital budget
Vote Description Ref
R thousand Budget Year 2011/12
Budget Year +1 2012/13
Budget Year +2 2013/14
Forecast 2014/15
Forecast 2015/16
Forecast 2016/17
Present value
Capital expenditure 1Vote1 - Municipal Manager 86 – – Vote2 - Director: Corporate Services 76 5 5 Vote3 - Director: Financial Services 237 130 80 Vote4 - Director: Engineering Services 42,415 2,252 923 Vote5 - Director: Community Services 233 40 45 Vote6 - Director: Electrical Services 10,396 45,682 25,385 Vote7 - Example 7 – – – Vote8 - Example 8 – – – Vote9 - Example 9 – – – Vote10 - Example 10 – – – Vote11 - Example 11 – – – Vote12 - Example 12 – – – Vote13 - Example 13 – – – Vote14 - Example 14 – – – Vote15 - Example 15 – – – List entity summary if applicable
Total Capital Expenditure 53,443 48,109 26,438 – – – –
Future operational costs by vote 2Vote1 - Municipal Manager 47 Vote2 - Director: Corporate Services 76 5 5 Vote3 - Director: Financial Services 207 130 80 Vote4 - Director: Engineering Services 1,442 1,185 923 Vote5 - Director: Community Services 233 40 45 Vote6 - Director: Electrical Services 745 380 385 Vote7 - Example 7Vote8 - Example 8Vote9 - Example 9Vote10 - Example 10Vote11 - Example 11Vote12 - Example 12Vote13 - Example 13Vote14 - Example 14Vote15 - Example 15List entity summary if applicable
Total future operational costs 2,750 1,740 1,438 – – – –
Future revenue by source 3Property ratesProperty rates - penalties & collection chargesService charges - electricity revenueService charges - water revenueService charges - sanitation revenueService charges - refuse revenueService charges - otherRental of facilities and equipmentList other revenues sources if applicableList entity summary if applicable
Total future revenue – – – – – – – Net Financial Implications 56,193 49,849 27,875 – – – – References1. Summarise the total capital cost until capital project is operational (MFMA s19(2)(a))2. Summary of future operational costs from when projects operational (present value until the end of each asset's useful life) (MFMA s19(2)(b))3. Summarise the future revenue from when projects are operational, including municipal tax and tariff implications, (present value until the end of asset's useful life)
Forecasts2011/12 Medium Term Revenue & Expenditure Framework

WC053 Beaufort West - Supporting Table SA36 Detailed capital budget
Municipal Vote/Capital project Ref
R thousand
5
Audited Outcome 2009/10
Current Year 2010/11
Full Year Forecast
Budget Year 2011/12
Budget Year +1 2012/13
Budget Year +2 2013/14 Ward location New or renewal
Parent municipality:List all capital projects grouped by Municipal Vote Examples Examples
Vote1 - Municipal Manager Flip Chart B Other Assets Plant & Equipment 1 900 NVote1 - Municipal Manager Data projector + screen B Other Assets Plant & Equipment 13 13,000 NVote1 - Municipal Manager P A System Portable B Other Assets Plant & Equipment 20 20,000 NVote1 - Municipal Manager Hinged Door Cupboard (Labour Relation Officer) B Other Assets Furniture and other office equipment 3 3,000 NVote1 - Municipal Manager 6 Drawer A4 Buddi (Labour Relation Officer) B Other Assets Furniture and other office equipment 1 600 NVote1 - Municipal Manager Filling Cabinet (SAMWU) B Other Assets Furniture and other office equipment 5 4,500 NVote1 - Municipal Manager Fax Machine (SAMWU) B Other Assets Plant & Equipment 5 5,000 NVote1 - Municipal Manager Camera (CDW B/West) B Other Assets Plant & Equipment 4 3,900 NVote1 - Municipal Manager Projector Acer S1200( CDW B /West) B Other Assets Plant & Equipment 4 4,000 NVote1 - Municipal Manager 4 Drawer Locking Pedestal x 1 (CDW B/West) B Other Assets Furniture and other office equipment 5 4,500 NVote1 - Municipal Manager Video Camera x1 (CDW B/West) B Other Assets Plant & Equipment 9 8,500 NVote1 - Municipal Manager Mobile Air Conditioner x1 B Other Assets Plant & Equipment 4 3,500 NVote1 - Municipal Manager Camera (CDW Nelspoort) B Other Assets Plant & Equipment 4 3,900 NVote1 - Municipal Manager Camera (CDW Merweville) B Other Assets Plant & Equipment 4 3,900 NVote1 - Municipal Manager Mobile Air Conditioner x1 (CDW Merweville) B Other Assets Plant & Equipment 4 3,500 NVote1 - Municipal Manager Cabinet x 1 (CDW Merweville) B Other Assets Furniture and other office equipment 3 2,500 NVote1 - Municipal Manager Chair x 1 (CDW Merweville) B Other Assets Furniture and other office equipment 1 800 NVote2 - Corporate Services Steel Filling Cabinets x 4 B Other Assets Furniture and other office equipment 9 8,500 NVote2 - Director: Corporate Services Back-up Generator B Other Assets Plant & Equipment 50 50,000 NVote2 - Director: Corporate Services Industrial Vacuum Cleaner B Other Assets Plant & Equipment 2 1,500 NVote2 - Director: Corporate Services Alarm B Infrastructure - Other Other 16 6,000 5 5 NVote2 - Director: Corporate Services Blinds B Infrastructure - Other Other 2 1,800 NVote2 - Director: Corporate Services Fridge B Other Assets Plant & Equipment 2 2,000 NVote2 - Director: Corporate Services Book Trolly B Other Assets Plant & Equipment 3 3,000 NVote2 - Director: Corporate Services Browser Box B Other Assets Plant & Equipment 2 2,000 NVote2 - Director: Corporate Services Vacuum Cleaner B Other Assets Plant & Equipment 2 1,500 NVote3 - Director: Financial Services Air Conditioner 4000 BTU (Controller: Income) D Other Assets Plant & Equipment 5 5,000 NVote3 - Director: Financial Services Office Desk & Chair (Controller Income) D Other Assets Furniture and other office equipment 5 5,000 NVote3 - Director: Financial Services Bucket & Trolley (Nelspoort Office) D Other Assets Plant & Equipment 2 1,500 NVote3 - Director: Financial Services Office Desk ( Asset Clerk) D Other Assets Furniture and other office equipment 3 2,800 NVote3 - Director: Financial Services Office Chair (Asset Clerk) D Other Assets Furniture and other office equipment 2 1,900 NVote3 - Director: Financial Services Office Chair (Accountant Expenditure) D Other Assets Furniture and other office equipment 2 1,900 RVote3 - Director: Financial Services URN D Other Assets Plant & Equipment 1 900 RVote3 - Director: Financial Services Air Conditioner 18000 BTU D Other Assets Plant & Equipment 7 6,500 RVote3 - Director: Financial Services Air Conditioner 18000 BTU D Other Assets Plant & Equipment 7 6,500 RVote3 - Director: Financial Services Air Conditioner 12000 BTU (Telephonist) D Other Assets Plant & Equipment 5 5,000 RVote3 - Director: Financial Services Office Desk D Other Assets Furniture and other office equipment 3 2,800 RVote3 - Director: Financial Services Buddi D Other Assets Furniture and other office equipment 1 800 NVote3 - Director: Financial Services Office Desk (SCM Clerk) D Other Assets Furniture and other office equipment 2 1,800 NVote3 - Director: Financial Services Chair (SCM Clerk) D Other Assets Furniture and other office equipment 1 850 NVote3 - Director: Financial Services Notice Board D Other Assets Furniture and other office equipment 4 4,000 NVote3 - Director: Financial Services Steel Filling Cabinet D Other Assets Furniture and other office equipment 2 1,650 NVote3 - Director: Financial Services HP Printer x 1(CDW B/West) D Other Assets Computers - Hardware/Equipment 4 4,000 NVote3 - Director: Financial Services HP Deskjet Colour Printer(CDW B/West) D Other Assets Computers - Hardware/Equipment 7 7,000 NVote3 - Director: Financial Services Desktop Mercer Full HD 1080P(CDW B/West) D Other Assets Computers - Hardware/Equipment 7 7,400 NVote3 - Director: Financial Services HP Printer x 1(CDW Nelspoort) D Other Assets Computers - Hardware/Equipment 4 4,000 NVote3 - Director: Financial Services Desktop Mercer Full HD 1080P D Other Assets Computers - Hardware/Equipment 7 7,400 NVote3 - Director: Financial Services PC Workstation Complete x 2 D Other Assets Computers - Hardware/Equipment 30 30,000 NVote3 - Director: Financial Services PC Workstation Complete x 2 D Other Assets Computers - Hardware/Equipment 20 20,000 NVote3 - Director: Financial Services Back-up Tape Streamer D Other Assets Computers - Hardware/Equipment 80 80,000 NVote3 - Director: Financial Services Fire Suppression D Other Assets Computers - Hardware/Equipment 160 80 80 NVote3 - Director: Financial Services Samsung ML 2525 A4 Laser Printers D Other Assets Computers - Hardware/Equipment 6 6,000 NVote3 - Director: Financial Services Laptop x 1 D Other Assets Computers - Hardware/Equipment 7 7,000 NVote3 - Director: Financial Services Wireless Redundancy Setup D Other Assets Computers - Hardware/Equipment 50 50 NVote3 - Director: Financial Services 20" LCD Monitor (Spare Unit) D Other Assets Computers - Hardware/Equipment 3 3,000 NVote3 - Director: Financial Services Fan Lights x 4 D Other Assets Plant & Equipment 12 12,000 NVote4 - Director: Engineering Services Office Equipment A Other Assets Plant & Equipment 5 4,700 NVote4 - Director: Engineering Services Office Equipment A Other Assets Plant & Equipment 48 15,000 15 18 NVote4 - Director: Engineering Services Neighbourhood Development B Infrastructure - Other Other 3,967 3,150,000 817 NVote4 - Director: Engineering Services Office Equipment A Other Assets Plant & Equipment 13 12,500 NVote4 - Director: Engineering Services Upgrading Fencing and Alarm System A Infrastructure - Other Other 200 200,000 RVote4 - Director: Engineering Services Tractor (Loader Tipe) A Other Assets General Vehicles 400 400,000 NVote4 - Director: Engineering Services Sod Cutter A Other Assets Plant & Equipment 60 60,000 NVote4 - Director: Engineering Services Grass Cutter A Other Assets Plant & Equipment 140 140,000 NVote4 - Director: Engineering Services Equipment A Other Assets Plant & Equipment 80 80,000 NVote4 - Director: Engineering Services Equipment A Other Assets Plant & Equipment 90 40,000 25 25 NVote4 - Director: Engineering Services Installation of New Agrimedical Pump A Infrastructure - Sanitation Reticulation 500 500,000 NVote4 - Director: Engineering Services Ugrading of Chloor Room A Infrastructure - Other Other 100 100,000 RVote4 - Director: Engineering Services Expolration of Nelspoort Sewerage Works A Infrastructure - Sanitation Sewerage Purification 100 100,000 NVote4 - Director: Engineering Services Sewerage Pump Station Telemetry Station A Infrastructure - Sanitation Sewerage Purification 106 106,230 NVote4 - Director: Engineering Services Telemetry System Recommisioning (Nelspoort) A Infrastructure - Sanitation Sewerage Purification 19 19,380 NVote4 - Director: Engineering Services PTIP - Bridge and Sidewalk A Infratrsucture - Road Transport Roads, Pavements & Bridges 3,500 3,500,000 NVote4 - Director: Engineering Services Rehabilitation of Gravel Road A Infratrsucture - Road Transport Roads, Pavements & Bridges 4,164 4,163,500 RVote4 - Director: Engineering Services Roads (Ward 4,5 and 7) A Infratrsucture - Road Transport Roads, Pavements & Bridges 218 218,173 RVote4 - Director: Engineering Services Equipment A Other Assets Plant & Equipment 125 40,000 40 45 NVote4 - Director: Engineering Services Roads Industrial Area (Ward 3) A Infratrsucture - Road Transport Roads, Pavements & Bridges 1,676 275,590 800 600 RVote4 - Director: Engineering Services Upgrading of Store (Merweville) A Infrastructure - Other Other 135 85,000 30 20 RVote4 - Director: Engineering Services Tractor A Other Assets General Vehicles 180 180,000 NVote4 - Director: Engineering Services Tiptrok A Other Assets General Vehicles 200 200,000 NVote4 - Director: Engineering Services Tractor with Sweeper A Other Assets General Vehicles 295 295,000 NVote4 - Director: Engineering Services Rehabilitate Roads & Stormwater ( Murraysburg) A Infratrsucture - Road Transport Roads, Pavements & Bridges 6,507 6,507,239 RVote4 - Director: Engineering Services Storm Water Retention Dams (Hillside) A Infratrsucture - Road Transport Roads, Pavements & Bridges 2,317 2,317,327 NVote4 - Director: Engineering Services Fencing A Infrastructure - Other Other 500 250,000 250 RVote4 - Director: Engineering Services Safety Equipment (Chloor) A Other Assets Plant & Equipment 50 50,000 NVote4 - Director: Engineering Services Equipment A Other Assets Plant & Equipment 100 50,000 50 NVote4 - Director: Engineering Services Office Equipment A Other Assets Plant & Equipment 10 10,000 NVote4 - Director: Engineering Services Upgrading of Chloor Building A Infrastructure - Other Other 50 50,000 RVote4 - Director: Engineering Services Repairs of Telemetrie System A Infrastructure - Water Transmission & Reticulation 400 400,000 NVote4 - Director: Engineering Services Exploration of Aquifers A Infrastructure - Water Transmission & Reticulation 14,650 14,650,000 NVote4 - Director: Engineering Services Instalation of PRV's A Infrastructure - Water Transmission & Reticulation 400 400,000 NVote4 - Director: Engineering Services Prepaid Watermeters (Ward 4, 6 and 7) A Other Assets Plant & Equipment 1,000 1,000,000 NVote4 - Director: Engineering Services Replacement of Old Water Network A Infrastructure - Water Reticulation 240 80,000 95 65 RVote4 - Director: Engineering Services Safety Equipment A Other Assets Plant & Equipment 195 60,000 60 75 NVote4 - Director: Engineering Services Replacement of Credit meters A Infrastructure - Water Reticulation 100 100,000 RVote4 - Director: Engineering Services Upgrading of Office A Infrastructure - Other Other 100 50,000 20 30 RVote4 - Director: Engineering Services Traillor A Other Assets General Vehicles 45 45,000 NVote4 - Director: Engineering Services Equipment A Other Assets Plant & Equipment 140 45,000 50 45 NVote4 - Director: Engineering Services Rehabilitate Gravel Roads, Curbing, Stormwater A Infratrsucture - Road Transport Roads, Pavements & Bridges 2,466 2,465,761 RVote5 - Director: Community Services Office Equipment A Other Assets Plant & Equipment 5 5,000 NVote5 - Director: Community Services Alarm (Office) A Infrastructure - Other Other 6 6,000 NVote5 - Director: Community Services Office Upgrade A Infrastructure - Other Other 30 30,000 NVote5 - Director: Community Services Filling Cabinets x 6 ; Office Desks x 2 A Other Assets Furniture and other office equipment 7 7,000 RVote5 - Director: Community Services Safety Gates and Fencing A Infrastructure - Other Other 30 30,000 NVote5 - Director: Community Services 1 x Base + 7 Portable Radio's (Two way) A Other Assets Plant & Equipment 8 8,000 NVote5 - Director: Community Services 50 L Street Refuse Bins x 50 A Other Assets Plant & Equipment 10 10,000 NVote5 - Director: Community Services Toilet Facilities x 2 (Waste Section) A Infrastructure - Other Other 30 30,000 NVote5 - Director: Community Services 90 L Refuse Bins x 300 A Other Assets Plant & Equipment 110 25,000 40 45 NVote5 - Director: Community Services Alarm (Stores) A Infrastructure - Other Other 6 6,000 NVote5 - Director: Community Services Air Conditioner A Other Assets Plant & Equipment 8 8,000 NVote5 - Director: Community Services Equipment A Other Assets Plant & Equipment 30 30,000 NVote5 - Director: Community Services Sirens and Red Lights A Other Assets Plant & Equipment 10 10,000 NVote5 - Director: Community Services lockers + Filling Cabinets A Other Assets Furniture and other office equipment 20 20,000 NVote5 - Director: Community Services Office Desk/Tables x 2 A Other Assets Furniture and other office equipment 3 3,000 NVote5 - Director: Community Services Filling Cabinet x 2 A Other Assets Furniture and other office equipment 2 2,000 NVote5 - Director: Community Services Office Chairs x 4 A Other Assets Furniture and other office equipment 3 3,000 NVote6 - Director Electrical Services Festive Lights Voëltjie Park A Infrastructure - Electricity Transmission & Reticulation 240 40,000 100 100 NVote6 - Director Electrical Services Motorcycle Meter readers A Other Assets General Vehicles 45 15,000 15 15 NVote6 - Director Electrical Services Mini Substation (Spare) A Infrastructure - Electricity Transmission & Reticulation 250 250,000 NVote6 - Director Electrical Services LDV A Other Assets General Vehicles 285 95,000 95 95 NVote6 - Director Electrical Services Power Monitoring Equipment (Beaufort West) A Infrastructure - Electricity Transmission & Reticulation 300 20,000 140 140 NVote6 - Director Electrical Services Load Control A Infrastructure - Electricity Transmission & Reticulation 44 44,000 NVote6 - Director Electrical Services 11 kV Switchgear Beaufort West A Infrastructure - Electricity Transmission & Reticulation 15,000 7,500 7,500 NVote6 - Director Electrical Services 11 kV Switchgear Rustdene A Infrastructure - Electricity Transmission & Reticulation 30,000 15,000 15,000 NVote6 - Director Electrical Services 12 kV Switchgear Kwa Mandlenkosi A Infrastructure - Electricity Transmission & Reticulation 5,000 2,500 2,500 NVote6 - Director Electrical Services Switchgear Main Substation 11kV A Infrastructure - Electricity Transmission & Reticulation 5,000 5,000 NVote6 - Director Electrical Services Two way Radios A Other Assets Plant & Equipment 20 5,000 5 10 NVote6 - Director Electrical Services 132 kV Substation (T.Off) A Infrastructure - Electricity Transmission & Reticulation 16,000 8,000,000 8,000 NVote6 - Director Electrical Services High Mass lights Nelspoort A Infrastructure - Electricity Transmission & Reticulation 251 251 NVote6 - Director Electrical Services 132 kV Substation A Infrastructure - Electricity Street Lighting 1,400 1,400,000 NVote6 - Director Electrical Services Electical Reticulation (New Industrial Area) A Infrastructure - Electricity Transmission & Reticulation 2,000 2,000 NVote6 - Director Electrical Services Install new battery systems A Infrastructure - Electricity Street Lighting 75 25,000 25 25 NVote6 - Director Electrical Services High Mass lights Merweville A Infrastructure - Electricity Street Lighting 251 250,800 NVote6 - Director Electrical Services High Mass lights Hooyvlakte A Infrastructure - Electricity Street Lighting 502 250,800 251 NVote6 - Director Electrical Services Flood lighting Sportground (Rustdene) A Infrastructure - Electricity Transmission & Reticulation 1,200 1,200 NVote6 - Director Electrical Services Flood lighting Sportground (Rugby Field) A Infrastructure - Electricity Transmission & Reticulation 1,200 1,200 NVote6 - Director Electrical Services Flood lighting Sportground (Merweville) A Infrastructure - Electricity Transmission & Reticulation 1,200 1,200 NVote6 - Director Electrical Services Flood lighting Sportground (Nelspoort) A Infrastructure - Electricity Transmission & Reticulation 1,200 1,200 N
Total Capital expenditure 1 53,443 48,109 26,438
Entities:List all capital projects grouped by Entity
Entity AWater project A
Entity BElectricity project B
Total Capital expenditure 2 – – – References1. Must reconcile with Budgeted Capital Expenditure2. Must reconcile with table A343. As per Table A64. As per Table 34
Project information
Asset Class 4. Asset Sub-Class 4.Program/Project description Project number
IDP Goal code
3.
Prior year outcomes
Total Project Estimate
2011/12 Medium Term Revenue & Expenditure Framework

WC053 Beaufort West - Supporting Table SA37 Projects delayed from previous financial year/s
Original Budget
Full Year Forecast
Budget Year 2011/12
Budget Year +1 2012/13
Budget Year +2 2013/14
R thousand YearParent municipality:
List all capital projects grouped by Municipal Vote Examples Examples
Entities:List all capital projects grouped by Municipal Entity
Entity NameProject name
References1. List all projects with planned completion dates in current year that have been re-budgeted in the MTREF2. Refer MFMA s303. Asset category and sub-category must be selected from Table A34
Municipal Vote/Capital projectPrevious target
year to complete
Current Year 2010/11 2011/12 Medium Term Revenue & Expenditure Framework
Project name Project number Asset Sub-Class 3.Asset Class 3.
Copyright © 2022 FDOKUMEN