as-is report western cape digital skils shared agenda for action
140
Capacity Building Programme for Employment Promotion AS-IS REPORT WESTERN CAPE DIGITAL SKILS SHARED AGENDA FOR ACTION Project details Reference Number: Title: CBPEP #13 WESTERN CAPE DIGITAL SKILS SHARED AGENDA FOR ACTION Activity Type: Consultant Name: Max No of Days: Short Term Expert Dr L Craffert 120 Month (s) Work: 9 1. Project objective The objective of the As-Is report is to: • Mapping the current digital skills landscape by reviewing the AS-IS environment • Developing a view of the to-be digital skills landscape; • Detailing a “Digital Skills Agenda”, with a view to meeting the overarching goal of the project; • Provide a communication strategy and change management process for sharing results; and, • Implementing the recommendations. 2. As-Is report Map the current digital skills landscape and present it as the As-Is scenario in a report format. 3. Scope of work • Desktop research to identify and provide a descriptive overview of (South African and Western Cape specific) digital skills related research/publications as it relates to user digital skills, digital leadership skills and ICT practitioner skills within the strategic growth sectors that are ICT intensive, namely Retail and Wholesale, Business Services, Financial Services, Media, Animation and Gaming, Tourism and ICT sectors.
-
Upload
khangminh22 -
Category
Documents
-
view
0 -
download
0
Transcript of as-is report western cape digital skils shared agenda for action

Capacity Building Programme for Employment Promotion
AS-IS REPORT
WESTERN CAPE DIGITAL SKILS SHARED AGENDA FOR ACTION
Project details Reference Number: Title:
CBPEP #13 WESTERN CAPE DIGITAL SKILS SHARED AGENDA FOR ACTION
Activity Type: Consultant Name: Max No of Days:
Short Term Expert Dr L Craffert 120
Month (s) Work:
9
1. Project objective
The objective of the As-Is report is to: • Mapping the current digital skills landscape by reviewing the AS-IS environment • Developing a view of the to-be digital skills landscape; • Detailing a “Digital Skills Agenda”, with a view to meeting the overarching goal of the
project; • Provide a communication strategy and change management process for sharing results;
and, • Implementing the recommendations.
2. As-Is report Map the current digital skills landscape and present it as the As-Is scenario in a report format. 3. Scope of work • Desktop research to identify and provide a descriptive overview of (South African and
Western Cape specific) digital skills related research/publications as it relates to user digital skills, digital leadership skills and ICT practitioner skills within the strategic growth sectors that are ICT intensive, namely Retail and Wholesale, Business Services, Financial Services, Media, Animation and Gaming, Tourism and ICT sectors.

i
• A descriptive overview of digital skills initiatives (supply) within Higher Education Institutions (viz. universities, TVET colleges, selective accredited and/or industry-specific service providers), focusing on current and planned ICT-practitioner skills and skills sets (The “planned” initiatives are included in an attempt to gauge role-players’ response to 4IR requirements).
• The key areas as described above) will be positioned within the context of a futuristic perspective of digital skills requirements.
• A once-off perspective on the current demand in terms of positions dependent on intermediary, advanced and specialised digital skills as obtained from a selected social media platform.
4. Project deliverables Refer to the full report 5. Findings and observations Refer to the full report

ii
Table of Contents SECTION 1: INTRODUCTION .................................................................................................................... 1
SECTION 2: SCOPE OF THE AS-IS REPORT ............................................................................................... 4
2.1 Key areas for the AS-IS research report ........................................................................................ 4
SECTION 3: RESEARCH MODEL /METHODOLOGY ................................................................................... 5
3.1 Methodology for the descriptive overview of the sectors ........................................................... 5
3.2 Methodology followed for the ICT supply information on Higher Education Institutions ........... 6
3.2.1 Universities ................................................................................................................................ 6
3.2.2 Technical, Vocational and Educational Training Colleges (TVET) .............................................. 6
3.3 Methodology for the once-off demand analysis of ICT and related skills .................................... 6
SECTION 4: RETAIL AND WHOLESALE SECTOR ANALYSIS ....................................................................... 7
4.1 Introduction .................................................................................................................................. 7
4.2 Sector definition ............................................................................................................................ 7
4.3 Sector dynamics ............................................................................................................................ 7
4.3.1 Growth and employment dynamics .......................................................................................... 7
4.3.2 Industry structure ...................................................................................................................... 9
4.3.3 Innovation ................................................................................................................................ 10
4.3.4 Change drivers and dynamics .................................................................................................. 10
4.4 Digital skills landscape ................................................................................................................ 14
4.4.1 SETA-led initiatives ................................................................................................................... 14
4.4.2 Formal Education-Led Supply Chain ........................................................................................ 15
4.4.3 Industry-Led Supply Chain ....................................................................................................... 15
4.4.4 Less Formal Supply Chain ......................................................................................................... 15
4.5 Insights ........................................................................................................................................ 16
SECTION 5: BUSINESS AND FINANCIAL SERVICES SECTOR ANALYSIS ................................................... 18
5.1 Introduction ................................................................................................................................ 18
5. 2. Sector definition ........................................................................................................................ 18
5.3 Overview of the landscape and dynamics .................................................................................. 18
5.3.1 Growth and employment dynamics ........................................................................................ 18
5.3.2 Companies / role players / industry bodies ............................................................................. 18
5.3.3 Key drivers and technological change...................................................................................... 19
5.4 Digital skills landscape ................................................................................................................ 22
5.4.1. SETA-led initiatives .................................................................................................................. 23
iii
5.4.2 Government-led initiatives ...................................................................................................... 24
5.4.3 Formal Education-led supply chain .......................................................................................... 25
5.4.4 Industry-led supply chain ......................................................................................................... 26
5.4.5 Business-led initiatives ............................................................................................................. 26
5.4.6 Less Formal Supply Chain ......................................................................................................... 27
5.5 Insights ........................................................................................................................................ 27
SECTION 6: TOURISM DIGITAL SKILLS SECTOR ANALYSIS ..................................................................... 29
6.1 Introduction ................................................................................................................................ 29
6.2 Definition of the sector ............................................................................................................... 29
6.3 Overview of the landscape and dynamics .................................................................................. 29
6.3.1 Economics ................................................................................................................................ 29
6.3.2 Policy aspects ........................................................................................................................... 30
6.3.3 Companies / role players / industry bodies ............................................................................. 30
6.3.4 Key drivers and technological change...................................................................................... 30
6.4 Digital skills landscape ................................................................................................................ 32
6.4.1 Formal Education-Led Supply Chain ........................................................................................ 32
6.4.2 Industry-led supply chain ......................................................................................................... 32
6.4.3 Less formal supply chain .......................................................................................................... 33
6.5 Insights ........................................................................................................................................ 34
SECTION 7: ANIMATION ........................................................................................................................ 35
7.1 Introduction ................................................................................................................................ 35
7.2 Sector definition .......................................................................................................................... 35
7.3 Landscape overview and sector dynamics .................................................................................. 35
7.3.1 Economics ................................................................................................................................ 36
7.3.2 Policy aspects ........................................................................................................................... 37
7.3.3 Companies, role players, industry bodies ................................................................................ 37
7.3.4 Change drivers and dynamics .................................................................................................. 38
7.3.4.1 Key drivers ............................................................................................................................. 38
7.3.4.2 Technological change ............................................................................................................ 38
7.3.4.3 Challenges and opportunities ............................................................................................... 38
7.4 Digital skills landscape ................................................................................................................ 39
7.4.1 Skills suppliers .......................................................................................................................... 40
7.4.2 Special initiatives (government, industry) ............................................................................... 41
7.4.3 SETA perspective ...................................................................................................................... 41

iv
7.4.4 Challenges, opportunities, requirements ................................................................................ 41
SECTION 8: FILM AND MEDIA ............................................................................................................... 43
8.1 Introduction ................................................................................................................................ 43
8.2 Sector definition .......................................................................................................................... 43
8.3 Landscape overview and dynamics ............................................................................................. 44
8.3.1 Economics ................................................................................................................................ 44
8.3.2 Policy aspects ........................................................................................................................... 44
8.3.3 Companies, role players, industry bodies ................................................................................ 45
8.3.3.1 Employment .......................................................................................................................... 45
8.3.3.2 Industry bodies ..................................................................................................................... 46
8.3.3.3 The Film and Media Value Chain .......................................................................................... 46
8.3.4 Key drivers, technological change, challenges and opportunities ........................................... 47
8.4 Digital skills landscape ................................................................................................................ 49
8.4.1 Skills gaps ................................................................................................................................. 49
8.4.2 Skills suppliers .......................................................................................................................... 50
8.4.3 Special initiatives (government, industry) ............................................................................... 52
8.4.4 SETA perspective on skills ........................................................................................................ 52
8.4.5 Challenges, opportunities, requirements ................................................................................ 53
8.5 Insights ........................................................................................................................................ 53
SECTION 9: GAMING ............................................................................................................................. 55
9.1 Introduction ................................................................................................................................ 55
9.2 Sector definition .......................................................................................................................... 55
9.3 Landscape overview and dynamics ............................................................................................. 55
9.3.1 Economics ................................................................................................................................ 56
9.3.2 Policy aspects ........................................................................................................................... 57
9.3.3 Companies, role players, industry bodies ................................................................................ 58
9.3.4 Key drivers, technological change, challenges and opportunities ........................................... 58
9.4 Skills landscape ........................................................................................................................... 60
9.4.1 Skills suppliers .......................................................................................................................... 61
9.4.2 Special initiatives ...................................................................................................................... 61
9.4.3 SETA perspective ...................................................................................................................... 62
9.4.4 Challenges, opportunities, requirements ................................................................................ 62
9.5 Insights ........................................................................................................................................ 62
SECTION 10: ICT SECTOR ....................................................................................................................... 63
v
10.1 Introduction .............................................................................................................................. 63
10.2 Sector definition ........................................................................................................................ 63
10.3 Landscape overview and sector dynamics ................................................................................ 63
10.3.1 Companies, role-players ........................................................................................................ 63
10.3.2 Change drivers and dynamics ................................................................................................ 64
10.3.3 Technological change ............................................................................................................. 65
10.3.3 Challenges and opportunities ................................................................................................ 67
10.4 Skills landscape ......................................................................................................................... 68
10.4.1 Skills suppliers ........................................................................................................................ 68
10.4.2 Vendor-led initiatives ............................................................................................................. 71
10.4.3 Incubators, accelerators, start-ups ........................................................................................ 72
10.4.3 Special initiatives.................................................................................................................... 72
10.4.4 SETA perspective on skills requirements ............................................................................... 73
10.4.5 Industry perspectives on skills requirements ........................................................................ 73
10.4.6 Specific skills requirement related to new technological initiatives ..................................... 74
10.4.7 Demand .................................................................................................................................. 74
10.5 Insights ...................................................................................................................................... 75
10.5.1 Legacy vs New technology ..................................................................................................... 75
10.5.2 Legacy vs new technology skills ............................................................................................. 76
10.5.3 Tertiary institutions ................................................................................................................ 76
10.5.4 The management gap ............................................................................................................ 77
10.5.5 The vendor challenge ............................................................................................................. 77
10.5.6 The push and pull conundrum ............................................................................................... 77
10.5.7 The impossible dream ............................................................................................................ 77
SECTION 11: DISCUSSION POINTS ........................................................................................................ 79
11.1 Introduction .............................................................................................................................. 79
11.2 Sectoral discussion points ......................................................................................................... 79
11.2.1 Wholesale & Retail ................................................................................................................. 79
11.2.2 Business and Finance ............................................................................................................. 79
11.2.3 Tourism .................................................................................................................................. 79
11.2.4 Film, Media, Animation, Gaming ........................................................................................... 80
11.2.5 ICT Sector ............................................................................................................................... 80
11.3 Generic discussion points ......................................................................................................... 81

vi
11.3.1 A differentiated approach for the identification of sector-specific digital skills requirements .......................................................................................................................................................... 81
11.3.2 Pro-active skilling (upskilling) of first-time job entrants ........................................................ 81
11.3.3 Upskilling and reskilling of people already in employment ................................................... 82
11.3.4 New and innovative models and approaches for skills acquisition ....................................... 82
11.3.5 Technical and digital skills are not the only requirements .................................................... 82
11.3.7 Combining efforts for high impact ......................................................................................... 82
11.3.8 Acknowledging the human dimension, combating ignorance and fear ................................ 82
Annexure 1: Film and Media process .................................................................................................... 83
Annexure 2: Film & media .................................................................................................................... 84
Annexure 3: Gaming industry revenue 2017 ........................................................................................ 87
Annexure 4: Incubators, accelerators and start-ups ............................................................................ 88
Annexure 5: Opinions of role players in the ICT sector ........................................................................ 89
Annexure 6: Business Initiatives ........................................................................................................... 90
Annexure 7: Western Cape digital skills agenda ................................................................................... 91
Literature Consulted ........................................................................................................................... 128
1
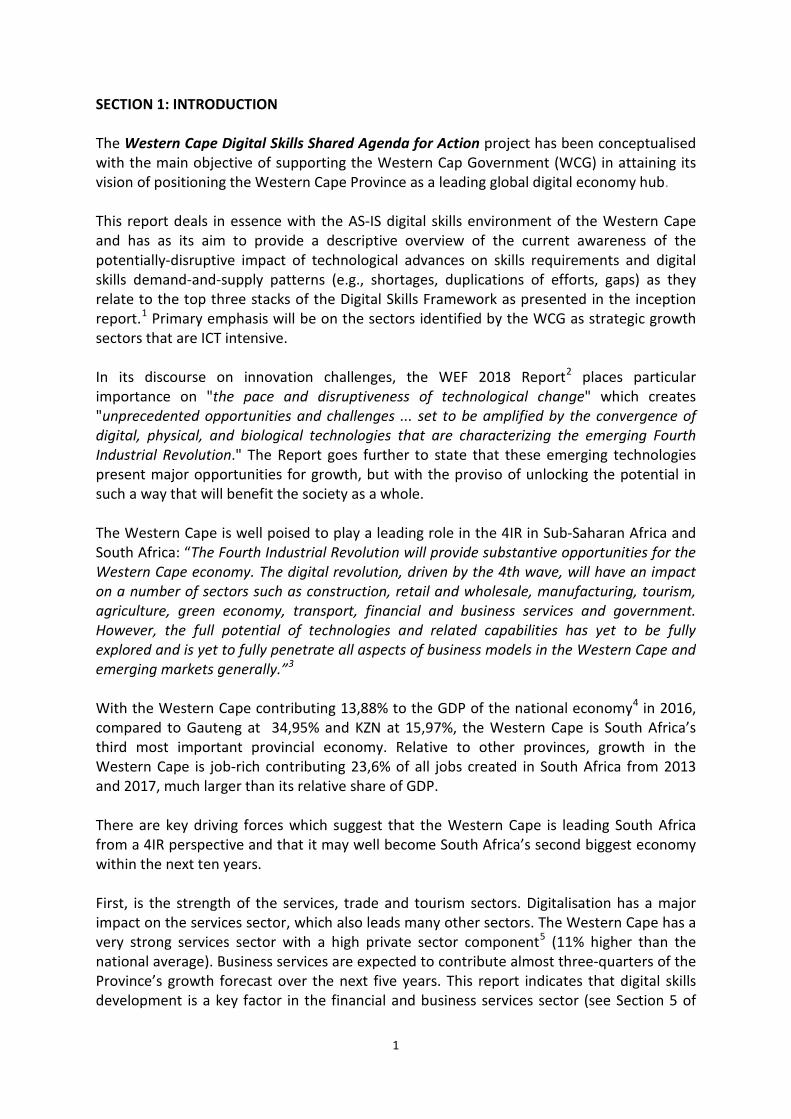
SECTION 1: INTRODUCTION The Western Cape Digital Skills Shared Agenda for Action project has been conceptualised with the main objective of supporting the Western Cap Government (WCG) in attaining its vision of positioning the Western Cape Province as a leading global digital economy hub. This report deals in essence with the AS-IS digital skills environment of the Western Cape and has as its aim to provide a descriptive overview of the current awareness of the potentially-disruptive impact of technological advances on skills requirements and digital skills demand-and-supply patterns (e.g., shortages, duplications of efforts, gaps) as they relate to the top three stacks of the Digital Skills Framework as presented in the inception report.1 Primary emphasis will be on the sectors identified by the WCG as strategic growth sectors that are ICT intensive. In its discourse on innovation challenges, the WEF 2018 Report2 places particular importance on "the pace and disruptiveness of technological change" which creates "unprecedented opportunities and challenges ... set to be amplified by the convergence of digital, physical, and biological technologies that are characterizing the emerging Fourth Industrial Revolution." The Report goes further to state that these emerging technologies present major opportunities for growth, but with the proviso of unlocking the potential in such a way that will benefit the society as a whole. The Western Cape is well poised to play a leading role in the 4IR in Sub-Saharan Africa and South Africa: “The Fourth Industrial Revolution will provide substantive opportunities for the Western Cape economy. The digital revolution, driven by the 4th wave, will have an impact on a number of sectors such as construction, retail and wholesale, manufacturing, tourism, agriculture, green economy, transport, financial and business services and government. However, the full potential of technologies and related capabilities has yet to be fully explored and is yet to fully penetrate all aspects of business models in the Western Cape and emerging markets generally.”3 With the Western Cape contributing 13,88% to the GDP of the national economy4 in 2016, compared to Gauteng at 34,95% and KZN at 15,97%, the Western Cape is South Africa’s third most important provincial economy. Relative to other provinces, growth in the Western Cape is job-rich contributing 23,6% of all jobs created in South Africa from 2013 and 2017, much larger than its relative share of GDP. There are key driving forces which suggest that the Western Cape is leading South Africa from a 4IR perspective and that it may well become South Africa’s second biggest economy within the next ten years. First, is the strength of the services, trade and tourism sectors. Digitalisation has a major impact on the services sector, which also leads many other sectors. The Western Cape has a very strong services sector with a high private sector component5 (11% higher than the national average). Business services are expected to contribute almost three-quarters of the Province’s growth forecast over the next five years. This report indicates that digital skills development is a key factor in the financial and business services sector (see Section 5 of

2
this report below). Strong growth sectors with major digital skills issues include wholesale and retail trade and tourism (see Sections 4 and 6 of this report). Second, is the ascendant global competitiveness of Cape Town. With an unemployment rate 13 percentage points lower than the national figure, and 10 points lower than the average metro, Cape Town is a city of genuine opportunity for millions of people”.6 The City is a key driver of the economy, accounting for 72,5% of the GDP in 2016, providing globally competitive business clusters in finance, insurance, real estate and business services sector which contributed 61,8% of the total growth in 2016. Within a globalised world, cities compete against each other for investment, export capability, skilled workers, entrepreneurship, tourism and retirees. “International and domestic firms, mobile professionals, investors and development can make choices between counties and cities as never before, with cities overtaking countries in importance”7. Investment, skills and partnerships are drawn to cities which perform well on global indexes, particularly the “footloose” new economy industries of the 4IR. Key indexes in which Cape Town performs well include being a continental leader in start-ups, financial services and liveability and being a global icon for tourism. In the PWC ranking of 20188 Cape Town comes top in Africa with strongest scores are for cost & ease of doing business, transportation and infrastructure, and sustainability and the natural environment, with moderate scores in intellectual capital and innovation and health, safety and security. Areas for improvement include economic clout, technology readiness, city gateway, and demographics and liveability. As this report will show (see Sections 7,8, 9 and 10) the City also leads in the cutting edge industries of film and media, animation, gaming and ICT. Third, is the fact that the Western Cape is exceptionally well invested from a knowledge and innovation infrastructure and performance, with Cape Town the national leader in the number of patents registered9. Finally, a steady effort by the Western Cape Government over the past decade has seen the maturation of digital partnership institutions such as CITI and the success of broadband roll out, so that digital literacy in the Western Cape is significantly higher than in other provinces10. Against this formidable platform of opportunity is the risk of job-less and job-loss growth as the 4IR affects the lowest level jobs and the least digitally literate majority of the Province. “South Africa remains the most unequal country in the world, and though this is less pronounced in Cape Town, it remains very unequal by international standards …inequality means that even as Cape Town’s universities produce Nobel Prize winners in Chemistry, Medicine and Literature, its population as a whole remains uneducated, and while tourists can relax in its safe Waterfront areas, city-wide crime statistics reflect the dangerous daily lives of its many informal township dwellers.”11 In recognition of the accelerating technological changes and the requirement to remain responsive to the needs, challenges and opportunities of a hyper-connected global economy, the Western Cape Government has set as one of its goals to position itself as a leading global digital hub. There is a clear understanding that such a goal statement is

3
dependent on the targeted development of the required digital skills and competency across all sectors in the economy for future employment and sustained competitiveness. The project is funded by the Capacity Building Programme for Employment Promotion12, and will be realised by means of the following activities: • Mapping the current digital skills landscape by reviewing the AS-IS environment • Developing a view of the to-be digital skills landscape; • Detailing a “Digital Skills Agenda”, with a view to meeting the overarching goal of the
project; • Provide a communication strategy and change management process for sharing results;
and, • Implementing the recommendations.
4
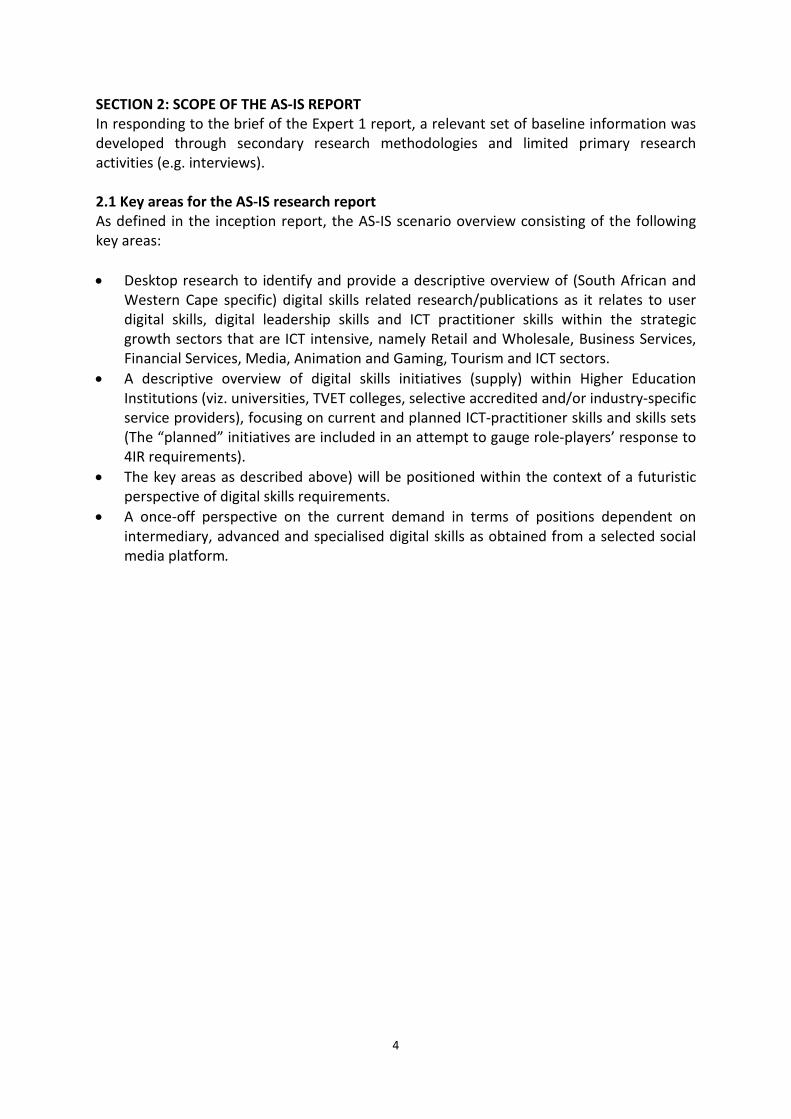
SECTION 2: SCOPE OF THE AS-IS REPORT In responding to the brief of the Expert 1 report, a relevant set of baseline information was developed through secondary research methodologies and limited primary research activities (e.g. interviews). 2.1 Key areas for the AS-IS research report As defined in the inception report, the AS-IS scenario overview consisting of the following key areas:
• Desktop research to identify and provide a descriptive overview of (South African and
Western Cape specific) digital skills related research/publications as it relates to user digital skills, digital leadership skills and ICT practitioner skills within the strategic growth sectors that are ICT intensive, namely Retail and Wholesale, Business Services, Financial Services, Media, Animation and Gaming, Tourism and ICT sectors.
• A descriptive overview of digital skills initiatives (supply) within Higher Education Institutions (viz. universities, TVET colleges, selective accredited and/or industry-specific service providers), focusing on current and planned ICT-practitioner skills and skills sets (The “planned” initiatives are included in an attempt to gauge role-players’ response to 4IR requirements).
• The key areas as described above) will be positioned within the context of a futuristic perspective of digital skills requirements.
• A once-off perspective on the current demand in terms of positions dependent on intermediary, advanced and specialised digital skills as obtained from a selected social media platform.
5
SECTION 3: RESEARCH MODEL /METHODOLOGY
3.1 Methodology for the descriptive overview of the sectors In its strategy to create the most appropriate and efficient research method that will allow the Expert 1 group, not only to complete its allocated tasks within the allocated time period, but also to corroborate and substantiate the findings gained from secondary research processes, the following overall methodology was agreed upon, namely: • Secondary research by means of external desk research of the 8 major sectors
constituting the Western Cape economy; • To arrive at consistency across data sources, the team members used the method of
triangulation to qualitatively check and establish the validity of their respective secondary research findings by analysing their research questions from multiple perspectives through cross verification from multiple sources; and,
• Interview and engage selected industry practitioners, industry employer representatives to add value by corroborating, or contesting, the findings.
For compliance to ethics in research, the generally-accepted protocols of conducting secondary research and its appropriate conventions of extracting secondary research data have been followed consistently. Finally, for purposes of expediency and efficiency, the eight sectors mandated to the Expert 1 team for investigation were critically assessed and analysed. To circumvent the impact of duplication and replication between closely-related sectors of the economy, the Expert 1 AS-IS team, where possible, reconstituted the respective units of analysis into five groupings, namely:
• The wholesale and retail industry as a research cohort; • Combining the business services sector and the financial services sector; • The tourism sector as a single cohort; • Combining the media, film, animation and gaming sectors into a single cohort; and, • The ICT practitioner supply sector as a single cohort. To ensure consistency amongst the research team, each researcher was to extract data by means of an internally agreed guideline, comprising of: • A brief introduction of the sector in terms of what it presents, and what it can become,
given a proper injection of resources, namely an adequate and relevant skills base, access to the requisite physical resources; funding to seek and promote opportunities for growth, and leadership and entrepreneurial acumen for innovation;
• Presenting a definition and description of the sector; • An overview of its economic contribution, policies pertinent to the advancement of the
sector, key stakeholders, challenges and opportunities, etc., by analysing available research to gain systemic insights into the sector by focusing on trends that (may) impact the growth and development of the sector (e.g. key driving factors and technology changes);
• The skills landscape within the sector which includes skills suppliers, special initiatives by stakeholders, perspectives on skills requirements from the respective sectoral education and training authorities, any “special” or focused training interventions, start-ups, incubators and accelerators as opportunity generators; and,
6
• Identifying gaps in each sector based on industry views of a futuristic perspective. Each of the five groupings is reported on by generally following the above guidelines. 3.2 Methodology followed for the ICT supply information on Higher Education Institutions 3.2.1 Universities The major supply of ICT skills in Higher Education is encompassed in the Classification of Educational Subject Matter Category 06 (CESM 06)13, as provided by the Department of Higher Education and Training (DHET). CEMS 06 consists of the “broad areas of study concerned with all facets of electronic computing, including computer systems, computer networks and computer software, as well as the classification, storage, processing and dissemination of information.” To determine the trend in the supply of ICT skills generated by Higher Education Institutions in the Western Cape14, the audited data sets for the years 2012, 2014 and 2016 of CESM 06 were utilised for relevant data extraction. The above data were categorised for both national and the Western Cape according to the following variables: • Academic qualification: (1) undergraduate degrees, certificates and diplomas; (2)
Honours degrees and postgraduate diplomas; (3) Master’s and Doctoral degrees • Gender • Employment equity requirements 3.2.2 Technical, Vocational and Educational Training Colleges (TVET)15 The data on the supply of ICT skills in TVET Colleges were obtained from the Higher Education Management Information System (HEMIS) of the Department of Higher Education. The determine the trend in the supply generated by TVET Colleges, the data sets for the years 2015, 2016, 2017 were utilised and categorised for the five Western Cape TVET colleges according to the number of graduates, gender and EE imperatives. The above data extraction was done per HEI for the provincial cohort. 3.3 Methodology for the once-off demand analysis of ICT and related skills A demand analysis for ICT and related skills was conducted using data freely available from LinkedIn’s jobs-search, and Google’s “Google-Trends” platform, supplemented by data provided by PNet, a private recruitment company. LinkedIn’s jobs-search data provides a snapshot of the current demand of ICT skills for the period of 1 (one) month. (Note that additional data for all jobs for all time is available from LinkedIn, but is less useful) whereas Google-Trends keyword-search engine provides data on a timeline, showing the variation in interest in ICT and related skills over a period of 3-4 years. Data were limited to the Western Cape, although for LinkedIn only Cape Town data were available.
7
SECTION 4: RETAIL AND WHOLESALE SECTOR ANALYSIS 4.1 Introduction The retail and wholesale sector is at the core of the Western Cape economy in terms of its contribution to the economy as a whole, its critical connection to other major sectors within the economy, as well as its contribution to growth and employment within the region. 4.2 Sector definition The retail sector involves and sale and exchange of goods directly to consumers whereas wholesale involves sales from wholesalers to retailers. The following key sub-sectors have been identified by stakeholders within the retail and wholesale sector.16 • Clothing • Supermarket • Motor trade and fuel • e-Retailing • Jewelry • Hardware • Merchandising. General dealers dominate the sector, making up 42% of all retail enterprises. This is followed by textiles, clothing, footwear and leather goods retailers that comprise 20% of the retail sector. Wholesalers of solid, liquid & gaseous fuels & related products dominate the sector followed by food, beverages & tobacco and machinery & equipment and supplies wholesalers17. 4.3 Sector dynamics 4.3.1 Growth and employment dynamics The global retail sector has experienced an annual growth rate of 3,8% since 200818. The sector is expected to continue to grow strongly due to macroeconomic and demographic forces such as: • Increasing global GDP • Increasing disposable income and consumer spending • Growing population size • Increasing digital penetration and mobile power • Globalisation and connectedness E-commerce in this sector is anticipated to show a phenomenal compound annual growth rate of 23% globally, between 2012 and 201919. In 2017, an estimated 1,66 billion people worldwide purchase goods online. During the same year, global e-retail sales amounted to R33,6 trillion and projections show a growth of up to R 65,4 trillion by 2021. Amazon with 1.87 billion shoppers per annum, EBay with 817, 6 million and Walmart with 339 million are the top 3 retailing sites in the USA20. In Asia Pacific, e-retail sales accounted for 12.1% of retail sales in 2016, but only for 1,8% of retail sales in the Middle East and Africa.
8
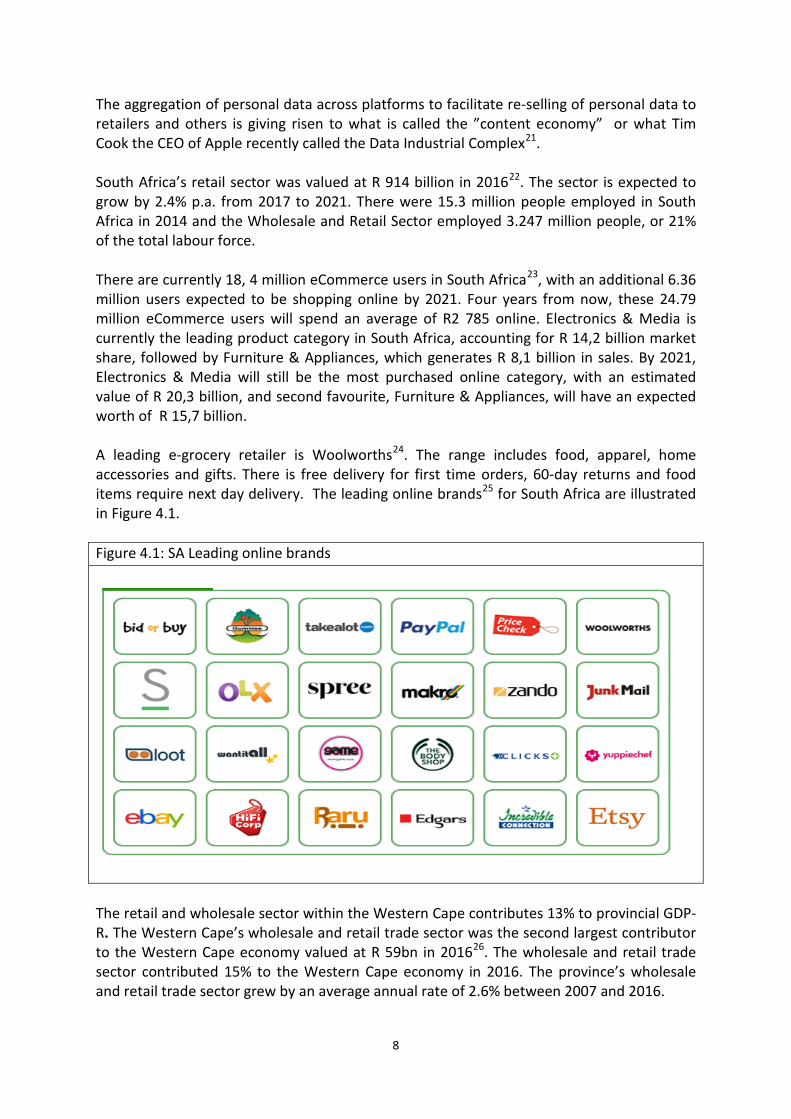
The aggregation of personal data across platforms to facilitate re-selling of personal data to retailers and others is giving risen to what is called the ”content economy” or what Tim Cook the CEO of Apple recently called the Data Industrial Complex21. South Africa’s retail sector was valued at R 914 billion in 201622. The sector is expected to grow by 2.4% p.a. from 2017 to 2021. There were 15.3 million people employed in South Africa in 2014 and the Wholesale and Retail Sector employed 3.247 million people, or 21% of the total labour force. There are currently 18, 4 million eCommerce users in South Africa23, with an additional 6.36 million users expected to be shopping online by 2021. Four years from now, these 24.79 million eCommerce users will spend an average of R2 785 online. Electronics & Media is currently the leading product category in South Africa, accounting for R 14,2 billion market share, followed by Furniture & Appliances, which generates R 8,1 billion in sales. By 2021, Electronics & Media will still be the most purchased online category, with an estimated value of R 20,3 billion, and second favourite, Furniture & Appliances, will have an expected worth of R 15,7 billion. A leading e-grocery retailer is Woolworths24. The range includes food, apparel, home accessories and gifts. There is free delivery for first time orders, 60-day returns and food items require next day delivery. The leading online brands25 for South Africa are illustrated in Figure 4.1. Figure 4.1: SA Leading online brands
The retail and wholesale sector within the Western Cape contributes 13% to provincial GDP-R. The Western Cape’s wholesale and retail trade sector was the second largest contributor to the Western Cape economy valued at R 59bn in 201626. The wholesale and retail trade sector contributed 15% to the Western Cape economy in 2016. The province’s wholesale and retail trade sector grew by an average annual rate of 2.6% between 2007 and 2016.
9
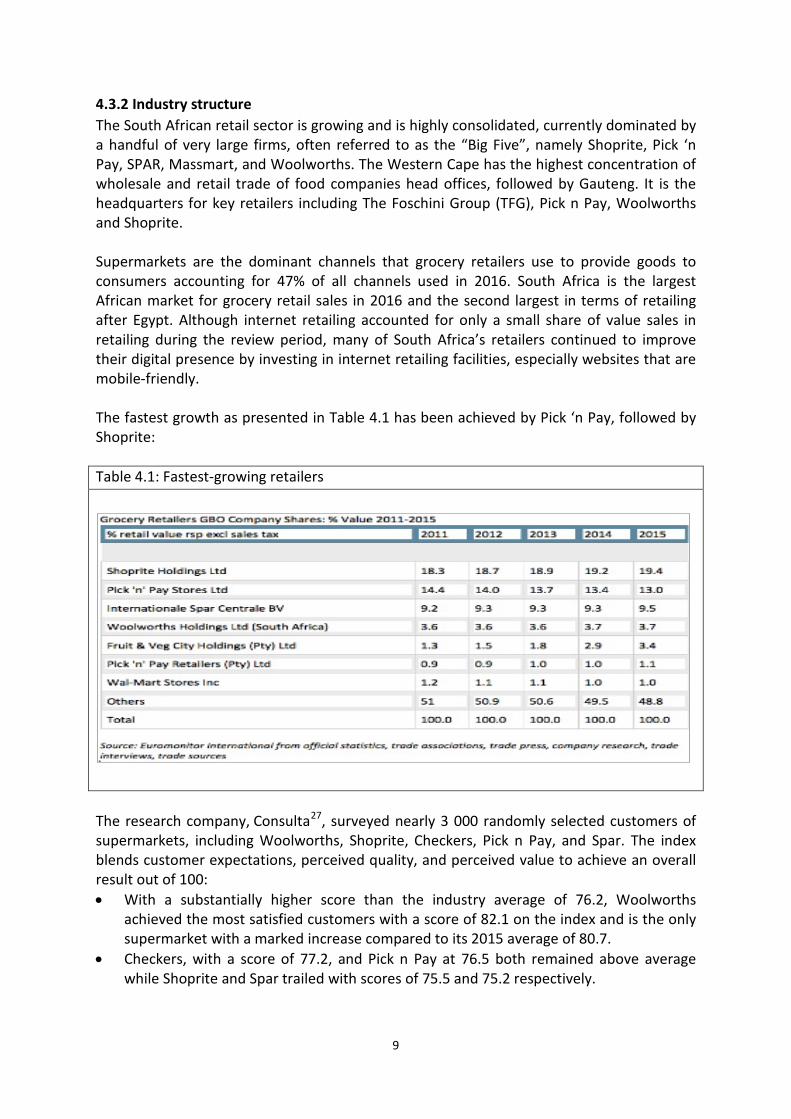
4.3.2 Industry structure The South African retail sector is growing and is highly consolidated, currently dominated by a handful of very large firms, often referred to as the “Big Five”, namely Shoprite, Pick ‘n Pay, SPAR, Massmart, and Woolworths. The Western Cape has the highest concentration of wholesale and retail trade of food companies head offices, followed by Gauteng. It is the headquarters for key retailers including The Foschini Group (TFG), Pick n Pay, Woolworths and Shoprite. Supermarkets are the dominant channels that grocery retailers use to provide goods to consumers accounting for 47% of all channels used in 2016. South Africa is the largest African market for grocery retail sales in 2016 and the second largest in terms of retailing after Egypt. Although internet retailing accounted for only a small share of value sales in retailing during the review period, many of South Africa’s retailers continued to improve their digital presence by investing in internet retailing facilities, especially websites that are mobile-friendly. The fastest growth as presented in Table 4.1 has been achieved by Pick ‘n Pay, followed by Shoprite: Table 4.1: Fastest-growing retailers
The research company, Consulta27, surveyed nearly 3 000 randomly selected customers of supermarkets, including Woolworths, Shoprite, Checkers, Pick n Pay, and Spar. The index blends customer expectations, perceived quality, and perceived value to achieve an overall result out of 100: • With a substantially higher score than the industry average of 76.2, Woolworths
achieved the most satisfied customers with a score of 82.1 on the index and is the only supermarket with a marked increase compared to its 2015 average of 80.7.
• Checkers, with a score of 77.2, and Pick n Pay at 76.5 both remained above average while Shoprite and Spar trailed with scores of 75.5 and 75.2 respectively.

10
According to Wesgro28, the Western Cape was the largest global investor by province into Africa by retail, accounting for 7.3% of FDI projects between 2003 and 2016. Between 2003 and 2016 a total of 18 FDI projects were recorded into the Western Cape’s retail. These projects represent a total capital investment of R4 billion which is an average investment of R250 million per project. During the period, a total of 1,744 jobs was created. The United States has been the largest investor into the Western Cape’s retail environment, accounting for 36%29. The following additional elements are key to the retail and wholesale landscape of the Western Cape: • The thousands of micro retailers who use the various platforms for sale, barter and
procurement. • The emergent Maker movement is a social movement with an artisan spirit. Maker
culture30 emphasizes learning-through-doing (active learning) in a social environment. Maker culture emphasizes informal, networked, peer-led, and shared learning motivated by fun and self-fulfillment.
• Traditional “Mom and Pop“ stores or Corner Cafés • The Township Economy31 with its unique configuration of spaza shops, taverns,
township industry and emergent retail malls • An informal sector, a large proportion of which entails survivalist entrepreneurship. 4.3.3 Innovation Online retailers have disrupted the traditional retail business model by simply acting as a platform which sells goods directly to consumers at small mark-ups. Some of these business models simply provide a safe and effective platform for the buying and selling of used goods, while making profits through commission, subscriptions or media and content. Some of South Africa’s biggest e-commerce platforms are based in the Western Cape. These include online shopping giants Spree, Gumtree and Zando. These platforms operate across the country and are increasingly gaining popularity and scale. They are big employers and are showcasing the sophistication and potential of the local retail and wholesale supply chain. The presence of these capabilities within the province is a testament to the Western Cape’s reputation of being an enabler and early adopter of innovation32 4.3.4 Change drivers and dynamics Digital is having an impact on every part of the retail and wholesale sector value chain, creating opportunities for new market creation, market entry and innovation. It is driving new capabilities and ways of operating, challenging traditional business models and transforming the traditional competitive landscape. Omni-channel marketing is now the norm for most brands and includes web, social, email, mobile app and traditional brick and mortar shops. The integration and orchestration of these comprise what is known as the “customer journey”. Kitewheel33 observed the following customer journey trends in 2016: • the web channel showed consistent growth • email experienced significant growth within omni-channel journeys

11
the tracking from a data analytics perspective of social touchpoints (i.e. when a potential customer comes into contact with a brand through social media or platform engagement) declined and were being used more as a means as to generate sales leads to feed into other channels in their customer journeys
• mobile app interactions represented less than 1% of total transactions but were experiencing ten times higher than the growth in other any channel.
“To master a truly seamless omni-channel experience, retailers will need to overcome the main barriers of quality/accuracy, in-person experience and fulfilment to drive scale and growth. They’ll also need to be shopper-centric, prioritise personalisation and invest in mobile-based solutions to support their activities, which incorporate digital into the in-store environment”34. The trends disrupting the wholesale and retail sector are presented in Table 4.2.:
Table 4.2: Trends disrupting the retail sector
Customer experience & value propositions
• Better understand customer behaviour through data & analytics, and so personalise services & offers
• Improved in-store experiences • Increased e-commerce • Personalisation of the service experience • More payment options enabling easier transactions • Ability to service global customers through e-commerce
Optimisation of operations
• Quick response to fluctuations in demand to optimise inventory management
• Ability to integrate products & service to create a valued experience • Business intelligence from analytics to improve display & distribution
Internet of Things • Enhanced supply chain visibility leading to stock-out prevention etc. • Transparent supply chain enabling customers or wholesalers to track product flow • Connect infrastructure, stock and systems and for example create • Location based offers and service customisation alerts when a product needs to
be re-ordered or has perished
Big data • Merchandising and market analysis • Campaign management and customer loyalty programmes • Supply-chain management and analytics • Event and behaviour-based targeting • Market and consumer segmentations • Linking purchasing data, geo-location data with payment data through
converged partnerships
Mobile connectivity • Mobile point-of sales devices to improve payment process • Engagement of customers to provide detailed product
information • Devices to assist with scanning and distribution of goods
Artificial intelligence • Analytics & predictive models to help personalise experiences, enhance inventory demand visibility & forecasting
• Automated packing and distribution of orders
12
Automation, Robotics & 3D Printing
• Various applications – drones to monitor stock levels, virtual assistants to place and receive orders, robotic product picking & packing
• Partly 3D printed infrastructure and production equipment components
• Automated inventory and warehouse management
Nature of work • Improved employee productivity in digitally enabled environment • Ability to create more responsive retail working environment • Increased need for workers to become ”digital operators” using digital tools in the
delivery of products or services.
Source: Ernst & Young: 201735
Ernst & Young36 identify the following imperatives for the Western Cape about this sector: Customer expectations are increasing: The digitalisation of all facets of the value chain is enabling very high levels of tracking, personalisation, customisation and engagement. Big firms lead digitalisation: It is the large companies within the sector that are able to invest in new digital capabilities to optimise all areas of their business operations and explore new service offerings to customers. Most large organisations within the sector have adopted digital applications that improve operations and management activities, create new distribution channels and build closer customer relationships. The wealth of lifestyle data that retailers have access to is substantial and they are starting to use this to transform customer buying experiences. Digitalisation combined with mobile enables customer engagement: The extensive penetration of digital devices into the population has put consumers at the forefront of sector dynamics, giving them the power to influence the industry. In this evolving competitive landscape, it is those organisations which best organise and adapt to serve changing expectations and ways of working that will thrive and dominate the market. The ‘intelligence’ about customers that organisations are able to glean from the data captured from spending and payment records is enabling organisation to better serve customers. Table 4.3 shows the number of vacancies in Cape Town per month for programming skills for graphic designers, social media, dot.net developers, web developers and SQL programmers, while Table 4.4 shows the number of vacancies per month in Cape Town for the retail sector for required skills in data analytics, Big Data, cyber security, virtual reality and cloud computing. It is therefore not surprising that data analytics emerges as the top digital skills need in the retail sector. Table 4.3: Retail vacancies

13
Source: Bizz Community (2018)37
Table 4.4: Digital skills required in the retail sector*
* This information does not portray a trend as it is for one month only Social platforms are key in supporting better brand management. Digital solutions enable analytical tools which scan through social media to capture and categorise comments and reviews, allowing businesses to track and monitor brand reputation in real-time. Social platforms also act as a marketing medium to achieve a wider and deeper reach into a target market. This is confirmed by the pre-eminence given to social media and graphic design in our survey.
0
2
4
6
8
10
12
14
16
Graphics Design Social Media C# Web Development SQLNum
ber o
f Vac
anci
es in
Cap
e To
wn
in 1
m
onth
Programming Skills
Retail
0
10
20
30
40
50
60
Data Analytics Big Data Cyber Security Virtual Reality Cloud Computing
Num
ber o
f Vac
anci
es in
Cap
e To
wn
in 1
mon
th
Skills
14
Loyalty programmes are vital, as consumers are willing to share more information if they get some benefit in return. Opportunities are emerging for small businesses, as digital capabilities are empowering smaller organisations, because they are now better able to compete with the larger market leaders. • The improvements in supply chain those digital solutions, means that smaller shops can
better manage ordering and stock to meet demand, and benefit from significantly more efficient goods delivery.
• Smaller businesses generally have more intimate relationships with their customers and provide a level of convenience that large organisations cannot.
• Digital advancements are enabling smaller businesses to improve their services to better meet their customers’ needs, improving their competitive position.
• SMMEs within the sector are also benefiting from the improving sophistication of supply chains as they are able to tap into the distribution and logistics systems built up by large and digitally maturing companies.
• This is enabling wider and faster access to products for SMMEs and assisting them to better serve their customers and save costs in storage and shelf space.
• Demand forecasting and sales analytics applications are becoming widespread and assisting decision-making.
4.4 Digital skills landscape 4.4.1 SETA-led initiatives The W&R (Wholesale and Retail) SETA Sector Skills Plan (SSP) 2016 -2017 has this to say about digital skills: The retail industry is enduring a consumer revolution. The key drivers of this revolution are the rapid adoption of mobile devices, digital media and tablets equipped with shopping applications. Wholesalers and retailers risk potential growth and development if they do not stay abreast of technology. The type, level and mix of skills required by multi-channel retailing presents a challenge to the sector. The W&R SETA needs to focus skills development on initiatives such as learnerships that include new technologies, and training in digital media, social networking and marketing. The skills development emphasis should include developing of talent pipelines to harness customer strategies38 The Top 10 Critical Skills identified are: Management, Leadership, Life skills (time management, Personal budgeting, Labour relations Knowledge), Customer service, Selling, Product knowledge, Supervisory, Financial acumen, Numeracy & literacy, IT Skills Computer (Advanced).

15
High level computer skills are required in relatively low-level positions such as: Store Person, Checkout Operator, Shelf Filler, Office Cashier and Sales Representative. The highest skills demand in the Western Cape are for: Retail Manager, Retail Supervisor, Retail Buyer, Sales Assistant (General), Sales and Marketing Manager, Retail Buyer, Butcher, Confectionary Baker. From an e-retail perspective key occupations are: e-Commerce Manager, e-Commerce Planner, Web Integrator, e-Retail Managers, Call Centre Agent, Software Developers. The increase in the demand for e-retail occupations clearly indicates that “no longer just technical people – they now need to be both technical- and business-minded. This combination is difficult to find, and when they are found they are very expensive.” 4.4.2 Formal Education-Led Supply Chain Some key initiatives in the Western Cape are: TVET College / Retail Simulations Centres: This project is aimed at capacitating colleges to deliver W&RSETA programmes with a two-pronged purpose of fostering collaboration between institutions and the sector and to produce graduates that meet the needs of the industry. There is a centre at the College of Cape Town Masters and Doctorates: W&R SETA has partnered with CPUT for the development of retail qualifications within HEIs as well as providing support to masters and PhD bursary beneficiaries. Partnerships have been established with Stellenbosch University (which provides access to Bureau for Market Research), CPUT (which has seen the establishment of a W&R Research Chair) 4.4.3 Industry-Led Supply Chain Employers / Operator In House Training: Most of the large retailers have in house training programmes Industry Specific Academies & Colleges: An example of this is the Woolworths Food Academy39 Schools of Excellence: The W&RSETA’s partnership with Decorland, Boxer Superstores, FG Knight, Mass Discounters, and Mass Cash was created to establish schools of excellence. This collaboration enables the provision of learnerships and Wholesale and Retail experience to graduates, the placement of 700 graduates at these retail organisations. Vendor Package Training: All of the major platforms have online training courses, e.g. Amazon Services Training40. 4.4.4 Less Formal Supply Chain Digital Literacy Programmes: None were found Incubators and Accelerators: No retail specific incubators and accelerators were found; certain incubation complexes do, however, include Maker enterprises for example notably in the Woodstock Design District41. At the Woodstock Exchange, for example one Grandt Mason Originals, which uses luxurious fabrics from ends of rolls and swatch books to make one-off footwear, Chapel leather goods; and the factory shop for Honest Chocolate. Informal & Intuitive Learning: This clearly plays a leading role in the sector.

16
Special Purpose Programmes: For informal trading, the W&RSETA’s partnership with theDepartment of Trade and Industry (the dti) was created to help develop the informal trading sector. Work Readiness Academies: None were found. 4.5 Insights
It is clear that significant up-skilling and re-skilling are required in the large Western Cape retail and wholesale workforce. This would take place on three levels:
• Firstly, at the leadership skills level, operating across sectors including banking and financial services and transport to handle distribution requires high levels of convergence management, innovation and digital savvy.
• Secondly, high levels of product information across channels, suppliers and distributors easily available on mobile will escalate the need for high level sales skills rather than basic product and price knowledge. This would, for example, mean that the sales person is familiar with the range and pricing of similar brands on the internet and is aware of what social media, blogs and celebrity tweets are saying about the product or brand.
• Thirdly, since all forms of buying and selling (C2C, B2C, informal and micro businesses) would rely on platforms (Gumtree, Facebook, Instagram) ultimately linked to mobile, mobile-based digital entrepreneurship skills are a universal need.
• A process of “downwards trickling” of needs for digital skills is evident, where the most basic occupations now require digital literacy. These jobs are also most threatened by automation, robotics and integrated inventories and supply chains. Even the job of the famous cashier at the checkout counter is likely to be supplanted. As thousands of jobs and livelihoods are at stake, a large-scale digital upskilling programme is indicated for the Western Cape.
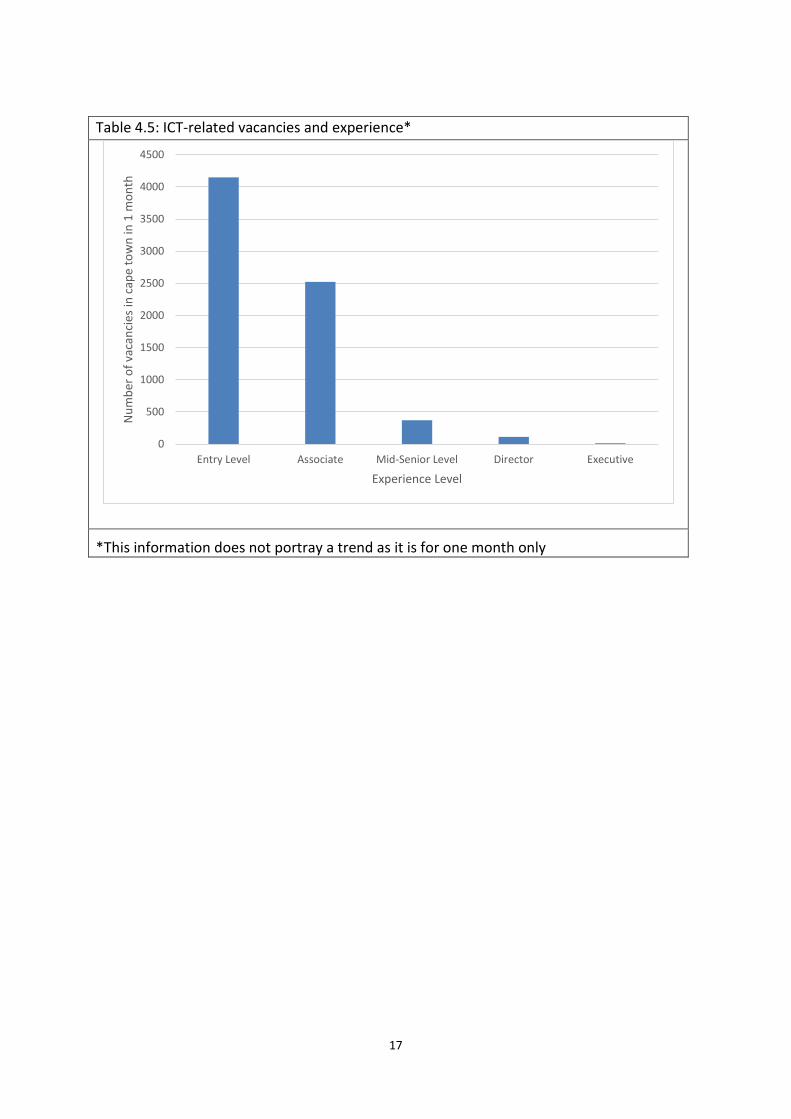
The needs at entry level correlate well with the IT Industry picture, as presented in Table 4.5.
17
Table 4.5: ICT-related vacancies and experience*
*This information does not portray a trend as it is for one month only
0
500
1000
1500
2000
2500
3000
3500
4000
4500
Entry Level Associate Mid-Senior Level Director Executive
Num
ber o
f vac
anci
es in
cap
e to
wn
in 1
mon
th
Experience Level

18
SECTION 5: BUSINESS AND FINANCIAL SERVICES SECTOR ANALYSIS
5.1 Introduction The Business and Financial Services sector in the Western Cape is fully integrated into the global economy and is playing a leading role in Sub Saharan Africa both as a financial centre and as a services export hub. As a major contributor to growth and employment, digital skilling in this sector is vital to the prosperity of the province. 5. 2. Sector definition Business services are a general term that describes work that supports a business but does not produce a tangible commodity42. The scope of business and financial services is vast, and includes Business Process Outsourcing services, consulting services, customer services, human resources services, cleaning, patronage, repair and maintenance services, dispute resolution and prevention services, it services, security services and financial services. Financial services include accountancy, banks and building societies, real estate, stock brokerages, tax services, valuation, risk management and insurance. 5.3 Overview of the landscape and dynamics 5.3.1 Growth and employment dynamics Globally, financial services are the third most profitable sector globally, delivering an estimated net margin of 17, 14% in 201643. Employment in the services sector in the Western Cape rose by an average of 2, 7 per cent per year between 2011 and 2016. The national GVA contribution of Services SETA-related sectors in 201644 was as follows: Professional Business Services: R 324 billion Business Activities: R 93 billion Community, social and personal services: R 92 billion Total: R 509 billion The services sector is the Province’s biggest employer and added the most jobs to the provincial economy (64 per cent of the jobs created from 2011). In 2015, the finance, insurance, real estate and business services sector made the largest positive contribution to economic growth to all districts. The sector therefore remains a key contributor to the economic well-being of the Province45. 5.3.2 Companies / role players / industry bodies The sector is dominated by multi-national and national vertical corporations that provide financial services (Old Mutual, Sanlam, ABSA, FNB) and consulting services (E&Y, Bigen, PWC, Deloitte, etc) that are well represented in the Western Cape. In 2012 Cape Town hosted 6 Global HQs of multi-national firms to Johannesburg’s 1446 . The highly rigorous Global Financial Centres Index47 of 2018 ranked Cape Town Cape Town highest as a financial centre in Sub Saharan African raking 38th globally, well ahead of Johannesburg at place 57.

19
Around a strong globally connected and integrated core of multi-national firms are a well-established network of professional medium sized service companies in HR, legal, asset management professional and business process services as well as a plethora of small and micro enterprises that provides everything form niche and bespoke services in professional services, maintenance and security services. 5.3.3 Key drivers and technological change Cape Town is South Africa’s start-up hot spot with triple the number of start-ups compared to Johannesburg with a much larger economy. Analysis by Endeavor Insight48 indicates that the Cape Town area tech sector includes between 450 and 550 entrepreneurial companies working in software development, e-commerce, or fintech. These firms are typically led by small teams of founders, averaging to about 1,7 cofounders per company. Cape Town has produced multiple firms that have stood out for their innovative breakthroughs and who have a strong global presence as a result. Clickatell, for example, developed the first mobile messaging API and was hired by the US State Department to send text message excerpts to global citizens during Obama’s 2009 speeches in Cairo and Accra1. The data mining firm BrandsEye is also known for its prediction of both the British exit from the European Union, and the outcome United States presidential election in 2016 Finally, what is perhaps the most obvious example of Cape Town’s impact in the tech sector is the internet giant Naspers, Africa’s highest-valued tech company and a massive tech investor on a global scale. Getsmarter, an Edutech firm that provides online certification courses in partnership with some of the world’s top universities, is another more recent example of these firms. Last year, the company was acquired by the Edutech giant 2U for $103 million, the equivalent of over R1 billion49. What makes the Cape Town area an attractive location for launching a technology company? Endeavour Insight asked local tech entrepreneurs why they chose to start their businesses in this community during the interviews conducted for the study. Results show that there are some characteristics of the city in particular that are highly valued by these entrepreneurs. The most commonly cited reason for launching a firm in the Cape Town area was a practical one: the area was where entrepreneurs were living when they first decided to start their companies. This rationale is actually common and has been seen in other cities studied by Endeavour Insight. What stands out is the recurring logic - many founders living in the area wanted to continue living there and start their business there for the quality of life and ecosystem. These factors often overlapped in the responses. As one founder noted “I was living in Stellenbosch at the time and it is an incredibly inspirational place to start a business.” Another founder responded that “it is the start-up capital of South Africa and I had just finished studying at UCT so it was a perfect match.” The second most commonly cited reason was the perception of Cape Town as a tech hub. One founder responded that Cape Town has an incredible tech and start up scene with creative and innovative minds because “people are willing to take a leap of faith and put themselves out there; it’s a great environment to feed off of from other entrepreneurs and start-ups.”

20
However, a major constraint observed in the Endeavour Research is lack of skills: “Access to talent was the most frequently cited challenge, with about 67 percent of 150 of entrepreneur respondents ranking it as a serious or very serious obstacle. The majority of respondents indicated that access to technical talent specifically was a serious or very serious challenge. One founder claimed that “our core strength is in our technology. Finding talented developers to help us build that technology, is a major hurdle.” The sector is undergoing three types of convergences: Firstly, the advent of global multi-sided platforms (MSPs) such as LinkedIn, Salesforce, Google, MasterCard and even Facebook are converging matchmaking and financial services at low cost that connects service providers, consumers, advertisers and value add services in instant time. This convergence directly benefits ecosystems of partners which provide value add, technology and intermediation services around the platforms. It also facilitates the Gig Economy: an environment in which temporary positions are common and organizations contract with independent workers for short-term engagements. The trend toward a gig economy has begun. A study by Intuit50 predicted that by 2020, 40% of American workers would be independent contractors. The implication from a digital skills perspective is that vast numbers of micro enterprises will require “self-help” digital skills support. This could take the form of:
• Local blended learning seminars and classes that support third party and vendor on-line training packages
• Peer learning seminars and workshops that encourage the building of fraternities in developing or implementing technologies, apps and platforms
• Developing local networking and matchmaking platforms of suppliers, producers and intermediaries to support local gig economies
Secondly, the Business Processing Industry BPO industry is converging typical back office administration services (the best example being call centres where the Western Cape has a global competitive advantage) which are concentrated to achieve economies and efficiencies of scale. Examples of this include Capitec, Sanlam and Old Mutual which have centralised their back office functions. Thirdly, Shared Services Centres (SSCs) are converging the full spectrum of business services under one roof to provide these services to one or more large enterprises. The Western Cape is second only to Gauteng in relation to both BPO and SSCs. In Table 5.1 Ernst and Young51 identify the following trends driving sector growth. Table 5.1: Trends Driving Financial and Business Services Sector Growth
Customer experience & value propositions
• Increased convenience and access to financial services • Improved knowledge of product offerings & ability to compare prices
– greater choice • Integration of banking into consumer lifestyles • More payment options enabling easier transactions
Optimisation of operations
• Increased efficiency and lower operational costs. • Ability to focus operations on customer service rather than back office

21
processes.
Nature of work • Enable staff to work anytime, anywhere • Increased customer centricity • Less staff focused on administration & back office functions
Internet of Things • Automated processes that trigger business rules and data analytics automatically.
• Branches and ATMs that self-monitor and report status automatically • Ability to measure customer behaviour and develop product offers
that respond to customised needs
Big data • Compliance and regulatory reporting • Risk analysis and management • Fraud detection and security analytics • CRM and customer loyalty programmes • Trade surveillance • Credit risk, scoring and analysis • High speed arbitrage trading • Personalised customer pricing & experience
Mobile connectivity • Mobile apps for consumers to carry out banking activities & manage their profiles and products
Artificial intelligence • AI Legal assistant • Monitor online searches to anticipate trends in demand
Automation, Robotics & 3D Printing
• Robotics process automation carries out routine and repetitive activities more accurately and quickly than a human. Main usage areas – audit, insurance claims approval, legal contract creation etc.
Ernst and Young found that the Western Cape is leading within the South African context in regard to innovation, managing disruption and mobile connectivity. The financial services sector specifically is “mature and sophisticated”. They do, however, identify the following imperatives for the Western Cape in regard to the businesses and financial services sectors:
Customer engagement: Digital device ownership generally requires that customers be engaged on their own terms across multiple channels. The millennial generation and the digitally savvy expect understanding and flexibility which means that they must be able to access all services online and be informed about what competitors offer. There is a high demand for trust and transparency New business models and operating models need to be developed. Typically, these are referred to as “agile” organisations which able to collaborate with or buy start-ups, attract and retain millennial talent (quote) and apply the principles of exponential organisations Predictive analytics: This cover a vast spectrum including financial security and fraud detection, recruitment, customer retention and acquisition and actuarial metrics.
The number of vacancies in the financial services sector per month for Cape Town is reflected in Table 5.2, which shows that the digital skills requirements are mainly data analytics, Big Data, cyber security, machine learning and cloud computing.
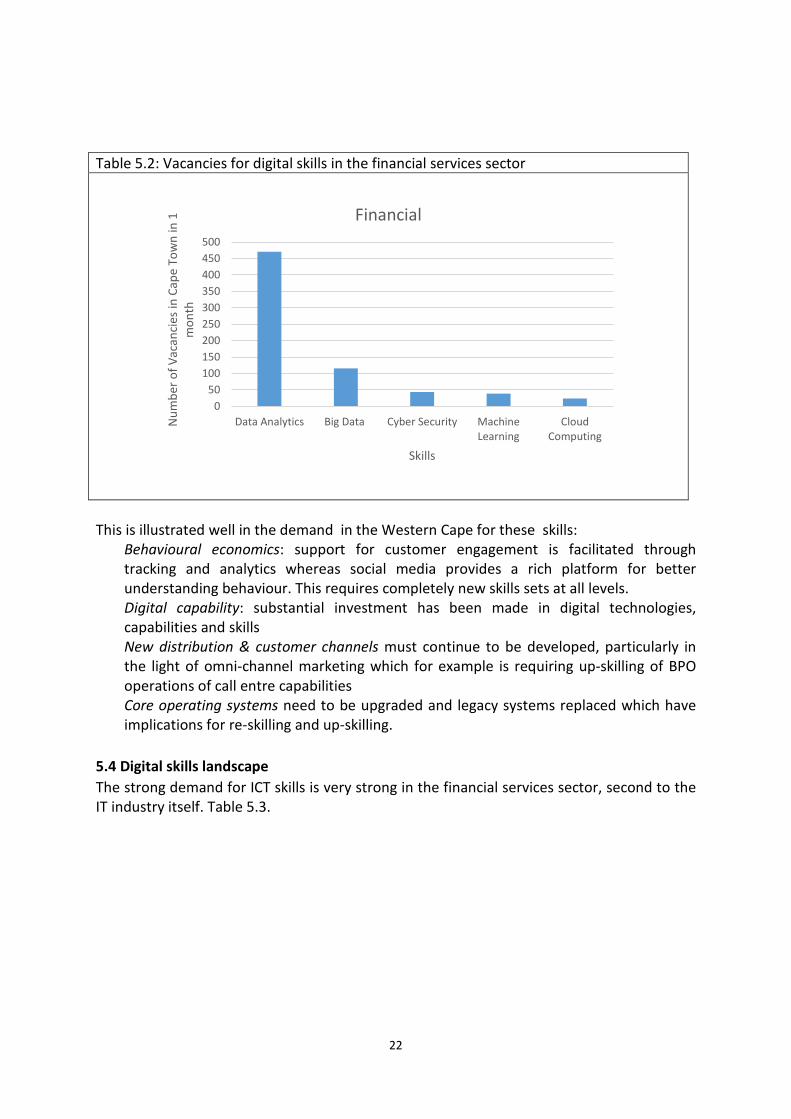
22
Table 5.2: Vacancies for digital skills in the financial services sector
This is illustrated well in the demand in the Western Cape for these skills:
Behavioural economics: support for customer engagement is facilitated through tracking and analytics whereas social media provides a rich platform for better understanding behaviour. This requires completely new skills sets at all levels. Digital capability: substantial investment has been made in digital technologies, capabilities and skills New distribution & customer channels must continue to be developed, particularly in the light of omni-channel marketing which for example is requiring up-skilling of BPO operations of call entre capabilities Core operating systems need to be upgraded and legacy systems replaced which have implications for re-skilling and up-skilling.
5.4 Digital skills landscape The strong demand for ICT skills is very strong in the financial services sector, second to the IT industry itself. Table 5.3.
050
100150200250300350400450500
Data Analytics Big Data Cyber Security MachineLearning
CloudComputing
Num
ber o
f Vac
anci
es in
Cap
e To
wn
in 1
m
onth
Skills
Financial

23
Table 5.3: ICT related vacancies per sector
5.4.1. SETA-led initiatives The Services Sector SETA SSP52 has performed an analysis of the change drives and skills demand in the sector, and identified the following skills needs in regard to ICT:
• Due to high levels of product information on the web, estate agents need to have skills in brand management, digital sales, marketing and social media
• Big data demands higher level of analytical skills • Computer generated outputs enhance the capabilities of professional services • Social media and online research skills are important for all companies • The revival of postal services will involve the adoption of digital mail • Millennials are preferring omni-channel to voice, with implications for the call centre
business model. Upskilling of agents is needed The following digital skills gaps are identified by the Services Sector SETA, namely: Management (i.e. Database analytics, Social media); Data management (Technicians & Associated Professions); Graphic design (Experiential marketing); Clerical Support Workers (Computer literacy, Internet skills, Document management). Additional information: • Over the last 5 years the SETA supported 60 000 learners of which 9 427 completed
their learning pathways.

24
• The SETA has accredited 1 408 public and private Skills Development Providers with only 156 in the Western Cape.
• The SETA is working with the SAQA, the QCTO and the DHET on 11 new qualifications including Call Centre Manager.
• The SETA has entered into 186 Service Demand partnerships and 40 Skills Supply Partnerships including 4 TVETS and UCT in the Western Cape and has a Skills Development Centre in Beaufort West.
5.4.2 Government-led initiatives The Cape Innovation and Technology Initiative (CiTi) was established in 1999. Best-known for managing the Bandwidth Barn, a space for start-ups to grow and connect in Cape Town, CiTi also successfully runs several programmes in the skills and enterprise development space. The Genesis Community IT Initiative (G-CITI) aims to enable communities through access to broadband technology, to participate digitally for personal development and business development purposes and become a hub of activity for technological and digital development for the Elsies River and adjacent communities. In addition to wide range of services, the digital skills programmes and courses offered include: Computer basics, IC3 Digital Literacy, Microsoft Office, Pastel, IT Technician training and IT Web Specialist training . The Western Cape Government Broadband Initiative (WCBi) aims at co-ordinating and integrating government action to radically improve the provision of telecommunication infrastructure, skills and usage within the Province. The government connectivity project will see about 2 000 government sites, including schools, libraries and health facilities connected and ensure that by 2022, the province has a 10 Gbps fibre based backbone running through the entire province (both urban and rural). This will be rolled out via a strategic partnership between WCG, the State Information Technology Agency (SITA) and Neotel (Neotel was appointed via a competitive, public tender process). The contract has already been concluded in 2014 and the rollout has commenced. Interactive Community Access Network (ICAN) which are a multipurpose Community ICT Access and Knowledge Centres aimed at getting mass adoption of technology to improve people’s lives through facilitating ICT access, content and skills development. The aim is to expand this network by using an entrepreneurship model across the Western Cape, with the first Proof of Concept being delivered in Elsies River, a community in the Cape Flats. An ICAN centre is a physical facility containing various focused interactive zones. The focused zones are: ICAN Learn, ICAN Study, ICAN Communicate, ICAN Create, ICAN Play. Through the ICAN project communities will be able to access digital literacy and e-educational and blended learning opportunities. A schedule of subsidised training will be available through the ICAN centres, including accreditation/ certification of certain courses. Training opportunities will range from basic e-literacy to application development and video productions. Public Access Wi-Fi Hotspots: provide limited free internet access to citizens, Wi-Fi hotspots are being installed at specific government buildings, offering access to online government

25
services, m-training, job portals and the Internet. This is a partnership with Neotel and was negotiated as part of the contract that is connecting almost 2 000 Provincial Government sites. A total of 384 hotspots will be set up across the province, with each citizen receiving a free allocation of 250MB per month. The project aims to develop a model for the sustainable provision of public Wi-Fi. Public Internet Competition: The aim of the Wi-Fi competition is to stimulate the use and adoption of technology through a quarterly competition as well as market the Internet. The competition has 2 components, namely: 1) the development of new ideas and innovations using technology and the internet and 2) uplifting stories from the 36 communities describing how the Internet has positively impacted lives. Internet Champion Programme: To ensure that digitally marginalised citizens are able to optimally use the Internet and to drive the adoption of technology and develop basic skills, Internet Champions will be stationed at the public access Wi-Fi hotspots to introduce the general public to the Internet, and offer basic usage guidelines. Connected Household: The aim of this project is to address the critical shortcoming of last mile access to affordable, high quality broadband in South Africa, particularly in middle- and low-income areas. E-Skills Platform: This is a collaborative project between DEDAT’s Broadband unit and Skills Development unit in order to improve skills development, support a vibrant and innovative e-content cluster, and drive broadband usage in the Western Cape. The platform incorporates a Skills Intelligence Platform to foster collaboration between relevant stakeholders; a Learning Management System to deliver e-learning content and courses; a Career Awareness Platform to match interests and skills to career paths; and a Content Publishing Platform that acts as a marketplace between creators and users of content. Key considerations include identifying gaps in the content creation ‘ecosystem’ and designing appropriate government interventions. Intellectual Property Management for Digital industries: Associated to the e-skills project and its goals around content stimulation are issues related to Intellectual Property protection within digital industries. Broadband for Business Toolkit: This project aims to develop a targeted campaign and incentive package to increase the awareness and benefits of broadband in order to improve business competitiveness through the uptake of broadband. Business Broadband Purchasing Collective: Research suggests purchasing collectives can yield economies of scale and improve uptake, as they bring together clusters of buyers and facilitate investment in infrastructure, particularly for bandwidth intensive industries. The Department will assist the East City design precinct to set up a purchasing collective to facilitate fibre-to-the-premises in this district. E-centres: The City of Cape Town is establishing e-centres, which ensure that residents, including those in townships, also receive broadband so that they too can be in the information superhighway of the mainstream economy. 5.4.3 Formal Education-led supply chain The formal educational infrastructure of 4 universities and 5 TVETs in the Western Cape is highly developed with business schools (UCT GSB, SBU) that rank well globally. It is outside the scope of this report to

26
5.4.4 Industry-led supply chain Employers / Operator In House Training All major national and multi-nationals have well-developed internal digital skills training programmes. Industry Specific Academies & Colleges: Various colleges and entry exams exist for most of the professions. Partnership-led initiatives: The Cape Digital Foundation: Aims to initiate, co-ordinate and drive the implementation of initiatives aimed at stimulating the usage and uptake of broadband services across all aspects of society. The foundation will be independent and neutral, comprising diverse stakeholders from government, academia, business and civil society, and therefore will help to address social issues through broadband in a unified way. 5.4.5 Business-led initiatives The Digital Venture Build programme (launched September 2018) is a six-month blended learning programme that provides entrepreneurs with online resources and on-site workshops to build a working prototype for a digital business. Participants of the programme will be able to apply for software development rewards valued at up to US$15,000 each. These software development rewards, which are offered as part of its Project Programme Rewards, will enable aspiring entrepreneurs to work with a full software development team to build and launch their digital ventures. BPESA: Over the past years the BPO sector53 has seen significant success in the continued implementation of the skills strategy, including: • The initiation of the BPO Skills Forums across the country • The formulation of a BPO ‘Future-skills’ framework • The Training of 175 young unemployed work-seekers in the Western Cape to prepare
them for access to the BPO Sector by providing work readiness training and a 12 month learnership. This initiative is being funded by the City of Cape Town, DEDAT, and EOH
• The training of 20 potential team leaders in the Western Cape to build individual knowledge and competence related to operational efficiency to positively effect change within the environment through managing team performance efficiently and effectively. This programme is also being funded by the City of Cape Town.
• The adoption of key elements of the BPO skills supply chain across all regions. • The collaborative effort of Government and Business to lobby support for the
acceleration of youth employment and the up-skilling, re-skilling and future-skilling of the work force.
• The adoption of the Programme Office model into BPESA to support strategic skills programmes across the country
• The forming of a relationship with the Y.E.S – Youth Employment Services campaign. • The participation in a co-design process with the University of the Western Cape for the
development of an interdisciplinary postgraduate diploma with specialisation in Data Analytics and Business Intelligence. This was a collaborative initiative between UWC, BPeSA, BPO agents niche data analytics companies

27
Vendor Package Training A good example of vendor package training is the Salesforce Trailblazer Certification Training Bundle. It includes eight in-depth courses and over 65 hours of video lessons. Lifetime54 access to the training is available for only $29.99. 5.4.6 Less Formal Supply Chain Digital Literacy Programmes: No formal training programmes identified Incubators and Accelerators: The Khayelitsha Barn: The Barn is an ICT incubator which was established in Woodstock and has successfully supported ICT SMME’s for the past 15 years. To capitalise on its success, the Community Barn in Khayelitsha has been developed as a proof of concept to test the model in a different community environment. The Barn provides an integrated set of interventions and programmes that assist ICT entrepreneurs from idea and concept phase, through business plan development and growth towards a stable and sustainable business that is able to create employment and generate economic wealth. Design Technology Centre: this will provide a physical space to test, model, prototype and develop broadband-enabled products and services, allowing evaluation of potential commercial and social value. This centre aims to improve the competitiveness of broadband-enabled businesses. This centre will form part of the Design Park, which is a project run in collaboration with the Design Sector/Fringe project. Think Rise situated in Woodstock Exchange in Cape Town part of Barclays Rise network that operates FinTech hubs around the world, where cutting-edge start-ups and scale-ups can connect, create and scale their businesses, backed by Barclays' global network of industry experts, mentors, investors and partners. Entrepreneurs located at hub get unparalleled access to mentorship, insights, guidance and world class facilities to accelerate their business. Work Readiness Academies: A good example of many academies is the following: The ASISA Academy55 for collective investment schemes, in partnership with UCT, runs this existing Academy CIS Bootcamp as an officially endorsed UCT Short Course (non-credit bearing). It is offered as a five-day course in Cape Town and Johannesburg. The course was developed in collaboration with a group of industry professionals in order to support new and existing members of investment administration, retail and compliance teams within investment management firms and CIS management companies. 5.5 Insights In the light of the complexity and diversity of this sector and the appearance of completely new products and industries within short time cycles (e.g. cryptocurrency) it is difficult to imagine how a formalised programme or institution with accredited qualifications could keep up with digital skills needs. The solutions may rather lie in developing a culture of innovation and supporting the ecosystem through accelerators, incubators and special up skilling programmes like bootcamps and master classes.
28
The highly sophisticated business and financial services firms operating in the Western Cape will continue to cater for their digital skills needs in their efforts to remain relevant in a highly competitive landscape. They will do this through a mix of in-house, hands-on and on-line training as well as through purchasing successful fin-tech start-ups in order to be agile. Unless university-linked incubators are established, it is unlikely that universities or TVETs could keep up with the pace of skilling, up-skilling and re-skilling required. Even the smaller and medium sized firms are easily able to access cheap on-line platform training packages. The overwhelming demand for data analytics skills, and it’s key role in all aspects of digitalised value chains suggests that the Western Cape needs to pay strong attention to this need, not least since it involves a strong formalised education element in the form of advanced statistical analysis (which will eventually be supplanted by AI but will still probably require high level appreciation of the mathematics). Support for Chairs of Data Analytics at universities and setting up of a university-supported data analytics incubator are indicated.
29
SECTION 6: TOURISM DIGITAL SKILLS SECTOR ANALYSIS
6.1 Introduction The tourism sector is highly digitalised and a key contributor to the Western Cape economy. The sector is at the leading edge of digital innovation and disruption and is obliged to be globally competitive. The development of digital skills in this sector is therefore of paramount importance. 6.2 Definition of the sector The UNWTO56 defines tourism as "…the activities of persons traveling to and staying in places outside their usual environment for not more than one consecutive year for leisure, business and other purposes."57It embraces the tourism value chain which includes international tour agents and operators (inbound and outbound), accommodation establishments, air and ground transport and a myriad of local enterprises from local operators to tour guides, restaurants, curios, natural attractions, conferences and many more. From an economic perspective we can also talk about tourism as the intersection of the visitor economy (overall demand and supply in all the sectors within which visitor activity and its direct and indirect consequences upon the economy) the leisure economy (what people do in their free time) and the experience economy58 (the value added to all economic activities by the experience that they generate). 6.3 Overview of the landscape and dynamics 6.3.1 Economics Tourism remains one of the world’s largest and fastest growing economic sectors. The UNWTO59reports the highest growth in international tourist arrivals in seven years since 2010. International tourist travel worldwide is projected to increase nearly 70% by 2030. The contribution to GDP growth is expected to be 4.3% in the Western Cape60 . The tourism sector is particularly successful within the Western Cape and is one of the largest employers in the region. It has been a large recipient of FDI over the last 10 years61and it is highly impacted upon by the digital economy and the Fourth Industrial Revolution. Cape Town International Airport (CTIA) surpassed the 5 million arrivals mark for the 12-month period to June 2017 and demonstrated excellent growth, recording 25% growth year-on-year62 The two main source markets are foreign and domestic tourists which are of comparable size63but with the highest technological sophistication and product expectations obviously in regards to foreign tourists. International tourism has picked up with an increase of 10 per cent in international arrivals in the Province between 2016 and 2017. In addition to contributing to the foreign spend in the Province of R23.1 billion in 2017, just over 11 000 jobs were created in the sector in 201764. As a meetings, incentives, conferences and events (MICE) destination, Cape Town hosts 58 major conferences annually which will grow with the expansion of the Cape Town International Convention Centre (CTICC) and the completion of the Century City Conference
30
Centre. South Africa’s leading tourism attraction, the V&A Waterfront achieved 24 million visitors in 201665. Cape Town is well-established as an iconic global destination and will leverage a strong share of global and domestic tourism well into the future. Some recent awards66 include: 2018: • One of the top 10 surf cities in the world by Surfer. • Number one city in Africa for business tourism events by the International Congress and
Convention Association (also in 2017) 2017 • Three Cape Town breweries top the South African list for the best locations to visit
across the world by travel experts Lonely Planet • Featured in Fodor’s Go List 2017 • Western Cape voted Golf Destination of the Year, 2017, Africa and Gulf States (IAGTO –
International Association of Golf Tour Operat • Number one city globally for tattoo affordability and studio availability according to the
YEAY App and Global Tattoo Index. 6.3.2 Policy aspects The South African government has prioritised tourism through the creation of a stand-alone National Department of Tourism (NDT) and a National Tourism Sector Strategy (NTSS). The Western Cape has prioritised tourism through its Project Khulisa growth strategy. The goal is to add up to 100 000 additional jobs to the tourism sector. The City of Cape Town has a multi-year Tourism Development Strategy67 6.3.3 Companies / role players / industry bodies Leading investors in the Western Cape’s hotel sector include the Rezidor Group, Taj Hotels, Starwood Hotels, Hilton, Marriot who have acquired the Protea Group, Tsogo Sun and Bon Hotels. WESGRO More than 15 000 accommodation units are now listed on Airbnb for Cape Town. In addition to major players such as Thompsons, BidVest and Hylton Ross there are literally hundreds of tour operators in Cape Town, covering a vast range of markets, tastes and experiences. Some 658 tour operators are listed in South Africa by safarribooking.com68 and Cape Town Tourism had 1 290 members in 2017 and was experiencing strong growth. The most important industry bodies include Cape Town Tourism, WESGRO, SATSA, Tourism Business Council of South Africa and Tourism Departments at national, provincial and City level. 6.3.4 Key drivers and technological change The following are drivers of disruptive transition in the tourism industry:

31
The emergence of multi-sided platforms (MSPs) that integrate all aspects of the value chain is the key driver of change. “Large sales forces are becoming less relevant as providers advertise information & engage with stakeholders/the market remotely on digital platforms…a different set of skills …is needed with this shifting focus from physical to digital channels” 69. Examples of customer-facing tourism MSPs include Expedia and TripAdvisor that support the independent traveller using on-line booking. Only 22% of visitors to South Africa make use of traditional travel agencies and just 10% consult hardcopy media. Many more visitors to SA book directly through vendor sites (33%) or online travel agents70 Other platforms are designed for tourism businesses: • TrekkSoft is used by thousands of tour and activity companies in 130+ countries and
connects to distribution channels like Viator and Expedia and resellers. • TP Connects allows travel agents to access rich content that includes videos, pictures,
and personalised preferences both in the B2B and online channels with air, hotel, car, transfer, insurance, rail, cruise, and dynamic holiday packaging.
The digitalisation of all facets of the value chain enables very high levels of tracking, personalisation, customisation and engagement. This has supported fundamental changes to business models as product platforms such as Uber disrupt the ground transport industry and Airbnb disrupts the accommodation industry. The rise of the ‘DIY’ (Do it yourself) traveller71 is supported my mobile technology proliferation which allows instant access to self-service channel bookings supported by high levels of content aggregation. Companies are able to extend their involvement in customers’ trips by regularly tracking their activity and communicating with them, expanding the opportunities to provide further services and build customer relationships72 and can monitor customer feedback, receiving current & future financial indicators using predictive software. As travellers can share experiences instantly their reviews and ratings are making product performance instant and transparent. This highly visible marketplace demand highly responsive engagement. Premier Hotels & Resorts’ Group Marketing Manager, Christa Badenhorst73, shares the following forecasts for the year ahead: “Globally, the number of people using mobile messaging apps is expected to increase from 1.82 billion in 2017, to 2.01 billion in 2018. With more and more people using apps like Facebook Messenger, WhatsApp and Snapchat, marketers are following suit to raise brand awareness, distribute content, advertise, generate leads, drive sales and conduct customer service…Artificial intelligence (AI) enables marketers to use user web-browsing behaviour information in their marketing efforts. Now that AI tools have become more affordable and accessible, more businesses will be utilising them to enhance pay-per-click ad campaigns, suggest social media content for better engagement, provide a highly personalised
32
experience to website visitors and enable customer support via chatbots - to name but a few capabilities”. In sum, the following transitions are underway in the tourism industry: • From mass markets to niche markets • From one size fits all to personalisation: accurate understanding through customer
analytics and engagement • From vacation packages to self-service in key segments • From brochures and websites to video and virtual experiences • From expert and media review to social media review • From selling of products (outbound marketing) to two-way engagement (inbound
marketing) • From traditional products to digitalised products • From a tourism value chain to an experience value chain that is more complex,
orchestrated, personalised and diverse • From booking engines and websites to multi –sided platforms • From desktop interfaces to mobile interfaces 6.4 Digital skills landscape Generally speaking there is little formal education led training for digital skills in tourism. The Tourism Human Resource Development Strategy Development & Skills Audit Study74found very low, unacceptable levels of computer literacy at all levels, as well as high levels of unemployment for TVET graduates in tourism and a mismatch with employer needs. The CATCHSETA was found to be ineffective. 6.4.1 Formal Education-Led Supply Chain Since much of the tourism value chain involves standard business and IT qualifications, tourism-specific qualifications are relatively limited. The following have been identified: • BTech Tourism Management: CPUT The purpose is to equip learners in interpreting,
formulating and implementing advanced event strategic and event leadership strategies for the sustainable development of the event industry
• National Certificate Tourism: False Bay College. This is a new tourism qualification at each of Levels 2, 3 and 4 of the NQF. This qualification is designed to provide both the theory and practice of tourism. The digital aspect is the vocational subject “Tourism Operations and Technology”
6.4.2 Industry-led supply chain Few if any tour guide training courses offer mobile technology training eg. See Tour Guide Training Institute75. Employers / Operator In House Training: As with all major global companies, major hotels and tour operators will have in-housetraining programmes on their booking and inventory management systems. Industry Specific Academies & Colleges: The CATHSETA accredits tour guide training. All tourist guides need to register as a Tourist Guide (Tourism Act 3, 2014). Registered guides
33
are bound by the Tourism Act which requires them to be suitably qualified and to act professionally. Having completed an accredited tourist guide training course, guides must register with the Tourist Guide Registration Office of DEDAT. Courses offered in Cape Town include Cape Academy of Guiding Services, Benguela Tour Guide Training, Tourist Guide Institute, Livingstone Tourism Academy, Cape Academy of Guiding Services and SATSA. Few if any tour guide training courses offer mobile technology training eg. See Tour Guide Training Institute76 For example, Southern Africa Tourism Services Association77 (SATSA) is offering Introductory Training for Tour Operators for 5 consecutive days (week days) without a digital skills module. Cape Town has a number of leading hotel schools, including the International Hotel School, the Private Hotel School, the IHT Hotel School, CPUT Granger Bay Hotel School and the Capital Hotel School.
Vendor Package Training: A good example is the Udemy78 which for only R 110 offers an online TripAdvisor training course covering TripAdvisor best practices, ZMOT or Zero Moment of Truth in Travel Marketing, submitting a travel business to TripAdvisor, using TripAdvisor Forums to win more guests, best practices for implementing TripAdvisor marketing tools in a website and paid and free TripAdvisor marketing tools. Course entry requirements are to have a travel business or plans to start a travel business, to have a website and be “Internet Savvy.” 6.4.3 Less formal supply chain Work-readiness academies The Tourism Bootcamp79 by the PG Tops group aims to bridge the skills gap for unemployed youth in order to facilitate their entry into the industry. They leverage the consultant and training resources within PG Tops and Luxury Safaris with four weeks of theory work followed by two weeks of practical mentorship at industry partners. The Khwela Academy80aims to teach previously disadvantaged female students through an internally Swiss accredited online learning platform, three-week overland trip through the country and a five-month paid internship. Students are learning in real time, and have to solve scenarios and challenges in small groups to promote peer-to-peer learning. Students are then placed with reliable companies where they will intern and experience working while gaining more experience. The Academy is supported by the Department of Economic Development and Tourism and the Jobs Fund. Digital Literacy Programmes: We have not been able to identify any in the tourism space. Incubators and Accelerators: We have not been able to identify any in the tourism space. Informal & Intuitive Learning: This is clearly the core learning channel for the Internet Savvy Special Purpose Programmes
34
6.5 Insights The highly sophisticated global and national hotel chains operating in the Western Cape will continue to cater for their digital skills needs in their efforts to remain globally competitive and capture global and nationally sophisticated market segments. They will do this through a mix of in-house, hands-on and on-line training in order to retain market leadership and keep pace with innovation in omni-channel marketing, on-line booking, CRM and travel aggregation platforms. They will have few other choices given the pace of innovation and a product cycle that will often be less than 12 months from one platform variant to another or from one less competitive to another more competitive platform (or platform convergence). Of concern are the smaller and medium sized tour operators and tourism product owners who more will often be black-owned or community-based. For these players the following observation made in Australia81 in 2015 would be true of the Western Cape today: “The reticence of small business operators to learn digital techniques is steeped in ignorance and fear. They do not know what they do n0o know about how the travel purchase cycle can be optimised by digital practices and they fear the perceived complexities and time required to make advancements in the digital space.” A key requirement in all tourism companies: global, big, medium and micro is the need for social media skills. Even the largest companies are building internal social platforms and the digitally savvy tourist will expect to be able to engage at all levels through social media to ascertain the authenticity of the enterprise. The necessity for these skills is also underscored by the high value given to previous customer ratings and experiences. An agile and responsive social media capability is fundamental to responding to legitimate and illegitimate negative commentary for the biggest and the smallest tourism companies. Whereas traditional tourism training has focused on the history, geography, landmarks and attractions of places, this knowledge is now highly challenged by the capabilities of search engines offering a deeper, more nuanced and media-rich content. Likewise, is itinerary planning now being supplanted by personalised matchmaking, content aggregation and on-line booking platforms. Tour guides and front-line staff would now be better trained in fluency of internet research, rich media presentation skills and social media. This presents a major up-skilling challenge at all customer-facing level in the industry, from the hotel concierge to the tour guide.

35
SECTION 7: ANIMATION
7.1 Introduction Animation is used in the mediums of television, films, commercials, training and education, 3D visualisation, the corporate environment, marketing and other creative environments. Animation is also used in the creation and design of games for PCs, internet, mobile and gaming consoles, not excluding Virtual and Augmented Reality, which are regarded as new technologies. Within the context of an increasing global population coupled with faster internet access, technological advances and the use of mobile phones, the animation industry is growing exponentially in developed countries. Unfortunately, from a comparative perspective the South Africa is very small. Economic and performance indicators have been included in this report. New media is a term being used to describe Animation and Gaming as globally relevant industries.82 Gaming, film animation and media all form part of the concept of ”new media”, and for the purposes of the descriptive overview, the three sectors of film and media, animation and gaming will be differentiated. 7.2 Sector definition The definition of film and television by the National Film and Video Commission (NFVF) is closely aligned to the DTI’s classification of qualifying films in line with the South African Film & Co-production Incentive, which includes: Feature films; Documentaries; TV series (including broadcaster commissions); TV films (including broadcast commissions); Animation series; Shorts films; Animation83 Animation may be defined as the creation of moving pictures or images with the help of technology and/or animation software. Visual Effects (VFX) (which is a major segment of animation) refers to the creation of special effects and realistic environment in films by combining real-life images with animation using specialised software. 7.3 Landscape overview and sector dynamics Although South Africa’s animation industry is small, it is well developed in terms of quality service and work effort. The South African industry typically comprises of 2D, 3D and VFX content development for the broader animation sectors including television, advertisements, films, short form and interactive media and games 84. From a business and funding perspective, the South African animation industry is centred on a “project-by-project” basis with conditional funding from government. Besides being an impediment to the development of the industry, most large companies involved in the animation value chain are unable to employ all staff on a full-time basis. Most staff members generally are freelance contract workers. Due to difficulty in obtaining local funding, animation companies are more inclined to seek work from large organisations abroad, such as BBC, Warner Brothers, Disney and Netflix. Animation and gaming companies
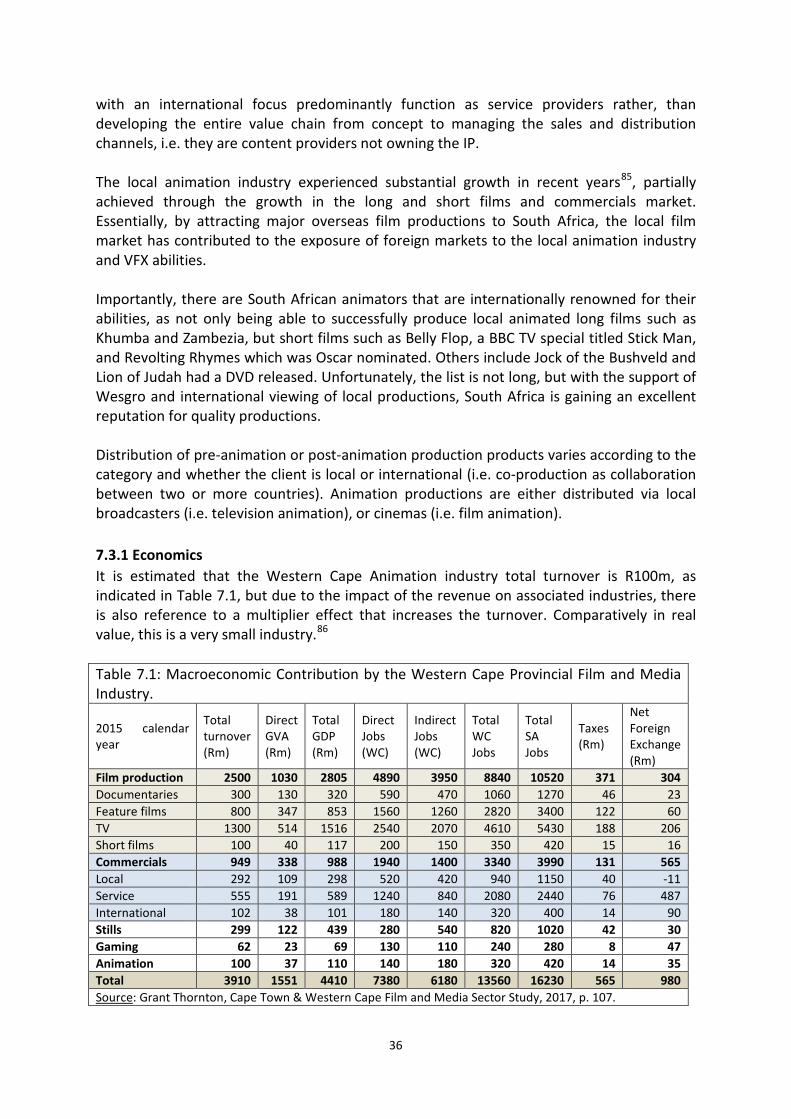
36
with an international focus predominantly function as service providers rather, than developing the entire value chain from concept to managing the sales and distribution channels, i.e. they are content providers not owning the IP. The local animation industry experienced substantial growth in recent years85, partially achieved through the growth in the long and short films and commercials market. Essentially, by attracting major overseas film productions to South Africa, the local film market has contributed to the exposure of foreign markets to the local animation industry and VFX abilities. Importantly, there are South African animators that are internationally renowned for their abilities, as not only being able to successfully produce local animated long films such as Khumba and Zambezia, but short films such as Belly Flop, a BBC TV special titled Stick Man, and Revolting Rhymes which was Oscar nominated. Others include Jock of the Bushveld and Lion of Judah had a DVD released. Unfortunately, the list is not long, but with the support of Wesgro and international viewing of local productions, South Africa is gaining an excellent reputation for quality productions. Distribution of pre-animation or post-animation production products varies according to the category and whether the client is local or international (i.e. co-production as collaboration between two or more countries). Animation productions are either distributed via local broadcasters (i.e. television animation), or cinemas (i.e. film animation). 7.3.1 Economics It is estimated that the Western Cape Animation industry total turnover is R100m, as indicated in Table 7.1, but due to the impact of the revenue on associated industries, there is also reference to a multiplier effect that increases the turnover. Comparatively in real value, this is a very small industry.86 Table 7.1: Macroeconomic Contribution by the Western Cape Provincial Film and Media Industry.
2015 calendar year
Total turnover (Rm)
Direct GVA (Rm)
Total GDP (Rm)
Direct Jobs (WC)
Indirect Jobs (WC)
Total WC Jobs
Total SA Jobs
Taxes (Rm)
Net Foreign Exchange (Rm)
Film production 2500 1030 2805 4890 3950 8840 10520 371 304 Documentaries 300 130 320 590 470 1060 1270 46 23 Feature films 800 347 853 1560 1260 2820 3400 122 60 TV 1300 514 1516 2540 2070 4610 5430 188 206 Short films 100 40 117 200 150 350 420 15 16 Commercials 949 338 988 1940 1400 3340 3990 131 565 Local 292 109 298 520 420 940 1150 40 -11 Service 555 191 589 1240 840 2080 2440 76 487 International 102 38 101 180 140 320 400 14 90 Stills 299 122 439 280 540 820 1020 42 30 Gaming 62 23 69 130 110 240 280 8 47 Animation 100 37 110 140 180 320 420 14 35 Total 3910 1551 4410 7380 6180 13560 16230 565 980 Source: Grant Thornton, Cape Town & Western Cape Film and Media Sector Study, 2017, p. 107.

37
7.3.2 Policy aspects In addition to the regulations and policy creation, the Cape Town City is responsible for all public location film permits and is continuously involved in the interaction with other government departments to ensure the permitting process is streamlined and efficient.87 A study on the Western Cape film and media reasons that the South African government’s incentive system requires improvement88, which implies a complete and detailed explanation of the incentive schemes, the benefits and criteria for eligibility. For example, the South African public sector incentives and supporting measures have become targeted towards BBBEE entities leaving the organisations either with no, or at best limited, public funding which restricts scaling of operations to any significant measure. The Film and Media Sector of the City of Cape Town is actively involved in supporting the City’s Economic Development and Tourism Department’s mandate. The City recognises the contribution of filming to the economic and cultural environment of Cape Town and therefore aims to facilitate a sustainable, film-friendly environment in all interactions with the industry. With regards to the Film and Media Sector the main focus is the regulation and policy guidelines around film and media activity within the City of Cape Town. 89 7.3.3 Companies, role players, industry bodies Currently, more than 30 active animation companies operate in Johannesburg, Cape Town (60% of the total), Tshwane and Durban, with a small group operating from East London and Port Elizabeth. There are 44 animation studios in South Africa and some of the key industry players90 are included in Table 7.2 below: Table 7.2: Key Animation developers in SA Sea Monster – Cape Town Sunrise (Lost Westlake) Animation Studios – Cape Town Triggerfish Animation – Cape Town Bugbox Animation - Johannesburg Luma Animation - Johannesburg Shy the Sun (Tulips / Chimneys) – Cape Town Mike Scott Animation – Plettenberg Bay Black Ginger – Cape Town Pixel Thieves – Cape Town Astral Studios - Johannesburg Wicked Pixels – Cape Town Blink Tower – Cape Town Mind’s Eye Creative - Johannesburg Studio Woo – Cape Town Lung Animation – Cape Town Source: Various internet sites and media reports Cape Town is the home of the largest animation studio on the continent, namely Triggerfish. The studio is involved with both local and international productions. The company currently employs 100 employees of whom the majority are on short-term contracts. Due to additional project work, the staff compliment will increase to 150 by December 2018. Animation South Africa, a non-profit organisation, has as its purpose to develop, promote and represent South African animation and VFX. It is mandated by industry to fulfil the role as the representative and industry body for animation in South Africa.91 Key associations in

38
South Africa’s film sector, which include animation and gaming industry bodies are listed in the Wesgro Film and Media study.92 7.3.4 Change drivers and dynamics 7.3.4.1 Key drivers Co-production project work from large international film producers is stimulating the local industry due to limited funding from government. To fill the skills gap when large projects are won, there is a tendency to outsource work to skilled people in other countries, or to import the skills for the duration of the project. Obtaining work permits for the latter arrangement is often a challenge. 7.3.4.2 Technological change Animators are expected to create both 2D and 3D animations using a variety of animation software programs, such as Maya 3DSMax, Flash, and Morpheme. However, software is constantly evolving and its licencing is expensive, but with the benefit of being exposed to the state-of-the-art trends. Furthermore, as the local animation and gaming industries co-operate with international companies, the derivative are knowledge-sharing about techniques and programmes. 7.3.4.3 Challenges and opportunities There is an urgent need to move away from a service industry mentality (project-to-project work and insourcing blocks of work from international companies) to creating content, owning the IP, and completing and owning the entire value chain.93 The Gaming, Animation and Film and Media industries appear to experience similar difficulties and face quite similar opportunities. The Grant Thornton survey94 gives an extensive breakdown of opportunities and constraints in its stakeholder interviews, which includes a SWOT analysis95 of the SA animation industry as presented in Table 7.3 from a document prepared for the Department of Arts and Culture96.

39
Table 7.3: SWOT Analysis on the SA animation industry
Source: Department of Arts and Culture. (2014). 7.4 Digital skills landscape Currently no separate statistical economic / employment data is available on the animation industry, as it appears these statistics have been aggregated from a few key surveys in other sectors. Despite the existence of institutions offering animation training coupled with companies’ internal training programmes, there are overarching observations within the industry that

40
students are in most cases not equipped to meet the demands of the industry. It seems as if industry role-players have a clear idea of which institutions can be approached for appropriately trained students.97 The consequence of skill shortages creates salary expectations higher than market benchmarking, resulting in the loss of valuable resources to other local industries and to international markets. Animation and the associated industries are high-risk environments due to: • Project-to-project work, generally on a short to mid-term contract basis. • Poaching of staff by the opposition with the incentive of receiving higher remuneration. • The general shortage of project funding due to competitive pricing of productions. • Outsourcing work of portions of the production value chain to individuals/organisations
in other countries; depending on the contractual arrangements, final editing and completion of the project may be done in South Africa,
• Additional staff is often in-sourced for short periods from African or other countries. This simplistic approach is a quick solution to a problem, but does not help in bridging the skills gap as the arrangement is contractual, knowledge sharing is absent, internships are not a priority and SETA skills planning is absent.
• Project-to-project work has resulted in a freelance work culture. • Recruiting suitably skilled staff becomes price competitive. 7.4.1 Skills suppliers Table 7.4 indicates institutions in SA offering training in animation design. Table 7.4: Organisations offering animation design Institution Programme Location Accreditation
The Animation School of South Africa.
3-year full time animation diploma. Specialises in animation and visual effects.
Cape Town Johannesburg
DHET. SAQA – NQF 6. Council of Higher Ed. MICT-SETA. Autodesk Authorised Training Centre.
Learn 3D
2D Concept Design; 3D Animation and Visual Effects & 3D Architecture / Design Visualisation 1 year Gaming Development Certificate.
Johannesburg No details.
Prestige Academy Bachelor of Applied Arts in 3D Animation. 2 year diploma in 3D Design and Digital Animation
Cape Town Pretoria
Dept of H Ed HEQC MICT-SETA
City Varsity – School of Media and Creative Arts
Diploma in Animation Diploma in Multimedia Design Other creative art courses
Cape Town Johannesburg
The website mentions accreditation but no details listed.
The SAE Institute of Animation.
BA in Motion Design and Animation (3 years). Higher Certificate in Animation and Visual Effects (1 year). Other creative art courses
Cape Town Johannesburg
DHET No further details.
The Wits School of BA Digital Arts Game Design Johannesburg University

41
Arts – Digital Arts. BA Hons in Digital Art MA in Digital Animation
accreditation
The Centre for Fine Art Animation and Design.
3-year course. Animation, graphic design and multi-media. Durban No further details
False Bay College – Public Animation Academy
2D animation. 1 year full time programme. Training on software programmes: Flash, After Effects, Illustrator and Photoshop.
Cape Town SAQA NQF 5
Source: Website search
7.4.2 Special initiatives (government, industry) 7.4.2.1 Government led Initiatives Wesgro (through their Film and Media Promotion Unit) has been mandated to provide marketing and promotional activities for the Film and Media Sector in the Province, whilst Wesgro, DTI, IDC and the Department of Arts and Culture continue to invest in the development of the national Film and Media industry. 98 7.4.2.2 Industry led initiatives SA Creative Services is a creative network where interested parties are able to job search, post articles, read articles by industry leader articles and readers have access to a selection of free creative tools to assist in career development. SA Creatives also provides creative services to corporates, small business and individuals looking to find suitable talent for projects. The Digital Canvas Academy provides classes for scholars during holidays with digital drawing skills, with the aim to inspire youth to enter the field of digital animation. Triggerfish plans to open a training academy in the near future which will offer internships and bridging courses so that new entrants will be equipped with suitable practical and theoretical skills. 7.4.3 SETA perspective The MICT-SETA Sector Education and Training Authority, was established in terms of the skills development act of 1998 and is responsible for skills development in the Advertising, Electronic Media and Film, Electronics, Information Technology and Telecommunications sectors and their sub sectors. Evident from the four different SETA bodies delineated to the animation industry99, it appears that there is no skills plan for Animation and Gaming, and at present no SETA caters specifically for training in animation production; where there is a directed SETA, the roles and functionality of this body are unclear and counterproductive. 7.4.4 Challenges, opportunities, requirements Referring to the value chain, in some instances the different stages of the process require specific job skills. The skills required range from unskilled to highly skilled, the latter referring to creative/artistic skills, editing skills, and business skills needed to convert technicians, programmers and artists into business owners100. Senior management skills (experienced people who have worked in different areas of the value chain) are also lacking in the animation industry according to both Triggerfish and Sea Monster CEOs.

42
It appears the areas of scarcity for most of the Film and Electronic Media occupations exists primarily in more technical roles specific to the sector and less on generic skills such as HR and Finance. Specialist areas include but are not limited to: Multimedia specialists, Graphic Designers, ICT programme developers / analysts / cloud computing / Network infrastructure, Script writers and concept artists, Senior managers, Digital/editing technicians, Visual effects compositors, Sound engineers, Project Managers, who have experience in the details of the value chain / Agile and Scrum Masters, Drone operators requiring the skills of a pilot but also need to have the insight of an experienced camera person, Special effects artists. Due to the quality of the SA animation productions, which are directly linked to the skills within the companies, experts confirmed regular invitations to relocate the company to places like Madagascar, Canada and New Zealand where more favourable government support and rebate/incentive programmes are on offer.

43
SECTION 8: FILM AND MEDIA
8.1 Introduction The rapid evolution of the digital era continues to impact South Africa. The Internet, mobile technology, and telecommunications sectors have been experiencing rapid growth over the past few years, directly influencing the broader Media / Entertainment, Information, Communications and Technology sectors. Collectively, constantly evolving innovation presents consumers with a diverse range of choices that are, inadvertently creating preferences that drive more change. This convergence of technological innovation is influencing consumer demand. The sale and distribution of printed matter is slowly being replaced by on-line purchasing and consumption. The media in the form of Amazon (not only as a book supplier but as a global web service), Apple, Showmax, Netflix, DSTV are forms of on-demand entertainment. The popular website Spotify offers free on-line music streaming, and Facebook and other social media platforms continue to affect the world in which we live. These examples all resort under the heading Media. New media is a term being used to describe Animation and Gaming as globally relevant industries.101 The commonality is that technology is driving change across these media channels. 8.2 Sector definition What is the media? TV, print, radio, blogs, email newsletters, social media, tweets, on-line sources, websites, app alerts, text messages, gaming, animation, advertising and so it goes on! An Oxford dictionary definition of the media (singular or plural) is; the main means of mass communication regarded collectively. For the purpose of this study, the overview focuses on Film and Media for the following reasons: • The industry is technology driven (demanding specialist technical knowledge; artistic
ability and tools; the use of diverse methods such as special effects which requires different types of software depending on the application).
• The Film and Media Sector is defined not only as feature films but also as television series and documentaries, commercials, Stills photography and so-called ‘new media’, such as animation and interactive computer games102.”
• The significant economic and employment contribution to the Western Cape, more so Cape Town.
• The industry can be pivotal to the positioning of the Western Cape as a knowledge-based / digital Province thereby increasing the contribution to national economic growth and development.
• Media convergence as a summation of the above: “Refers to the interlinking of computing and IT, communications networks, media content enabled by the internet and digital media technologies, and the convergent products, services and activities that has emerged as a result103.”

44
8.3 Landscape overview and dynamics 8.3.1 Economics The Film and Media industry in Cape Town and the Western Cape has been identified as a key industry, contributing significant value to the economy. The industry has grown rapidly over the last few years with the Western Cape emerging as a popular choice for local and international film and commercial productions104. The (NFVF) commissioned a study to determine the economic impact of the South African film and video industry for the period of January 2013 to March 2017105. In accordance with statistical data published by the NFVF, the Film and Media Sector contributed approximately R4.4 billion to the total South African Gross Domestic Product in 2016/17. 106 In 2015, the Gauteng Film Commission conducted an economic impact study of the Gauteng Film and Television Industry. This study shows that the Gauteng Film and Television industry’s economic contribution is estimated at R2.5 billion to the GDP of the Province, employing more than 20 000 workers per annum107. Table 8.1 provides information on the Western Cape film industry. Table 8.1: Macroeconomic Contribution of the Provincial Film and Media Industry. Western Cape Film Industry 2015 calendar year
Total turnover (Rm)
Direct GVA (Rm)
Total GDP (Rm)
Direct Jobs (WC)
Indirect Jobs (WC)
Total WC Jobs
Total SA Jobs
Taxes (Rm)
Net Foreign Exchange (Rm)
Film production 2500 1030 2805 4890 3950 8840 10520 371 304 Documentaries 300 130 320 590 470 1060 1270 46 23 Feature films 800 347 853 1560 1260 2820 3400 122 60 TV 1300 514 1516 2540 2070 4610 5430 188 206 Short films 100 40 117 200 150 350 420 15 16 Commercials 949 338 988 1940 1400 3340 3990 131 565 Local 292 109 298 520 420 940 1150 40 -11 Service 555 191 589 1240 840 2080 2440 76 487 International 102 38 101 180 140 320 400 14 90 Stills 299 122 439 280 540 820 1020 42 30 Gaming 62 23 69 130 110 240 280 8 47 Animation 100 37 110 140 180 320 420 14 35 Total 3910 1551 4410 7380 6180 13560 16230 565 980 Source: Grant Thornton, Cape Town & Western Cape Film and Media Sector Study, 2017, p. 107. The provincial film and media industry had a total turnover of R3.9bn in 2015. The breakdown is self-explanatory but a full explanation appears in the Grant Thornton survey. The same report offers a detailed macroeconomic overview of the Cape Town film and media industry.108 8.3.2 Policy aspects The Department of Trade and Industry introduced the Film and Television Production Rebate / Incentive Programme in 2004 with the aim of attracting large budget foreign films to facilitate foreign capital inflow and skills transfer. Since 2004, amendments to the

45
legislation were made to include conditional rebates / incentives to international and local productions. Currently there is a complex process regarding eligibility to apply for incentives, details of which fall outside the scope of this document. However, from March 2015, the DTI approved the following formats for the incentive: Feature films, Tele-movies, Television drama series, Documentaries, Animation, Digital content and Video gaming. The Department of Arts and Culture, Wesgro (offers the industry investment advice) and the IDC (Media and Motion Picture Strategic Business Unit), NFV, SABC, National Lottery Commission with private funding109, continue to support the Film and Media industry. The Cape Town Film Permit Office (“CTFPO”) is responsible for issuing permits to shoot in public spaces. A comprehensive section on policies and legislation that impact the film and media sector can be found in the Grant Thornton survey110 8.3.3 Companies, role players, industry bodies 8.3.3.1 Employment There are many companies associated with the Film and Media sector to be listed in this document. Table 8.2 shows the extent of employment within the film, media, animation and gaming industry of the Western Cape and the city of Cape Town, in which the city plays a most dominant role both in terms of employment (70%) and turnover (90%), respectively. Table 8.2: Employment in the film, media, animation and gaming industry (2015) 111 Western Cape Cape Town Television 4 610 3 060 Commercials 3 340 2 430 Feature films 2 820 2 030 Documentaries 1 060 760 Stills 820 540 Short films 350 250 Animation 320 240 Gaming 240 180 Total employment 13 560 9 490 Turnover R3.9 billion R3.5 billion Source: Thornton, G. (2017). Cape Town & Western Cape Film & Media Sector Study. Cape Town: Stratecon, p. 107. In 2018, there were 2938 employers in the film and electronic media sub-sector (Table 8.3). Most of these employers are in the Gauteng and Western Cape. Gauteng, being the biggest employer, is facilitated by the Gauteng Film Commission (GFC) strategy.112 Table 8.3: Number of Employers and size of Film and Electronic Media 2014 2015 2016 2017 2018 Large (150+) 48 40 43 47 55 Medium (50-149) 40 43 54 56 56 Small (0-49) 2107 1879 2365 2615 2827
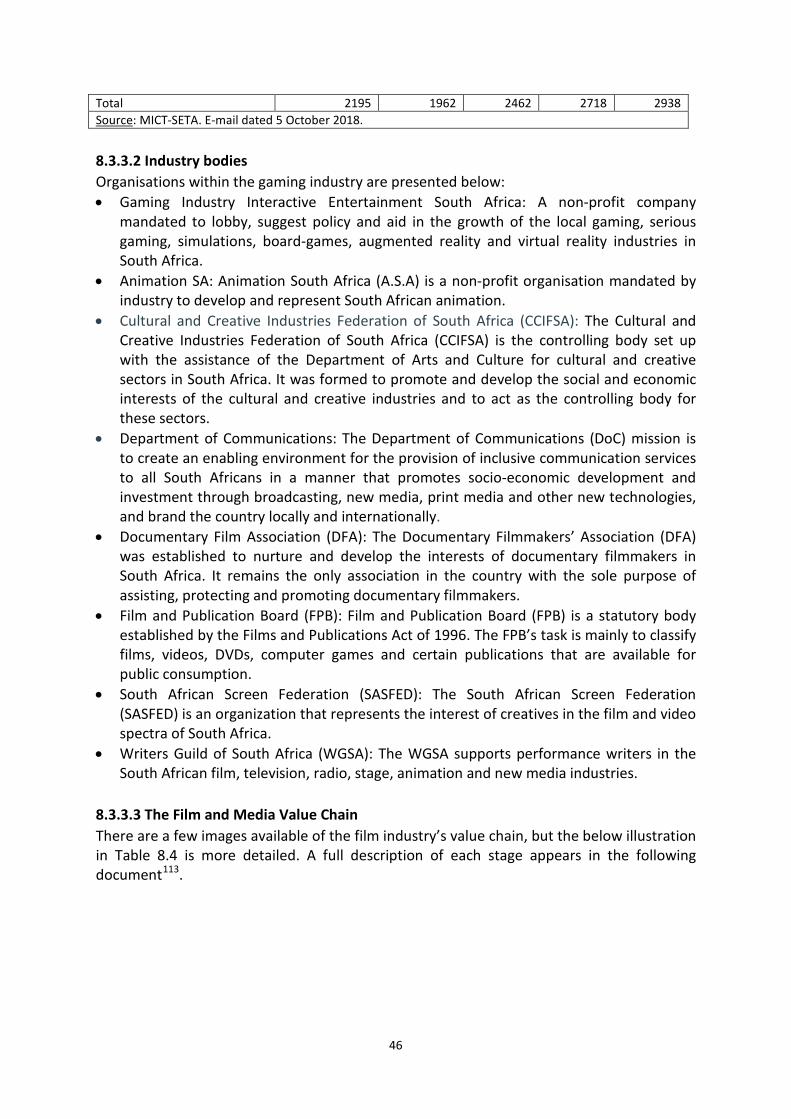
46
Total 2195 1962 2462 2718 2938 Source: MICT-SETA. E-mail dated 5 October 2018. 8.3.3.2 Industry bodies Organisations within the gaming industry are presented below: • Gaming Industry Interactive Entertainment South Africa: A non-profit company
mandated to lobby, suggest policy and aid in the growth of the local gaming, serious gaming, simulations, board-games, augmented reality and virtual reality industries in South Africa.
• Animation SA: Animation South Africa (A.S.A) is a non-profit organisation mandated by industry to develop and represent South African animation.
• Cultural and Creative Industries Federation of South Africa (CCIFSA): The Cultural and Creative Industries Federation of South Africa (CCIFSA) is the controlling body set up with the assistance of the Department of Arts and Culture for cultural and creative sectors in South Africa. It was formed to promote and develop the social and economic interests of the cultural and creative industries and to act as the controlling body for these sectors.
• Department of Communications: The Department of Communications (DoC) mission is to create an enabling environment for the provision of inclusive communication services to all South Africans in a manner that promotes socio-economic development and investment through broadcasting, new media, print media and other new technologies, and brand the country locally and internationally.
• Documentary Film Association (DFA): The Documentary Filmmakers’ Association (DFA) was established to nurture and develop the interests of documentary filmmakers in South Africa. It remains the only association in the country with the sole purpose of assisting, protecting and promoting documentary filmmakers.
• Film and Publication Board (FPB): Film and Publication Board (FPB) is a statutory body established by the Films and Publications Act of 1996. The FPB’s task is mainly to classify films, videos, DVDs, computer games and certain publications that are available for public consumption.
• South African Screen Federation (SASFED): The South African Screen Federation (SASFED) is an organization that represents the interest of creatives in the film and video spectra of South Africa.
• Writers Guild of South Africa (WGSA): The WGSA supports performance writers in the South African film, television, radio, stage, animation and new media industries.
8.3.3.3 The Film and Media Value Chain There are a few images available of the film industry’s value chain, but the below illustration in Table 8.4 is more detailed. A full description of each stage appears in the following document113.
47
Table 8.4: Film and Media Value Chain.114
Source: Urban-Econ Development Economists (2017) Although video game and animation development (in terms of the value chain) may differ slightly to film, representing the process is important as job titles often mention the stage (i.e. pre-production-production and post production and the category, i.e. film / commercials / stills / gaming and animation). 8.3.4 Key drivers, technological change, challenges and opportunities 8.3.4.1 Key drivers
Direct stimulants to the local film and media economy and job market are described below: • Government’s Foreign Film and Television Production and Post-Production Incentive
Programme. This is a tax rebate system worth 20%–25% on South African spend. It is a system of incentives put in place by the Department of Trade and Industry (DTI) to support the South African film industry, thereby aiding both domestic and foreign productions. The incentives not only encourage filming on location in the country but also offer additional rebates for post-production work done in the country. This helps to create employment in the sector, and further develop the skills base of the local filming industry.115
48
• Cape Town has a good reputation as a filming location and the quality of work offered by local service providers (film and animation) is very good.
• The favourable exchange rate attracts international companies to use the local film and new media companies, including the infrastructure.
• The province is an attractive tourist destination. 8.3.4.2 Technological change
• Virtual Reality: This new technology will come with challenges, since the film makers will be giving control to the viewer as to where to focus and imagine non-linear storytelling. VR is the viable direction film can take
• Digital Terrestrial TV: Digital terrestrial television (DTT) is seen as a technological opportunity for the country to unlock the economic and social benefits of broadband technology. DTT will transform the way the local film industry operates and the way in which audiences access local content by opening distribution channels for those who are operating in the TV production space.
• Visual effects technology and software for film and media will continue to evolve. Keeping abreast with the changes will require more exposure and involvement with the international film circuit.
8.3.4.3 Challenges, opportunities
The Grant Thornton, Wesgro and NFVF surveys provide extensive information on the film and media sector. Based on these studies and related online articles, the following aspects were identified: • Due to project inconsistency, scaling of organisations is a constraint. • Globally, media companies are responding to technical solutions that enhance their
digital supply chains using cloud computing. By using cloud computing, media companies are developing new and better ways to quickly and efficiently deliver content to their target audiences. This innovation is very new to the South African media industry and the benefits should be explored further.
• There is an opportunity for Cape Town to grow and develop the post-production and animation sectors. These sub sectors are both highly technical and require large scale infrastructure investment.
• The catalyst for increased FDI is through the improvement of the DTI incentive and rebate scheme. The DTI post-production rebate should allow for projects filmed in other locations outside of SA to qualify for the rebate as this would stimulate growth and employment within the industry through an increase in project quantities.
• Government agencies do not fully comprehend the needs and challenges facing the Film and Media industry. Education of local government officials is required on the importance and value of the Film and Media industry.
• There should be a film liaison department interfacing with government agencies. • There is insufficient production infrastructure. • Shortening the film location permit application and processing time. The Cape Town
Film Permit Office (CTFPO) is responsible for issuing permits.

49
• The Film and Media Sector is high profile and influential. The Sector has the ability to promote the City and Province on an international platform which in turn will attract more international business to the Province.
• Regulations and insurance around Drone filming are onerous. • Dedicated commercial studios will increase both foreign and local products in the City,
thereby increasing job opportunities and revenue. The NFVF document contains a SWOT analysis (Table 8.5) which supports some of the comments made above.
Table 8.5: South African Film Industry SWOT Strengths Weaknesses
Existing institutional support structures Lack of variety of skills (film, business, entrepreneurial etc.
Weaker exchange rate No coordination between key support bodies Digital technology driving quality content production Slow transformation in the industry Access to global markets Limited distribution channels Experienced crew Lack of private investment Opportunities Threats Maximise location of diverse shooting locations for local and international film industry Changes in political and policy environment
Enhance and tailor make funding models Inability to retain skills Investor-attracting incentive programmes Lack of supporting infrastructure in the province Incorporation of Previously Disadvantaged Individuals into the industry Protection of creative ideas (IP)
Emerging film-makers with talent Piracy Increase training institutions Emergence of alternative / innovative distribution platforms
Source: NFVF (2017), pp. 24-25 8.4 Digital skills landscape 8.4.1 Skills gaps The following skills gaps have been identified by various industry surveys116: Creative skills such as script writing, content creation, storytelling, cinematography / copy writers, Artist skills for set creation/building, Media producers, Film and video editors, Sound technicians, Drone operators, Editing skills, Game developers / programmers, Graphic designers, Multimedia specialist / Digital technicians / Visual effects, Illustrators, Directors (Film, tv, stage, photography and radio), Broadcast transmitter operators, Rigging and lighting specialists, Interactive and direct marketing strategists. The NFVF, in their 2016 skills survey, asked employers which skills are difficult to find. The response indicated skills-shortages across the value chain and was dependent on the respondent’s position in the chain. Some of the most mentioned scarce skills include: Production staff (especially producers), Editors, Camera operators, Sound engineers, Writers Lighting skills and engineers, Animators, Administrative skills (budgeting), Basic technical skills (examples provided are rolling up cables, cleaning cameras, handling video equipment and general knowledge of equipment and products117).
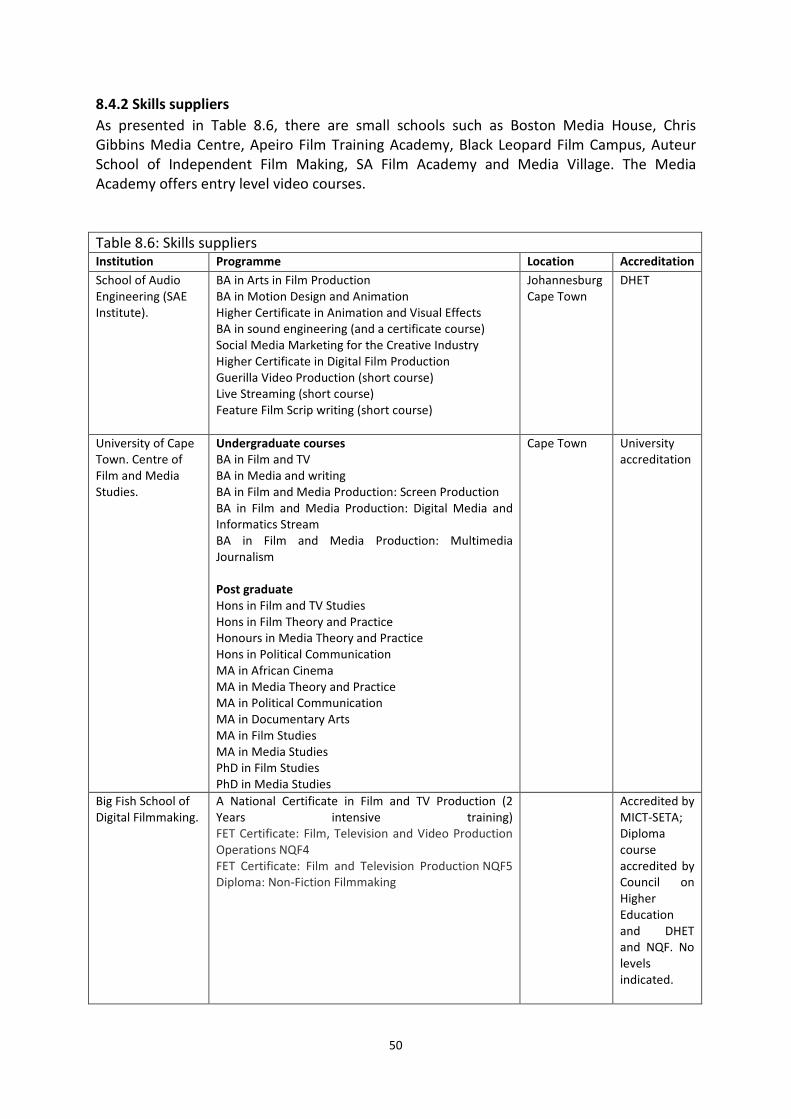
50
8.4.2 Skills suppliers As presented in Table 8.6, there are small schools such as Boston Media House, Chris Gibbins Media Centre, Apeiro Film Training Academy, Black Leopard Film Campus, Auteur School of Independent Film Making, SA Film Academy and Media Village. The Media Academy offers entry level video courses. Table 8.6: Skills suppliers Institution Programme Location Accreditation School of Audio Engineering (SAE Institute).
BA in Arts in Film Production BA in Motion Design and Animation Higher Certificate in Animation and Visual Effects BA in sound engineering (and a certificate course) Social Media Marketing for the Creative Industry Higher Certificate in Digital Film Production Guerilla Video Production (short course) Live Streaming (short course) Feature Film Scrip writing (short course)
Johannesburg Cape Town
DHET
University of Cape Town. Centre of Film and Media Studies.
Undergraduate courses BA in Film and TV BA in Media and writing BA in Film and Media Production: Screen Production BA in Film and Media Production: Digital Media and Informatics Stream BA in Film and Media Production: Multimedia Journalism Post graduate Hons in Film and TV Studies Hons in Film Theory and Practice Honours in Media Theory and Practice Hons in Political Communication MA in African Cinema MA in Media Theory and Practice MA in Political Communication MA in Documentary Arts MA in Film Studies MA in Media Studies PhD in Film Studies PhD in Media Studies
Cape Town University accreditation
Big Fish School of Digital Filmmaking.
A National Certificate in Film and TV Production (2 Years intensive training) FET Certificate: Film, Television and Video Production Operations NQF4 FET Certificate: Film and Television Production NQF5 Diploma: Non-Fiction Filmmaking
Accredited by MICT-SETA; Diploma course accredited by Council on Higher Education and DHET and NQF. No levels indicated.

51
City Varsity – School of Media and Creative Arts
Higher Certificate in New Media Development Higher Certificate in Motion Picture Makeup Diploma in Sound Engineering Diploma in Professional Photography Diploma in Professional Acting Diploma in Multimedia Design and Production Diploma in Film and TV Production Techniques Diploma in Animation Certificate in Journalism: Print and Digital Media BA Professional Acting for Camera BA in Film and TV
Cape Town Johannesburg
DHET
The SAE Institute of Animation.
BA in Motion Design and Animation (3 years). Higher Certificate in Animation and Visual Effects (1 year). Other creative art courses
Cape Town Johannesburg
DHET No further details.
The Wits School of Arts – Digital Arts.
BA in Media Studies, covers Media and Society; Reading Media Forms; Texts, Processes of Reception and Audiences; Sociology of News Production; Media and Power; Media and Culture; Media and Society. Hons and MA in Media Studies
Johannesburg University accreditation
Cape Peninsula University of Technology
Cape Peninsula University of Technology National Diploma in Film and Video Technology National Diploma in Journalism National Diploma in Photography Baccalaureus Technologiae in Journalism Baccalaureus Technologiae in Photography
Cape Town University accreditation
AFDA. (The SA School of Motion Picture Medium and Live Performance)
BA degree in Motion Picture Medium (NQF7) and BA in Live Performance. (3 Years) Higher Certificate in Film, TV and Entertainment Production (1 YEAR)
Johannesburg, Cape Town, Durban and PE
DHET, SAQA, CHE
Source: Wesgro Film and Media (2017). Cape Town and Western Cape Film and Media Promotion. Cape Town. Stutterstock, p. 46. Industry-led training: Generally, many companies provide in-house training and development for new and current employees. This allows organisations to tailor courses around their specific needs within the value-chain. Although formal qualifications are preferred, due to the skills shortage, on the job training is a quick solution as long as the person has the ability and knowledge to learn about the Film and Media industry. Triggerfish and Sea Monster confirmed this during the interview. Industry players do not find the programmes offered by certain institutions to meet the needs of the film and media industry. Furthermore, current training institutions provide training for entry-level employees only. There is no training and development for staff at middle management roles or those wishing to further their careers to potentially become industry leaders.

52
8.4.3 Special initiatives (government, industry) The film festival Behind the Blazer Film Festival, is presented in association with the National Film and Video Foundation (NFVF). The Behind the Blazer Film Festival is an event that showcases films made by South African high school students from townships, developing cities and rural areas. 8.4.4 SETA perspective on skills According to the MICT-SETA classification, gaming, and animation form part of the Film and Electronica Media sector. However, little information is available on the status and future perspective of this sector. Based on communication with MICT-SETA, the following response was obtained118: “Unfortunately our study has not gone to that detail of mapping employment and unemployment rates per province. But that is a detail you will find in our impact study research that will be published next year. The animation industry is not a stand-alone sub-sector but should be understood as sector within ‘Electronic Media and Film’. We have yet to document detailed research on it in our future research.”119 Subsequent to the endeavour to gain better insight into the MICT-SETA perspective of the skills shortage in the sector, Table 8.7 presents an overview of these shortages in film and electronic media sector. Table 8.7: MICT-SETA national skills shortage in the Film and Electronic Media sector
Source: MICT-SETA 2017
53
8.4.5 Challenges, opportunities, requirements An analysis of the challenges, opportunities and requirements for the film and media sectors can be presented as follows: • There are limited formal and practical training providers in the Film and Media industry
which has been identified as an area that requires more support and development from government departments. A quote from Grant Thornton survey “The film industry is a service industry with limited attention to the creative input and skills needed to create internationally recognised local content120.
• The industry is not seen as a stable and prosperous sector for students to join, therefore previously disadvantaged students may opt for careers in other industries. There is a need to encourage more Black participation at levels such as Production Managers and HODs.
• Complying and qualifying for MICT SETA skills development initiatives are complex matters of which the benefits of these programmes are not clear.
• Lack of project consistency which creates a challenge in employing staff on a full-time basis, internal training programmes should meet MICT-SETA skills development requirements.
• Training programmes and courses relevant to the Film and Media Sector are mainly conducted at tertiary level through a select number of institutes. Refer to the section below on Skills Suppliers.
• The Film and Media Sector is currently not transformed despite the willingness of industry role players to create a more inclusive environment. Government tends to fund and support industries where they can see transformation occurring. The incentive scheme has a BBBEE requirement.
• As part of its development mandate, the industry representative bodies should facilitate a dialogue between the training providers and the film and media industry in order to bridge the current cap.
• Film and media training initiatives should be publicised and kept updated for existing employees and new entrants to the industry to be aware of upskilling opportunities.
• The Film and Media industry is unattractive to computer skilled people as the IT sector offers better job security and salaries. This results in a shortage of skills which are listed in another section of the document.
• There is an opportunity to engage international organisation to assist in training and skills transfers when foreign production companies work in the Cape Town industry.
• Obtaining international work visas is a slow and challenging process. 8.5 Insights The MICT-SETA strategy is unclear according to the research documents. This perception has been confirmed by SETA. The Film, Media and New Media sector is a technology driven eco-system (highly digitised) and is being influenced by international organisations. There is an awareness to keep abreast of developments but the cost factor is an inhibitor due to the project to project culture (which constrains scaling operations) and the DTI funding compliance (BBBEE Level 2) and the skill shortage for certain specialised occupations.

54
There is limited training and development for staff at middle management roles or those wishing to further their careers to potentially become industry leaders. According to the Skills Framework, there are elements of the ICT Practitioner Skills pervasive in the Film, Media and New Media (gaming and animation) industries where specialist skills are required. In general, it appears that ICT plays an important role across the board (from intermediate to specialist) in the Sector User Digital Skills block. This should be evident after reading the Animation, Gaming and Film and Media documents.

55
SECTION 9: GAMING
9.1 Introduction Globally, as the video gaming industry, otherwise known as “interactive entertainment”, grows exponentially, the demand is changing gaming content, hardware and software products at a rapid rate. The ongoing challenge is that core gamers are seeking more immersive experiences which require greater artistic and technological innovations and capabilities, from a supply perspective. The user market is extremely diverse in age, gender and competitiveness. There is the social or casual gamer on the one side to serious gamers who participate in massive on-line hackathons which can last for days. The industry caters for diverse demographics and offers the user multiple platforms. Competitions, prize money, eSports and exhibitions are all contributing to the exponential growth of gaming globally. In February 2018, the first gaming eSports event was held at the Winter Olympics. On a professional level, serious gamers can earn substantial amounts of money just by playing eSports tournaments. The growth in smartphone ownership is providing millions of consumers with an accessible and affordable route into the gaming market, causing an exponential growth in the casual / social gaming market. Fast and affordable broadband access coupled with easy to use mobile apps allows the enthusiast access to games, anytime and anywhere. 9.2 Sector definition Obtaining specific sector information or economic performance of this industry has not been possible as the industry is not effectively and formally defined as an industry which “manufactures” a product. Gaming and Animation are not mutually exclusive industries. From the survey reports obtained, Wesgro 121and DTI classify animation and gaming as New Media which is accounted for within the broader term of Film and Media. For some or other reason, this classification is as a result of incentives and subsidies. 9.3 Landscape overview and dynamics The traditional methods of playing games, i.e., pc and console, remain the most popular forms in South Africa while social gaming’s growth is on its own trajectory, not eating into the traditional market. Those using smart phones to play games generally focus on compelling but simple games while the pc and console players are more interested in on-line competitive group games. Desktop Dungeons (GCF Design, 2013) and Toxic Bunny (Celestial Games, 1996) are two of South Africa’s video games that have hit the global arena. eSports - or electronic sports - is the umbrella term for organised, competitive computer gaming, usually between professionals. eSports involves gamers gathering as an on-line collective, from all over the world to participate in gaming competitions.
56
eSports gaming attracts large physical audiences who watch on big screens or on-line. In 2015 alone, the global eSports gaming audience was estimated to be 226 million people. The competitors themselves are trained professionals with high level gaming skills. Tournament prizes approach millions of dollars. Tournaments are based around a very specific list of games, including names like: League of Legends, Dota 2, CounterStrike, Call of Duty, World of Warcraft, Halo, StarCraft and FIFA. In order to be accepted into this level of competition, a gamer has to achieve a certain proficiency level. This category of gaming has huge potential as it involves advertising, media rights and sponsorships, besides attracting new players to the gaming arena. Game based learning is fast growing global industry, and according to Metaari’s 2017-2022 report.122 The following six catalysts are listed as drivers of the the educational game market: • The growing global demand for early childhood learning games. • The organizational resistance to Game-based Learning is fading fast. • The growing availability of easy-to-use development tools. • Exponential innovation in Augmented Reality (AR), Virtual Reality (VR, and Mixed
Reality (MR)). • An upsurge of new next-generation brain training games coming on the market based
on neuroscience, cognitive therapy, and biosensors. • The impending rollouts of very fast 5G networks and the Internet of Things
(IoT)Combined, these catalysts have created highly favourable market conditions for Game-based Learning developers across all seven regions analysed in this report.
It is quite significant that South Africa has the highest growth rate for game-based learning in the world at 51.1%. 9.3.1 Economics There are diverse and unsubstantiated revenue figures published on the worth of the gaming industry globally. The Accenture report123 states a revenue figure of $87bn while Newzoo, an international research organization in its 2017 Global Games Market Report,124 confirmed a spend of $109 billion on games. Furthermore, video game revenues achieved a turnover of $116bn from a 2007 base of $44.9 billion. China is leading the global market at $36.3bn followed by the USA at $25.06 billion. It is ostensibly, the fastest growing component of the international media sector. According to PwC’s Entertainment and media outlook, 2018-2022, the South African video game market, from a consumption perspective, exceeded R3 billion (2017) through its development, marketing and sales of video games. It must also be noted that this figure includes advertising spend. The report also projects that the industry will achieve R6.2 billion in revenue in 2022125.

57
The Interactive Entertainment of South Africa (IESA), industry survey was conducted in 2016126. Due to absence of official statistics for the game development industry, the team at “Make Games South Africa” managed the survey in 2015 so the 2016 results appear to be an update of the 2015 findings. The following is a summary of the key findings of the IESA report (2016): • 31 active game development companies in South Africa responded to the survey. • 17 are located in Cape Town while 6 are located in Johannesburg. • Overall these organisations have directly created 255 jobs. • Permanent Jobs increased from 152 positions to 176 positions, a 16% growth. • The value of these organisations is about R100 million (2015), an 85.6% growth from
the previous year (R53,9m in 2014). • Only 14% of the industry is female (2015 presents a slight increase from 2014). • Only 13% of the industry is not white (up from last year). • Little transformation has occurred in the industry. It is still predominantly white male
dominated. • Together the organisations released a total of 103 games in the 2015. 9.3.2 Policy aspects It appears that existing government policies do not provide a clear and practical strategy or roles and responsibilities of industry role-players involved in South Africa’s gaming and animation industries. Due to the absence of formal research and industry statistics, Interactive Entertainment South Africa conducted its own basic research as mentioned above. Nick Hall, CEO of IESA and an attorney by profession, has been promoting the legal position of game developers to government, for some time. The area of contention has been around the interpretation and application of the SPB regulations.
On 04 March 2015 South Africa's Film and Publication Board (FPB) submitted in the Government Gazette127 which in essence was aimed at controlling all local information posted on the internet. The objective was to protect under aged children to any explicit and inappropriate video material being posted locally.128 In 2016 an update of policy was presented, admitting that the bulk of this content is unclassified and recognised that there is an enormous quantity of such content, most of which is produced, hosted in and distributed from foreign jurisdictions.

58
Nick Hall of IESA continues to engage with government on the legal aspects surrounding legislation and the gaming industries rights. This has been an ongoing complex issue and is outside the scope of this document, 9.3.3 Companies, role players, industry bodies Some of the most important role players in the gaming industry are listed in Table 9.1 below, which shows that Cape Town forms the basis of the majority of these companies. Table 9.1: Key Gaming developers in SA Sea Monster – Cape Town 24Bit Games - Johannesburg Triggerfish Animation (Ballisti) – Cape Town Kopskop Games – Cape Town Retro Epic – Cape Town Marsh Town Madness- Johannesburg and Cape
Town Freelives – Cape Town Starboy Games - Johannesburg Quarter Circle Forward and Design (QCF) – Cape Town
Orangespice Games – Cape Town
Thoopid – Cape Town Guinea Pixel – Cape Town Celestial Games – Johannesburg Fuzzy Logic Games – Cape Town Renderheads – Cape Town Runestorm – Cape Town The Brotherhood – Cape Town Source: Various internet sites and media reports Gaming Industry Interactive Entertainment South Africa is a non-profit company mandated to lobby, suggest policy and aid in the growth of the local gaming, serious gaming, simulations, board-games, augmented reality and virtual reality industries in South Africa. The African Electronic Sports Association (AESA) is a South African non-profit organisation established to promote the development and adoption of e-Sports or electronic sports in and throughout Africa. The primary objective is to encourage youth to adopt Play/Gaming, Programming/Coding and Robotics in preparation of the 4IR. 9.3.4 Key drivers, technological change, challenges and opportunities The internet articles and industry related documents found (about the South African gaming industry) appear to be published as far back as 2008 to around 2017 with the occasional 2018 commentary. Besides some of the information being dated which has limited use, finding accurate and corroborated statistical information on the SA gaming industry is a challenge. 9.3.4.1 Key drivers
From a global perspective the key drivers of the growing gaming industry is stated below:129 • An evolving customer-base. A result of the growth in the number of gamers through
mobile phone access. • Evolving definition of games. The impact of innovative gaming such as immersive
gaming (virtual and augmented reality). • Digital Delivery Digital Distribution. Purchasing on-line and downloading rather than a
physical purchase is disrupting the industry. On-line customer engagement with a dynamic customer experience is stimulating the purchase and distribution of games.
59
• Proliferating business models. The move away from a single physical purchase point to on-line purchase options is challenging traditional business models. Often termed as micro-transactions (smaller transactions), coupled with associated advertising, is allowing vendors and suppliers to get closer to individuals preferences and spending patterns.
Gaming leagues and competitions are also contributing to the growth spurt of international gaming. From a continental perspective, South Africa's video gaming compared to the rest of Africa, is unchallenged due to the large number of wealthy South Africans living in the major cities. Nigeria and Kenya are runners-up to the local gaming industry. Much talent resides in these two countries from a gaming and animation perspective. The PWC report indicates that social and casual gaming will be the major drivers of economic growth while pc games have passed console gaming. 130 New areas of development are virtual reality, augmented and mixed reality gaming. Distribution channels are moving away from the conventional physical mode (store purchases) to digital which makes accessing games easy either by downloading or by using a Gaming App. On-line banking makes monetary transacting easy so the desired game is simply a click away. The following very general factors are stimulating game awareness in South Africa: • Easy access to affordable smart phones. • The availability of internet access in urban areas. • Data costs are still high but the rates are gradually being reduced due to pressure from
government on the large Telco’s. • On-line publicity around public hackathons and competitions which may involve
monetary or other prizes. • The pervasive impact of social media which is being used to create awareness around
gaming and the fun aspect of participating. • The level of interest amongst young learners in the secondary education institutions is
stimulating interest. Educational gaming is gaining a small, but significant presence in schools which is also stimulating the use of technology.
• The gaming industry is no longer a niche arena for the youth or a specific consumer segment. With the advent of mobile gaming and improvements to hardware used in playing these games, gaming has become a viable form of entertainment for players from all backgrounds and ages.
• Events and eSports organizations like Mind Sports South Africa, the Digital Gaming League, Orena and LANX have become very popular with the big demand for eSports tournaments and other gaming events in large cities. “Mind Sports South Africa” also hosts school events. There are other tournaments which offer sizable monetary prizes.
9.3.4.2 Technological change
Innovation in the gaming industry: Virtual Reality (VR) and Augmented Reality (AR)
60
With the advancement of technology, software and human creativity, gaming continues to advance in innovation and product development. VR and AR are regarded as the future of gaming but currently the integrated components that enable the immersive experience, are costly for the average user. Virtual Reality (VR): The term immersive experience is used when users of the technology are interacting in a closed real-life virtual environment, which compounds the human experience and emotions. The computer-generated characters and surroundings offer visual effects in a 2 and 3D stereoscopic environment. Augmented reality (AR): has the capacity to change the perception of the augmented world through the use of digital sensations, graphics and other digitally created objects in a real-world setting. In order to enrich the perception of virtual reality, headsets shift pictures in-front of the wearer’s eye according to the motion of his head. This is achieved by head tracking. Head tracking systems are typically equipped with gyroscopes, accelerometers and magnetometers to mathematically plot and visually track, the movement of user’s head. It is all about enhancing the way the user interacts with the real world. Another major difference between AR and VR lies in the way they are used. To experience VR, special headsets or 3D glasses are used, but in AR, the user experiences imagery through the app installed on their mobile or tablets, therefore it makes it easier for the user to experience AR. AR games requires a Virtual Environment to be implemented as in Mixed Reality (MR), whereas VR games are in general self-sufficient with its own virtual world. Both these technologies have brought about significant advancements, not only in the gaming and entertainment industries but also in tourism, healthcare and business. 9.3.4.3 Challenges, opportunities
Unfortunately, the South African game developer industry is small and high risk with limited funding. Job creation and long-term economic stability are not realities in this industry due to: • Limited government support due to compliance to BBBEE requirements (it is a white
male dominated industry). • Broad legislation which does not protect game developers from copyright
infringements. • Games face the risk of being pirated thereby reducing much needed revenue streams
for the local industry. 9.4 Skills landscape There are references to the need for different skill sets coupled with the traditional forms of training in the animation and gaming industries. These include but are not limited to: social intelligence; virtual collaboration as a requirement of the modern office (working alone and remotely); novel forms of thinking (logic with creative) and computational thinking which supports cognitive thinking.

61
9.4.1 Skills suppliers 9.4.1.1 Formal education-led supply
• University of Cape Town: UCT offers a major in Computer Games Development, but this must be taken in conjunction with a major in computer science. Focus areas include: 2D and 3D game technology; AI and path planning; C++/ Java programming (as part of the mainstream CS course); Microsoft XNA development; Playability and Design; Game Software Engineering; Games Engine Architecture; 2D & 3D Computer Graphics; Multi-User and Distributed Games.
• Witwatersrand University: WITS in Johannesburg offers two game design courses – a Bachelor of Engineering Science in Digital Art – BEngSc (Digital Art) and a Bachelor of Arts in Digital Arts majoring in Game Design – BA DigA (Game Design).
9.4.1.2 Industry-led supply
• Friends of Design: This institution is based in Cape Town and offers a 1-year course in game design and development, after which the student will receive a Higher Certificate in Game Graphics and Multimedia Entertainment, NQF-level 5. Since the course builds on existing skill, there is a prerequisite for a formal qualification in Graphic Design, IT & Programming, Web Design, 3D Animation, or Illustration and Fine Art
• Learn 3D: A Cape Town and Johannesburg based training organisation, offers courses in game design and development. Basically, the focus is programming in C#, game theory and development techniques with the leading gaming engine Unity 3D, as well as work with the latest Virtual Reality technology by developing games compatible with the Oculus Rift. The website does not mention specifics about accreditation or type of qualification.
• Vega School: An educational brand of The Independent Institute of Education (The IIE) was formed in 1999. The institution offers the BCIS degree in Game Design and Development. This is 3-year full time programme at NQF LEVEL 7. The course provides students with the knowledge and experience required to create both two-dimensional and three-dimensional games across a multitude of platforms.
9.4.2 Special initiatives 9.4.2.1 Partnership initiative The Serious About Games (SAG) initiative is a collaborative effort between the Western Cape Department of Economic Development and Tourism, the Cape Innovation and Technology Initiative (CiTi), Interactive Entertainment South Africa, 67 Games, and the Cape Craft and Design Institute. Established in 2016, the purpose of the initiative is to use game development in the spatial planning of informal settlements, thereby improving residents' living standards by enabling easy access to emergency services, basic services and recreational areas. Vukuzenzele was the first of series of events which are to encourage game development and game-based learning to impact social change.

62
9.4.2.2 eSports Local eSports tournaments (2017) include Telkom Masters and Mettlestates Counter Strike: Global Offensive, both offering prize money of R1m. 2018 events include African Cyber Gaming League to the larger attraction titled Rush which were held at the Sandton Convention Centre in June 2018. Another notable event was the FIFA eWorld Cup qualifier hosted by VS Gaming, a subsidiary of Telkom. With a prize pool of over R1.5 million, the VS Gaming Cup also offered the winners a chance to enter into the Global Series Play-offs. 9.4.3 SETA perspective The Gaming and Animation industries are not specifically categorised as a sector or even as an industry by MICT-SETA. This was confirmed by their Researcher. Further details can be found in the Film and Media document prepared for GTAC. From discussions with Sea Monster and Triggerfish, the animation and gaming industries fall under the broad term of Film and Electronic Media (See Section 8.4.4). 9.4.4 Challenges, opportunities, requirements To avoid repeating the drivers and enablers within the skill types, the Animation, Gaming and Film and Media industries, to a great extent, share a similar value chain. The process requires often requires different skills sets. This has been elaborated on in the Animation document under the same section (See Section 7.4.4). 9.5 Insights A question arises in that if the local supply of games, by 31 gaming studios in South Africa is generating circa R100m in revenue (note: only the supply of games), while the consumption of hardware, games and advertising according to PWC amounts to +R3bn131 , there appears to be missed opportunities for the local suppliers. An unsubstantiated and cursory comment is that the international sales / distribution channels into South Africa for gaming programmes should attract some form of levy or royalty to subsidise the development (for developers but more so for STEM training initiatives) of the local industry. Mathematics is used extensively in game programme development. From a supply and demand perspective, social, educational and professional (serious) gaming will help equip people with valuable technical (computational), artistic or cognitive skills for 4IR. The youth should be introduced to specific early developmental programmes using educational gaming / gamification / Minecraft etc to stimulate their thinking around Science, Technology, Engineering and Math (STEM). A highly digitised, all the new technology, limited opportunities for skilling and upskilling (across the value chain).

63
SECTION 10: ICT SECTOR
10.1 Introduction The South African ICT sector is well-established and it is the largest in Africa, contributing approximately 8,2% to the national GDP. Despite ICT spending increasing to R123 billion by 2016, there are concerns amongst sector stakeholders that South Africa is falling behind its peers in Africa. Several international corporates, recognised as leaders in the ICT sector, operate subsidiaries from South Africa. With its current market capitalisation of R178 billion, this sector could grow to R208 billion by 2020.132 The BMI report133 holds “a positive growth outlook for the South African IT market in 2018 and throughout the remainder of our forecast period to 2021. We forecast the software and IT services segments will be particular outperformers as public and private sector organisations leverage a growing availability of cloud-based solutions to drive cost - cutting and efficiency gains in their operations.” 10.2 Sector definition There are many definitions for the ICT industry. The definition is directly dependent on the context in which ICT is used. For example “ICTs within the context of education encompasses not only a reference to equipment (i.e. devices) but also to a group of skills or competencies that teachers and students must possess in order to be considered having achieved a certain level of competencies as it relates to ICTs.”134 Zia, Ilahi and Khan135 define an information and communication technology (ICT) as “a diverse set of technological tools and resources used to communicate and to create, disseminate, store and manage information.” For this study, the definition of Zia et al. is used. However, the application of definition is limited to the definition of the INSEAD report of 2013, as commissioned by the European Commission for Enterprise and Industry. As this study aims at exploring the AS-IS situation in terms of ICT skills in the Western Cape the workforce includes i) management NS Business architecture level skills, ii) core practitioners skills and iii) other ICT technicians skills. The use of the term ICT practitioners does not include ICT mechanics, manual workers and non-ICT professionals working in the industry (European Commission, DG Enterprise and Industry, 2013)136. 10.3 Landscape overview and sector dynamics 10.3.1 Companies, role-players The ICT sector in the Western Cape is completely diffused within all industry sectors. Not only is ICT involved in the major educational and business sectors but are branching into the social- economic communities. In the Western Cape especially ICT diffusion into rural and underserved communities are seen as a major focus area of the local government (Western Cape Government, 2014)137.

64
ICT is a priority for the Western Cape and employs 30 000 people contributing over R3 billion to the GDP. As an example of the priority, the Western Cape Government invested over R2.89 billion to connect every resident to broadband138.
All major industries have been affected by the growing need for more and more ICT products. For example, the programme for high-speed internet by means of fibre infrastructure has been a huge success and large parts of Cape Town and surrounding areas now has access to this product. This created an environment where business, education and the private citizen can benefit and compete on an international basis. Furthermore, the Western Cape (WC) via Cape Town positioned itself to develop into a SMART city. The WC at large and Cape Town specifically are committed to be one of the leading ICT role players in South Africa and Africa.
The ICT industry composes of provincial government, municipalities, education sector such as the four universities, TVET’s, large corporates such as Sanlam, Old Mutual, Capitec bank, PSG, Pick & Pay, Checkers, Woolworths, PEP, and the Foschini group to name a few. The ICT vendors such as SAP, Oracle, Microsoft, IBM and many others are also well presented. Unfortunately, there is a lack of industry bodies to represent the role players in the Western Cape. From a national perspective, it is interesting to note that small enterprises sector is the largest employer of ICT practitioners (see Table 10.1). No information is available at provincial level.
Table 10. 1 ICT employment by enterprise size 2016 - 2017
Enterprise Size 2016 2017 Large 154 170 Medium 302 351 Small 9795 12178 TOTAL 10 251 12 699
Source: MICT-SETA OGS, 2017 10.3.2 Change drivers and dynamics Vendors, SMME’s (i.e. niche companies, new technologies), and to a certain extent large companies are driving key changes in the industry. The key focus areas by vendors are presented in Table 10.2.

65
Table 10.2: Vendor focus areas
Vendor Topics
Microsoft Azure (Cloud Services:IaaS, PaaS, SaaS), Office365, Docker, Virtualization, DevOps, Cloud Development, Infrastructure as Code, Web Development, BI, Big Data (data analytics), AR/VR / Hololens, Blockchain, IoT (and data analytics), Cognitive Services
IBM Cognitive & AI (Artificial Intelligence / Machine Learning / Cognitive Computing), Data Science & Analytics (big data and analytics), Blockchain, IoT, Quantum Computing and Algorithms, Security (IAM, Data Security, Cyber Security), Cloud development, Systems (mainframe development)
Oracle
Container Databases, In-Memory Grids, Blockchain, Data analytics/ BI / Ml, Java (monetize), Microservices, Architecture
SAP SAP Hana (Cloud development), Machine Learning, Block Chain IoT, Intelligent Enterprise (Process Automation), Business Process Development
Elaborating on the vendor-driven changes, Microsoft is a good case in point - the company is currently driving the Office 365 product, which is an innovative product. However, this will to a large extent dictate how companies will manage their HR function in future. Vendors are currently promoting Artificial Intelligence (AI), Business Intelligence (BI), Machine Learning (ML), Block chain, Big Data, IoT, Quantum computing and many more services and products. These developments create a huge demand for the development of these “new” skills, leading to enormous strain on the skills supply value chain. Educational and training institutions find it difficult to cope with fast-changing skills requirements and high demand for a skilled workforce. From a public sector perspective, legislation typically triggers significant changes in the market; for example, the new act compels Financial Service Providers (FSPs) to keep record of all advice given to clients. This requires a new function to record, store and make the information available for inspection on demand. From an international perspective, other key drivers are also forthcoming - countries are demanding more transparency and insist on the protection of the individual’s privacy. Key drivers towards the new ICT landscape are, inter alia, social media (Facebook, WhatsApp) and industry platforms. 10.3.3 Technological change 10.3.3.1 Global perspective
Gartner139 identifies the following emerging technology trends for 2018:
• Trend #1: Democratized AI - AI, one of the most disruptive classes of technologies, will become more widely available due to cloud computing, open source and the “maker” community.

66
• Trend #2: Digitalized ecosystems - Emerging technologies in general will require support from new technical foundations and more dynamic ecosystems. These ecosystems will need new business strategies and a move to platform-based business models.
• Trend #3: Do-it-yourself biohacking - 2018 is just the beginning of a “trans-human” age where hacking biology and “extending” humans will increase in popularity and availability.
• Trend #4: Transparently immersive experiences - Technology, such as that seen in smart workspaces, is increasingly human-centric, blurring the lines between people, businesses and things, and extending and enabling a smarter living, work and life experience.
• Trend #5: Ubiquitous infrastructure - In general, infrastructure is no longer the key to strategic business goals. The appearance and growing popularity of cloud computing and the always-on, always-available, limitless infrastructure environment have changed the infrastructure landscape. These technologies will enable a new future of business.
The main changes within the ICT landscape lies within the nano-technology, blockchain, digital transformation and cloud. One of the major changes is within the self-service end-user technology where the focus will increasingly shift to the self-sufficiency of the end user. A shift from websites to platforms is evident. Artificial Intelligence (AI) and especially data analytics are fast changing and will dominate the ICT landscape. 10.3.3.2 South African perspective
Whereas the above explanation refers to the international context, the following section refers the perspective of national and provincial ICT companies. Interviews were conducted with South African CIOs to determine their views on top technology trends and the major issues affecting ICT, as presented in Table 10.3.
Table 10.3: Industries view on top trends and biggest issues affecting ICT140 Industry sector
Company Role Name Top tech trends Biggest issues affecting ICT
Consumer goods and services
British American Tobacco South Africa
Head of IT Sub-Saharan Africa
Hein du Toit
1) Automation using AI and Chatbots to transform back-office operations 2) Cloud-based platforms driving efficiency and consolidation"
1) Embracing agility and digital ways of working in multinational companies 2) Ideal time for IT to step up/in companies transformation
Coca-Cola Southern and Eastern Africa
Chief digital officer
Priya Thakoor
AI, cloud, containerisation, robotics, marketing automation, augmented and virtual reality are top of mind for customer-led businesses.
Technology leaders need to bring both the strategy business and technology competencies together
Financial services
Insurance Group
CIO Gavin Kandier
Consumer-driven, on-demand business products, delivered by digital channels
Organizations need to innovate and adapt by building a culture of proactive innovation and transformation
Santam Executive head
Kevin Wright
1) Cloud services 2) IoT
Becoming a facilitator of solutions rather than just a

67
It is important to note that not one of the CIO’s mentioned availability of skilled resources as an issue affecting ICT, which is in contrast to the interviewed CIO’s; however, it is also possible that the skills question was not posed to them. As far as the top trends are concerned the CIO’s were unanimous on Cloud Computing and digitisation of business. Also mentioned was AI, IoT, API’s Consumer driven by digital channels. The trends that overlapped with the interviewed CIO’s were Cloud, AI, chatbots, robotics, IoT, consumer focussed and API. Some other emerging trends not necessarily mentioned by CIO’s in Brainstrom are Big Data, machine learning, business intelligence and blockchain (refer to Section 4 & 5 for more information). Not mentioned elsewhere in the report is the aspect of the modern office: • The modern office: In more sophisticated economies the principle of work-as-you-go
and anytime, anywhere will be well embedded. The software developer and technician (as we know them today) will be replaced by a workforce that can develop their own software and fix their own hardware problems. Some companies are currently implementing a technology knowledge transfer strategy in order for employees to be in charge of their own technology. With the modern office becoming increasingly independent, technologies will play a more important role.
With this in mind, the educational ecosystem will have to accommodate these changes and train their students to be self-sufficient in terms of technologies, and how to stay ahead of new technologies being introduced at a rapid pace. There are many new technologies and innovations being introduced to the marketplace. The above-mentioned are but a few. Nano technology, space technology, health technologies, etc., are some examples of innovations disrupting the ICT ecosystem. 10.3.3 Challenges and opportunities Although new technologies present exceptional opportunities for growth and innovation, it simultaneously poses the challenge of accelerated ICT skills requirements. The main challenges within the new ICT ecosystem are the skills needed to support the new technologies. The adoption of new technologies by new customers is often underestimated and can in some instances lead to failures.
operations and IT
3) Location-based data" solution provider
Public sector
The Council for Medical Schemes
CIO Jaap Kügel
1) Web services and API to automate statutory returns 2) Cloud due to its ability to support new technologies and will have to be embraced with both the regulator as well as medical schemes"
1) Compliance with stricter legislation governing privacy 2) Protection of information 3) Cyber security
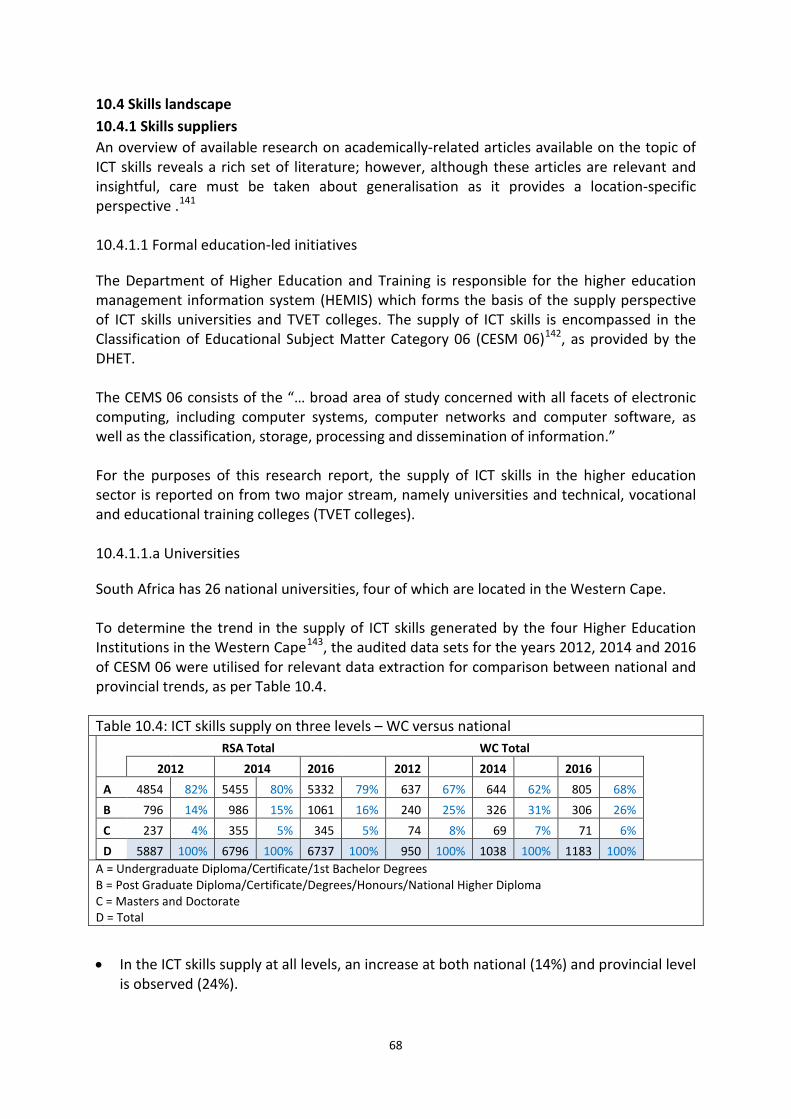
68
10.4 Skills landscape 10.4.1 Skills suppliers An overview of available research on academically-related articles available on the topic of ICT skills reveals a rich set of literature; however, although these articles are relevant and insightful, care must be taken about generalisation as it provides a location-specific perspective .141 10.4.1.1 Formal education-led initiatives
The Department of Higher Education and Training is responsible for the higher education management information system (HEMIS) which forms the basis of the supply perspective of ICT skills universities and TVET colleges. The supply of ICT skills is encompassed in the Classification of Educational Subject Matter Category 06 (CESM 06)142, as provided by the DHET. The CEMS 06 consists of the “… broad area of study concerned with all facets of electronic computing, including computer systems, computer networks and computer software, as well as the classification, storage, processing and dissemination of information.” For the purposes of this research report, the supply of ICT skills in the higher education sector is reported on from two major stream, namely universities and technical, vocational and educational training colleges (TVET colleges). 10.4.1.1.a Universities
South Africa has 26 national universities, four of which are located in the Western Cape. To determine the trend in the supply of ICT skills generated by the four Higher Education Institutions in the Western Cape143, the audited data sets for the years 2012, 2014 and 2016 of CESM 06 were utilised for relevant data extraction for comparison between national and provincial trends, as per Table 10.4. Table 10.4: ICT skills supply on three levels – WC versus national
RSA Total
WC Total 2012 2014 2016 2012 2014 2016
A 4854 82% 5455 80% 5332 79% 637 67% 644 62% 805 68% B 796 14% 986 15% 1061 16% 240 25% 326 31% 306 26% C 237 4% 355 5% 345 5% 74 8% 69 7% 71 6% D 5887 100% 6796 100% 6737 100% 950 100% 1038 100% 1183 100%
A = Undergraduate Diploma/Certificate/1st Bachelor Degrees B = Post Graduate Diploma/Certificate/Degrees/Honours/National Higher Diploma C = Masters and Doctorate D = Total
• In the ICT skills supply at all levels, an increase at both national (14%) and provincial level is observed (24%).

69
• For the group as a whole, the WC delivered 16% of ICT graduates in 2012 (950/5887), in 2014 it was 15% (1038/6796) and in 2016 the figure was 15% (1183/6737).
• In 2016 the Western Cape delivered: 15% (805/5332) of South Africa’s first degree graduates; 28,8% (306/1061) of the postgraduate/honours level; and 20% of the masters and doctorate graduates.
• For the Western Cape the growth in the undergraduate cohort 2012 to 2016 represents 26,4%; at honours level (B) it is 27,5%, whilst at masters and doctoral level (C) a 4% decline has been reported.
Table 10.5 presents a comparative figure of the CESM 06 graduates between the four Western Cape-based universities and the South African total by male/female cohort across the years 2012, 2014 and 2016:
• For the three periods under review (2012, 2014, 206) the trends indicate an increase in both the female and male graduates in CESM 06.
• The total number of CESM 06 graduates increased by almost 25% from 2012 to 2016. • For the same period, female graduates show a 30% increase and male graduates a 22%
increase, respectively. The trend depicted in the growth of female graduates is encouraging.
* The electronic database is available on request. Table 10.5: Gender comparison of ICT majors Western Cape 2012, 2014, 2016
Source: Electronic database available from the DHET* 10.4.1.1b Technical, Vocational and Educational Training Colleges (TVET)144
Nationally, South Africa has 50 TVET colleges, six of which are located in the Western Cape.
600
631
729
350
408
454
950
1038
1183
0 200 400 600 800 1000 1200 1400
2012
2014
2016
2012
2014
2016
2012
2014
2016
Mal e
Fem
ale
Tota l
Male Female Total2012 2014 2016 2012 2014 2016 2012 2014 2016
Western Cape 600 631 729 350 408 454 950 1038 1183
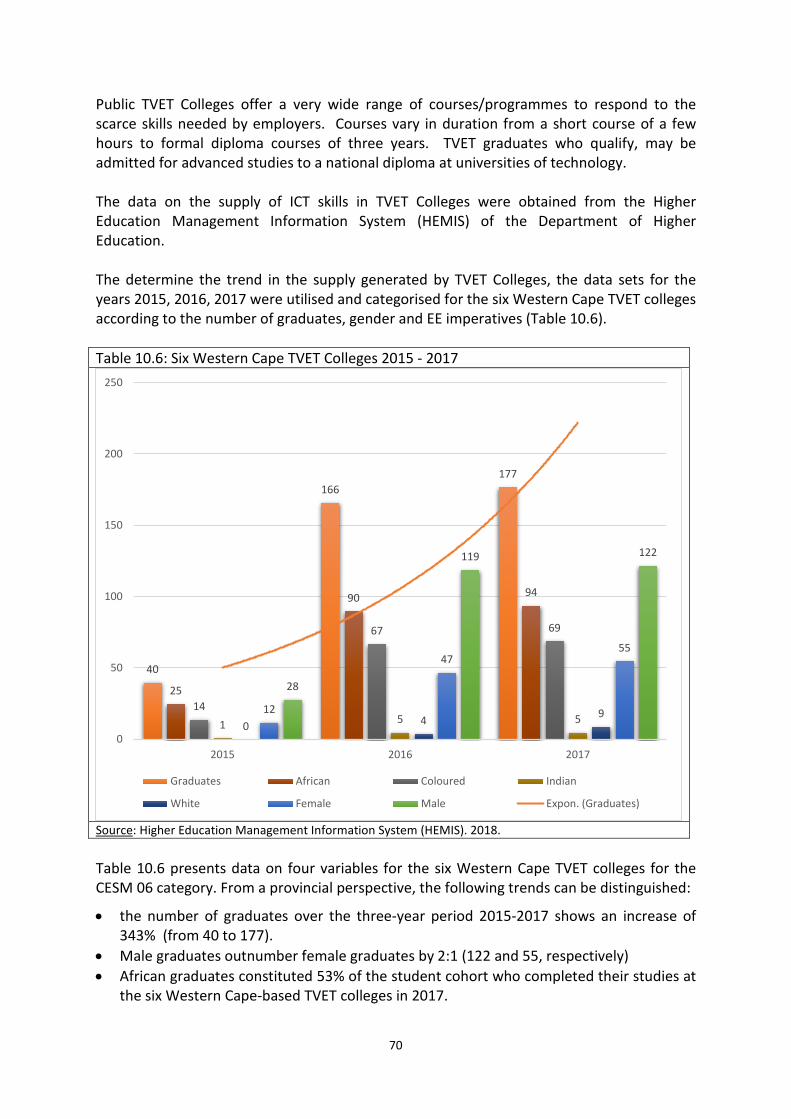
70
Public TVET Colleges offer a very wide range of courses/programmes to respond to the scarce skills needed by employers. Courses vary in duration from a short course of a few hours to formal diploma courses of three years. TVET graduates who qualify, may be admitted for advanced studies to a national diploma at universities of technology. The data on the supply of ICT skills in TVET Colleges were obtained from the Higher Education Management Information System (HEMIS) of the Department of Higher Education. The determine the trend in the supply generated by TVET Colleges, the data sets for the years 2015, 2016, 2017 were utilised and categorised for the six Western Cape TVET colleges according to the number of graduates, gender and EE imperatives (Table 10.6). Table 10.6: Six Western Cape TVET Colleges 2015 - 2017
Source: Higher Education Management Information System (HEMIS). 2018. Table 10.6 presents data on four variables for the six Western Cape TVET colleges for the CESM 06 category. From a provincial perspective, the following trends can be distinguished:
• the number of graduates over the three-year period 2015-2017 shows an increase of 343% (from 40 to 177).
• Male graduates outnumber female graduates by 2:1 (122 and 55, respectively) • African graduates constituted 53% of the student cohort who completed their studies at
the six Western Cape-based TVET colleges in 2017.
40
166 177
25
90 94
14
67 69
1 5 5 0 4 9 12
47 55
28
119 122
0
50
100
150
200
250
2015 2016 2017
Graduates African Coloured Indian
White Female Male Expon. (Graduates)

71
Although the base of completions in very small (177 in 2017), the curved trend line for the three-year time series (2015-2017) presents a general pattern of an increase in TVET college completions in ICT skills supply, across variables (gender and race). 10.4.4.1c New programmes offered by institutions
University of the Western Cape - Postgraduate Diploma in Computer Studies and Media Application (with specialisation
in Data Analytics and Business Intelligence. Interdisciplinary approach (business and technical skills). Implemented in 2017 with a first cohort of 25 and 33 for 2018.
- Postgraduate Diploma in AR & VR: Implementation 2019. - Postgraduate Diploma in e-Logistics: Implementation 2019. - Master’s Programme in Data Science (in collaboration with NWU). Implemented in
2018. In terms of the data science skills demand, the NRF, in collaboration with universities, are exploring the concept of a national postgraduate school, data science, mathematics and statistics to develop the necessary capacity. International universities will support this initiative. University of Cape Town - Master’s degree in Data Science University of Stellenbosch - Honours degree in Data Science (Computer Science Department)
Cape Peninsula University of Technology - MTech ICT from 2019. (Artificial Intelligence, Machine learning and Business
Intelligence). * At the completion date of this research report, not all information on new courses in CESM 06 for UCT and US was available. 10.4.2 Vendor-led initiatives To a large extent, vendors such as SAP, Oracle, Microsoft and IBM dictate what is happening in the ICT ecosystem. They are all entrenched in enterprises and are also at the forefront of new technologies. Many companies simply follow what these vendors recommend. Table 10.7 presents more information of vendor-specific training.
Table 10.7: Vendor’s positioning, trends and offering SAP145 Next generation applications are emerging fast. Cloud technologies are making IT
department’s organizational leaders. Accelerated software change is driving the world. SAP offers real-time access to information, automate manual tasks in order to thrive in the digital economy. There is also SMME management software available from SAP. The SAP university. The university caters for the Next-Gen of enterprises and enables companies around the world to connect with academic thought leaders and researchers. SAP is involved in start-ups, accelerators, tech community partners, purpose driven

72
10.4.3 Incubators, accelerators, start-ups The value chain in terms of incubators, accelerators and start-ups is depicted in Figure 10.1. Figure 10.1 Initiatives value chain There are many incubators in the ICT space. These incubators form an integral part of the ecosystem and give many people an opportunity to hone in on their skills set. The Western Cape hosts a multitude of incubators, accelerators and start-ups. For more detail, see Annexure 5. 10.4.3 Special initiatives There are some special initiatives taking place in the Western Cape. For example, Capaciti 1000 is a hub that specialises in offering training in selected skills together with tertiary
partners, venture firms, futurists, and SAP experts to reimagine the future of industries and the intelligent enterprise, with seeds in disruptive innovation. SAP offers ERP, digital Core, people management, customer experience, analytics and digital platforms.
IBM146 IBM Skills Academy is designed for academia worldwide. The program assists university faculties to provide students with additional skills, giving them an advantage in the job market. Training and certification program are designed to bridge the skills gap between universities and market industry. IBM offers Cognitive and AI, data science and analytics, blockchain, IoT, Quantum Computing, security, cloud and systems. This can happen through a blended learning approach is followed; Online courses, classroom training and hands-on lab.
Microsoft147 Microsoft South Africa embarked on a mission to train one million citizens. This will happen through the Microsoft Azure data centres that combine with other local cloud services, in order to create around 165 000 new jobs in SA through 2022. The curriculum covers five key topics including Computer Skills; The Internet, Cloud Services and the World Wide Web; Productivity Programmes (Microsoft Office); Computer Security and Privacy, and Digital Lifestyles. Free Tools and Training for SMEs & Start-ups in Africa.MS covers Virtualisation, Security, desktop management, dev ops, cloud development, mobile apps development, Database administration, DB development, BI, Adv analytics and Big data.
Oracle148 A new strategy emerged where by users will have to pay for services. You have to pay for a LTS or update every 6 month for your Java Version. This may be a huge problem for large companies. To add to this desktop and web applications must be updated or rewritten because of technical changes. This change is currently a big topic in Europe/USA leaving the future of Java unclear. It is foreseen that applications will be migrated to web applications. It could be that in future Java is not the right language to learn. The Oracle university is a well-known entity within the ICT industry. It currently offers in terms of training the following: Oracle database, Applications, Java, BI, Middleware Enterprise management, Operating systems, and virtualisation. Training is through classroom or online style training.
Incubators Accelerators Start-ups SMMEs

73
institutions, vendors and other companies. They have been successful and as added benefit places as many resources as possible through internships and full positions within the broader industries. Vodacom invests R600 million in digital skills and connectivity. However, these programmes have as a focus the foundational levels. 10.4.4 SETA perspective on skills requirements Eight (8) of the top 10 occupations that MICT-SETA regard as hard to fill vacancies, relate to ICT practitioners. Table 10. 8 shows the occupations and number of vacancies as reported for the 2017 period149.
Table 10.8: Hard-to-fill vacancies Occupations Number of Vacancies
Software developer 1131
Computer Network and Systems Engineer 352
ICT Systems Analyst 316
Programmer Analyst 165
ICT Security Specialist 150
Business Analyst 126
Database Designer and Administrator 91
Telecommunications Network Engineer 91
10.4.5 Industry perspectives on skills requirements From the interviews conducted with Cape Town-based CIOs their views on skills requirement and acquisition are presented below: 10.4.5.1 The fear-factor as driving force for skills development and skills requirements: On the question “what drivers and dynamics are at play in this sector,” it was stated by all the participants that disruption caused by new innovations drive their strategies and decisions. To an extent it is the fear factor of being “caught out” or “left behind” that motivates them. 10.4.5.2 Skills profile required include non-technical competencies: Asking about the current need profile for digital skills, the general theme that occurred is a profile that consists of innovative, creativity, and system thinking skills. Design thinking skills with the ability to see the bigger picture also formed part of the profile. References were made to business development and innovation skills, ability to work within a team as well as the ability for forward-thinking (a futuristic perspective). 10.4.5.3 Skills acquisition strategies: Currently skills are being sourced from the traditional academic institutions such as universities, TVET colleges and private education institutions. However, this approach is supplemented by simply “poaching” resources from other companies, or recruiting resources from specialist software houses and boutique software establishments. Another strategy is to appoint graduates with the preferred aptitude

74
profile, who are then directed to vendors for specific training from between 3 – 12 months. It seems as if the skills supply from tertiary institutions is insufficient to address the demand from industry which require of them to implement alternative strategies to fill the skills needs. 10.4.5.4 A demand for senior and experienced ICT practitioners: It is quite significant that CIOs’ identified the need for more experienced, senior skilled individuals with specific reference to business analytics, enterprise architects and integration specialists. No reference was made to lower level skills (such as Java, Microsoft, etc.) which provide quite a different picture than the demand demonstrated by the LinkedIn statistics (see Section 11). Table 10.9 provides the skills requirement as obtained via interviews and media reports. (Annexure 5 provides a summary of the responses of the interviewees).
Table 10.9 High level skills required by Industry Architecture and Design Data centre skills End-user computing ERP & related corporate services ICT programs Network and network management
Risk management Security Management Software Development Systems and Solutions Telecommunication Services Data Analytics
Source: Various internet sites and media reports The interviews with ICT role players gave some insight into challenges, opportunities and requirements. 10.4.6 Specific skills requirement related to new technological initiatives Enterprises such as EOH Sanlam, Old mutual, Engen and more were interviewed to gain an understanding of their current business focus. Maintenance and new developments in terms of legacy systems are still the focus areas. However, many of the organisations are piloting or experimenting with gamification, AI, BI, machine learning, IOT, Big data, Bitcoin and Blockchain to name a few. Annexure 6 provides a more comprehensive list of current initiatives. Connected to these initiatives are the skills that they require to develop and support these new initiatives and projects. 10.4.7 Demand Digital skills trends show consistency over a period of 5 years in so far data analytics and Big Data are concerned. Blockchain and Cybersecurity are fast moving up the chain of importance. Cybersecurity although not “top of mind” by many CIO’s is still important. However, Blockchain is still new and are being carefully monitored to see what benefits will be harvested and how this will fit in organisations’ strategies and business models. The view is that it is still too early to tell and a “wait and see” attitude is followed. Table 10.10 presents trends since 2014.
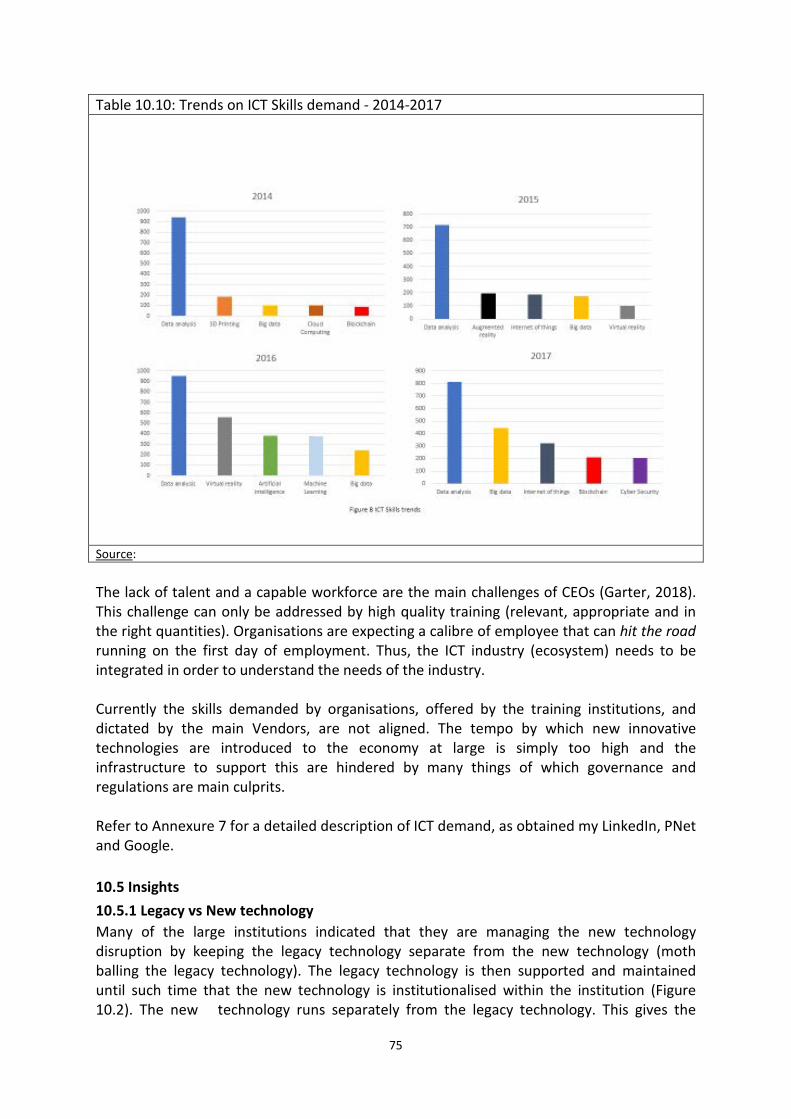
75
Table 10.10: Trends on ICT Skills demand - 2014-2017
Source: The lack of talent and a capable workforce are the main challenges of CEOs (Garter, 2018). This challenge can only be addressed by high quality training (relevant, appropriate and in the right quantities). Organisations are expecting a calibre of employee that can hit the road running on the first day of employment. Thus, the ICT industry (ecosystem) needs to be integrated in order to understand the needs of the industry. Currently the skills demanded by organisations, offered by the training institutions, and dictated by the main Vendors, are not aligned. The tempo by which new innovative technologies are introduced to the economy at large is simply too high and the infrastructure to support this are hindered by many things of which governance and regulations are main culprits. Refer to Annexure 7 for a detailed description of ICT demand, as obtained my LinkedIn, PNet and Google. 10.5 Insights 10.5.1 Legacy vs New technology Many of the large institutions indicated that they are managing the new technology disruption by keeping the legacy technology separate from the new technology (moth balling the legacy technology). The legacy technology is then supported and maintained until such time that the new technology is institutionalised within the institution (Figure 10.2). The new technology runs separately from the legacy technology. This gives the

76
business the opportunity to evaluate the new technology before accepting it. In this way the new technology can take over the legacy technology and introduce a new business model without threatening business sustainability. Figure 10.2: Decline in legacy technology
10.5.2 Legacy vs new technology skills There is a realisation within the industry at large that new skills are needed to develop, support, maintain, implement and grow the new technology. Skills such as Java and SQl are slowly becoming absolute and need to be replaced with new skills such as platform development, blockchain, and design thinking. 10.5.3 Tertiary institutions The new skills need to be supplied by all in the education sector. However, universities specific need to educate and teach higher level skills such as design thinking, systems thinking, digital leadership skills, AI, machine learning and analytics. Lower level skills can be supplied by TVET ‘s as well as private colleges and establishments. These needs are currently being fulfilled by vendors such as SAP, IBM and more. New technological advances create a huge demand for the development of “new” skills, leading to enormous strain on the skills supply value chain. Educational and training institutions find it difficult to cope with fast-changing and high demand for a skilled workforce. The tertiary institutions should be cautious as they could become irrelevant for the industry in future. This is mainly due to the fact that the accreditation process is tedious and takes exceptionally long to create a new programmes. This could take as much as 3 to 4 years
77
before implementation whereas the new technology and new products can be supplied and are indeed supplied within 3 months. 10.5.4 The management gap It is interesting to note that when interviewing CIO’s and top IT management the skills needs expressed are those of middle and higher level skills, which is in contrast to what is advertised on recruitment platform where lower level skills dominate. In some way this makes sense as the priorities of many IT departments are to maintain and support the systems needed for business to continue. New technology is rather seen as a disruptive forced that must be managed as it happens, hence reactive. This possess a huge threat to businesses as the new technology may over run the old business (Kodak and many other companies are examples of this). 10.5.5 The vendor challenge New innovation is mostly driven by vendors such as SAP, IBM, Microsoft and others. In some cases this is simply to be first in the market and to increase profits through the fear factor that is “if you do not adopt you will lose.” The challenges for companies are to see through all the smoke and mirrors, and to identify the products that will increase their sustainability and profits. However, the vendors are ideally placed to give the correct advice and guidance to organisation to guide them on their way forward. Most of the vendors do have universities to train and skill organisation in the use of the new technologies. The Vendors are currently promoting AI, BI, machine learning, Block chain, Big Data, IoT, Quantum computing and many more services and products. This is putting enormous strain on skills development. Educational and training institutions cannot cope with changes and huge demands for a skilled workforce. 10.5.6 The push and pull conundrum With the large variety of industries in the Western Cape in many cases it is the industries demanding from the ICT industry new technologies, but they also lead the way in new innovative products that need superior ICT products. This is a very desirable state to be in. In the same way ICT is offering the other industries new innovative opportunities to give them a competitive advantage. This push and pull tension between ICT and the other industries is where the opportunities for growth lies. However, some sort of alignment between ICT, the industry and government need to be achieve in order to create an environment where the industry can flourish in. 10.5.7 The impossible dream There is a perceived misalignment between the education, private and government sectors in terms of expectations. Evaluating the needs of the different industries and the employment requirements for positions, a truly superior intellectual resource is needed. Of course this is not possible. To get as close as possible to this the ICT industry and the educators need to align as far as possible and add to the skills value chain. Table 10.11 is a proposed skills development value chain.

78
Table 10.11: The proposed ICT skills value chain Supply Chain Entry level Operational level Top level
Formal higher education
Tertiary education (Universities)
TVET
Private universities
Industry led supply chain (vendors)
Private institutions
Incubators/accelerators/SMMEs
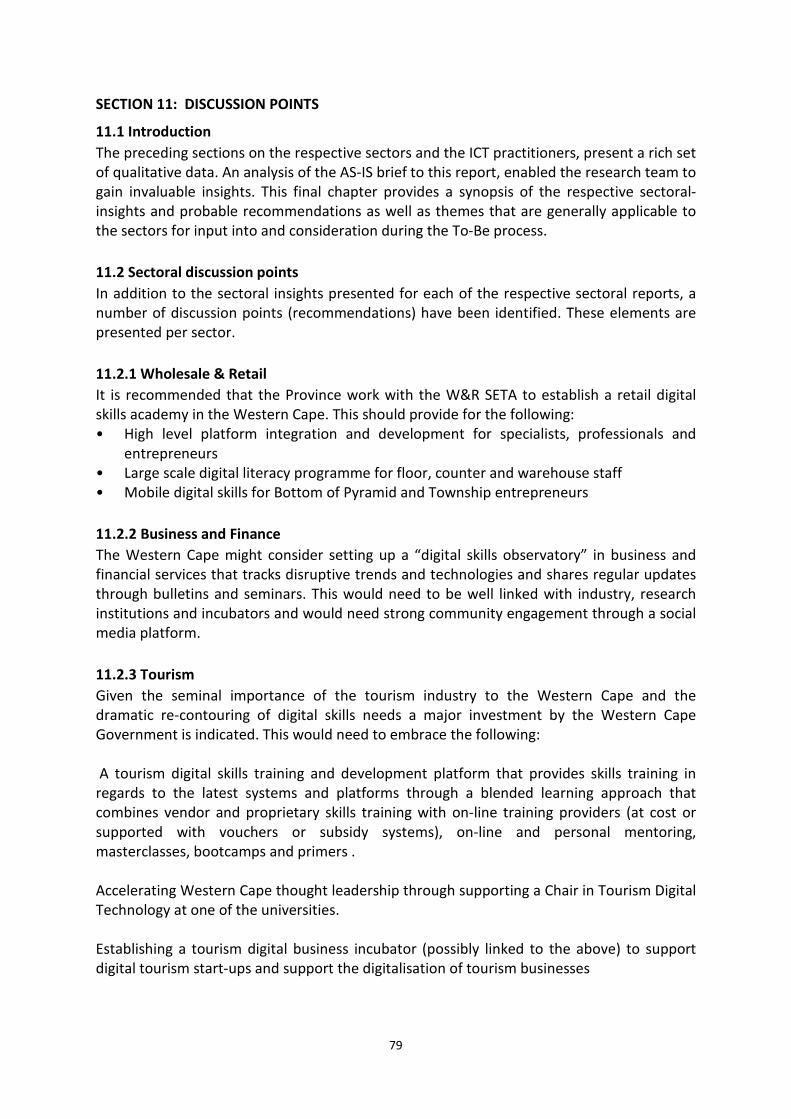
79
SECTION 11: DISCUSSION POINTS
11.1 Introduction The preceding sections on the respective sectors and the ICT practitioners, present a rich set of qualitative data. An analysis of the AS-IS brief to this report, enabled the research team to gain invaluable insights. This final chapter provides a synopsis of the respective sectoral-insights and probable recommendations as well as themes that are generally applicable to the sectors for input into and consideration during the To-Be process. 11.2 Sectoral discussion points In addition to the sectoral insights presented for each of the respective sectoral reports, a number of discussion points (recommendations) have been identified. These elements are presented per sector. 11.2.1 Wholesale & Retail It is recommended that the Province work with the W&R SETA to establish a retail digital skills academy in the Western Cape. This should provide for the following: • High level platform integration and development for specialists, professionals and
entrepreneurs • Large scale digital literacy programme for floor, counter and warehouse staff • Mobile digital skills for Bottom of Pyramid and Township entrepreneurs 11.2.2 Business and Finance The Western Cape might consider setting up a “digital skills observatory” in business and financial services that tracks disruptive trends and technologies and shares regular updates through bulletins and seminars. This would need to be well linked with industry, research institutions and incubators and would need strong community engagement through a social media platform. 11.2.3 Tourism Given the seminal importance of the tourism industry to the Western Cape and the dramatic re-contouring of digital skills needs a major investment by the Western Cape Government is indicated. This would need to embrace the following: A tourism digital skills training and development platform that provides skills training in regards to the latest systems and platforms through a blended learning approach that combines vendor and proprietary skills training with on-line training providers (at cost or supported with vouchers or subsidy systems), on-line and personal mentoring, masterclasses, bootcamps and primers . Accelerating Western Cape thought leadership through supporting a Chair in Tourism Digital Technology at one of the universities. Establishing a tourism digital business incubator (possibly linked to the above) to support digital tourism start-ups and support the digitalisation of tourism businesses
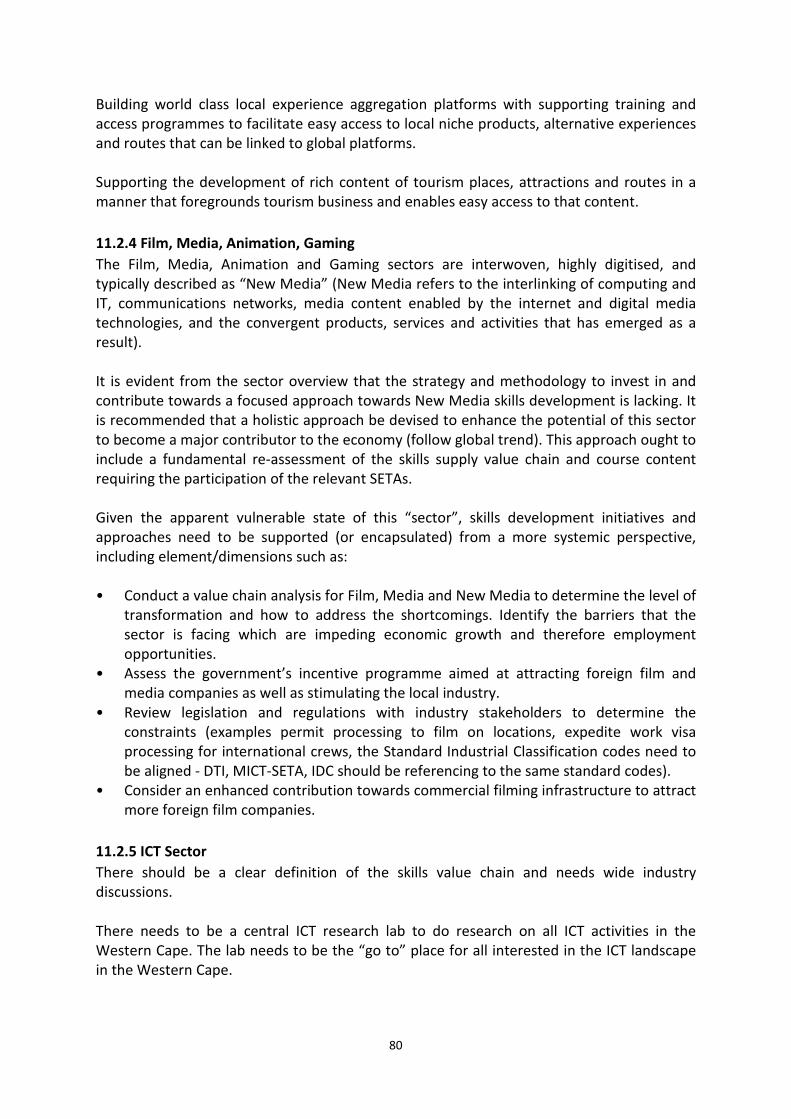
80
Building world class local experience aggregation platforms with supporting training and access programmes to facilitate easy access to local niche products, alternative experiences and routes that can be linked to global platforms. Supporting the development of rich content of tourism places, attractions and routes in a manner that foregrounds tourism business and enables easy access to that content. 11.2.4 Film, Media, Animation, Gaming The Film, Media, Animation and Gaming sectors are interwoven, highly digitised, and typically described as “New Media” (New Media refers to the interlinking of computing and IT, communications networks, media content enabled by the internet and digital media technologies, and the convergent products, services and activities that has emerged as a result). It is evident from the sector overview that the strategy and methodology to invest in and contribute towards a focused approach towards New Media skills development is lacking. It is recommended that a holistic approach be devised to enhance the potential of this sector to become a major contributor to the economy (follow global trend). This approach ought to include a fundamental re-assessment of the skills supply value chain and course content requiring the participation of the relevant SETAs. Given the apparent vulnerable state of this “sector”, skills development initiatives and approaches need to be supported (or encapsulated) from a more systemic perspective, including element/dimensions such as: • Conduct a value chain analysis for Film, Media and New Media to determine the level of
transformation and how to address the shortcomings. Identify the barriers that the sector is facing which are impeding economic growth and therefore employment opportunities.
• Assess the government’s incentive programme aimed at attracting foreign film and media companies as well as stimulating the local industry.
• Review legislation and regulations with industry stakeholders to determine the constraints (examples permit processing to film on locations, expedite work visa processing for international crews, the Standard Industrial Classification codes need to be aligned - DTI, MICT-SETA, IDC should be referencing to the same standard codes).
• Consider an enhanced contribution towards commercial filming infrastructure to attract more foreign film companies.
11.2.5 ICT Sector There should be a clear definition of the skills value chain and needs wide industry discussions. There needs to be a central ICT research lab to do research on all ICT activities in the Western Cape. The lab needs to be the “go to” place for all interested in the ICT landscape in the Western Cape.

81
A CIO council for the Western Cape is urgently needed. The aims of the council still need to be determined but could include i) overseeing the ICT lab, discussion forum to guide the Government and industry on trends and especially skills strategies. Urgent attention needs to be given in skills training of Data Analytics and Big Data and input to assisting industry i) More research into Blockchain, its benefits and how it can be utilised (opportunities) by the different industries are needed 11.3 Generic discussion points 11.3.1 A differentiated approach for the identification of sector-specific digital skills requirements Addressing the digital skills requirements of realising the vision of becoming a global digital hub, necessitates a more incorporated digital skills development approach than the current supply of ICT practitioner skills through the various skills supply channels. The sector overviews demonstrate the necessity of identifying and including sector-specific digital competencies (or capabilities not typically provided by ICT practitioner skills) in the job profiles and families of the different sectors on introductory, intermediary, advanced, specialist and leadership levels. It is also evident that the nature of the digital skills competencies required in the various sectors is dissimilar. The tourism sector is a good point in case where the digital skills requirements for tourism operators can typically be described as digitally fluid which will enable them to navigate amongst various platforms, websites and different digital tools. It therefore, seems appropriate and necessary for each of the sectors to identify and develop a digital competency profile (for its respective jobs and job families) that will be appropriate and relevant for the particular sector. 11.3.2 Pro-active skilling (upskilling) of first-time job entrants Working towards the pro-active skilling (or upskilling) of first-time employees to be digitally competent to function effectively within the fast-changing digital economy, is a requirement as the industry cannot constantly play catch-up. It is evident from sector overviews that competency in the Microsoft Office Suite (often referred to as digital work-readiness competency) is not sufficient anymore. Competences such as media literacy and data literacy are increasingly regarded as essential components of (entry-level) digital literacy. In addition to digital literacy, it therefore necessitates the integration of digital competencies within the training curricula of formal training institutions, as guided by sector-specific digital skills requirements (mentioned in 11.3.1). This should facilitate the supply of human resources (i.e. first-time job entrants) with the necessary functional (business) and digital skills relevant to the particular sector.

82
11.3.3 Upskilling and reskilling of people already in employment Technological advances and disruption are also affecting the current work force on all job levels. To facilitate the sustained inclusion of employees in the digital economy and the sustained competitiveness of employers (companies/institutions), it will be necessary to develop and implement focused sector-specific upskilling and reskilling interventions to address current and anticipated digital skills requirements. Examples of such initiatives are already occurring and could serve as models for implementation in all sectors. 11.3.4 New and innovative models and approaches for skills acquisition Technological development (digital disruption) has been described as a “speed-ball injected into the economy”150, which accelerates the tempo for digital skills demand from intermediate level to specialist and leadership level. The accelerated digital skills demand outpaces the current traditional model of skills acquisition practices. The adequate skilling of new job entrants, as well as the reskilling and upskilling of those already in employment, will require a rethink of the current skills development and skills funding models and approaches. 11.3.5 Technical and digital skills are not the only requirements It is evident from the sector overviews that (advanced) technical and/or digital skills are not the only requirements for positioning the Western Cape as a leading global digital hub. Skills such as problem solving, complexity thinking, computational thinking, design thinking skills, ability to innovate, and the ability to work across functional or disciplinary boundaries and team work seem to be important skills for this discourse. 11.3.7 Combining efforts for high impact The efforts of the National Research Foundation (NRF) and various universities to address the data analytics skills shortage in the country serve as an excellent example of how stakeholders can collaborate and combine efforts to address skills demands in a coordinated manner for impact. Perhaps other areas of digital skills shortages (across sectors) can be addressed in similar fashion. 11.3.8 Acknowledging the human dimension, combating ignorance and fear Although the main objective of this project is to work towards a shared agenda for digital skills development, it is also of importance to consider the approach adopted in motivating for and driving towards the preferred “To-Be” scenario. Cognisance needs to be taken of the potential ignorance and even fear of particular target audiences to engage with ICTs and the digital economy. It will be worthwhile considering people-friendly approaches and even the inclusion of behavioural economic principles to facilitate the larger (social) change process.
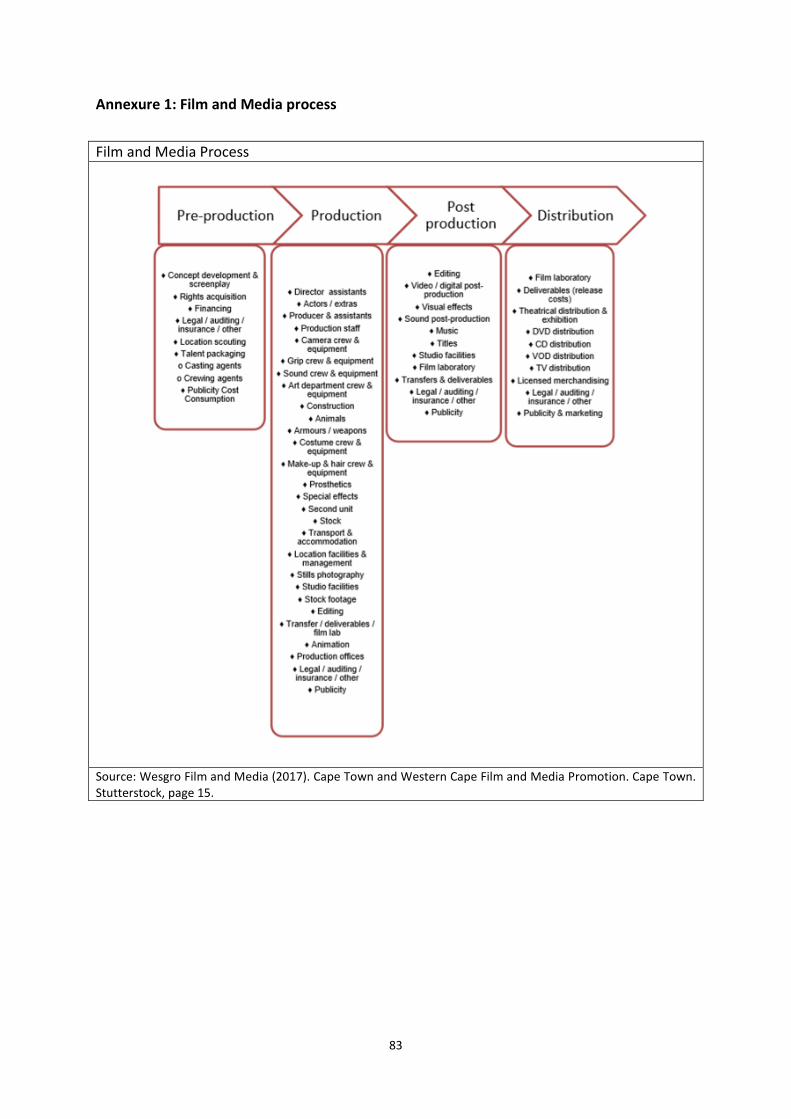
83
Annexure 1: Film and Media process
Film and Media Process
Source: Wesgro Film and Media (2017). Cape Town and Western Cape Film and Media Promotion. Cape Town. Stutterstock, page 15.

84
Annexure 2: Film & media
To develop the industry, government also encourages foreign production as a way not only to earn revenue but also upskill local resource. From the current structure, there is a gap in terms of initiatives offered to those that are just starting out and have no credentials as most of the current support initiatives require film makers to at least have a resume or experience, without this emerging film makers will not be able to develop any productions due to lack of start-up capital. Further leaving the industry untransformed and underserviced in some parts of the country151.

85
Summary of initiative, criteria and offerings in the film and media industry

86
Source: Thornton, G. (2017). Cape Town & Western Cape Film & Media Sector Study. Cape Town: Stratecon, page 78.
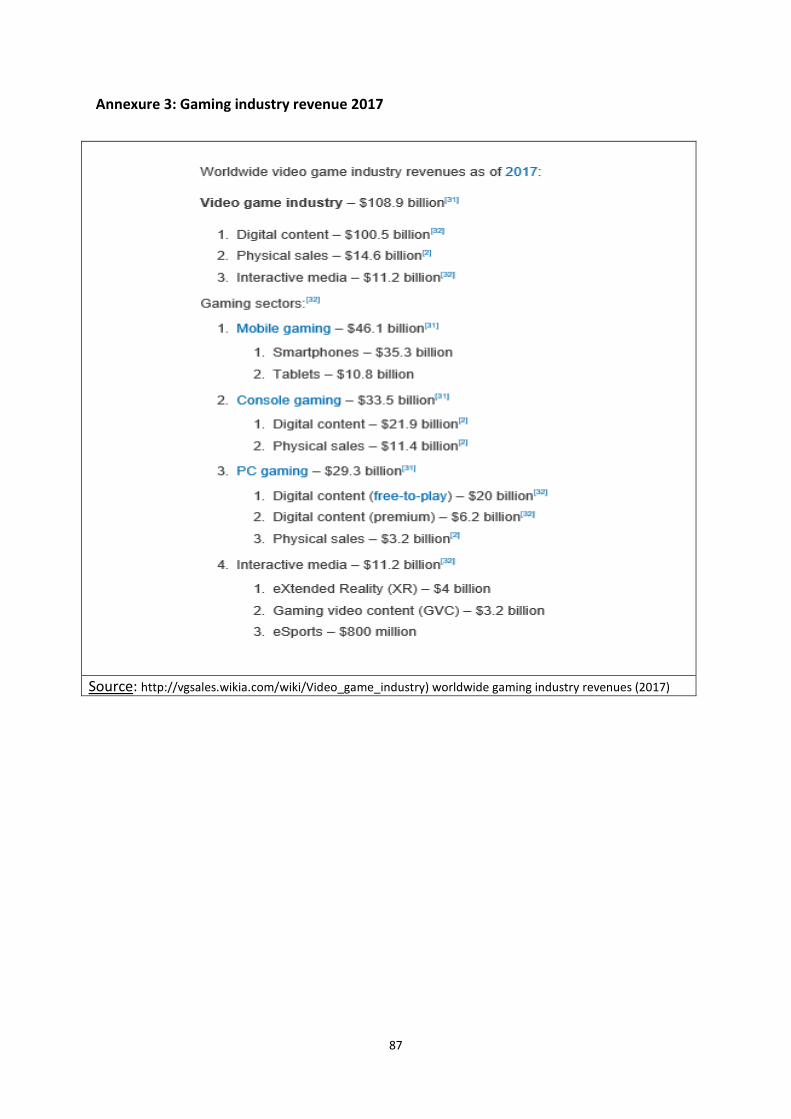
87
Annexure 3: Gaming industry revenue 2017
Source: http://vgsales.wikia.com/wiki/Video_game_industry) worldwide gaming industry revenues (2017)
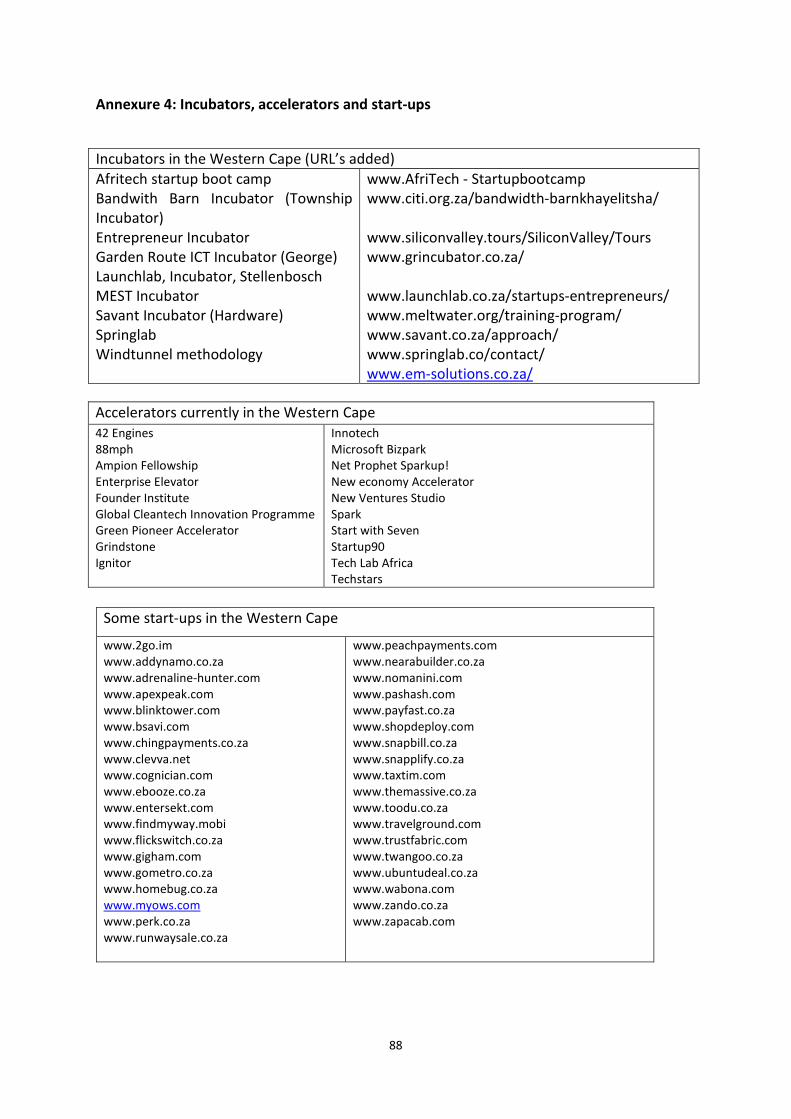
88
Annexure 4: Incubators, accelerators and start-ups
Accelerators currently in the Western Cape 42 Engines 88mph Ampion Fellowship Enterprise Elevator Founder Institute Global Cleantech Innovation Programme Green Pioneer Accelerator Grindstone Ignitor
Innotech Microsoft Bizpark Net Prophet Sparkup! New economy Accelerator New Ventures Studio Spark Start with Seven Startup90 Tech Lab Africa Techstars
Some start-ups in the Western Cape
www.2go.im www.addynamo.co.za www.adrenaline-hunter.com www.apexpeak.com www.blinktower.com www.bsavi.com www.chingpayments.co.za www.clevva.net www.cognician.com www.ebooze.co.za www.entersekt.com www.findmyway.mobi www.flickswitch.co.za www.gigham.com www.gometro.co.za www.homebug.co.za www.myows.com www.perk.co.za www.runwaysale.co.za
www.peachpayments.com www.nearabuilder.co.za www.nomanini.com www.pashash.com www.payfast.co.za www.shopdeploy.com www.snapbill.co.za www.snapplify.co.za www.taxtim.com www.themassive.co.za www.toodu.co.za www.travelground.com www.trustfabric.com www.twangoo.co.za www.ubuntudeal.co.za www.wabona.com www.zando.co.za www.zapacab.com
Incubators in the Western Cape (URL’s added) Afritech startup boot camp Bandwith Barn Incubator (Township Incubator) Entrepreneur Incubator Garden Route ICT Incubator (George) Launchlab, Incubator, Stellenbosch MEST Incubator Savant Incubator (Hardware) Springlab Windtunnel methodology
www.AfriTech - Startupbootcamp www.citi.org.za/bandwidth-barnkhayelitsha/ www.siliconvalley.tours/SiliconValley/Tours www.grincubator.co.za/ www.launchlab.co.za/startups-entrepreneurs/ www.meltwater.org/training-program/ www.savant.co.za/approach/ www.springlab.co/contact/ www.em-solutions.co.za/
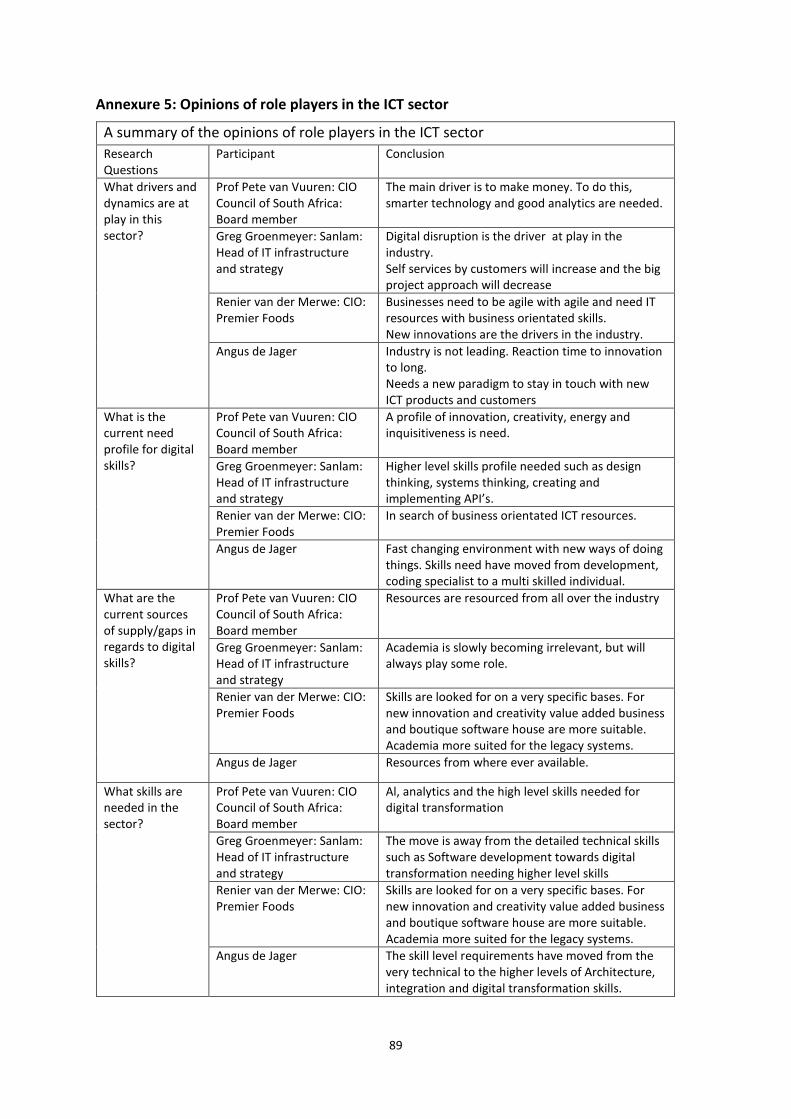
89
Annexure 5: Opinions of role players in the ICT sector
A summary of the opinions of role players in the ICT sector Research Questions
Participant Conclusion
What drivers and dynamics are at play in this sector?
Prof Pete van Vuuren: CIO Council of South Africa: Board member
The main driver is to make money. To do this, smarter technology and good analytics are needed.
Greg Groenmeyer: Sanlam: Head of IT infrastructure and strategy
Digital disruption is the driver at play in the industry. Self services by customers will increase and the big project approach will decrease
Renier van der Merwe: CIO: Premier Foods
Businesses need to be agile with agile and need IT resources with business orientated skills. New innovations are the drivers in the industry.
Angus de Jager Industry is not leading. Reaction time to innovation to long. Needs a new paradigm to stay in touch with new ICT products and customers
What is the current need profile for digital skills?
Prof Pete van Vuuren: CIO Council of South Africa: Board member
A profile of innovation, creativity, energy and inquisitiveness is need.
Greg Groenmeyer: Sanlam: Head of IT infrastructure and strategy
Higher level skills profile needed such as design thinking, systems thinking, creating and implementing API’s.
Renier van der Merwe: CIO: Premier Foods
In search of business orientated ICT resources.
Angus de Jager Fast changing environment with new ways of doing things. Skills need have moved from development, coding specialist to a multi skilled individual.
What are the current sources of supply/gaps in regards to digital skills?
Prof Pete van Vuuren: CIO Council of South Africa: Board member
Resources are resourced from all over the industry
Greg Groenmeyer: Sanlam: Head of IT infrastructure and strategy
Academia is slowly becoming irrelevant, but will always play some role.
Renier van der Merwe: CIO: Premier Foods
Skills are looked for on a very specific bases. For new innovation and creativity value added business and boutique software house are more suitable. Academia more suited for the legacy systems.
Angus de Jager Resources from where ever available.
What skills are needed in the sector?
Prof Pete van Vuuren: CIO Council of South Africa: Board member
Al, analytics and the high level skills needed for digital transformation
Greg Groenmeyer: Sanlam: Head of IT infrastructure and strategy
The move is away from the detailed technical skills such as Software development towards digital transformation needing higher level skills
Renier van der Merwe: CIO: Premier Foods
Skills are looked for on a very specific bases. For new innovation and creativity value added business and boutique software house are more suitable. Academia more suited for the legacy systems.
Angus de Jager The skill level requirements have moved from the very technical to the higher levels of Architecture, integration and digital transformation skills.

90
Annexure 6: Business Initiatives
Current Enterprise initiatives and skills required for the development of the initiatives Initiatives AR App / Gamification Big Data Analytics Bitcoin payment pilot Boost in ICT Skills - 44 students, 12 week training in software Programming language Scratch Computer technician apprenticeship Cyber Security Cyber Security / Disaster Recovery Entrepreneurial Dev Programme Fintech start-up / Easy to setup insurance In-store Wifi / E-commerce lockers (older) People & Potential Programme Project / Prototype Providing basic online courses and infrastructure Scan card and collect items Self-Checkout Cashier Tech Talent Programme
Skills Basic IT skills Big Data technology Block chain skills Business Continuity Management Data analytics Business development skills Entrepreneurial skills Finance skills Integration skills Networking skills Programming skills Project management Security knowledge System Management Digital literacy/ fluidity
91
Annexure 7: Western Cape digital skills agenda
Digital Skills – Demand Analysis for ICT and related skills

92
1 Methodology ________________________________________________________________ 94
1.1 ICT and Related Skills _________________________________________________________ 94
1.2 LinkedIn data _______________________________________________________________ 95
1.3 Google Trends ______________________________________________________________ 96
1.4 Pnet ______________________________________________________________________ 97
2 Data Presentation & Analysis ___________________________________________________ 98
2.1 LinkedIn Data _______________________________________________________________ 98
2.1.1 General ______________________________________________________________ 98
2.1.2 ICT related Vacancies by Experience ______________________________________ 101
2.1.3 ICT related Vacancies by Sector __________________________________________ 101
2.1.4 Top Information Systems skills Requirement ________________________________ 102
2.1.5 Top Five Information Systems skills by Sector _______________________________ 103
2.1.6 Top Programming Skills Requirement _____________________________________ 105
2.1.7 Top 5 Programming Skills by Sector _______________________________________ 107
2.2 Google Trends Data _________________________________________________________ 110
2.2.1 Information Systems skills Search Trends ___________________________________ 110
2.2.2 Search Trends Volume for Information Systems skills Over Five Years ____________ 113
2.2.3 Programming Skills Search trends ________________________________________ 114
2.2.4 Search Trends Volume for Programming Skills Over Five Years __________________ 117
2.3 Pnet Data _________________________________________________________________ 118
2.3.1 General _____________________________________________________________ 118
2.3.2 Top 10 ICT Vacancies per Year ___________________________________________ 120
2.3.3 ICT Vacancies by Sector ________________________________________________ 123
2.3.4 Programming Skills Required by Year ______________________________________ 124

93
Table of Figures Figure 1: Total number of ICT vacancies in major tech cities _________________________ 98 Figure 2: ICT vacancies per 100,000 in major tech cities ____________________________ 98 Figure 3: ICT Vacancies as a share of all vacancies in SA ____________________________ 99 Figure 4: ICT Vacancies as a share of all vacancies in Cape Town _____________________ 99 Figure 5: Share of ICT vacancies by cities in SA __________________________________ 100 Figure 6: : ICT vacancies as a share of all vacancies in major tech cities _______________ 100 Figure 7: ICT Vacancies by Experience _________________________________________ 101 Figure 8: ICT Vacancies by Sector _____________________________________________ 102 Figure 9: Information Systems skills vacancies in Cape Town _______________________ 102 Figure 10 ICT Vacancies by Information Systems skills in the Financial Services Sector ___ 103 Figure 11: ICT Vacancies by Information Systems skills in the Retail Sector ____________ 103 Figure 12: ICT Vacancies by Information Systems skills in the ICT Services Sector _______ 104 Figure 13: Consolidated Information Systems skills Requirement ____________________ 104 Figure 14: Top 5 Programming Skills Required in Cape Town _______________________ 105 Figure 15: Top 10 Programming skills required in Cape Town _______________________ 106 Figure 16: ICT Vacancies by Programming Skills in Financial Sector __________________ 107 Figure 17: ICT Vacancies by Programming Skills in Retail Sector _____________________ 107 Figure 18: ICT Vacancies by Programming Skills in ICT-Services Sector ________________ 108 Figure 19: Programming Skills Requirement by Sector ____________________________ 108 Figure 20: Number of Keyword Searches by Technology Skill in 2014 _________________ 110 Figure 21: Number of Keyword Searches by Technology Skill in 2015 _________________ 110 Figure 22: Number of Keyword Searches by Technology Skill in 2016 _________________ 111 Figure 23 Number of Keyword Searches by Technology Skill in 2017 _________________ 111 Figure 24: Number of Keyword Searches by Technology Skill in 2018 _________________ 112 Figure 25: Search Trends Volume for Information Systems skills by Year ______________ 113 Figure 26: Number of Keyword Searches by Programming Skill in 2014 _______________ 114 Figure 27: Number of Keyword Searches by Programming Skill in 2015 _______________ 114 Figure 28: Number of Keyword Searches by Programming Skill in 2016 _______________ 115 Figure 29: Number of Keyword Searches by Programming Skill in 2017 _______________ 115 Figure 30: Number of Keyword Searches by Programming Skill in 2018 _______________ 116 Figure 31: Search Trends Volume for Programming Skills by Year ____________________ 117 Figure 32: Total number of vacancies and ICT vacancies per month __________________ 118 Figure 33: Share of ICT Vacancies of All Vacancies in WC 2016-2018 _________________ 118 Figure 34: ICT Vacancies as a share of all Vacancies ______________________________ 119 Figure 35: ICT Vacancies by Suburbs in September 2018 in WC _____________________ 119 Figure 36: Top 10 Vacancies – Sept 2016 _______________________________________ 120 Figure 37: Top 10 vacancies - Sept 2017________________________________________ 120 Figure 38: Top 10 vacancies - Sept 2018________________________________________ 121 Figure 39: Top vacancies per 1000 ICT vacancies compared by year __________________ 122 Figure 40:Vacancies per sector – Total number of vacancies _______________________ 123 Figure 41: Vacancies by Sector - Per 1000 ICT Vacancies ___________________________ 123 Figure 42:Programming skills required – Sept 2016 _______________________________ 124 Figure 43: Programming skills required – Sept 2017 ______________________________ 125 Figure 44: Programming skills required – Sept 2018 ______________________________ 125 Figure 45:Top programming skills required per 1000 ICT vacancies compared by year ___ 125
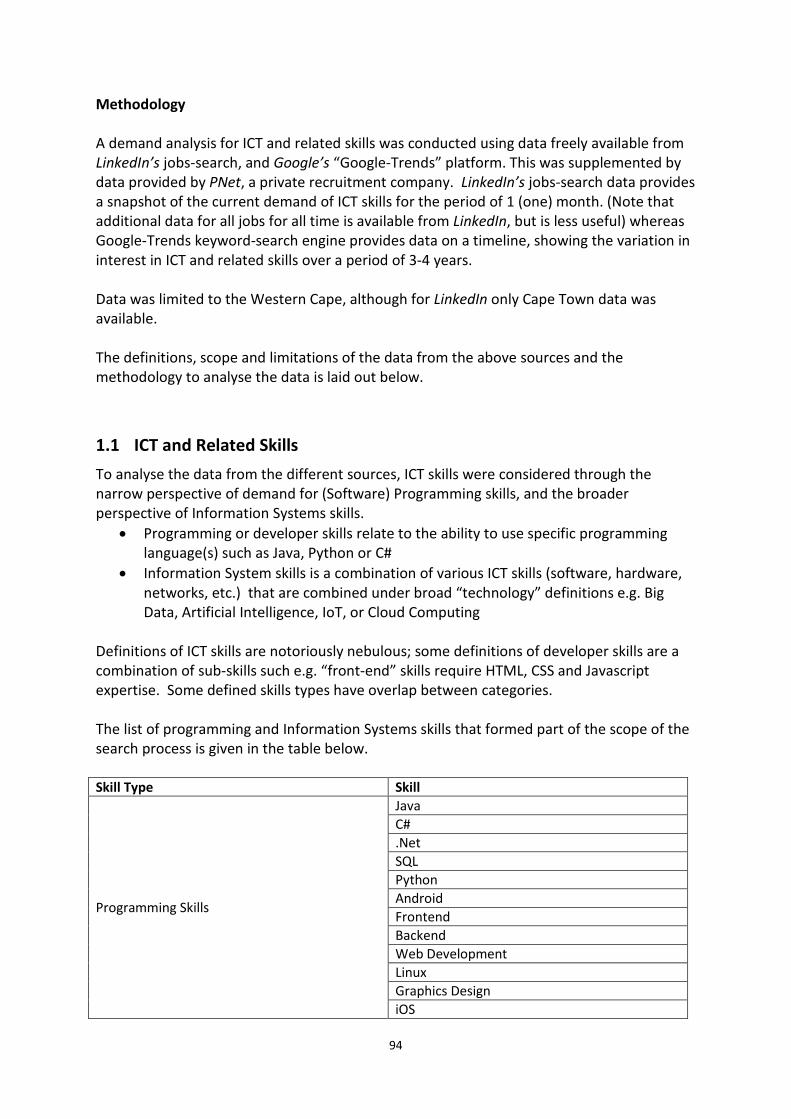
94
Methodology A demand analysis for ICT and related skills was conducted using data freely available from LinkedIn’s jobs-search, and Google’s “Google-Trends” platform. This was supplemented by data provided by PNet, a private recruitment company. LinkedIn’s jobs-search data provides a snapshot of the current demand of ICT skills for the period of 1 (one) month. (Note that additional data for all jobs for all time is available from LinkedIn, but is less useful) whereas Google-Trends keyword-search engine provides data on a timeline, showing the variation in interest in ICT and related skills over a period of 3-4 years. Data was limited to the Western Cape, although for LinkedIn only Cape Town data was available. The definitions, scope and limitations of the data from the above sources and the methodology to analyse the data is laid out below.
1.1 ICT and Related Skills To analyse the data from the different sources, ICT skills were considered through the narrow perspective of demand for (Software) Programming skills, and the broader perspective of Information Systems skills.
• Programming or developer skills relate to the ability to use specific programming language(s) such as Java, Python or C#
• Information System skills is a combination of various ICT skills (software, hardware, networks, etc.) that are combined under broad “technology” definitions e.g. Big Data, Artificial Intelligence, IoT, or Cloud Computing
Definitions of ICT skills are notoriously nebulous; some definitions of developer skills are a combination of sub-skills such e.g. “front-end” skills require HTML, CSS and Javascript expertise. Some defined skills types have overlap between categories. The list of programming and Information Systems skills that formed part of the scope of the search process is given in the table below. Skill Type Skill
Programming Skills
Java C# .Net SQL Python Android Frontend Backend Web Development Linux Graphics Design iOS

95
Database Business Intelligence Social Media SAP
Information Systems skills
Data Analytics Big Data Cyber Security Machine Learning Blockchain Robotic Process Automation Internet of Things Artificial Intelligence Virtual Reality Robotics 3D Printing Augmented Reality Quantum Computing
1.2 LinkedIn data LinkedIn’s job-search engine was used to extract vacancy data for the ICT field in Cape Town over a period of one month. LinkedIn’s filter functions were used across all searches, with the following filters. Filter Type Filter Used Description Search Location Cape Town Area LinkedIn recognises Cape Town as a valid location
filter, but not the “Western Cape” and doesn’t provide vacancy data at provincial level. Data for specific “City” locations such as Paarl and George were available, but the number of vacancies in those locations were insignificant compared to those for Cape Town, and have not been considered in the analysis.
Date Posted (Timeframe)
Past Month This filtered out vacancies that were advertised more than four weeks before the date of extraction. The reason for limiting the scope to one month only was that, the alternative filters provided only either the vacancies in the past 24 hours or all vacancies that were ever posted on the website
Job function Information Technology
This was a pre-defined filter tag that filtered out all the non-ICT related vacancies. This filter was used because it best matched the scope of ICT related vacancies
Industry (Sector)
Various When extracting data on sector specific ICT related vacancies, the Industry filter was set to the sector of interest e.g. Retail or Financial Services. The “Media” sector was composed of a combination of several sub-sectors such as “Broadcast media”, “Online

96
media”, “Gaming”, “Animation”. The grouping was done because of the small number vacancies in these individual sub-sectors.
Title (Job Title)
Various When extracting skill specific vacancies such as Java Developer, the job-title filter was set to specific keywords of interest such as “Java” or “Java Developer”
Experience Level
Various To determine the level of expertise required by the industry in the ICT field, this filter was pre-set by LinkedIn to e.g. internship, entry level or mid-senior level.
Number of Applicants
Various This filter was set to “Under 10 applicants” when searching for vacancies that had less than 10 applications, this data was used to look at how many vacancies had a poor response by applicants.
In addition to job-search filters, LinkedIn also provides “competitive intelligence” about applicants for specific vacancies. This applicant data provides an insight into education, seniority level and location of applicants. For example, using these insights, it was possible to determine the location, education and seniority level of applicants for Software development jobs in Cape Town. The limitations of the data must be emphasized. LinkedIn is the largest online jobs and recruitment platform across the world, but it is at an early stage of adoption locally – local recruitment companies that have personal and direct contact with human resource departments still play a significant role in jobs placement in South Africa. Secondly, the data presented is only over a single month – long term trends cannot be easily extrapolated. Nevertheless, we are of the opinion that the LinkedIn data provides useful insights on current skills demand.
1.3 Google Trends The Google Trends engine allows users to extract keyword-search data. This produces the number of searches made for a specific keyword, over any given time (e.g. per week or per year). The Google Trends engine was used mainly because of a lack of historical vacancy data on LinkedIn. The keyword-search trends data indirectly hints at skills in demand over a time period. The following filters were used across all searches: Filter Type Filter Used Description Location Western Cape Google Trends provides provincial level data. It
should be noted that the yearly trend characteristics are similar for Cape Town as for the Province, as the majority of ICT-related searches originate from the Cape Town area
Timeframe January 2014 to Sept 2018
Even though, search data is available for the last 15 years, only five years of data was extracted. This was done because Google’s keyword search data collection methods have changed vastly over the last 15 years, and because any data older than five years

97
is likely to be outdated for the ICT sector Keyword Category
Jobs This filter ensures that keyword searches are specific to vacancies. This excludes general searches e.g. when extracting data for “Python” as an ICT skill, this filter would filter out search results data relating to say Monty Python’s Flying Circus, or the reptile python.
Even though Google Trends provides insight into the trends for skills demand over time, it has certain constraints e.g. the data cannot be filtered by sector. It must also be noted that the results are that of keyword search and not vacancies, which means that the trend will represent the interest in a specific skill rather than actual demand as represented by a vacancy. Therefore, Google Trends data must be used in conjunction with the LinkedIn data or other skills demand data in order to provide a more complete picture
1.4 Pnet Pnet is a local careers portal that provided access to three months of vacancy data over a three-year period i.e. September 2016, September 2017 and September 2018. The data for each period was analysed and compared. Unlike Linkedin, Pnet’s data did not have pre-defined key-word tags, which made the data analysis difficult. The following filters were used when analyzing the data: Filter Type Filter Used Description Job Region (Province Location)
Western Cape Provincial level data was extracted
Timeframe September 2016, September 2017, September 2018
A month-long snapshot of each of the three years’ vacancy data was extracted, in order to obtain a consistent view of demand over time
Listing Sector (Job Function)
IT & Internet This filter was applied to focus the scope of all ICT related vacancies
Listing Sector (Sector)
Various In order to extract sector specific data, this filter was applied using specific sectors such as finance, or retail
Skills Required Various To extract skill specific vacancy data, this filter was applied using specific skill keyword such as C# or Java
Job Location (Suburb Location)
Various This filter was applied to determine the number of vacancies per suburb in Western Cape

98
Data Presentation & Analysis
1.5 LinkedIn Data 1.5.1 General In order to understand demand for ICT skills in Cape Town in comparison with other cities across the world a comparative view of ICT vacancies in a number of other major cities was obtained.
Figure 1: Total number of ICT vacancies in major tech cities
Figure 2: ICT vacancies per 100,000 in major tech cities • LinkedIn carries jobs for a wide range of sectors. We analysed what the percentage of
vacancies for ICT jobs against the total number of listed vacancies. • We then looked at the other South African cities to see what the relative percentage of ICT
0
10000
20000
30000
40000
50000
60000
London San FranciscoBay
Bengaluru Joburg Cape Town Durban Nairobi
Tota
l ICT
Vac
anci
es in
1 m
onth
City
0
200
400
600
800
1000
1200
San FranciscoBay
London Joburg Cape Town Bengaluru Durban Nairobi
ICT
Vaca
ncie
s per
100
,000
in a
mon
th
City

99
jobs are across the major cities.
Figure 3: ICT Vacancies as a share of all vacancies in SA
Figure 4: ICT Vacancies as a share of all vacancies in Cape Town
79%
21%
Total Jobs
ICT Jobs
74%
26% Total Jobs
ICT relatedjobs

100
Figure 5: Share of ICT vacancies by cities in SA
Figure 6: ICT vacancies as a share of all vacancies in major tech cities • Nationally, Johannesburg has 40% more ICT vacancies than Cape Town • On an international scale, large tech cities such as London and San Francisco have more than 7
times the number of ICT jobs than Cape Town • The share of ICT jobs as a ratio of all the advertised jobs in Cape Town is on par with
Johannesburg and the major tech cities around the world.
0
2000
4000
6000
8000
10000
12000
Joburg Cape Town Durban Other
Num
ber o
f Vac
anci
es in
Cap
e To
wn
in 1
m
onth
City
0%
5%
10%
15%
20%
25%
30%
35%
Bengaluru Cape Town San FranciscoBay
London Joburg Durban Nairobi
ICT
Vaca
ncie
s as a
Rat
io o
f Tot
al V
acan
cies
in 1
mon
th
City

101
The Data that follows is based on analysis for Cape Town only
1.5.2 ICT related Vacancies by Experience
Figure 7: ICT Vacancies by Experience • The majority (>90%) of ICT related vacancies are either Entry or Associate level (i.e. less than 5
years of work experience) • Note that only 1% Internship opportunities are available
• According to some CIO’s recruiting lower level resource is not that much of problem. It is however difficult to find senior people to fill vacancies. This is in contrast to the LinkedIn data. However, it must be taken into consideration how long it takes to find suitable people for the job. To advertise for say 4000 entry level jobs and it is filled within 30 days compared to advertise a senior level job but it takes 2 years to find a resource, shows the complexity of the issues at hand.
1.5.3 ICT related Vacancies by Sector
0
500
1000
1500
2000
2500
3000
3500
4000
4500
Entry Level Associate Mid-Senior Level Director Executive
Num
ber o
f vac
anci
es in
cap
e to
wn
in 1
mon
th
Experience Level

102
Figure 8: ICT Vacancies by Sector • The majority (>90%) of ICT related jobs are in either the ICT sector (comprising Hardware,
Software, Networks, Communications, Services, etc.) or in the Financial Services sector • The media sector, which includes online media, broadcast media, gaming and animation, only
has a small set of vacancies
1.5.4 Top Information Systems skills Requirement
Figure 9: Information Systems skills vacancies in Cape Town • Data analytics (which could be convoluted with Big Data ) is by far (64%) the largest skill
requirement for Information Systems skills vacancies
0
500
1000
1500
2000
2500
3000
3500
4000
4500
ICT Financial ServicesIndustry
Retail Industry Leisure, Travel &Tourism
Media
Tota
l Num
ber o
f Vac
anci
es in
Cap
e To
wn
in
1 m
onth
Sector
0
100
200
300
400
500
600
700
800
Data Analytics Big Data Cloud Computing Cyber Security Machine LearningNum
ber o
f Vac
anci
es in
Cap
e To
wn
in 1
mon
th
Information System

103
• Analysing the ICT skills required per sector shows (Figure 5) that Data analytics and Big Data to dominate the skills requirements. This again supports the industry leader’s opinion of skills requirements.programming skils
•
1.5.5 Top Five Information Systems skills by Sector
Figure 10 ICT Vacancies by Information Systems skills in the Financial Services Sector
Figure 11: ICT Vacancies by Information Systems skills in the Retail Sector
0
50
100
150
200
250
300
350
400
450
500
Data Analytics Big Data Cyber Security Machine Learning Cloud Computing
Num
ber o
f Vac
anci
es in
Cap
e To
wn
in 1
mon
th
Skills
0
10
20
30
40
50
60
Data Analytics Big Data Cyber Security Virtual Reality Cloud Computing
Num
ber o
f Vac
anci
es in
Cap
e To
wn
in 1
mon
th
Skills

104
Figure 12: ICT Vacancies by Information Systems skills in the ICT Services Sector
Figure 13: Consolidated Information Systems skills Requirement • Sector based Skills data was only available for three sectors – Financial Services, ICT Services,
and Retail • Data Analytics and Big data appear as the top skills required in each of the three sectors.
There is a close correlation in the skills set for Big Data and Data Analytics. • Financial services have the greatest need for Data skills
0
50
100
150
200
250
300
350
Data Analytics Big Data Cloud Computing Cyber Security Machine Learning
Num
ber o
f Vac
anci
es in
Cap
e To
wn
in 1
mon
th
Skills
0
100
200
300
400
500
600
700
800
900
Num
ber o
f Vac
anci
es in
Cap
e To
wn
in 1
mon
th
ICT Skills
ICT
Retail
Financial

105
• Virtual Reality, whilst small, appears to hold a potentially significant role in the Retail sector • Overlap of information may have caused some double counting
1.5.6 Top Programming Skills Requirement
Figure 14: Top 5 Programming Skills Required in Cape Town
0
50
100
150
200
250
300
350
400
450
Java C# Frontend IT Business Analyst Web Developer
Num
ber o
f Vac
anci
es in
Cap
e To
wn
in 1
mon
th
Programming Skill

106
Figure 15: Top 10 Programming skills required in Cape Town
• The top programming skills requirement of Java and C# hint at mobile app-development and software development.
• Analysing the programming skills requirements Java and C# is in high demand. Web development is not that clear and many languages are being applied. It is interesting to note that the CIO’s and industry leaders are of the opinion that these skills requirements will become less important and eventually disappear. As mentioned earlier it will be replaced with a different kind of resource.
0
50
100
150
200
250
300
350
400
450N
umbe
r of V
acan
cies
in C
ape
Tow
n in
1 m
onth
Programming Skill
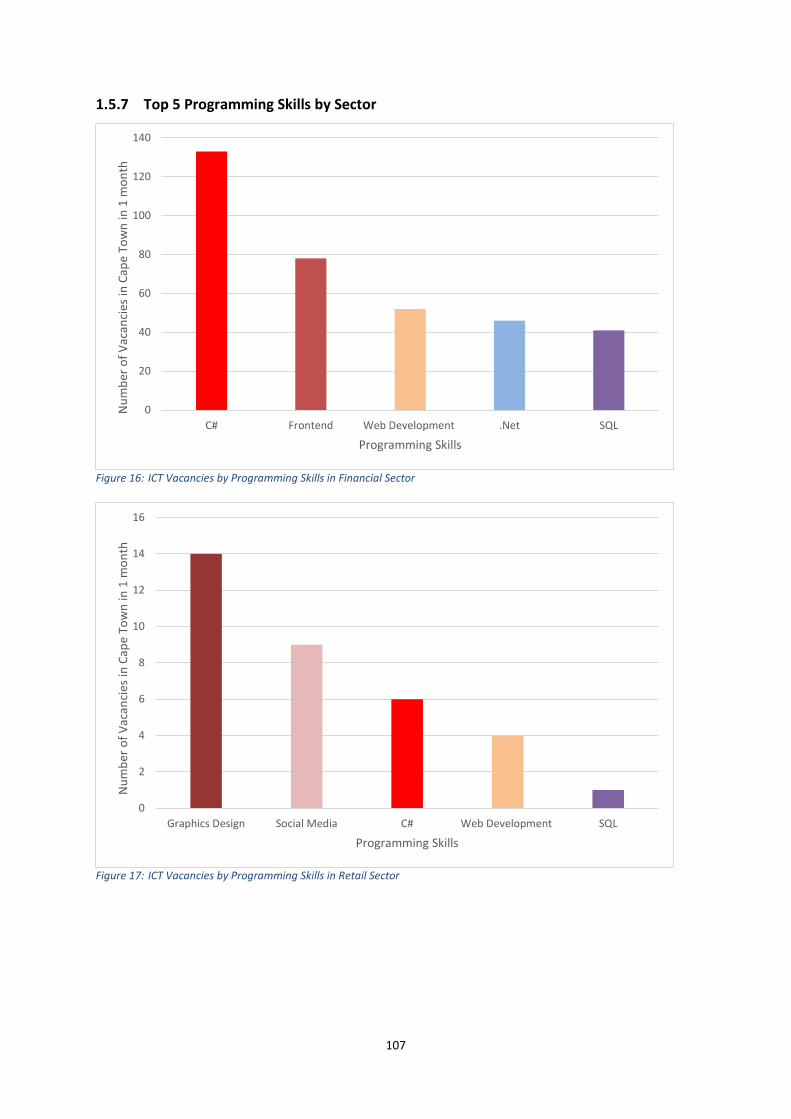
107
1.5.7 Top 5 Programming Skills by Sector
Figure 16: ICT Vacancies by Programming Skills in Financial Sector
Figure 17: ICT Vacancies by Programming Skills in Retail Sector
0
20
40
60
80
100
120
140
C# Frontend Web Development .Net SQL
Num
ber o
f Vac
anci
es in
Cap
e To
wn
in 1
mon
th
Programming Skills
0
2
4
6
8
10
12
14
16
Graphics Design Social Media C# Web Development SQL
Num
ber o
f Vac
anci
es in
Cap
e To
wn
in 1
mon
th
Programming Skills

108
Figure 18: ICT Vacancies by Programming Skills in ICT-Services Sector
Figure 19: Programming Skills Requirement by Sector • Although the top skill requirement in the Financial Services and Retail sector is Data Analytics,
none of the usual data analysis languages like Java and Python make it to the top 5 requirements for programming skills
• This could point at outsourcing of programming of data analysis requirements to ICT services contractors
• Java and C# dominates the programming market place. It is surprising to note that data base
0
50
100
150
200
250
300
350
400
450
Java C# Frontend IT Business Analyst .Net
Num
ber o
f Vac
anci
es in
Cap
e To
wn
in 1
mon
th
Programming Skills
0
50
100
150
200
250
300
350
400
450
Num
ber o
f Vac
anci
es in
Cap
e To
wn
in 1
mon
th
Programming skills
ICT
Retail
Financial

109
and security skills are at the lower end of the scale.

110
1.6 Google Trends Data 1.6.1 Information Systems skills Search Trends
Figure 20: Number of Keyword Searches by Technology Skill in 2014
Figure 21: Number of Keyword Searches by Technology Skill in 2015

111
Figure 22: Number of Keyword Searches by Technology Skill in 2016
Figure 23 Number of Keyword Searches by Technology Skill in 2017

112
Figure 24: Number of Keyword Searches by Technology Skill in 2018 • The keyword search data shows a large, consistent appetite for data analysis, correlating with
the data from Linkedin • Skills such as blockchain and cybersecurity have more interest in 2018 than they had in 2014,
which could be an indication of the growth of the Fin-Tech industry in the Western Cape • There may be a “hype-effect” in the keyword search results, e.g. block-chain interest may co-
relate to sharp increase or sharp decrease in the value of cryptocurrencies

113
1.6.2 Search Trends Volume for Information Systems skills Over Five Years
Figure 25: Search Trends Volume for Information Systems skills by Year
• Going forward, the skills that may have growing interest in 2019 may be Cyber-security, Blockchain and Artificial Intelligence
• Note that even though volume of Data Analysis searches seems to be decreasing in 2018, it is rather the volume of searches of other keywords that is increasing
0%
10%
20%
30%
40%
50%
60%
70%
80%
90%
100%
2014 2015 2016 2017 2018
Shar
e of
Key
wor
d Se
arch
es in
Wes
tern
Cap
e Pe
r Yea
r
Year
Data analysis: (Western Cape)
Cyber Security: (Western Cape)
Cloud Computing: (Western Cape)
Blockchain: (Western Cape)
Big data: (Western Cape)
Artificial intelligence: (Western Cape)

114
1.6.3 Programming Skills Search trends
Figure 26: Number of Keyword Searches by Programming Skill in 2014
Figure 27: Number of Keyword Searches by Programming Skill in 2015
0
200
400
600
800
1000
1200
1400
Database Java Android SQL C#
Num
ber o
f Key
wor
d se
arch
resu
lt in
1 y
ear
Programming skill
0
200
400
600
800
1000
1200
1400
Database Businessintelligence
Java Android Web Developer
Num
ber o
f Key
wor
d se
arch
resu
lt in
1 y
ear
Programming Skill
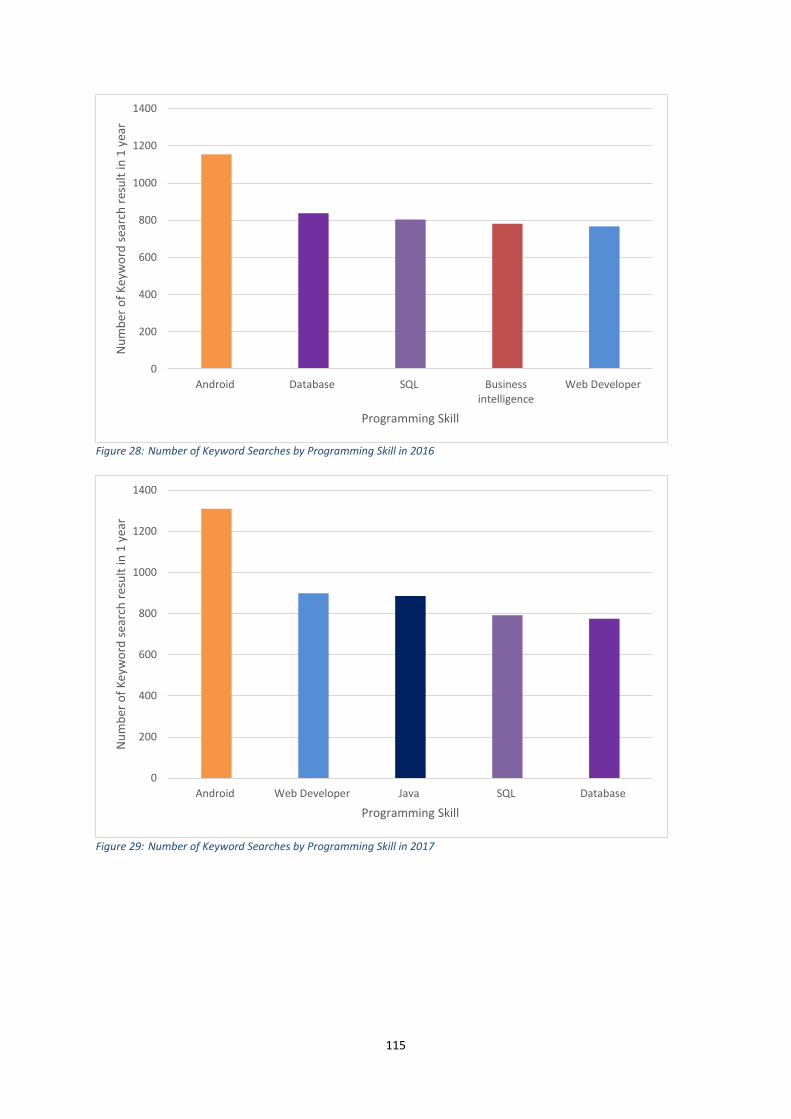
115
Figure 28: Number of Keyword Searches by Programming Skill in 2016
Figure 29: Number of Keyword Searches by Programming Skill in 2017
0
200
400
600
800
1000
1200
1400
Android Database SQL Businessintelligence
Web Developer
Num
ber o
f Key
wor
d se
arch
resu
lt in
1 y
ear
Programming Skill
0
200
400
600
800
1000
1200
1400
Android Web Developer Java SQL Database
Num
ber o
f Key
wor
d se
arch
resu
lt in
1 y
ear
Programming Skill

116
Figure 30: Number of Keyword Searches by Programming Skill in 2018 • The most significant interests in programming skills in 2018 are Android, SQL and Java, all
three closely related to app development • Results from the Google trends for programming skills are significantly different from the
Linkedin data. • The top programming skills required by companies in September 2018 according to Linkedin
were Java, C# and Frontend, whereas the top programming skill interests in 2018 according to Google-Trends were Android, SQL and Java
0
100
200
300
400
500
600
700
800
900
Android SQL Java Database Businessintelligence
Num
ber o
f Key
wor
d se
arch
resu
lt in
1 y
ear
Programming Skill

117
1.6.4 Search Trends Volume for Programming Skills Over Five Years
Figure 31: Search Trends Volume for Programming Skills by Year
• Interest in programming skills is fairly consistent, with skills such as Java, Android, database/SQL showing up in most of the five year’s of data
• Presence of Social Media and Graphic design interest in 2018’s top five data be due to the growing online media/social media industry in the Western Cape
• The most significant growth over the last five years is that of Android, which is possibly due to growing interest in mobile application development
• Searches such as SQL and database hint at interest in data-analysis
2014 2015 2016 2017 20180%
10%
20%
30%
40%
50%
60%
70%
80%
90%
100%
Year
Shar
e of
Key
wor
d Se
arch
es in
Wes
tern
Cap
e Pe
r Yea
r
SQL: (Western Cape)
Social Media: (Western Cape)
Java: (Western Cape)
Graphic design: (Western Cape)
C#: (Western Cape)
Android: (Western Cape)

118
1.7 Pnet Data 1.7.1 General
Figure 32: Total number of vacancies and ICT vacancies per month
Figure 33: Share of ICT Vacancies of All Vacancies in WC 2016-2018
0
1000
2000
3000
4000
5000
6000
7000
Sept '16 Sept '17 Sept '18
Num
ber o
f Vac
anci
es in
1 m
onth
Month
Total Vacancies ICT Vacancies
82%
18%
Total Vacancies WC
Total ICT Vacancies WC
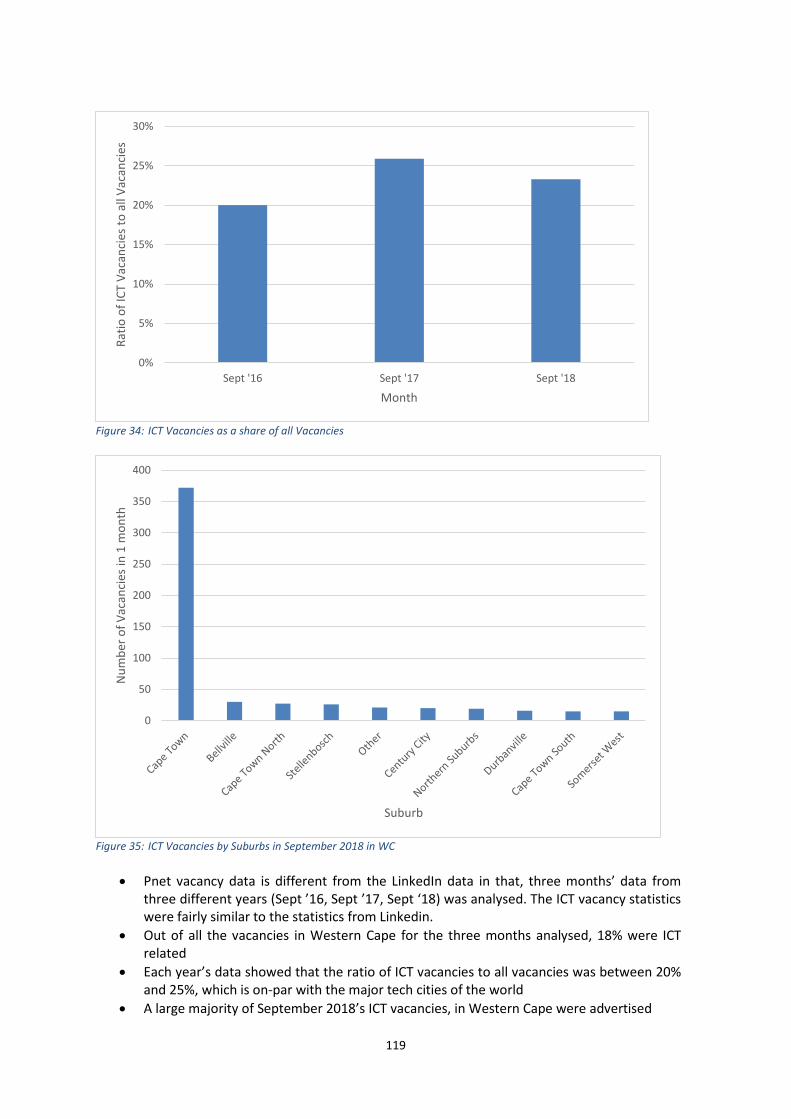
119
Figure 34: ICT Vacancies as a share of all Vacancies
Figure 35: ICT Vacancies by Suburbs in September 2018 in WC
• Pnet vacancy data is different from the LinkedIn data in that, three months’ data from three different years (Sept ’16, Sept ’17, Sept ‘18) was analysed. The ICT vacancy statistics were fairly similar to the statistics from Linkedin.
• Out of all the vacancies in Western Cape for the three months analysed, 18% were ICT related
• Each year’s data showed that the ratio of ICT vacancies to all vacancies was between 20% and 25%, which is on-par with the major tech cities of the world
• A large majority of September 2018’s ICT vacancies, in Western Cape were advertised
0%
5%
10%
15%
20%
25%
30%
Sept '16 Sept '17 Sept '18
Ratio
of I
CT V
acan
cies
to a
ll Va
canc
ies
Month
0
50
100
150
200
250
300
350
400
Num
ber o
f Vac
anci
es in
1 m
onth
Suburb
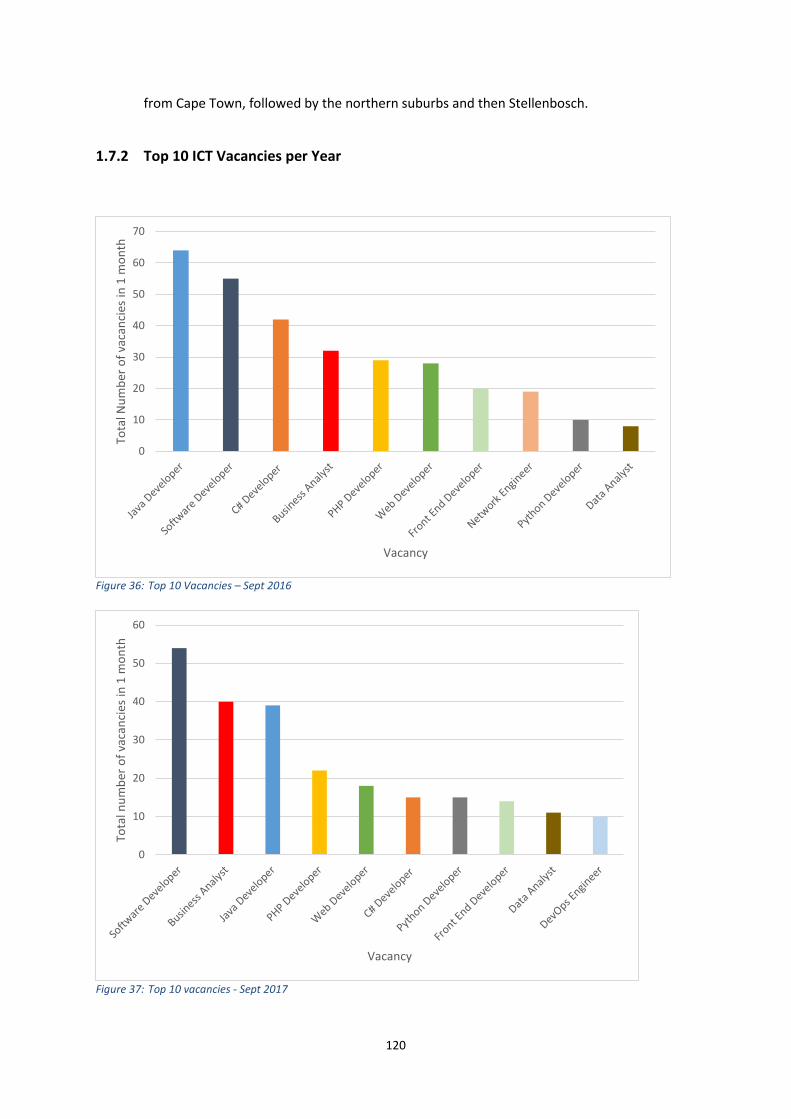
120
from Cape Town, followed by the northern suburbs and then Stellenbosch.
1.7.2 Top 10 ICT Vacancies per Year
Figure 36: Top 10 Vacancies – Sept 2016
Figure 37: Top 10 vacancies - Sept 2017
0
10
20
30
40
50
60
70
Tota
l Num
ber o
f vac
anci
es in
1 m
onth
Vacancy
0
10
20
30
40
50
60
Tota
l num
ber o
f vac
anci
es in
1 m
onth
Vacancy
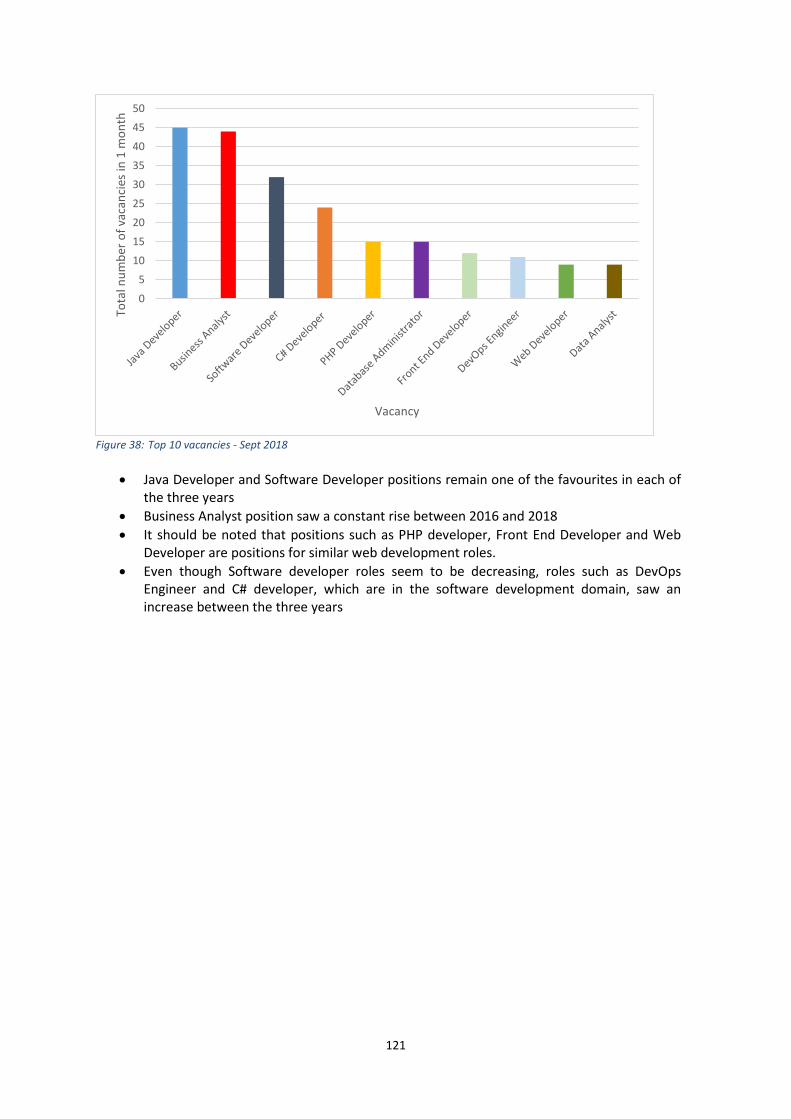
121
Figure 38: Top 10 vacancies - Sept 2018
• Java Developer and Software Developer positions remain one of the favourites in each of the three years
• Business Analyst position saw a constant rise between 2016 and 2018 • It should be noted that positions such as PHP developer, Front End Developer and Web
Developer are positions for similar web development roles. • Even though Software developer roles seem to be decreasing, roles such as DevOps
Engineer and C# developer, which are in the software development domain, saw an increase between the three years
0
5
10
15
20
25
30
35
40
45
50To
tal n
umbe
r of v
acan
cies
in 1
mon
th
Vacancy

122
Figure 39: Top vacancies per 1000 ICT vacancies compared by year
• From the graphs above, it is established that the number of vacancies differs between months
• Therefore, in order to compare information on the same scale, the vacancy data is normalized by calculating the ratio per 1000 vacancies
• Each of the programming skill demand seems to be decreasing from 2016 to 2018. This might either be because, the overall demand in these fields have decreased, or that these vacancies are increasingly being posted on different channels, such as linkedin
0
10
20
30
40
50
60
Java Developer SoftwareDeveloper
C# Developer PHP Developer Web Developer
Num
ber o
f Vac
anci
es p
er 1
000
ICT
Vaca
ncie
s
Programming Skill
2016 2017 2018

123
1.7.3 ICT Vacancies by Sector
Figure 40:Vacancies per sector – Total number of vacancies
• This graph shows the total number of vacancies per sector in September of each of the three years
• The number of vacancies in each of the sectors is decreasing over the three years, this could also vacancies being increasingly posted on different channels such as linkedin
Figure 41: Vacancies by Sector - Per 1000 ICT Vacancies
• Similar to the data in the previous section, the vacancy data in this section is also normalised in order to allow comparison on the same scale
• This graph shows the year by year comparison of ICT vacancies per sector
0
200
400
600
800
1000
1200
ICT Services Financial Services Retail Media
Tota
l num
ber o
f sec
tor s
peci
fic v
acan
cier
in
1 m
onth
Sector
Sept '16 Sept '17 Sept '18
0
100
200
300
400
500
600
700
800
900
ICT Services Financial Services Retail Media
Sect
or S
peci
fic V
acan
cy p
er 1
000
ICT
Vacn
cies
Sector
Sept '16 Sept '17 Sept '18
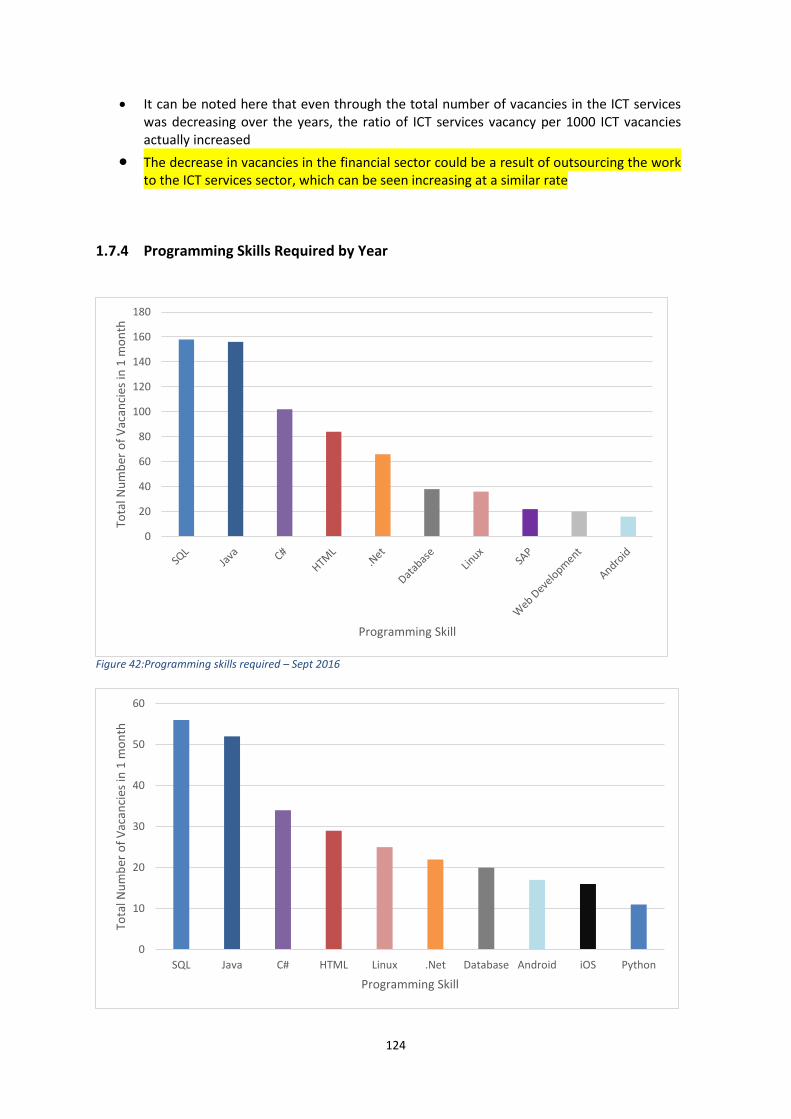
124
• It can be noted here that even through the total number of vacancies in the ICT services was decreasing over the years, the ratio of ICT services vacancy per 1000 ICT vacancies actually increased
• The decrease in vacancies in the financial sector could be a result of outsourcing the work to the ICT services sector, which can be seen increasing at a similar rate
1.7.4 Programming Skills Required by Year
Figure 42:Programming skills required – Sept 2016
0
20
40
60
80
100
120
140
160
180
Tota
l Num
ber o
f Vac
anci
es in
1 m
onth
Programming Skill
0
10
20
30
40
50
60
SQL Java C# HTML Linux .Net Database Android iOS Python
Tota
l Num
ber o
f Vac
anci
es in
1 m
onth
Programming Skill
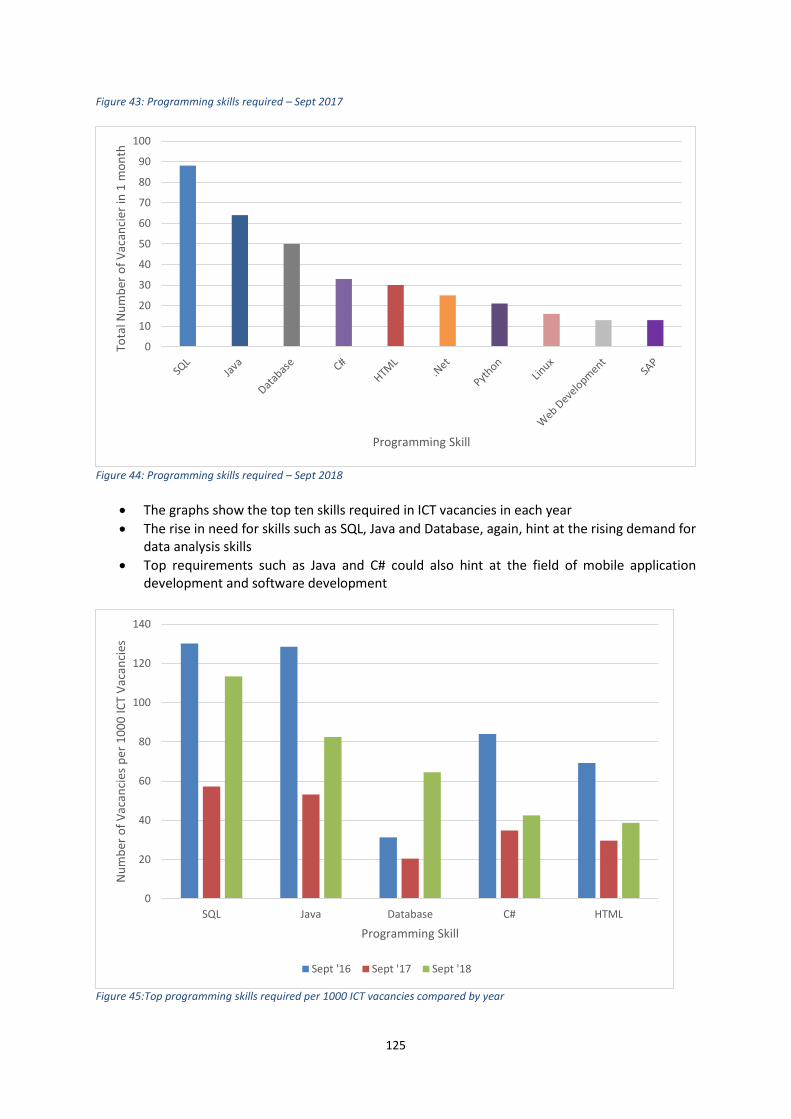
125
Figure 43: Programming skills required – Sept 2017
Figure 44: Programming skills required – Sept 2018
• The graphs show the top ten skills required in ICT vacancies in each year • The rise in need for skills such as SQL, Java and Database, again, hint at the rising demand for
data analysis skills • Top requirements such as Java and C# could also hint at the field of mobile application
development and software development
Figure 45:Top programming skills required per 1000 ICT vacancies compared by year
0
10
20
30
40
50
60
70
80
90
100
Tota
l Num
ber o
f Vac
anci
er in
1 m
onth
Programming Skill
0
20
40
60
80
100
120
140
SQL Java Database C# HTML
Num
ber o
f Vac
anci
es p
er 1
000
ICT
Vaca
ncie
s
Programming Skill
Sept '16 Sept '17 Sept '18

126
• This graph is normalised in order to compare the top programming skills requirement on the same scale
• The only programming skill that increased from 2016 to 2018 in ratio to 1000 ICT vacancies was “database”

127
EXTRA
Table 10.W: University graduates CESM 06 Western Cape and National 2012, 2014, 2016
2012 2014 2016 2012 2014 2016 2012 2014 2016Western Cape 600 631 729 350 408 454 950 1038 1183National 3449 4098 4245 2438 2698 2492 5887 6796 6737
0
1000
2000
3000
4000
5000
6000
7000
8000
Male Female Total
128
Literature Consulted 1 DSF ONE Report, section6.1 2 Schwab, K. (2017), Global Competitiveness Report 2017–2018, World Economic Forum, Geneva, https://members.weforum.http://www3.weforum.org/docs/GCR2017-2018/05FullReport/TheGlobalCompetitivenessReport2017%E2%80%932018.pdf, last accessed 15 October 2018. 3 Western Cape Government (2018) Provincial Economic Review and Outlook 2018 4 Stats SA Q4 2017 5 Western Cape Government (2018) Provincial Economic Review and Outlook 2018 6 PwC, (2018) Cape Town: African City of Opportunity, South Africa: Price Waterhouse Coopers 7 Khanna, P. (2016) Connectography: Mapping the Future of Global Civilization 8 PwC, (2018) Cape Town: African City of Opportunity, South Africa: Price Waterhouse Coopers 9 ibid 10 Research ICT Africa (RIA) (2016) Western Cape Digital Readiness Assessment 11 PwC, (2018) Cape Town: African City of Opportunity, South Africa: Price Waterhouse Coopers 12 The EU-funded Capacity Building Programme for Employment Promotion (CBPEP) is aimed at assisting the Government of South Africa to attain its goal of reducing unemployment. To refine 13 To be completed 14 University of Cape Town, University of Stellenbosch, University of the Western Cape, Cape Peninsula University of Technology. 15 TVET colleges: Cape Town College, West Coast, South Peninsula, Northlink and Southern Cape 16 W&R SETA (2017) Sector Skills Plan 17 Ibid 18 Ernst & Young (2017) 19 Ibid 20 https://www.businessinsider.com/biggest-online-shopping-sites-list-2018-4?IR=T 21https://techcrunch.com/2018/10/24/apples-tim-cook-makes-blistering-attack-on-the-data-industrial-complex/?guccounter=1
22 https://www.euromonitor.com/retailing-in-south-africa/report 23 https://www.eshopworld.com/blog/south-africa-ecommerce-insights-2017/ 24 www.woolworths.co.za 25 https://www.kadaza.co.za/shopping# 26 Western Cape Government (2017) Provincial Economic Review and Outlook 2017 27 https://businesstech.co.za/news/business/170911/the-best-and-worst-supermarkets-in-south-africa/ 28 http://www.wesgro.co.za/research?ResearchID=-1zKXeJ66z 29 Ibid 30 https://en.wikipedia.org/wiki/Maker_culture 31 http://www.scielo.org.za/pdf/sajems/v20n1/21.pdf 32 Ernst & Young (2017) 33 Kitewheel (2016) The State of the Customer Journey 2016 34 http://www.bizcommunity.com/Article/196/731/154821.html 35 Op cit 36 Op cit 37 Bizz Community, http://www.bizcommunity.com/Article/196/22/176367.html 38 W&R SETA (2017) Sector Skills Plan p.27 39 https://insidefmcg.com.au/tag/woolworths-food-academy/ 40 https://services.amazon.com/content/seller-resources-how-to-guides.html 41 http://theguildgroup.co.za/woodstock-design-district/ 42 https://searchcio.techtarget.com/definition/business-services 43 Ernst and Young (2017) Sector Digital Disruption Impact Assessment, prepared for DEDAT, 44 Services SETA (2018) Sector Skills Plan 2018/19 45 Western Cape Government (2017) Provincial Economic Review and Outlook 2017

129
46 Brookings Institute (2016). South Africa’ s Global Gateway Profiling The Gauteng City Region’s International Competitiveness and Connections 47 China Development Institute (2018) Global Financial Centres Index 48 Endeavour Insight (2018) Evaluation & Network Analysis Of The Cape Town Stellenbosch Tech Sector 49 Ibid 50 https://http-download.intuit.com/http.intuit/CMO/intuit/futureofsmallbusiness/intuit_2020_report.pdf 51 Ernst and Young op cit 52 Services Sector SETA Sector Skills Plan (2018/19) 53 http://www.bpesa.org.za/wp-content/uploads/2018/10/Key-Indicator-2018-Report.pdf 54 https://www.engadget.com/2018/05/02/salesforce-trailblazer-training/ 55http://www.asisaacademy.org.za/index.php/programmes/uct-collective-investment-schemes-cis-short-course 56 UNWTO (2018) Tourism Highlights 2018 Edition 57 ibid 58 Pine, J. and Gilmore, J. (1999) The Experience Economy, Harvard Business School Press, Boston, 1999. 59 Ibid 60 Ernst and Young (2017) Sector Digital Disruption Impact Assessment, prepared for DEDAT, 61 WESGRO (2018) The Importance of Tourism in the Western Cape 62 Cape Town Tourism (2017) Annual Report 2016/7 63 Ibid 64 PERO (2018) op cit 65 Ibid 66https://resource.capetown.gov.za/documentcentre/Documents/City%20strategies,%20plans%20and%20frameworks/Tourism%20Development%20Framework%20for%20the%20City%20of%20Cape%20Town.pdf
67 Cape Town Tourism (2017) Annual Report 2016/7 68 https://www.safaribookings.com/operators/south-africa 69 Cape Town Tourism (2017) Annual Report 2016/7 70 http://www.travelstart.co.za/blog/south-africas-tourists/#ixzz5UqvIVxvB
71 Ernst and Young (2017) Sector Digital Disruption Impact Assessment, prepared for DEDAT, 72 Ibid 73 https://www.iol.co.za/travel/tourism-marketing-trends-to-tap-into-in-2018-12596442 74 HSRC (2016) Tourism Human Resource Development Strategy 76 https://touristguideinstitute.co.za/full-time-tourist-guide-training-courses/ 77 http://www.satsa.com/satsa-training/ 78 https://www.udemy.com/tripadvisor-training-tourism-online-marketing-travel-hotels-resorts/ 79 http://tourismbootcamp.co.za/ 80 https://www.khwela.org.za/our-plan 81 https://www.tourismtribe.com/tourism-digital-skills/. 82 Thornton, G. (2017). Cape Town & Western Cape Film & Media Sector Study. Cape Town: Stratecon, page 3. 83 Urban-Econ Development Economists. (2017). Economic Impact of the South African Film Industry Report 2017 Commissioned by The National Film and Video Foundation. Johannesburg: Urban-Econ, page 10. 84 Urban-Econ Development Economists. (2017). Economic Impact of the South African Film Industry Report 2017 Commissioned by The National Film and Video Foundation. Johannesburg: Urban-Econ, page 20. 85 Personal interviews with Glen Gilles (CEO Sea Monster), Stuart Forrest (CEO Triggerfish), Robin Jutzen (Manager, Enterprise and Investment, CiTI, Thabang Motsoeneng, (MICT-SETA Researcher), Jenni Jones (Amazon Programme Manager) between 17 Sep and 10 October 2018.
86 Thornton, G. (2017). Cape Town & Western Cape Film & Media Sector Study. Cape Town: Stratecon, page 108. 87 Thornton, G. (2017). Cape Town & Western Cape Film & Media Sector Study. Cape Town: Stratecon, page 26.

130
88 Thornton, G. (2017). Cape Town & Western Cape Film & Media Sector Study. Cape Town: Stratecon, pages 85 and 86. 89 Thornton, G. (2017). Cape Town & Western Cape Film & Media Sector Study. Cape Town: Stratecon, page 26. 90 Creative Community and Job Board Animators, Illustrators, VFX & Game Developers in SA. 2108). https://pixelsmithstudios.com/ 91 https://animationsa.org/ 92 Wesgro Film and Media (2017). Cape Town and Western Cape Film and Media Promotion. Cape Town. Stutterstock, page 46. 93 Interview with Sea Monster 94 Thornton, G. (2017). Cape Town & Western Cape Film & Media Sector Study. Cape Town: Stratecon, pages 72 to 92. 95 Thornton, G. (2017). Cape Town & Western Cape Film & Media Sector Study. Cape Town: Stratecon, pages 115 and 116. 96 Urban-Econ Development Economists. Prepared for the Department of Arts and Culture. (2014). Strategy for the South African Animation Industry: Final Draft. Pages 29 and 30. 97 Interviews with the CEOs of Sea Monster and Triggerfish. For example, the Animation School provides students with practical and relevant education in animation and the creative arts. More than 60% of Triggerfish’s staff has a qualification from The Animation School. 98 Thornton, G. (2017). Cape Town & Western Cape Film & Media Sector Study. Cape Town: Stratecon, pages 39 and 40. 99 Urban-Econ Development Economists. Prepared for the Department of Arts and Culture. (2014). Strategy for the South African Animation Industry: Final Draft. Page 41. 100 100 Thornton, G. (2017). Cape Town & Western Cape Film & Media Sector Study. Cape Town: Stratecon, page 84. 101 Thornton, G. (2017). Cape Town & Western Cape Film & Media Sector Study. Cape Town: Stratecon, page 3. 102 Thornton, G. (2017). Cape Town & Western Cape Film & Media Sector Study. Cape Town: Stratecon, page 3. 103 Flew,T. (2014). New Media. Melbourne, Australia: Oxford University Press, page 19. 104 Unfortunately, obtaining an overview of the economic contributions of the national film industry by Province and for a particular financial year, was not possible, therefore different sources had to be consulted resulting in snapshots for different periods. It was also important to correlate the different economic declarations as some figures appear to be incorrectly stated. 105 Urban-Econ Development Economists. (2017). Economic Impact of the South African Film Industry Report 2017 Commissioned by The National Film and Video Foundation. Johannesburg: Urban-Econ, page 3. 106 Urban-Econ Development Economists. (2017). Economic Impact of the South African Film Industry Report 2017 Commissioned by The National Film and Video Foundation. Johannesburg: Urban-Econ, page 5. 107 Thornton, G. (2017). Cape Town & Western Cape Film & Media Sector Study. Cape Town: Stratecon, page 66. 108 Thornton, G. (2017). Cape Town & Western Cape Film & Media Sector Study. Cape Town: Stratecon, page 7 and 8. 109 Thornton, G. (2017). Cape Town & Western Cape Film & Media Sector Study. Cape Town: Stratecon, page 39 and 40. 110 Thornton, G. (2017). Cape Town & Western Cape Film & Media Sector Study. Cape Town: Stratecon, page 29 and 32. 111 Thornton, G. (2017). Cape Town & Western Cape Film & Media Sector Study. Cape Town: Stratecon, page 107. 112 e-mail from MICT-SETA, 5 Oct 2018 113 Thornton, G. (2017). Cape Town & Western Cape Film & Media Sector Study. Cape Town: Stratecon, pages 13 to 19. 114 Urban-Econ Development Economists. (2017). Economic Impact of the South African Film Industry Report 2017 Commissioned by The National Film and Video Foundation. Johannesburg: Urban-Econ, page 12. 115 Thornton, G. (2017). Cape Town & Western Cape Film & Media Sector Study. Cape Town: Stratecon, pages 33 to 40.

131
116 “Strategy for the SA Animation Industry: Final Draft. Page 51; Interview with Sea Monster and Triggerfish; NFVF “Economic Impact of the SA Film Industry Report 2017” pages 24 and 27; Grant Thornton “CPT & WC Film and Media Sector Study, pages 65, 74, 79, 83, 84, 85; Internet research. 117 National Film and Video Foundation. (2016). The State of Skills in the South African Film Industry. NFVF, page 16. 118MICT-SETA’s Researcher, Thabang Motsoeneng 119 e-mail from SETA dated 23 October 2018 120 Thornton, G. (2017). Cape Town & Western Cape Film & Media Sector Study. Cape Town: Stratecon, page 78. 121 Wesgro, (2017). Cape Town & Western Cape Film & Media Promotion. Cape Town: Stutterstock, page 5. 122 Adkins, S. (2017). The 2017-2022 Global Game-based Learning Market, Metaari Pages 9 and 11. 123 Kelly, C; Mishra, B; Jequinto. (2014). Accenture The Pulse of Gaming, Gaming Disruption. Page 4. 124 Newzoo.com/insights/articles/the-global-games-market 125 PWC. (2018). Entertainment and Media Outlook:2018-2022. Johannesburg. Page 101. 126 Hall, N. (2016). Interactive Entertainment South Africa Industry Survey 2016. Pages unmarked. 127 The Draft Online Regulations Policy in the Government Gazette 128 Information from the FPB website 129 Kelly, C; Mishra, B; Jequinto. (2014). Accenture The Pulse of Gaming, Gaming Disruption. Pages 4 and 5. 130 PWC. (2018). Entertainment and Media Outlook:2018-2022. Johannesburg. Page 99. 131 PWC. (2018). Entertainment and Media Outlook:2018-2022. Johannesburg. Page 101. 132 MICT-SETA Strategy report, 2017 133 BMI, South Africa Business Forecast Report, 2015
134 Zuppo C M. 2012. Defining ICT in a boundaryless world: The development of a working hierarchy. International Journal of Managing Information Technology (IJMIT) Vol.4, No.3, August 2012 DOI : 10.5121/ijmit.2012.4302 13 135 Zia N, Ilahi M & Khan N A. 2018. The Role of ICT (Information & Communication Technology) in Higher Education. Multidisciplinary Higher Education, Research, Dynamics & Concepts
136
137 Western Cape (South Africa). Department of the Premier. 2017. Draft WCG digital government strategy. Provincial Government of the Western Cape. WESGRO. 2017. ICT and services | cost of doing business.
138 https://www.westerncape.gov.za/news/western-cape-government-economic-and-fiscal-strategy-open-business 139 https://www.gartner.com/smarterwithgartner/5-trends-emerge-in-gartner-hype-cycle-for-emerging-technologies-2018/ 140 Brainstorm, the CIO dictionary. (2018). 141 Academic articles available on the topic of ICT skills (Kirlidog, van der Vyver, Zeeman & Coetzee, 2018; Breytenbach & De Villiers, 2015; Breytenbach & De Villiers, 2012; De Villiers, Johnson & Cremer, 2012; Johannesburg Centre for Software Engineering, 2011; Calitz, 2010; Cohen & Parsotam, 2010; Lotriet, Matthee & Alexander, 2010; Daniels, 2007; Wilson, Woolard & Lee, 2004; Kekana, 2002) . 142 Department of Education. (2008). Classification of Educational Subject Matter (CESM). [Online]. www.dhet.gov.za 143 University of Cape Town, University of Stellenbosch, University of the Western Cape, Cape Peninsula University of Technology. 144 TVET colleges: In total, there are 50 TVET colleges in South Africa, of which 6 are located in the Western Cape, namely: College of Cape Town for TVET, False Bay TVET College, Northlink TVET College, West Coast TVET College, Boland TVET College, South Cape TVET College. [Online]. http://www.tvetcolleges.co.za/ 145 https://www.sap.com/africa/products/sme-business-software.html
132
https://www.sap.com/training-certification/university-alliances.html#pdf-asset=f80714c1-fd7c-0010-87a3-c30de2ffd8ff&page=7 146 https://www.research.ibm.com/university/ https://www-03.ibm.com/services/weblectures/dlv/Gate.wss?handler=Login&action=index&customer=meap&offering=meai&origin=us&allow_login=no&from=short_url 147 https://mva.microsoft.com/ / https://www.microsoft.com/africa/4afrika/academy/virtual-academy.aspx https://ctutraining.ac.za/ctu-corporate-solutions/microsoft-virtual-academy/ https://www.itweb.co.za/content/RgeVDqPoOL8MKJN3 http://biz4afrika.microsoft.com/ 148 https://www.itassetmanagement.net/2018/05/01/oracle-to-charge-for-java-from-jan-2019/ https://education.oracle.com/training-by-product’ 149 MICT_SETA Skills Startegy, 2017 150 Osden 151 Urban-Econ Development Economists. (2017). Economic Impact of the South African Film Industry Report 2017 Commissioned by The National Film and Video Foundation. Johannesburg: Urban-Econ, page 78.
Paula.Tena
Sello
Paula.Tena
Sello