CLIMATE MAPS
21
1 National Hydrometeorological Service - Skopje CLIMATE MAPS NEEDED FOR IMPLEMENTATION OF EUROPEAN STANDARDS (EUROCODES) IN THE REPUBLIC OF NORTH MACEDONIA July, 2020
-
Upload
khangminh22 -
Category
Documents
-
view
4 -
download
0
Transcript of CLIMATE MAPS
1
National Hydrometeorological Service - Skopje
CLIMATE MAPS
NEEDED FOR IMPLEMENTATION OF EUROPEAN STANDARDS (EUROCODES) IN THE
REPUBLIC OF NORTH MACEDONIA
July, 2020
2
CLIMATE MAPS
NEEDED FOR IMPLEMENTATION OF EUROPEAN STANDARDS (EURO CODES) IN THE
REPUBLIC OF NORTH MACEDONIA
INTRODUCTION
Knowing the climate and adapting human activities to its impacts is a general national interest
of every country and every society. The National Hydrometeorological Service (NHMS) as an
entity in the Ministry of Agriculture, Forestry and Water Economy (MAFWE) is responsible for
meteorological measurements and observations in the Republic of North Macedonia, in line
with the standards of the World Meteorological Organization (WMO).
This analysis describes the methodology used by the NHMS to prepare the climate maps
through which the Eurocodes should be adopted and implemented in the Republic of North
Macedonia, as defined in the following European standards:
MKC EN 1991-1-3 General actions - snow loads
MKC EN 1991-1-4 General actions - wind actions and
MKC EN 1991-1-5 General actions - thermal actions.
These European standards provide recommendations for determining the characteristic
values for snow load, wind load and maximum and minimum air temperatures, which are an
important component affecting buildings and other structures. Of particular interest is the
impact assessment in order to avoid major material and human damages, which may occur
due to demolition of certain structures because of miscalculated or underestimated load
value, but equally important is to control the cost of construction by not overestimating the
load values.
CLIMATE MAPS DEVELOPMENT METHODOLOGY
In accordance with European norms prescribed by the European Committee for
Standardization EN-1990, Article 4, paragraph 4.1.2 (7) P note 2 "The characteristic value of
climatic actions is based upon the probability of 0.02 (2%) of its time-varying part being
exceeded for a reference period of one year. This is equivalent to a mean return period of 50
years for the time-varying part."
The statistical preparation of climate data is a very complex procedure because the data has
to be adapted to the specifics of the regions that are subject of analysis. In order to define
the characteristic values, it is sufficient to analyze the statistics of the annual maximums/
minimums, with a focus on a certain discrete set of meteorological data comprising one value
for each year of meteorological observations.
The procedure usually involves the following steps:
1. Selection of meteorological stations sufficient to provide full coverage of the territory
in terms of space, but also in terms of altitude at which meteorological variables are
measured (maximum and minimum air temperature, basics of wind speed, weight or
3
height and density of snow cover), provided a condition that there is a long time series
of measurements (30-50 years);
2. Defining and homogenizing a series of extreme annual values for the variable under
consideration;
3. Selection of the most appropriate distribution of extreme values, such as Gumbel
distribution, distribution of extreme values, Weibull distribution, Frechet, etc., taking
into account the "later" suitability of the obtained value that will represent the
variable;
4. Review and verification of the series of extreme values in order to obtain characteristic
values of meteorological variables;
5. Spatial interpolation and drawing of climate maps;
6. Explanation of climate maps with identification of homogeneous climate regions: each
climate region is characterized by a special relation to the characteristic value of the
climate variable as a function of altitude.
THERMAL ACTIONS
The relief structure of the Republic of North Macedonia impacts the development of
atmospheric activity, the regime of meteorological elements, as well as their distribution, and
thus the climate regime. Meteorological elements represent the physical state and physical
phenomena of the atmosphere.
Air temperature is an element that varies in time and space and it shows the temperature of
the ground layer of the atmosphere that mostly depends on the influence of the Sun. It is
measured at 2m above the ground. The maximum air temperature is measured with a
maximum mercury thermometer for a period of 24h (from 21:00 the previous day to 21:00 in
the current day). The minimum air temperature is the lowest measured value in a period of
24h (from 21:00 the previous day to 21:00 in the current day) and is measured with a
minimum alcohol thermometer. The unit of measurement for air temperature is degree
Celsius (° C).
4
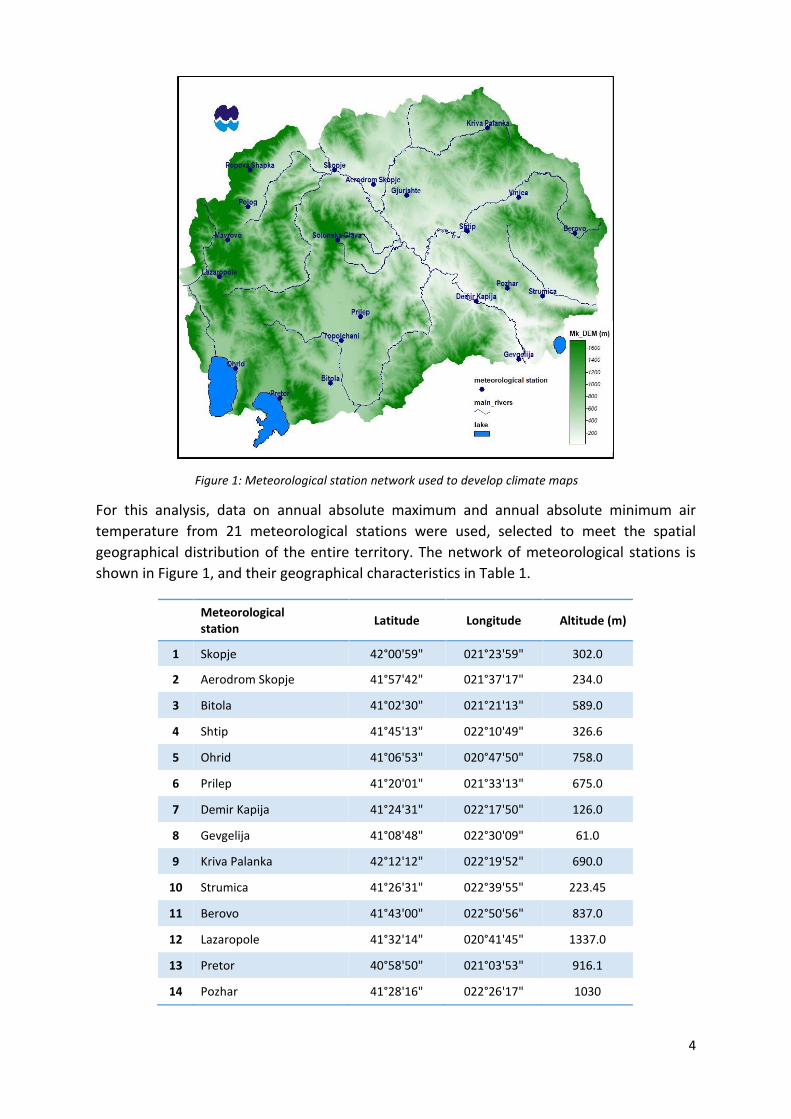
Figure 1: Meteorological station network used to develop climate maps
For this analysis, data on annual absolute maximum and annual absolute minimum air
temperature from 21 meteorological stations were used, selected to meet the spatial
geographical distribution of the entire territory. The network of meteorological stations is
shown in Figure 1, and their geographical characteristics in Table 1.
Meteorological station
Latitude Longitude Altitude (m)
1 Skopje 42°00'59" 021°23'59" 302.0
2 Aerodrom Skopje 41°57'42" 021°37'17" 234.0
3 Bitola 41°02'30" 021°21'13" 589.0
4 Shtip 41°45'13" 022°10'49" 326.6
5 Ohrid 41°06'53" 020°47'50" 758.0
6 Prilep 41°20'01" 021°33'13" 675.0
7 Demir Kapija 41°24'31" 022°17'50" 126.0
8 Gevgelija 41°08'48" 022°30'09" 61.0
9 Kriva Palanka 42°12'12" 022°19'52" 690.0
10 Strumica 41°26'31" 022°39'55" 223.45
11 Berovo 41°43'00" 022°50'56" 837.0
12 Lazaropole 41°32'14" 020°41'45" 1337.0
13 Pretor 40°58'50" 021°03'53" 916.1
14 Pozhar 41°28'16" 022°26'17" 1030
5
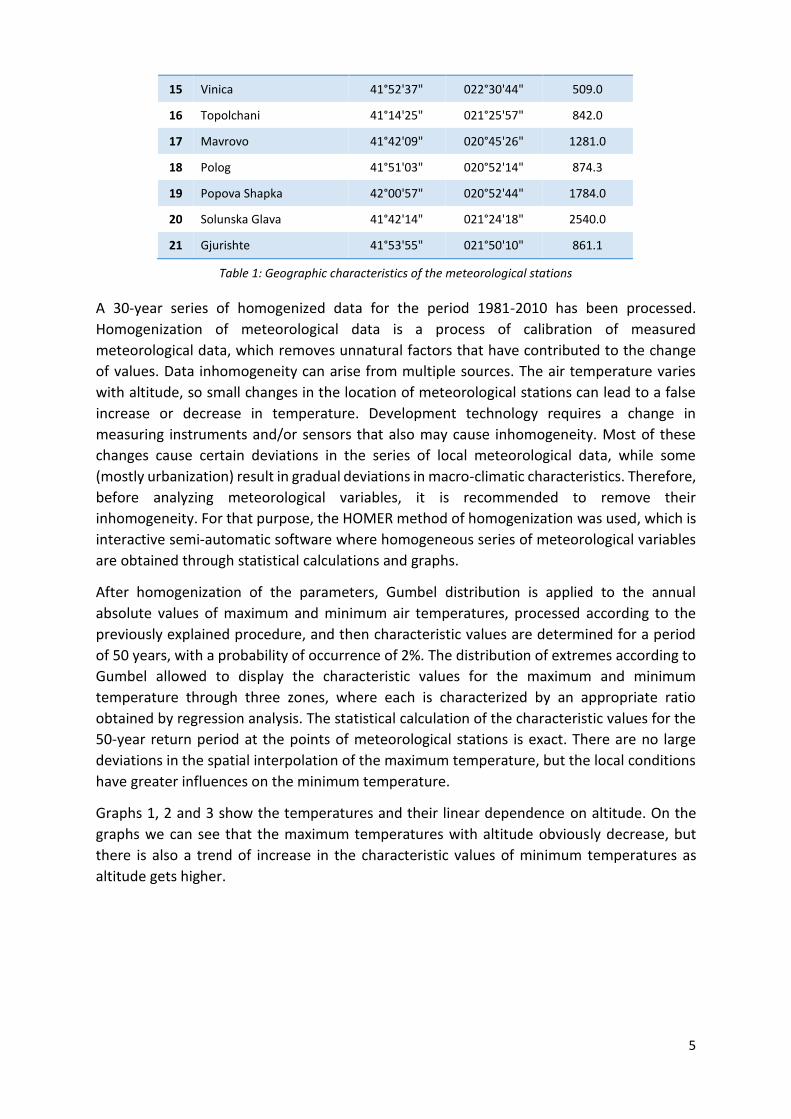
Table 1: Geographic characteristics of the meteorological stations
A 30-year series of homogenized data for the period 1981-2010 has been processed.
Homogenization of meteorological data is a process of calibration of measured
meteorological data, which removes unnatural factors that have contributed to the change
of values. Data inhomogeneity can arise from multiple sources. The air temperature varies
with altitude, so small changes in the location of meteorological stations can lead to a false
increase or decrease in temperature. Development technology requires a change in
measuring instruments and/or sensors that also may cause inhomogeneity. Most of these
changes cause certain deviations in the series of local meteorological data, while some
(mostly urbanization) result in gradual deviations in macro-climatic characteristics. Therefore,
before analyzing meteorological variables, it is recommended to remove their
inhomogeneity. For that purpose, the HOMER method of homogenization was used, which is
interactive semi-automatic software where homogeneous series of meteorological variables
are obtained through statistical calculations and graphs.
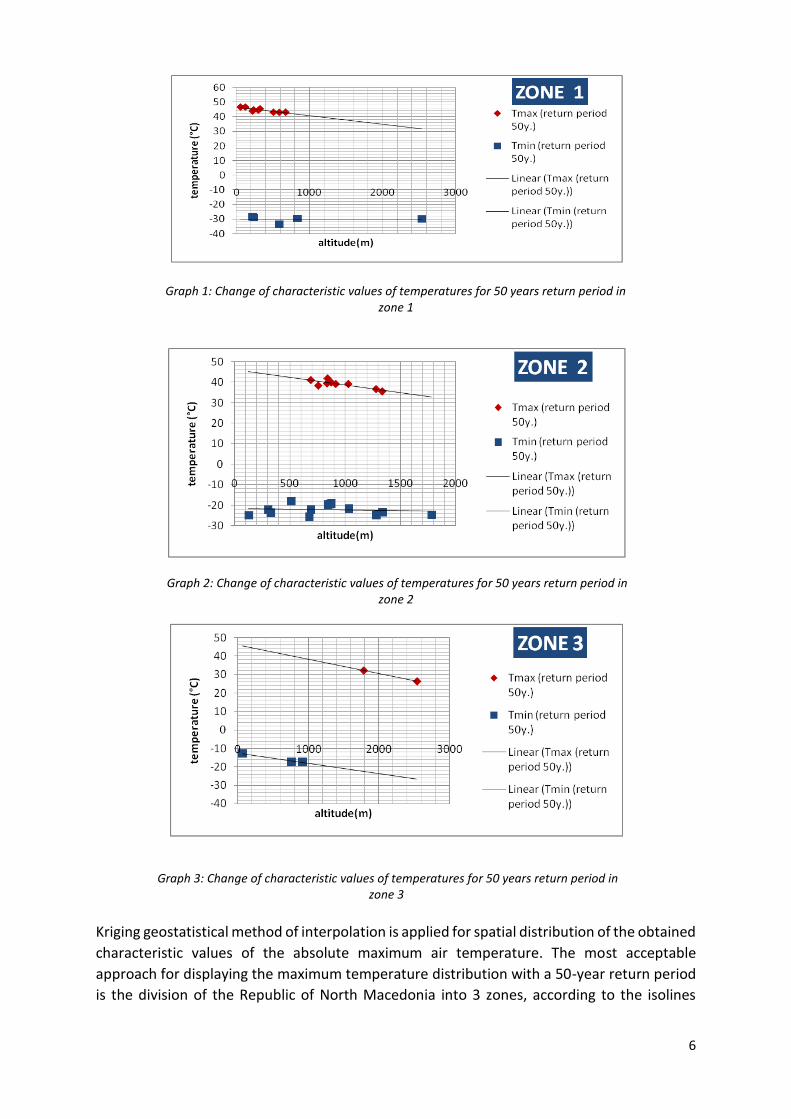
After homogenization of the parameters, Gumbel distribution is applied to the annual
absolute values of maximum and minimum air temperatures, processed according to the
previously explained procedure, and then characteristic values are determined for a period
of 50 years, with a probability of occurrence of 2%. The distribution of extremes according to
Gumbel allowed to display the characteristic values for the maximum and minimum
temperature through three zones, where each is characterized by an appropriate ratio
obtained by regression analysis. The statistical calculation of the characteristic values for the
50-year return period at the points of meteorological stations is exact. There are no large
deviations in the spatial interpolation of the maximum temperature, but the local conditions
have greater influences on the minimum temperature.
Graphs 1, 2 and 3 show the temperatures and their linear dependence on altitude. On the
graphs we can see that the maximum temperatures with altitude obviously decrease, but
there is also a trend of increase in the characteristic values of minimum temperatures as
altitude gets higher.
15 Vinica 41°52'37" 022°30'44" 509.0
16 Topolchani 41°14'25" 021°25'57" 842.0
17 Мavrovo 41°42'09" 020°45'26" 1281.0
18 Polog 41°51'03" 020°52'14" 874.3
19 Popova Shapka 42°00'57" 020°52'44" 1784.0
20 Solunska Glava 41°42'14" 021°24'18" 2540.0
21 Gjurishte 41°53'55" 021°50'10" 861.1
6
Graph 1: Change of characteristic values of temperatures for 50 years return period in zone 1
Graph 2: Change of characteristic values of temperatures for 50 years return period in zone 2
Graph 3: Change of characteristic values of temperatures for 50 years return period in
zone 3
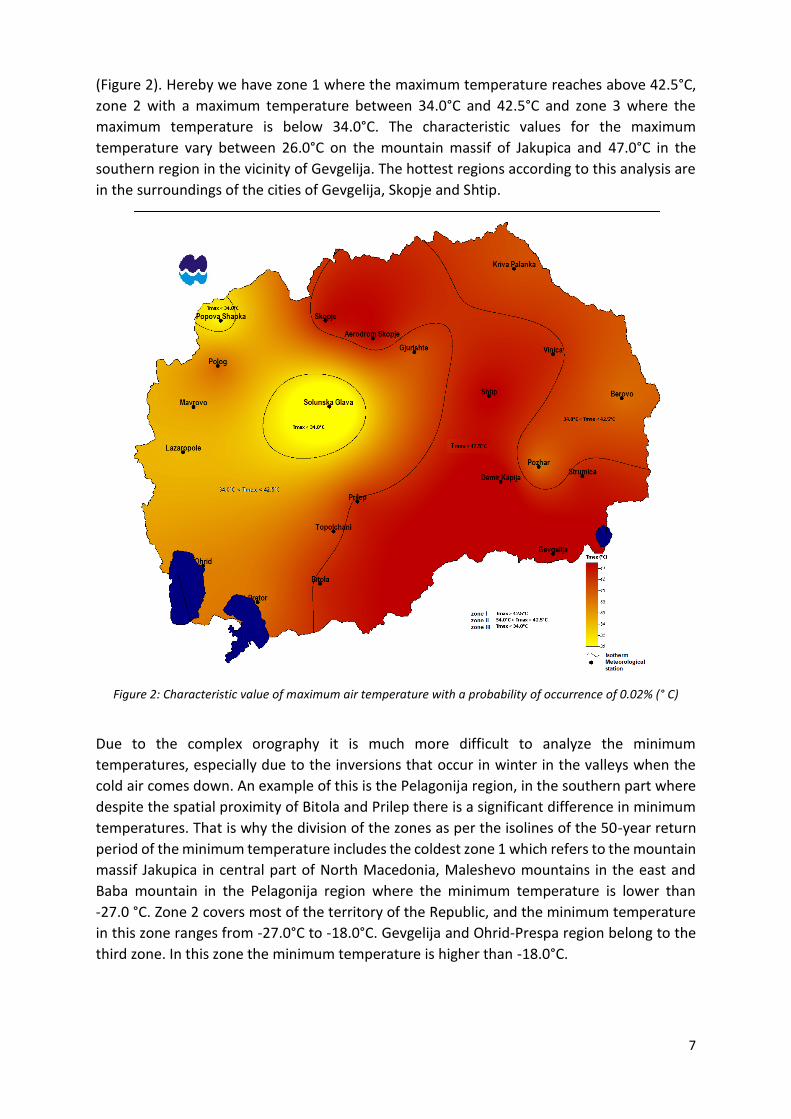
Kriging geostatistical method of interpolation is applied for spatial distribution of the obtained
characteristic values of the absolute maximum air temperature. The most acceptable
approach for displaying the maximum temperature distribution with a 50-year return period
is the division of the Republic of North Macedonia into 3 zones, according to the isolines
7
(Figure 2). Hereby we have zone 1 where the maximum temperature reaches above 42.5°C,
zone 2 with a maximum temperature between 34.0°C and 42.5°C and zone 3 where the
maximum temperature is below 34.0°C. The characteristic values for the maximum
temperature vary between 26.0°C on the mountain massif of Jakupica and 47.0°C in the
southern region in the vicinity of Gevgelija. The hottest regions according to this analysis are
in the surroundings of the cities of Gevgelija, Skopje and Shtip.
Figure 2: Characteristic value of maximum air temperature with a probability of occurrence of 0.02% (° C)
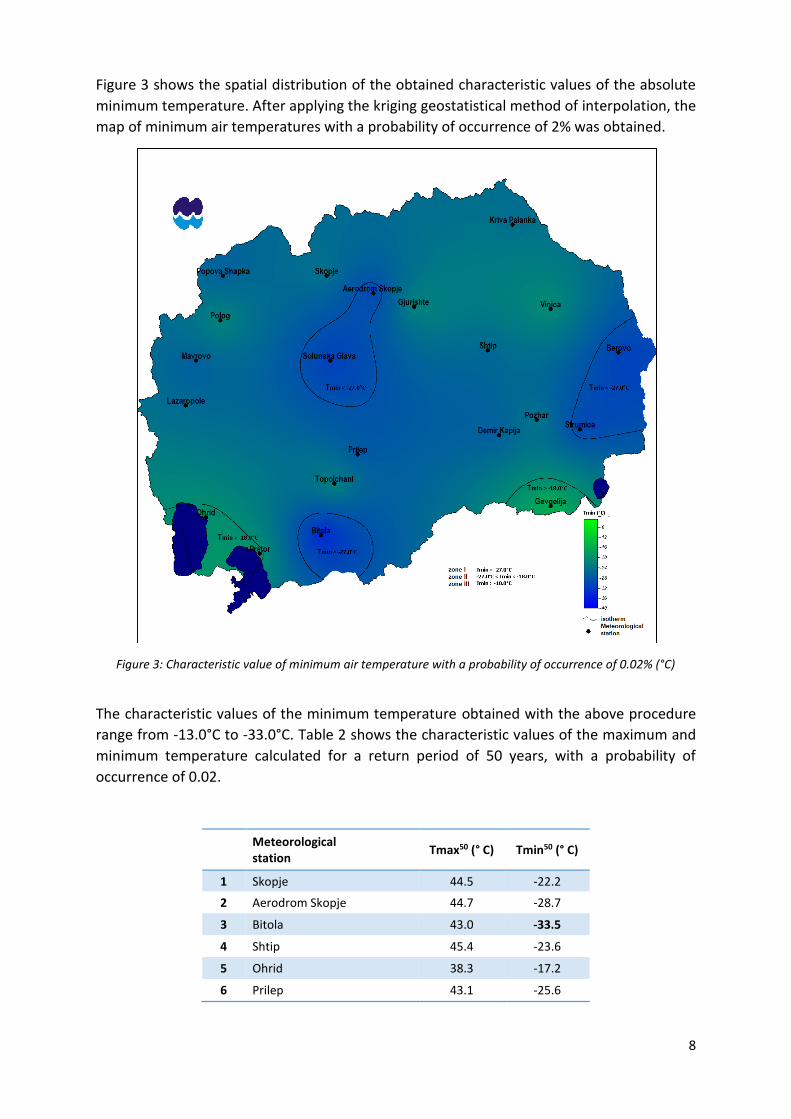
Due to the complex orography it is much more difficult to analyze the minimum
temperatures, especially due to the inversions that occur in winter in the valleys when the
cold air comes down. An example of this is the Pelagonija region, in the southern part where
despite the spatial proximity of Bitola and Prilep there is a significant difference in minimum
temperatures. That is why the division of the zones as per the isolines of the 50-year return
period of the minimum temperature includes the coldest zone 1 which refers to the mountain
massif Jakupica in central part of North Macedonia, Maleshevo mountains in the east and
Baba mountain in the Pelagonija region where the minimum temperature is lower than
-27.0 °C. Zone 2 covers most of the territory of the Republic, and the minimum temperature
in this zone ranges from -27.0°C to -18.0°C. Gevgelija and Ohrid-Prespa region belong to the
third zone. In this zone the minimum temperature is higher than -18.0°С.
8
Figure 3 shows the spatial distribution of the obtained characteristic values of the absolute
minimum temperature. After applying the kriging geostatistical method of interpolation, the
map of minimum air temperatures with a probability of occurrence of 2% was obtained.
Figure 3: Characteristic value of minimum air temperature with a probability of occurrence of 0.02% (°C)
The characteristic values of the minimum temperature obtained with the above procedure
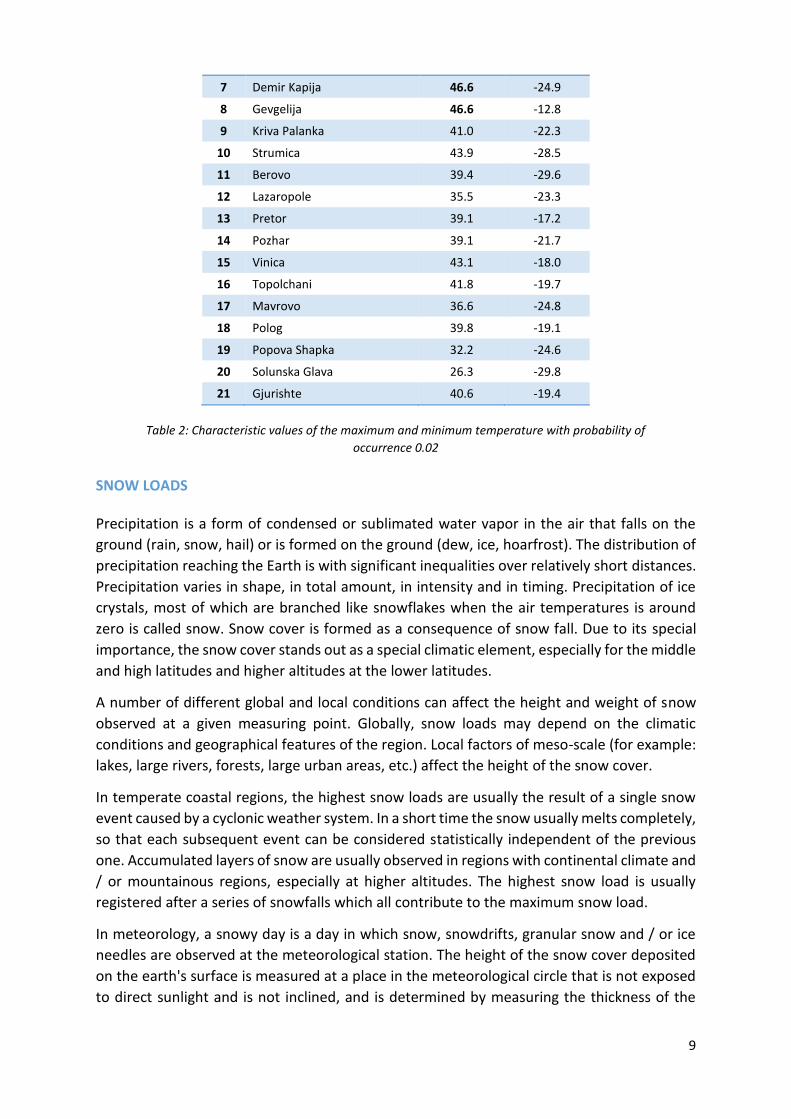
range from -13.0°C to -33.0°C. Table 2 shows the characteristic values of the maximum and
minimum temperature calculated for a return period of 50 years, with a probability of
occurrence of 0.02.
Meteorological station
Tmax50 (° C) Tmin50 (° C)
1 Skopje 44.5 -22.2
2 Aerodrom Skopje 44.7 -28.7
3 Bitola 43.0 -33.5
4 Shtip 45.4 -23.6
5 Ohrid 38.3 -17.2
6 Prilep 43.1 -25.6
9
7 Demir Kapija 46.6 -24.9
8 Gevgelija 46.6 -12.8
9 Kriva Palanka 41.0 -22.3
10 Strumica 43.9 -28.5
11 Berovo 39.4 -29.6
12 Lazaropole 35.5 -23.3
13 Pretor 39.1 -17.2
14 Pozhar 39.1 -21.7
15 Vinica 43.1 -18.0
16 Topolchani 41.8 -19.7
17 Мavrovo 36.6 -24.8
18 Polog 39.8 -19.1
19 Popova Shapka 32.2 -24.6
20 Solunska Glava 26.3 -29.8
21 Gjurishte 40.6 -19.4
Table 2: Characteristic values of the maximum and minimum temperature with probability of
occurrence 0.02
SNOW LOADS
Precipitation is a form of condensed or sublimated water vapor in the air that falls on the
ground (rain, snow, hail) or is formed on the ground (dew, ice, hoarfrost). The distribution of
precipitation reaching the Earth is with significant inequalities over relatively short distances.
Precipitation varies in shape, in total amount, in intensity and in timing. Precipitation of ice
crystals, most of which are branched like snowflakes when the air temperatures is around
zero is called snow. Snow cover is formed as a consequence of snow fall. Due to its special
importance, the snow cover stands out as a special climatic element, especially for the middle
and high latitudes and higher altitudes at the lower latitudes.
A number of different global and local conditions can affect the height and weight of snow
observed at a given measuring point. Globally, snow loads may depend on the climatic
conditions and geographical features of the region. Local factors of meso-scale (for example:
lakes, large rivers, forests, large urban areas, etc.) affect the height of the snow cover.
In temperate coastal regions, the highest snow loads are usually the result of a single snow
event caused by a cyclonic weather system. In a short time the snow usually melts completely,
so that each subsequent event can be considered statistically independent of the previous
one. Accumulated layers of snow are usually observed in regions with continental climate and
/ or mountainous regions, especially at higher altitudes. The highest snow load is usually
registered after a series of snowfalls which all contribute to the maximum snow load.
In meteorology, a snowy day is a day in which snow, snowdrifts, granular snow and / or ice
needles are observed at the meteorological station. The height of the snow cover deposited
on the earth's surface is measured at a place in the meteorological circle that is not exposed
to direct sunlight and is not inclined, and is determined by measuring the thickness of the
10
snow cover on a flat surface using a snow gauge or snow gauge ruler. The instrument is set
according to WMO standards, and measurements are performed every day during the
climatic term at 07:00 (CET; UTC + 1). The unit of measure for the height of the snow cover is
centimeters. Snow load (Sk) is the weight of the snow cover measured per unit area, and is
calculated according to the following equation (1)
Sk [kN / m2] = ρs hs g (1),
where usually the density of snow (ρs) is measured in g/cm3, and the height of the snow cover
(hs) in cm. After conversion into units of the SI system kg/m3 and m, we express the snow load
in kN/m2 which is approximately equal to 100 kg/m2.
At present, no mathematical model is known to explain the development of total snow
depending on time, nor is there any additional action recorded to initiate such a calculation
at all. However, for interpolation of daily values of water content in a snow column for longer
periods observed, physical models give reliable results.
The characteristic value of the snow load should be determined in accordance with EN 1990:
2002, 4.1.2 (7) P, the definition of characteristic snow load on the ground is a load having an
annual probability of exceeding 0.02, not taking into account the exceptional snow load.1
When determining the characteristic values of the snow load on the ground, not all
uncertainties associated with the statistical calculation and / or the applied calculation model
can be avoided. The uncertainties of the statistical calculation are caused by the technique of
measurements and the location of the measuring station, and the uncertainties of the model
are caused by the way of converting the height of the snow cover into a load, selection of
appropriate distribution and probabilistic model, appropriate return period and division of
regions according to load.
In 1983 the World Meteorological Organization provided guidance on the instruments,
manner and methods to be used for meteorological measurements.2 By using empirical
expressions, and by measuring the height of the snow cover and the density of the snow,
snow load be calculated. Furthermore, the annual maximum snow load on the ground is
analyzed, which means that the maximum annual value of the observations is used to further
calculate the distribution. The Gumbel distribution is applied, which allows calculating the
characteristic value of the snow load on the ground.
In some regions, and especially in southern Europe, isolated cases with significantly higher
snow loads have been observed. Depending on the length of time series of the data being
analyzed, if these isolated cases are included, the statistical processing of regular snowfall
may be disrupted. Therefore, exceptional values of snow load are defined. The criterion for
defining an exceptional snow load according to European research is as follows: "If the ratio
of the maximum value of the characteristic snow load is determined without including values
1 EN 1990: 2002, 4.1.2 (7) P; EN 1991-1-3, 1.6.1 2 World Meteorological Organization (WMO) - Guide to meteorological instruments and methods of
observation. WMON ° 8, Geneva, Switzerland, 1983.
11
greater than 2.0, then the maximum value of the load will be considered to be exceptional"3.
Of course, this criterion is left to further elaboration with national annexes.
The snow load maps developed by the NHMS include data from the meteorological stations
from Table 1 and Figure 1, with the exception of the meteorological station at Solunska Glava,
for which we have no measured data on the height of the snow cover. The empirical
expressions of the measured data on the height of the snow cover and the constant density
of the snow are used to calculate the characteristic snow load. Each country uses different
models to transform snow density into load. With fixed values for average snow density,
calculations are made in Belgium, France, the Netherlands, Luxembourg and Greece. The
Republic of North Macedonia also accepted the calculation method where the mean value of
snow density is 300 kg/m3. With Gumbel's distribution a return period of 50 years is
presented. The impact of altitude on snow load is presented in Figure 4.
Given the low number of meteorological stations at higher altitude (above 1500m), all snow
load requirements relating to regions at altitude higher than 1500m should be additionally
processed.
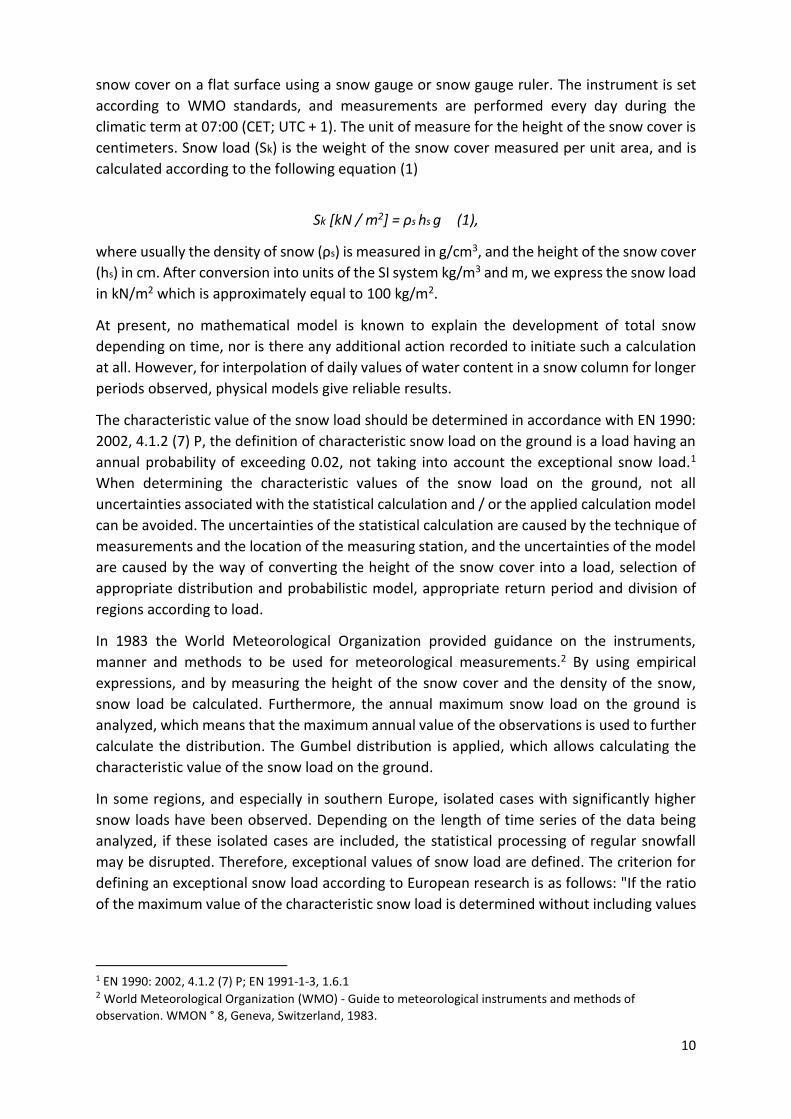
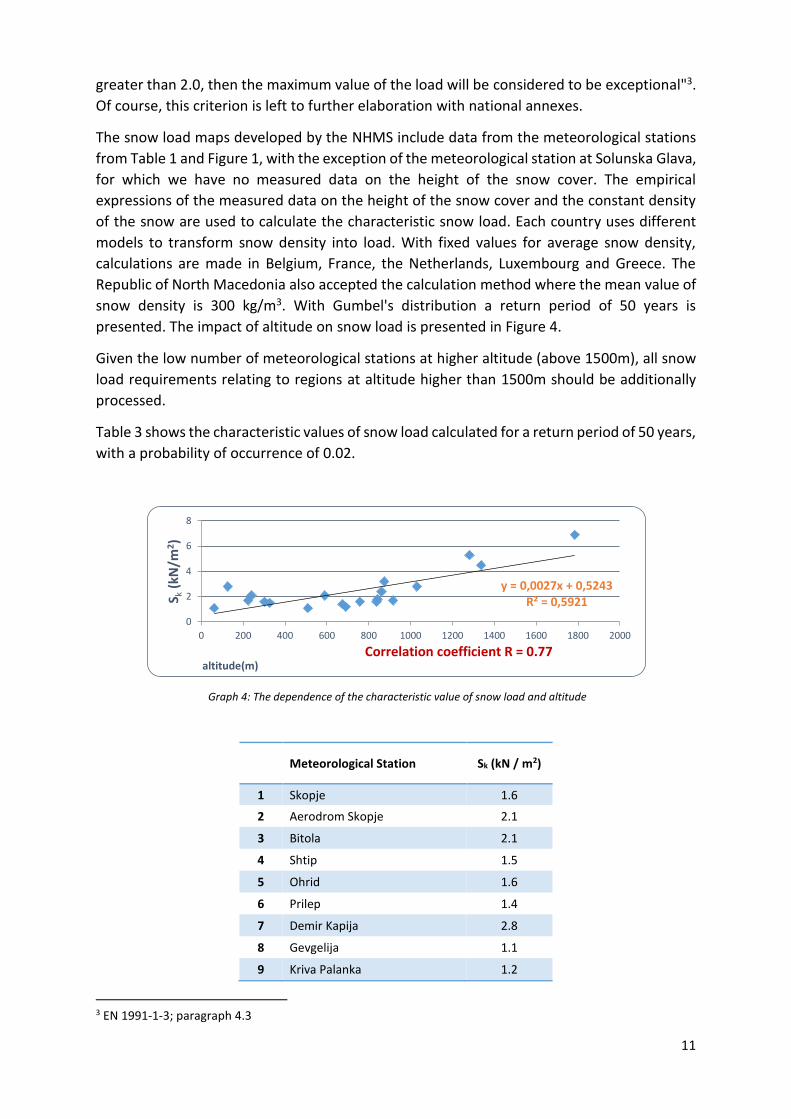
Table 3 shows the characteristic values of snow load calculated for a return period of 50 years,
with a probability of occurrence of 0.02.
Graph 4: The dependence of the characteristic value of snow load and altitude
Meteorological Station Sk (kN / m2)
1 Skopje 1.6
2 Aerodrom Skopje 2.1
3 Bitola 2.1
4 Shtip 1.5
5 Ohrid 1.6
6 Prilep 1.4
7 Demir Kapija 2.8
8 Gevgelija 1.1
9 Kriva Palanka 1.2
3 EN 1991-1-3; paragraph 4.3
y = 0,0027x + 0,5243R² = 0,5921
0
2
4
6
8
0 200 400 600 800 1000 1200 1400 1600 1800 2000
S k(k
N/m
2)
altitude(m)Correlation coefficient R = 0.77
12
10 Strumica 1.7
11 Berovo 1.6
12 Lazaropole 4.5
13 Pretor 1.7
14 Pozhar 2.8
15 Vinica 1.1
16 Topolchani 1.8
17 Мavrovo 5.3
18 Polog 3.2
19 Popova Shapka 6.9
20 Gjurishte 2.4
Table 3: Characteristic values of snow load with probability of occurrence 0.02
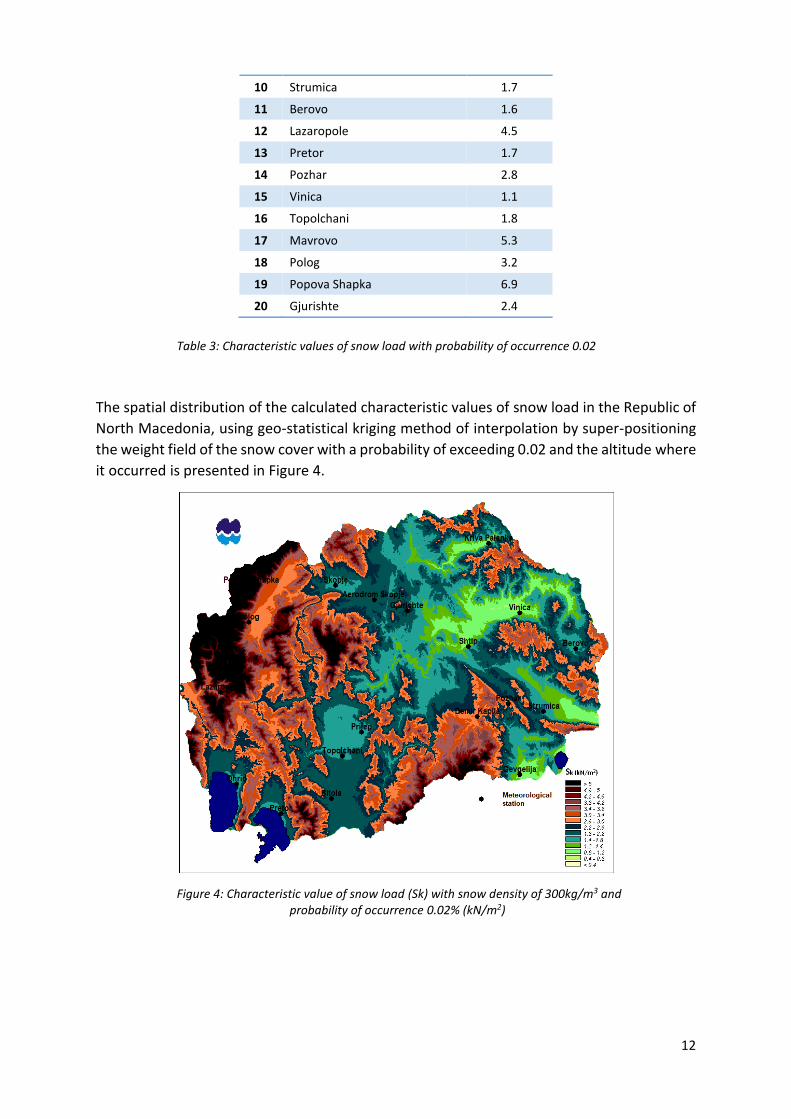
The spatial distribution of the calculated characteristic values of snow load in the Republic of
North Macedonia, using geo-statistical kriging method of interpolation by super-positioning
the weight field of the snow cover with a probability of exceeding 0.02 and the altitude where
it occurred is presented in Figure 4.
Figure 4: Characteristic value of snow load (Sk) with snow density of 300kg/m3 and probability of occurrence 0.02% (kN/m2)

13
SNOW LOAD WITH DIFFERENT SNOW DENSITY (100, 150, 200 AND 250KG/M3)
The values for snow load calculated with the data on the height of the snow cover and the
different mean density of snow measured on the meteorological stations are given in Table
4. The spatial distribution of the characteristic values of snow load in the Republic of North
Macedonia, using geostatistical kriging method of interpolation by super-positioning the
weight field of the snow cover with a probability of exceeding 0.02 and the altitude of snow
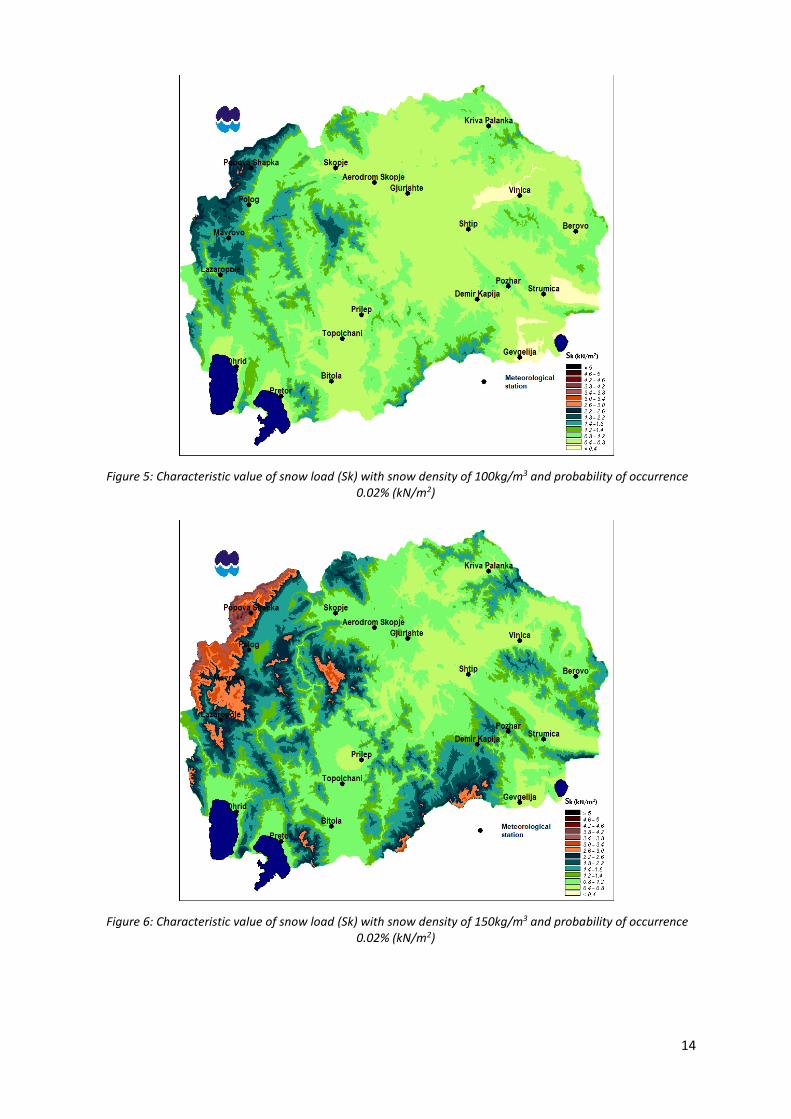
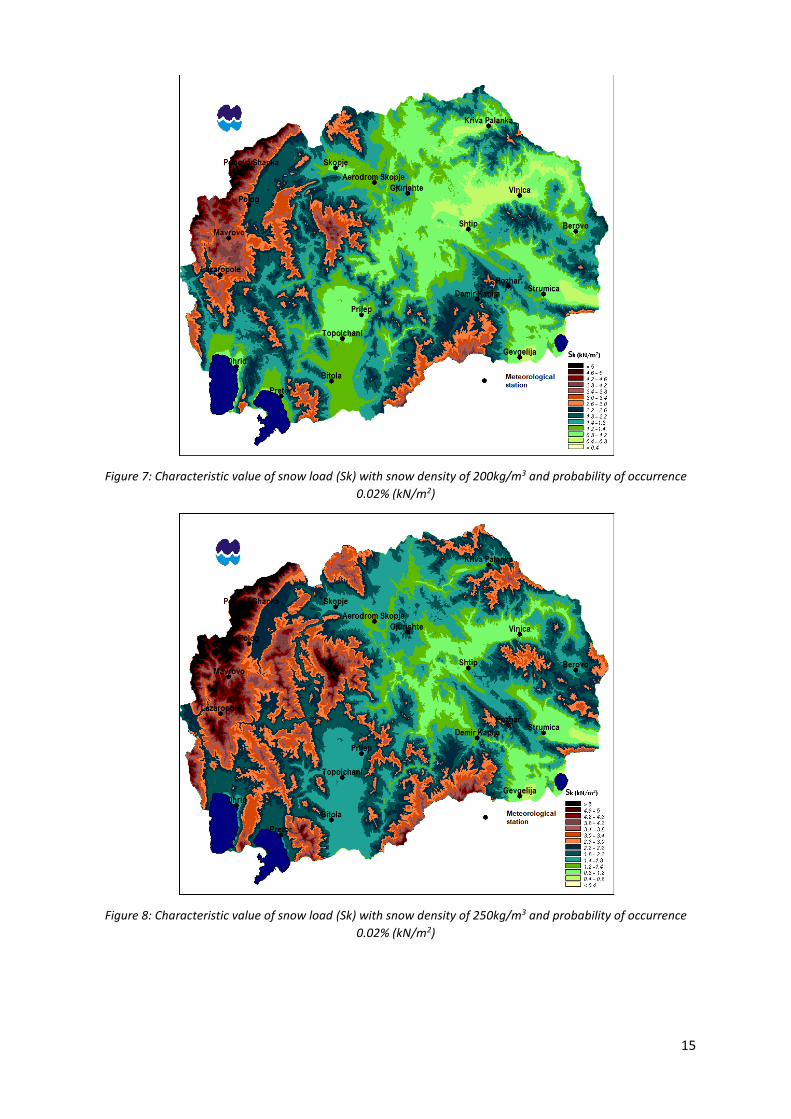
with density of 100, 150, 200 and 250 kg/m3 is presented in Figures 5, 6, 7 and 8.
(kg / m3) density of snow 100 150 200 250
Meteorological station
Gevgelija 0.4 0.6 0.8 0.9
Lazaropole 1.5 2.2 3.0 3.7
Ohrid 0.5 0.8 1.0 1.3
Pretor 0.6 0.9 1.2 1.4
Bitola 0.7 1.1 1.4 1.8
Demir Kapija 0.9 1.4 1.9 2.3
Pozhar 0.9 1.4 1.9 2.4
Strumica 0.6 0.9 1.1 1.4
Topolchani 0.6 0.9 1.2 1.5
Мavrovo 1.8 2.6 3.5 4.4
Polog 1.1 1.6 2.2 2.7
Popova Shapka 2.3 3.5 4.6 5.8
Gjurishte 0.8 1.2 1.6 2.0
Prilep 0.5 0.7 0.9 1.2
Skopje 0.5 0.8 1.1 1.3
Aerodrom Skopje 0.7 1.0 1.4 1.7
Shtip 0.5 0.7 1.0 1.2
Berovo 0.5 0.8 1.1 1.3
Vinica 0.4 0.6 0.7 0.9
Kriva Palanka 0.4 0.6 0.8 1.0
Table 4: Characteristic values of snow load with different average snow density and
probability of occurrence of 0.02
14
Figure 5: Characteristic value of snow load (Sk) with snow density of 100kg/m3 and probability of occurrence 0.02% (kN/m2)
Figure 6: Characteristic value of snow load (Sk) with snow density of 150kg/m3 and probability of occurrence 0.02% (kN/m2)
15
Figure 7: Characteristic value of snow load (Sk) with snow density of 200kg/m3 and probability of occurrence
0.02% (kN/m2)
Figure 8: Characteristic value of snow load (Sk) with snow density of 250kg/m3 and probability of occurrence
0.02% (kN/m2)
16
WIND ACTIONS
Due to the uneven distribution of energy over the Earth's surface the air in the atmosphere is
in constant motion. The different distribution of energy that is manifested through the
different air temperature of the Earth's surface creates differences in air pressure. As a result
of the air pressure difference, a horizontal flow of air is created which is known as wind. Taking
into account the importance of wind data, its action at different altitudes is carefully studied
and the results are most often used during the design, construction and maintenance of
buildings and structures.
The changes in wind speed and direction on the Earth's surface is mainly influenced by the
complex relief, i.e. by the physical and geographical conditions. Daily wind changes depend
on the state of the atmosphere, i.e. on the weather conditions. In the ground layer of the
atmosphere, the change of wind with height is due to the friction force. These changes are
more pronounced in the lowest layers of the atmosphere, up to 50m from the Earth's surface.
In this layer the wind speed changes abruptly with altitude. The change in wind speed and
direction depends on the Earth's surface, the state of the atmosphere and the value of the
wind speed. Less smooth the surface, the greater is the force of external friction, and thus the
greater is the change in speed and direction with height.
The aforementioned European standard for wind actions, recommends that the characteristic
value of "10 minutes mean wind speed with a probability of exceeding 0.02, regardless of the
direction, measured at a height of 10m" is used in calculations.
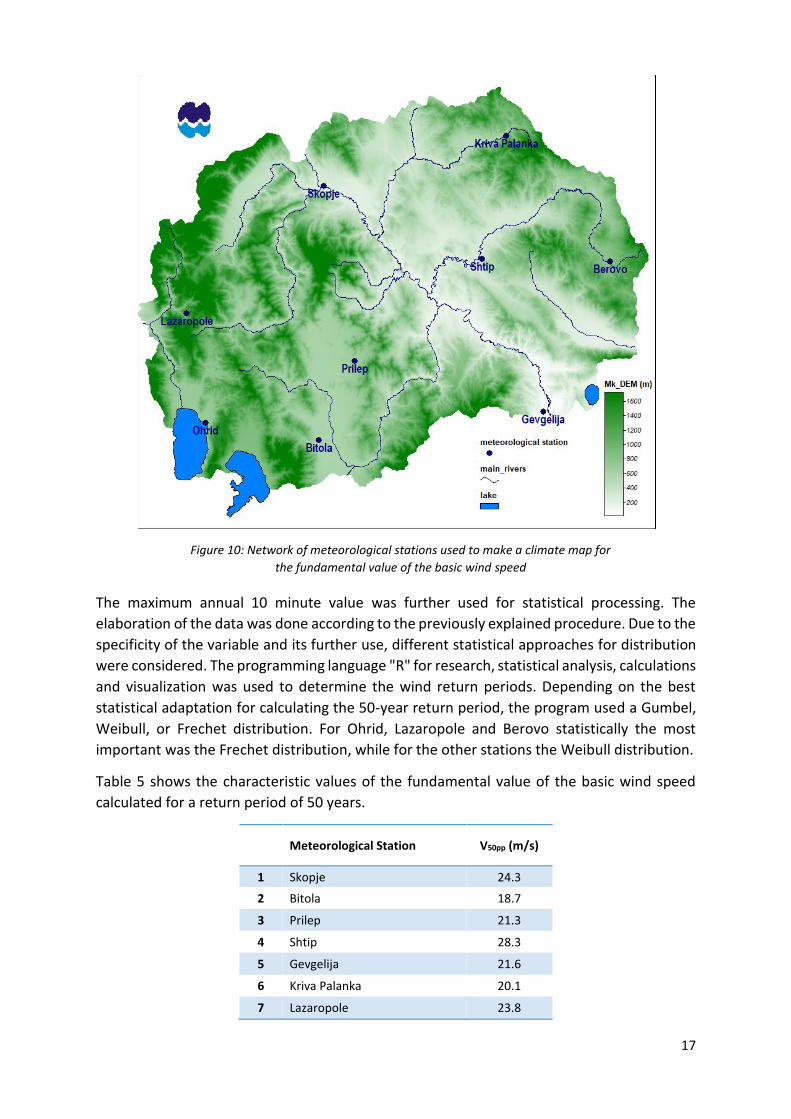
Data from 9 meteorological stations shown in Figure 10 were used for this analysis, for the
period 1991-2017. Geographical characteristics of the stations are shown in Table 1. The
instrument that records the 10 minute wind speed on anemographic tapes is an anemograph.
This fundamental value of the basic wind speed is measured in m/s. The registered 10 minutes
mean speed which passed the wind path was analyzed.
17
Figure 10: Network of meteorological stations used to make a climate map for
the fundamental value of the basic wind speed
The maximum annual 10 minute value was further used for statistical processing. The
elaboration of the data was done according to the previously explained procedure. Due to the
specificity of the variable and its further use, different statistical approaches for distribution
were considered. The programming language "R" for research, statistical analysis, calculations
and visualization was used to determine the wind return periods. Depending on the best
statistical adaptation for calculating the 50-year return period, the program used a Gumbel,
Weibull, or Frechet distribution. For Ohrid, Lazaropole and Berovo statistically the most
important was the Frechet distribution, while for the other stations the Weibull distribution.
Table 5 shows the characteristic values of the fundamental value of the basic wind speed
calculated for a return period of 50 years.
Meteorological Station V50pp (m/s)
1 Skopje 24.3
2 Bitola 18.7
3 Prilep 21.3
4 Shtip 28.3
5 Gevgelija 21.6
6 Kriva Palanka 20.1
7 Lazaropole 23.8
18
8 Berovo 14.7
9 Ohrid 29.3
Table 5: Characteristic values of the fundamental value of the basic wind speed
with probability of occurrence of 0.02
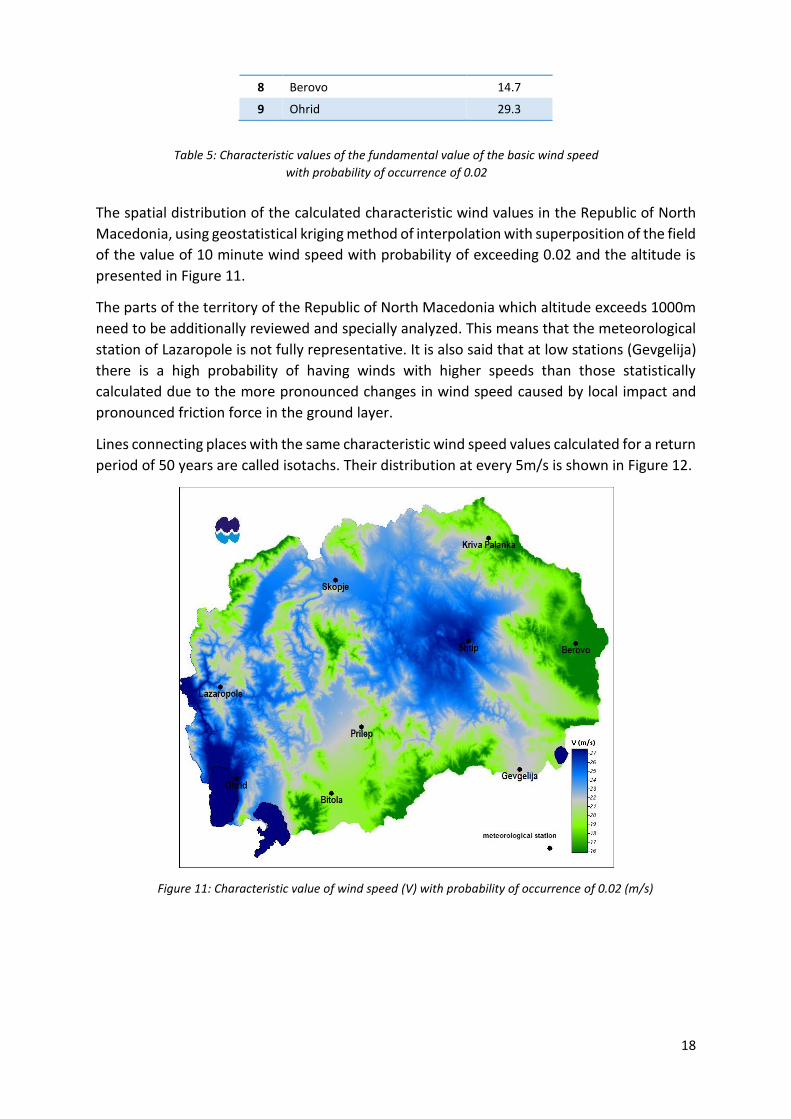
The spatial distribution of the calculated characteristic wind values in the Republic of North
Macedonia, using geostatistical kriging method of interpolation with superposition of the field
of the value of 10 minute wind speed with probability of exceeding 0.02 and the altitude is
presented in Figure 11.
The parts of the territory of the Republic of North Macedonia which altitude exceeds 1000m
need to be additionally reviewed and specially analyzed. This means that the meteorological
station of Lazaropole is not fully representative. It is also said that at low stations (Gevgelija)
there is a high probability of having winds with higher speeds than those statistically
calculated due to the more pronounced changes in wind speed caused by local impact and
pronounced friction force in the ground layer.
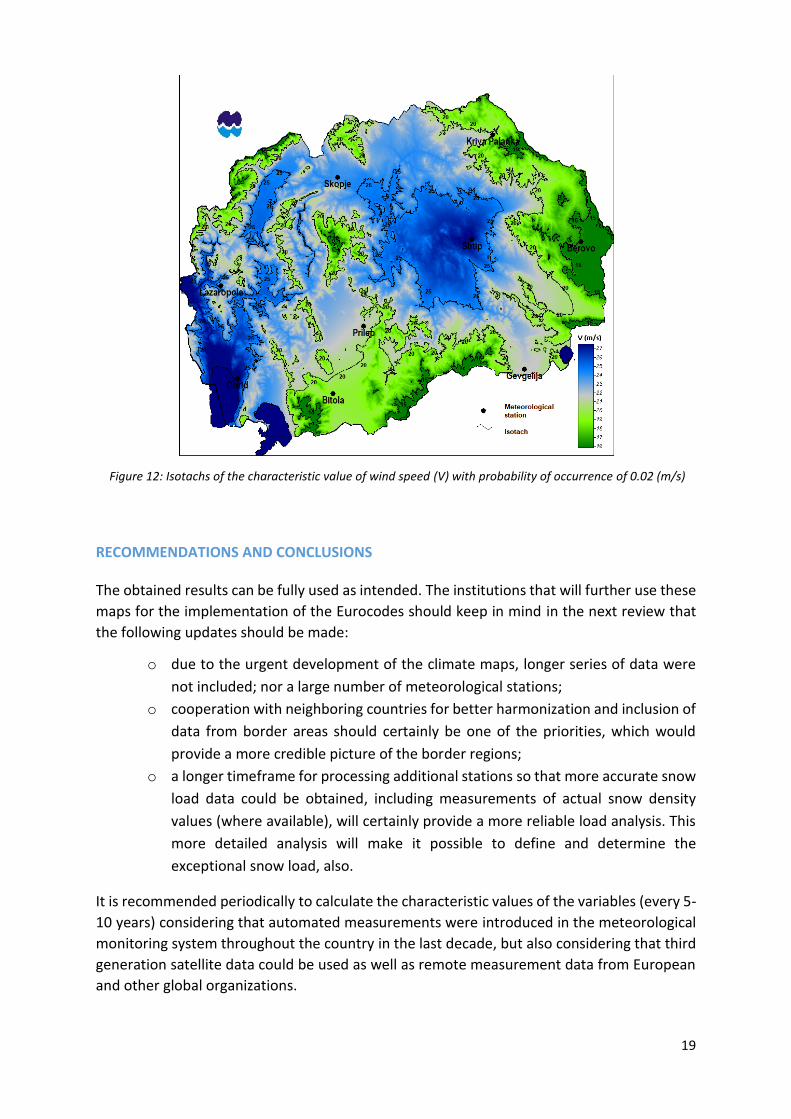
Lines connecting places with the same characteristic wind speed values calculated for a return
period of 50 years are called isotachs. Their distribution at every 5m/s is shown in Figure 12.
Figure 11: Characteristic value of wind speed (V) with probability of occurrence of 0.02 (m/s)
19
Figure 12: Isotachs of the characteristic value of wind speed (V) with probability of occurrence of 0.02 (m/s)
RECOMMENDATIONS AND CONCLUSIONS
The obtained results can be fully used as intended. The institutions that will further use these
maps for the implementation of the Eurocodes should keep in mind in the next review that
the following updates should be made:
o due to the urgent development of the climate maps, longer series of data were
not included; nor a large number of meteorological stations;
o cooperation with neighboring countries for better harmonization and inclusion of
data from border areas should certainly be one of the priorities, which would
provide a more credible picture of the border regions;
o a longer timeframe for processing additional stations so that more accurate snow
load data could be obtained, including measurements of actual snow density
values (where available), will certainly provide a more reliable load analysis. This
more detailed analysis will make it possible to define and determine the
exceptional snow load, also.
It is recommended periodically to calculate the characteristic values of the variables (every 5-
10 years) considering that automated measurements were introduced in the meteorological
monitoring system throughout the country in the last decade, but also considering that third
generation satellite data could be used as well as remote measurement data from European
and other global organizations.
20
CLIMATE MAPS - CLIMATE CHANGE ACTIONS (IMPACTS)
The evidence of climate change is unequivocal and the consequences are increasingly being
felt in Republic of North Macedonia and worldwide. The impact of climate change on man-
made systems has a large component of uncertainty, given that the future climatic scenarios
mainly depend on the evolution of the global CO2 drivers.
The most likely pathways for drivers’ concentrations depend on mitigation scenarios and
deadlines for the implementation of policies to reduce greenhouse gas emissions, like the
Kyoto Protocol. These scenarios, globally, show further warming and change in the water
cycle, but locally, the trends can be very different and even opposite from the global average.
According to the results obtained, it is expected that the climate in North Macedonia will be
warmer and drier and the amplitude of change will be initially related to future concentrations
of greenhouse gases (V. Djurdjevic).
Namely, the obtained results signal that extreme precipitation in future, in the upper limit,
gives 60% probability for increase in the number of days with precipitation over 40mm/day
and 20% increase of the maximum daily precipitation (V. Djurdjevic), which indicates that
further analysis is needed because local daily changes may not condition a change in the
return period of the characteristic values analyzed during the development of the climate
maps.
Additional research on climate maps is needed through the so-called pilot study in which a
procedure will be developed for combining the historically measured meteorological data and
the future predicted values, obtained as output data from the projections in the climate
scenarios (maximum and minimum air temperature and amount of precipitation).
The proposed methodology should ensure a comprehensive overview of the climate change
impacts on the characteristic values that were analyzed during the preparation of climate
maps, according to the different emission scenarios.

21
MAFWE Ministry of Agriculture, Forestry and Water Economy
WMO World Meteorological Organization
NHMS National Hydrometeorological Service
_______________________________________________________________________
SET Central European Time (SEA)
HOMER HOMogenizaton softwarE in R
UTC Coordinated Universal Time