Reconstructing dynamic regulatory maps
13
Reconstructing dynamic regulatory maps Jason Ernst 1 , Oded Vainas 2 , Christopher T Harbison 3,5 , Itamar Simon 2 and Ziv Bar-Joseph 1,4, * 1 Machine Learning Department, School of Computer Science, Carnegie Mellon University, Pittsburgh, PA, USA, 2 Department of Molecular Biology, Hebrew University Medical School, Jerusalem, Israel, 3 Whitehead Institute for Biomedical Research, Nine Cambridge Center, Cambridge, MA, USA and 4 Department of Computer Science, School of Computer Science, Carnegie Mellon University, Pittsburgh, PA, USA 5 Present address: Bristol-Myers Squibb Pharmaceutical Research Institute, Princeton, NJ 08543, USA * Corresponding author. Machine Learning Department, School of Computer Science, Carnegie Mellon University, 5000 Forbes Ave., Pittsburgh, PA 15213, USA. Tel.: þ 1 412 268 8595; Fax: þ 1 412 268 3431; E-mail: [email protected] Received 17.8.06; accepted 15.11.06 Even simple organisms have the ability to respond to internal and external stimuli. This response is carried out by a dynamic network of protein–DNA interactions that allows the specific regulation of genes needed for the response. We have developed a novel computational method that uses an input–output hidden Markov model to model these regulatory networks while taking into account their dynamic nature. Our method works by identifying bifurcation points, places in the time series where the expression of a subset of genes diverges from the rest of the genes. These points are annotated with the transcription factors regulating these transitions resulting in a unified temporal map. Applying our method to study yeast response to stress, we derive dynamic models that are able to recover many of the known aspects of these responses. Predictions made by our method have been experimentally validated leading to new roles for Ino4 and Gcn4 in controlling yeast response to stress. The temporal cascade of factors reveals common pathways and highlights differences between master and secondary factors in the utilization of network motifs and in condition-specific regulation. Molecular Systems Biology 16 January 2007; doi:10.1038/msb4100115 Subject Categories: computational methods; chromatin & transcription Keywords: dynamics; hidden Markov models; regulatory networks Introduction Understanding the dynamic programs that a cell utilizes in response to internal or external stimuli is an important challenge. These programs activate regulatory networks controlled by several transcription factors (TFs) (Harbison et al, 2004) and can involve a large number of genes (Natarajan et al, 2001). Direct information about this process has been obtained from genome-wide chromatin immunopre- cipitation (ChIP-chip) experiments and comparative motif studies that have been carried out to identify some of the regulators involved (Hahn et al, 2004; Harbison et al, 2004; Xie et al, 2005; Workman et al, 2006). Time-series microarray expression experiments are a complementary source of data, providing dynamic information about the expression of thousands of genes that are activated or repressed in response to stimuli such as environmental stress (Gasch et al, 2000). An extensive literature has accumulated on methods to analyze and model time-series gene expression data. Some of these methods have focused on determining a continuous representation of the time-series expression data using splines (D’haeseleer et al, 1999; Bar-Joseph et al, 2003a). Other methods have focused on clustering genes while taking into account gene expression dynamics using methods such as auto-regressive equations (Ramoni et al, 2002), hidden Markov models (HMMs) (Schliep et al, 2003), and template- based methods (Ernst et al, 2005). Others have modeled time- series gene expression data using techniques such as differential equations (Chen et al, 1999), dynamic bayesian networks (Kim et al, 2003), and singular value decomposition (Holter et al, 2001). These methods, although useful, only provide a partial view of the transcriptional regulation process as they do not explicitly integrate information about TF–gene interactions such as ChIP-chip and motif data. Most methods that integrate gene expression data with motif or ChIP-chip data do so without explicitly taking into account the dynamic nature of biological systems. A number of these methods combined a large number of expression data sets and motif data to infer transcription modules (Pilpel et al, 2001; Ihmels et al, 2002; Segal et al, 2003). Transcriptional modules are subsets of TFs and genes, such that genes in the same module tend to be similarly expressed and regulated by the same TFs across a number of experimental conditions. Bar-Joseph et al (2003b) inte- grated ChIP-chip data with expression data with a similar objective. Das et al (2006) presented a method that com- bined human expression data and motif information to identify active motifs, combinations of motifs and target genes under certain conditions. Although these prior methods provided important insights and often used time-series expression data sets, they did not take advantage of the sequential ordering of time points in an expression experi- ment, essentially treating time-series and static expression data in the same way. & 2007 EMBO and Nature Publishing Group Molecular Systems Biology 2007 1 Molecular Systems Biology 3; Article number 74; doi:10.1038/msb4100115 Citation: Molecular Systems Biology 3:74 & 2007 EMBO and Nature Publishing Group All rights reserved 1744-4292/07 www.molecularsystemsbiology.com
-
Upload
independent -
Category
Documents
-
view
0 -
download
0
Transcript of Reconstructing dynamic regulatory maps

Reconstructing dynamic regulatory maps
Jason Ernst1, Oded Vainas2, Christopher T Harbison3,5, Itamar Simon2 and Ziv Bar-Joseph1,4,*
1 Machine Learning Department, School of Computer Science, Carnegie Mellon University, Pittsburgh, PA, USA, 2 Department of Molecular Biology, Hebrew UniversityMedical School, Jerusalem, Israel, 3 Whitehead Institute for Biomedical Research, Nine Cambridge Center, Cambridge, MA, USA and 4 Department of ComputerScience, School of Computer Science, Carnegie Mellon University, Pittsburgh, PA, USA5 Present address: Bristol-Myers Squibb Pharmaceutical Research Institute, Princeton, NJ 08543, USA* Corresponding author. Machine Learning Department, School of Computer Science, Carnegie Mellon University, 5000 Forbes Ave., Pittsburgh, PA 15213, USA.Tel.: þ 1 412 268 8595; Fax: þ 1 412 268 3431; E-mail: [email protected]
Received 17.8.06; accepted 15.11.06
Even simple organisms have the ability to respond to internal and external stimuli. This responseis carried out by a dynamic network of protein–DNA interactions that allows the specific regulationof genes needed for the response. We have developed a novel computational method that uses aninput–output hidden Markov model to model these regulatory networks while taking into accounttheir dynamic nature. Our method works by identifying bifurcation points, places in the time serieswhere the expression of a subset of genes diverges from the rest of the genes. These points areannotated with the transcription factors regulating these transitions resulting in a unified temporalmap. Applying our method to study yeast response to stress, we derive dynamic models that are ableto recover many of the known aspects of these responses. Predictions made by our method have beenexperimentally validated leading to new roles for Ino4 and Gcn4 in controlling yeast response tostress. The temporal cascade of factors reveals common pathways and highlights differencesbetween master and secondary factors in the utilization of network motifs and in condition-specificregulation.Molecular Systems Biology 16 January 2007; doi:10.1038/msb4100115Subject Categories: computational methods; chromatin & transcriptionKeywords: dynamics; hidden Markov models; regulatory networks
Introduction
Understanding the dynamic programs that a cell utilizesin response to internal or external stimuli is an importantchallenge. These programs activate regulatory networkscontrolled by several transcription factors (TFs) (Harbisonet al, 2004) and can involve a large number of genes(Natarajan et al, 2001). Direct information about this processhas been obtained from genome-wide chromatin immunopre-cipitation (ChIP-chip) experiments and comparative motifstudies that have been carried out to identify some of theregulators involved (Hahn et al, 2004; Harbison et al, 2004; Xieet al, 2005; Workman et al, 2006). Time-series microarrayexpression experiments are a complementary source of data,providing dynamic information about the expression ofthousands of genes that are activated or repressed in responseto stimuli such as environmental stress (Gasch et al, 2000).
An extensive literature has accumulated on methods toanalyze and model time-series gene expression data. Someof these methods have focused on determining a continuousrepresentation of the time-series expression data using splines(D’haeseleer et al, 1999; Bar-Joseph et al, 2003a). Othermethods have focused on clustering genes while taking intoaccount gene expression dynamics using methods such asauto-regressive equations (Ramoni et al, 2002), hiddenMarkov models (HMMs) (Schliep et al, 2003), and template-based methods (Ernst et al, 2005). Others have modeled time-
series gene expression data using techniques such asdifferential equations (Chen et al, 1999), dynamic bayesiannetworks (Kim et al, 2003), and singular value decomposition(Holter et al, 2001). These methods, although useful, onlyprovide a partial view of the transcriptional regulation processas they do not explicitly integrate information about TF–geneinteractions such as ChIP-chip and motif data.
Most methods that integrate gene expression data withmotif or ChIP-chip data do so without explicitly taking intoaccount the dynamic nature of biological systems. A numberof these methods combined a large number of expressiondata sets and motif data to infer transcription modules(Pilpel et al, 2001; Ihmels et al, 2002; Segal et al, 2003).Transcriptional modules are subsets of TFs and genes,such that genes in the same module tend to be similarlyexpressed and regulated by the same TFs across a numberof experimental conditions. Bar-Joseph et al (2003b) inte-grated ChIP-chip data with expression data with a similarobjective. Das et al (2006) presented a method that com-bined human expression data and motif information toidentify active motifs, combinations of motifs and target genesunder certain conditions. Although these prior methodsprovided important insights and often used time-seriesexpression data sets, they did not take advantage of thesequential ordering of time points in an expression experi-ment, essentially treating time-series and static expressiondata in the same way.
& 2007 EMBO and Nature Publishing Group Molecular Systems Biology 2007 1
Molecular Systems Biology 3; Article number 74; doi:10.1038/msb4100115Citation: Molecular Systems Biology 3:74& 2007 EMBO and Nature Publishing Group All rights reserved 1744-4292/07www.molecularsystemsbiology.com
A few recent methods have been proposed to integrate time-series expression data with ChIP-chip or motif data whiletaking into account the ordering of experiments in time-seriesdata sets. For instance, time-series expression data were usedto determine which genes were active at certain phases andthen combined with ChIP-chip data using a trace-backalgorithm to identify active TFs at these phases (Luscombeet al, 2004). This method in effect identified an ordered seriesof static regulatory graphs, but its direct connection with thedynamics of observed gene expression patterns is less clear.Other methods have relied more heavily on individualgene expression profile dynamics. For instance, Kundaje et al(2005) forms independent clusters of genes by using a jointprobabilistic model for the dynamics of time-series expressionprofiles of genes and the motifs in their promoter regions.Others have integrated time-series expression data with ChIP-chip data to model the expression of individual genes (Lin et al,2005) and interactions among TFs (Cokus et al, 2006) applyingtheir techniques to model the cell cycle. Another method(Bonneau et al, 2006) used kinetic equations based on thetime-series expression data to associate TFs with subsets ofgenes across a subset of experimental conditions.
Our objective is different from that of these prior works. Wepresent a computational method that integrates the time-seriesexpression data and ChIP-chip or motif information to infer an
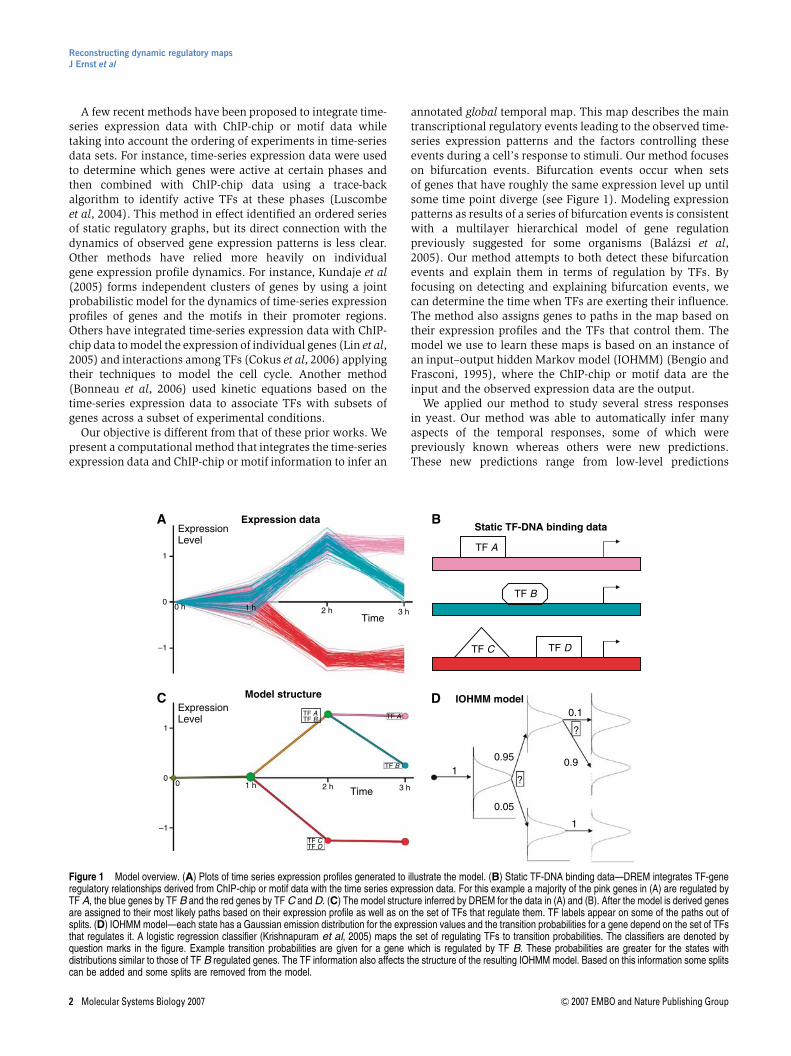
annotated global temporal map. This map describes the maintranscriptional regulatory events leading to the observed time-series expression patterns and the factors controlling theseevents during a cell’s response to stimuli. Our method focuseson bifurcation events. Bifurcation events occur when setsof genes that have roughly the same expression level up untilsome time point diverge (see Figure 1). Modeling expressionpatterns as results of a series of bifurcation events is consistentwith a multilayer hierarchical model of gene regulationpreviously suggested for some organisms (Balazsi et al,2005). Our method attempts to both detect these bifurcationevents and explain them in terms of regulation by TFs. Byfocusing on detecting and explaining bifurcation events, wecan determine the time when TFs are exerting their influence.The method also assigns genes to paths in the map based ontheir expression profiles and the TFs that control them. Themodel we use to learn these maps is based on an instance ofan input–output hidden Markov model (IOHMM) (Bengio andFrasconi, 1995), where the ChIP-chip or motif data are theinput and the observed expression data are the output.
We applied our method to study several stress responsesin yeast. Our method was able to automatically infer manyaspects of the temporal responses, some of which werepreviously known whereas others were new predictions.These new predictions range from low-level predictions
TF C
Time
ExpressionLevel
Model structure
Time
1
0.1
0.9
1
0.95
0.05
ExpressionLevel
Expression dataStatic TF-DNA binding data
IOHMM model
TF A
TF B
TF D
?
?
1 h0 h 2 h 3 h
1
0
–1
1
00 1 h 2 h 3 h
TF B
TF CTF D
TF A TF ATF B
–1
A B
C D
Figure 1 Model overview. (A) Plots of time series expression profiles generated to illustrate the model. (B) Static TF-DNA binding data—DREM integrates TF-generegulatory relationships derived from ChIP-chip or motif data with the time series expression data. For this example a majority of the pink genes in (A) are regulated byTF A, the blue genes by TF B and the red genes by TF C and D. (C) The model structure inferred by DREM for the data in (A) and (B). After the model is derived genesare assigned to their most likely paths based on their expression profile as well as on the set of TFs that regulate them. TF labels appear on some of the paths out ofsplits. (D) IOHMM model—each state has a Gaussian emission distribution for the expression values and the transition probabilities for a gene depend on the set of TFsthat regulates it. A logistic regression classifier (Krishnapuram et al, 2005) maps the set of regulating TFs to transition probabilities. The classifiers are denoted byquestion marks in the figure. Example transition probabilities are given for a gene which is regulated by TF B. These probabilities are greater for the states withdistributions similar to those of TF B regulated genes. The TF information also affects the structure of the resulting IOHMM model. Based on this information some splitscan be added and some splits are removed from the model.
Reconstructing dynamic regulatory mapsJ Ernst et al
2 Molecular Systems Biology 2007 & 2007 EMBO and Nature Publishing Group

regarding the timing of specific interactions to mechanisticpredictions about the set of TFs controlling recovery fromstress to predictions related to phenotypic changes. We haveexperimentally validated all types of these predictions leadingto new roles for TFs in controlling yeast response to stress.We also used our temporal maps to compare different stressexperiments and to identify a number of common controlmechanisms. By using the time of activation that our methodassigned to TFs, we were able to identify cascades ofactivators. Analysis of these cascades provides insights intothe utilization of networks motifs and condition-specificregulation in response to stress.
Results
The Dynamic Regulatory Events Miner (DREM)
To combine time-series gene expression data and ChIP-chip ormotif data, we extended an algorithm for learning IOHMMs(Bengio and Frasconi, 1995). IOHMMs are an extension ofHMMs. HMMs have been used in the past to model sequentialdata including DNA and protein sequence data (Durbin et al,1998) and to cluster gene expression data (Schliep et al, 2003).In HMMs as well as IOHMMs, hidden states are used to groupgenes by associating a cluster with each path through thehidden states over time. In our application, each hidden stateis associated with one time point and represents a Gaussiandistribution of the expression values for genes associated withit (Figure 1). IOHMMs extend HMMs in that they allow for anadditional input set that does not necessarily change over timeto control the transition probabilities of genes from state tostate (Figure 1). In our application, we use static ChIP-chipexperiments or motif data as this additional input information.Thus, our model encodes a mapping from ChIP-chip or motifdata to the observed temporal expression values.
We constrain the transitions to enforce a tree structureamong the hidden states. This allows us to model bifurcationevents, places in the time series where subsets of genes thathad similar expression values at prior time points diverge fromeach other. The identification of these events using an IOHMMis biased to those splits for which different sets of TFs regulatethe divergent sets of genes. The algorithm searches over manypossible treemap structures, training the parameters asso-ciated with the structures, and then scoring these structuresusing cross-validation to select the best one. The resulting setof hidden states and transitions between them leads to a globaldynamic map. Each gene is then assigned to a specific pathin the map based on its time-series expression data and ChIP-chip or motif data. Following this assignment, we computeassociation scores for TFs and splits using the hypergeometricdistribution enrichment calculation. In the supplement, wediscuss how to relax the tree constraints to allow paths toconverge during recovery periods making the model morerealistic (Supplementary Figure 14). For the results in the maintext, we only used the sampled time points; however, as weshow in Supplementary information, one can also use ourmodel with interpolated values for time points that were notsampled (Supplementary Figure 15). Finally, we note that forthe results in this paper, we limited the analysis to binary splitsalthough the method also generalizes to higher order splits.
Complete details on the algorithm are given in the Methodssection in Supplementary information.
A temporal map for amino-acid starvationresponse
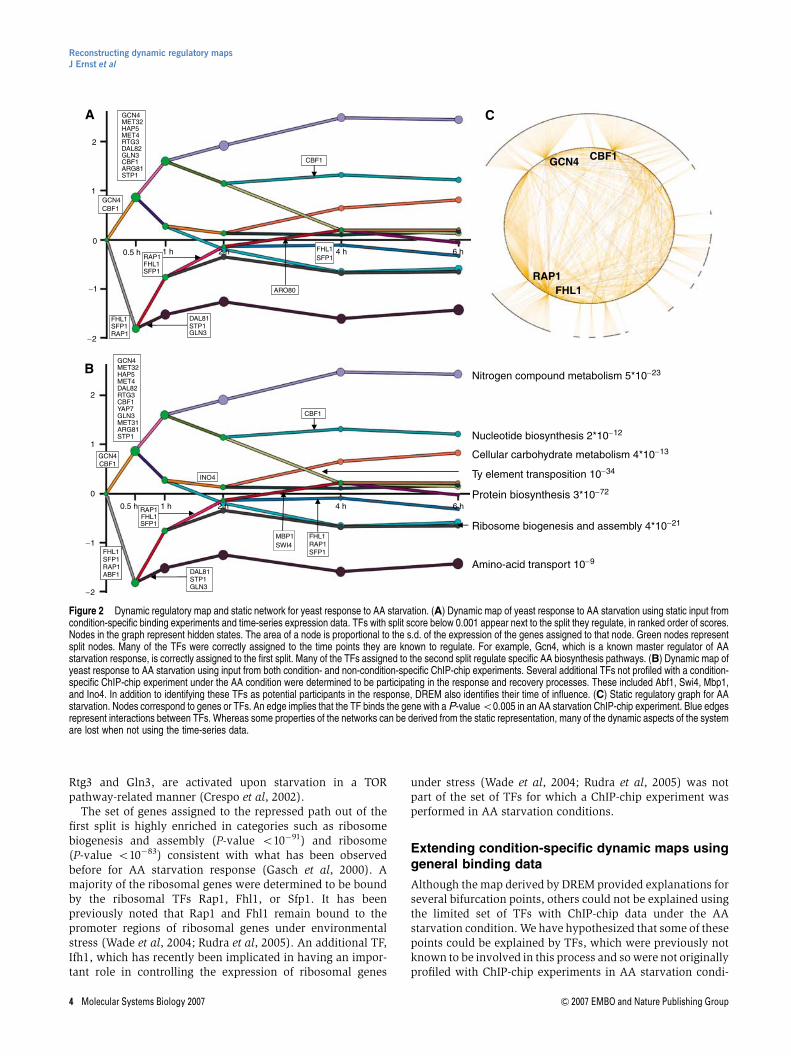
To test the ability of the dynamic regulatory events miner(DREM) to learn dynamic maps from time-series and ChIP-chip data, we initially focused on the amino-acid (AA)starvation response pathway in yeast. As AAs are the basicstructural components of proteins, yeast response to this stressby increasing AA synthesis and decreasing AA utilization iscritical for its survival. For this condition, we have detailedtime-series expression data (Gasch et al, 2000) as well as ChIP-chip experiments for 34 TFs (Harbison et al, 2004) (Supple-mentary Table 1). The time-series expression data were filteredto remove genes that did not change substantially at any timepoint (see Results section in Supplementary information).Figure 2A presents a temporal map derived by DREM usingthese two data sets. This map contained 11 unique pathscontrolled by a total of 15 TFs (using a TF split cutoff score of0.001; see Materials and methods). In some cases, the same TFappears multiple times on the same path indicating multiplebifurcations with which the TF is significantly associated. Ashas been noted before, following AA starvation there is amassive transcription response involving both activation andrepression. Our algorithm assigned to the first bifurcation twosets of TFs, Gcn4 and Cbf1 are associated with the genes thatturn on upon starvation, whereas Fhl1, Sfp1, and Rap1 areassociated with the repressed genes (Figure 2A and Supple-mentary Figure 1). These observations fit and expand currentknowledge about this process. Gcn4 is indeed the masterregulator of the AA starvation response (Hinnebusch and Fink,1983; Natarajan et al, 2001), whereas Cbf1 has been previouslyassociated with methionine biosynthesis (Baker and Masison,1990). Our findings of Cbf1 association to the first bifurcationpoint suggest that it has a broader role in the cellular responseto AA starvation. Indeed, genes regulated by Cbf1 and assig-ned to the higher path out of the first split were enriched notonly for gene ontology (GO) (Ashburner et al, 2000) categorieslike sulfur AA metabolism (P-value o10�9), which waspreviously noted (Thomas et al, 1992), but also for glutamatemetabolism (P-value o4�10�6) and the more general AAmetabolism category, with a lower P-value (o7�10�16). Gcn4and Cbf1 are known to cooperate in the activation of the Met16gene (O’Connell et al, 1995) and our finding of Gcn4 and Cbf1as the two major activators in the AA response may suggestthat such cooperativity is much more common. Indeed, weobserve a significant overlap in genes bound by both Gcn4 andCbf1 (P-value o4�10�8). Many of the TFs assigned to thesecond time point (secondary TFs) are known regulators ofspecific AA biosynthesis pathways, including Met4 as well asArg81, Met32, and Dal82. Using GO, we determined that the setof genes assigned to the highest path after the first time pointwas enriched for AA metabolism (P-value o9�10�39) andsubcategories such as glutamate biosynthesis (P-valueo10�13), sulfur AA metabolism (P-value o6�10�10), methio-nine metabolism (P-value o2�10�9), and arginine metabo-lism (P-valueo4�10�9). Two other TFs assigned to this point,
Reconstructing dynamic regulatory mapsJ Ernst et al
& 2007 EMBO and Nature Publishing Group Molecular Systems Biology 2007 3
Rtg3 and Gln3, are activated upon starvation in a TORpathway-related manner (Crespo et al, 2002).
The set of genes assigned to the repressed path out of thefirst split is highly enriched in categories such as ribosomebiogenesis and assembly (P-value o10�91) and ribosome(P-value o10�83) consistent with what has been observedbefore for AA starvation response (Gasch et al, 2000). Amajority of the ribosomal genes were determined to be boundby the ribosomal TFs Rap1, Fhl1, or Sfp1. It has beenpreviously noted that Rap1 and Fhl1 remain bound to thepromoter regions of ribosomal genes under environmentalstress (Wade et al, 2004; Rudra et al, 2005). An additional TF,Ifh1, which has recently been implicated in having an impor-tant role in controlling the expression of ribosomal genes
under stress (Wade et al, 2004; Rudra et al, 2005) was notpart of the set of TFs for which a ChIP-chip experiment wasperformed in AA starvation conditions.
Extending condition-specific dynamic maps usinggeneral binding data
Although the map derived by DREM provided explanations forseveral bifurcation points, others could not be explained usingthe limited set of TFs with ChIP-chip data under the AAstarvation condition. We have hypothesized that some of thesepoints could be explained by TFs, which were previously notknown to be involved in this process and so were not originallyprofiled with ChIP-chip experiments in AA starvation condi-
FHL1RAP1
GCN4 CBF1
Amino-acid transport 10− 9
Ribosome biogenesis and assembly 4*10− 21
Protein biosynthesis 3*10− 72
Cellular carbohydrate metabolism 4*10− 13
Nitrogen compound metabolism 5*10− 23
Nucleotide biosynthesis 2*10− 12
Ty element transposition 10− 34
GCN4MET32HAP5MET4RTG3DAL82GLN3CBF1
FHL1SFP1RAP1
DAL81STP1GLN3
GCN4MET32
MET4DAL82RTG3CBF1YAP7GLN3MET31ARG81STP1
RAP1
MBP1SWI4
FHL1
DAL81STP1GLN3
RAP1SFP1
FHL1SFP1
HAP5
ARG81STP1
CBF1
RAP1FHL1SFP1
ARO80
2
0.5 h 1 h 2 h 4 h 6 h
2
1
0
0.5 h 1 h 2 h 4 h 6 h
1
0
−1
− 2
− 1
− 2
INO4
CBF1
FHL1SFP1
GCN4CBF1
GCN4CBF1
FHL1SFP1RAP1ABF1
A
B
C
Figure 2 Dynamic regulatory map and static network for yeast response to AA starvation. (A) Dynamic map of yeast response to AA starvation using static input fromcondition-specific binding experiments and time-series expression data. TFs with split score below 0.001 appear next to the split they regulate, in ranked order of scores.Nodes in the graph represent hidden states. The area of a node is proportional to the s.d. of the expression of the genes assigned to that node. Green nodes representsplit nodes. Many of the TFs were correctly assigned to the time points they are known to regulate. For example, Gcn4, which is a known master regulator of AAstarvation response, is correctly assigned to the first split. Many of the TFs assigned to the second split regulate specific AA biosynthesis pathways. (B) Dynamic map ofyeast response to AA starvation using input from both condition- and non-condition-specific ChIP-chip experiments. Several additional TFs not profiled with a condition-specific ChIP-chip experiment under the AA condition were determined to be participating in the response and recovery processes. These included Abf1, Swi4, Mbp1,and Ino4. In addition to identifying these TFs as potential participants in the response, DREM also identifies their time of influence. (C) Static regulatory graph for AAstarvation. Nodes correspond to genes or TFs. An edge implies that the TF binds the gene with a P-value o0.005 in an AA starvation ChIP-chip experiment. Blue edgesrepresent interactions between TFs. Whereas some properties of the networks can be derived from the static representation, many of the dynamic aspects of the systemare lost when not using the time-series data.
Reconstructing dynamic regulatory mapsJ Ernst et al
4 Molecular Systems Biology 2007 & 2007 EMBO and Nature Publishing Group
tions. To test this, we have employed DREM again, this timeaugmenting the static input data with an additional 75 TFsprofiled with ChIP-chip experiments in other conditionsin yeast, primarily yeast complete growing media (YPD)(Harbison et al, 2004). To reduce false positives in this ChIP-chip data, we used a post-processed version of the data thatalso requires the presence of an evolutionarily conserved motif(see Materials and methods). The map derived from thisadditional data (Figure 2B) contained new TFs that explaineda number of temporal events (Supplementary Tables 2 and 3).Some of these TFs were added to previously annotated timepoints. For instance, Yap7 was assigned to the set of secondaryTFs on the top split. Abf1 was assigned to the first split and wasdetermined to control genes that were downregulated early on.This agrees with previous studies that implicated Abf1 in beinginvolved in regulating the ribosome (Della Seta et al, 1990;Planta 1997). Two G1 cell-cycle activators, Swi4 and Mbp1,now appear on a split starting at the 2-h point on the recoverypath. This path was enriched for genes previously shown tobe cell cycle regulated (Spellman et al, 1998) (P-valueo9�10�6), where enrichment was based on all genes goinginto the split. Another factor, Ino4, which has been implicatedin phospholipid biosynthesis (Klig et al, 1988) and morerecently has been suggested to be a global regulator of geneexpression (Santiago and Mamoun, 2003; Workman et al,2006), was determined to be activating genes starting aroundthe 2-h time point. Several of the genes in the path that DREMdetermined to be controlled by Ino4 were known lipidmetabolism genes (GO P-value o6�10�5). The induction ofIno4-regulated lipid biosynthesis genes may be connected tothe immediate need of membrane used for the autophagocy-tosis process. This process is utilized by yeast in order toregulate the equilibrium between proteins and the diminishingset of AAs due to the starvation condition (Petiot et al, 2002).
Validating interactions and mechanisticpredictions
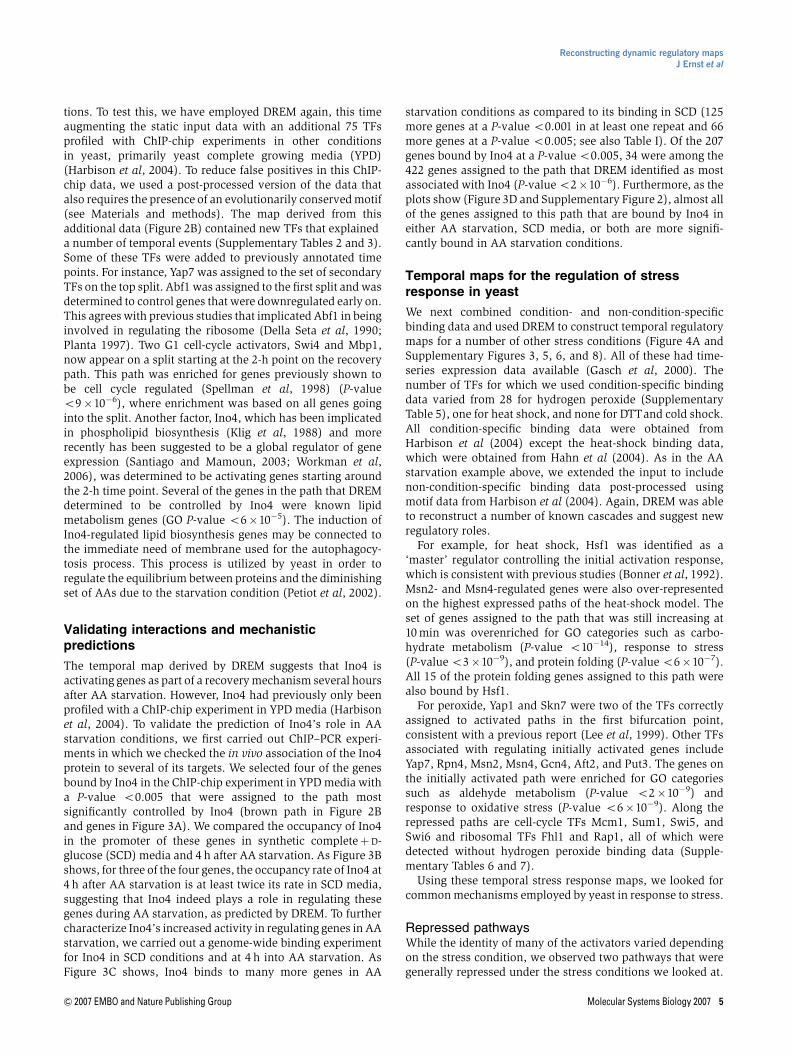
The temporal map derived by DREM suggests that Ino4 isactivating genes as part of a recovery mechanism several hoursafter AA starvation. However, Ino4 had previously only beenprofiled with a ChIP-chip experiment in YPD media (Harbisonet al, 2004). To validate the prediction of Ino4’s role in AAstarvation conditions, we first carried out ChIP–PCR experi-ments in which we checked the in vivo association of the Ino4protein to several of its targets. We selected four of the genesbound by Ino4 in the ChIP-chip experiment in YPD media witha P-value o0.005 that were assigned to the path mostsignificantly controlled by Ino4 (brown path in Figure 2Band genes in Figure 3A). We compared the occupancy of Ino4in the promoter of these genes in synthetic completeþD-glucose (SCD) media and 4 h after AA starvation. As Figure 3Bshows, for three of the four genes, the occupancy rate of Ino4 at4 h after AA starvation is at least twice its rate in SCD media,suggesting that Ino4 indeed plays a role in regulating thesegenes during AA starvation, as predicted by DREM. To furthercharacterize Ino4’s increased activity in regulating genes in AAstarvation, we carried out a genome-wide binding experimentfor Ino4 in SCD conditions and at 4 h into AA starvation. AsFigure 3C shows, Ino4 binds to many more genes in AA
starvation conditions as compared to its binding in SCD (125more genes at a P-value o0.001 in at least one repeat and 66more genes at a P-value o0.005; see also Table I). Of the 207genes bound by Ino4 at a P-value o0.005, 34 were among the422 genes assigned to the path that DREM identified as mostassociated with Ino4 (P-value o2�10�6). Furthermore, as theplots show (Figure 3D and Supplementary Figure 2), almost allof the genes assigned to this path that are bound by Ino4 ineither AA starvation, SCD media, or both are more signifi-cantly bound in AA starvation conditions.
Temporal maps for the regulation of stressresponse in yeast
We next combined condition- and non-condition-specificbinding data and used DREM to construct temporal regulatorymaps for a number of other stress conditions (Figure 4A andSupplementary Figures 3, 5, 6, and 8). All of these had time-series expression data available (Gasch et al, 2000). Thenumber of TFs for which we used condition-specific bindingdata varied from 28 for hydrogen peroxide (SupplementaryTable 5), one for heat shock, and none for DTTand cold shock.All condition-specific binding data were obtained fromHarbison et al (2004) except the heat-shock binding data,which were obtained from Hahn et al (2004). As in the AAstarvation example above, we extended the input to includenon-condition-specific binding data post-processed usingmotif data from Harbison et al (2004). Again, DREM was ableto reconstruct a number of known cascades and suggest newregulatory roles.
For example, for heat shock, Hsf1 was identified as a‘master’ regulator controlling the initial activation response,which is consistent with previous studies (Bonner et al, 1992).Msn2- and Msn4-regulated genes were also over-representedon the highest expressed paths of the heat-shock model. Theset of genes assigned to the path that was still increasing at10 min was overenriched for GO categories such as carbo-hydrate metabolism (P-value o10�14), response to stress(P-value o3�10�9), and protein folding (P-value o6�10�7).All 15 of the protein folding genes assigned to this path werealso bound by Hsf1.
For peroxide, Yap1 and Skn7 were two of the TFs correctlyassigned to activated paths in the first bifurcation point,consistent with a previous report (Lee et al, 1999). Other TFsassociated with regulating initially activated genes includeYap7, Rpn4, Msn2, Msn4, Gcn4, Aft2, and Put3. The genes onthe initially activated path were enriched for GO categoriessuch as aldehyde metabolism (P-value o2�10�9) andresponse to oxidative stress (P-value o6�10�9). Along therepressed paths are cell-cycle TFs Mcm1, Sum1, Swi5, andSwi6 and ribosomal TFs Fhl1 and Rap1, all of which weredetected without hydrogen peroxide binding data (Supple-mentary Tables 6 and 7).
Using these temporal stress response maps, we looked forcommon mechanisms employed by yeast in response to stress.
Repressed pathwaysWhile the identity of many of the activators varied dependingon the stress condition, we observed two pathways that weregenerally repressed under the stress conditions we looked at.
Reconstructing dynamic regulatory mapsJ Ernst et al
& 2007 EMBO and Nature Publishing Group Molecular Systems Biology 2007 5

The first pathway showed a similar pattern of repression andrecovery in all of the reconstructed temporal regulatory mapsexcept for the map for cold shock. This pathway included theribosomal genes and their primary TFs (Rap1, Sfp1, and Fhl1).These genes are repressed steeply and quickly. However, thesegenes also recovered quickly approaching their pre-treatmentlevels. In cold shock, the ribosomal genes were assigned to anactivated path consistent with a previously made observation(Gasch et al, 2000; Supplementary Figures 6 and 7).
Another common repressed pathway that was observed inAA starvation, heat shock, and cold shock was a pathwaycontrolled by Swi4, Swi6, and Mbp1. This pathway primarilycontained cell-cycle genes. For example, in the heat-shockpathway, there was a particularly strong enrichment for G1cell-cycle genes (Spellman et al, 1998) (P-value o4�10�20).In comparison to the ribosomal genes, cell-cycle genes were
repressed at a slower rate and to a less significant level(Supplementary Figure 4). However, when they recover, theywere expressed at a higher level than their initial (time point 0)value (Figure 4B). A possible explanation to the slowrepression of the cell-cycle genes, which is followed by astrong activation, is that what we are actually seeing is thewell-documented stress-related cell-cycle arrest. In an unsyn-chronized culture, the downregulation of G1 genes should begradual as it takes time until all cells leave the G1 phase. On theother hand, in the recovery stage, the culture is relativelysynchronized and therefore the G1 genes reach higher levelsthan in unsynchronized culture. To test the prediction that thispathway in heat shock indeed represents differences in thecell-cycle phase distribution, we counted the budding index ofcells following heat shock. As Figure 4C shows, 20–40 minafter heat shock, cells enter S-phase arrest (increase in the
Expression pattern of Ino4 genes on response path
Time
Expressionlevel
Ino4 occupancy in gene promoter region at 0 h and4 h
0
2
4
6
8
10
12
YDR497C YNL169C YGR196C YHR123W
Gene
Inte
nsi
ty
SCD
AA starvation
AA versus SCD binding for Ino4-bound genes onresponse path (repeat 1)
00 1 2 3 4 5
0.5
1
1.5
2
2.5
3
3.5
4
4.5
5
SCD repeat 1: − log base 10 P -value
AA
rep
eat
1: −
log
bas
e 10
P -v
alu
e
Number of Ino4-bound gene promoters in SCD versusamino-acid starvation conditions
0
50
100
150
200
250
0 h SCD 4 h AA
Experiment condition
Nu
mb
er o
f g
enes
0.001– 0.005 (union)< 0.001 (union)
2
1
0
0 0.5 h 1 h 2 h 4 h 6 h
− 1
− 2
A B
C D
Figure 3 The role of Ino4 in regulating response to AA starvation. (A) Expression profiles of 13 genes in AA starvation that were assigned to the brown path inFigure 2B. These 13 genes were all bound by Ino4 in a ChIP-chip experiment in YPD media with a P-value o0.005 and have an evolutionarily conserved Ino4 motif.It was predicted by DREM that Ino4 was activating these and other genes starting around 2 h (see also Supplementary Table 4). (B) Occupancy rates of Ino4 in thepromoter region of four genes regulated by Ino4, before and at 4 h after AA starvation. For three of these four genes, the Ino4 promoter occupancy rates were at leasttwo-fold higher following AA starvation than in synthetic completeþ D-glucose (SCD) media before AA starvation. (C) Comparison of the number of genes bound byIno4 before and 4 h after AA starvation using a whole-genome binding experiment. We compared the lists using two different P-value cutoffs (0.001 and 0.005). Geneswere counted if they are bound at the appropriate P-value in at least one of the two repeats. At the 0.001 P-value cutoff, there is almost a six-fold enrichment for Ino4-bound genes 4 h after AA starvation. (D) Comparison of binding P-values for genes assigned to the main path determined by DREM to be regulated by Ino4 in one of therepeats (see also Supplementary Figure 2). The plots are the negative log base 10 of the binding P-value for genes that were bound with a P-value o0.005 in one ormore of the Ino4 binding experiments and are on the identified Ino4 response path. The horizontal and vertical lines represent a P-value significance of 0.005. Anythingto the right of the vertical line is significant under normal growth conditions. Anything above the horizontal line is significant in the AA starvation experiment. Anythingabove the diagonal line is more significant in the AA starvation experiment. This plot indicates that these genes were bound more significantly in AA starvation conditionsthan SCD conditions.
Reconstructing dynamic regulatory mapsJ Ernst et al
6 Molecular Systems Biology 2007 & 2007 EMBO and Nature Publishing Group
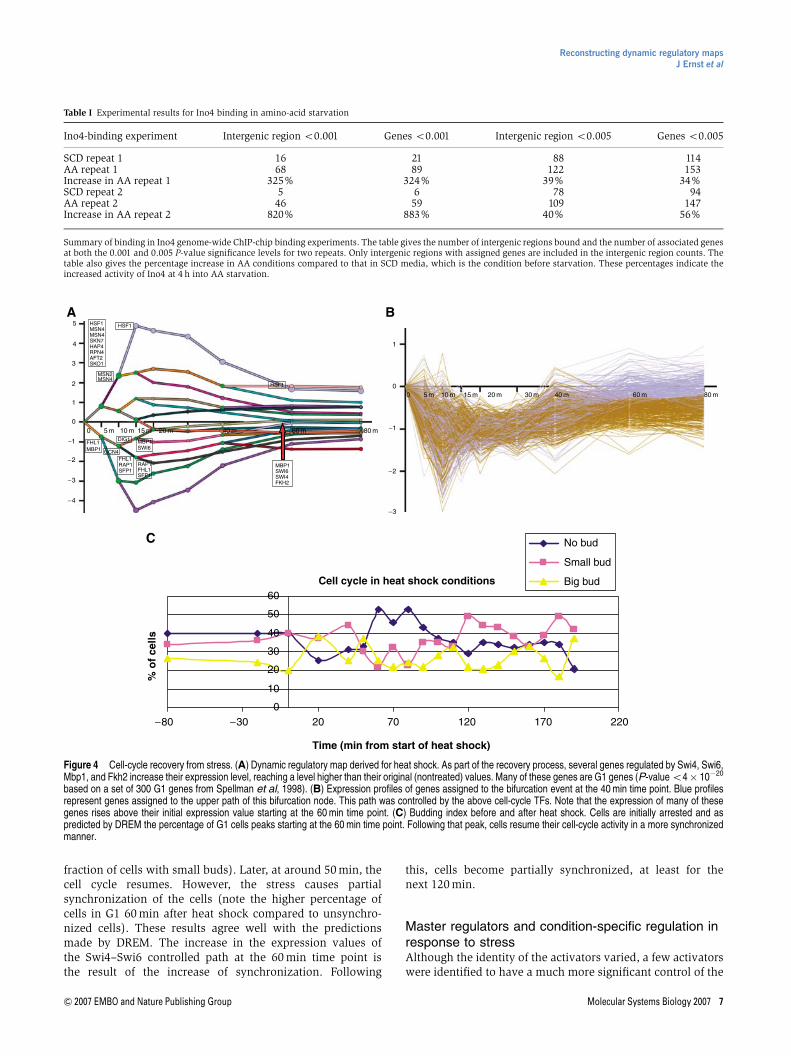
fraction of cells with small buds). Later, at around 50 min, thecell cycle resumes. However, the stress causes partialsynchronization of the cells (note the higher percentage ofcells in G1 60 min after heat shock compared to unsynchro-nized cells). These results agree well with the predictionsmade by DREM. The increase in the expression values ofthe Swi4–Swi6 controlled path at the 60 min time point isthe result of the increase of synchronization. Following
this, cells become partially synchronized, at least for thenext 120 min.
Master regulators and condition-specific regulation inresponse to stressAlthough the identity of the activators varied, a few activatorswere identified to have a much more significant control of the
Table I Experimental results for Ino4 binding in amino-acid starvation
Ino4-binding experiment Intergenic region o0.001 Genes o0.001 Intergenic region o0.005 Genes o0.005
SCD repeat 1 16 21 88 114AA repeat 1 68 89 122 153Increase in AA repeat 1 325% 324% 39% 34%SCD repeat 2 5 6 78 94AA repeat 2 46 59 109 147Increase in AA repeat 2 820% 883% 40% 56%
Summary of binding in Ino4 genome-wide ChIP-chip binding experiments. The table gives the number of intergenic regions bound and the number of associated genesat both the 0.001 and 0.005 P-value significance levels for two repeats. Only intergenic regions with assigned genes are included in the intergenic region counts. Thetable also gives the percentage increase in AA conditions compared to that in SCD media, which is the condition before starvation. These percentages indicate theincreased activity of Ino4 at 4 h into AA starvation.
Cell cycle in heat shock conditions
0
10
20
30
40
50
60
Time (min from start of heat shock)
% o
f ce
lls
No bud
Small bud
Big bud
5
4 1
0
3
2
1
−1
−1
− 2
− 3
− 2
− 3
− 4
00 5 m 10 m 15 m 20 m 40 m
5 m 10 m 15 m 20 m 30 m 40 m 60 m 80 m0
60 m 80 m
− 80 − 30 20 70 120 170 220
A B
C
Figure 4 Cell-cycle recovery from stress. (A) Dynamic regulatory map derived for heat shock. As part of the recovery process, several genes regulated by Swi4, Swi6,Mbp1, and Fkh2 increase their expression level, reaching a level higher than their original (nontreated) values. Many of these genes are G1 genes (P-value o4� 10�20
based on a set of 300 G1 genes from Spellman et al, 1998). (B) Expression profiles of genes assigned to the bifurcation event at the 40 min time point. Blue profilesrepresent genes assigned to the upper path of this bifurcation node. This path was controlled by the above cell-cycle TFs. Note that the expression of many of thesegenes rises above their initial expression value starting at the 60 min time point. (C) Budding index before and after heat shock. Cells are initially arrested and aspredicted by DREM the percentage of G1 cells peaks starting at the 60 min time point. Following that peak, cells resume their cell-cycle activity in a more synchronizedmanner.
Reconstructing dynamic regulatory mapsJ Ernst et al
& 2007 EMBO and Nature Publishing Group Molecular Systems Biology 2007 7

initial change in expression levels in response to AA starvation(Gcn4, Cbf1, Rap1, Fhl1, and Sfp1) and heat shock (Hsf1,Msn2/4, and Skn7). This can be seen most clearly in the AAmap where the majority of the activators in these conditionswere activating genes in later time points. This type ofresponse can result from cells that constitutively express asmall number of master regulators so that they can reactquickly to stress whereas the later TFs are only expressed aspart of the response process. This is consistent with previousstudies. For example, Msn2 and Msn4 are regulated at the levelof nuclear exclusion (Gorner et al, 1998), Cbf1 also alreadyexists in the cell before starvation and its transcript level is notaffected by methionine starvation (Mellor et al, 1990), and
Gcn4 and Hsf1 are found in association to a subset of theirtarget gene promoters even before stress (Hahn et al, 2004;Harbison et al, 2004). These differences are also apparent inthe initial expression levels of the regulators. As Figure 5Cshows, during the first two time points, where their impact onthe genes they regulate is the highest, master regulators do notdrastically change their own expression when compared withpretreatment levels. In contrast, the expression levels of mostsecondary TFs increase, indicating that many are transcrip-tionally regulated.
To further study this point, we looked at the condition-specific regulation activities of TFs in AA starvation and heatshock by dividing the TFs into two groups: the first contained
Average expression level of primary andsecondary activators
–0.4
–0.2
0
0.2
0.4
0.6
0.8
21
Sampled time point
Mea
n e
xpre
ssio
n le
vel
Primary activatorsSecondary activators
Percentage overlap usinga 0.005 binding P-value cutoff
0
10
20
30
40
50
60
70
80
0–20 20–50 50–80 80–100Percentage overlap
0–20 20–50 50–80 80–100Percentage overlap
Per
cen
tag
e o
f fa
cto
rs
0
10
20
30
40
50
60
70
80
Per
cen
tag
e o
f fa
cto
rsOverlap secondary
Overlap primary
GCN4 binding (15min versus 60min)
0
1
2
3
4
5
6
7
0 1 2 3 4 5 6 7GCN4 at 60 min: –log base 10 binding P -value
GC
N41
5 m
in:
–lo
g b
ase
10 b
ind
ing
P-v
alu
e
Percentage overlap of top100 bound genes
y
Overlap secondary
Overlap primary
A B
C D
Figure 5 Distribution of binding overlap between YPD media and stress condition for different sets of TFs. We group TF into two sets. The first subset contains the TFsassigned to first split points in AA starvation or heat that were profiled with a ChIP-chip experiment in the condition (8, primary TFs Cbf1, Gcn4, Fhl1, Rap1, and Sfp1 fromAA starvation in Harbison et al (2004) and for heat Msn2 and Skn7 from Harbison et al (2004) and Hsf1 from Hahn et al (2004)) and the secondary TFs assigned tosecond split point profiled with a ChIP-chip experiment in the condition (8, secondary TFs Arg81, Dal82, Gln3, Hap5, Met32, Met4, Rtg3, and Stp1 from AA starvation inHarbison et al, 2004). (A) Percent overlap for each of these two sets when binding (under both stress and YPD media conditions) is determined using a 0.005 P-valuecutoff. Note the difference between the distribution of overlap for primary and other TFs. Whereas the majority of TFs display a big difference in the set bound genesunder stress and YPD media, many primary TFs bind to a large percentage of stress-regulated genes in YPD media as well. This difference is even bigger in (B) wherewe plot the overlap for the top 100 genes (ordered by their binding P-values) in each condition. Whereas most TFs (and most secondary TFs) drastically alter the subsetof genes they regulate under stress, half of the primary factors bind to more than 50% of the same genes in both conditions. Although the binding strength may bedifferent under stress, these results indicate that many of the primary pathways are maintained, in low levels, under YPD media as well. (C) Average expression levels forprimary and secondary factors for the first two time points in the AA starvation and heat-shock experiments. Whereas the average expression levels for the secondaryfactors are much higher when compared to their untreated levels, the levels for the primary factors do not change significantly between the two conditions.(D) Comparison of binding P-values for Gcn4 in the MMS condition at 15 and 60 min. Points above the diagonal correspond to genes that were bound more significantlyat 15 min than at 60 min. As can be seen from the plot, a substantial majority of genes were bound more significantly at 15 min than at 60 min. Points to the right of thevertical had a P-value o0.005 in MMS at 60 min, whereas points above the horizontal line had a P-value o0.005 in MMS at 15 min.
Reconstructing dynamic regulatory mapsJ Ernst et al
8 Molecular Systems Biology 2007 & 2007 EMBO and Nature Publishing Group

TFs that were determined to control the initial response andthe second contained the rest of the TFs. We compared thebinding targets of these TFs under YPD media and in thecondition that they regulate. As part of the response to stress,several yeast TFs begin to regulate genes that were notregulated by them in YPD media (Bar-Joseph et al, 2003b;Luscombe et al, 2004). As can be seen in Figure 5A, regulatorscontrolling the first bifurcation point (master regulators)showed a much larger overlap in the set of genes bound instress and YPD media compared to the TFs regulating genes atlater time points (secondary regulators). Whereas six of theeight TFs assigned to a first point had more than 20% overlapbetween condition-specific and YPD media binding data, andfour had more than 50% overlap, six of the eight TFs firstappearing at a second split had less than a 20% overlap andnone had more than 50% overlap (Supplementary Tables 9and 10). These results hold even if we ignore the actualP-values and focus on the list of 100 top bound genes in eachcondition (Figure 5B). Again, these differences indicate that,at least for some types of stress, cells maintain the ability toquickly activate the initial response pathways.
In addition to differences in the condition-specific activitybetween master and secondary regulators, we have alsoobserved differences in the utilization of different networkmotifs. As Supplementary Figures 9 and 10 show, genes boundby master regulators in a feed forward loop (FFL) displayedconsistently higher expression levels when compared to genesregulated by the same TFs in a multiple input (MI) or singleinput (SI) motifs. In contrast, for many secondary TFs, we havenot observed a large difference between the expression levelsof FFL-controlled genes and genes controlled by the other twonetwork motifs. The ability of master regulators to utilize FFLsby consistently expressing some of the genes at a higher levelduring a response may help cells fine-tune their response tovarious stresses. Indeed, whereas 45% of the genes bound byGcn4 in an FFL are known AA biosynthesis genes (based onGO), only 21 and 13% of the genes bound in an MI or an SI,respectively, are assigned to this category. Thus, althoughmany genes are activated initially, only a few of them willremain expressed at a high level in a later point as theirexpression requires the additional binding of a secondaryfactor. In this way, an FFL serves as a filtering motif, removingsignals that were erroneously activated and maintaining thosethat are required for the actual response pathway (Mangan andAlon, 2003).
Determining the activation time of regulators
As the results above indicate, most TFs that are activatedduring stress either change or expand the set of genes theyregulate. To identify these new sets, ChIP-chip experiments areoften used to determine the roles of several TFs in variousresponse pathways (Bar-Joseph et al, 2003b; Harbison et al,2004; Workman et al, 2006). However, even when TFs areknown, or suspected, to be involved in such pathway, theactual time in which they are activated may vary. Masterregulators are activated early on, whereas secondary regula-tors are activated later. The ability of DREM to determinea time point for carrying out such experiment can help inaccurately recovering the role a factor plays in a response
pathway. To study this, we have looked at the activation ofGcn4 as part of the response to methyl-methanesulfonate(MMS) stress in yeast. In a previous study, it was determined,using an experiment 60 min after the induction of stress, thatGcn4 did not expand the set of genes it regulates whencompared to the set it regulates in YPD media (Workman et al,2006). We used DREM to reconstruct a dynamic map for thissystem (Supplementary Figure 8). The DREM map inferred forthis condition made two predictions about Gcn4: (1) that Gcn4was expanding the set of genes it regulates at the 15 min timepoint when compared to YPD media and (2) that Gcn4 bindingwould likely be less intense at 60 min as the expression of themain Gcn4-controlled paths decreased at that time point. Totest whether the temporal predictions of DREM were correct,we carried out genome-wide binding experiments at three timepoints: 0 (YPD media), 15, and 60 min. As predicted by DREM,we found a large expansion in the set of genes regulated byGcn4 at the 15 min time point. Whereas 45 genes were boundby Gcn4 in YPD media (using a 0.005 P-value cutoff), 235genes were bound at the 15 min time point and a smallernumber (212 genes) at the 60 min time point (SupplementaryTable 8). In addition, for the vast majority of Gcn4-boundgenes, the binding P-value was more significant at the 15 mintime point when compared to the 60 min point, indicating thatGcn4 is indeed more active earlier in the response as predictedby DREM (Figure 5D). We note that our results, indicating thatGcn4 is expanding the set it regulates even at the 60 min timepoint, differ from previously reported results (Workman et al,2006). There could be several reasons for this discrepancy, themost likely source is the noise associated with any high-throughput experiment. However, the fact that our 60 minresults agree well with the 15 min results, with the expressiondata, and with the findings of a previous study (Natarajan et al,2001) indicates that Gcn4 is indeed activating genes as partof the MMS-response pathway.
Verifying the advantage of integrating time-seriesexpression and ChIP-chip data
To verify the advantage gained from integrating time-seriesexpression data and ChIP-chip data, we tested whether eitherdata alone could have reproduced results similar to thoseobtained when combining them. First, we generated arandomized version of the AA ChIP-chip data by randomizingthe genes each TF was bound to while holding the number ofgenes bound by each TF fixed. We then applied DREM to thisrandomized ChIP-chip data and the original AA gene expres-sion data. This procedure resulted in maps that had no, or veryfew, TF labels (Supplementary Figure 11). Specifically, wefound that activators that were determined to be ‘master’regulators using the real binding data were not assigned to thefirst split using the randomized values and most of the AAbiosynthesis regulators were not assigned to any of the splits.Second, we applied an HMM model to the time-series datawithout using ChIP-chip while still enforcing the same treestructure requirements on the hidden states. To compare theHMM model with the IOHMM model of Figure 2B, we did usethe ChIP-chip data as a post-processing step to score the TFsat each split. We found that most of the relevant TFs were
Reconstructing dynamic regulatory mapsJ Ernst et al
& 2007 EMBO and Nature Publishing Group Molecular Systems Biology 2007 9

substantially more significant with an IOHMM than with anHMM (Supplementary Figure 12). To further validate that thegrouping of genes were more biologically meaningful whenusing the IOHMM compared to an HMM, we performed GOenrichment comparisons and found more GO categories to beenriched in an IOHMM model (Supplementary Figure 13).Combined, these results demonstrate the importance of theChIP-chip data for determining an accurate regulation model.To demonstrate the importance of the time-series data forinferring regulatory models, as opposed to ChIP-chip dataalone, we present a regulation graph in Figure 2C. This graphuses only the ChIP-chip AA-binding data. Although one canrank TFs based on the number of genes they regulate, it is clearfrom the figure that it would be very hard to infer the dynamicsof the response process from the ChIP-chip data alone.
Discussion
The recent availability of expression and ChIP-chip and motifdata has led to a number of efforts aimed at reconstructingregulatory networks. To date, these efforts primarily focusedon determining a static graph representation of the underlyingnetwork. These efforts have led to many insights regarding theoverall organization of networks (Barabasi and Oltvai, 2004),network motifs (Milo et al, 2002), and the set of interactionsin various biological systems (Pilpel et al, 2001; Ihmels et al,2002; Bar-Joseph et al, 2003b; Segal et al, 2003; Workman et al,2006).
The computational method we presented in this paper,DREM, takes a different approach providing a global dynamicview of the gene regulation. This approach has a number ofadvantages when compared to methods that derive staticgraphs. First, biological systems are dynamic. TFs may binddifferent genes at different time points. Thus, the ability ofDREM to derive dynamic maps that associate TFs with thegenes they regulate and their activation time points may leadto better insights regarding the system being studied. Theseinsights may include the identification of master regulatorsthat control the initial response and secondary regulators thatare responsible for more specific pathways. It may also helpexplain several aspects of the observed response including thecondition-specific activity of factors and the activation ofcertain network motifs. As timing is available in these maps,some of the paths and the factors regulating them may belinked to predictions regarding the timing of specific pheno-types. Second, many TFs are post-transcriptionally regulated.For these TFs, it is hard to determine an activation time whenusing only their expression data. When studying biologicalsystems using ChIP-chip methods, researchers rely onprevious knowledge and other data sources to determinewhich factors to profile under the condition of interest (Bar-Joseph et al, 2003b; Hahn et al, 2004; Harbison et al, 2004;Workman et al, 2006). DREM’s ability to use general motif dataor ChIP-chip data from other experimental conditions forderiving temporal regulatory maps presents a useful comple-mentary approach for determining TFs on which to study witha ChIP-chip experiment. As we have shown for Ino4, thesepredictions may lead to new regulatory roles for some of thefactors. Importantly, for these factors, DREM also indicates
a time point at which these ChIP-chip experiment should becarried out. Determining the right point leads to a moreaccurate set of regulators as we have shown with Gcn4 inMMS. Finally, we note that although we presented DREM inthe context of analyzing a large number of stress-response datasets, it can be applied equally well to study a single conditionof interest.
The accuracy of the models generated by DREM and theirpredictive power is another indicator to the importance of dataintegration. As was noted in the past (Jansen et al, 2003), eachdata source provides only a partial view of the activity in thecell. By integrating diverse data sets, we can improve overthe results obtained by each datum on its own. For example, inthe context of clustering expression data, a key question isthe number of clusters to use. Another problem relates tonoise and the small number of time points measured. DREMaddresses these problems by integrating ChIP-chip or motifdata with the time-series data. This leads to more naturalderivations of clusters based on bifurcation points andimproves the resulting clusters as we showed using GO(Supplementary Figure 13).
Like any other computational method, DREM is highlydependent on the input data. DREM relies on the availabilityof high-quality time-series expression data. Here, thesampling rate may play an important role in the ability ofDREM to derive accurate regulatory maps. For example,although we observed initial activation by a few masterregulators in a number of different conditions, the initialresponse to peroxide was determined to be controlled by nineTFs. This may be the result of the sampling rate. If this rate istoo low, regulatory effects may be aggregated in some of thetime points, preventing DREM from associating TFs with theircorrect activation time. Determining the appropriate samplingrate is an important problem (Simon et al, 2005). In somecases, DREM can be used to identify a problem with thesampling rate that has been used and to suggest places inwhich more samples are needed. However, even in cases inwhich an experiment is well sampled, TF labels can aggregateat earlier time points, as assignments of genes to paths is basedon all time points.
The models derived by DREM are currently limited to treestructures with the option to also model convergence of pathsfrom a common split. Although this is motivated by previousbiological observations (Balazsi et al, 2005), in some cases itmay be more natural to allow other types of path merges andresplits. DREM also does not explicitly model regulationthrough other mechanisms, such as chromosome remodelingand mRNA degradation. Transition probabilities in DREM arecomputed using logistic regression, which does not capture alltypes of combinatorial interactions. Another limitation ofDREM is that the output dynamic map model is sometimeschosen from a number of possible dynamic maps with similarscores. However, when this happens, these different mapsusually share most of the important splits.
Although DREM was applied to learn networks in yeast, thegrowing availability and diversity of ChIP-chip (Cam et al,2004), motif (Xie et al, 2005), and time-series expression datamake it possible to use DREM for many different species suchas human, mouse, and flies, among others. The ability toderive dynamic networks from such data may lead to new
Reconstructing dynamic regulatory mapsJ Ernst et al
10 Molecular Systems Biology 2007 & 2007 EMBO and Nature Publishing Group
insights, predictions, and ultimately better understandting ofmany biological systems.
Materials and methods
Pre-processing input data
We first generated a binary matrix of predictions of TF–gene regulatoryinteractions. For predictions based on condition-specific ChIP-chipdata, a ‘1’ was encoded if the binding P-value of the TF to the gene’spromoter region was o0.005, otherwise a ‘0’ was encoded. For TFswithout condition-specific ChIP-chip data, we followed a version of theregulatory code of Harbison et al (2004). For these TFs, a TF–gene pairhad a ‘1’ encoded in the matrix if the TF bound the promoter of thegene with a P-value o0.005 in at least one ChIP-chip experiment andthere was a motif in its promoter that was evolutionarily conserved inat least two other yeast species. If no ChIP-chip data were availablefor a gene, then a ‘0’ was encoded for all entries. All time-seriesdata were transformed to start at ‘0’ so that the value at each time pointrepresents the log ratio change from an unstressed control. Genes werefiltered if there was more than one missing value or if the gene didnot change sufficiently at any time point (see Resutls section inSupplementary information).
Dynamic regulatory events miner algorithm
Each state of the probabilistic model is associated with a Gaussiandistribution. A tree structure was used among the states and theirtransitions. At time point 0, there is one state, which is the root of tree.Every state except those associated with the last time point has at leastone child, and for the results in this paper we allowed not more thantwo children. Any state having more than one child has a logisticregression classifier with L1 loss penalty (Krishnapuram et al, 2005)associated with it. This classifier maps the set of predicted TFinteractions for a gene to a probability distribution of transitionsto each of the child states. To learn a dynamic regulatory map, theDREM algorithm first performs a search over tree structures. Arandomly selected subset of genes is used to train the Gaussiandistribution parameters and the classifiers in the tree structure underconsideration. The remaining genes are used to score the various treestructures considered. Training is carried out using a version of theBaum–Welch algorithm (Durbin et al, 1998). After the best scoringstructure is found using the test set of genes, weakly supported splitsare pruned to avoid overfitting the test set of genes. After a final modelstructure is selected, all genes are used to train the parameters of thefinal model. See Methods section in Supplementary information forfull details.DREM software: The DREM software is available for download athttp://www.sb.cs.cmu.edu/drem.
Inferring gene assignments and TF scores
Genes are assigned to their most likely path through the model usingthe Viterbi algorithm (Durbin et al, 1998). The assignment of genes topaths through the models is used to determine if certain paths areoverenriched for genes regulated by certain TFs. Overenrichmentscores are used for the association of TFs with paths. These scores areobtained using the hypergeometric distribution, with a lower scoremeaning a stronger association. The base set of genes for thehypergeometric distribution can be just the genes going into theprevious split giving a TF split association score, or all genes onthe microarray giving an overall association score of a TF for a path.
GO P-values
GO P-values were computed in the DREM software based on thehyper-geometric distribution. All P-values reported are uncorrected,but are still significant at the 0.01 level when correcting for multiplehypothesis testing using a randomization procedure (Ernst andBar-Joseph, 2006).
Saccharomyces cerevisiae strain list
For the immunoprecipitation experiments, we used Myc-tagged W303yeast strain obtained as a gift from Rick Young. The genotype of theIno4 strain is MATa:ade2-1:trp1-1:can1-100:leu2-3,112:his3-11,15:ura3:GALþ :psiþ :INO4::9myc:TRP1 and of the Gcn4 strain isMATa:ade2-1:trp1-1:can1-100:leu2-3,112:his3-11,15:ura3:GALþ :psiþ :GCN4::9myc:TRP1.
Growth condition
For the AA starvation experiments, cells were grown in completeminimal medium (SCD) to early-log phase. Cells were collected bycentrifugation and resuspended in an equal volume of minimalmedium lacking AAs and adenine (YNB�AA, 2% glucose, 20 mg/luracil) and allowed to grow. Samples for location analysis were takenbefore resuspension in AA starvation conditions and 4 h afterwards.
For the MMS experiments, cells were grown in YPD media to early-log phase at 301C until the culture reached an OD600 of 0.8–1.0. MMS(Sigma) was added to a final concentration of 0.03%, and the culturewas grown for an additional hour. Samples for genome-wide locationanalysis were taken before adding MMS and 15 and 60 min after addingMMS.
Chromatin immunoprecipitation–PCR
Bound proteins were formaldehyde-crosslinked to DNA in vivo,followed by cell lysis and sonication to shear DNA. Crosslinkedmaterial was immunoprecipitated with an anti-myc antibody, followedby reversal of the crosslinks to separate DNA from protein (Aparicio1999; Orlando, 2000). Enrichment for Ino4-binding site was measuredby semiquantitative PCR using primers designed for the detection ofupstream regions of the genes YDR497C, YNL169C, YGR196C, andYHR123W. Primer sequences are as follows: YDR497C: TAGCGCACCAAACTGAAAGA, AAGCGCATATACTTAGTTCTCTCCA; YNL169C: CGACCAAGAAGGATTTGAGC, CCAGCACCTTTTTGGTGTTT; YGR196C:CGCTTTCCAGAAAAAGGGTA, CGTCGTTTGTTTGTTTGGTG; YHR123W: TGGCAAAATACAGAACACAGG, TATGCTCAGTCCAGCCCTTT.As a negative control, primers for the upstream region of Cts1 wereused (AGTGGTTGGTTGGTGGGAATA; TCTTTGACCAATGCCTATGAA).The quantization of the enrichment was performed by calculating theratio of the IP signal and the input signal for the target gene divided bythe IP ratio and the input ratio of the negative control gene (Cts1),utilizing the software TINA. TINA is software for quantification ofband intensity. After PCR, the fragments were separated on agarosegel (1%) and monitored by a CCD camera. Bands intensitieswere quantified using TINA 2.09d quantification software (Raytest,http://www.raytest.de).
Chip on chip
Genome-wide location analysis was performed as described pre-viously (Ren et al, 2000). Briefly, following purification of the DNA inthe ChIP procedure, immunoprecipitated DNA and DNA from anunenriched sample were amplified and differentially fluorescentlylabeled by ligation-mediated PCR. These samples were hybridized toa microarray consisting of spotted PCR products representing theintergenic regions of the S. cerevisiae genome. The data have beendeposited into ArrayExpress with the accession numbers E-MEXP-905(Gcn4 experiments) and E-MEXP-906 (Ino4 experiments).
Budding index calculation
Cells grown continuously at 301C were collected by centrifugation,resuspended in an equal volume of 371C medium, and returned to 371Cfor growth. Samples were collected at time points as described inFigure 4C. For each time point, cells were mildly sonicated in order toseparate clumps, counted and divided into three groups: ‘No Bud’—asingle cell; ‘Small Bud’—a cell with a small bud attached; and a ‘BigBud’—a cell with a bud that is more than half of the size of the cell it isattached to.
Reconstructing dynamic regulatory mapsJ Ernst et al
& 2007 EMBO and Nature Publishing Group Molecular Systems Biology 2007 11
Supplementary information
Supplementary information is available at Molecular Systems Biologywebsite (www.nature.com/msb).
AcknowledgementsWe thank Zoubin Ghahramani for the useful discussions aboutthis work. JE and ZBJ acknowledge funding through NIH grant NO1AI-5001 and NSF CAREER award 0448453 to ZBJ.
References
Aparicio OM (1999) Characterization of proteins bound to chromatinby immuno-precipitation from whole-cell extracts. Curr ProtocolsMol Biol 4: 21.3.10–21.3.12
Ashburner M, Ball CA, Blake JA, Botstein D, Butler H, Cherry JM,Davis AP, Dolinski K, Dwight SS, Eppig JT, Harris MA, Hill DP,Issel-Tarver L, Kasarskis A, Lewis S, Matese JC, Richardson JE,Ringwald M, Rubin GM, Sherlock G (2000) Gene Ontology: tool forthe unification of biology. Nat Genet 25: 25–29
Baker RE, Masison DC (1990) Isolation of the gene encoding theSaccharomyces cerevisiae centromere-binding protein CP1. Mol CellBiol 10: 2458–2467
Balazsi G, Barabasi A, Oltvai ZN (2005) Topological units ofenvironmental signal processing in the transcriptional regulatorynetwork of Escherichia coli. Proc Natl Acad Sci USA 102: 7841–7846
Barabasi A, Oltvai Z (2004) Network biology: understanding the cell’sfunctional organization. Nat Rev Genet 5: 101–113
Bar-Joseph Z, Gerber G, Gifford D, Jaakkola T, Simon I (2003a)Continuous representations of time series gene expression data.J Comput Biol 10: 241–256
Bar-Joseph Z, Gerber GK, Lee TI, Rinaldi NJ, Yoo JY, Robert F, GordonDB, Fraenkel E, Jaakkola TS, Young RA, Gifford DK (2003b)Computational discovery of gene modules and regulatorynetworks. Nat Biotech 21: 1337–1342
Bengio Y, Frasconi P (1995) An input output HMM architecture. AdvNeural Inform Process 7: 427–434
Bonneau R, Reiss DJ, Shannon P, Facciotti M, Hood L, Baliga NS,Thorsson V (2006) The Inferelator: an algorithm for learningparsimonious regulatory networks from systems biology data setsde novo. Genome Biol 7: R36
Bonner JJ, Heyward S, Fackenthal DL (1992) Temperature-dependentregulation of a heterologous transcriptional activation domainfused to yeast heat shock transcription factor. Mol Cell Biol 12:1021–10230
Cam H, Balciunaite E, Blais A, Spektor A, Scarpulla RC, Young R,Kluger Y, Dynlacht BD (2004) A common set of gene regulatorynetworks links metabolism and growth inhibition. Mol Cell 16:399–411
Chen T, He HL, Church GM (1999) Modeling gene expression withdifferential equations. Pac Symp Biocomput 4: 29–40
Cokus S, Rose S, Haynor D, Grønbech N, Pellegrini M (2006) Modellingthe network of cell cycle transcription factors in the yeastSaccharomyces cerevisiae. BMC Bioinform 7: 381
Crespo JL, Powers T, Fowler B, Hall MN (2002) The TOR-controlledtranscription activators GLN3, RTG1, and RTG3 are regulated inresponse to intracellular levels of glutamine. Proc Natl Acad Sci USA99: 6784–6789
D’haeseleer P, Wen X, Fuhrman S, Somogyi R (1999) Linear modelingof mRNA expression levels during CNS development and injury.Pac Symp Biocomput 4: 41–52
Das D, Nahle Z, Zhang MQ (2006) Adaptively inferring humantranscriptional subnetworks. Mol Syst Biol 2: 29
Della Seta F, Ciafre SA, Marck C, Santoro B, Presutti C, Sentenac A,Bozzoni I (1990) The ABF1 factor is the transcriptional activatorof the L2 ribosomal protein genes in Saccharomyces cerevisiae.Mol Cell Biol 10: 2437–2441
Durbin R, Eddy S, Krogh A, Mitchison G (1998) Biological SequenceAnalysis. Cambridge: Cambridge University Press
Ernst J, Bar-Joseph Z (2006) STEM: a tool for the analysis of short timeseries gene expression data. BMC Bioinformatics 7: 191
Ernst J, Nau G, Bar-Joseph Z (2005) Clustering short time series geneexpression data. Bioinformatics 21 (Suppl 1): S159–S168
Gasch AP, Spellman PT, Kao CM, Carmel-Harel O, Eisen MB, Storz G,Botstein D, Brown PO (2000) Genomic expression programs in theresponse of yeast cells to environmental changes. Mol Biol Cell 11:4241–4257
Gorner W, Durchschlag E, Martinez-Pastor MT, Estruch F, Ammerer G,Hamilton B, Ruis H, Schuller C (1998) Nuclear localization of theC2H2 zinc finger protein Msn2p is regulated by stress and proteinkinase A activity. Genes Dev 12: 586–597
Hahn JS, Hu Z, Thiele D, Iyer VR (2004) Genome-wide analysis ofthe biology of stress responses through heat. Mol Cell Biol 24:5249–5256
Harbison CT, Gordon DB, Lee TI, Rinaldi NJ, Macisaac KD, DanfordTW, Hannett NM, Tagne JB, Reynolds DB, Yoo J, Jennings EG,Zeitlinger J, Pokholok DK, Kellis M, Rolfe PA, Takusagawa KT,Lander ES, Gifford DK, Fraenkel E, Young RA (2004) Transcrip-tional regulatory code of a eukaryotic genome. Nature 431: 99–104
Hinnebusch AG, Fink GR (1983) Positive regulation in the generalamino acid control of Saccharomyces cerevisiae. Proc Natl Acad SciUSA 80: 5374–5378
Holter NS, Maritan A, Ciepak M, Fedoroff NV, Banavar J (2001)Dynamic modeling of gene expression data. Proc Natl Acad Sci USA98: 1693–1698
Ihmels J, Friedlander G, Bergmann S, Sarig O, Ziv Y, Barkai N (2002)Revealing modular organization in the yeast transcriptionalnetwork. Nat Genet 31: 370–377
Jansen R, Yu H, Greenbaum D, Kluger Y, Krogan NJ, Chung S, Emili A,Snyder M, Greenblatt JF, Gerstein M (2003) A Bayesian networksapproach for predicting protein–protein interactions from genomicdata. Science 302: 449–453
Kim SY, Imoto S, Miyano S (2003) Inferring gene networks from timeseries microarray data using dynamic Bayesian networks. BriefBioinform 4: 228–235
Klig LS, Hoshizaki DK, Henry SA (1988) Isolation of the yeast INO4gene, a positive regulator of phospholipid biosynthesis. Curr Genet13: 7–14
Krishnapuram B, Figueiredo M, Carin L, Hartemink A (2005) Sparsemultinomial logistic regression: fast algorithms and generalizationbounds. IEEE Trans Pattern Anal Mach Intell 27: 957–968
Kundaje A, Middendorf M, Gao F, Wiggins C, Leslie C (2005)Combining sequence and time series expression data to learntranscriptional modules. IEEE/ACM Trans Comput Biol Bioinform 2:194–202
Lee J, Godon C, Lagniel G, Spector D, Garin J, Labarre J, Toledano MB(1999) Yap1 and Skn7 control two specialized oxidative stressresponse regulons in yeast. J Biol Chem 274: 16040–16046
Lin L, Lee H, Li W, Chen B (2005) Dynamic modeling of cis-regulatorycircuits and gene expression prediction via cross-gene identi-fication. BMC Bioinform 6: 258
Luscombe NM, Babu MM, Yu H, Snyder M, Teichmann SA, Gerstein M(2004) Genomic (2004) analysis of regulatory network dynamicsreveals large topological changes. Nature 431: 308–312
Mangan S, Alon U (2003) Structure and function of the feed-forwardloop network motif. Proc Natl Acad Sci USA 100: 11980–11985
Mellor J, Jiang W, Funk M, Rathjen J, Barnes CA, Hinz T, HegemannJH, Philippsen P (1990) CPF1, a yeast protein which functions incentromeres and promoters. EMBO J 9: 4017–4026
Milo R, Shen-Orr S, Itzkovitz S, Kashtan N, Chklovskii D, Alon U(2002) Network motifs: simple building blocks of complexnetworks. Science 298: 824–827
Natarajan K, Meyer MR, Jackson BM, Slade D, Roberts C, HinnebuschAG, Marton MJ (2001) Transcriptional profiling shows that Gcn4p isa master regulator of gene expression during amino acid starvationin yeast. Mol Cell Biol 21: 4347–4368
Reconstructing dynamic regulatory mapsJ Ernst et al
12 Molecular Systems Biology 2007 & 2007 EMBO and Nature Publishing Group
O’Connell KF, Surdin-Kerjan Y, Baker RE (1995) Role of the Saccharo-myces cerevisiae general regulatory factor CP1 in methioninebiosynthetic gene transcription. Mol Cell Biol 15: 1879–1888
Orlando V (2000) Mapping chromosomal proteins in vivo by formal-dehyde-crosslinked-chromatin immunoprecipitation. Trends BiochemSci 25: 99–104
Petiot A, Pattingre S, Arico S, Meley D, Codogno P (2002) Diversityof signaling controls of macroautophagy in mammalian cells.Cell Struct Funct 27: 431–441
Pilpel Y, Sudarsanam P, Church G (2001) Identifying regulatorynetworks by combinatorial analysis of promoter elements. NatGenet 29: 153–159
Planta RJ (1997) Regulation of ribosome synthesis in yeast. Yeast 13:1505–1518
Ramoni MF, Sebastiani P, Kohane IS (2002) Cluster analysis of geneexpression dynamics. Proc Natl Acad Sci USA 99: 9121–9126
Ren B, Robert F, Wyrick JJ, Aparicio O, Jennings EG, Simon I, ZeitlingerJ, Schreiber J, Hannett N, Kanin E, Volkert TL, Wilson CJ, Bell SP,Young RA (2000) Genome-wide location and function of DNAbinding proteins. Science 290: 2306–2309
Rudra D, Zhao Y, Warner JR (2005) Central role of Ifh1p–Fhl1pinteraction in the synthesis of yeast ribosomal proteins. EMBO J 24:533–542
Santiago TC, Mamoun CB (2003) Genome expression analysis in yeastreveals novel transcriptional regulation by inositol and choline andnew regulatory functions for Opi1p, Ino2p, and Ino4p. J Biol Chem278: 38723–38730
Schliep A, Schonhuth A, Steinhoff C (2003) Using hidden Markovmodels to analyze gene expression time course data. Bioinformatics19 (Suppl 1): S255–S263
Segal E, Yelensky R, Koller D (2003) Genome-wide discovery oftranscriptional modules from DNA sequence and gene expression.Bioninformatics 19 (Suppl 1): S273–S282
Simon I, Siegfried Z, Ernst J, Bar-Joseph Z (2005) Combined static anddynamic analysis for determining the quality of time-seriesexpression profiles. Nat Biotech 23: 1503–1508
Spellman PT, Sherlock G, Zhang MQ, Iyer VR, Anders K, Eisen MB,Brown PO, Botstein D, Futcher B (1998) Comprehensiveidentification of cell cycle-regulated genes of the yeast Saccharo-myces cerevisiae by microarray hybridization. Mol Biol Cell 9:3273–3297
Thomas D, Jacquemin I, Surdin-Kerjan Y (1992) MET4, a leucinezipper protein, and centromere-binding factor 1 are both requiredfor transcriptional activation of sulfur metabolism inSaccharomyces cerevisiae. Mol Cell Biol 12: 1719–1727
Wade JT, Hall DB, Struhl K (2004) The transcription factor Ifh1 is a keyregulator of yeast ribosomal protein genes. Nature 432: 1054–1058
Workman CT, Mak HC, McCuine S, Tagne JB, Agarwal M, Ozier O,Begley TJ, Samson LD, Ideker T (2006) A systems approach tomapping DNA damage response pathways. Science 312: 1054–1059
Xie X, Lu J, Kulbokas EJ, Golub TR, Mootha V, Lindblad-Toh K, LanderES, Kellis M (2005) Systematic discovery of regulatory motifs inhuman promoters and 30 UTRs by comparison of several mammals.Nature 434: 338–345
Reconstructing dynamic regulatory mapsJ Ernst et al
& 2007 EMBO and Nature Publishing Group Molecular Systems Biology 2007 13