Lesson 1наIntroduction to Climate and Climate Change
37
3/3/2017 Lesson 1 Introduction to Climate and Climate Change https://www.eeducation.psu.edu/meteo469/print/book/export/html/112 1/37 Published on METEO 469: From Meteorology to Mitigation: Understanding Global Warming D7 (https://www.e education.psu.edu/meteo469 ) Home > METEO 469 Course Outline > Lesson 1 Introduction to Climate and Climate Change Lesson 1 Introduction to Climate and Climate Change The links below provide an outline of the material for this lesson. Be sure to carefully read through the entire lesson before returning to Canvas to submit your assignments. Introduction Credit: Today in Montclair, 94611 [1] Did you complete the Course Orientation? Before you begin this course, please complete the Course Orientation. About Lesson 1
-
Upload
khangminh22 -
Category
Documents
-
view
0 -
download
0
Transcript of Lesson 1наIntroduction to Climate and Climate Change

3/3/2017 Lesson 1 Introduction to Climate and Climate Change
https://www.eeducation.psu.edu/meteo469/print/book/export/html/112 1/37
Published on METEO 469: From Meteorology to Mitigation: Understanding Global Warming D7 (https://www.eeducation.psu.edu/meteo469)
Home > METEO 469 Course Outline > Lesson 1 Introduction to Climate and Climate Change
Lesson 1 Introduction to Climate and Climate ChangeThe links below provide an outline of the material for this lesson. Be sure to carefully read through the entire lesson before returningto Canvas to submit your assignments.
Introduction
Credit: Today in Montclair, 94611 [1]
Did you complete the Course Orientation?
Before you begin this course, please complete the Course Orientation.
About Lesson 1

3/3/2017 Lesson 1 Introduction to Climate and Climate Change
https://www.eeducation.psu.edu/meteo469/print/book/export/html/112 2/37
Humancaused climate change represents one of the great environmental challenges of our time. To appreciate its societal,environmental, and economic implications, one must appreciate the basic underlying science. This course seeks to first lay down thefundamental scientific principles behind climate change and global warming. These principles involve aspects of atmospheric scienceand meteorology, as well as aspects of other areas of the physical and biological sciences. With a firm grounding in the basic science,we go on to explore other issues involving climate change impacts and the issue of mitigation — that is, solutions to dealing with thechallenges presented by climate change.
In the process, we will learn how to do basic computations and to use theoretical models of the climate system of varying complexityto address questions regarding future climate change. Students will explore the impacts of various alternative greenhouse gasemissions scenarios and investigate policies that would allow for appropriate stabilization of future greenhouse gas concentrations.The structure of the course roughly parallels the treatment of the subject matter by the reports of the Intergovernmental Panel onClimate Change (IPCC), focusing first on the basic science, then the future projections and their potential impacts, and finally issuesinvolving adaptation, vulnerability, and mitigation. We will use a variety of tools to inform our understanding of these topics, includingdigital video, audio, simulation models, and virtual field trips to online data resources.
In this first lesson, we are going to define climate and climate change, as well as the closely related matter of global warming. We willintroduce the components of the climate system (the atmosphere, ocean, cryosphere, and biosphere). We will also briefly introducesome of the other key scientific concepts: atmospheric structure and composition, energy balance, atmospheric and oceaniccirculation. We will draw a distinction between natural and human impacts on climate, and we will review the science behindgreenhouse gases and the greenhouse effect. We will explore the crucial topic of feedback mechanisms, including importantemerging knowledge regarding carbon cycle feedbacks. Finally, we will begin to explore a number of important overriding themessuch as the role of scientific uncertainty in decision making.
What will we learn in Lesson 1?
By the end of Lesson 1, you should be able to:
define the Earth's climate system and its components;distinguish the factors governing natural climate variability from humancaused climate change;explain the greenhouse effect;describe the role of feedback mechanisms; anddiscuss the role of uncertainty in decisionmaking.
What will be due for Lesson 1?

3/3/2017 Lesson 1 Introduction to Climate and Climate Change
https://www.eeducation.psu.edu/meteo469/print/book/export/html/112 3/37
Please refer to the Syllabus for the specific time frames and due dates.
The following is an overview of the required activities for Lesson 1. Detailed directions and submission instructions are located withinthis lesson.
Read:IPCC Fifth Assessment Report, Working Group 1 [2]Summary for Policy Makers [3]
A Introduction: p. 4B.5 Observed Changes in the Climate System, Carbon and Other Biogeochemical Cycles: p. 1112C Drivers of Climate Change: p. 1314
Dire Predictions, v.2: p. 8, 13, 2225Participate in the LESSON 1: GENERAL DISCUSSION OF METEO 469 discussion forum.
What is Climate?When it comes to defining climate, it is often said that "climate is what you expect; weather is what you get". That is to say, climate isthe statisticallyaveraged behavior of the weather. In reality, it is a bit more complicated than that, as climate involves not just the

3/3/2017 Lesson 1 Introduction to Climate and Climate Change
https://www.eeducation.psu.edu/meteo469/print/book/export/html/112 4/37
atmosphere, but the behavior of the entire climate system—the complex system defined by the coupling of the atmosphere, oceans,ice sheets, and biosphere.
Having defined climate, we can begin to define what climate change means. While the notion of climate is based on some sort ofstatistical average of behavior of the atmosphere, oceans, etc., this average behavior can change over time. That is to say, what you"expect" of the weather is not always the same. For example, during El Niño years, we expect it to be wetter in the winter in Californiaand snowier in the southeastern U.S., and we expect fewer tropical storms to form in the Atlantic during the hurricane season. So,climate itself varies over time.
If climate is always changing, then is climate change by definition always occurring? Yes and No. A hundred million years ago, duringthe early part of the Cretaceous period, dinosaurs roamed a world that was almost certainly warmer than today. The geologicalevidence suggests, for example, that there was no ice even at the North and South poles. So global warming can happen naturally,right? Certainly, but why was the Earth warmer at that time?
A hint of why can be found in many of the careful renditions of what the Earth may have looked like during the age of dinosaurs.Some of the most insightful interpretations came from the 19th century Yale paleontologist, Othniel Charles Marsh. Let us look at oneof his renderings:

3/3/2017 Lesson 1 Introduction to Climate and Climate Change
https://www.eeducation.psu.edu/meteo469/print/book/export/html/112 5/37
One section of the Age of Reptiles mural in the Peabody Museum

3/3/2017 Lesson 1 Introduction to Climate and Climate Change
https://www.eeducation.psu.edu/meteo469/print/book/export/html/112 6/37
Credit: Yale Alumni Magazine [4]
Think About It!
What features of the above mural might provide a clue for why the early Cretaceous was so warm?
Click for answer.
So, the major climate changes in Earth's geologic past were closely tied to changes in the greenhouse effect. Those changes werenatural. The changes in greenhouse gas concentrations that we talk about today, are, however, not natural. They are due to humanactivity.
Importance: Why Should We Care About Climate Change?
Figure 1.1: Polar bears walking on melting ice.Credit: The Select Committee on Energy Independence and Global Warming [5]
As we have discussed, climate change can be natural. If climate changes naturally, then why should we be concerned about theclimate change taking place today? After all, the early Cretaceous period discussed previously was warmer than today, but life thrivedeven in regions, such as the interior of Antarctica, that are uninhabitable today.
One misconception is that the threat of climate change has to do with the absolute warmth of the Earth. That is not, in fact, the case.It is, instead, the rate of change that has scientists concerned. Living things, including humans, can easily adapt to substantialchanges in climate as long as the changes take place slowly, over many thousands of years or longer. However, adapting to changesthat are taking place on timescales of decades is far more challenging.

3/3/2017 Lesson 1 Introduction to Climate and Climate Change
https://www.eeducation.psu.edu/meteo469/print/book/export/html/112 7/37
Here is a useful "thought experiment" to illustrate what sort of discussion might be happening now if, instead of the current climate, wewere living under the climate conditions of the last Ice Age, and human fossil fuel emissions were pushing us out of the ice age andinto conditions resembling the preindustrial period, rather than the actual case, where we are pushing the Earth out of the preindustrial period and into a period with conditions more like the Cretaceous. Take a look at Figure 1.2 below, which indicates the Gulfcoast continental outline near the height of the last Ice Age 18,000 years ago, vs. the current continental outline.
[6]Figure 1.2: Sea Level: Today vs. the Pleistocene Epoch Enlarge [6]Credit: EPA [7]
Everything in the the lighter shading would be flooded in the transition from the ice age to preindustrial modern climate. But what sortof effort would that have taken?
It turns out that the natural increase in atmospheric CO2 that led to the thaw after the last Ice Age was an increase from 180 parts permillion (ppm) to about 280 ppm. This was a smaller increase than the presenttime increase due to human activities, such as fossilfuel burning, which thus far have raised CO2 levels from the preindustrial value of 280 ppm to a current level of about 400 pma levelwhich is increasing by 2 ppm every year. So, arguably, if the dawn of industrialization had occurred 18,000 years ago, we may verylikely have sent the climate from an ice age into the modern preindustrial state.
How long it would have taken to melt all of the ice is not precisely known, but it is conceivable it could have happened over a periodas short as two centuries. The area ultimately flooded would be considerably larger than that currently projected to flood due to thehumancaused elevation of CO2 that has taken place so far. The hypothetical city of "Old Orleans" would have to be relocated from itsposition in the Gulf of Mexico 100+ miles off the coast of New Orleans, to the current location of "New Orleans".
By some measures, human interference with the climate back then, had it been possible, would have been even more disruptive thanthe current interference with our climate. Yet that interference would simply be raising global mean temperatures from those of the lastIce Age to those that prevailed in modern times prior to industrialization. What this thought experiment tells us is that the issue is notwhether some particular climate is objectively "optimal". The issue is that human civilization, natural ecosystems, and our environmentare heavily adapted to a particular climate — in our case, the current climate. Rapid departures from that climate would likely exceedthe adaptive capacity that we and other living things possess, and cause significant consequent disruption in our world.

3/3/2017 Lesson 1 Introduction to Climate and Climate Change
https://www.eeducation.psu.edu/meteo469/print/book/export/html/112 8/37
Here is an example that relates how polar bears in the north will have to adapt to the changing climate conditions that are presentingthemselves in northern Manitoba, from a panel discussion shot in November, 2010 including the designer of this course and thepopular star George Stroumboulopoulos of CBC Television in Canada (Michael Mann's comments begin around 4:48 in the linkedvideo [8]):
Figure 1.3: CBC's Stroumboulopoulos Polar Bear Special (course author on the right).
So, hopefully, we have established that climate change is something worth caring about. Perhaps it is something worth doingsomething about. But you cannot really do anything about a problem that you do not understand, let alone know how to solve.
So, in the remainder of this lesson, we are going to try to begin to get a handle on the fundamental science underlying climate changeand global warming.
Overview of the Climate System Part 1The components of the climate system
The climate system reflects an interaction between a number of critical subsystems or components. In this course, we will focus onthe components most relative to modern climate change: the atmosphere, hydrosphere, cryosphere, and biosphere. Please click onthe arrow in the screencast below to walk through the important aspects of these components.

3/3/2017 Lesson 1 Introduction to Climate and Climate Change
https://www.eeducation.psu.edu/meteo469/print/book/export/html/112 9/37
Credit: Schematic of Climate System, IPCC 2007 [9]
Atmospheric Structure and Composition
The atmosphere is of course a critical component of the climate system, and the one we will spend the most time talking about.
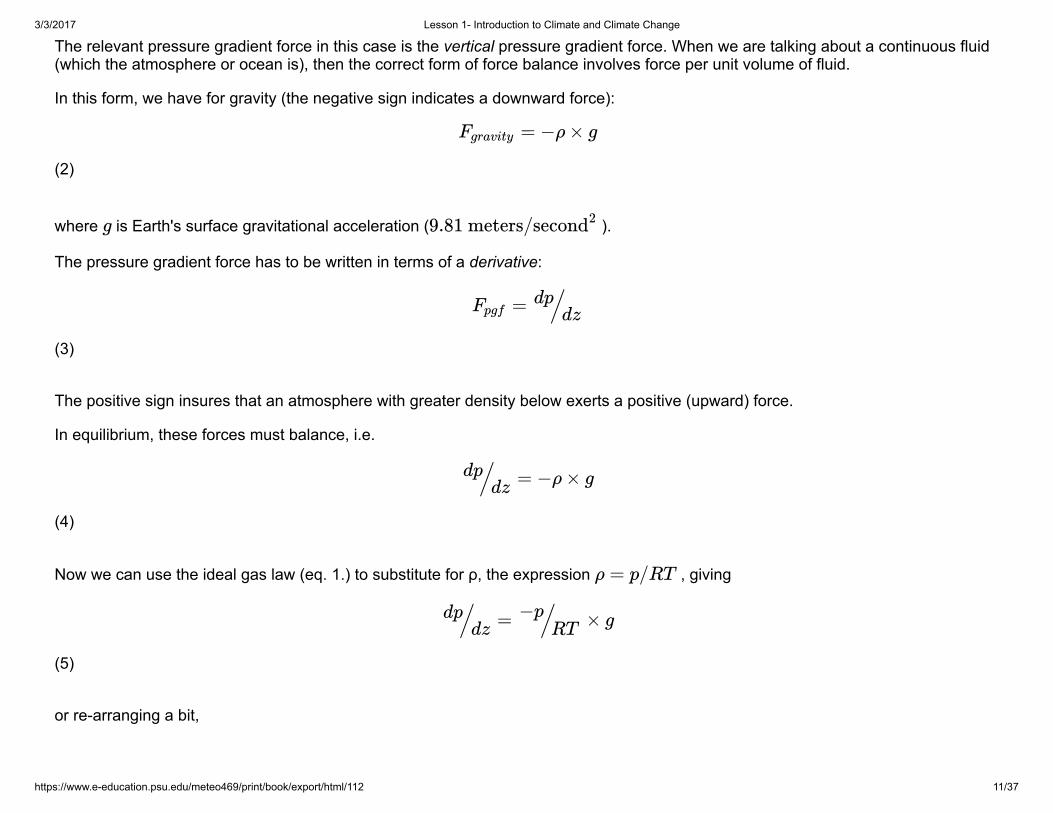
One key feature about the atmosphere is the fact that pressure and density decay exponentially with altitude:

3/3/2017 Lesson 1 Introduction to Climate and Climate Change
https://www.eeducation.psu.edu/meteo469/print/book/export/html/112 10/37
Figure 1.4: Atmospheric structure.Credit: Britannica.com
As you can see, the pressure decays nearly to zero by the time we get to 50 km. For this reason, the Earth's atmosphere, as notedfurther in the discussion below, constitutes a very thin shell around the Earth.
The exponential decay of pressure with altitude follows from a combination of two very basic physical principles. The first physicalprinciple is the ideal gas law. You are probably most familiar with the form , but that form applies to a bounded gas,where the volume can be defined. In our case, the gas is free, and the appropriate form of the ideal gas law is
(1)
where is the atmospheric pressure, is the density of the atmosphere, is the gas constant that is specificto Earth's atmosphere, and is temperature.
The 2nd principle is the force balance. There are two primary vertical forces acting on the atmosphere. The first is gravity, while theother is what is known as the pressure gradient force — it is the support of one part of the atmosphere acting on some other part ofthe atmosphere. This balance is known as the hydrostatic balance.
pV = nRT
p = ρRT
p ρ R = 287 J kK−1 g−1
T
3/3/2017 Lesson 1 Introduction to Climate and Climate Change
https://www.eeducation.psu.edu/meteo469/print/book/export/html/112 11/37
The relevant pressure gradient force in this case is the vertical pressure gradient force. When we are talking about a continuous fluid(which the atmosphere or ocean is), then the correct form of force balance involves force per unit volume of fluid.
In this form, we have for gravity (the negative sign indicates a downward force):
(2)
where is Earth's surface gravitational acceleration ( ).
The pressure gradient force has to be written in terms of a derivative:
(3)
The positive sign insures that an atmosphere with greater density below exerts a positive (upward) force.
In equilibrium, these forces must balance, i.e.
(4)
Now we can use the ideal gas law (eq. 1.) to substitute for ρ, the expression , giving
(5)
or rearranging a bit,
= −ρ × gFgravity
g 9.81 meters/second2
=Fpgfdp
dz/
= −ρ × gdpdz
/
ρ = p/RT
= × gdpdz
/ −pRT
/
( )/ /

3/3/2017 Lesson 1 Introduction to Climate and Climate Change
https://www.eeducation.psu.edu/meteo469/print/book/export/html/112 12/37
(6)
The term in parentheses can be treated as a constant (in reality, temperature varies with altitude, but it varies less dramatically thanpressure or density, so it's easiest to simply treat it as a constant).
This is a relatively simple first order differential equation.
Self Check...
Do you remember how to solve this first order differential equation from your previous math studies?
Click for answer.
The expression for atmospheric pressure as a function of altitude is:
(7)
where is the surface pressure, and is the surface height (by convention typically taken as zero).
This equation is known as the hypsometric equation.
The combination has units of inverse length, and so we can define a scale height (assuming a mean temperature ,
(8)
= −( )dzdpp/ g
RT/
p = exp [−( ) (z − )]p0gRT
/ z0
p0 z0
gRT/
T = 14°C = 287K
=hsRT
g ≈ 8.4km/

3/3/2017 Lesson 1 Introduction to Climate and Climate Change
https://www.eeducation.psu.edu/meteo469/print/book/export/html/112 13/37
and write:
(9)
this gives an exponential decline of pressure with height, with the efolding height equal to the scale height, representing the altitudeat which pressure falls to roughly 1/3 of its surface value. At this altitude, which as you can see from the above graphic is just a bitbelow the height of Mt. Everest, roughly 2/3 of the atmosphere is below you.
Selfcheck...
Using the hypsometric equation (9 above), estimate the altitude at which roughly half of the atmosphere is below you.
Click for answer.
Let us look at the vertical structure of the atmosphere in more detail, define some key layers of the atmosphere:
= exp [− (z − ) / ]pp0
/ z0 hs

3/3/2017 Lesson 1 Introduction to Climate and Climate Change
https://www.eeducation.psu.edu/meteo469/print/book/export/html/112 14/37

3/3/2017 Lesson 1 Introduction to Climate and Climate Change
https://www.eeducation.psu.edu/meteo469/print/book/export/html/112 15/37
Figure 1.5: Atmospheric Composition.Credit: Mann & Kump, Dire Predictions: Understanding Climate Change, 2nd Edition © 2015 Pearson Education, Inc.
Now, let us talk a bit more about the atmospheric composition:
The atmosphere is mostly nitrogen and oxygen, with trace amounts of other gases. Most atmospheric constituents are well mixed,which is to say, these constituents vary in constant relative proportion, owing to the influence of mixing and turbulence in theatmosphere. The assumption of a wellmixed atmosphere and the assumption of ideal gas behavior, were both implicit in our earlierderivation of the exponential relationship of pressure with height in the atmosphere.
There are, of course, exceptions to these assumptions. As discussed earlier, ozone is primarily found in the lower stratosphere(though some is produced near the surface as consequence of photochemical smog). Some gases, such as methane, have strongsources and sinks and are therefore highly variable as a function of region and season.
Atmospheric water vapor is highly variable in its concentration, and, in fact, undergoes phase transitions between solid, liquid, andsolid form during normal atmospheric processes (i.e., evaporation from the surface, and condensation in the form of precipitation asrainfall or snow). The existence of such phase transitions in the water vapor component of the atmosphere is an obvious violation ofideal gas behavior!
3/3/2017 Lesson 1 Introduction to Climate and Climate Change
https://www.eeducation.psu.edu/meteo469/print/book/export/html/112 16/37
Of particular significance in considerations of atmospheric composition are the socalled greenhouse gases (CO2, water vapor,methane, and a number of other trace gases) because of their radiative properties and, specifically, their role in the socalledgreenhouse effect. This topic is explored in greater detail later on in this lesson.
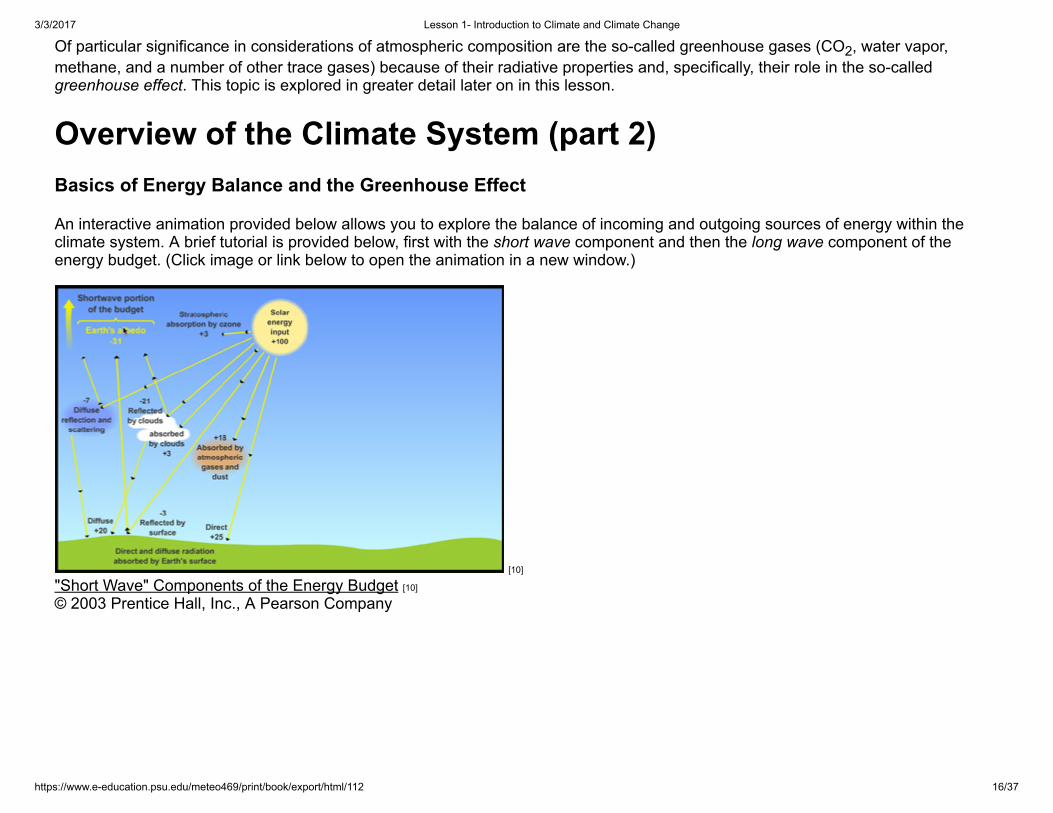
Overview of the Climate System (part 2)Basics of Energy Balance and the Greenhouse Effect
An interactive animation provided below allows you to explore the balance of incoming and outgoing sources of energy within theclimate system. A brief tutorial is provided below, first with the short wave component and then the long wave component of theenergy budget. (Click image or link below to open the animation in a new window.)
[10]"Short Wave" Components of the Energy Budget [10]© 2003 Prentice Hall, Inc., A Pearson Company

3/3/2017 Lesson 1 Introduction to Climate and Climate Change
https://www.eeducation.psu.edu/meteo469/print/book/export/html/112 17/37
[11]"Long Wave" Components of the Energy Budget [Please note that there is a slight error in the spoken part of the "Long Wave" video above, beginning around 3:17. While adding up the components of the long waveenergy emitted by the atmosphere to space, which total 66 units, the narrator neglects to add in 8 units of direct heat loss to space.]© 2003 Prentice Hall, Inc., A Pearson Company
Now explore this tool yourself, at your own pace. It takes some time to absorb all of the information that is contained here. Start withthe short wave energy budget. Once you are satisfied that you have got that down, go on to the somewhat more complex long waveenergy budget.
3/3/2017 Lesson 1 Introduction to Climate and Climate Change
https://www.eeducation.psu.edu/meteo469/print/book/export/html/112 18/37
Short wave Energy Budget© 2003 Prentice Hall, Inc., A Pearson Company
Consider how incoming and outcoming energy sources of shortwave and longwave radiation achieve a net balance:
at the surfacewithin the atmosphereat the top of the atmosphere
In future lessons, we will examine the greenhouse effect in a more quantitative manner. Note here how the greenhouse effect worksqualitatively. It involves the ability of greenhouse gases within the atmosphere to absorb longwave radiation, impeding the escape ofthe longwave radiation emitted from the surface to outer space.
In our first discussion session at the end of this lesson, you will be asked to speculate on certain aspects of this schematic, and topose some questions of your own for your classmates to attempt to answer.
Seasonal and Latitudinal Dependence of Energy Balance

3/3/2017 Lesson 1 Introduction to Climate and Climate Change
https://www.eeducation.psu.edu/meteo469/print/book/export/html/112 19/37
Next, let us note that the above picture represents average climate conditions, that is, averaged over the entire Earth's surface, andaveraged over time. However, in reality, the incoming distribution of radiation varies in both space and time. We measure the radiationin terms of power (energy per unit time) per unit area, a quantity we term intensity or energy flux, which can be measured in watts persquare meter (W/m2).
The dominant spatial variation occurs with latitude. On average, there is roughly 343 W/m2 of incoming short wave solar radiation thatis incident on the Earth, averaged over time, and over the Earth surface area. Obviously, there is more incoming solar radiationarriving at the surface near the equator than near the poles. On average, roughly 30%, or about 100 W/m2 of this incident radiation isreflected out to space by clouds and reflective surfaces of the Earth, such as ice and desert sand, leaving roughly 70% of theincoming solar radiation to be absorbed by the Earth's surface. The portion that is reflected by clouds and by the surface also variessubstantially with latitude, owing to the latitudinal variations in cloud and ice cover:
Figure 1.6: Latitudinal Distribution of Various Sources of Incoming and Outgoing RadiationCredit: Ruddiman, Earth's Climate: Past and Future (W.H. Freeman, 2001)
Moreover, the distribution of outgoing long wave radiation also varies substantially with latitude:

3/3/2017 Lesson 1 Introduction to Climate and Climate Change
https://www.eeducation.psu.edu/meteo469/print/book/export/html/112 20/37
Figure 1.7: Net Incoming vs. Outgoing Radiation as a Function of LatitudeCredit: Ruddiman, Earth's Climate: Past and Future (W.H. Freeman, 2001)
More terrestrial radiation is emitted from the warmer tropical regions and less emitted from the cold polar regions:
Figure 1.8: Annual Mean TemperatureCredit: Wikimedia Commons

3/3/2017 Lesson 1 Introduction to Climate and Climate Change
https://www.eeducation.psu.edu/meteo469/print/book/export/html/112 21/37
The disparity shown above (Figure 1.8) between the incoming solar radiation that is absorbed at the surface and the outgoingterrestrial radiation emitted from the surface poses a conundrum. As we can see in Figure 1.8, outgoing radiation exceeds incomingradiation near the poles, i.e., there is a deficit of radiation at the surface. Conversely, there is a surplus of incoming radiation near theequator. Should the poles, therefore, continue to cool down and the tropics continue to warm up over time?
Think About It!
Any idea what the solution to this conundrum might be?
Click for answer.
It is also worth noting that the incoming solar radiation is not constant in time. As we will see in later lessons, the output of the Sun,the socalled solar constant, can vary by small amounts on timescales of decades and longer. During the Earth's early evolution,billions of year ago, the Sun was probably about 30% less bright than it is todayindeed, explaining how the Earth's climate couldhave been warm enough to support life back then remains remains somewhat of a challenge, known as the "Faint Young Sun"paradox [12].
Even more dramatic changes in solar insolation take place on shorter timescales—the diurnal and annual timescale. These changes,however, do not have to do with the net output of the Sun, but rather the distribution of solar insolation over the Earth's surface. Thisdistribution is influenced by the Earth's daily rotation about its axis, which of course leads to night and day, and the annual orbit of theEarth about the Sun, which leads to our seasons. While there is a small component of the seasonality associated with changes in thethe EarthSun distance during the course of the Earth's annual orbit about the Sun (because of the slightly elliptical nature of theorbit), the primary reason for the seasons is the tilt of Earth's rotation axis relative to the plane defined by the Earth and the Sun,which causes the Northern Hemisphere and Southern Hemisphere to be preferentially oriented either towards or away from the Sun,depending on the time of year.
Check it out for yourself with this animation:

3/3/2017 Lesson 1 Introduction to Climate and Climate Change
https://www.eeducation.psu.edu/meteo469/print/book/export/html/112 22/37
© 2003 Prentice Hall, Inc., A Pearson Company
The consequence of all of this, is that amount of short wave radiation received from the Sun at the top of the Earth's atmospherevaries as a function of both time of day and season:
3/3/2017 Lesson 1 Introduction to Climate and Climate Change
https://www.eeducation.psu.edu/meteo469/print/book/export/html/112 23/37
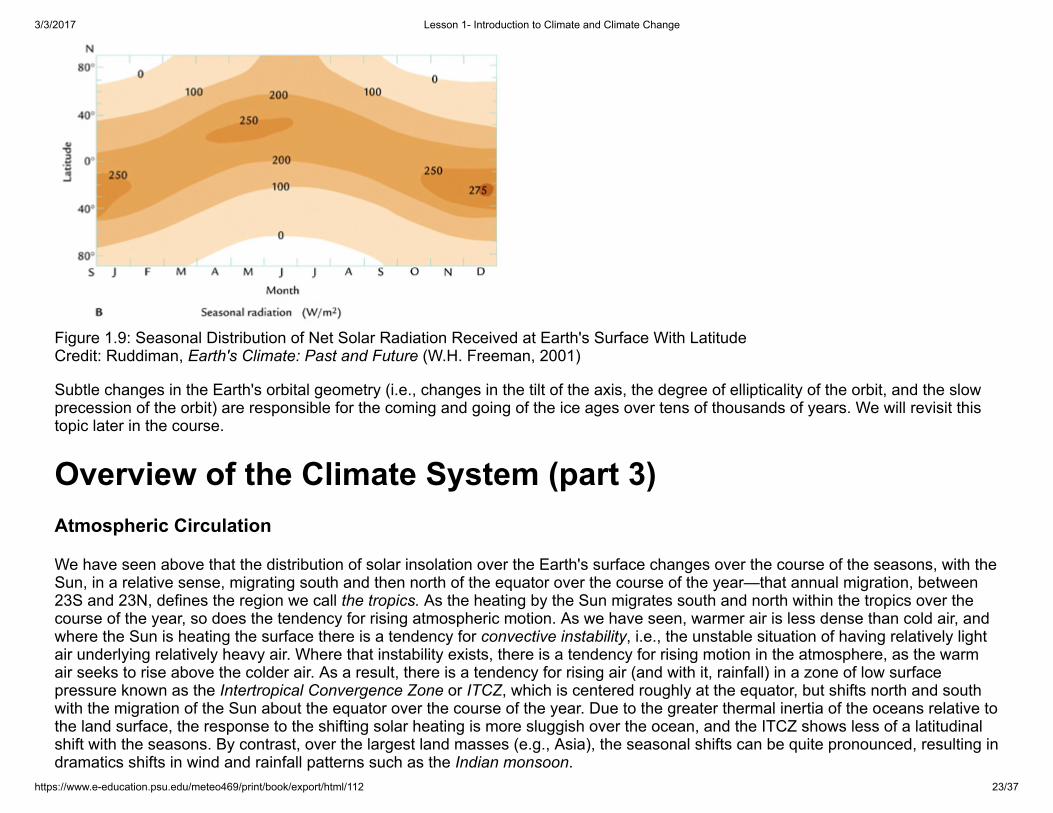
Figure 1.9: Seasonal Distribution of Net Solar Radiation Received at Earth's Surface With LatitudeCredit: Ruddiman, Earth's Climate: Past and Future (W.H. Freeman, 2001)
Subtle changes in the Earth's orbital geometry (i.e., changes in the tilt of the axis, the degree of ellipticality of the orbit, and the slowprecession of the orbit) are responsible for the coming and going of the ice ages over tens of thousands of years. We will revisit thistopic later in the course.
Overview of the Climate System (part 3)Atmospheric Circulation
We have seen above that the distribution of solar insolation over the Earth's surface changes over the course of the seasons, with theSun, in a relative sense, migrating south and then north of the equator over the course of the year—that annual migration, between23S and 23N, defines the region we call the tropics. As the heating by the Sun migrates south and north within the tropics over thecourse of the year, so does the tendency for rising atmospheric motion. As we have seen, warmer air is less dense than cold air, andwhere the Sun is heating the surface there is a tendency for convective instability, i.e., the unstable situation of having relatively lightair underlying relatively heavy air. Where that instability exists, there is a tendency for rising motion in the atmosphere, as the warmair seeks to rise above the colder air. As a result, there is a tendency for rising air (and with it, rainfall) in a zone of low surfacepressure known as the Intertropical Convergence Zone or ITCZ, which is centered roughly at the equator, but shifts north and southwith the migration of the Sun about the equator over the course of the year. Due to the greater thermal inertia of the oceans relative tothe land surface, the response to the shifting solar heating is more sluggish over the ocean, and the ITCZ shows less of a latitudinalshift with the seasons. By contrast, over the largest land masses (e.g., Asia), the seasonal shifts can be quite pronounced, resulting indramatics shifts in wind and rainfall patterns such as the Indian monsoon.

3/3/2017 Lesson 1 Introduction to Climate and Climate Change
https://www.eeducation.psu.edu/meteo469/print/book/export/html/112 24/37
The air rising in the tropics then sinks in the subtropics, forming a subtropical band of high surface pressure and low precipitationassociated with the prevailing belt of deserts in the subtropics of both hemispheres. The resulting pattern of circulation of theatmosphere is known as the Hadley Cell circulation. In subpolar latitudes, there is another region of low surface pressure, associatedagain with rising atmospheric motion and rainfall. This region is known as the polar front. These belts of high and low atmosphericsurface pressure, and the associated patterns of atmospheric circulation also shift south and north over the course of the year inresponse to the heating by the Sun. You can explore the atmospheric patterns using this map:
We have seen above that there is an imbalance between the absorbed incoming short wave solar radiation and the emitted outgoinglong wave terrestrial radiation, with a relative surplus within the tropics and a relative deficit near the poles. We, furthermore, notedthat the atmosphere and ocean somehow relieve this imbalance by transporting heat laterally, through a process known as heatadvection. We are now going to look more closely at how the atmosphere accomplishes this transport of heat. We have already seenone important ingredient, namely the Hadley Cell circulation, which has the net effect of transporting heat poleward from where thereis a surplus to where there is a deficit.
Wind patterns in the extratropics also serve to transport heat poleward. The lateral wind patterns are primarily governed by a balancebetween the previously discussed pressure gradient force (acting in this case laterally rather than vertically), and the Coriolis force, aneffective force that exists due to the fact that the Earth is itself rotating. This balance is known as the geostrophic balance.

3/3/2017 Lesson 1 Introduction to Climate and Climate Change
https://www.eeducation.psu.edu/meteo469/print/book/export/html/112 25/37
The Coriolis force acts at right angles to the direction of motion: 90 degrees to the right in the Northern Hemisphere and 90 degreesto the left in the Southern Hemisphere. The pressure gradient force is directed from regions of high surface pressure to regions of lowsurface pressure. As a consequence, geostrophic balance leads to winds in the midlatitudes, between the subtropical high pressurebelt and the subpolar low pressure belt of the polar front, blowing from west to east. We call these westerly winds. For reasons thathave to do with the vertical thermal structure of the atmosphere, and the combined effect of the geostrophic horizontal force balanceand hydrostatic vertical force balance in the atmosphere, the westerly winds become stronger aloft, leading to the intense regions ofhigh wind known as the jet streams in the midlatitude upper troposphere.
Conversely, winds in the tropics tend to blow from east to west. These are known as easterly winds or, by the perhaps more familiarterm, the trade winds. In the Northern Hemisphere, geostrophic balance implies counterclockwise rotation of winds about lowpressure centers and clockwise rotation of winds about high pressure centers. The directions are opposite in the SouthernHemisphere.
Due to the effect of friction at the Earth's surface, there is an additional component to the winds which blows out from high pressurecenters and in towards low pressure centers. The result is spiraling in (convergence) towards low pressure centers and a spiraling out(divergence) about high pressure centers. The convergence of the winds toward the low pressure centers is associated with the risingatmospheric motion that occurs within regions of low surface pressure. The divergence of the winds away from the high pressurecenters is associated with the sinking atmospheric motion that occurs within regions of high atmospheric pressure.
The inward spiraling low pressure systems in midlatitudes constitute the polar front, which separates the coldest air masses near thepoles from the warmer air masses in the subtropics. In fact, it is the unstable property of having clashing air masses with vastlydifferent temperature characteristics, known as baroclinic instability, that is responsible for the existence of extratropical cyclones. Theenergy that drives the extratropical cyclones comes from the work done as surface air is lifted along frontal (i.e., cold front and warmfront) boundaries. These extratropical storm systems relieve highlatitude deficit of radiation by mixing cold polar and warmsubtropical air and, in so doing, transporting heat poleward, along the latitudinal temperature gradient.
You can explore the resulting largescale pattern of circulation of the global atmosphere in this animation:

3/3/2017 Lesson 1 Introduction to Climate and Climate Change
https://www.eeducation.psu.edu/meteo469/print/book/export/html/112 26/37
Ocean Circulation (Gyres, Thermohaline Circulation)
While we have focused primarily on the atmosphere thus far, the oceans, too, play a key role in relieving the radiation imbalance by transporting heat from lower tohigher latitudes. The oceans also play a key role in both climate variability and climate change, as we will see. There are two primary components of the oceancirculation. The first component is the horizontal circulation, characterized by winddriven ocean gyres.

3/3/2017 Lesson 1 Introduction to Climate and Climate Change
https://www.eeducation.psu.edu/meteo469/print/book/export/html/112 27/37
Figure 1.10: Global Ocean Currents.Credit: NOAA [13]
The major surface currents are associated with the ocean gyres. These include the warm poleward western boundary currents suchas the Gulf Stream, which is associated with the North Atlantic Gyre, and the Kuroshio Current associated with the North Pacific Gyre.These gyres also contain cold equatorward eastern boundary currents such as the Canary Current in the eastern North Atlantic andthe California Current in the western North Atlantic. Similar current systems are found in the Southern Hemisphere. The horizontalpatterns of ocean circulation are driven by the alternating patterns of wind as a function of latitude, and, in particular, by the tendencyfor westerly winds in midlatitudes and easterly winds in the tropics, discussed above.
An important additional mode of ocean circulation is the thermohaline circulation, which is sometimes referred to as the meridionaloverturning circulation or MOC. The circulation pattern is shown below:

3/3/2017 Lesson 1 Introduction to Climate and Climate Change
https://www.eeducation.psu.edu/meteo469/print/book/export/html/112 28/37
Figure 1.11: The Ocean's Meridional Overturning Circulation or "Conveyor Belt Circulation"Credit: Image courtesy of Windows to the Universe [14]
By contrast with the horizontal gyre circulations, the MOC can be viewed as a vertical circulation pattern associated with a tendencyfor sinking motion in the highlatitudes of the North Atlantic, and rising motion more broadly in the tropics and subtropics of the Indianand Pacific ocean. This circulation pattern is driven by contrasts in density, which are, in turn, largely due to variations in bothtemperature and salinity (hence the term thermohaline). The sinking motion is associated with relatively cold, salty surface waters ofthe subpolar North Atlantic, and the rising motion with the relatively warm waters in the tropical and subtropical Pacific and Indianocean.
The picture presented in Figure 1.11 above is a highly schematized and simplistic description of the actual vertical patterns ofcirculation in the ocean. Nonetheless, the conveyor belt is a useful mnemonic. The northward surface branch of this circulationpattern in the North Atlantic is sometimes erroneously called the Gulf Stream. The Gulf Stream, as discussed above, is part of thecirculating waters of the winddriven ocean gyre circulation. By contrast, the northward extension of the thermohaline circulation in theNorth Atlantic, is rightfully referred to as the North Atlantic Drift. This current system represents a net transport of warm surfacewaters to higher latitudes in the North Atlantic and is also an important means by which the climate system transports heat polewardfrom lower latitudes. Changes in this current system are speculated as having played a key role in past and potential future climatechanges, as will be explored later in this course.

3/3/2017 Lesson 1 Introduction to Climate and Climate Change
https://www.eeducation.psu.edu/meteo469/print/book/export/html/112 29/37
Other Fundamental PrinciplesReading Assignment
Before we go any further, please make sure that you have read the following document:
From the IPCC Fifth Assessment Working Group 1 [2], read the Introduction (p.4), section B.5, Observed Changes in the ClimateSystem, Carbon and Other Biogeochemical Cycles (p. 1112), and section C, Drivers of Climate Change (p. 1314) of theSummary for Policy Makers [3].
As you read, pay particular note to the discussion of natural vs. human drivers of climate, and the historic changes in the natural andhuman factors influencing climate. Consider the following questions:
Is modern climate change driven solely by humans?
Can we explain global warming in terms of natural factors?
Are these questions reasonable, or are they too simplistic?
Natural vs. Human Forcing

3/3/2017 Lesson 1 Introduction to Climate and Climate Change
https://www.eeducation.psu.edu/meteo469/print/book/export/html/112 30/37
Figure 1.12: Radiative Forcing Components. [Enlarge [15]]Credit: IPCC, 2013
Let us consider more closely the above figure (Figure 1.12) from the IPCC Summary for Policy Makers . There is a lot of informationpacked in this figure. Figure 1.12 summarizes the relative impacts of various natural and human forcing factors on the Earth's climate.Later on in the course, we will look at how these forcing factors are likely to have impacted global mean temperature trends over thepast century. In the meantime, we can make some rough assessment of the relative importance of the different factors as gauged bytheir estimated radiative forcing — measured by the energy per unit time that a given forcing factor exerts per square meter of theEarth's surface. The first thing to pay attention to is whether the indicated forcing factor is a warming factor (black dot to the right ofzero) or cooling factor (black dot to the left of zero). The next thing to take note of is how high or low the forcing associated with thatfactor is, as indicated by the length of the bar. Finally, take note of the error bars (these are shown as the horizontal "barbell" symbols)indicating whether the factor in question is relatively well known, or relatively uncertain.
The forcings are separated into two fundamentally different categories: anthropogenic (that is, humancaused) and natural. You maybe surprised to learn that while greenhouse gases are the primary anthropogenic forcing, there are other notable anthropogenicforcing contributions. Indeed, if one computes the net effect of anthropogenic aerosols (primarily sulphate) produced by industrialactivity, adding together the direct and indirect effects of these aerosols, the total negative global radiative forcing (roughly 0.8 W/m2)is nearly half as large as the positive radiative forcing (roughly 1.7 W/m2) due to humancaused CO2 concentration increases (though

3/3/2017 Lesson 1 Introduction to Climate and Climate Change
https://www.eeducation.psu.edu/meteo469/print/book/export/html/112 31/37
the uncertainty associated with the most recent estimate of aerosol forcing is quite large). As we will see in later lectures, the coolingeffect of these aerosols offset a substantial fraction of anthropogenic greenhouse warming over the past century.
One important historical natural forcing of climate is not shown in this diagram. This is the cooling effect of volcanic eruptions due toreflective aerosol injected into the stratosphere. Unlike other forcings, this volcanic forcing is episodic, rather than continuous innature. Explosive volcanic eruptions may have a cooling effect on climate for several years. If there is a large number of eruptionsover a sustained period of time, this can have an overall cooling impact on climate. We will revisit this issue in Lesson 4.
Feedback Mechanisms
The response of the climate to forcing, whether natural or humancaused, would be far more modest than it is, were it not for theinfluence of feedback mechanisms. Feedback mechanisms are mechanisms within the climate system that act to either attenuate(negative feedback) or amplify (positive feedback) the response to a given forcing. On balance, the feedbacks are believed to bepositive in the sense that the response of the climate system to a positive forcing is greater than one would expect from the forcingalone, because of the net warming effect arising from these responses.
The principle feedback mechanisms relevant to climate change on historical timescales, are:
1. The water vapor feedback. Warming atmosphere can hold larger amounts of water vapor. Since water vapor is a greenhousegas, this leads to further warming:a Positive Feedback [16]
2. The icealbedo feedback. Surface of the Earth has less snow/ice as it warms, leading to less reflection and greater absorption ofincoming solar radiation: a Positive Feedback
3. The cloud radiative feedbacks. There are different competing effects:1. Warmer atmosphere produces more low clouds. The primary impact of more low clouds would be to reflect more solarradiation out to space: a Negative Feedback [17]
2. Warmer atmosphere produces more high clouds, like cirrus. The primary impact of such thin, high clouds is to increase thegreenhouse effect due to their ability to trap much of the outgoing longwave terrestrial radiation while remaining largelytransparent to incoming shortwave solar radiation: a Positive Feedback
On balance, it has been believed that the negative cloud radiative feedbacks win over the positive cloud radiative feedbacks thoughthe low cloud feedbacks are quite uncertain, and the overall cloud radiative feedback could very well be positive.
The net effect of all these feedbacks is positive and serves to increase the warming due a particular external forcing (be it increasedgreenhouse gas concentrations due to fossil fuel emissions, increased solar output, or some other external forcing) beyond whatwould be expected purely from that factor alone. For example, a doubling of CO2 concentrations relative to preindustrial levels would,in the absence of feedbacks, lead to roughly 1.25°C warming. However, our best estimates indicate that the positive water vaporfeedback would add about 2.5°C additional warming, while the positive ice albedo feedback adds about 0.6°C warming. Whilesubstantially more uncertain, the negative cloud radiative feedback could lead to just under 2°C cooling. Add up the numbers, and thetotal comes to about 2.5°C warming (actually, current generation climate models average closer to 3°C).

3/3/2017 Lesson 1 Introduction to Climate and Climate Change
https://www.eeducation.psu.edu/meteo469/print/book/export/html/112 32/37
Figure 1.13: Climate Feedback MechanismsCredit: Ruddiman, Earth's Climate: Past and Future (W.H. Freeman, 2001)
This quantityhow much we expect the Earth to warm once it equilibrates to a doubling of greenhouse gas concentrationsis knownas the equilibrium climate sensitivity. We will explore this key concept in more detail in subsequent lectures.
The Carbon Cycle
The traditional concept of climate sensitivity envisions the concentration of CO2 and other greenhouse gases as specified (i.e.,doubled from some initial level), and calculates the expected warming. This construction is somewhat artificial, however, becauseactivities, such as fossil fuel burning, do not directly regulate the concentration of CO2 or other greenhouse gases, but instead governthe atmospheric emissions, which can interact with the climate system. For example, life on land and in the ocean can both take upand give off CO2: CO2 is taken up during photosynthesis — production of organic matter by green plants, and given off duringrespiration (or remineralization) — a reverse process during which organic matter is decomposed. As climate becomes warmer, theliving organisms are affected by the change, e.g., green plants might consume more CO2 because the growing season becomeslonger and the plants have more time for photosynthesis; or, on the other hand, warmer temperatures might induce bacterial activityand the rates of decay of organic matter, causing an increase in the CO2 emissions. In general, the Earth system processes ofchemical, physical, or biological origin that emit CO2 to the atmosphere are referred to as carbon sources, while those that take upCO2 from the atmosphere are referred to as carbon sinks or losses. Climate change affects the characteristics of living things, as wellas other components of the climate system, such as, for example, the overturning ocean circulation (which helps to sequesteratmospheric carbon in the deep ocean), and therefore can influence various carbon sources and sinks that exist within the Earthsystem.

3/3/2017 Lesson 1 Introduction to Climate and Climate Change
https://www.eeducation.psu.edu/meteo469/print/book/export/html/112 33/37
Figure 1.14: The Carbon Cycle.Credit: Mann & Kump, Dire Predictions: Understanding Climate Change, 2nd Edition © 2015 Pearson Education, Inc.
We refer to the amount of emitted CO2 that actually stays in the atmosphere as the airborne fraction of CO2. So far, only roughly halfof our carbon emissions remain airborne. The other half has been absorbed by carbon sinks. The primary carbon sink is the upperocean, which has absorbed roughly 2530% of the CO2, while the terrestrial biosphere has absorbed another 1520% of the CO2.
These sinks are not constant over time, however. Numerous studies indicate that both the upper ocean and terrestrial biosphere arelikely to become less able to absorb and hold additional CO2 as the globe warms. Were this to happen, the airborne fraction of CO2 inthe atmosphere would increase, and CO2 would accumulate in the atmosphere more quickly for a given rate of emissions. Suchresponses are known as the carbon cycle feedbacks, because they have the ability to influence the accumulation of CO2 in theatmosphere.

3/3/2017 Lesson 1 Introduction to Climate and Climate Change
https://www.eeducation.psu.edu/meteo469/print/book/export/html/112 34/37
Figure 1.15: Natural Carbon SinksCredit: Ruddiman, Earth's Climate: Past and Future (W.H. Freeman, 2001)
The existence of carbon cycle feedbacks forces us to reconsider the concept of climate sensitivity discussed earlier. Consider forexample the accumulated carbon emissions that we might calculate would lead to a doubling of CO2 in the atmosphere in theabsence of carbon cycle feedbacks. As the climate warms, the positive carbon cycle feedbacks discussed above would cause theairborne fraction to increase. As a result, the final increase in atmospheric CO2 would be greater than the originally calculateddoubling. Accordingly, there would be even more warming than one would estimate from applying the standard concept of equilibriumclimate sensitivity to the original estimated slug of carbon emissions.
Such complications lead to the more general notion of the Earth System sensitivity. We will revisit these concepts later in the course.
Lesson 1 DiscussionActivity
Directions
At this point, you have completed the Course Orientation and the first lesson for METEO 469. Let's talk! Please participate in anonline discussion of the course in general and of the material we have covered thus far. Please share your thoughts about the generaltopic of this course and what you hope to learn. Also, please discuss the material presented in Lesson 1.
This discussion will take place in a threaded discussion forum in Canvas (see the Canvas Guides [18] for the specific information onhow to use this tool) over approximately a weeklong period of time. Since the class participants will be posting to the discussion

3/3/2017 Lesson 1 Introduction to Climate and Climate Change
https://www.eeducation.psu.edu/meteo469/print/book/export/html/112 35/37
forum at various points in time during the week, you will need to check the forum frequently in order to fully participate. You can alsosubscribe to the discussion and receive email alerts each time there is a new post.
Please realize that a discussion is a group effort and make sure to participate early in order to give your classmates enough time torespond to your posts.
Post your comments addressing some aspect of the material that is of interest to you and respond to other postings by asking forclarification, asking a followup question, expanding on what has already been said, etc. For each new topic you are posting, pleasetry to start a new discussion thread with a descriptive title, in order to make the conversation easier to follow.
Suggested topics
The purpose of the discussion is to facilitate a free exchange of thoughts and opinions among the students, and you are encouragedto discuss any topic within the general discussion theme that is of interest to you. If you find it helpful, you may also use the topicssuggested below.
General discussion of METEO 469
Why are you taking this course?Why are you interested in climate change?Is it important to you to understand the scientific basis of climate science?Is it important to you to learn about impacts of climate change?What do you hope to learn in this course?
Lesson 1: Introduction to Climate and Climate Change
In your understanding, what is the difference between the climate and the weather? Why is it important to differentiate betweenthe two?Discuss natural v.s. anthropogenic climate change.What are feedback mechanisms in regards to the climate system? Can we know all feedback mechanisms in our climatesystem? Which mechanisms are considered most important and why?Discuss the concept of climate sensitivity. Why is this concept useful?Discuss the components of the carbon cycle and how carbon sources and sinks influence atmospheric CO2 levels.
Submitting your work
1. Go to Canvas.2. Go to the Home tab.3. Click on Lesson 1 discussion: General Discussion of METEO 469.4. Post your comments and responses.

3/3/2017 Lesson 1 Introduction to Climate and Climate Change
https://www.eeducation.psu.edu/meteo469/print/book/export/html/112 36/37
Grading criteria
You will be graded on the quality of your participation. See the online discussion grading rubric [19] for the specifics on how thisassignment will be graded. Please note that you will not receive a passing grade on this assignment if you wait until the last day of thediscussion to make your first post.
Lesson 1 SummaryWe have reviewed the essential basic concepts necessary for understanding climate change and global warming, including:
the concepts of climate, climate change, and global warming;the components of the Earth's climate system: the atmosphere, oceans, cryosphere, and biosphere;the structure and composition of the Earth's atmosphere;the concepts of radiation and energy balance;the nature of the circulation of the atmosphere and the oceans;the concept of radiative forcing;climate feedbacks and climate sensitivity;carbon cycle feedbacks and the Earth System sensitivity.
We are now well equipped to begin digging into the details. Our first foray will be into the world of climate observations. What dataare available that can inform our understanding of how climate has changed over historic time? What indirect data are available thatplace historical observation in a longerterm context? How do we analyze such data to assess whether there is indeed "climatechange"? This will be our next topic.
Reminder Complete all of the module tasks!
You have finished Lesson 1. Doublecheck the list of requirements on the first page of this lesson to make sure you have completedall of the activities listed there before beginning the next lesson.
Source URL: https://www.eeducation.psu.edu/meteo469/node/112
Links [1] http://Montclairoak.com [2] https://www.ipcc.ch/report/ar5/wg1/ [3] https://www.ipcc.ch/pdf/assessmentreport/ar5/wg1/WG1AR5_SPM_FINAL.pdf [4] http://www.yalealumnimagazine.com/uploads/images/2800028/1337795703/dinos_male44.jpg [5] http://www.markey.senate.gov/GlobalWarming/impactzones/arctic.html [6] https://www.eeducation.psu.edu/meteo469/sites/www.eeducation.psu.edu.meteo469/files/lesson01/EPAGulfMexicoshelf.GIF [7] http://epa.gov/gmpo/edresources/pleistoceneimage02.html [8] http://www.polarbearsinternational.org/media/video/polarbearsclimatechangeandhoweachuscanhelp [9] http://www.ipcc.ch/publications_and_data/ar4/wg1/en/faq12.html

3/3/2017 Lesson 1 Introduction to Climate and Climate Change
https://www.eeducation.psu.edu/meteo469/print/book/export/html/112 37/37
[10] https://www.eeducation.psu.edu/meteo469/sites/www.eeducation.psu.edu.meteo469/files/lesson01/solar_short.html [11] https://www.eeducation.psu.edu/meteo469/sites/www.eeducation.psu.edu.meteo469/files/lesson01/solar_long.html [12] http://www.sciencenews.org/view/generic/id/57810/title/Warmth_in_the_dark_age [13] http://www.adp.noaa.gov/currents_map.html [14] http://www.windows2universe.org/ [15] https://www.eeducation.psu.edu/meteo469/sites/www.eeducation.psu.edu.meteo469/files/lesson01/IPCCForcings_large_5.png [16] https://www.eeducation.psu.edu/meteo469/sites/www.eeducation.psu.edu.meteo469/files/lesson01/p_feedback.gif [17] https://www.eeducation.psu.edu/meteo469/sites/www.eeducation.psu.edu.meteo469/files/lesson01/n_feedback.gif [18] https://community.canvaslms.com/docs/DOC1294 [19] https://www.eeducation.psu.edu/meteo469/245