
TARGETING CLIMATE CHANGE
91
GLOBAL STATUS OF CCS TARGETING CLIMATE CHANGE 2019
-
Upload
khangminh22 -
Category
Documents
-
view
3 -
download
0
Transcript of TARGETING CLIMATE CHANGE

GLOBAL STATUS OF CCS
TARGETING CLIMATE CHANGE
2019

TARGETING CLIMATE CHANGE

URGENT ACTION IS REQUIRED TO
ACHIEVE CLIMATE CHANGE TARGETS
CARBON CAPTURE AND STORAGE
IS VITAL


5
ABOUT US
The Global CCS Institute (the Institute) is an international think tank whose mission is to accelerate the deployment of carbon capture and storage (CCS), a vital technology to tackle climate change.
As a team of almost 40 professionals, working with and on behalf of our Members, we drive the adoption of CCS as quickly and cost effectively as possible; sharing expertise, building capacity and providing advice and support so CCS can play its part in reducing greenhouse gas emissions.
Our diverse international membership includes governments, global corporations, private companies, research bodies and non-governmental organisations; all committed to CCS as an integral part of a net-zero emissions future.
The Institute is headquartered in Melbourne, Australia with offices in Washington DC, Brussels, Beijing, London and Tokyo.
1.0 INTRODUCTION
ABOUT THE REPORT
CCS is an emissions reduction technology critical to meeting global climate targets.
The Global Status of CCS 2019 documents important milestones for CCS over the past 12 months, its status across the world and the key opportunities and challenges it faces.
We hope this report will be read and used by governments, policy-makers, academics, media commentators and the millions of people who care about our climate.
AUTHORS
The team that prepared this report and its underlying analyses: This report was led by Brad Page, Guloren Turan and Alex Zapantis and included Lee Beck, Chris Consoli, Ian Havercroft, Harry Liu, Patricia Loria, Annya Schneider, Eve Tamme, Alex Townsend, Lucy Temple-Smith, Dominic Rassool and Tony Zhang.
Other Institute staff members who contributed to this report are: Jamie Burrows, Jeff Erikson, Bruno Gerritts, Carla Judge, David Kearns, Xiangshan Ma, Rob Mitchell, Hiroshi Nambo and Nabeela Raji.
ACRONYMS
BECCS Bioenergy with CCSCCS Carbon Capture and StorageCCUS Carbon Capture Utilisation and StorageCOP Conference of the PartiesDAC Direct Air CaptureDACCS Direct Air Capture with Carbon StorageEC European CommissionEOR Enhanced Oil RecoveryESG Environmental, Social and Corporate GovernanceETS Emissions Trading SchemeEU ETS European Union’s Emissions Trading SystemEU European UnionFEED Front-End Engineering Design GHG Greenhouse GasGt GigatonneGW GigawattIPCC Intergovernmental Panel on Climate ChangeLCFS Low Carbon Fuel StandardMMV Monitoring, Measurement and VerificationMtpa Million Metric Tonnes Per AnnumMW MegawattNDC Nationally Determined ContributionOECD Organisation for Economic Co-operation and DevelopmentR&D Research and DevelopmentSDS Sustainable Development ScenarioSMR Steam Methane Reformation SOE State Owned EnterpriseTWH Terrawatt HourUNFCCC United Nations Framework Convention on Climate ChangeUK United KingdomUS United States of AmericaUS DOE United States Department of Energy
CONTENTS
1.0 INTRODUCTION1.1 About Global CCS Institute1.2 About the Report1.3 Acronyms1.4 CEO Foreword
2.0 MEETING THE CLIMATE CHALLENGE: THE NEED FOR CCS
3.0 GLOBAL STATUS OF CCS3.1 Global CCS Facilities Update3.2 Policy Levers for Accelerating Deployment 3.3 Global CO2 Storage Overview3.4 Legal and Regulatory Overview
4.0 REGIONAL OVERVIEWS4.1 International Climate Policy Overview 4.2 Americas4.3 Europe4.4 Middle East and Central Asia4.5 Asia Pacific
5.0 CCS DEVELOPMENT: TECHNOLOGY AND APPLICATIONS
5.1 Natural Gas5.2 Hydrogen5.3 CCS in the Power Sector5.4 Bioenergy with Carbon Capture
and Storage (BECCS)5.5 Direct Air Capture (DAC)5.6 CO2 Utilisation5.7 CCS Innovation5.8 Industry’s Transition to a Net-zero Future
6.0 APPENDICES
7.0 REFERENCES
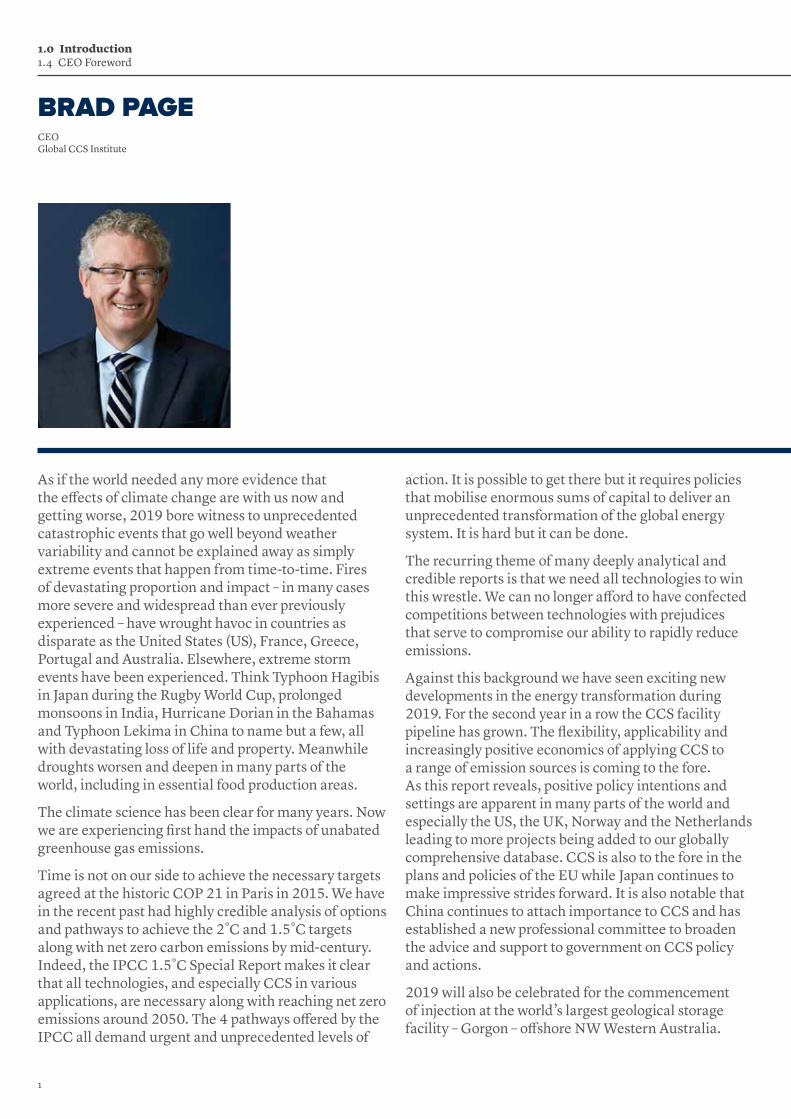
BRAD PAGECEO Global CCS Institute
1.0 Introduction 1.4 CEO Foreword
As if the world needed any more evidence that the effects of climate change are with us now and getting worse, 2019 bore witness to unprecedented catastrophic events that go well beyond weather variability and cannot be explained away as simply extreme events that happen from time-to-time. Fires of devastating proportion and impact – in many cases more severe and widespread than ever previously experienced – have wrought havoc in countries as disparate as the United States (US), France, Greece, Portugal and Australia. Elsewhere, extreme storm events have been experienced. Think Typhoon Hagibis in Japan during the Rugby World Cup, prolonged monsoons in India, Hurricane Dorian in the Bahamas and Typhoon Lekima in China to name but a few, all with devastating loss of life and property. Meanwhile droughts worsen and deepen in many parts of the world, including in essential food production areas.
The climate science has been clear for many years. Now we are experiencing first hand the impacts of unabated greenhouse gas emissions.
Time is not on our side to achieve the necessary targets agreed at the historic COP 21 in Paris in 2015. We have in the recent past had highly credible analysis of options and pathways to achieve the 2˚C and 1.5˚C targets along with net zero carbon emissions by mid-century. Indeed, the IPCC 1.5˚C Special Report makes it clear that all technologies, and especially CCS in various applications, are necessary along with reaching net zero emissions around 2050. The 4 pathways offered by the IPCC all demand urgent and unprecedented levels of
action. It is possible to get there but it requires policies that mobilise enormous sums of capital to deliver an unprecedented transformation of the global energy system. It is hard but it can be done.
The recurring theme of many deeply analytical and credible reports is that we need all technologies to win this wrestle. We can no longer afford to have confected competitions between technologies with prejudices that serve to compromise our ability to rapidly reduce emissions.
Against this background we have seen exciting new developments in the energy transformation during 2019. For the second year in a row the CCS facility pipeline has grown. The flexibility, applicability and increasingly positive economics of applying CCS to a range of emission sources is coming to the fore. As this report reveals, positive policy intentions and settings are apparent in many parts of the world and especially the US, the UK, Norway and the Netherlands leading to more projects being added to our globally comprehensive database. CCS is also to the fore in the plans and policies of the EU while Japan continues to make impressive strides forward. It is also notable that China continues to attach importance to CCS and has established a new professional committee to broaden the advice and support to government on CCS policy and actions.
2019 will also be celebrated for the commencement of injection at the world’s largest geological storage facility – Gorgon – offshore NW Western Australia.
1

Ramping up over time to capture and store between 3.4 and 4.0 million tonnes of CO2 per annum, Gorgon puts Australia on the CCS facility map and is a credit to the determination and persistence of the joint venture partners led by Chevron and including prominent Institute members Shell and Exxon Mobil.
Hydrogen as a vital new energy source in the decarbonisation race was also to the fore in 2019. In Europe, Australia, Japan, South Korea and an increasing number of other countries, hydrogen is receiving policy attention not seen for several decades. The difference this time around is that the need for a zero-emission energy dense fuel is vital and the technology to produce and deliver the hydrogen has advanced substantially in the intervening period. As is noted later in this report, the most technologically proven, economical, at-scale process for producing clean hydrogen is through steam methane reforming or coal gasification, both with CCS. The potential market for clean hydrogen is substantial and early stage investment in production facilities, evidenced for example in the Japanese/Australian joint venture of building a coal gasification pilot plant, is the harbinger of a growing industry as are plans in the UK and in Europe.
Perhaps the most compelling development in the last 12 months though is that increasingly, CCS is the stand out technology to genuinely deliver a just transition for many fossil fuel-based communities. Dealing with the associated emissions for extracting, processing and using fossil fuels and perhaps more significantly
developing the new energy economy based on clean fuels like hydrogen, is dependent on CCS deployment. And as CCS is deployed, many communities that otherwise may have a less prosperous outlook in a carbon-constrained world become a positive part of the transition.
But we have much more work to do. Few clean energy technologies are on track to be deployed at the scale required to meet the Paris climate targets. CCS is resurgent but still lagging while emissions again rose in the past year. Now is the time to rally for greater policy support and for capital to be allocated to build on the positive CCS progress of the past two years.
2

LORD NICHOLAS STERNIG Patel Professor of Economics & Government, London School of Economics Chair, Grantham Research Institute
The effects of climate change are already raging across the world with wild fires, droughts, and rising sea levels. Bad as it is already, we risk far worse. Failure to mitigate climate change is deeply dangerous; we owe it to future generations to tackle this global and urgent problem. The faster we can reduce emissions in the near-term, the better our chance of preventing the worst impacts of climate change.
For this, we need to change the way we think about this global challenge. Turning towards a new form of sustainable economic growth and looking at investment in innovation would also yield strong societal and economic returns. The Global Commission on the Economy and Climate has shown that bold climate action could deliver returns of trillions of dollars per year in the period to 2030 and create more than 60 million good jobs.
We need to invest in all opportunities for emissions reductions while radically changing how we work, live, and consume. Living and consuming more efficiently is the first step, along with a massive growth in renewable and clean energy. Yet, we must not forget that we will need to completely transform the economy for it to become carbon neutral and deploy a portfolio of measures and technology solutions to accelerate the clean energy transition.
1.0 Introduction CCS Ambassador
One of the opportunities that we have at hand, carbon capture, use and storage, will play a vital role as indicated by the Intergovernmental Panel on Climate Change’s Report on Global Warming of 1.5 ºC. The diversity of its applications is immense; from direct air capture delivering negative emissions, to the ability to prevent infrastructure emissions lock-ins by abating existing infrastructure in the industrial and power sectors, capturing, using and storing carbon will be a vital instrument in reaching net-zero emissions goals.
As is the case for many abatement options, effective actions and policy to accelerate the deployment of a wide-range of carbon capture use and storage technologies across many sectors of the economy, and especially those that are hard to decarbonise, are urgently needed.
As a society, we have a responsibility towards future generations to mitigate climate change. Investment in mitigation and innovation will undoubtedly offer large returns and great value, while improving our ability to tackle climate change through sustained action. Time is short, but we have in our hands a different model of development. It is the sustainable and inclusive growth story of the 21st century.
3
“ CARBON CAPTURE, USE AND STORAGE, WILL PLAY A VITAL ROLE AS INDICATED BY THE INTERGOVERNMENTAL PANEL ON CLIMATE CHANGE’S REPORT ON GLOBAL WARMING OF 1.5ºC.”
Lord Nicholas Stern IG Patel Professor of Economics & Government, London School of Economics Chair, Grantham Research Institute
4

“ IT’S ABOUT SUPPORTING ALL VIABLE TECHNOLOGIES & IDEAS, INCLUDING CARBON CAPTURE & STORAGE”
Polar explorer
JADE HAMEISTER OAM
Together, we are all part of the human species.
Separating us are just divisions of our own making – such as religious beliefs, borders drawn on maps, concepts of race, money, and gender.
Debates about saving our planet from global warming are misplaced.
Planet Earth doesn’t need saving - it will recover long after we have wiped ourselves and all other life out – this is about the survival of the human species.
But… what if? What if we could focus more on this great threat to humanity and why we need to work together, rather than focus on what spreads us apart?
If we can make this shift, we could learn to relate as one great tribe of humans, learn to respect our common home, and ultimately save the future of all life on Earth, including our own.
At just 18, I am no expert on the science of global warming, but I am likely the only person on the planet of my generation to have the privilege of first-hand experience in Earth’s three main polar regions. Journeys that saw me cover a total of around 1,300km in 80 days.
I now feel a deep emotional connection with our planet Earth and a responsibility to play my part in the protection of these incredibly beautiful and fragile environments.
My polar expeditions confirmed for me that global warming is an undeniable truth.
That is why I call on the political and business leaders to stop arguing and start taking massive action. It’s not about choosing the best technology – it’s about supporting ALL viable technologies and ideas, including carbon capture and storage – that together create a web that seeks to hold global temperature rise to under two degrees Celsius (if that is even still possible).
My generation will inherit this great threat of global warming and the political decisions of today’s leaders. Please give us a platform from which we can still achieve a positive outcome.
I am confident that my generation will have the technology, the passion and the unified movement to make a meaningful difference, but it is up to current world leaders to make sure we still have a fighting chance.
Please, give us that fighting chance.
1.0 CCS Ambassador
5

“ IT’S ABOUT SUPPORTING ALL VIABLE TECHNOLOGIES & IDEAS, INCLUDING CARBON CAPTURE & STORAGE”
Jade Hameister OAM Polar explorer
6

BILL GATES
1.0 CCS Ambassador
I often hear that lower cost solar and wind power along with the emerging breakthroughs in energy storage mean that these sources will be enough to get us to a carbon-free power grid. But because the world must balance the need to eliminate carbon emissions with economic growth, we should also consider what solutions would be most affordable. A recent study from researchers at MIT found that supporting renewable energy with a mix of clean energy solutions— including nuclear and carbon capture and storage (CCS)— would make carbon-free electricity up to 62 percent cheaper than using renewables alone.
Another way we can get zero-carbon electricity is carbon capture, utilisation, and storage, which separates and permanently stores CO2 pollution from an energy plant’s exhaust to keep it out of the atmosphere. This technology is especially important in places where there isn’t good renewable energy potential, or where it would be too costly to retire and replace existing power plants.
“ ANOTHER WAY WE CAN GET ZERO-CARBON ELECTRICITY IS CARBON CAPTURE, UTILISATION, & STORAGE”
7

“ ANOTHER WAY WE CAN GET ZERO-CARBON ELECTRICITY IS CARBON CAPTURE, UTILISATION, & STORAGE”Bill Gates GatesNotes.com, May 14, 2019
8

9
2.0 MEETING THE CLIMATE CHALLENGE: THE NEED FOR CCS
1.0 INTRODUCTION1.1 About Global CCS Institute1.2 About the Report1.3 Acronyms1.4 CEO Foreword
2.0 MEETING THE CLIMATE CHALLENGE: THE NEED FOR CCS
3.0 GLOBAL STATUS OF CCS3.1 Global CCS Facilities Update3.2 Policy Levers for Accelerating Deployment 3.3 Global CO2 Storage Overview3.4 Legal and Regulatory Overview
4.0 REGIONAL OVERVIEWS4.1 International Climate Policy Overview 4.2 Americas4.3 Europe4.4 Middle East and Central Asia4.5 Asia Pacific
5.0 CCS DEVELOPMENT: TECHNOLOGY AND APPLICATIONS
5.1 Natural Gas5.2 Hydrogen5.3 CCS in the Power Sector5.4 Bioenergy with Carbon Capture
and Storage (BECCS)5.5 Direct Air Capture (DAC)5.6 CO2 Utilisation5.7 CCS Innovation5.8 Industry’s Transition to a Net-zero Future
6.0 APPENDICES
7.0 REFERENCES

CCS IS VITAL TO ACHIEVE CLIMATE CHANGE TARGETS
Despite both the urgent need for action to mitigate climate change, and the rapid take-up of renewable energy over the past 20 years, progress in curbing emissions has been slow. Approximately 80 per cent of primary energy is supplied by fossil fuels, the same as 50 years ago. Global energy-related CO2 emissions are on an upward trend again—having temporarily stabilised for a few years, they rose by 1.7 per cent in 20181. Government commitments do not bridge the gap between current emissions and the remaining global carbon budget.
Analysis by the Intergovernmental Panel on Climate Change (IPCC) and International Energy Agency (IEA) has consistently shown that CCS is an essential part of the lowest cost path towards meeting climate targets. The IPCC's Fifth Annual Assessment Report (AR5) showed that excluding CCS from the portfolio of technologies used to reduce emissions would lead to a doubling in cost - the largest cost increase from the exclusion of any technology.
The Special Report on Global warming of 1.5°C2 (IPCC SR15) reinforced the important role of CCS in avoiding dangerous climate change. It underlined that reducing emissions alone is no longer enough. To limit global temperature rises to 1.5°C above pre-industrial levels, the world must reach net zero emissions by around 2050. Most modelling scenarios show that this will require significant deployment of negative emissions technologies. Bioenergy with CCS (BECCS) is one of the few available that can deliver to the necessary scale.
As the IPCC SR15 report outlined, it is possible to construct emissions abatement models that limit global warming to 1.5 without CCS, but extensive near-term reductions in energy demand would be necessary. To accommodate rising population and income, extreme societal and behavioural changes would be necessary. Experience to date suggests such radical changes are extremely challenging and highly improbable.
2.0 Meeting the Climate Challenge: The Need for CCS
11
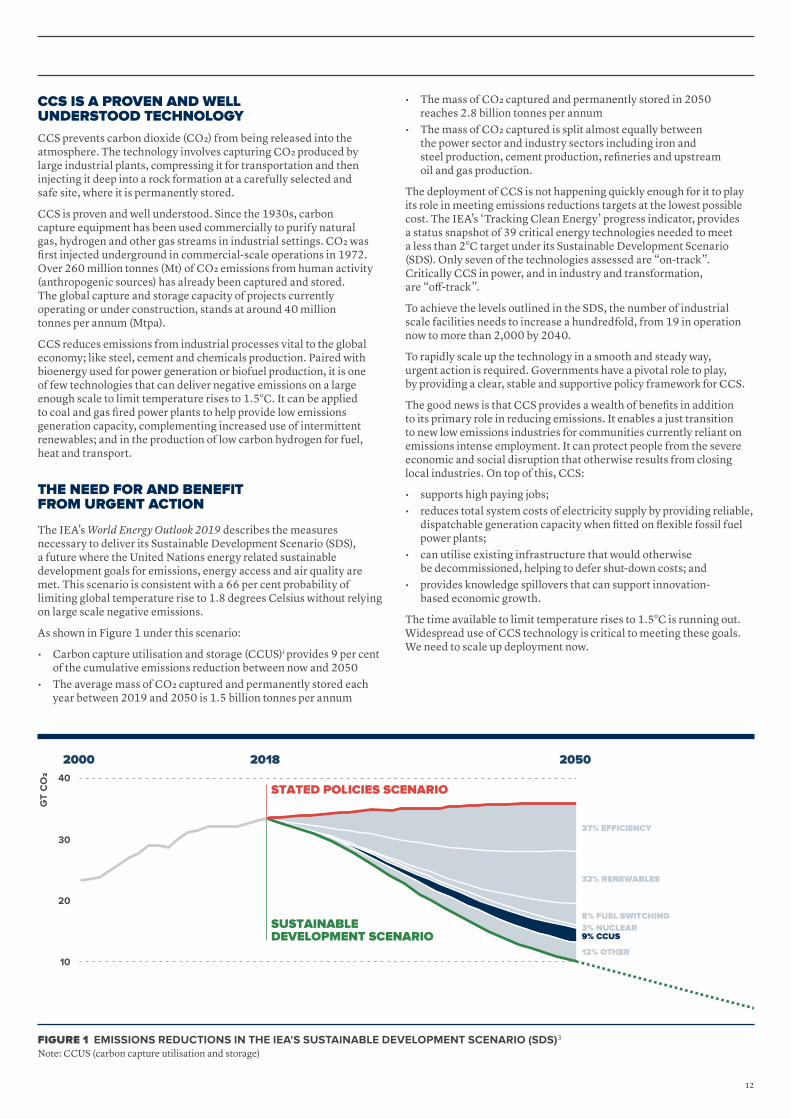
FIGURE 1 EMISSIONS REDUCTIONS IN THE IEA'S SUSTAINABLE DEVELOPMENT SCENARIO (SDS)3
Note: CCUS (carbon capture utilisation and storage)
CCS IS A PROVEN AND WELL UNDERSTOOD TECHNOLOGY
CCS prevents carbon dioxide (CO2) from being released into the atmosphere. The technology involves capturing CO2 produced by large industrial plants, compressing it for transportation and then injecting it deep into a rock formation at a carefully selected and safe site, where it is permanently stored.
CCS is proven and well understood. Since the 1930s, carbon capture equipment has been used commercially to purify natural gas, hydrogen and other gas streams in industrial settings. CO2 was first injected underground in commercial-scale operations in 1972. Over 260 million tonnes (Mt) of CO2 emissions from human activity (anthropogenic sources) has already been captured and stored. The global capture and storage capacity of projects currently operating or under construction, stands at around 40 million tonnes per annum (Mtpa).
CCS reduces emissions from industrial processes vital to the global economy; like steel, cement and chemicals production. Paired with bioenergy used for power generation or biofuel production, it is one of few technologies that can deliver negative emissions on a large enough scale to limit temperature rises to 1.5°C. It can be applied to coal and gas fired power plants to help provide low emissions generation capacity, complementing increased use of intermittent renewables; and in the production of low carbon hydrogen for fuel, heat and transport.
THE NEED FOR AND BENEFIT FROM URGENT ACTION
The IEA’s World Energy Outlook 2019 describes the measures necessary to deliver its Sustainable Development Scenario (SDS), a future where the United Nations energy related sustainable development goals for emissions, energy access and air quality are met. This scenario is consistent with a 66 per cent probability of limiting global temperature rise to 1.8 degrees Celsius without relying on large scale negative emissions.
As shown in Figure 1 under this scenario:
• Carbon capture utilisation and storage (CCUS)i provides 9 per cent of the cumulative emissions reduction between now and 2050
• The average mass of CO2 captured and permanently stored each year between 2019 and 2050 is 1.5 billion tonnes per annum
• The mass of CO2 captured and permanently stored in 2050 reaches 2.8 billion tonnes per annum
• The mass of CO2 captured is split almost equally between the power sector and industry sectors including iron and steel production, cement production, refineries and upstream oil and gas production.
The deployment of CCS is not happening quickly enough for it to play its role in meeting emissions reductions targets at the lowest possible cost. The IEA’s ‘Tracking Clean Energy’ progress indicator, provides a status snapshot of 39 critical energy technologies needed to meet a less than 2°C target under its Sustainable Development Scenario (SDS). Only seven of the technologies assessed are “on-track”. Critically CCS in power, and in industry and transformation, are “off-track”.
To achieve the levels outlined in the SDS, the number of industrial scale facilities needs to increase a hundredfold, from 19 in operation now to more than 2,000 by 2040.
To rapidly scale up the technology in a smooth and steady way, urgent action is required. Governments have a pivotal role to play, by providing a clear, stable and supportive policy framework for CCS.
The good news is that CCS provides a wealth of benefits in addition to its primary role in reducing emissions. It enables a just transition to new low emissions industries for communities currently reliant on emissions intense employment. It can protect people from the severe economic and social disruption that otherwise results from closing local industries. On top of this, CCS:
• supports high paying jobs;• reduces total system costs of electricity supply by providing reliable,
dispatchable generation capacity when fitted on flexible fossil fuel power plants;
• can utilise existing infrastructure that would otherwise be decommissioned, helping to defer shut-down costs; and
• provides knowledge spillovers that can support innovation- based economic growth.
The time available to limit temperature rises to 1.5°C is running out. Widespread use of CCS technology is critical to meeting these goals. We need to scale up deployment now.
8% FUEL SWITCHING
GT
CO2 40
30
20
10
9% CCUS
37% EFFICIENCY
32% RENEWABLES
3% NUCLEAR
12% OTHER
STATED POLICIES SCENARIO
SUSTAINABLEDEVELOPMENT SCENARIO
2000 2018 2050
12

PROFESSOR SALLY BENSONCo-Director, Precourt Institute for Energy; Director, Global Climate & Energy Project; Professor, Energy Resources Engineering Department; Senior Fellow, Precourt Institute for Energy Stanford University
2.0 CCS Ambassador
CLOSING THE AMBITION GAP AND GETTING ON WITH THE INEVITABLE
When I was a teenager growing up in Northern California, we had a big wildfire every 10 years or so. Shockingly, thousands of homes would be lost and many more people displaced. Now huge wildfires happen every year. As I write this, one hundred kilometers north, 77,000 acres are burning, casting a haze of smoke across the state. Those once-rare and extreme events like wildfires, floods, droughts, extreme heat, and intense hurricanes happen much more frequently now, with enormous societal cost and personal suffering. Climate change is no longer abstract or something we need to worry about in the future. I am worried now.
Over the last 20 years, the role of carbon capture and storage has evolved from “nice to have,” to “necessary,” and now, CCUS is inevitable. We need Gt* scale CCUS now. We are using up our carbon budget so quickly, that at some point in the not-to-distant future we are likely to begin scrubbing carbon dioxide from the atmosphere. But this is much less efficient than capturing CO2 directly from point sources. So why aren’t we doing more to scale up CCUS from point sources when we could stop these emissions now?
Of course, there are many reasons why we aren’t doing more. At the top of the list is lack of the carrots or sticks that would motivate action and justify the investment. But perhaps even more important than this, we have an ambition gap between the rate that CCUS is growing today – about 10 per cent a year, compared to the rate needed to reach a Gt/year by 2040. If we could just double scaleup rate to 20 per cent per year, and sustain that to 2040, bingo, we reach 1 Gt/year by 2040. Let’s do it.
*Billion tons of CO2 captured and stored per annum
13
Professor Sally Benson Co-Director, Precourt Institute for Energy; Director, Global Climate & Energy Project; Professor, Energy Resources Engineering Department; Senior Fellow, Precourt Institute for Energy Stanford University
“ OVER THE LAST 20 YEARS, THE ROLE OF CARBON CAPTURE AND STORAGE HAS EVOLVED FROM ‘NICE TO HAVE,’ TO ‘NECESSARY,’ AND NOW, CCUS IS INEVITABLE.”
14

15
3.0 GLOBAL STATUS OF CCS

1.0 INTRODUCTION1.1 About Global CCS Institute1.2 About the Report1.3 Acronyms1.4 CEO Foreword
2.0 MEETING THE CLIMATE CHALLENGE: THE NEED FOR CCS
3.0 GLOBAL STATUS OF CCS3.1 Global CCS Facilities Update3.2 Policy Levers for Accelerating Deployment 3.3 Global CO2 Storage Overview3.4 Legal and Regulatory Overview
4.0 REGIONAL OVERVIEWS4.1 International Climate Policy Overview 4.2 Americas4.3 Europe4.4 Middle East and Central Asia4.5 Asia Pacific
5.0 CCS DEVELOPMENT: TECHNOLOGY AND APPLICATIONS
5.1 Natural Gas5.2 Hydrogen5.3 CCS in the Power Sector5.4 Bioenergy with Carbon Capture
and Storage (BECCS)5.5 Direct Air Capture (DAC)5.6 CO2 Utilisation5.7 CCS Innovation5.8 Industry’s Transition to a Net-zero Future
6.0 APPENDICES
7.0 REFERENCES

3.1 GLOBAL CCS FACILITIES UPDATE
FIGURE 2 CURRENT CCS FACILITIES AROUND THE WORLDii
3.0 Global Status of CCS 3.1 Global CCS Facilities Update
PILOT & DEMOSTRATION SCALE FACILITY IN OPERATION & CONSTRUCTION
PILOT & DEMOSTRATION SCALE FACILITY IN ADVANCED DEVELOPMENT
PILOT & DEMOSTRATION SCALEFACILITY COMPLETEDLARGE SCALE CCS FACILITIES COMPLETED
LARGE SCALE CCS FACILITIESIN ADVANCED DEVELOPMENT
LARGE SCALE CCS FACILITIES IN OPERATION & CONSTRUCTION
TEST CENTRELARGE SCALE = >400,000 TONNES OF CO2CAPTURED PER ANNUM
17

Over the past year the global development and deployment of CCS continued to gather pace. The world map on these pages shows the growing presence of CCS around the globe. In 2019, the number of large-scale CCS facilities increased to 514.
Of these:
• 19 are operating; • four are under construction; • 10 are in advanced development using a dedicated front
end engineering design (FEED) approach; and• 18 are in early development.
Right now, those in operation and construction have the capacity to capture and permanently store around 40 million tonnes of CO2 every year. This is expected to increase by about one million tonnes in the next 12-18 months. In addition, there are 39 pilot and demonstration scale CCS facilities (operating or about to be commissioned) and nine CCS technology test centres.
MAJOR STRIDES IN 2019 FOR CCS
In 2019, more than 25 million tonnes of CO2 from the power and industrial sectors was permanently stored using CCS. Two new facilities commenced operation and others reported the achievement of significant cumulative CO2 storage milestones:
• CO2 injection commenced at the Gorgon natural gas processing plant on Barrow Island off the coast of Western Australia in August 2019. This will be the world’s largest dedicated geological CO2 storage facility when it ramps up to full capacity storing up to 4.0 Mtpa CO2 a year5.
• The Alberta Carbon Trunk Line (ACTL), a 240-kilometre CO2 pipeline, expected to come online in 2020, will offer CO2 transport services to industry in Alberta, Canada. North West Redwater Partnership’s Sturgeon refinery and the Agrium fertiliser plant will jointly supply around 1.6 Mtpa of CO2 via the pipeline to EOR operations in central Alberta.
• 100 million tonnes – Shute Creek gas processing plant in Wyoming US, with a 7 Mtpa CO2 capture capacity, has cumulatively captured more than 100 million tonnes of CO2 from natural gas processing operations for use in enhanced oil recovery6.
• 38 million tonnes – Great Plains Synfuels plant in North Dakota US, captures CO2 from the coal (lignite) gasification process, producing syngas (hydrogen and carbon monoxide) for energy use and chemical production. It has delivered around 38 million tonnes of CO2 for EOR in the Weyburn and Midale fields in Canada since it commenced operation since 20007.
• 22 million tonnes – On the Norwegian continental shelf, Sleipner CO2 storage and Snøhvit CO2 storage facilities have cumulatively captured and stored around 22 million tonnes of CO28. Sleipner was the world's first large scale dedicated CO2 geological storage facility, storing CO2 from natural gas processing since 1996.
• 10 million tonnes – Petrobras Santos Basin CO2-EOR facility in offshore Brazil, reached a milestone of 10 million tonnes of CO2 captured and reinjected in the natural gas processing industry9. Petrobras is continually expanding the capacity of its floating production storage and offloading (FPSO) units, aiming to cumulatively reinject more than 40 million tonnes of CO2 by 2025.
PILOT & DEMOSTRATION SCALE FACILITY IN OPERATION & CONSTRUCTION
PILOT & DEMOSTRATION SCALE FACILITY IN ADVANCED DEVELOPMENT
PILOT & DEMOSTRATION SCALEFACILITY COMPLETEDLARGE SCALE CCS FACILITIES COMPLETED
LARGE SCALE CCS FACILITIESIN ADVANCED DEVELOPMENT
LARGE SCALE CCS FACILITIES IN OPERATION & CONSTRUCTION
TEST CENTRELARGE SCALE = >400,000 TONNES OF CO2CAPTURED PER ANNUM
18

Abu Dhabi Phase 2 natural gas processing plant Abu Dhabi National Oil Company (ADNOC) is developing its second CCUS facility in the United Arab Emirates. It will capture 1.9 to 2.3 Mtpa of CO2 from its gas processing plant for EOR. Both the Abu Dhabi Phase 1 (CO2 capture from the Emirates Steel Industries steel plant) and Abu Dhabi Phase 2 facilities will store CO2 in the same reservoir.
Wabash CO2 sequestration Wabash Valley Resources LLC aims to develop an ammonia plant with near-zero CO2 emissions using a repurposed integrated gasification combined cycle (IGCC) plant in Indiana, USA. The facility will capture 1.5 to 1.75 Mtpa CO2 for dedicated geological storage in the Wabash CarbonSAFE CO2 storage hub.
Project Tundra The Minnkota Power Cooperative is planning the retrofit of a 3.1 to 3.6 Mtpa CO2 capture plant to the Milton R. Young coal-fired power station in North Dakota USA. Carbon dioxide will be captured from Unit 2 of the power station which generates 455 megawatts of electric (MWe). They are initially targeting dedicated geological storage sites. The North Dakota CarbonSAFE Storage Hubiii is studying the future potential for the utilisation of CO2 from this facility for EOR.
• 5 million tonnes – Air Products’ carbon capture plant on hydrogen in Port Arthur US, has mitigated more than 5 million tonnes of CO2 by coupling steam methane reforming (SMR) with CCS and has been in operation since 201310.
• 4 million tonnes – The Quest CCS facility in Canada, operating since the end of 2015, has been capturing CO2 from the SMR process for hydrogen production. Shell Canada announced that 4 million tonnes of CO2 had been captured and safely stored, ahead of schedule11.
• 3 million tonnes – Boundary Dam CCS, the first large-scale CCS facility in power generation, for Boundary Dam Unit 3 in Saskatchewan, Canada has been in operation since the end of 2014. The facility passed 3 million tonnes of CO2 captured in 201912.
Investment in CCS is slowly gathering momentum. Figure 3 (above) shows CCS growth planned for the next five years and beyond.
Facilities that entered the advanced developmentiii stage for the first time in 2019 are summarised in the following paragraphs:
FIGURE 3 POWER AND INDUSTRIAL APPLICATIONS OF LARGE-SCALE CCS FACILITIES IN OPERATION, UNDER CONSTRUCTION AND IN ADVANCED DEVELOPMENT
* Size of the circle is proportional to the capture capacity of the facility. Indicates the primary industry type of the facility among various options.
3.0 Global Status of CCS 3.1 Global CCS Facilities Update
APPLICATIONS IN OPERATION 2016 2017 2018 2019 2020 2021 2022 2023 2024 2025+
WASTE INCINERATION
CEMENT PRODUCTION
CHEMICAL PRODUCTION
IRON & STEEL PRODUCTION
HYDROGEN PRODUCTION
FERTISLISER PRODUCTION
NATURAL GAS PROCESSING
POWER GENERATION
NORWAY FULL CHAIN
ILLINOIS INDUSTRIAL
INTEGRATED MID-CONTINENT HUBYANCHANG
LAKE CHARLES
METHANOLSINOPEC QILU
ABU DHABI PHASE 1
QUEST
TERRELL (FORMERLY VAL VERDE)
SHUTE CREEK
ABU DHABI PHASE 2
BOUNDARY DAM
UTHMANIYAH GORGON
CNPC JILIN
SLEIPNER
SNØHVIT
LOST CABIN
PETROBRAS PRE-SALT
ENID FERTILISER ACTL AGRIUMCOFFFEYVILLE
CENTURY PLANT
PETRA NOVA
CARBONSAFE ILLINOIS HUB*
DRY FORK
PROJECT TUNDRA
ACTL STURGEON PORTHOS
WABASH
CARBONNET*GREAT PLAINS
AIR PRODUCTS
IN OPERATION IN CONSTRUCTION ADVANCED DEVELOPMENT1 Mtpa CO2 CIRCLE AREA PROPORTIONATE TO CAPACITY=
19

Dry Fork integrated commercial CCS The Basin Electric Power Cooperative aims to capture 3.0 Mtpa CO2 from the 385 MW Dry Fork coal-fired power station in Wyoming, USA. They are targeting adjacent geological storage formations currently being studied by Wyoming CarbonSAFE13. The Cooperative is also considering EOR as a potential CO2 storage pathway, utilising nearby CO2 pipeline networks and EOR operations.
CarbonSAFE Illinois hub – Macon Countyiii Building on learnings from Illinois Industrial CCS facility in the Archer Daniels Midland Ethanol plant, this project seeks to establish a 50+ million tonne commercial geological storage hub in Illinois USA. Adjacent power plants, such as Prairie State Generation (816 MWe, coal fired power plant, 10 Mtpa CO2) which has been awarded a full-scale FEED study14, and regional ethanol plants are potential CO2 sources.
Integrated mid – continent stacked carbon storage hub Storage infrastructure would be established in southwestern Nebraska and southwestern Kansas to enable collection of CO2 from ethanol plants, power plants and refineries in the region. Ethanol plants producing 1.9-5 Mtpa CO2 in the region could utilise this infrastructure. The Nebraska Public Power District’s Gerald Gentleman Station (coal fired) is another potential source of CO2 for this storage hub. A FEED study on the retrofit of Ion Engineering’s non-aqueous ICE-21 solvent capture technology to the Gerald Gentleman Station is underway15.
THE CCS PIPELINE IS REPLENISHING, BUT NOT FAST ENOUGH
Figure 4 (below) shows how the CCS facility pipeline has developed over the past decade. It shows a continuous decrease in the number of facilities in the pipeline between 2010 and 2017 followed by year-on-year increases in 2018 and 2019. There are many possible explanations for this pattern and it is not possible to be definitive about the causes. However it is likely that the Global Financial Crisis (GFC) which started in mid 2007 and ran through 2009 contributed to the observed decline. The uncertainty in global markets and the economic downturn that accompanied the GFC focussed governments’ attention on short term economic recovery and focussed the private sector on survival. Action to mitigate climate change fell down the list of priorities and both public policy and private capital responded in-kind. Investment in CCS, which requires strong policy and significant capital, subsequently retreated. If data for 2007 to 2009 showed a peak in the project pipeline, that would lend weight to this hypothesis. However, this period was prior to the 2009 establishment of the Institute and the data therefore is unavailable.
The CCS industry has been regaining momentum since 2017 and there are roughly four times as many large scale CCS facilities operating today as there was in 2010. A number of factors have probably driven the increase in CCS project development observed in 2018 and 2019. The 2015 Paris Agreement established a clear level of ambition to limit global warming to well below 2°C and pursuing efforts to limit [it] to 1.5°C. This was supported by almost every nation of the world. This agreement refocussed governments, the private sector and civil society on climate mitigation. This has supported examples of stronger climate policy from government (e.g. legislating net-zero emission targets), greater pressure from shareholders on
FIGURE 4 PIPELINE OF LARGE-SCALE CCS FACILITIES FROM 2010 TO 2019: CO2 CAPTURE AND STORAGE CAPACITY
180
160
140
120
100
80
60
40
20
02010 2011 2012 2013 2014 2015 2016 2017 2018 2019
CO
² C
AP
TU
RE
AN
D S
TO
RA
GE
CA
PA
CIT
Y P
ER
YE
AR
(M
tpa
)
IN OPERATION IN CONSTRUCTION ADVANCED DEVELOPMENT EARLY DEVELOPMENT
20

More information about some of these hubs and clusters:• Petrobras Santos Basin CCS network was the first “CCS hub and
cluster” in operation. It has a unique set up with 10 FPSOs anchored in the Santos Basin off the coast of Rio de Janeiro, Brazil. The captured CO2 is directly injected into the Lula, Sapinhoá and Lapa oil fields for EOR.
• Supported by CAD485 million from the Alberta Government, the ACTL will transport up to 14.6 Mtpa CO2 from Alberta’s Industrial Heartland for CO2 emission reduction. This is in addition to CO2 transport from the Sturgeon refinery and Agrium fertiliser plant.
• Northern Lights is an open-access CO2 transport and storage hub, seeking to provide capacity for large CO2 volumes across Europe21. This will move the operation beyond the current Norway full chain CCS facility from the Norcem and Fortum capture sites.
• Six of eight new facilities which emerged in the US are part of the United States Department of Energy’s Carbon Storage Assurance Facility Enterprise (CarbonSAFE) Initiative. This is focused on the development of a geologic storage complex for 50 plus million tonnes of CO2 from industrial sources.
• CarbonNet is a CO2 transport and storage hub supported by the Victorian and Australian Governments. It will provide CO2 transport and storage services to potential capture projects in Australia’s Latrobe Valley. The Hydrogen Energy Supply Chain (HESC) project is constructing a pilot hydrogen production plant via coal gasification and will demonstrate the transport of hydrogen by ship to Japan. A decision on investment on a commercial hydrogen production plant with CCS is expected around 2025. If it proceeds, this plant could be the first customer of the CarbonNet CO2 hub.
• Net Zero Teesside in the UK is a CO2 transport and storage hub for the Tees Valley.
• Other CCS hubs and clusters supported as Projects of Common Interest include Acorn Full Scale CCS, Ervia Cork, the Port of Rotterdam CCUS Backbone Initiative (PORTHOS) and the Amsterdam IJmuiden-CO2 Transport Hub and Offshore Storage (ATHOS).
• The Net Zero Teesside, Northern Lights, PORTHOS, Xinjiang Jungger CCUS hub and the Gulf of Mexico CCUS hubs have been selected as kickstarters for the Oil and Gas Climate Initiative’s large-scale investment in CCS hubs and clusters18.
Further details about hubs and clusters are discussed in Section 4.0 of this report.
publically listed companies to reduce emissions, and accelerated the movement of capital away from high emissions assets to low emissions assets. The net result has been a more thorough analysis of how to deliver significant emission reductions necessary to achieve ambitious climate targets by governments, and an increased sense of urgency in the private sector to develop strategies to insulate themselves from future climate-policy risk. In both cases, CCS emerges as an essential part of the answer. Add to these drivers the significant reduction in the cost of capture observed over the past decade, and four years after the Paris Agreement, the CCS pipeline is repleneshing.
The capture capacity of operating large-scale CCS facilities has increased from 31.2 Mtpa in 2017 to 39.2 Mtpa in in 2019. The total capacity of all facilities at all stages of development in the pipeline has increased from 64.5Mtpa from 37 facilities in 2017 to 97.5Mtpa from 51 facilities in 2019. A growing number of these, as well as recently announced projects in the US, New Zealand and Qatariv, that have not yet been added to the CCS pipeline have the potential to form the next global wave of CCS investment in the 2020s. Also significant is the broader application of CCS represented in the new facilities under study. They go beyond the “low hanging fruit” opportunities like natural gas processing, fertiliser and ethanol production to include less developed industries like hydrogen production and bio-energy CCS.
In the coal fired power sector, where the cost of CCS was once considered too expensive, the cost of CO2 capture has reduced by half using only first-generation technology – down from over USD100 per tonne CO2 captured, to around USD45 per tonne. The benefits of learning-by-doing from the first tranche of CCS facilities continues to drive costs down.
Whilst the recent uptick in investment in CCS is encouraging, it is far from sufficient to meet climate targets. If all facilities in the CCS pipeline now were operational in 2040 and no more entered the pipeline, CO2 capture capacity would still be approximately a factor of 20 below what is required. There is an urgent need for stronger government policy to incentivise private sector investment in CCS.
NEXT WAVE OF CCS: HUBS AND CLUSTERS
“Next wave” facilities based around CCS hubs and clusters have featured in 2019. Added to the Global CCS Institute's database in 201616, these facilities take advantage of the fact that many emissions-intensive facilities (both power and industrial) tend to be concentrated in the same areas. Hubs and clusters significantly reduce the unit cost of CO2 storage through economies of scale, and offer commercial synergies that reduce the risk of investment. They can play a strategically important role in climate change mitigation.
Figure 5 (opposite) shows CCS hubs and clusters identified as having made significant developments in 2019, and summarises some of the features they share.
Key characteristics of hubs and clusters:• Multiple industrial point sources of CO2 connected to a CO2
transport and storage network.• Access to large geological storage resources with the capacity to
store CO2 from industrial sources for decades.• Studies of almost all potential hubs and clusters have been
supported by government17. • Economies of scale deliver lower unit-costs for CO2 storage.• Synergies between multiple CO2 sources and the storage operator
reduce cross chain risks and support commercial viability.
Hubs and clusters significantly reduce the unit
cost of CO2 storage through economies of scale, and offer
commercial synergies that reduce the risk of investment.
3.0 Global Status of CCS 3.1 Global CCS Facilities Update
21

FIGURE 5 CCUS HUBS AND CLUSTERS GLOBALLY, WITH SIGNIFICANT DEVELOPMENTS IN 2019
ZERO CARBONHUMBER
Up to 18.3 Mtpa
INTEGRATED MID-CONTINENT STACKEDCARBON STORAGE HUB
1.9 - 19.4 Mtpa
NET ZERO TEESSIDE
0.8 - 6 Mtpa
9
10GULF OF MEXICO CCUS HUB
6.6 - 35 Mtpa
6 ATHOS
1 - 6 Mtpa
ABU DHABI CLUSTER
2.7 - 5 Mtpa
PETROBRAS SANTOSBASIN CCS CLUSTER
9 FPSOs - 3 Mtpa
7
CARBONNET
2 - 5 Mtpa
15
PORTHOS
2 - 5 Mtpa
11NORTH DAKOTA CARBONSAFE
3 - 17 Mtpa
2
CARBONSAFE ILLINOIS MACONCOUNTY
2 - 15 Mtpa
WABASHCARBONSAFE
1.5 - 18 Mtpa
5 NORTHERNLIGHTS
0.8 - 5 Mtpa
8 XINJIANG JUNGGARBASIN CCS HUB
0.2 - 3 Mtpa
14ACTL
1.7 - 14.6 Mtpa
1
STORAGE TYPEINDUSTRY SECTOR
COAL FIRED POWER
NATURAL GAS PROCESSING
FERTILISER PRODUCTION
HYDROGEN PRODUCTION
NATURAL GAS POWER
IRON AND STEEL PRODUCTION
CHEMICAL & PETROCHEMICALPRODUCTION
CEMENT PRODUCTION
WASTE INCINERATION
ETHANOL PRODUCTION
BIOMASS POWER
VARIOUS OPTIONSCONSIDERED
DEEP SALINE FORMATIONS
ENHANCED OIL RECOVERY
DEPLETED OIL AND GASRESERVOIRS
DELIVERY
PIPELINE
SHIP
ROAD
DIRECT INJECTION
1
15
53
6
7
9
8
4
21112
14
13
10
13
4 3
12
22
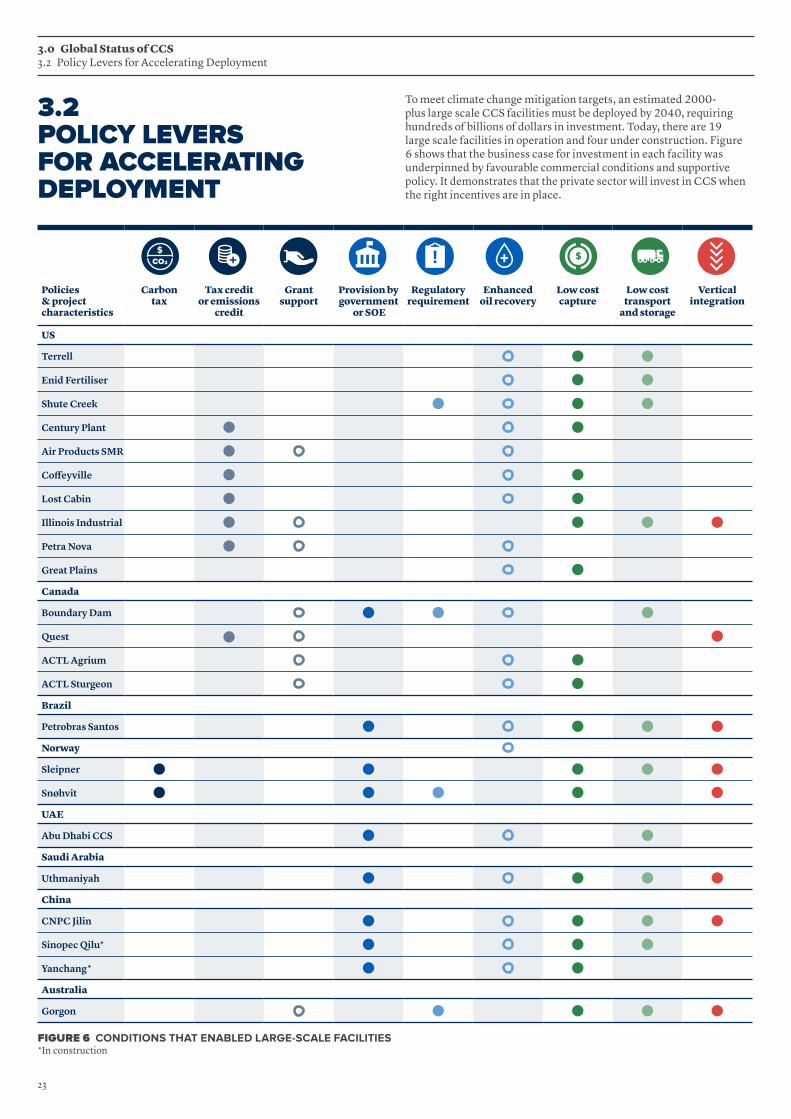
To meet climate change mitigation targets, an estimated 2000-plus large scale CCS facilities must be deployed by 2040, requiring hundreds of billions of dollars in investment. Today, there are 19 large scale facilities in operation and four under construction. Figure 6 shows that the business case for investment in each facility was underpinned by favourable commercial conditions and supportive policy. It demonstrates that the private sector will invest in CCS when the right incentives are in place.
3.0 Global Status of CCS 3.2 Policy Levers for Accelerating Deployment
3.2 POLICY LEVERS FOR ACCELERATING DEPLOYMENT
FIGURE 6 CONDITIONS THAT ENABLED LARGE-SCALE FACILITIES*In construction
Policies & project characteristics
Carbon tax
Tax credit or emissions
credit
Grant support
Provision by government
or SOE
Regulatory requirement
Enhanced oil recovery
Low cost capture
Low cost transport
and storage
Vertical integration
US
Terrell
Enid Fertiliser
Shute Creek
Century Plant
Air Products SMR
Coffeyville
Lost Cabin
Illinois Industrial
Petra Nova
Great Plains
Canada
Boundary Dam
Quest
ACTL Agrium
ACTL Sturgeon
Brazil
Petrobras Santos
Norway
Sleipner
Snøhvit
UAE
Abu Dhabi CCS
Saudi Arabia
Uthmaniyah
China
CNPC Jilin
Sinopec Qilu*
Yanchang*
Australia
Gorgon
23

Like all large infrastructure projects, the development and construction of CCS facilities is capital intensive. This influences the viability of projects and prices out potential investors. However, learning rates drive costs down as successive CCS facilities come online. For example, assuming a conservative learning rate of 8 per cent from Figure 7 (above), as facilities increase from tens to thousands by mid-century, the cost of capturing CO2 falls by approximately half. It is imperative that investors are incentivised as much as possible in the early stages, to accelerate the learning rate and attract new projects.
There is strong evidence that capture costs have already reduced. Figure 8 (below) shows estimated costs from a range of feasibility and front end engineering and design (FEED) studies for coal combustion CCS facilitiesv using mature amine-based capture systems. Two of the projects, Boundary Dam and Petra Nova are operating today. The cost of capture reduced from over USD100 per tonne CO2 at the Boundary Dam facility to below USD65 per tonne CO2 for the Petra Nova facility, some three years later. The most recent studies show capture costs (also using mature amine-based capture systems) for facilities that plan to commence operation in 2024-28, cluster around USD43 per tonne of CO2. New technologies at pilot plant scale promise capture costs around USD33 per tonne of CO2.
FIGURE 8 LEVELISED COST OF CO2 CAPTURE FOR LARGE SCALE POST-COMBUSTION FACILITES AT COAL FIRED POWER PLANTS, INCLUDING PREVIOUSLY STUDIED FACILITIESvii
FIGURE 7 LEARNING RATES FOR DIFFERENT ELECTRICITY PRODUCTION TECHNOLOGIES (THE AVERAGE FOR ONE-FACTOR MODELS)17
Policies & project characteristics
Carbon tax
Tax credit or emissions
credit
Grant support
Provision by government
or SOE
Regulatory requirement
Enhanced oil recovery
Low cost capture
Low cost transport
and storage
Vertical integration
US
Terrell
Enid Fertiliser
Shute Creek
Century Plant
Air Products SMR
Coffeyville
Lost Cabin
Illinois Industrial
Petra Nova
Great Plains
Canada
Boundary Dam
Quest
ACTL Agrium
ACTL Sturgeon
Brazil
Petrobras Santos
Norway
Sleipner
Snøhvit
UAE
Abu Dhabi CCS
Saudi Arabia
Uthmaniyah
China
CNPC Jilin
Sinopec Qilu*
Yanchang*
Australia
Gorgon
CO
ST
OF
CO2
CA
PT
UR
E
(US
$ 2
017
PE
R T
ON
NE
CO2) 140
40
60
80
100
120
202004 2006 2008 2010 2012 2014 2016 2018 2020 2022 2024 2026 2028 2030
PORTO TOLLE PROJECT PIONEER
BETCHATÓW
BOUNDARY DAM
PETRA NOVA
TRAILBLAZERLONGANNETSAN JUAN
SHAND
SURAT HELE
FUELCELL MCFCION C3DCLINDE/BASF OASE
KINGSNORTH
ANTELOPE VALLEY
MASSVLAKTE MOUNTAINEER PROJECT TUNDRA
PREVIOUSLY STUDIED FACILITIES CURRENTLY OPERATING RECENTLY PROPOSED AND NEW FACILITIESFIRST GENERATION CAPTURE TECHNOLOGY LEARNING RATE NEXT GENERATION CAPTURE TECHNOLOGY LEARNING RATE
COAL FIREDPOWER PLANT
GAS FIREDPOWER PLANT
GAS(NGCC)
WIND(ONSHORE)
WIND(OFFSHORE)
SOLARPV
BIOMASSPOWER GEN
AVERAGE LEARNING RATE (% REDUCTION IN COST FOR DOUBLING CAPACITY OR OUTPUT)
0% 5% 10% 15% 20% 25%
11%
23%
12%
12%
14%
15%
8%
24

Figure 9 (below) shows how government policy and confidence in CCS can reduce the cost of debt over time. Initial CCS facilities are developed under high risk conditions, due to the existence of weak policy frameworks and few CCS facilities being in operation, so the cost of debt is at its highest.
As more facilities enter operation, and better policy frameworks evolve, the cost of debt is reduced. Eventually a low risk lending rate, representative of a mature industry, is reached.
To explore further detail on policy priorities for policymakers and how to stimulate investment in CCS, download our 2019 Thought Leadership Report Policy priorities to incentivise large scale deployment of CCS at globalccsinstitute.com
ESG AND DIRECTORS’ DUTIES
A company’s attitude towards environmental, social and corporate governance (ESG) factors, is an increasingly significant consideration for investors, shareholders and the wider public. There is closer scrutiny and reporting of ESG factors that are material to a business’s core activities. While companies are increasingly willing to adopt more sustainable practices, their openness has also been driven by the rise of socially-conscious investment, the concept of the ‘enlightened shareholder’ and increased public activism surrounding environmental, social and governance issues.
In recent years, the ‘environmental’ aspects of corporate governance have increased in importance, with climate change and carbon risk exposure becoming the most pressing considerations. In organisations with a significant CO2 footprint, investors and shareholders are offered detailed information about matters like exposure to climate change impacts and carbon risk, how these will be adapted to, strategies for addressing greenhouse gas and any new commercial opportunities that have been identified to reduce the business impacts.
Reporting against sustainability and environmental performance measures has moved from being largely voluntary to necessary.
The most obvious way to create incentives for investors is to place a material value on CO2. Policymakers can choose from options like tax credits, carbon tax or direct regulation as a condition of approval. The mistaken idea that CCS is too expensive compared to other climate change mitigation technologies is easily dispelled when a low value is placed on carbon. For example, the IEA has estimated that as much as 450 MtCO2 could be captured, utilised and stored globally with a commercial incentive as low as USD40 per tonne of CO2 by deploying CCS on the many low-cost opportunities available19. This value is at the bottom end of the USD40-80 range that the High-Level Commission on Carbon Prices recommended by 2020 to drive transformational change consistent with meeting Paris Agreement targets20, 21.
Compared to mature industries, there is relatively little experience developing commercial CCS facilities. As a consequence, potential investors and financiers apply risk premiums which drive up the cost of private capital (both debt and equity) to a level where investing is difficult. In fact, very few CCS projects have been funded through debt financing because prevailing risks—and perceived risks that arise from banks’ lack of knowledge—make it difficult for them to qualify. Until risks are perceived to be well managed, banks are unwilling to qualify CCS projects for debt financing or offer competitive interest rates to project developers. By working collaboratively with the private sector—which is well placed to manage general project risks such as technical, construction and operational performance risks—governments can play a pivotal role in risk-sharing, enabling private sector investment.
Robust policy frameworks can address market failures that lead to hard-to-reduce risks, such as cross-chain, and long-term liability risks. Government can de-risk investments by taking on risks that cannot be borne by the private sector. While private sector investment in CCS is profit-driven, government is motivated to provide public goods. Government forgoes financial return on CCS investments, in exchange for efficient industry contributions towards emissions targets and a stable climate for constituents. Cross-chain and liability risks are therefore managed through the development of shared transport and storage networks, and robust legal and regulatory frameworks, respectively.
3.0 Global Status of CCS 3.2 Policy Levers for Accelerating Deployment
FIGURE 9 THE EVOLUTION OF ILLUSTRATIVE LENDING RATES WITH POLICY DE-RISKING AND INCREASED DEPLOYMENT RATES FOR CCS FACILITIES
16%
14%
12%
10%
6%
8%
4%
2%
0%
CO
ST
OF
DE
BT
HIGH RISKLENDING
15% POLICY
CONFIDENCE
CONFIDENCE10%
10%
POLICY
MATURE INDUSTRY
IRREDUCIBLERISKS
GENERALPROJECT
GENERALPROJECT
MODERATE RISK LENDING
IRREDUCIBLERISKS
LOW RISKLENDING
25

TASK FORCE CLIMATE-RELATED FINANCIAL DISCLOSURES (TCFD) – DEFINING A UNIVERSAL APPROACH TO DISCLOSING THE IMPACTS OF CLIMATE CHANGE
Formed by the Financial Stability Board (FSB) in 2015, the TCFD sought to develop a framework to help organisations disclose the financial impact of climate change on their operations. The FSB required the disclosures developed by the TCFD, to “promote more informed investment, credit [or lending], and insurance underwriting decisions” and, in turn, “enable stakeholders to understand better the concentrations of carbon-related assets in the financial sector and the financial system’s exposures to climate-related risks.”
The recommendations, published in 2017, should assist companies to identify and disclose key financial information that helps the wider finance and investment community better understand climate-related risks and opportunities. The recommendations focus on four areas:
• governance• strategy• risk management• metrics and targets.
The TCFD’s recommendations have been adopted by many organisations worldwide. In May 2019 Chair, Michael Bloomberg, reported that nearly 800 public and private-sector organizations now support the task force and its work. This includes global financial firms responsible for assets exceeding $118 trillion.
ESG disclosures and investment decisions are increasingly part of financial reporting obligations. Some suggest there is now a clear link between a company’s ESG performance and its ability to leverage capital, including the cost of that capital.
Experience shows that failure to adopt a pragmatic approach to environmental performance and climate change impacts, may result in direct and indirect risks for a company. The burgeoning divestment movement is one example, where the views of shareholders and the wider public have been made very clear to companies perceived as high-risk investments, or as failing to address their carbon footprint.
Potential harm to a company’s reputation is an important consideration, but there may be more significant implications for organisations that don’t meet expectations in regard to climate change mitigation. In recent years, resolutions have been brought against corporations by shareholder groups seeking to ensure that companies adapt their practices to the realities of a carbon constrained future. In some instances, shareholders even brought formal legal proceedings against company directors.
Adopting low-carbon technologies will be an important solution for many organisations seeking to address public and investor-led perceptions of their activities, and meet shareholder challenges.
CCS offers a potent opportunity for those with significant CO2 exposure, to demonstrate their management of the issue and improve how they are regarded. Increasingly, major companies are choosing to invest in CCS technology, demonstrating commitment to CO2 reduction as part of their long-term risk management strategies.
CCS is likely to play an increasingly large role in companies’ ESG commitments.
CCS Ambassador
ZOË KNIGHTManaging Director & Group Head, HSBC Centre of Sustainable Finance
“ WITH THE NEED TO SCALE UP TO MORE THAN 2,000 FACILITIES BY 2040 WE ALSO HAVE NO TIME TO LOSE.”
In order to meet the net-zero emissions ambition, a diverse set of clean energy technologies is required. CCS' crucial role to delivering emissions reductions has been underscored by the IPCC, the UK Committee on Climate Change, the IEA just to name a few.
With the need to scale up to more than 2,000 facilities by 2040 we also have no time to lose. While the flow of funding towards new low-carbon technologies is increasing, it is not happening at the pace that is needed. As with renewables when they were in early stages of deployment, targeted public sector signals of support for the industry would help accelerate the market for CCS.
26

FIGURE 10 GLOBAL STORAGE RESOURCE ESTIMATES (GIGATONNE) AROUND THE WORLD22
Global estimates show there are vast storage resources to meet the highest requirements for CCS to achieve climate change targets.
3.3 GLOBAL CO2 STORAGE OVERVIEW
3.0 Global Status of CCS 3.3 Global CO2 Storage Overview
2,000-21,000
220-410
200-4301,210-4,130
100
2,000
150
47-63
200NORTHSEA
300
140
140
1-5
100
5-305-25
129 23
7
16
2-228
HIGH CONFIDENCE
MEDIUM CONFIDENCE
LOW CONFIDENCE
VERY LOW CONFIDENCE
27

TIME TO FOCUS ON GIGATONNE CO2 STORAGE
To meet climate targets, the IPCC climate pathways model up to 1,200 Gt of CO2 cumulatively stored by 210023. There is high confidence that vast CO2 storage resources are available globally to meet these scenarios. The IEA forecasts that 2.3 Gt of CO224 must be stored each year, by 2060. It means a CCS deployment rate of more than double to that of the growth of the oil industry during the last century25.
To achieve multi-gigatonne annual CO2 storage rates, the world will need to characterise, appraise and develop thousands of individual storage sites. The IEA Greenhouse Gas R&D Programme (IEAGHG)26 estimates that approximately 30-60 storage sites need developing each year until 2050. Adding negative emissions storage, from 2050 and 2,100, that number could double. The good news is that the history of oil and gas shows what can be achieved when there is a business case. According to the IEAGHG:
• 350 gas and oil fields were developed annually in the peak development period (2000-2010)
• since 1940, commercial gas resources were discovered at a rate equal to the required rate of development for CO2 storage resources
• the number of rigs (used to drill for exploration and CO2 injection wells) required to develop CO2 storage sites is only 20 per cent of the total rig count.
Recognising the importance of CCS to meeting emission reduction targets, several countries have implemented initiatives to identify CO2 storage sites:
• The US is identifying a series of sites which could store 50Mt or more of CO2
• Norway and UK both completing significant public databases of CO2 storage formations across the North Sea
• EU nations producing a storage formation-scale atlas• Australia undertaking site-scale evaluations with seismic
and core analysis around the country• Japan completing an offshore drilling campaign to test
CO2 storage formations.
2,000-21,000
220-410
200-4301,210-4,130
100
2,000
150
47-63
200NORTHSEA
300
140
140
1-5
100
5-305-25
129 23
7
16
2-228
28

3.0 Global Status of CCS 3.3 Global CO2 Storage Overview
such as tracers, and geophysical logging tools are also employed. Collectively, these downhole tools can provide high-resolution conformance and verification of the CO2.
The primary driver for surface monitoring is to meet community expectations. In an appropriate well-characterised site, the likelihood of CO2 reaching the surface is diminishingly small. Hence, surface monitoring primarily focuses around boreholes (legacy or operational) that provide the only direct path from the storage formation to the surface. Geochemical analysis measures soil or surface water for elevated CO2 levels. In the offshore, geochemical sampling is also employed, along with bubble detection systems and sonar to identify potential leaks. The automation of sampling is decreasing costs and the physical footprint of monitoring.
During the first wave of CO2 storage operations, risk-assessment based MMV programmes demonstrated to regulators and stakeholders that CO2 storage is predictable and permanent. In many cases, the number of tools operators use to prove conformance and verify the CO2 is gradually being reduced. The cost of MMV is reducing as the community understand the low risk of CO2 storage, and tools and techniques become more sophisticated.
MONITORING IS CRITICAL TO ENSURE THAT COMMUNITY EXPECTATIONS ARE MET
Monitoring, measurement and verification (MMV) play a vital role in ensuring CO2 storage meets operational, regulatory and community expectations. CO2 storage uses MMV technologies and the experience of the oil, gas, and groundwater industries. The key focus of a CO2 MMV programme is tracking the CO2, pressure field, and the surrounding geology around the storage formation. Groundwater and surface monitoring are also common place in most MMV programmes.
Seismic imaging is the most commonly used method to ensure the plume is behaving as expected. With repeated 3D seismic, under certain conditions, a plume can be tracked as it moves through the storage formation. Passive seismic and downhole seismic are increasingly being employed to minimise the footprint and cost of deployment and long-term monitoring.
Pressure monitoring is one of the oldest downhole-based technologies. By measuring the pressure of the formation, an operator can confirm the containment of CO2. Any shift in pressure may indicate a change in conditions. Also, monitoring the pressure of surrounding formations can rapidly detect if the CO2 does move out of the storage formation. Along with pressure monitoring, a suite of geochemical testing,
FIGURE 11 A SCHEMATIC OF SELECT MONITORING TECHNOLOGIES AVAILABLE FOR CO2 STORAGE FACILITIES
ELECTROMAGNETICEM ELECTRICAL RESISTANCE TOMOGRAPHYERT
1.2.1.3/
right column list; height: full page (Layout below).
Page 04
A
Storage environments and technology
O�shoreBoomer/Sparker profilingBubble stream detectionMulti-echo soundingsSidescan sonar
O�shoreSeabottom gas samplingSeawater geochemistrySeabottom seismicSeabottom EM
Electrical Resistance Tomography
Sub-surfaceDownhole fluid chemistryDownhole pressureDownhole temperatureGeophysical logs
Sub-surfaceCross-hole EMCross-hole ERTCross-hole seismicMicroseismicVertical seismic profilingWell gravimetry
AtmosphereAirborne EMAirborne spectralSatellite interferometry
SurfaceEddy covarianceSurface gas fluxSoil gas concentrationsGround water chemistry
Surface2D/3D surface seismicLand EM/ERTSurface gravimetryTiltmeters
2
1
1
2
3
1
2
1
2
1
2
1
2
3
800m
EM ERT Electromagnetic
1. ATMOSPHERE AIRBORNE EM AIRBORNE SPECTRAL SATELLITE INTERFEROMETRY
2. SURFACE EDDY COVARIANCE SURFACE GAS FLUX SOIL GAS CONCENTRATIONS GROUND WATER CHEMISTRY
3. SURFACE 2D/3D SURFACE SEISMIC LAND EM/ERT SURFACE GRAVIMETRY TILTMETERS
1. SUB-SURFACE DOWNHOLE FLUID CHEMISTRY DOWNHOLE PRESSURE DOWNHOLE TEMPERATURE GEOPHYSICS LOGS
2. SUB-SURFACE CROSS-HOLE EM CROSS-HOLE ERT CROSS-HOLE SEISMIC MICROSEISMIC VERTICAL SEISMIC PROFILING WELL GRAVIMETRY
1. OFFSHORE BOOMER/SPARKER PROFILING BUBBLE STREAM DETECTION MULTI-ECHO SOUNDINGS SIDESCAN SONAR
2. OFFSHORE SEABOTTOM GAS SAMPLING SEAWATER GEOCHEMISTRY SEABOTTOM SEISMIC SEABOTTOM EM
1 1 1
22 2
2
29

ENHANCED OIL RECOVERY PRODUCTION PERMANENTLY STORES CO2
Over 260 million tonnes of anthropogenic CO2 has been injected and permanently stored to date—most through enhanced oil recovery (EOR). Increasing oil production this way is a standard, mature and routine global operation. It is important to emphasise that CO2 – EOR is not suitable for every oil field. But where CO2 is suitable to enhance oil recovery the process is as follows:
1. CO2 is injected into the oil field’s rock formations where it behaves as a solvent, swelling the oil and mobilising oil previously trapped in the rock’s pore spaces.
2. A proportion of the CO2 migrates through the formation as a CO2 plume, known as free phase CO2. As more CO2 is exposed to the rock, it dissolves into surrounding brine. Some becomes immovably trapped in the pore spaces—residual trapping. These same trapping mechanisms occur during dedicated storage.
3. A mixture of oil, brine, and other fluids brings the remaining CO2 to the surface. The CO2 is separated from these fluids, compressed and re-injected into the oil field with additional CO2, creating a closed loop with trivial fugitive emissions.
CO2 is the most expensive operational cost of any CO2-EOR facility, so almost every molecule supplied is re-injected. The high cost of CO2 means the gas is monitored at the surface and within the reservoir to ensure optimal use. Ultimately, all the CO2 injected into an oil field for EOR remains trapped in the pore space that originally held the oil and other fluids.
The permanent storage of CO2 through EOR delivers emissions abatement. The IEA estimates that during conventional EOR operations, there is an emissions abatement on a full lifecycle basis. This includes emissions from using the oil produced27. If policy incentives are put in place, industry will store even more CO2 this way, beyond what the optimising process requires.
FIGURE 12 SCHEMATIC OF CO2 EOR AND CO2 TRAPPING MECHANISMS
3.9.2/ Emissions Sources and Mitigation Options in Industry
Full Page width;
Page 05
Purchased CO2Anthropogenic and/orother natural sources
Recycled CO2From production well
Injected CO2
Zone of E�cient Sweep (minimum 1000m)
CO2 storedpermanently
CO2 stored inpore space
Driverwater
MiscibleZone Oil Bank Additional
Oil RecoveryCO2 CO2Water
ZOOMONE
Free PhaseZOOMONE Dissolution Trapping
Caprock Caprock
ZOOMTHREEResidual TrappingZOOM
TWO Mineral TrappingZOOMTHREE
CO2CO2
ZOOMTWO
ZOOMTHREE
Caprock
CO2
CO2
CO2
30

Program Director, Decarbonized Fossil Energy Clean Air Task Force
DEEPIKA NAGABHUSHAN
3.0 Introduction CCS Ambassadors
In the two years since the U.S. Congress passed a milestone CCUS incentive, 45Q tax credit, a number of projects have initiated development. In the same period, an interesting theme has emerged: states and utilities have set themselves goals to have carbon-free electricity.
States such as California and New York have committed to achieving zero-carbon power systems. Utilities that provide over 40 per cent of US electricity have committed to reducing their CO2 emissions between 80 to 100 per cent.
CCUS will not only play an important role in fulfilling above commitments, but also help meeting even bolder goals that will include decarbonizing industrial emissions and leveraging zero-carbon fuels. This creates implications on federal and state governments to enact additional CCUS enabling policies.
First, we need cheaper capture technologies that are faster to build. This requires federal funding to support transformational technology research and development.
Second, we need financial incentives to commercially deploy CCUS. This will lead to multiple technology vendors providing standardized components, reducing custom engineering needs and banks that are familiar enough with CCUS to readily finance projects.
Third, we need to expand the network of CO2 pipelines and storage sites such that CO2 capture projects can easily connect to it, much like a commercial laundromat would connect to the existing water and sewage lines.
Finally, broader climate policies such as procurement mandates, emission caps and energy standards must embrace CCUS, promoting wide-scale deployment.
If we meet these four categories of CCUS policy goals, then we will at least have a chance to meet our mid-century climate goals. That is what is at stake.
“ IF WE MEET THESE FOUR CATEGORIES OF CCUS POLICY GOALS, THEN WE WILL AT LEAST HAVE A CHANCE TO MEET OUR MID-CENTURY CLIMATE GOALS. THAT IS WHAT IS AT STAKE.”
31
Deepika Nagabhushan Program Director, Decarbonized Fossil Energy Clean Air Task Force
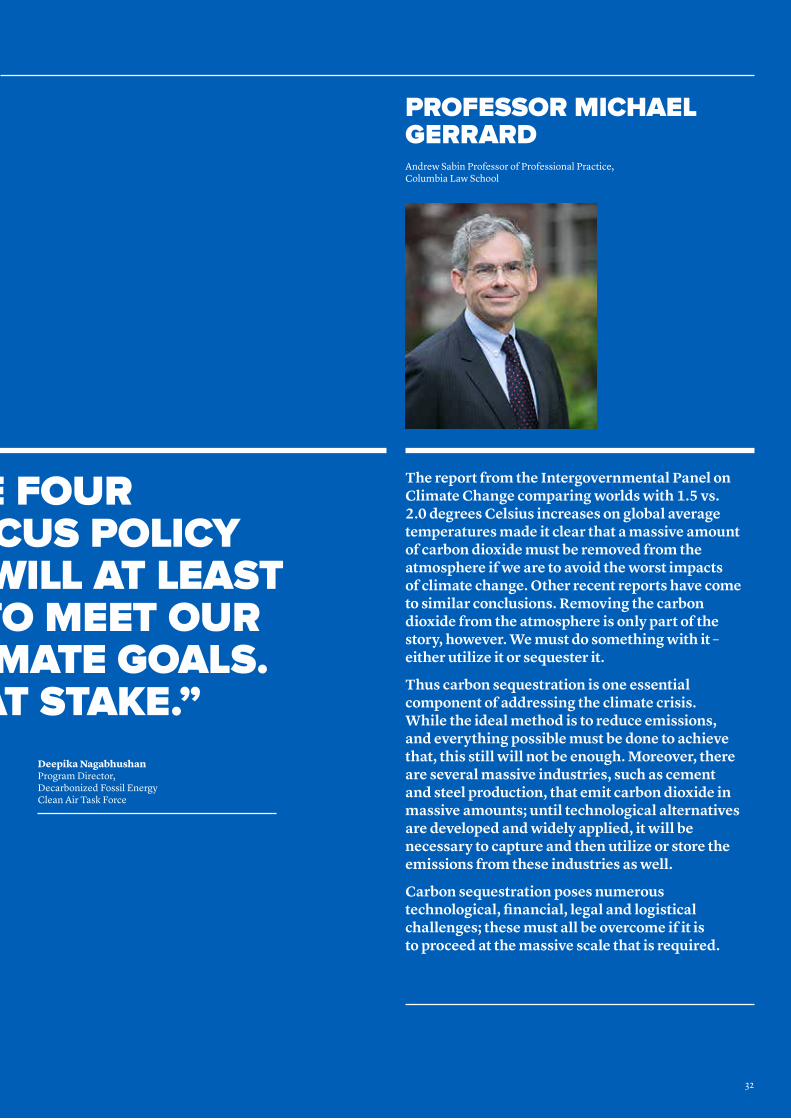
The report from the Intergovernmental Panel on Climate Change comparing worlds with 1.5 vs. 2.0 degrees Celsius increases on global average temperatures made it clear that a massive amount of carbon dioxide must be removed from the atmosphere if we are to avoid the worst impacts of climate change. Other recent reports have come to similar conclusions. Removing the carbon dioxide from the atmosphere is only part of the story, however. We must do something with it – either utilize it or sequester it.
Thus carbon sequestration is one essential component of addressing the climate crisis. While the ideal method is to reduce emissions, and everything possible must be done to achieve that, this still will not be enough. Moreover, there are several massive industries, such as cement and steel production, that emit carbon dioxide in massive amounts; until technological alternatives are developed and widely applied, it will be necessary to capture and then utilize or store the emissions from these industries as well.
Carbon sequestration poses numerous technological, financial, legal and logistical challenges; these must all be overcome if it is to proceed at the massive scale that is required.
Andrew Sabin Professor of Professional Practice, Columbia Law School
PROFESSOR MICHAEL GERRARD
“ IF WE MEET THESE FOUR CATEGORIES OF CCUS POLICY GOALS, THEN WE WILL AT LEAST HAVE A CHANCE TO MEET OUR MID-CENTURY CLIMATE GOALS. THAT IS WHAT IS AT STAKE.”
32

3.0 Global Status of CCS 3.4 Legal and Regulatory Overview
3.4 LEGAL AND REGULATORY OVERVIEWPolicy makers and project proponents agree that practical, well-defined legislation and a strong global regulatory framework are necessary for CCS to reach its potential. The US state of California’s CCS Protocol which accompanies the Low Carbon Fuel Standard (See section 4.2 Regional overview: Americas), has allowed the development of a regulatory model that addresses the requirements of operators, and wider public concerns. Generally though, progress continues to be slow. Several jurisdictions are yet to even examine their legal frameworks and in some existing regimes, movement is limited, continuing the uncertainty for those seeking to invest in CCS.
In recent months, the most notable legal and regulatory development is a proposal to address a key barrier found in international marine agreements. Article 6 of the London Protocol governs the Parties’ export of wastes for dumping in the marine environment. An unintended consequence of this Protocol is that it effectively bans transboundary transportation of CO2 for geological storage. The signatories to the London Protocol passed an amendment to resolve this issue in 2009, however two thirds of the Protocol's contracting parties must ratify the amendment for it to come into force. So far only Norway, United Kingdom, Netherlands, Finland, Estonia and Iran have done so. At the London Convention meeting in early October, the Parties of the London Protocol agreed to allow provisional application of the 2009 amendment of Article 6 to the London Protocol allowing for cross-border transport and export of CO2 for geological storage in sub-seabed geological formations.
Adopting the resolution will not set a precedent and will only be binding upon those Parties that choose to be provisionally bound by the amendment. If the Parties accept the interim solution, there will be legal certainty about cross-border CO2 transport for CCS climate emissions mitigation. Our analysis of potential ‘hot-spots’ for activity within the scope of Article 6, are set out in Figure 13 (opposite). The hot-spots represent locations where transboundary storage is likely because a nation has limited storage potential, but neighbouring jurisdictions can store CO2 on their behalf. As seen from Figure 13, there are multiple opportunities for transboundary shipment of CO2 worldwide, especially in Europe and Asia.
The current status of some forms of CO2 transportation under European legislation, also remains uncertain. Amendments have been made to the European Union Emissions Trading Scheme (EU ETS) Directive to include CO2 capture, transport by pipelines and the geological storage of CO2 within its scope of activities. Covered installations are not required to surrender emissions allowances for the CO2 they have successfully captured for subsequent transportation by pipelines and geological storage, and they can benefit from the EU ETS carbon price. The scope of the Directive, however, applies narrowly to CO2 transport by pipelines and those installations that plan to transport CO2 by other means, e.g. by ships or trucks, would still need to pay for these emissions. The legislation as it currently stands, therefore poses a regulatory barrier to those projects that wish to transport CO2 through different means (e.g. trains and barges).
IS IT TIME TO ADOPT A NEW APPROACH TO LIABILITY?
Liability is often raised by policymakers, regulators and project proponents as a potential barrier to widespread CCS deployment. It continues to be an issue globally, despite the adoption of various detailed CCS-specific frameworks in recent years. Our Thought Leadership Report examined the issue through policy and legislative analysis and interviews with policymakers, regulators, lawyers, project proponents and insurance sector representatives. The report — Lessons and Perceptions: Adopting a Commercial Approach to CCS Liability — concluded that effort must be made to dispel the widely-held view that liability could be a ‘showstopper’ for the technology, and to give the public and private sectors greater confidence that it can be managed. Adopting a more commercial approach will ultimately see a shift in focus from high-level concerns, towards identifying successful practices and models, as well as eliminating the remaining obstacles to more widespread deployment.
The following actions are central to a more commercial approach:
• Clearly determine what is meant by the term liability. While there are potentially a wide range of liabilities applicable to CCS operations throughout the project lifecycle, their impact differs greatly when considered individually.
• Examine options for addressing greenhouse emissions/climate liabilities, which present unique challenges to both operators and regulators alike.
• Consider the role of both government and the private sector in allocating and managing risks and consequently liability. Experience to-date reveals that there are options which may reduce parties’ exposure and support project deployment.
• Renewed engagement with the insurance sector. Timely and more regular engagement will be necessary if insurers are to develop new products to assist operators manage their potential liabilities.
• Ensure a close and robust dialogue, between project proponents and regulators. Experience demonstrates that engagement has assisted both parties in determining the practical requirements of legislation, or where there is ambiguity in its application.
To download our report Lessons and Perceptions: Adopting a Commercial Approach to CCS Liability please visit globalccsinstitute.com
33
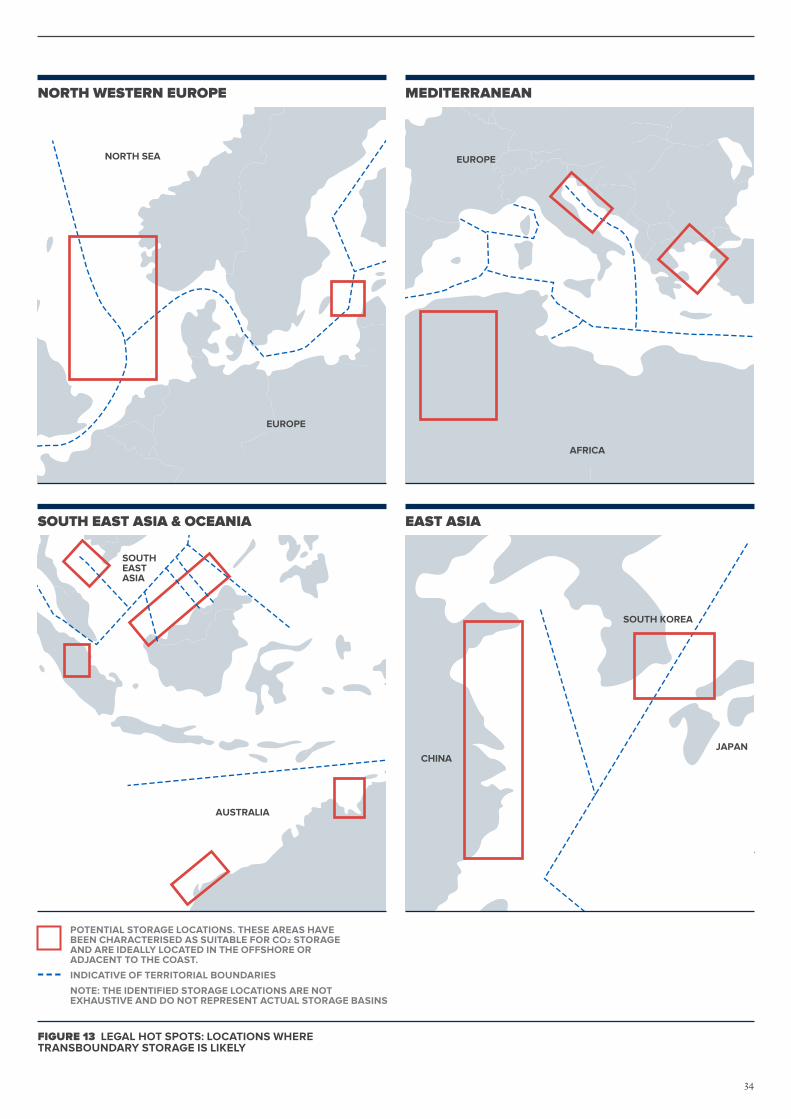
CHINAJAPAN
SOUTH KOREA
FIGURE 13 LEGAL HOT SPOTS: LOCATIONS WHERE TRANSBOUNDARY STORAGE IS LIKELY
SOUTH EAST ASIA & OCEANIA
AUSTRALIA
SOUTHEASTASIA
AFRICA
EUROPE
MEDITERRANEAN
POTENTIAL STORAGE LOCATIONS. THESE AREAS HAVE BEEN CHARACTERISED AS SUITABLE FOR CO2 STORAGE AND ARE IDEALLY LOCATED IN THE OFFSHORE OR ADJACENT TO THE COAST.
NOTE: THE IDENTIFIED STORAGE LOCATIONS ARE NOT EXHAUSTIVE AND DO NOT REPRESENT ACTUAL STORAGE BASINS
INDICATIVE OF TERRITORIAL BOUNDARIES
EAST ASIA
EUROPE
NORTH SEA
NORTH WESTERN EUROPE
34

35
4.0 REGIONAL OVERVIEWS

36
1.0 INTRODUCTION1.1 About Global CCS Institute1.2 About the Report1.3 Acronyms1.4 CEO Foreword
2.0 MEETING THE CLIMATE CHALLENGE: THE NEED FOR CCS
3.0 GLOBAL STATUS OF CCS3.1 Global CCS Facilities Update3.2 Policy Levers for Accelerating Deployment 3.3 Global CO2 Storage Overview3.4 Legal and Regulatory Overview
4.0 REGIONAL OVERVIEWS4.1 International Climate Policy Overview 4.2 Americas4.3 Europe4.4 Middle East and Central Asia4.5 Asia Pacific
5.0 CCS DEVELOPMENT: TECHNOLOGY AND APPLICATIONS
5.1 Natural Gas5.2 Hydrogen5.3 CCS in the Power Sector5.4 Bioenergy with Carbon Capture
and Storage (BECCS)5.5 Direct Air Capture (DAC)5.6 CO2 Utilisation5.7 CCS Innovation5.8 Industry’s Transition to a Net-zero Future
6.0 APPENDICES
7.0 REFERENCES

4.0 Regional Overviews 4.1 International Climate Policy Overview
CARBON, CAPTURE, UTILISATION AND STORAGE (CCUS) RECOGNISED BY G20 LEADERS IN JAPAN
June was a good month in politics for CCUS technologies. The first success was being included in Karuizawa’s G20 Ministerial Meeting on Energy Transitions and Global Environment for Sustainable Growth communiqué, for the first time ever.
And then, the opportunities offered by CCUS technologies for the energy transition were recognised within the official G20 Osaka Leaders’ Declaration, following Japan’s hosting of the event. The admittance of CCUS, as well as hydrogen, into the Declaration marked another first.
The Declaration acknowledged, “the role of all energy sources and technologies in the energy mix and different possible national paths to achieve cleaner energy systems.” It stated that all G20 Leaders: ... recognise opportunities offered by further development of innovative, clean and efficient technologies for energy transitions, including hydrogen as well as, depending on national circumstances, the Carbon Capture, Utilisation and Storage (CCUS), taking note of work on ‘Carbon Recycling’ and ‘Emissions to Value’.
Signatories reaffirmed that they will, “communicate, update or maintain our NDCs, taking into account that further global efforts are needed (by 2020)” and emphasized, “the importance of providing financial resources to assist developing countries with respect to both mitigation and adaptation in accordance with the Paris Agreement.”
The Institute looks forward to more progress before the 2020 G20 summit in Riyadh.
The GCF is an excellent potential source of funding for new CCS projects in developing countries because it allows project developers to access significant levels of funding at more affordable rates than would otherwise be available.
The International Civil Aviation Organization is currently developing a Carbon Offsetting and Reduction Scheme for International Aviation (CORSIA). The scheme aims to stabilise the CO2 emissions of international aviation at 2020 levels. The rulebook is still being written, but airlines will need to offset their emissions by purchasing international credits from other sectors, or taking actions themselves. The CCS community will closely follow this industry because airlines may purchase carbon credits from CCS projects or even develop emission reduction projects of their own.
4.1 SUPRANATIONAL CLIMATE POLICY OVERVIEWThe role of CCS in climate change mitigation is highlighted in the IPCC SR15 report and in a range of recent analyses and studies. Several ongoing international processes are poised to have an impact on CCS’s wider, global deployment. These include the pledges and cooperative approaches under the Paris Agreement, Green Climate Fund (GCF) and carbon offsetting scheme for international aviation.
Under the Paris Agreement, Nationally Determined Contributions (NDCs) are the main opportunity for countries to highlight their commitment to using CCS technology. So far, ten countries (Bahrain, China, Egypt, Iran, Iraq, Malawi, Norway, Saudi Arabia, South Africa and United Arab Emirates) have done so. CCS has near-term relevance28 for an estimated 50-60 countries who are well-positioned to use it over the coming decades. Some of these countries have previously shown strong interest in CCS, but did not include it in their Nationally Determined Contribution (NDC). The Institute expects that many will over the next cycles.
Signatories to the Paris Agreement are invited to submit their long-term low-greenhouse-gas emission development strategies to the United Nations Framework Convention on Climate Change (UNFCCC) by 2020. Ten out of the 13 strategies submitted as of August 2019, include CCS29. As more are submitted, the Institute will form a clearer picture of where CCS fits in the long-term emissions reduction planning of countries and regions.
Article 6 of the Paris Agreement offers countries another option to support wide scale deployment of CCS. Negotiations are underway around co-operation between nations to fulfil their pledges through joint action, which would also bring down compliance costs. With growing interest in CCS technologies, this approach may help to establish CCS projects in developing countries.
The UNFCCC increasingly sees technology transfer as one of the key mechanisms to achieve climate change mitigation and adaptation. Their Technology Executive Committee’s work plan for the next four years includes the “role of emerging technologies”. The Technology Mechanism will look at improving access in developing nations, and IEA has concluded that the largest deployment of CCS must occur in non-OECD countries30. The GCF listed CCS as one of the technologies to transform energy and industry, in their strategic programming for the first replenishment. The replenishment process has had an excellent start, with announcements from over a dozen of countries to double their pledges and the total amount of the first replenishment already exceeding the previous pledging conference in 2014.
2015 2017 2018 2020 2023 2024 2025 2028 2030 2050
ADOPTION OF THE PARIS AGREEMENT
FACILITATIVE DIALOGUE
Talanoa Dialogue& adoption of theParis rulebook.
GLOBALSTOCKTAKE
GLOBALSTOCKTAKE
NET ZEROEMISSIONS
Countries communicate new or updated NDCs & long term strategies.
Countries communicate new or updated NDCs.New nancial commitments due.
Climate plans submitted, first round pledges (NDCs)
UN Secretary General’s Climate Summit.
National inventory report on NDCs.
Countries communicatenew or updated NDCs.
FIGURE 14 PARIS AGREEMENT AMBITION MECHANISM31
37

Chair, Solar Impulse Foundation
BERTRAND PICCARD
When I was spending holidays in the Swiss Alps during the 60’s, all the residents of the village were taking their garbage in their car to dump them in a valley where a little river was flowing. The waste would burn day and night and produced smoke with a horrible smell. But all this was completely legal. Why don’t we do it anymore? Because today it’s prohibited.
The result of stopping people from throwing rubbish into the valley and paying for its disposal was the creation of new industries - waste collection, energy recovery, recycling - that created jobs and profit.
Why is it then that companies can still dump as much carbon into the atmosphere as they wish? Why should it be treated differently?
Today, we must correct this market failure. Putting a price on carbon will provide incentives to capture, reduce or eliminate harmful emissions. Doing so is not adding a new tax, but merely correcting an old injustice, and will open the door to the market of the century - protection of the environment.
The IEA has consistently highlighted that CCUS is critical to meeting our global climate goals. Last year, global energy demand accelerated at its fastest pace this decade, with fossil fuels meeting around 70 per cent of this growth and contributing to a historic high for energy-related CO2 emissions. In fact, for more than 30 years, the share of fossil fuels in the world’s energy mix has remained virtually unchanged at around 81 per cent. CCUS is a necessary bridge between the reality of today’s energy system and the increasingly urgent need to reduce emissions. Not only can it avoid locking in emissions from existing power and industrial facilities, it also provides a critical foundation for carbon removal or negative emissions. But so far, the vast potential of CCUS remains largely unrealised.
Executive Director, International Energy Agency
“ CCUS IS A NECESSARY BRIDGE BETWEEN THE REALITY OF TODAY’S ENERGY SYSTEM AND THE INCREASINGLY URGENT NEED TO REDUCE EMISSIONS.”Dr. Fatih Birol Executive Director, International Energy Agency
DR FATIH BIROL
CCS Ambassadors
38
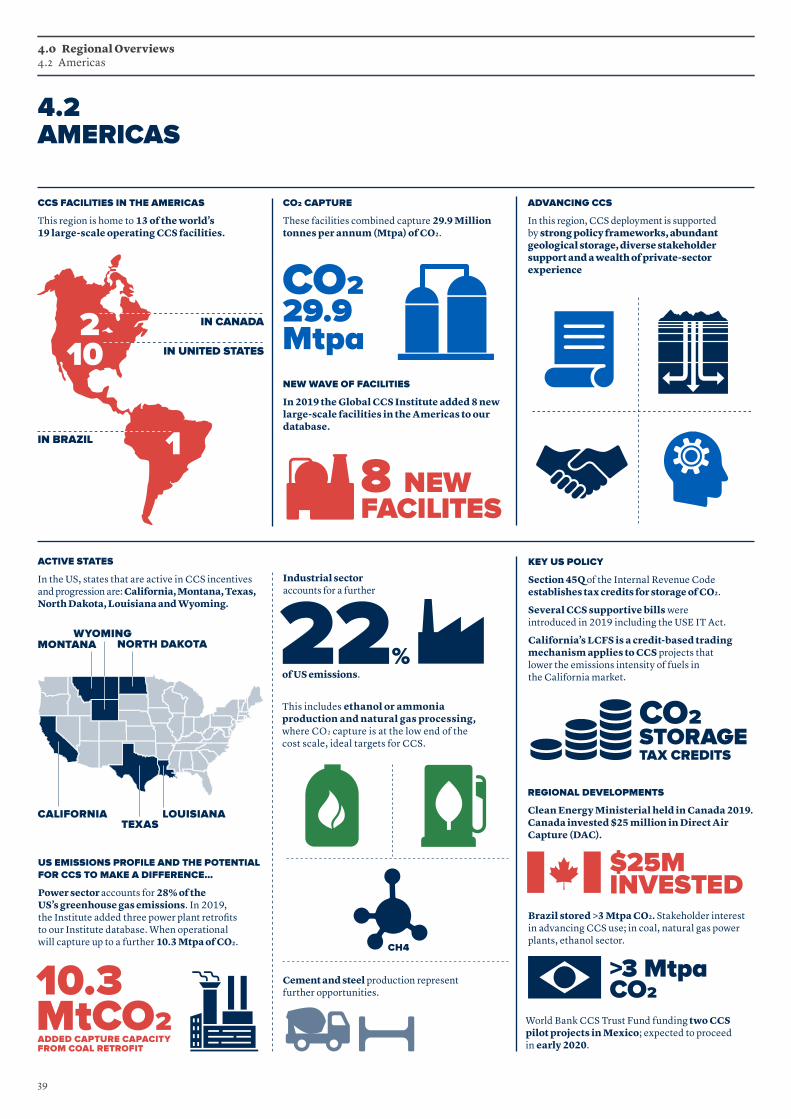
4.0 Regional Overviews 4.2 Americas
4.2 AMERICAS
ADDED CAPTURE CAPACITY FROM COAL RETROFIT
CH4
>3 Mtpa CO2
CCS FACILITIES IN THE AMERICAS
This region is home to 13 of the world’s 19 large-scale operating CCS facilities.
ACTIVE STATES
In the US, states that are active in CCS incentives and progression are: California, Montana, Texas, North Dakota, Louisiana and Wyoming.
KEY US POLICY
Section 45Q of the Internal Revenue Code establishes tax credits for storage of CO2.
Several CCS supportive bills were introduced in 2019 including the USE IT Act.
California’s LCFS is a credit-based trading mechanism applies to CCS projects that lower the emissions intensity of fuels in the California market.
REGIONAL DEVELOPMENTS
Clean Energy Ministerial held in Canada 2019. Canada invested $25 million in Direct Air Capture (DAC).
US EMISSIONS PROFILE AND THE POTENTIAL FOR CCS TO MAKE A DIFFERENCE…
Power sector accounts for 28% of the US’s greenhouse gas emissions. In 2019, the Institute added three power plant retrofits to our Institute database. When operational will capture up to a further 10.3 Mtpa of CO2.
Industrial sector accounts for a further
CO2 CAPTURE
These facilities combined capture 29.9 Million tonnes per annum (Mtpa) of CO2.
NEW WAVE OF FACILITIES
In 2019 the Global CCS Institute added 8 new large-scale facilities in the Americas to our database.
ADVANCING CCS
In this region, CCS deployment is supported by strong policy frameworks, abundant geological storage, diverse stakeholder support and a wealth of private-sector experience
This includes ethanol or ammonia production and natural gas processing, where CO2 capture is at the low end of the cost scale, ideal targets for CCS.
Brazil stored >3 Mtpa CO2. Stakeholder interest in advancing CCS use; in coal, natural gas power plants, ethanol sector.
World Bank CCS Trust Fund funding two CCS pilot projects in Mexico; expected to proceed in early 2020.
CO2 29.9 Mtpa
8 NEW FACILITES
10.3 MtCO2
22%
CALIFORNIATEXAS
LOUISIANA
NORTH DAKOTAWYOMING
MONTANA
CO2 STORAGE TAX CREDITS
$25M INVESTED
of US emissions.
IN CANADA
IN UNITED STATES
IN BRAZIL
210
1
Cement and steel production represent further opportunities.
39
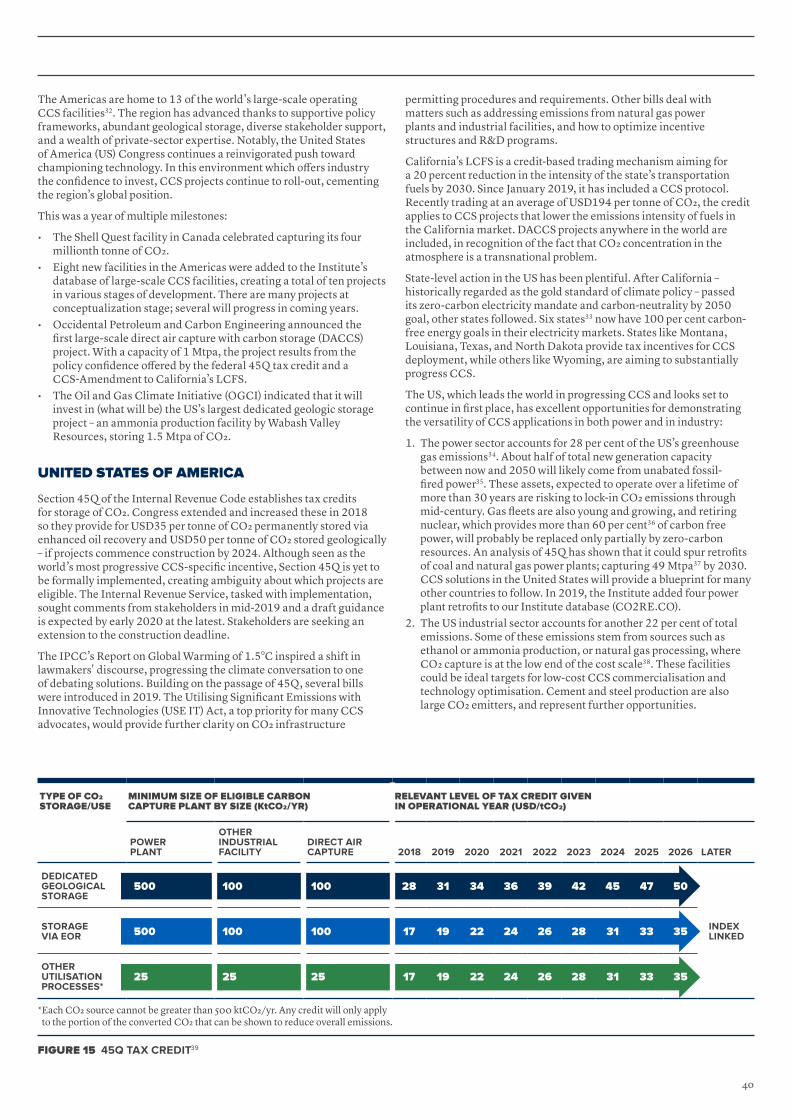
The Americas are home to 13 of the world's large-scale operating CCS facilities32. The region has advanced thanks to supportive policy frameworks, abundant geological storage, diverse stakeholder support, and a wealth of private-sector expertise. Notably, the United States of America (US) Congress continues a reinvigorated push toward championing technology. In this environment which offers industry the confidence to invest, CCS projects continue to roll-out, cementing the region’s global position.
This was a year of multiple milestones:
• The Shell Quest facility in Canada celebrated capturing its four millionth tonne of CO2.
• Eight new facilities in the Americas were added to the Institute’s database of large-scale CCS facilities, creating a total of ten projects in various stages of development. There are many projects at conceptualization stage; several will progress in coming years.
• Occidental Petroleum and Carbon Engineering announced the first large-scale direct air capture with carbon storage (DACCS) project. With a capacity of 1 Mtpa, the project results from the policy confidence offered by the federal 45Q tax credit and a CCS-Amendment to California’s LCFS.
• The Oil and Gas Climate Initiative (OGCI) indicated that it will invest in (what will be) the US’s largest dedicated geologic storage project – an ammonia production facility by Wabash Valley Resources, storing 1.5 Mtpa of CO2.
UNITED STATES OF AMERICA
Section 45Q of the Internal Revenue Code establishes tax credits for storage of CO2. Congress extended and increased these in 2018 so they provide for USD35 per tonne of CO2 permanently stored via enhanced oil recovery and USD50 per tonne of CO2 stored geologically – if projects commence construction by 2024. Although seen as the world’s most progressive CCS-specific incentive, Section 45Q is yet to be formally implemented, creating ambiguity about which projects are eligible. The Internal Revenue Service, tasked with implementation, sought comments from stakeholders in mid-2019 and a draft guidance is expected by early 2020 at the latest. Stakeholders are seeking an extension to the construction deadline.
The IPCC’s Report on Global Warming of 1.5°C inspired a shift in lawmakers' discourse, progressing the climate conversation to one of debating solutions. Building on the passage of 45Q, several bills were introduced in 2019. The Utilising Significant Emissions with Innovative Technologies (USE IT) Act, a top priority for many CCS advocates, would provide further clarity on CO2 infrastructure
permitting procedures and requirements. Other bills deal with matters such as addressing emissions from natural gas power plants and industrial facilities, and how to optimize incentive structures and R&D programs.
California’s LCFS is a credit-based trading mechanism aiming for a 20 percent reduction in the intensity of the state’s transportation fuels by 2030. Since January 2019, it has included a CCS protocol. Recently trading at an average of USD194 per tonne of CO2, the credit applies to CCS projects that lower the emissions intensity of fuels in the California market. DACCS projects anywhere in the world are included, in recognition of the fact that CO2 concentration in the atmosphere is a transnational problem.
State-level action in the US has been plentiful. After California – historically regarded as the gold standard of climate policy – passed its zero-carbon electricity mandate and carbon-neutrality by 2050 goal, other states followed. Six states33 now have 100 per cent carbon-free energy goals in their electricity markets. States like Montana, Louisiana, Texas, and North Dakota provide tax incentives for CCS deployment, while others like Wyoming, are aiming to substantially progress CCS.
The US, which leads the world in progressing CCS and looks set to continue in first place, has excellent opportunities for demonstrating the versatility of CCS applications in both power and in industry:
1. The power sector accounts for 28 per cent of the US’s greenhouse gas emissions34. About half of total new generation capacity between now and 2050 will likely come from unabated fossil-fired power35. These assets, expected to operate over a lifetime of more than 30 years are risking to lock-in CO2 emissions through mid-century. Gas fleets are also young and growing, and retiring nuclear, which provides more than 60 per cent36 of carbon free power, will probably be replaced only partially by zero-carbon resources. An analysis of 45Q has shown that it could spur retrofits of coal and natural gas power plants; capturing 49 Mtpa37 by 2030. CCS solutions in the United States will provide a blueprint for many other countries to follow. In 2019, the Institute added four power plant retrofits to our Institute database (CO2RE.CO).
2. The US industrial sector accounts for another 22 per cent of total emissions. Some of these emissions stem from sources such as ethanol or ammonia production, or natural gas processing, where CO2 capture is at the low end of the cost scale38. These facilities could be ideal targets for low-cost CCS commercialisation and technology optimisation. Cement and steel production are also large CO2 emitters, and represent further opportunities.
TYPE OF CO2 STORAGE/USE
MINIMUM SIZE OF ELIGIBLE CARBON CAPTURE PLANT BY SIZE (KtCO2/YR)
RELEVANT LEVEL OF TAX CREDIT GIVEN IN OPERATIONAL YEAR (USD/tCO2)
POWER PLANT
OTHER INDUSTRIAL FACILITY
DIRECT AIR CAPTURE 2018 2019 2020 2021 2022 2023 2024 2025 2026 LATER
DEDICATED GEOLOGICAL STORAGE
500 100 100 28 31 34 36 39 42 45 47 50
INDEX LINKED
STORAGE VIA EOR 500 100 100 17 19 22 24 26 28 31 33 35
OTHER UTILISATION PROCESSES*
25 25 25 17 19 22 24 26 28 31 33 35
* Each CO2 source cannot be greater than 500 ktCO2/yr. Any credit will only apply to the portion of the converted CO2 that can be shown to reduce overall emissions.
FIGURE 15 45Q TAX CREDIT39
40

CANADA, CENTRAL AND SOUTH AMERICA
Interest in accelerating CCS deployment remains strong across the Americas:
• Canada's Government joined the ranks of BHP, Occidental Petroleum and Chevron through investing $25 million in the Canadian Direct Air Capture (DAC) company Carbon Engineering through Canada's Strategic Innovation Fund.
• In Brazil, the Petrobras Santos Basin Pre-Salt Oil Field CCS has been separating CO2 onsite as part of natural gas processing since 2013 and is now storing 3 Mtpa. The captured CO2 is injected direct into the Lula, Sapinhoá and Lapa oil fields for enhanced oil recovery. Stakeholders are keen to speed up CCS use; mainly in coal and natural gas power plants, but also in the ethanol sector.
• With funding from the World Bank CCS Trust Fund, two CCS pilot projects are progressing in Mexico. The CO2 Capture Pilot Project (CCPP) and the CO2 EOR and Storage Pilot Project (CESP). Significant planning and scoping have been completed and the projects are expected to proceed in early 2020.
The potential convergence of industry, transport and energy policies under the umbrella of comprehensive climate action, is driving government initiatives and policy innovation that supports CCS. The focus must now be on these policies, and their ability to deliver steel in the ground.
Above: Petra Nova Carbon Capture, United States of America; right: Quest Facility, Canada. Photo courtesy of Shell.
* Size of the circle is proportional to the capture capacity of the facility. Indicates the primary industry type of the facility among various options.
4.0 Regional Overviews 4.2 Americas
FIGURE 16 APPLICATIONS OF CCS FACILITIES: AMERICAS
APPLICATIONS IN OPERATION 2016 2017 2018 2019 2020 2021 2022 2023 2024 2025+
CHEMICAL PRODUCTION
HYDROGEN PRODUCTION
FERTISLISER PRODUCTION
NATURAL GAS PROCESSING
POWER GENERATION
ILLINOIS INDUSTRIAL
INTEGRATED MID-CONTINENT HUB
LAKE CHARLES
METHANOL
QUEST ACTL STURGEON
TERRELL (FORMERLY VAL VERDE)
SHUTE CREEK
BOUNDARY DAM
LOST CABIN
PETROBRAS PRE-SALT
ENID FERTILISER ACTL AGRIUMCOFFFEYVILLE
CENTURY PLANT
PETRA NOVA
CARBONSAFE ILLINOIS HUB*
DRY FORK
PROJECT TUNDRA
WABASH
GREAT PLAINS
AIR PRODUCTS
IN OPERATION IN CONSTRUCTION ADVANCED DEVELOPMENT1 Mtpa CO2 CIRCLE AREA PROPORTIONATE TO CAPACITY=
41

“ [CCUS] IS THE ONLY SOLUTION THAT CAN TRULY MITIGATE CLIMATE CHANGE AND PROVIDE RELIABLE ENERGY PRODUCTION THROUGH A REALISTIC MIX OF RENEWABLES AND NATURAL RESOURCES.”
FIGURE 17 DIFFERENT TYPES OF CCS PROJECTS THAT CAN QUALIFY TO GENERATE CREDITS UNDER THE CALIFORNIAN LOW CARBON FUEL STANDARD40
DIRECT AIR CAPTURE PROJECTS
CCS AT OIL & GAS PRODUCTION FACILITIES
CCS AT REFINERIES PROJECTS
ALL OTHER CCS PROJECTS (E.G. CCS WITH ETHANOL)
LOCATION OF CCS PROJECT
Anywhere in the world Anywhere, provided they sell the transportation fuel in California
Anywhere, provided they sell the transportation fuel in California
Anywhere, provided they sell the transportation fuel in California
STORAGE SITE Onshore saline or depleted oil and gas resevoirs, or oil and gas resevoirs used for CO2 EOR
CREDIT METHOD Project-based Project-based under the Innovative Crude Provision
Project-based under the Refinery Investment Credit Program
Project-based or fuel pathway
EARLIETS DATE WHICH EXISTING PROJECTS ELIGIBLE
Any 2010 2016 Any
REQUIREMENTS Project must meet requirements specified in the CCS protocol
ADDITIONAL RESTRICTIONS None Must acheive minimum CI or emission reduction
None None
NEWTON B. JONESPresident, International Brotherhood of Boilermakers
CCS Ambassador
CCUS is the global answer to climate change. It is the only solution that can truly mitigate climate change and provide reliable energy production through a realistic mix of renewables and natural resources—all while preserving and creating jobs, economic growth and social stability.
While CCUS is finally gaining limited awareness, we’re not yet scratching the surface on the volume of mainstream attention needed to scale up support from legislators who can ensure government policies and incentives are in place to expedite industry CCUS investments.
The urgency to bring viable CCUS projects to life is now, and the International Brotherhood of Boilermakers is fully committed to raising our collective voices to advocate for CCUS as the bridge to a cleaner energy future and the right solution to save our way of life and our planet.
42
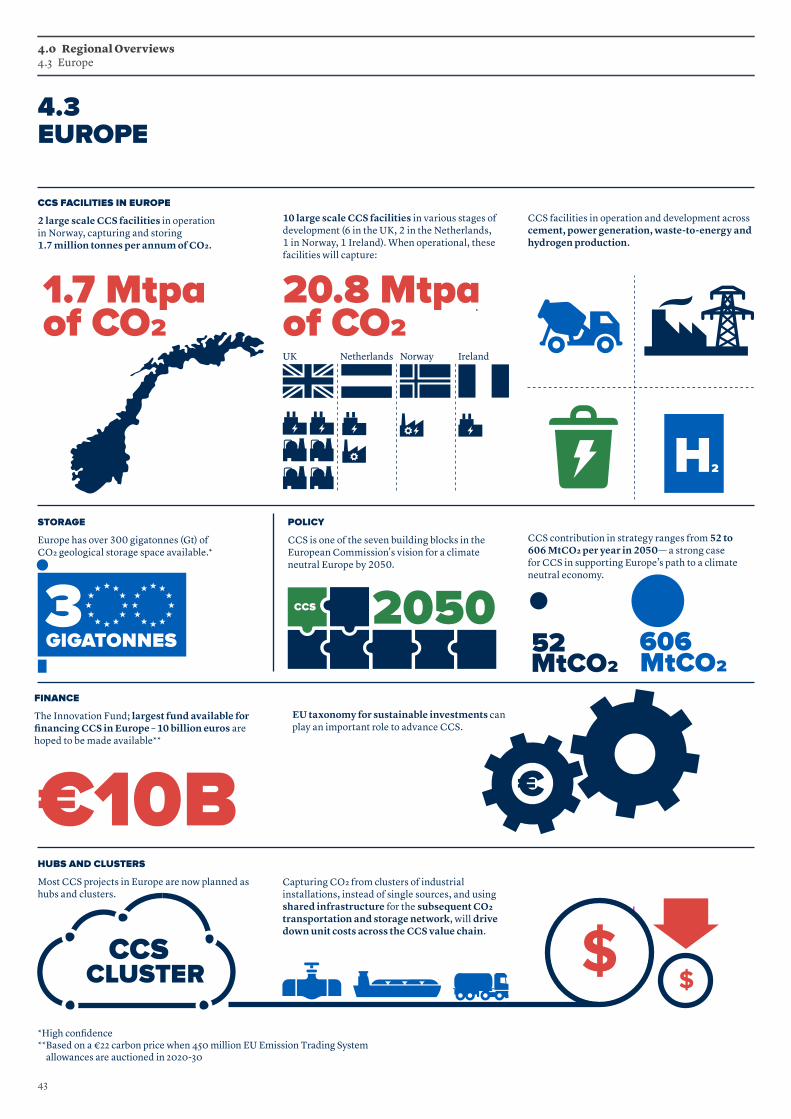
4.0 Regional Overviews 4.3 Europe
4.3 EUROPE
CCS FACILITIES IN EUROPE
2 large scale CCS facilities in operation in Norway, capturing and storing 1.7 million tonnes per annum of CO2.
1.7 Mtpa of CO2
€10B
20.8 Mtpa of CO2
10 large scale CCS facilities in various stages of development (6 in the UK, 2 in the Netherlands, 1 in Norway, 1 Ireland). When operational, these facilities will capture:
CCS facilities in operation and development across cement, power generation, waste-to-energy and hydrogen production.
EU taxonomy for sustainable investments can play an important role to advance CCS.
Capturing CO2 from clusters of industrial installations, instead of single sources, and using shared infrastructure for the subsequent CO2 transportation and storage network, will drive down unit costs across the CCS value chain.
CCS contribution in strategy ranges from 52 to 606 MtCO2 per year in 2050— a strong case for CCS in supporting Europe’s path to a climate neutral economy.
52MtCO2606
FINANCE
The Innovation Fund; largest fund available for financing CCS in Europe – 10 billion euros are hoped to be made available**
HUBS AND CLUSTERS
Most CCS projects in Europe are now planned as hubs and clusters.
POLICY
CCS is one of the seven building blocks in the European Commission's vision for a climate neutral Europe by 2050.
STORAGE
Europe has over 300 gigatonnes (Gt) of CO2 geological storage space available.*
3GIGATONNES
$$CCS
CLUSTER
MtCO2
H2
*High confidence ** Based on a €22 carbon price when 450 million EU Emission Trading System
allowances are auctioned in 2020-30
NorwayUK Netherlands Ireland
2050CCS
43

In November 2018, the European Commission (EC) published its vision for a climate neutral Europe by 2050 in “A Clean Planet for all - A European strategic long-term vision for a prosperous, modern, competitive and climate neutral economy41.” CCS is one of seven building blocks in the strategy, and in the various scenarios put forward, its contribution ranges from 52 to 606 MtCO2 per year in 2050— a strong case for CCS in supporting Europe’s path to a climate neutral economy. The strategy’s scenarios rely on CCS mainly for industrial decarbonisation, delivering negative emissions through BECCS and producing low-carbon hydrogen.
Discussion around Europe’s 2050 target has shifted from “if” to “how” climate neutrality will be delivered. This change has sparked renewed interest in CCS as one emission reduction technology needed in a portfolio of climate solutions. The EU’s long-term strategy should be adopted in the coming months, before it is submitted to the UNFCCC in early 2020 as requested under the Paris Agreement.
Under the Governance of the Energy Union Regulation, EU Member States developed their draft National Energy and Climate Plans (NECPs) for 2021-2030. Each country took a close look at their energy and climate targets together, breaking down silos and mapping their pathway to meet the 2030 targets. While CCS is reflected in many NECPs, details about how, and on what scale, these technologies will be deployed, are often not provided. The final versions of NECPs, due by the end of 2019, should reflect all ongoing and/or planned activities, as well as highlighting where CCS ought to be used because of its strong potential to deliver emission reductions.
The latest EU ETS review, finalised in 2018, strengthened the Market Stability Reserve (the mechanism to reduce the surplus of emission allowances) and increased the pace of emissions cuts. The overall number of emission allowances will decline at an annual rate of 2.2
per cent from 2021 onwards, compared to 1.74 per cent currently. This review has delivered a stronger carbon price, which has been fluctuating around 25 EUR for most of 2019. Another element added during the 2018 revision, setting up the 10-billion EUR Innovation Fund, has been progressing well and several CCS projects will be ready to tap into its resources.
Aside from climate and energy policy, there is a major development in the field of sustainable finance in Europe, which can help direct financial flows towards wider deployment of CCS. The EU taxonomy for sustainable investments42, currently being negotiated between the Council of the EU, the European Parliament and the EC, will create a common language for all actors in the financial system, steering public and private capital toward sustainable investments. The technical report on EU Taxonomy43 sets technical screening criteria for activities that can make an important contribution to climate change mitigation. CCS is highlighted under several activities. If the technical criteria and the outcome of political negotiations follows the current path, the taxonomy can become a strong driver for institutional investment in CCS across the EU and, potentially, globally.
Norway, United Kingdom and the Netherlands are already strong supporters of CCS, and the number of countries showing interest in these technologies continues to increase. Most notably, Germany is talking about CCS again with Chancellor Angela Merkel confirming in May 2019 that Germany must reach climate neutrality by mid-century. Three CCS facilities currently in development – Net Zero Teesside, UK; Port of Rotterdam (PORTHOS), Netherlands; and ATHOS (Belgium/Netherlands) – consider Germany to be one of their CO2 sources in future expansion phases of their projects44.
INNOVATION FUND
The Innovation Fund is the largest fund available for financing CCS in Europe. It finances innovative low-carbon technologies and processes in energy intensive industries, CCUS, renewable energy and energy storage projects. Ten billion euros are hoped to be made available, based on a €22 carbon price when 450 million EU ETS allowances are auctioned in 2020-30.
Innovation Fund grants can be combined with other funding sources; for example, with EU instruments like Horizon Europe or Connecting Europe Facility, with national programmes, or with private capital.
Up to 40 per cent of grant payments will be given in the project preparation phase, based on pre-defined milestones. The remaining 60 per cent, linked to innovation, are based on verified emissions avoidance outcomes and can continue for up to 10 years. The fund’s simplicity, flexibility, increased synergies and streamlined governance are a result of lessons learned from its predecessor, NER300 programme.
The first call for proposals will be made in 2020, with regular calls expected thereafter. Several planned CCS facilities are already well positioned to submit proposals.
FIGURE 18 DISBURSEMENTS BASED ON MILESTONES45
FEASABILITYSTUDY
GRANT AWARD FINANCIAL CLOSE ENTRY INTO OPERATION 3-10YRSANNUAL INSTALLMENTSPROJECT MILESTONES
Up to 40% payment
FEED
At least 60% payment
Not-depending on veri�ed emissions avoidance
Depending on veri�ed emissions avoidance
CONSTRUCTION REPORTINGPERIOD
44
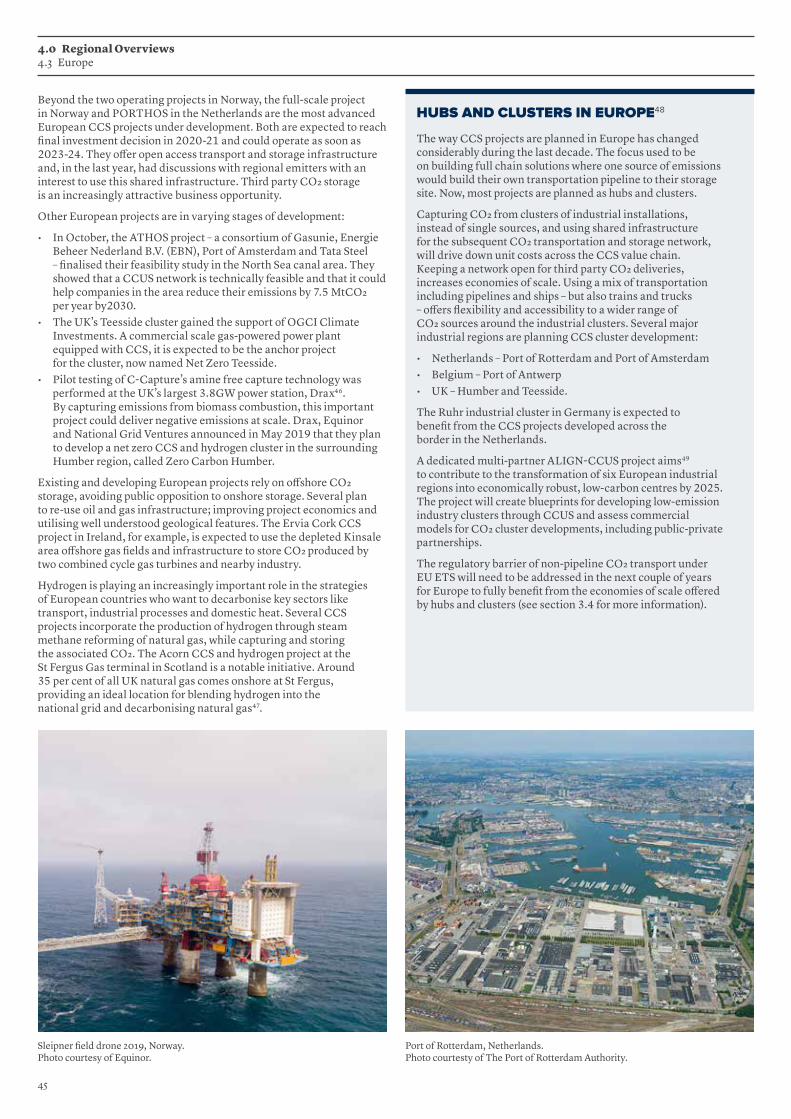
Beyond the two operating projects in Norway, the full-scale project in Norway and PORTHOS in the Netherlands are the most advanced European CCS projects under development. Both are expected to reach final investment decision in 2020-21 and could operate as soon as 2023-24. They offer open access transport and storage infrastructure and, in the last year, had discussions with regional emitters with an interest to use this shared infrastructure. Third party CO2 storage is an increasingly attractive business opportunity.
Other European projects are in varying stages of development:
• In October, the ATHOS project – a consortium of Gasunie, Energie Beheer Nederland B.V. (EBN), Port of Amsterdam and Tata Steel – finalised their feasibility study in the North Sea canal area. They showed that a CCUS network is technically feasible and that it could help companies in the area reduce their emissions by 7.5 MtCO2 per year by2030.
• The UK’s Teesside cluster gained the support of OGCI Climate Investments. A commercial scale gas-powered power plant equipped with CCS, it is expected to be the anchor project for the cluster, now named Net Zero Teesside.
• Pilot testing of C-Capture’s amine free capture technology was performed at the UK’s largest 3.8GW power station, Drax46. By capturing emissions from biomass combustion, this important project could deliver negative emissions at scale. Drax, Equinor and National Grid Ventures announced in May 2019 that they plan to develop a net zero CCS and hydrogen cluster in the surrounding Humber region, called Zero Carbon Humber.
Existing and developing European projects rely on offshore CO2 storage, avoiding public opposition to onshore storage. Several plan to re-use oil and gas infrastructure; improving project economics and utilising well understood geological features. The Ervia Cork CCS project in Ireland, for example, is expected to use the depleted Kinsale area offshore gas fields and infrastructure to store CO2 produced by two combined cycle gas turbines and nearby industry.
Hydrogen is playing an increasingly important role in the strategies of European countries who want to decarbonise key sectors like transport, industrial processes and domestic heat. Several CCS projects incorporate the production of hydrogen through steam methane reforming of natural gas, while capturing and storing the associated CO2. The Acorn CCS and hydrogen project at the St Fergus Gas terminal in Scotland is a notable initiative. Around 35 per cent of all UK natural gas comes onshore at St Fergus, providing an ideal location for blending hydrogen into the national grid and decarbonising natural gas47.
HUBS AND CLUSTERS IN EUROPE48
The way CCS projects are planned in Europe has changed considerably during the last decade. The focus used to be on building full chain solutions where one source of emissions would build their own transportation pipeline to their storage site. Now, most projects are planned as hubs and clusters.
Capturing CO2 from clusters of industrial installations, instead of single sources, and using shared infrastructure for the subsequent CO2 transportation and storage network, will drive down unit costs across the CCS value chain. Keeping a network open for third party CO2 deliveries, increases economies of scale. Using a mix of transportation including pipelines and ships – but also trains and trucks – offers flexibility and accessibility to a wider range of CO2 sources around the industrial clusters. Several major industrial regions are planning CCS cluster development:
• Netherlands – Port of Rotterdam and Port of Amsterdam • Belgium – Port of Antwerp • UK – Humber and Teesside.
The Ruhr industrial cluster in Germany is expected to benefit from the CCS projects developed across the border in the Netherlands.
A dedicated multi-partner ALIGN-CCUS project aims49 to contribute to the transformation of six European industrial regions into economically robust, low-carbon centres by 2025. The project will create blueprints for developing low-emission industry clusters through CCUS and assess commercial models for CO2 cluster developments, including public-private partnerships.
The regulatory barrier of non-pipeline CO2 transport under EU ETS will need to be addressed in the next couple of years for Europe to fully benefit from the economies of scale offered by hubs and clusters (see section 3.4 for more information).
Sleipner field drone 2019, Norway. Photo courtesy of Equinor.
Port of Rotterdam, Netherlands. Photo courtesty of The Port of Rotterdam Authority.
4.0 Regional Overviews 4.3 Europe
45

NORWAY CONTINUES TO ADVANCE ITS EUROPEAN CCS AMBITION
A leading country in CCS development globally, Norway has geologically stored more than 20Mt of CO2 in the past 20 years. The Sleipner and Snøhvit projects were the first in the world to store CO2 offshore and are the only operational large scale CCS facilities in Europe.
A planned full scale CCS project will involve capturing CO2 at multiple industrial facilities, then transporting it for storage. Operated by Equinor with partners Shell and Total, the facility will uniquely use ship-based transport, thus enabling the storage of CO2 for major sources across North West Europe. The transport and storage element of the project – Northern Lights – will be open access infrastructure.
The initial Norwegian sources of CO2 – Fortum’s Oslo Varme waste-to-energy plant and Heidelberg Cement’s Norcem cement plant in Brevik – have performed FEED studies and site testing. A drilling campaign will start soon to study the suitability and capacity of the Johansen formation in the Norwegian Continental Shelf for storing CO2.
Based on its experience with CCS, the Norwegian Government hopes to use this project as the catalyst for wider deployment of CCS in Europe. The use of sea-based transport means industry across Western Europe can also store and transport their CO2 through Northern Lights.
FIGURE 19 POTENTIAL SOURCES OF CO2 FOR NORTHERN LIGHTS50
In September, the Norwegian Government hosted a high-level CCS conference in Oslo, together with the European Commission. During the event Equinor, on behalf of the Northern Lights partners, signed agreements to develop value chains in CCUS with:
• Air Liquide• ArcelorMittal • Ervia • Fortum Oyj• HeidelbergCement AG• Preem • Stockholm Exergi
The parties will cooperate on CO2 handling and transport to Northern Lights.
NORWEGIAN FULL-SCALE PROJECT3RD PARTY VOLUMES OF CO2ALTERNATIVE STORAGE PROJECTS
PREEMGOTHENBURG
PREEMLYSEKIL
STOCKHOLMEXERGI
NORCEM AS
BORG CO2
ARCELORMITTALHAMBURG
ARCELORMITTALGENT
ARCELORMITTALDUNKERQUE
H2M, EEMSHAVEN
AIRLIQUIDEPORT ANTWERP& FLUXYS
FORTUMOLSO VARME
EYDECLUSTER
ACORN
NET ZERO TEESSIDE
CO2 HUBNORDLAND
ERVIA
NORTHERN LIGHTSSTORAGE SITE
46
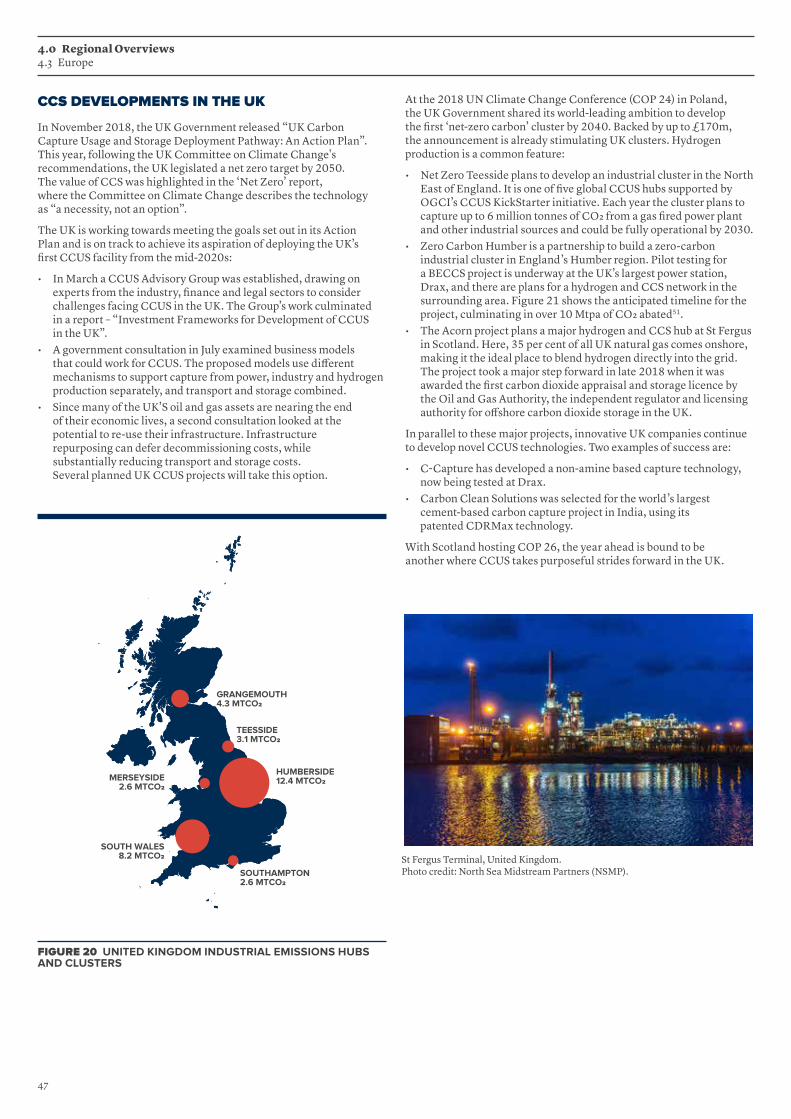
At the 2018 UN Climate Change Conference (COP 24) in Poland, the UK Government shared its world-leading ambition to develop the first ‘net-zero carbon’ cluster by 2040. Backed by up to £170m, the announcement is already stimulating UK clusters. Hydrogen production is a common feature:
• Net Zero Teesside plans to develop an industrial cluster in the North East of England. It is one of five global CCUS hubs supported by OGCI’s CCUS KickStarter initiative. Each year the cluster plans to capture up to 6 million tonnes of CO2 from a gas fired power plant and other industrial sources and could be fully operational by 2030.
• Zero Carbon Humber is a partnership to build a zero-carbon industrial cluster in England’s Humber region. Pilot testing for a BECCS project is underway at the UK’s largest power station, Drax, and there are plans for a hydrogen and CCS network in the surrounding area. Figure 21 shows the anticipated timeline for the project, culminating in over 10 Mtpa of CO2 abated51.
• The Acorn project plans a major hydrogen and CCS hub at St Fergus in Scotland. Here, 35 per cent of all UK natural gas comes onshore, making it the ideal place to blend hydrogen directly into the grid. The project took a major step forward in late 2018 when it was awarded the first carbon dioxide appraisal and storage licence by the Oil and Gas Authority, the independent regulator and licensing authority for offshore carbon dioxide storage in the UK.
In parallel to these major projects, innovative UK companies continue to develop novel CCUS technologies. Two examples of success are:
• C-Capture has developed a non-amine based capture technology, now being tested at Drax.
• Carbon Clean Solutions was selected for the world’s largest cement-based carbon capture project in India, using its patented CDRMax technology.
With Scotland hosting COP 26, the year ahead is bound to be another where CCUS takes purposeful strides forward in the UK.
CCS DEVELOPMENTS IN THE UK
In November 2018, the UK Government released “UK Carbon Capture Usage and Storage Deployment Pathway: An Action Plan”. This year, following the UK Committee on Climate Change's recommendations, the UK legislated a net zero target by 2050. The value of CCS was highlighted in the ‘Net Zero’ report, where the Committee on Climate Change describes the technology as “a necessity, not an option”.
The UK is working towards meeting the goals set out in its Action Plan and is on track to achieve its aspiration of deploying the UK’s first CCUS facility from the mid-2020s:
• In March a CCUS Advisory Group was established, drawing on experts from the industry, finance and legal sectors to consider challenges facing CCUS in the UK. The Group’s work culminated in a report – “Investment Frameworks for Development of CCUS in the UK”.
• A government consultation in July examined business models that could work for CCUS. The proposed models use different mechanisms to support capture from power, industry and hydrogen production separately, and transport and storage combined.
• Since many of the UK’S oil and gas assets are nearing the end of their economic lives, a second consultation looked at the potential to re-use their infrastructure. Infrastructure repurposing can defer decommissioning costs, while substantially reducing transport and storage costs. Several planned UK CCUS projects will take this option.
4.0 Regional Overviews 4.3 Europe
St Fergus Terminal, United Kingdom. Photo credit: North Sea Midstream Partners (NSMP).
FIGURE 20 UNITED KINGDOM INDUSTRIAL EMISSIONS HUBS AND CLUSTERS
GRANGEMOUTH4.3 MTCO2
TEESSIDE3.1 MTCO2
HUMBERSIDE12.4 MTCO2
SOUTHAMPTON2.6 MTCO2
SOUTH WALES8.2 MTCO2
MERSEYSIDE2.6 MTCO2
47
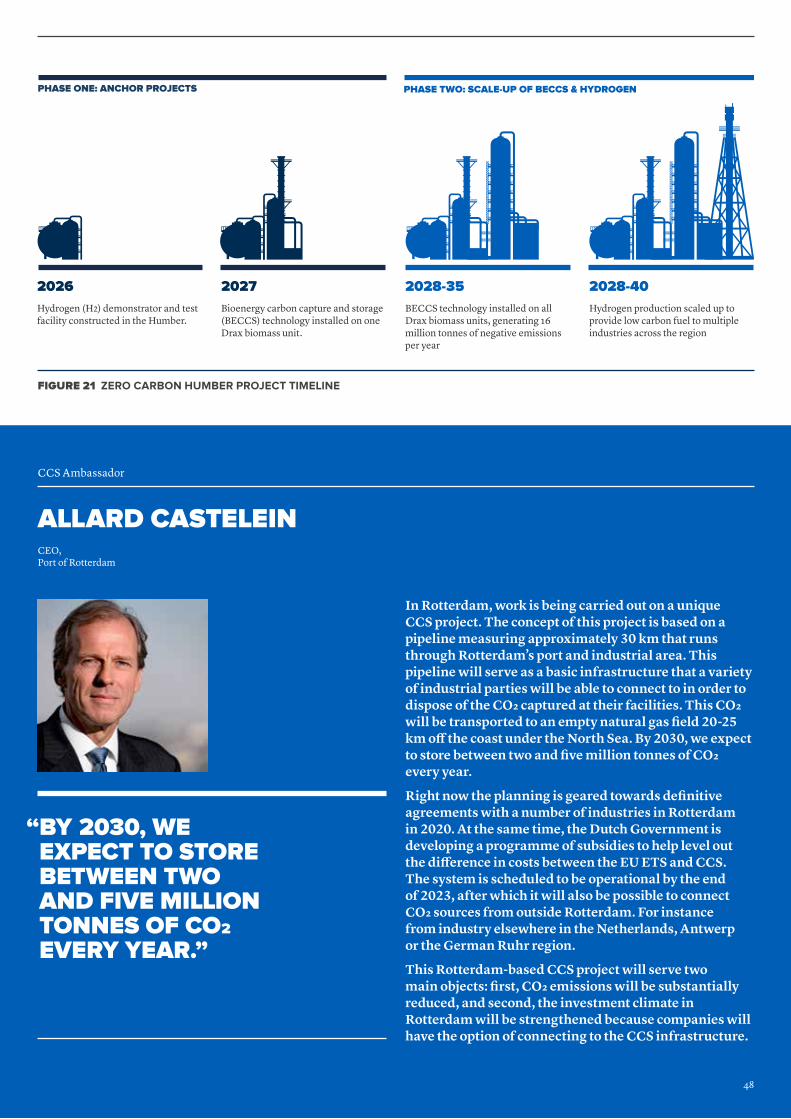
FIGURE 21 ZERO CARBON HUMBER PROJECT TIMELINE
In Rotterdam, work is being carried out on a unique CCS project. The concept of this project is based on a pipeline measuring approximately 30 km that runs through Rotterdam’s port and industrial area. This pipeline will serve as a basic infrastructure that a variety of industrial parties will be able to connect to in order to dispose of the CO2 captured at their facilities. This CO2 will be transported to an empty natural gas field 20-25 km off the coast under the North Sea. By 2030, we expect to store between two and five million tonnes of CO2 every year.
Right now the planning is geared towards definitive agreements with a number of industries in Rotterdam in 2020. At the same time, the Dutch Government is developing a programme of subsidies to help level out the difference in costs between the EU ETS and CCS. The system is scheduled to be operational by the end of 2023, after which it will also be possible to connect CO2 sources from outside Rotterdam. For instance from industry elsewhere in the Netherlands, Antwerp or the German Ruhr region.
This Rotterdam-based CCS project will serve two main objects: first, CO2 emissions will be substantially reduced, and second, the investment climate in Rotterdam will be strengthened because companies will have the option of connecting to the CCS infrastructure.
CEO, Port of Rotterdam
CCS Ambassador
ALLARD CASTELEIN
PHASE ONE: ANCHOR PROJECTS PHASE TWO: SCALE-UP OF BECCS & HYDROGEN
2026
Hydrogen (H2) demonstrator and test facility constructed in the Humber.
Bioenergy carbon capture and storage (BECCS) technology installed on oneDrax biomass unit.
BECCS technology installed on all Drax biomass units, generating 16 million tonnes of negative emissions per year
Hydrogen production scaled up to provide low carbon fuel to multiple industries across the region
2027 2028-35 2028-40
“ BY 2030, WE EXPECT TO STORE BETWEEN TWO AND FIVE MILLION TONNES OF CO2 EVERY YEAR.”
48

H2
OVERVIEW
HYDROGEN OPPORTUNITY
Low carbon hydrogen production, from natural gas with CCS, in the Middle East is estimated to cost only USD1.50/kg
4.0 Regional Overviews 4.4 Middle East and Central Asia
4.4 MIDDLE EAST AND CENTRAL ASIA
$US1.50/kg
2
Decarbonising the region’s energy system is key to achieving global climate targets. CCS has a role to play.
Both countries have committed to doubling public investment in clean energy research and development and are participating in the Clean Energy Ministerial’s CCUS initiative.
POLICY AND CCS MOVEMENT
Saudi Arabia and the United Arab Emirates both members of Mission Innovation and the Clean Energy Ministerial.
CENTRAL ASIA
Rapidly increasing energy demands being driven by growing population, rising living standards and urbanisation that is largely met by fossil fuels.
Region has vast and accessible underground storage potential of 5-30 Gigatonnes*
Capturing 1.6 Mtpa of CO22 large scale CCS facilities in operation: 1 in iron and steel production and 1 in natural gas processing
1.6 Mtpa 5-30 Gt
*Medium confidence
49

MIDDLE EAST
Natural gas demand is expected to continue to rise in the Middle East, driven by the growing industrial sector, power generation demands and the growing petrochemicals industry52. Countries in the region are increasingly aware of the need to decarbonise their oil and gas production and the importance of diversifying toward new energy economies. CCS can play an important role in the Middle East to support energy demand and the transition to cleaner energy sources. With vast and accessible underground CO2 storage potential53, abundant cost-competitive gas resources54 and hydrogen production facilities with excess capacity, the Middle East has potential to become a hub for CCS development and deployment. The region could also use its location and natural gas and pore space resources to develop a clean hydrogen export industry. Clean hydrogen production, from natural gas with CCS, in the Middle East is estimated to cost USD1.50/kg H255.
Saudi Arabia and the United Arab Emirates (UAE) lead this region’s efforts, each hosting one large-scale CCS facility that is supported and operated by State Owned Enterprises. Abu Dhabi captures CO2 from steel production and Uthmaniyah, Saudi Arabia from natural gas processing – both supply CO2 for enhanced oil recovery.
Abu Dhabi National Oil Company (ADNOC) recently announced that it would be scaling up efforts to reduce its emissions 10 percent, by 2023. CCS will play a role56. In the next decade, ADNOC aims to scale-up CCS deployment six-fold, capturing five million tonnes of CO2 by 2030. Emissions will be captured from either the Habshan-Bab complex, or the Shah plant57.
In October 2019, Qatar, now the second’s largest exporter of LNG58, announced that it aims to capture and store five million tonnes of CO2 from LNG facilities by 202559. Qatar Petroleum has announced a facility at the industrial hub Ras Laffan with the potential to capture and store 2.1 million tonnes per annum, which could become the largest CCS facility in the Middle East and North Africa region60. The captured CO2 will be used for EOR.
Saudi Arabia and the UAE are members of Mission Innovation and the Clean Energy Ministerial. The two nations have each committed to doubling public investment in clean energy research and development and are participating in the Clean Energy Ministerial’s CCUS initiative.
CENTRAL ASIA
In Central Asia, a growing population, rising living standards and urbanisation are creating rapidly increasing energy demands. These are largely met via abundant and inexpensive fossil fuel reserves. For many countries, such as Kazakhstan and Turkmenistan, energy production is a central part of the economy and they rely heavily on fossil fuel. Home to some of the most energy intensive economies in the world, decarbonising this region’s energy system will be key to achieving global climate targets.
For several countries in the region, CCS could play a role in supporting efforts to decarbonise energy sources. In Kazakstan for example coal, oil and gas contribute 98 per cent of the country’s primary energy supply61. The country is interested in CCS, given its significant coal reserves and dependence on mining. Natural resources company, Eurasian Resources Group (ERG) is currently exploring how to use CCS to reduce emissions from its fossil fuel power generation fleet. Initial investigations are focused on the feasibility of retrofitting a coal fired power plant with a 2Mtpa CCS facility. If successful, ERG will construct and operate a pilot capture plant.
In the next decade, Abu Dhabi National Oil Company aims to scale-up CCS deployment six-fold, capturing five million tonnes of CO2 by 2030.
50
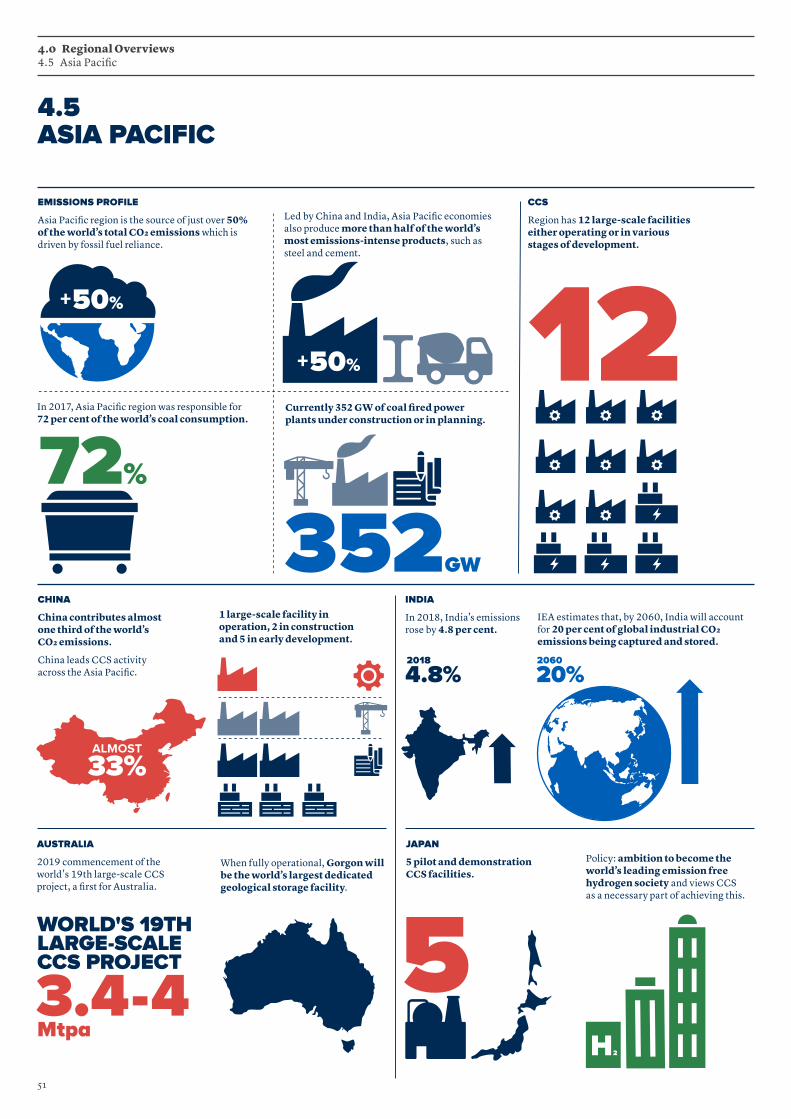
4.0 Regional Overviews 4.5 Asia Pacific
4.5 ASIA PACIFIC
EMISSIONS PROFILE
Asia Pacific region is the source of just over 50% of the world’s total CO2 emissions which is driven by fossil fuel reliance.
CCS
Region has 12 large-scale facilities either operating or in various stages of development.
CHINA
China contributes almost one third of the world’s CO2 emissions.
China leads CCS activity across the Asia Pacific.
INDIA
In 2018, India’s emissions rose by 4.8 per cent.
JAPAN
5 pilot and demonstration CCS facilities.
AUSTRALIA
2019 commencement of the world's 19th large-scale CCS project, a first for Australia.
Policy: ambition to become the world’s leading emission free hydrogen society and views CCS as a necessary part of achieving this.
When fully operational, Gorgon will be the world’s largest dedicated geological storage facility.
IEA estimates that, by 2060, India will account for 20 per cent of global industrial CO2 emissions being captured and stored.
1 large-scale facility in operation, 2 in construction and 5 in early development.
20%4.8%2018 2060
5
33%ALMOST
In 2017, Asia Pacific region was responsible for 72 per cent of the world’s coal consumption.
72%
12Currently 352 GW of coal fired power plants under construction or in planning.
352GW
Led by China and India, Asia Pacific economies also produce more than half of the world’s most emissions-intense products, such as steel and cement.
H2
50%+
50%+
3.4-4 Mtpa
WORLD'S 19TH LARGE-SCALE CCS PROJECT
51

The Asia Pacific region is the source of just over half of the world’s total CO2 emissions. This heavy emissions profile is driven by large, rapidly growing and developing economies which rely on fossil fuels for power generation. Many countries, particularly those across South East Asia, have young fleets of fossil fuel power stations with decades of economic life, and are planning more. There are 352 GW of coal fired power plants under construction or in planning for the near-future.
In 2017, the Asia Pacific was responsible for 72 per cent of the world’s coal consumption62. China made up nearly half of this; followed by South East Asia, Korea and Japan. Increasing coal power generation in Indonesia, Bangladesh, Philippines and Vietnam is driving future forecast demand.
Switching from coal to gas for industrial and residential uses, particularly in China, has increased demand for liquefied natural gas63. It is predicted to account for almost 60 per cent of total global energy consumption by 202464. Led by China and India, Asia Pacific economies also produce more than half of the world’s most emissions-intense products, such as steel65 and cement66.
These challenges – combined with inertia around developing low-carbon policy mechanisms and lack of legal and regulatory regimes to incentivise CCS investment – could create the assumption that there is little room for CCS technologies. But, with air pollution on the rise, CCS deployment cannot happen soon enough. Encouragingly, in the past year, the Asia Pacific has continued to strengthen its position as one of the most active CCS regions in the world, with 12 large-scale facilities either operating or in various stages of development67.
CHINA
China leads CCS activity across the Asia Pacific with one large-scale facility in operation, two in construction and five in early development. China also contributes almost one third of the world’s CO2 emissions and has the most urgent requirement to reduce them.
Following the 2018 restructure, the Chinese Government focused on a more coordinated approach to general environmental management, combining emissions reductions with air pollutant controls, to stimulate new industries and jobs. Their new National CCUS Professional Committee will provide government with direct support and advice on relevant industrial standards and policy-making, striving to enhance international cooperation on CCS.
In May 2019, the latest Roadmap for CCUS in China was published. It clarified the strategic position of CCUS and proposed mid to long-term targets and priorities for achieving low carbon transition through affordable, feasible and reliable CCUS technologies.
The Institute expects that these significant policy commitments to cut emissions and advance low carbon technologies will advance the deployment of CCS.
INDIA
In 2018, India’s emissions rose by 4.8 per cent, alongside a sharp increase in energy demand and a five per cent growth in demand for coal68. It has the world’s third largest coal fleet69, with an average plant age of 16 years70 and growing infrastructure demands which draw on energy intensive materials like steel and cement, of which India is the world’s second largest global producer. Importantly, in its clean technology scenario, the IEA estimates that, by 2060, India will account for 20 per cent of global industrial CO2 emissions capture and storage71. CCS can underpin a meaningful energy transition for this region, offering rapid decarbonisation for clean and sustainable economic development.
Indian company Dalmia Cement has committed to becoming carbon negative by 2040 and sees CCU as one of the solutions it needs to get there. In September 2019, the company announced plans for a large scale 0.5 Mtpa carbon capture facility in Tamil Nadu, in partnership with Carbon Clean Solutions who will provide the plant’s technology. Dalmia is looking for multiple utilisation streams from the carbon capture plant.
JAPAN
The Japanese Ministry of Economy, Trade and Industry (METI) and Ministry of the Environment (MOE) continue to drive Japan’s comprehensive CCS program. This program is multi-dimensional, addressing the full CCS value chain from the development, and demonstration of capture technologies, investigating effective regulatory models, exploring policy options for commercial deployment, identifying and characterizing storage reservoirs and CO2 transport options, and understanding CCS business models. In June, the Japanese Government submitted its Long-Term Strategy under the Paris Agreement, to the UNFCCC. The strategy identifies CCS alongside other emission-reduction technologies, to deliver deep emission reductions to power generation and industrial processes including the production of clean hydrogen, and states the Government of Japan’s intention to collaborate with the private sector and other governments on a range of initiatives designed to reduce barriers to CCS deployment.
The Hydrogen Energy Supply Chain project (HESC) is a significant example of Japanese government collaboration with the private sector and other governments to commercialise CCS. This project being developed by Kawasaki Heavy Industries (KHI), Electric Power Development Co. (J-Power), Iwatani Corporation, Marubeni Corporation, Sumitomo Corporation and AGL, with the support of the Governments of Japan, Australia and the State of Victoria, will demonstrate the production of hydrogen from coal in the Latrobe Valley of Victoria and the transport of hydrogen by ship from Australia to Japan. Construction of the gasifier commenced in November 2019 and first hydrogen production is expected by 2021. If this pilot is successful, an investment decision to construct a commercial scale clean hydrogen production facility with CCS in the Latrobe Valley, to supply Japan could be made in the mid 2020s.
Osaki CoolGen facility, Japan.
52
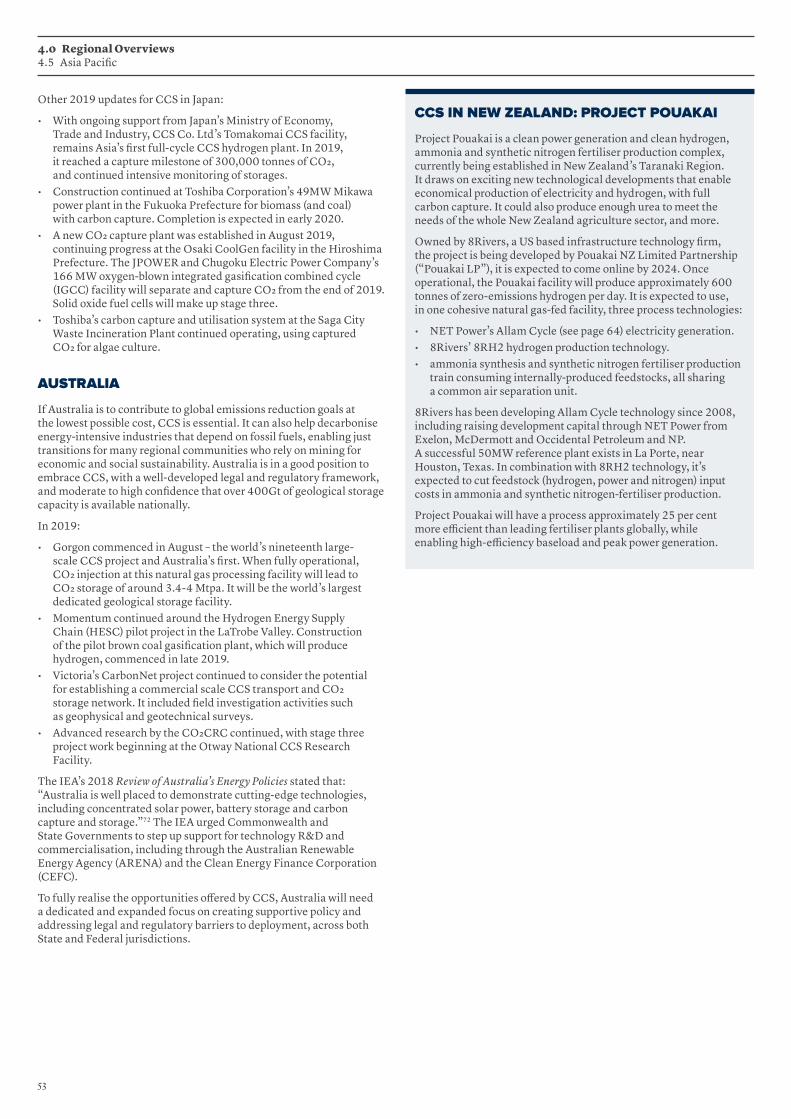
CCS IN NEW ZEALAND: PROJECT POUAKAI
Project Pouakai is a clean power generation and clean hydrogen, ammonia and synthetic nitrogen fertiliser production complex, currently being established in New Zealand’s Taranaki Region. It draws on exciting new technological developments that enable economical production of electricity and hydrogen, with full carbon capture. It could also produce enough urea to meet the needs of the whole New Zealand agriculture sector, and more.
Owned by 8Rivers, a US based infrastructure technology firm, the project is being developed by Pouakai NZ Limited Partnership (“Pouakai LP”), it is expected to come online by 2024. Once operational, the Pouakai facility will produce approximately 600 tonnes of zero-emissions hydrogen per day. It is expected to use, in one cohesive natural gas-fed facility, three process technologies:
• NET Power’s Allam Cycle (see page 64) electricity generation.• 8Rivers’ 8RH2 hydrogen production technology.• ammonia synthesis and synthetic nitrogen fertiliser production
train consuming internally-produced feedstocks, all sharing a common air separation unit.
8Rivers has been developing Allam Cycle technology since 2008, including raising development capital through NET Power from Exelon, McDermott and Occidental Petroleum and NP. A successful 50MW reference plant exists in La Porte, near Houston, Texas. In combination with 8RH2 technology, it’s expected to cut feedstock (hydrogen, power and nitrogen) input costs in ammonia and synthetic nitrogen-fertiliser production.
Project Pouakai will have a process approximately 25 per cent more efficient than leading fertiliser plants globally, while enabling high-efficiency baseload and peak power generation.
Other 2019 updates for CCS in Japan:
• With ongoing support from Japan’s Ministry of Economy, Trade and Industry, CCS Co. Ltd’s Tomakomai CCS facility, remains Asia’s first full-cycle CCS hydrogen plant. In 2019, it reached a capture milestone of 300,000 tonnes of CO2, and continued intensive monitoring of storages.
• Construction continued at Toshiba Corporation’s 49MW Mikawa power plant in the Fukuoka Prefecture for biomass (and coal) with carbon capture. Completion is expected in early 2020.
• A new CO2 capture plant was established in August 2019, continuing progress at the Osaki CoolGen facility in the Hiroshima Prefecture. The JPOWER and Chugoku Electric Power Company’s 166 MW oxygen-blown integrated gasification combined cycle (IGCC) facility will separate and capture CO2 from the end of 2019. Solid oxide fuel cells will make up stage three.
• Toshiba’s carbon capture and utilisation system at the Saga City Waste Incineration Plant continued operating, using captured CO2 for algae culture.
AUSTRALIA
If Australia is to contribute to global emissions reduction goals at the lowest possible cost, CCS is essential. It can also help decarbonise energy-intensive industries that depend on fossil fuels, enabling just transitions for many regional communities who rely on mining for economic and social sustainability. Australia is in a good position to embrace CCS, with a well-developed legal and regulatory framework, and moderate to high confidence that over 400Gt of geological storage capacity is available nationally.
In 2019:
• Gorgon commenced in August – the world’s nineteenth large-scale CCS project and Australia’s first. When fully operational, CO2 injection at this natural gas processing facility will lead to CO2 storage of around 3.4-4 Mtpa. It will be the world’s largest dedicated geological storage facility.
• Momentum continued around the Hydrogen Energy Supply Chain (HESC) pilot project in the LaTrobe Valley. Construction of the pilot brown coal gasification plant, which will produce hydrogen, commenced in late 2019.
• Victoria’s CarbonNet project continued to consider the potential for establishing a commercial scale CCS transport and CO2 storage network. It included field investigation activities such as geophysical and geotechnical surveys.
• Advanced research by the CO2CRC continued, with stage three project work beginning at the Otway National CCS Research Facility.
The IEA’s 2018 Review of Australia’s Energy Policies stated that: “Australia is well placed to demonstrate cutting-edge technologies, including concentrated solar power, battery storage and carbon capture and storage.”72 The IEA urged Commonwealth and State Governments to step up support for technology R&D and commercialisation, including through the Australian Renewable Energy Agency (ARENA) and the Clean Energy Finance Corporation (CEFC).
To fully realise the opportunities offered by CCS, Australia will need a dedicated and expanded focus on creating supportive policy and addressing legal and regulatory barriers to deployment, across both State and Federal jurisdictions.
4.0 Regional Overviews 4.5 Asia Pacific
53

CCS Ambassadors
Since 2012, Japan CCS has been steadily accumulating numerous results and achievements in the Tomakomai CCS Demonstration Project, under the leadership of the Japanese Government and the warm support and cooperation of the people of Tomakomai City, led by Mayor Iwakura.
The Tomakomai CCS Demonstration Project is playing an important role of firstly to achieve the objective of demonstrating a full-chain CCS system comprising the capture, injection and storage from onshore into sub-seabed reservoirs of a cumulative amount of 300,000 tonnes of CO2, and further to resolve the challenges towards the practical use of CCS technology in Japan post 2020.
Reflecting on our trajectory towards this objective, we achieved 100,000 tonnes in November 2017, 200,000 tonnes in August 2018, and en route to achieving our objective by the end of 2019.
Our achievement of safe and secure operation of the Tomakomai Project in the vicinity of a large city, and in spite of major earthquakes and disasters has established that CCS is a safe and sound mitigation technology against global warming. Also, in conjunction with the demonstration of CCS technology, we have been active in fostering the acceptance of CCS by the local community, and have been steadily advancing our global warming efforts together with the local community.
Our efforts in Japan in countering global warming have been received very highly internationally, and we have widely promoted the storage of CO2 into the offshore sub-seabed. Of particular note is our deep collaborative relationship with the Global CCS Institute, which has been instrumental is disseminating widely our achievements in the international scene. The trust that has been extended to us by the Institute has inspired us in our day-to-day activities has led us on a path towards contributing to the development of CCS in the world, for which we are truly grateful.
As has been pointed out in the IPCC SR15 report, the earth in which we live is experiencing serious consequences of global warming. In recent years, Japan has suffered extensive damage from heavy rains and giant typhoons caused by rising sea water temperatures, and many people are starting to witness firsthand the effects of the extreme changes in the global environment.
We consider our efforts in global warming countermeasures through the promotion of CCS to be our duty, and will continue our active engagement in international activities.
To this end, under the guidance of the Japanese Government, and in collaboration with the local and global community, we will endeavor towards the improvement of our technical capabilities and the large-scale deployment of CCS in Japan and abroad. While aiming to proceed to the next step in CCUS which takes into perspective the efficient use of CO2, we will continue our international activities in order that the achievements of the Tomakomai CCS Demonstration Project are shared and effectively utilised not only in Japan but also abroad as pioneering accomplishments in offshore sub-seabed CO2 storage, and in doing so make a small contribution towards the mitigation of global warming.
The government of Japan approved “the Long-Term Strategy under Paris Agreement” at a cabinet meeting in June 2019. The Strategy holds a long-term vision of reducing GHG emissions by 80 per cent by 2050, proclaiming “a decarbonized society” as its ultimate goal, and aiming to accomplish it as early as possible in the second half of this century. Under this long-term vision, CCS is regarded as a technology contributing to substantial GHG emission reductions in the future.
So far, Japan has been working on a large-scale demonstration test at Tomakomai, Hokkaido, research and development on CO2 separation and safety management technologies, and a study of suitable storage sites, aiming for the practical application of the CCS technology around 2020. Especially, the demonstration project at Tomakomai, which draws global attention, achieved the accumulative CO2 injection amount of 280,000 ton as of the end of September 2019, having made successful progress in coordination with local stakeholders.
Meanwhile, in order to realize the future societal implementation of CCS in Japan, further reduction of CCS costs and availability of transportation from distant CO2 sources to suitable storage sites with enough potential are issues needing to be addressed. Social acceptance of CCS needs to be ensured as well. Efforts are needed to proceed with the full chain of economic and safe separation and capture, transportation, and storage, under appropriate division of roles between the government and the private sector.
Looking at efforts in other countries, “the Long-Term Strategy under Paris Agreement” promotes to “seek international collaboration on research and development, demonstration, standardization and further rulemaking.” Participating in the CEM CCUS Initiative and the IEA CCUS Summit among others so far, Japan has been actively promoting efforts for further deployment of CCUS, while supporting overseas operations of its private companies under bilateral cooperation with countries such as the US, Indonesia, and Saudi Arabia. Japan continues to seek for such multilateral and bilateral cooperation.
As a technology that is capable of reducing substantial CO2 emissions, it is important not only for Japan but also for the entire world to put CCS into practical use and realize its commercialisation. I would like to extend my respect to activities of the Global CCS Institute, which is working to promote the worldwide deployment of CCS.
SHOICHI ISHIIIIDA YUJI
Director-General, Industrial Science and Technology Policy and Environment Bureau Ministry of Economy, Trade and Industry (METI), Japan
President, Japan CCS Co. Ltd
“ AS A TECHNOLOGY THAT IS CAPABLE OF REDUCING SUBSTANTIAL CO2 EMISSIONS, IT IS IMPORTANT NOT ONLY FOR JAPAN BUT ALSO FOR THE ENTIRE WORLD TO PUT CCS INTO PRACTICAL USE AND REALIZE ITS COMMERCIALISATION.”
54

55
5.0 CCS DEVELOPMENT: TECHNOLOGY AND APPLICATIONS

1.0 INTRODUCTION1.1 About Global CCS Institute1.2 About the Report1.3 Acronyms1.4 CEO Foreword
2.0 MEETING THE CLIMATE CHALLENGE: THE NEED FOR CCS
3.0 GLOBAL STATUS OF CCS3.1 Global CCS Facilities Update3.2 Policy Levers for Accelerating Deployment 3.3 Global CO2 Storage Overview3.4 Legal and Regulatory Overview
4.0 REGIONAL OVERVIEWS4.1 International Climate Policy Overview 4.2 Americas4.3 Europe4.4 Middle East and Central Asia4.5 Asia Pacific
5.0 CCS DEVELOPMENT: TECHNOLOGY AND APPLICATIONS
5.1 Natural Gas5.2 Hydrogen5.3 CCS in the Power Sector5.4 Bioenergy with Carbon Capture
and Storage (BECCS)5.5 Direct Air Capture (DAC)5.6 CO2 Utilisation5.7 CCS Innovation5.8 Industry’s Transition to a Net-zero Future
6.0 APPENDICES
7.0 REFERENCES

5.0 CCS development: Technology and Applications 5.1 Natural Gas
5.1 NATURAL GAS
DECARBONISING POWER, INDUSTRY AND KICK-STARTING THE ENERGY TRANSITION
In 2018, demand for natural gas grew at its fastest pace since 2010, accounting for almost half of added global energy demand73. It is expected to grow at about 1.6 per cent per year through to 2024, largely because it is seen as a fix to worsening air quality in non-OECD countries, can replace retiring coal and nuclear in Europe, and is undercutting coal in the US74. The IEA’s Sustainable Development Scenario75 sees gas demand stabilising slightly below this forecast somewhere between the mid-2020s and 2040. While gas power generation produces half the carbon dioxide emissions of coal, at around 350 kg CO2/mega watt hour (MWh) for the most efficient combined cycle gas plant, it is not considered a low emissions technology. Natural gas production and processing also produce significant CO2 emissions.
Eliminating almost all greenhouse gas emissions along the natural gas value chain is necessary if we are to meet the target of net-zero emissions by mid-century. More than 700 Mtpa76 of indirect CO2 emissions – almost equal to the emissions of Germany in 201677 – could be eliminated from oil and gas operations through the application of CCS. Applying CCS at gas processing facilities costs around USD20-25 per tonne CO278. It is not only one of the lowest cost CCS-applications, but is already capturing 25 Mtpa79 at ten of 19 operating large-scale CCS facilities80. Even so, roughly 150 Mtpa81 of effectively pure CO2 is still being vented from facilities around the globe. CCS can play a role in laying out a sustainable path for natural gas to become one of the preferred fuels of the future.
The liquified natural gas trade is forecast to grow by a quarter to 202482. The SDS expects it to increase another 15 per cent in the period to 204083. Natural gas usually contains CO2 which has to be stripped to 0.0005 per cent CO2 before liquefaction (compared to piped gas which usually has less than 0.5 per cent CO2), to comply with local regulations and protect equipment. Natural gas is already being decarbonised at these processing facilities:
• The Gorgon CCS project was established due to a condition of the project's approval—the gas field contains 14 per cent of CO284, which has to be stripped before liquefaction. The facility commenced CO2 storage in August 2019 and is expected to store 80 per cent of reservoir CO2 (or 3.4 to 4 Mtpa), reducing the facility’s total emissions by 40 per cent. When operating at full capture capacity, it will be the world’s largest dedicated geological storage project.
• A CCS project at the Snøhvit LNG plant in Norway has been operating since 2008, storing about 0.7 Mtpa in a depleted natural gas field, under the sea bed.
Natural gas power generation with CCS, and other low emission dispatchable power technologies, are an important complement to the increasing use of intermittent renewables—ensuring system reliability and resilience. Studies demonstrate that a grid consisting of firm low-carbon generation capacity reduces the cost of the energy transition and enhances energy security in decarbonisation scenarios85. The average age of the global natural gas fleet is only 19 years86 and more than 130 GW87 of unabated capacity is under construction globally, potentially locking in emissions for decades. CCS retrofits will be necessary so climate goals can be reached.
There are many opportunities already for CCS technologies to provide low cost emissions abatement in gas production and usage. It is a growing market.
THE ALLAM CYCLE OPPORTUNITY
A new gas-based power generation technology is being developed by NetPower which offers the promise of electricity generation with carbon capture for the same cost as conventional natural gas combined cycle generation. The technology utilises the Allam Cycle. In a conventional natural gas combined cycle generator, the combustion gases from methane burnt in air drive a turbine which in turn drives a generator to produce electricity. The exhaust gases from the turbine then pass through a heat exchanger to heat water creating steam which drives a second turbine, also connected to the generator, producing additional power. The flue gases consist mostly of nitrogen (from air), carbon dioxide and water. Capturing the carbon dioxide from the flue gases of a conventional gas powered generator requires the installation and operation of a capture plant to separate the carbon dioxide, which makes up only about 10 per cent, from the other gases, mostly nitrogen. This adds cost and reduces the amount of electricity produced. In a conventional gas powered generator, the power required to run the carbon dioxide capture plant may reduce the overall efficiency of the generator by 10 to 15 percentage points.
The Allam cycle burns gas in an atmosphere of oxygen and carbon dioxide producing only carbon dioxide and water in the combustion gases, which then drive a turbine and a generator. The hot exhaust gases pass though a heat exchanger, condensing the water (which is removed), the remaining pure carbon dioxide is re-compressed and an amount equal to that continuously added from the combustion of methane is bled off at high pressure ready for transport and geological storage. The remaining carbon dioxide is re-heated in the heat exchanger and recycled into the combustion unit and turbine.
Even though significant power is required by the air separation unit necessary to produce the oxygen for the combustor, the efficiency advantages of the Allam cycle over conventional combined cycle generators produce equivalent over-all efficiencies (almost 60 per cent). However, the Allam cycle enjoys a very significant advantage over conventional gas power systems with respect to the capture of carbon dioxide as it requires no additional equipment or power to separate carbon dioxide from its flue gases, ready for geological storage. Thus there is no parasitic load, no loss of efficiency and no reduction in electricity produced.
57

5.2 HYDROGEN
THE FOCUS ON HYDROGEN
Hydrogen regained the spotlight in 2019 as a multipurpose, clean fuel for a net-zero future, producing no greenhouse gas emissions when used. The breadth of regions, countries and cities with strategies and supportive policies for using and producing hydrogen, demonstrates global recognition of the fuel’s potential to decarbonise economies88. In 2018 alone, the EU and 18 national governments made notable hydrogen announcements and by mid-2019 there were 50 incentives in place globally to support its use89. Hydrogen is expected to play a major role in decarbonising industrial processes, transport, domestic heating, and possibly electricity generation (see Figure 23 below).
Demand for clean hydrogen is expected to grow strongly. A briefing paper prepared for the Australian Commonwealth and State Governments on the development of a National Hydrogen Strategy envisages demand exceeding 530 Mtpa by 205090, up from 70 Mtpa today91.
Currently, 98 per cent of global hydrogen production is from unabated fossil fuels, around three quarters92 stemming from natural gas. CO2 emissions from its production are approximately 830 Mtpa93, equivalent to the annual emissions of the UK in 201894. To meet climate targets, hydrogen must be produced via zero or very low emission pathways. The European Commission95 and several countries have already directly identified CCS as a key consideration for achieving this96. Australia, New Zealand, Japan, China, the US and the Netherlands have also indicated its importance in their hydrogen policies (see Appendix 6.3 for details).
FIGURE 22 HYDROGEN PRODUCTION AND USE
BIOMASS
INDUSTRY TRANSPORT HEAT POWER
REFORMER PLANT
GASIFICATION PLANT
INPUTS & FUELS
PRODUCTION
USES
COALOILNATURAL GAS
HYDROGEN TRAIN
HYDROGENFUEL CELL
ELECTRIC TRUCK
HYDROGEN FUEL CELL
ELECTRIC CAR
CHEMICAL PLANTSTEEL PLANT
FERTILISER PLANTREFINERY PLANT
DOMESTIC & INDUSTRIAL HEAT
HYDROGEN GAS TURBINE
HYDROGENSTORAGE
HYDROGEN CO2 FEEDSTOCK HEAT POWER
CO2STORAGE
CCS
58

In contrast, production using electrolysis with renewables accounts for only 0.7 per cent100 of the 70 Mtpa of dedicated hydrogen produced today101. If hydrogen demand reaches 530Mtpa by 2050, producing this via electrolysis would require about 25,000 terrawatt hours (TWh)vii of electricity from renewable or nuclear generation. This is approximately 2.8 times the total electricity generated from all renewable sources and nuclear combined in 2017102, viii. Creating enough renewable energy for both hydrogen production and low emissions electricity is extremely challenging.
COMMERCIAL VIABILITY
Price will be a key decider of whether hydrogen plays a significant role in emissions reduction. Low-carbon hydrogen produced using gas reforming and gasification technologies with CCS is proven, operating at commercial scale and available for deployment right now. Hydrogen produced using coal or methane with CCS costs USD1.70-2.40 per kilogram103 compared to USD7.45 for hydrogen produced via electrolysisix. CCS hydrogen costs two thirds less.
Action is required now to ensure hydrogen can play its role in the global energy transition, at the scale required to meet emissions reductions targets. Scaling up low-carbon hydrogen production with CCS will require capital grants or incentivising policies from governments104, viii, a value on carbon and market mechanisms to create demand.
HYDROGEN PRODUCTION WITH CCS
The three main technologies used to produce low-carbon hydrogen are:
• gas reforming (mostly from steam methane reforming) with CCS;• coal gasification with CCS; and • electrolysis powered by renewables.
Each technology offers its own benefits and will play a role in the global energy transition97. The advantages of low-carbon hydrogen production through gas reforming and coal gasification with CCS, centre around the maturity of the technologies, scale and commercial viability.
MATURITY
Low-carbon hydrogen has been produced through gas reforming and coal gasification with CCS, for almost two decades. For example, the Great Plains Synfuel Plant in North Dakota, US, commenced operation in 2000 and produces approximately 1,300 tonnes of hydrogen (in the form of hydrogen rich syngas) per day, from brown coal98. Hydrogen produced from coal or gas with CCS is the lowest cost clean hydrogen by a significant margin and requires less than one tenth of the electricity needed by electrolysis. Where renewable electricity is relatively scarce using renewable electricity to displace unabated fossil generation capacity in the grid may deliver more emissions reduction than using it to produce hydrogen in electrolysers.
There are five low-carbon hydrogen production facilities with CCS operating globally and three under construction, with a total production capacity of 1.5 million tonnes99. Another three are in advanced development (see Figure 24 below).
SCALE
For hydrogen to make a meaningful contribution to global greenhouse gas emission reductions, it will need to be produced in very large quantities to displace a significant proportion of current fossil fuel demand. Scaling up for low-carbon hydrogen production with CCS is currently far less challenging than scaling up the use of electrolysis. Commercial scale hydrogen production facilities with CCS that each produce around 1000 tonnes of hydrogen per day are already operating. Coal, methane and pore space for CO2 storage are plentiful. When produced on a large scale, low-carbon hydrogen made with CCS is currently the lowest cost source available.
5.0 CCS development: Technology and Applications 5.2 Hydrogen
FIGURE 23 INDUSTRIES INVOLVING HYDROGEN PRODUCTION WITH CCS – GLOBAL FACILITY PIPELINE
* Indicates the primary industry type of the facility among various options. Size of the circle is proportional to the capture capacity of the facility.
IN OPERATION 2016 2017 2018 2019 2020 2021 2022 2023 2024 2025+
INDUSTRIES INVOLVING HYDROGEN PRODUCTION
QUESTACTL STURGEON
PORTHOS
CARBONNET*GREAT PLAINS
AIR PRODUCTSENID FERTILISER
ACTL AGRIUMCOFFFEYVILLE
WABASH
SINOPEC QILU
1 Mtpa CO2 CIRCLE AREA PROPORTIONATE TO CAPACITY= IN OPERATION IN CONSTRUCTION ADVANCED DEVELOPMENT
59
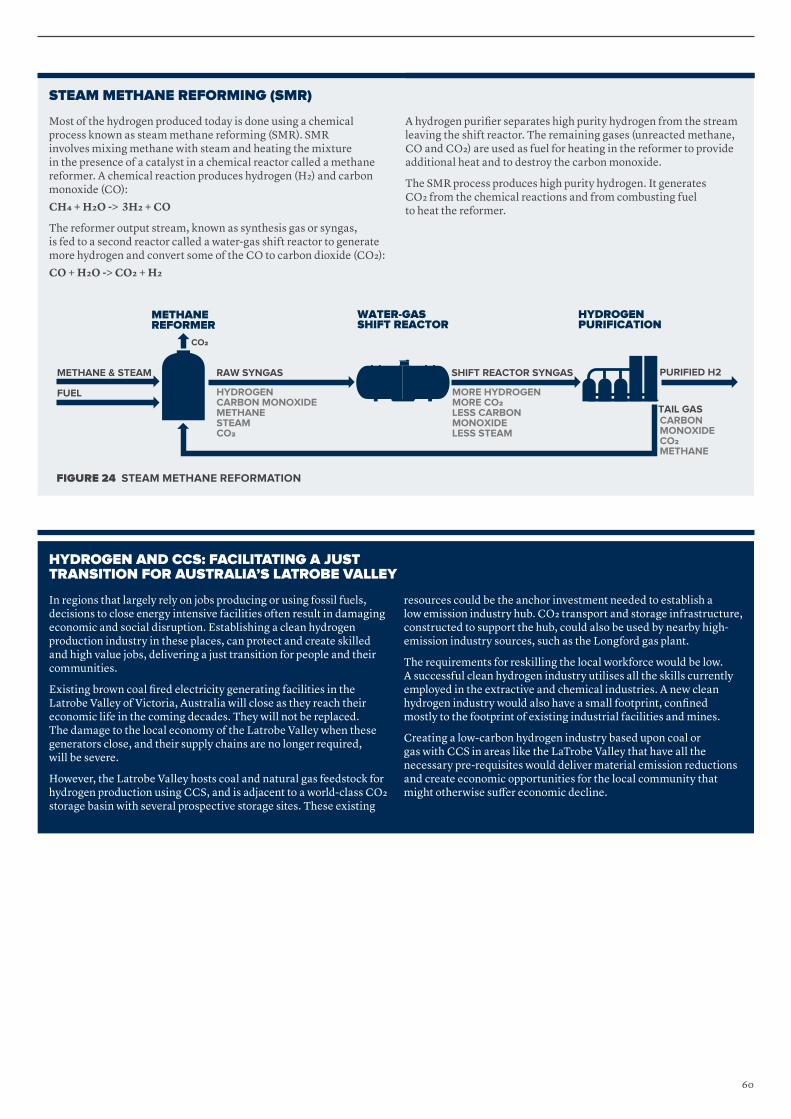
HYDROGEN AND CCS: FACILITATING A JUST TRANSITION FOR AUSTRALIA’S LATROBE VALLEY
In regions that largely rely on jobs producing or using fossil fuels, decisions to close energy intensive facilities often result in damaging economic and social disruption. Establishing a clean hydrogen production industry in these places, can protect and create skilled and high value jobs, delivering a just transition for people and their communities.
Existing brown coal fired electricity generating facilities in the Latrobe Valley of Victoria, Australia will close as they reach their economic life in the coming decades. They will not be replaced. The damage to the local economy of the Latrobe Valley when these generators close, and their supply chains are no longer required, will be severe.
However, the Latrobe Valley hosts coal and natural gas feedstock for hydrogen production using CCS, and is adjacent to a world-class CO2 storage basin with several prospective storage sites. These existing
resources could be the anchor investment needed to establish a low emission industry hub. CO2 transport and storage infrastructure, constructed to support the hub, could also be used by nearby high-emission industry sources, such as the Longford gas plant.
The requirements for reskilling the local workforce would be low. A successful clean hydrogen industry utilises all the skills currently employed in the extractive and chemical industries. A new clean hydrogen industry would also have a small footprint, confined mostly to the footprint of existing industrial facilities and mines.
Creating a low-carbon hydrogen industry based upon coal or gas with CCS in areas like the LaTrobe Valley that have all the necessary pre-requisites would deliver material emission reductions and create economic opportunities for the local community that might otherwise suffer economic decline.
STEAM METHANE REFORMING (SMR)
Most of the hydrogen produced today is done using a chemical process known as steam methane reforming (SMR). SMR involves mixing methane with steam and heating the mixture in the presence of a catalyst in a chemical reactor called a methane reformer. A chemical reaction produces hydrogen (H2) and carbon monoxide (CO):CH4 + H2O -> 3H2 + CO
The reformer output stream, known as synthesis gas or syngas, is fed to a second reactor called a water-gas shift reactor to generate more hydrogen and convert some of the CO to carbon dioxide (CO2):CO + H2O -> CO2 + H2
A hydrogen purifier separates high purity hydrogen from the stream leaving the shift reactor. The remaining gases (unreacted methane, CO and CO2) are used as fuel for heating in the reformer to provide additional heat and to destroy the carbon monoxide.
The SMR process produces high purity hydrogen. It generates CO2 from the chemical reactions and from combusting fuel to heat the reformer.
FIGURE 24 STEAM METHANE REFORMATION
PURIFIED H2
HYDROGENCARBON MONOXIDEMETHANESTEAMCO2
MORE HYDROGENMORE CO2LESS CARBON MONOXIDELESS STEAM
METHANEREFORMER
WATER-GASSHIFT REACTOR
HYDROGENPURIFICATION
CO2
METHANE & STEAM
FUEL
RAW SYNGAS
CARBONMONOXIDECO2METHANE
TAIL GAS
SHIFT REACTOR SYNGAS
60

5.3 CCS IN POWER SECTORMost planned and active CCS projects are in industrial sectors where high concentration CO2 is readily available and can be captured at relatively low cost. However, to enable sustainable economic growth and elevate living standards while achieving Paris Agreement targets, deep emissions reductions are needed across all sectors, especially the power sector. There are only two large-scale CCS facilities currently operating therex.
Rapid deployment of renewable energy has reduced the amount of dispatchable power required from fossil fuel sources, but the nature of wind and solar generation, mean renewables may create challenges for energy systems mostly not designed for intermittent generation105. High levels of intermittent energy may even substantially increase overall system costs106. Coal and gas fuelled power stations equipped with CCS delivers dispatchable low emissions electricity demanded by advanced economies, and requires no additional measures to ensure grid resilience and reliability of supply. As the penetration of intermittent renewable generation in a grid increases, additional investment in transmission augmentation, energy storage, demand side management and artificial inertia is also required. The lowest cost low emissions electricity grid will require dispatchable low emissions generators alongside intermittent renewable generation capacity.
According to the IEA, existing and under construction energy facilities account for around 95 per cent of the emissions ‘budget’ under its SDS107. Coal-fired power stations make up around one third of total energy-related emissions globally. To enable continued operation in a low-carbon world, asset owners need to conduct economic and technology feasibility assessments on retrofitting options. In developing countries, especially in Asia where coal fired power plants have an average age of eleven years108 and decades of economic life, retrofitting CCS will be required to reduce emissions.
Under the IEA’s SDS, it is expected that 350 MtCO2 will be captured and stored from the power sector in 2030109. Since large-scale CCS projects in power have long lead times – in the range of 6-10 years – the power sector must take substantive steps now, to meet those targets in 10-20 years.
5.0 CCS development: Technology and Applications 5.3 CCS in Power Sector
5.4 BIOENERGY WITH CARBON CAPTURE AND STORAGE (BECCS)Bioenergy with Carbon Capture and Storage (BECCS) is a promising class of technologies. The production of sustainable biomass is considered to be renewable energy, so integrating its combustion or fermentation with CCS technology, achieves negative emissions. Bioenergy is used to fuel vehicles (as bioethanol) and to provide electricity through biomass combustion, displacing fossil fuels as a source of thermal energy. It is considered one of the few scalable carbon dioxide removal options. BECCS is a feature of IPCC scenarios consistent with limiting global warming to 1.5 degrees110.
Despite its potential, there are some serious hurdles ahead of wide scale BECCS deployment:
• Productivity and resource requirements for different types of land and biomass vary significantly. Growing forest based residues uses 1-1.7 hectares for every tonne of CO2 removed annually while purpose-grown energy crops need approximately 0.1-0.4 hectares111.
• Producing crops specifically for BECCS can involve land clearing, which may reduce or even reverse its carbon removal potential112.
• Wide scale deployment of BECCS could compete or overlap with land available for forest creation or food production, leading to significant changes in ecosystems113.
• Producing biomass at the scale required demands large amounts of water and fertiliser.
Apart from the IEA, several prominent organisations (Royal Society, Stanford University, Imperial College London and others) remain committed to BECCS, viewing it as an essential technology in the fight against climate change. Many private sector companies also see BECCS as a way to decarbonise and shelter themselves from carbon prices, or as a means to meet regulation requirements. In July 2013, UK based Drax power station converted the first of its six boilers to fire using biomass. Their decision was made in response to the UK Government’s 2025 deadline for phasing out coal in the power sector. Drax initiated a CCS pilot project in 2018 which now captures 1 tonne of CO2 per day. If successful, the pilot will pave the way towards negative emissions in the UK.
The other main application of BECCS uses fermentation to produce bioethanol. Bioethanol production produces a relatively pure stream of CO2 gas which presents an opportunity for low cost capture and makes BECCS facilities a relatively low cost development. This could be especially relevant in developing countries, which are responsible for approximately 35 per cent of global ethanol production114.
The Institute regards the deployment of BECCS as a proven and important complement to CCS, so long as it uses sustainably sourced biomass. It cannot, however, be relied upon as the only form of CCS. It is one option in a suite of solutions.
Boundary Dam, Canada. Photo Courtesy of SaskPower.
61

CCS Ambassadors
Researcher, Institute of Rock and Soil Mechanics, Chinese Academy of Sciences
PROFESSOR WEI NING
“ THE TOTAL THEORETICAL CO2 STORAGE RESOURCES IN CHINA CAN REACH 2,500 GIGATONNES”
OPPORTUNITIES IN CHINA
China’s total annual CO2 emissions are currently approximately 10 billion tonnes. Four major sectors: coal power, modern coal conversion, cement and the iron and steel industry account for more than two-thirds of total emissions. Technologies to capture and geologically store CO2, using China’s vast storage resources, is predicted to significantly improve the range and affordability of options available to mitigate rising emissions from those four industries.
In addition, CO2 geological storage and utilisation technologies can be applied to enhance the recovery of hydrocarbons, underground water, geothermal, and other resources to offset the high cost of CO2 storage. Among these options, the capacity of CO2
If we want to limit warming to 1.5°C, we need to halve global CO2 emissions in ten years compared to now, and CO2 emissions need to be net zero in 2050. Every tonne and every year counts. Technological and cost developments in CCS are outpaced by those in renewable electricity. CCS is therefore only useful when fast implementation and environmental performance can be assured. This means in industry. CCS has a role there if it enables an industrial system transition and takes us out of the current carbon lock-in. If that can be done, we should get on with it.”
HELEEN DE CONINCKAssociate Professor, Department of Environmental Science, Radboud UniversityCoordinating Lead Author of Chapter 4 of the IPCC Special Report on Global warming of 1.5°C
EOR and gas (EGR) recovery, underground water (EWR), and coal-bed methane (ECBM) recovery have the highest potential. Also, CO2-EOR and CO2-EWR have sufficient technical readiness levels (TRL) and relatively low cost to deploy large, industrial-scale facilities today.
The total theoretical CO2 storage resources in China can reach 2,500 gigatonnes (50 per cent probability) with very high variations, including resource availability, spatial distribution of suitable sites, TRL, and corresponding cost ranges of various CO2 geological storage and utilisation options.
The theoretical CO2 storage resources available in order of decreasing resource potential are: deep saline aquifers for EWR (2,471 GtCO2); coal-bed methane for ECBM (114 GtCO2); oil fields for EOR (4.76 GtCO2); and natural gas fields for EGR (4.02 GtCO2). The levelised cost of abatement in the order of increasing cost are EOR, EGR, and EWR, being the highest cost amongst the three technologies.
Systematic source-sink matching results show that the effective annual mitigation potential of CGUS and dedicated geological storage could reach 3.5 gigatonne per annum in China. The combined levelised cost of abatement is less than 60 USD/t CO2 in those four major industry sectors above under current techno-economic conditions. Highly prospective regions include the North, Northeast, and Northwest of China.
6262

5.5 DIRECT AIR CAPTURE (DAC)Direct Air Capture (DAC) is a modular technology that can capture CO2 directly from the atmosphere using chemicals that bind or stick to it. CO2 can then be stored or repurposed into CO2 re-use applications, such as manufacture of construction aggregates, plastics and synthetic fuels.
There are two promising groups of DAC technologies:
• Large infrastructural DAC using water solutions containing hydroxides to extract CO2 from the air. It requires high temperatures (greater than 800°C ) for regeneration, which tends to be provided by burning natural gas.
• A modular technology based on amine materials bonded to a porous solid support. The process operates at 85°-120°C requiring far less heat energy. There is potential for future cost reductions through mass production.
Compared to other other forms of negative emissions (carbon dioxide removal i.e. trees), DAC facilities require little land. There are however, concerns about its requirement for large amounts of water and energy to extract low concentration CO2 from the atmosphere. Recent models estimate that if DAC was the only CO2 removal method used to avoid a rise of 1.5°C in global average temperature by 2050, its energy requirements would represent approximately half of current global energy consumption115.
• Climeworks, a Swiss company utilising modular DAC technology, estimates its capture costs to be between USD500-700 per tonne CO2 stored. It relies on support from individuals and companies, willing to purchase emissions reduction certificates for a higher price than they could get on a market like the EU ETS. Climeworks aims to bring the cost of storage down to approximately USD100 per tonne CO2116, so that it can access a larger market and upscale the technology.
• Development of the world’s largest DAC plant was recently announced by Oxy Low Carbon Ventures and Carbon Engineering Ltd in the US. They are working on the engineering and design of a facility that will capture an estimated 1 Mtpa of CO2 from the atmosphere every year. The gas will be used for EOR and be permanently sequestered in the Permian Basin. Projected revenues from the EOR have made this large-scale DAC project commercially viable. In addition, the project is designed to be eligible for 45Q tax credits and the LCFS CCS Protocol (see Section 4.3).
• Global Thermostat in the US has built two pilot facilities, each with the capacity to remove 3,000-4,000 tonnes of CO2 per year117. They will use captured CO2 to produce synthetic fuels.
The cost of DAC may reduce its appeal for wide scale deployment. Progress is being made though, and it is on its way to playing a role in combatting climate change.
5.0 CCS development: Technology and Applications 5.5 Direct Air Capture (DAC)
5.6 CO2 UTILISATIONIn the next several decades, the geological storage of CO2 will do the vast amount of work to meet climate goals. However, carbon utilisation has an important role to play. To illustrate, Mac Dowell et al estimate that up to 700 million tonnes per annum of CO2 could be utilized by 2050118. Estimates by the IPCC of the amount of CO2 that must be stored using CCS by the middle of this century to limit global warming to 1.5 degrees are around 5000 to 10,000 million tonnes per year119.
Carbon utilisation will expand investment in the testing and refining of capture technologies and can be used to permanently sequester CO2 at locations where transportation pipelines are impractical or not economically feasible.
CCUS is the process of capturing CO2 to be recycled for further use. Carbon utilisation’s effectiveness as a positive weapon in the fight against climate change depends on how it is used. It can be ‘substituted’ for natural CO2 in EOR, or be used as an input to the production of something of value. Interest and investment in converting CO2 to a different form or substance is recently booming. In general terms, CO2 utilisation delivers emissions abatement where:
• The CO2 utilised would have otherwise been emitted to the atmosphere and it remains permanently stored (EOR) or bound in the product (eg concrete).
• The CO2 utilised would have otherwise been emitted to the atmosphere and the product displaces a product of fossil fuel origin (eg production of synthetic liquid fuels displacing diesel).
• The CO2 utilised would have otherwise been emitted to atmosphere, and it displaces CO2 produced from a natural source solely for that purpose (eg greenhouse horticulture).
CO2 ‘SUBSTITUTE’
Dutch waste recycling and waste-to-energy firm AVR is beginning construction of a large-scale CO2 capture system in its Duiven plant. The pure CO2 stream, once an industry by-product, will be transported by Air Liquide to greenhouse horticulture areas in the Netherlands. A similar project is occurring in Saga, Japan. Both projects will see enhanced plant growth through the addition of extra CO2, while avoiding the use of natural CO2 or natural gas for cultivation.
REPURPOSED CO2
Other companies have developed technologies to permanently store CO2 in building materials and chemical products:
• CarbonCure, Blue Planet, and Solidia Technologies have various sized concrete and aggregates projects underway worldwide, many in North America.
• BluePlanet bubbles waste gases from California’s largest power plant at Moss Landing through seawater, collecting CO2. Around 90 per cent is removed and then combined with minerals in the water to create limestone.
• Lanzatech creates chemical products and fuels using emissions from industrial facilities, and has several projects around the globe.
• Cemvita Factory uses CO2 as the feedstock for sustainable production of intermediate chemicals and polymers.
63
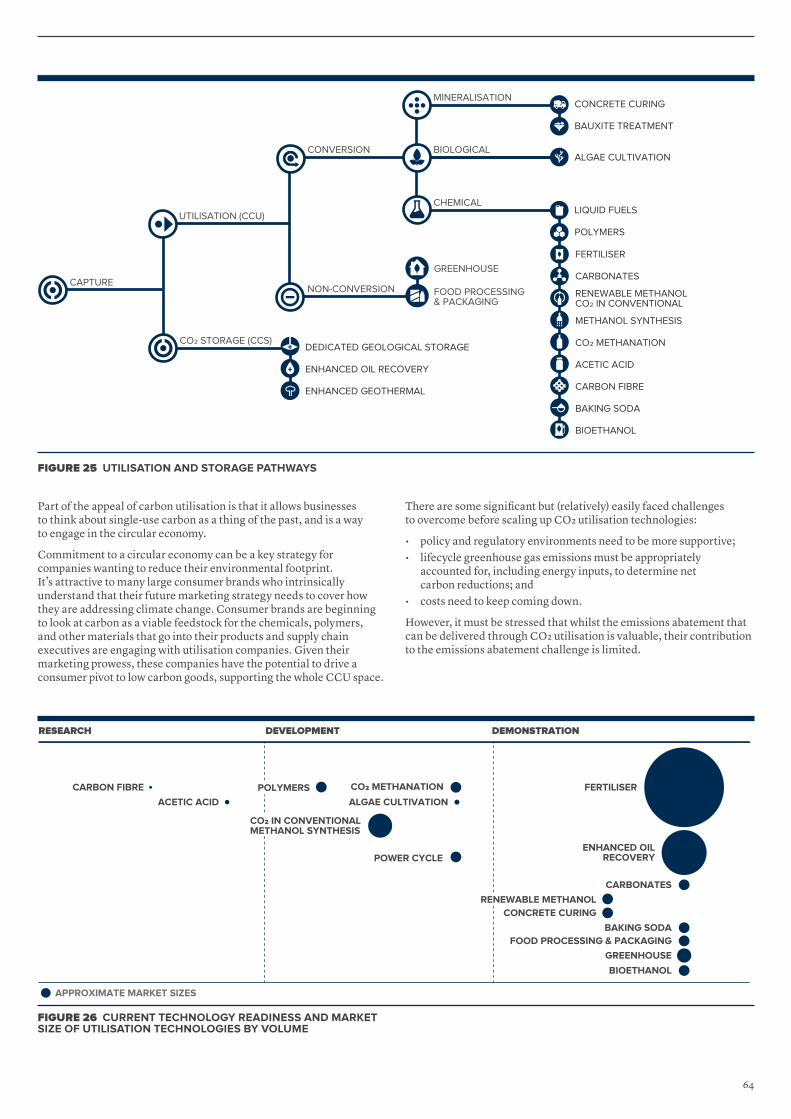
Part of the appeal of carbon utilisation is that it allows businesses to think about single-use carbon as a thing of the past, and is a way to engage in the circular economy.
Commitment to a circular economy can be a key strategy for companies wanting to reduce their environmental footprint. It’s attractive to many large consumer brands who intrinsically understand that their future marketing strategy needs to cover how they are addressing climate change. Consumer brands are beginning to look at carbon as a viable feedstock for the chemicals, polymers, and other materials that go into their products and supply chain executives are engaging with utilisation companies. Given their marketing prowess, these companies have the potential to drive a consumer pivot to low carbon goods, supporting the whole CCU space.
There are some significant but (relatively) easily faced challenges to overcome before scaling up CO2 utilisation technologies:
• policy and regulatory environments need to be more supportive; • lifecycle greenhouse gas emissions must be appropriately
accounted for, including energy inputs, to determine net carbon reductions; and
• costs need to keep coming down.
However, it must be stressed that whilst the emissions abatement that can be delivered through CO2 utilisation is valuable, their contribution to the emissions abatement challenge is limited.
CAPTURE
UTILISATION (CCU)
NON-CONVERSION
CONVERSION
MINERALISATION
ALGAE CULTIVATION
CONCRETE CURING
BAUXITE TREATMENT
BIOLOGICAL
CHEMICAL
CO2 STORAGE (CCS)
GREENHOUSE
FOOD PROCESSING& PACKAGING
LIQUID FUELS
POLYMERS
FERTILISER
CARBONATES
RENEWABLE METHANOLCO2 IN CONVENTIONAL
METHANOL SYNTHESIS
CO2 METHANATION
ACETIC ACID
CARBON FIBRE
BAKING SODA
BIOETHANOL
DEDICATED GEOLOGICAL STORAGE
ENHANCED OIL RECOVERY
ENHANCED GEOTHERMAL
FIGURE 25 UTILISATION AND STORAGE PATHWAYS
RESEARCH DEVELOPMENT DEMONSTRATION
FERTILISER
ENHANCED OILRECOVERY
CARBONATES
CONCRETE CURING
BAKING SODAFOOD PROCESSING & PACKAGING
GREENHOUSE
BIOETHANOL
POWER CYCLE
ALGAE CULTIVATION
CO2 METHANATION
APPROXIMATE MARKET SIZES
CARBON FIBRE
ACETIC ACID
CO2 IN CONVENTIONAL METHANOL SYNTHESIS
POLYMERS
RENEWABLE METHANOL
FIGURE 26 CURRENT TECHNOLOGY READINESS AND MARKET SIZE OF UTILISATION TECHNOLOGIES BY VOLUME
64

WHAT HAS BEEN LEARNED?
• Modularising previously large-scale capture plants has reduced the price of design and construction – improving reliability and quality control through shop fabrication, lower front-end costs, and increased flexibility to add more capture units when required.
• Operating expenses have been reduced through the development of advanced solvents with lower regeneration energy and high degradation resistance–
• the energy required for amine regeneration applied to coal combustion flue gas has significantly improved from values around 5.5 GJ/t CO2 to 3.0 GJ/t CO2 for advanced amines, and to below 2.5 GJ/t CO2 in the latest enhanced solvent technology; and
• high degradation resistance means reduced demand for the makeup of the capture solvent.
• Process optimisation using inter-cooling, lean vapour recompression, split flow arrangement and stripper inter-heating can further drive costs down.
• Heat integration and the amount of steam/cooling water needed, also affect operating costs. Finding the right steam supply method, maximising steam extraction efficiency at nominal and partial loads and recovering waste heat for use in the plant steam cycle are now seen as very important in new generation carbon capture plants.
5.0 CCS development: Technology and Applications 5.7 CCS Innovation
5.7 CCS INNOVATION Carbon dioxide capture has been an essential part of industrial processes for 90 years, either through chemical absorption (amines, since 1930120), physical absorption, adsorption or a membrane or cryogenic distillation-based separation process. In natural gas processing and urea fertiliser production, CO2 separation is an inherent part of the production process, so the cost for capture is very low121. In other industries like hydrogen, iron and steel and cement production, and in waste-to-energy, CO2 capture has been proven at commercial scale but not yet widely deployed.
In the power sector, CO2 capture has only recently been applied at two commercial facilities – both coal fired generators – Boundary Dam since 2015 and Petra Nova since 2017122. The extra costs of capture and the absence of policies to justify investment are primary barriers to large-scale deployment of CCS in power generation. However, good progress has been made to reduce the cost of carbon capture and to optimise performance through project learning. Next-generation capture technologies have also emerged to drive costs down.
PROJECT LEARNING
Providers of goods and services compete to reduce costs and to improve the utility of their products in pursuit of market share. As a market grows, economies of scale and scope and learning-by-doing deliver cost reductions. Innovation happens and can only be protected from competitors for a finite time until knowledge leakage inevitably spreads developments throughout an entire industry. Demand increases until market saturation occurs. The net result is the familiar pattern of technology costs reducing over time, in real terms. This is exactly the pattern observed in relation to renewable energy technologies this century, driven by very strong and sustained policy support.
The process of cost reduction is only just beginning in the global CCS industry. Boundary Dam123 and Petra Nova demonstrate how cost innovation is happening, even in the absence of a strong competitive market. Altering design, construction and operations can reduce costs for future carbon capture facilities:
• SaskPower reported in 2015 that, based on project learning from Boundary Dam, they could cut costs by up to 30 per cent on new CCS power projects. Their CCS feasibility study for SaskPower Shand power plant, was based on a 67 per cent reduction in capital costs and a levelized capture cost of USD45 per tonne CO2 (prefeasibility level +40/-25%) 124. Shand is significantly cheaper than their first-of-a-kind facility.
• In 2018 NRG Energy showed that, based on their learnings, their next CO2 capture retrofit will be at least 20 per cent cheaper, reaching a levelised capture cost of USD47 per tonne CO2125.
Valuable project learning is leading to real improvements for large-scale capture plants126, xi. Figure 28 (right) shows that the cost of carbon capture in the power industry reduces through its evolution from the Boundary Dam CCS facility, to Petra Nova Carbon Capture facility, and the proposed Shand CCS facility. First-of-a-kind plants are expected to have substantially higher financial risks and costs for design and construction, but provide experience and knowledge for cost reductions in subsequent CCS plants.
100
120
60
40
20
80
0
LEV
ELI
SE
D C
OS
T O
F C
AP
TU
RE
(US
D$
20
18 P
ER
TO
NN
E C
O²)
BOUNDARYDAM
PETRANOVA
SHAND
CAPTIAL COST FIXED O&M
FUEL COST VARIABLE O&M
FIGURE 27 BREAK DOWN OF LEVELISED COST OF CAPTURE (LCOC) FOR BOUNDARY DAM, PETRA NOVA AND SHAND127, xiii
First-of-a-kind plant would be expected to have substantially higher financial risks and extra cost for design and construction, but it provides experience and knowledge for the cost reductions in the subsquent CCS plants.GCCSI Analysis based on 8% discount rate, 30 years project life, 2.5 years construction time, capacity factor of 85%. Cost data are normalised to 2017 values. Expected accuracy range: Boundary Dam and Petra Nova: -10% to +15%, Shand: -25% to +40%.
65

5.8 INDUSTRY’S TRANSITION TO A NET-ZERO FUTUREIndustry is the basis of our modern society and is an essential source of economic growth, bringing financial benefits and job opportunities to communities around the world. While creating this wealth, industry uses about one-third of global energy and produces nearly a third of global greenhouse gases. To limit global warming to 1.5°C, the IPCC estimates that these direct and indirect emissions must fall by 75-90 per cent by 2050, relative to 2010 levels128. Under net-zero emission targets, industry must become carbon neutral. It will require a portfolio of mitigation options including: improved energy efficiency, electrification via renewable energy, innovation in production processes, materials and feedstocks, and CCS.
CCS is essential to industrial decarbonisation. It can provide clean growth opportunities and help ensure a just and sustainable transition for industrial regions and communities. There is a strong case for arguing that without CCS, the necessary deep decarbonisation of industry is simply not possible. CCS essential to industrial decarbonisation. It can provide clean growth opportunities and help ensure a just and sustainable transition for industrial regions and communities. Today, the vast majority of CCS projects are in industrial application.
The Energy Transitions Commission states that achieving net-zero emissions in hard-to-abate sectors without CCS “will probably be impossible, and certainly more expensive.” It describes CCS as the most cost-effective route to decarbonising chemicals, steel and hydrogen production129. The IEA estimates that CCS can contribute 28 gigatonnes of CO2 emissions reductions in industry from 2017 to 2060130. The IEA’s Clean Technology Scenario, places CCS as the second most important lever for deep emissions cuts, accounting for 38 per cent in the chemical sector, 17 per cent in cement and 15 per cent in iron and steel131. CCS is currently a key option available for deeply decarbonizing cement, steel and iron production.
CEMENT
The cement industry contributes 8 per cent of global CO2 emissions132. Heating the kiln for calcination of limestone and then the calcination reaction itself, produces almost all the emissions from clinker production. Around 90 per cent of the CO2 can be captured and stored using CCS, as long as engineering design is optimised. This is already happening:
• The LEILAC project recently demonstrated that direct separation (removing CO2 from limestone as it is being heated) could capture more than 95 per cent of CO2 process emissions133.
• Calix is piloting this new, efficient and cost-competitive direct separation technology.
• Norway’s Norcem project, which is part of a larger Northern Lights project, aims to use post-combustion technologies to capture CO2 from a cement plant.
STEEL AND IRON
Steel and iron production is reliant on coal, as both a feedstock and a fuel, and the industry produces almost as much CO2 every year as cement production134. Unlike cement though, emissions arise at different points in the production process. CO2 must be captured during heating and from the blast furnace when iron is being reduced to make steel. Recent innovations include:
• An alternative to hot metal production and conventional blast furnaces—the smelting Reduction HIsarna Process has the potential to capture 80 per cent of CO2 emissions from steelmaking when deployed together with CCS135; and
• The launch of the “3D” project (for DMX™ Demonstration) in Dunkirk — a consortium of European stakeholders is piloting the capture of CO2 emissions at ArcelorMittal’s facility.
CHEMICAL INDUSTRY: ETHYLENE AND AMMONIA
The chemical industry, which produces products like plastic, is the industrial sector’s third-largest emitter136. CCS has not been applied at commercial-scale in this sector. Some possibilities are:
• Ethylene, used mostly as a base for plastics, is made from various hydrocarbons that are ‘cracked’ in pyrolysis furnaces. Known as steam cracking, most CO2 is generated when fuel heats the furnaces. Capturing CO2 from furnace exhaust gases is already a proven CCS application in the power and iron and steel industries.
• Ammonia, used as a base ingredient for fertilisers and explosives, is a critical input for the agriculture and mining sectors. It is derived from either coal or natural gas, and its production emits a mixture of hydrogen and nitrogen, as well as a large, near-pure, stream of CO2. Two large-scale CCS facilities already compress, transport and use (for EOR) pure stream CO2.
FIGURE 28 INDUSTRIAL EMISSIONS BY SECTOR BY IN 2017137
IRON AND STEEL (2.07 GTCO2)
CEMENT (2.22 GTCO2)
ALUMINIUM (0.25 GTCO2)
CHEMICALS AND PETROCHEMICALS (1.14 GTCO2)
PULP AND PAPER (0.17 GTCO2)
OTHER INDUSTRY (2.07 GTCO2)
28%
26.2%26.1%
14.4%
3.2%
2.1%
66

5.0 CCS development: Technology and Applications 5.8 Industry’s Transition to a Net-zero Future
CAPTURE TECHNOLOGY INNOVATION
Next-generation capture technologies have unique features – either through material innovation, process innovation and/or equipment innovation – which reduce capital and operating costs and improve capture performance. (See Figure 29 below).
Some of these technologies are already being considered in engineering studies for CCS facilities. They are:
• Ion Engineering’s non-aqueous ICE-21 solvent – selected for a Front-End Engineering Design (FEED) study, retrofitting to Nebraska Public Power District’s Gerald Gentleman Station.
• Membrane Technology and Research’s PolarisTM membrane system – selected for a FEED study at Basin Electric’s Dry Fork Station.
• Mitsubishi Heavy Industries’ new KS-21TM solvent – selected for a FEED study retrofitting to Prairie State Generating Company’s Energy Campus.
• Linde-BASF’s lean-rich solvent absorption/regeneration cycle technology – selected for a FEED study at Southern Company’s natural gas-fired power plant.
• The University of Texas’s piperazine advanced stripper (PZAS) process – selected for a FEED study at the Mustang Station of Golden Spread Electric Cooperative138.
Next generation technologies are helping to drive down CCS development costs and shorten deployment timelines. Assisted by industry improvements that result from learning-by-doing at facility operation and project management level, these developments are edging CCS closer to widespread deployment.
FIGURE 29 SELECTED NEXT-GENERATION CAPTURE TECHNOLOGIES BEING TESTED AT 0.5 MWe (10 T/D) SCALE OR LARGER WITH ACTUAL FLUE GAS139
VENDOR TECHNOLOGYCURRENT SCALE 2014 2015 2016 2017 2018 2019 2020 2021 2022 2023 2024 2025
SOLVENTS
LINDE/BASF ADVANCED AMINE/ HEAT INTEGRATION
15 MWe
ION ENGINEERING NON-AQUEOUS SOLVENT/ AMINE MIXTURE
12 MWe
IFPEN / AXENS SOLID-LIQUID PHASE CHANGE SOLVENTS
0.7 MWe
UNIVERSITY OF KENTUCKY
HEAT-INTEGRATED ADVANCED AMINE
0.7 MWe
THE UNIVERSITY OF TEXAS AT AUSTIN
PIPERAZINE AND FLASH STRIPPER PROCESS
0.5 MWe
SORBENTS
INVENTYS INTENSIFIED RAPID-CYCLE TSA
2 MWe
TDA ALKALIZED ALUMINA SORBENT
0.5 MWe
MEMBRANES
FUELCELL ENERGY MCFC WITH ELECTROCHEMICAL MEMBRANE
3 MWe
MTR POLARIS™ MEMBRANE
1 MWe
SOLID LOOPING
CARBON ENGINEERING
CHEMICAL LOOPING
0.5 MWe
INHERENT CAPTURE
NET POWER / 8 RIVERS CAPITAL
ALLAM CYCLE 25 MWe
BENCH SMALL PILOT LARGE PILOT DEMONSTRATIONTECHNOLOGY DEVELOPMENT STAGE
67

CO2 CAPTURE RATES CAN APPROACH 100 PER CENT
Carbon dioxide capture rates from low concentration gas streams such a power station flue gas, have historically targeted 90 per cent. This capture rate has almost become the default target however, as described below, there is no technical reason why capture rates in the high nineties can not be delivered. Notwithstanding what is technically feasible, both of the first retrofits of CCS to coal fired power stations adopted the 90 per cent capture target.
The Boundary Dam CCS retrofit has not achieved an overall capture rate of 90 per cent since it commenced operating due to down time required for maintenance and process improvements. As a first of a kind plant, it is not surprising that operational difficulties were encountered. However these lessons only need to be learned once and the operators of Boundary Dam, SaskPower, make all of their operational data available to share those learnings.
The Petra Nova facility, which is the second retrofit of CCS to a coal fired power station, has avoided similar difficulties. Petra Nova captures 90 per cent of the CO2 (approximately 1.4 million tonnes per year) from a slip stream of flue gas equivalent to that produced by a 240MW power station. The capacity of the capture plant was determined by the demand for CO2. If there was sufficient demand, there is no reason why Petra Nova could not have treated all of the flue gas produced by the power station, at a capture rate of 90 per cent or more.
A 2019 techno-economics analysis by CSIRO140 and IEAGHG141 looked at the cost of achieving 99 per cent CO2 capture in fossil fuel-fired power plants, compared to achieving 90 per cent. Excluding transport and storage, cost went up by three per cent in an ultra-supercritical coal plant and by eight per cent in a natural gas combined cycle.
Figure 30 (below) shows that emissions with CCS can be reduced to:
• 48 grams CO2eq / kWh (9 grams CO2eq/kWh direct emissions) in a coal fired plant; and
• 89 grams CO2eq / kWh (4 grams CO2eq/kWh direct emissions) in a gas fired plant.
There is no technological barrier to capturing 99 per cent of direct CO2 emissions in coal or natural gas-fired power plants.
0
25
50
75
100
150
125
COAL FIRED WITH 90% CAPTURE
GAS FIRED COMBINED
CYCLE WITH 90% CAPTURE
COAL FIRED WITH 99% CAPTURE
GAS FIRED COMBINED
CYCLE WITH 99% CAPTURE
SOLAR PHOTOVOLTAIC
UTILITY
WIND
INDIRECT EMISSIONDIRECT EMISSION
EM
ISS
ION
INT
EN
SIT
Y (
GR
AM
CO2e
q p
er kW
H)
FIGURE 30 COMPARISON OF EMISSION INTENSITY IN FOSSIL-FUEL-FIRED POWER PLANT WITH 90 PER CENT AND 99 PER CENT CO2 CAPTURE142
Note: Direct emission in a power plant refers to greenhouse gas emission from the on-site power production; indirect Emission in a power plant includes a variety of emissions from the supply chain, e.g. extraction and transport of fossil fuels, and/or infrastructure used.
68

69
6.0 APPENDICES

1.0 INTRODUCTION1.1 About Global CCS Institute1.2 About the Report1.3 Acronyms1.4 CEO Foreword
2.0 MEETING THE CLIMATE CHALLENGE: THE NEED FOR CCS
3.0 GLOBAL STATUS OF CCS3.1 Global CCS Facilities Update3.2 Policy Levers for Accelerating Deployment 3.3 Global CO2 Storage Overview3.4 Legal and Regulatory Overview
4.0 REGIONAL OVERVIEWS4.1 International Climate Policy Overview 4.2 Americas4.3 Europe4.4 Middle East and Central Asia4.5 Asia Pacific
5.0 CCS DEVELOPMENT: TECHNOLOGY AND APPLICATIONS
5.1 Natural Gas5.2 Hydrogen5.3 CCS in the Power Sector5.4 Bioenergy with Carbon Capture
and Storage (BECCS)5.5 Direct Air Capture (DAC)5.6 CO2 Utilisation5.7 CCS Innovation5.8 Industry’s Transition to a Net-zero Future
6.0 APPENDICES
7.0 REFERENCES
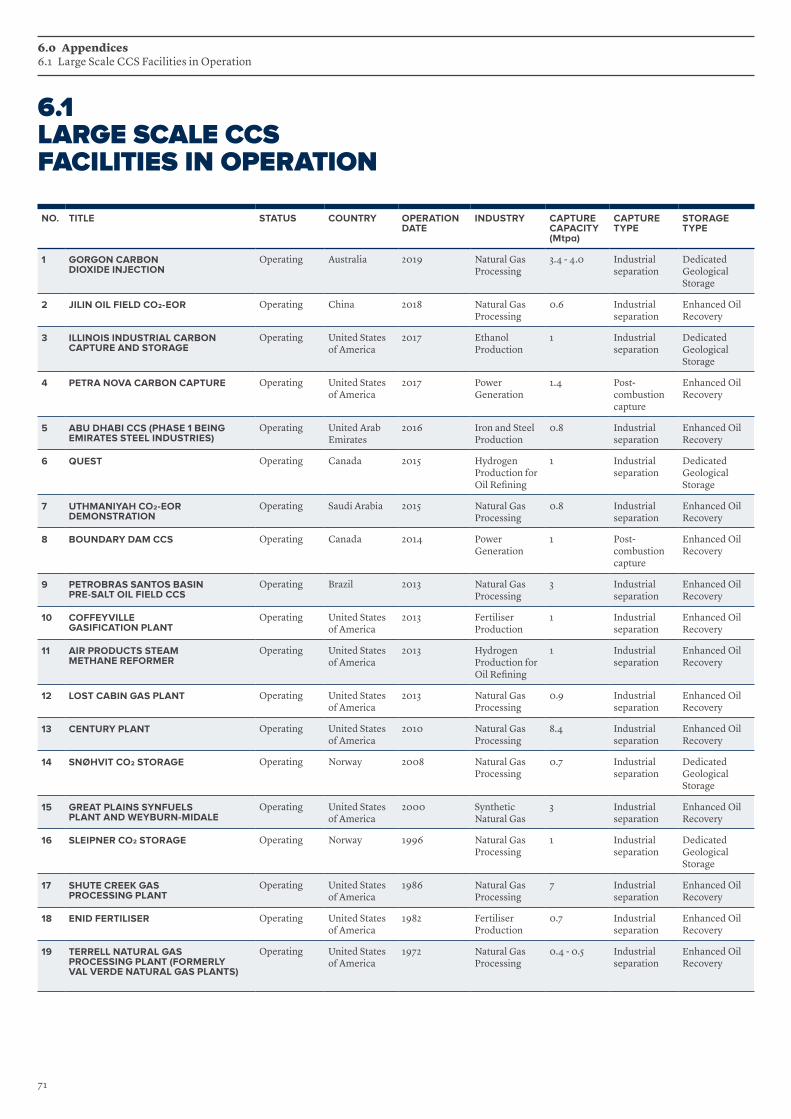
NO. TITLE STATUS COUNTRY OPERATION DATE
INDUSTRY CAPTURE CAPACITY (Mtpa)
CAPTURE TYPE
STORAGE TYPE
1 GORGON CARBON DIOXIDE INJECTION
Operating Australia 2019 Natural Gas Processing
3.4 - 4.0 Industrial separation
Dedicated Geological Storage
2 JILIN OIL FIELD CO2-EOR Operating China 2018 Natural Gas Processing
0.6 Industrial separation
Enhanced Oil Recovery
3 ILLINOIS INDUSTRIAL CARBON CAPTURE AND STORAGE
Operating United States of America
2017 Ethanol Production
1 Industrial separation
Dedicated Geological Storage
4 PETRA NOVA CARBON CAPTURE Operating United States of America
2017 Power Generation
1.4 Post-combustion capture
Enhanced Oil Recovery
5 ABU DHABI CCS (PHASE 1 BEING EMIRATES STEEL INDUSTRIES)
Operating United Arab Emirates
2016 Iron and Steel Production
0.8 Industrial separation
Enhanced Oil Recovery
6 QUEST Operating Canada 2015 Hydrogen Production for Oil Refining
1 Industrial separation
Dedicated Geological Storage
7 UTHMANIYAH CO2-EOR DEMONSTRATION
Operating Saudi Arabia 2015 Natural Gas Processing
0.8 Industrial separation
Enhanced Oil Recovery
8 BOUNDARY DAM CCS Operating Canada 2014 Power Generation
1 Post-combustion capture
Enhanced Oil Recovery
9 PETROBRAS SANTOS BASIN PRE-SALT OIL FIELD CCS
Operating Brazil 2013 Natural Gas Processing
3 Industrial separation
Enhanced Oil Recovery
10 COFFEYVILLE GASIFICATION PLANT
Operating United States of America
2013 Fertiliser Production
1 Industrial separation
Enhanced Oil Recovery
11 AIR PRODUCTS STEAM METHANE REFORMER
Operating United States of America
2013 Hydrogen Production for Oil Refining
1 Industrial separation
Enhanced Oil Recovery
12 LOST CABIN GAS PLANT Operating United States of America
2013 Natural Gas Processing
0.9 Industrial separation
Enhanced Oil Recovery
13 CENTURY PLANT Operating United States of America
2010 Natural Gas Processing
8.4 Industrial separation
Enhanced Oil Recovery
14 SNØHVIT CO2 STORAGE Operating Norway 2008 Natural Gas Processing
0.7 Industrial separation
Dedicated Geological Storage
15 GREAT PLAINS SYNFUELS PLANT AND WEYBURN-MIDALE
Operating United States of America
2000 Synthetic Natural Gas
3 Industrial separation
Enhanced Oil Recovery
16 SLEIPNER CO2 STORAGE Operating Norway 1996 Natural Gas Processing
1 Industrial separation
Dedicated Geological Storage
17 SHUTE CREEK GAS PROCESSING PLANT
Operating United States of America
1986 Natural Gas Processing
7 Industrial separation
Enhanced Oil Recovery
18 ENID FERTILISER Operating United States of America
1982 Fertiliser Production
0.7 Industrial separation
Enhanced Oil Recovery
19 TERRELL NATURAL GAS PROCESSING PLANT (FORMERLY VAL VERDE NATURAL GAS PLANTS)
Operating United States of America
1972 Natural Gas Processing
0.4 - 0.5 Industrial separation
Enhanced Oil Recovery
6.1 LARGE SCALE CCS FACILITIES IN OPERATION
6.0 Appendices 6.1 Large Scale CCS Facilities in Operation
71

NO. TITLE STATUS COUNTRY OPERATION DATE
INDUSTRY CAPTURE CAPACITY (Mtpa)
CAPTURE TYPE
STORAGE TYPE
20 ALBERTA CARBON TRUNK LINE ("ACTL") WITH NORTH WEST REDWATER PARTNERSHIP'S STURGEON REFINERY CO2 STREAM
In Construction
Canada 2020 Hydrogen Production for Oil Refining
1.2 - 1.4 Industrial separation
Enhanced Oil Recovery
21 ALBERTA CARBON TRUNK LINE ("ACTL") WITH AGRIUM CO2 STREAM
In Construction
Canada 2020 Fertiliser Production
0.3 - 0.6 Industrial separation
Enhanced Oil Recovery
22 SINOPEC QILU PETROCHEMICAL CCS
In Construction
China 2020 Chemical Production
0.40 Industrial separation
Enhanced Oil Recovery
23 YANCHANG INTEGRATED CARBON CAPTURE AND STORAGE DEMONSTRATION
In Construction
China 2020 - 2021 Chemical Production
0.41 Industrial separation
Enhanced Oil Recovery
24 WABASH CO2 SEQUESTRATION Advanced development
United States of America
2022 Fertiliser production
1.5-1.75 Industrial separation
Dedicated Geological Storage
25 PORT OF ROTTERDAM CCUS BACKBONE INITIATIVE (PORTHOS)
Advanced development
Netherlands 2023 Various 2.0 -5.0 Various Dedicated Geological Storage
26 NORWAY FULL CHAIN CCS Advanced development
Norway 2023-2024 Cement production and waste-to-energy
0.80 Various Dedicated Geological Storage
27 LAKE CHARLES METHANOL Advanced development
United States of America
2024 Chemical production
4.20 Industrial separation
Enhanced oil recovery
28 ABU DHABI CCS PHASE 2 - NATURAL GAS PROCESSING PLANT
Advanced development
United Arab Emirates
2025 Natural gas processing
1.9 - 2.3 Industrial separation
Enhanced Oil Recovery
29 DRY FORK INTEGRATED COMMERCIAL CCS
Advanced development
United States of America
2025 Power generation 3.00 Post-combustion capture
Dedicated Geological Storage or Enhanced Oil Recovery
30 CARBONSAFE ILLINOIS – MACON COUNTY
Advanced development
United States of America
2025 Power generation and ethanol production
2.0 - 5.0 Post-combustion capture and industrial separation
Dedicated Geological Storage and Enhanced Oil Recovery
31 PROJECT TUNDRA Advanced development
United States of America
2025 - 2026 Power generation 3.1 - 3.6 Post-combustion capture
Dedicated Geological Storage or Enhanced Oil Recovery
32 INTEGRATED MID-CONTINENT STACKED CARBON STORAGE HUB
Advanced development
United States of America
2025 - 2035 Ethanol production, power generation and/or refinery
1.90 Various Dedicated Geological Storage and Enhanced Oil Recovery
33 CARBONNET Advanced development
Australia 2020's Under evaluation 3.00 Under Evaluation
Dedicated Geological Storage
34 OXY AND WHITE ENERGY ETHANOL EOR FACILITY
Early development
United States of America
2021 Ethanol production
0.6-0.7 Industrial separation
Enhanced Oil Recovery
35 SINOPEC EASTERN CHINA CCS
Early development
China 2021 Fertiliser production
0.50 Industrial separation
Enhanced oil recovery
36 HYDROGEN 2 MAGNUM (H2M) Early development
Netherlands 2024 Power Generation 2.00 Under Evaluation
Dedicated Geological Storage
6.2 LARGE SCALE CCS FACILITIES IN CONSTRUCTION, ADVANCED AND EARLY DEVELOPMENT
72
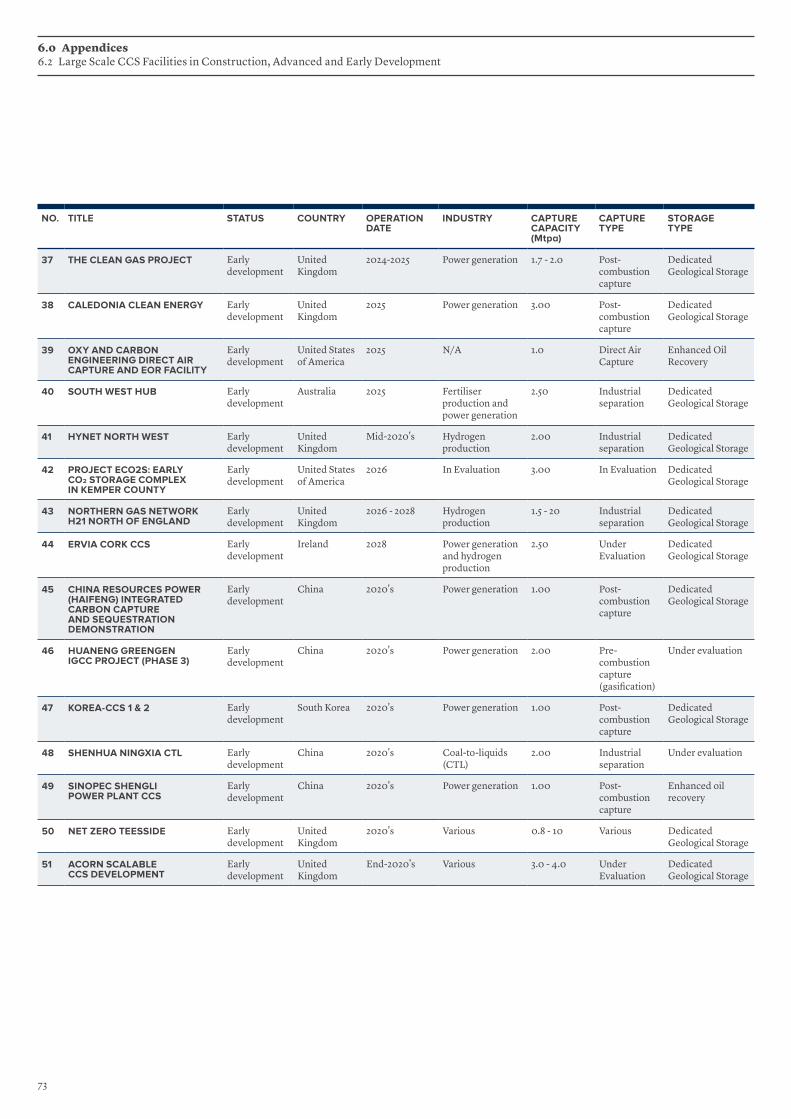
NO. TITLE STATUS COUNTRY OPERATION DATE
INDUSTRY CAPTURE CAPACITY (Mtpa)
CAPTURE TYPE
STORAGE TYPE
37 THE CLEAN GAS PROJECT Early development
United Kingdom
2024-2025 Power generation 1.7 - 2.0 Post-combustion capture
Dedicated Geological Storage
38 CALEDONIA CLEAN ENERGY Early development
United Kingdom
2025 Power generation 3.00 Post-combustion capture
Dedicated Geological Storage
39 OXY AND CARBON ENGINEERING DIRECT AIR CAPTURE AND EOR FACILITY
Early development
United States of America
2025 N/A 1.0 Direct Air Capture
Enhanced Oil Recovery
40 SOUTH WEST HUB Early development
Australia 2025 Fertiliser production and power generation
2.50 Industrial separation
Dedicated Geological Storage
41 HYNET NORTH WEST Early development
United Kingdom
Mid-2020's Hydrogen production
2.00 Industrial separation
Dedicated Geological Storage
42 PROJECT ECO2S: EARLY CO2 STORAGE COMPLEX IN KEMPER COUNTY
Early development
United States of America
2026 In Evaluation 3.00 In Evaluation Dedicated Geological Storage
43 NORTHERN GAS NETWORK H21 NORTH OF ENGLAND
Early development
United Kingdom
2026 - 2028 Hydrogen production
1.5 - 20 Industrial separation
Dedicated Geological Storage
44 ERVIA CORK CCS Early development
Ireland 2028 Power generation and hydrogen production
2.50 Under Evaluation
Dedicated Geological Storage
45 CHINA RESOURCES POWER (HAIFENG) INTEGRATED CARBON CAPTURE AND SEQUESTRATION DEMONSTRATION
Early development
China 2020's Power generation 1.00 Post-combustion capture
Dedicated Geological Storage
46 HUANENG GREENGEN IGCC PROJECT (PHASE 3)
Early development
China 2020's Power generation 2.00 Pre-combustion capture (gasification)
Under evaluation
47 KOREA-CCS 1 & 2 Early development
South Korea 2020's Power generation 1.00 Post-combustion capture
Dedicated Geological Storage
48 SHENHUA NINGXIA CTL Early development
China 2020's Coal-to-liquids (CTL)
2.00 Industrial separation
Under evaluation
49 SINOPEC SHENGLI POWER PLANT CCS
Early development
China 2020's Power generation 1.00 Post-combustion capture
Enhanced oil recovery
50 NET ZERO TEESSIDE Early development
United Kingdom
2020's Various 0.8 - 10 Various Dedicated Geological Storage
51 ACORN SCALABLE CCS DEVELOPMENT
Early development
United Kingdom
End-2020's Various 3.0 - 4.0 Under Evaluation
Dedicated Geological Storage
6.0 Appendices 6.2 Large Scale CCS Facilities in Construction, Advanced and Early Development
73

COUNTRY INCLUSION/DETAIL/IMPORTANCE OF CCS IN HYDROGEN STRATEGY
AUSTRALIA Consultations by the National Hydrogen Working Group to develop a National Hydrogen Strategy by the end of 2019 are already considering the production of hydrogen using fossil fuels and CCS. In addition, construction at the Hydrogen Energy Supply Chain (HESC) liquefaction and loading facility began in July 2019. The HESC is a project, supported by a consortium of government and industry partners from Australia and Japan, will look at the feasibility of turning brown coal from the Latrobe Valley into hydrogen to be shipped to Japan and using the CarbonNet CCS project to transport and store emissions in the nearby Gippsland basin.
JAPAN Host of the 2019 G20, Japan used this important platform to highlight hydrogen. This included hosting the first Hydrogen Energy Ministerial meeting and, in the same month, adopted a carbon-neutrality strategy that includes innovation goals for both carbon capture and hydrogen and launched a Japan H2 Mobility program which aims build 80 refueling stations by 2021143.
UNITED STATES The United States also showed progress in the development of hydrogen production with CCS with provisions added to the 45Q tax credit to incentivise the conversion of CO2 and other products, and included conversion via combination with hydrogen144. In addition, the amendment of California’s Low Carbon Fuel Standard to enable CCUS came into effect. This created a way for companies that produce hydrogen via SMR with carbon capture to generate credits, while also incentivising the roll-out of hydrogen-fuelling capacity – thus eliminating one of the barriers to adoption.
UNITED KINGDOM In the UK, the majority of hydrogen production is expected to use natural gas with CCS and is being driven by the dedicated policies, reviews and investments in hydrogen as a low emissions technology to decarbonise transport and heat sectors, as well as industry145.For example, the H21 Leeds Citygate project, after a detailed economic and technical feasibility study conducted in 2016, has proposed to decarbonise the existing natural gas network in the UK city of Leeds by converting it to 100 per cent hydrogen. The project involves a process of hydrogen production using Steam Methane Reforming of natural gas; the associated carbon emissions will be sequestered under the North Sea.
EUROPE The Hydrogen Roadmap Europe146 was published in February 2019 by FCH JU, which consists of members representing the European Commission, Hydrogen Europe and Hydrogen Research Europe. With the aim of supporting research and development in fuel cell and hydrogen energy technologies, the study focuses on pathways for their large-scale deployment until 2050. The production of hydrogen from steam methane reforming processes is highlighted as an avenue for the decarbonization of the transport and industrial sectors. In particular CCS is recommended for companies as a proven method of producing very low carbon hydrogen on a large scale. The EU’s “Clean Planet for All’ decarbonization strategy was published by the European Commission in November 2018. The strategy considers several pathways to reach decarbonization by 2050. The production of hydrogen from natural gas steam reforming using CCS, for energy storage purposes, energy carrier purposes in the transport, heat and industrial sectors and as a feedstock for industry is considered as a potential decarbonization strategy in these sectors.
NETHERLANDS Outlines of a Hydrogen Roadmap147 was drafted by TKI New Gas (Top Sector Energy) on behalf of the Ministry of Economic Affairs and Climate Policy. Published in March 2018, the report explores decarbonisation pathways using hydrogen in the industrial and transport sectors. The report recommends exploring hydrogen production from natural gas with CCS (blue hydrogen) in order to accelerate large-scale application of hydrogen.
6.3 HYDROGEN STRATEGIES WITH CCS
74

75
7.0 REFERENCES

1.0 INTRODUCTION1.1 About Global CCS Institute1.2 About the Report1.3 Acronyms1.4 CEO Foreword
2.0 MEETING THE CLIMATE CHALLENGE: THE NEED FOR CCS
3.0 GLOBAL STATUS OF CCS3.1 Global CCS Facilities Update3.2 Policy Levers for Accelerating Deployment 3.3 Global CO2 Storage Overview3.4 Legal and Regulatory Overview
4.0 REGIONAL OVERVIEWS4.1 International Climate Policy Overview 4.2 Americas4.3 Europe4.4 Middle East and Central Asia4.5 Asia Pacific
5.0 CCS DEVELOPMENT: TECHNOLOGY AND APPLICATIONS
5.1 Natural Gas5.2 Hydrogen5.3 CCS in the Power Sector5.4 Bioenergy with Carbon Capture
and Storage (BECCS)5.5 Direct Air Capture (DAC)5.6 CO2 Utilisation5.7 CCS Innovation5.8 Industry’s Transition to a Net-zero Future
6.0 APPENDICES
7.0 REFERENCES

7.0 REFERENCES
1.0 INTRODUCTION
N/A
MEETING THE CLIMATE CHALLENGE: ROLE OF CCS
1. International Energy Agency (2019), Global Energy and CO2 Status Report, accessed from <https://www.International Energy Agency.org/geco/>.
2. Intergovernmental Panel on Climate Change (2018), Global warming of 1.5°C. An IPCC Special Report on the impacts of global warming of 1.5°C above pre-industrial levels and related global greenhouse gas emission pathways, in the context of strengthening the global response to the threat of climate change, accessed from <https://www.ipcc.ch/sr15/>.
3. International Energy Agency (2019), World Energy Outlook 2019, available at <www.International Energy Agency.org/weo>.
3.0 CCS STATUS 3.1 GLOBAL CCS FACILITIES UPDATE
4. Global CCS Institute (2019a), ‘CO2RE Database, Facilities Report’, accessed from <https://CO2RE.co/FacilityData>.
5. Global CCS Institute (2018), The Global Status of CCS Report 2018, Melbourne, Australia, accessed from <https://www.globalccsinstitute.com/resources/global-status-report/>.
6. ExxonMobil (2019), 2019 Energy and Carbon Summary, accessed from <https://corporate.exxonmobil.com/-/media/Global/Files/energyand-carbon-summary/Energy-and-carbon-summary.pdf>.
7. Basin Electric Power Cooperative (2019), Great Plains Synfuels Plant, accessed from <https://basinelectric.com/ sites/CMS/files/files/pdf/Fact-Sheets-Media-Kit/DGC- fact-sheet-8-19.pdf>.
8. Equinor (2018), Equinor - Climate Change 2018, accessed from <https://www.equinor.com/content/dam/statoil/documents/sustainability-reports/CDP-Equinor-response-2018.pdf>.
9. OGCI (2019), OGCI 2019 Annual Report Scaling up action aiming for net zero emissions, accessed from <https://oilandgasclimateinitiative.com/wp-content/uploads/2019/09/OGCI-Annual-Report-2019.pdf>.
10. Air Products (2019), Air Products 2019 Sustainability Report, accessed from <http://www.airproducts.com/~/media/Files/PDF/company/2019-Sustainability-Report.pdf>.
11. Shell (2019), ‘Quest carbon capture and storage’, accessed October 10, 2019, from <https://www.shell.ca/en_ca/about-us/projects-and-sites/quest-carbon-capture-and-storage-project.html>.
12. Saskpower (2019), ‘Boundary Dam Carbon Capture Project’, accessed October 15, 2019, from <https://www.saskpower.com/Our-Power-Future/Infrastructure-Projects/Carbon-Capture-and-Storage/ Boundary-Dam-Carbon-Capture-Project>.
13. US National Energy Technology Laboratory (2019), ‘CarbonSAFE’, accessed from https://www.netl.doe.gov/coal/carbon-storage/storage-infrastructure/carbonsafe>.
14. U.S. Department of Energy (2019), ‘FOA 2058: Front-End Engineering Design (FEED) Studies for Carbon Capture Systems on Coal and Natural Gas Power Plants’, accessed from <https://www.energy.gov/fe/foa-2058-front-end-engineering-design-feed-studies-carboncapture- systems-coal-and-natural-gas>.
15. U.S. Department of Energy (2019), ‘FOA 2058: Front-End Engineering Design (FEED) Studies for Carbon Capture Systems on Coal and Natural Gas Power Plants’, accessed from <https://www.energy.gov/fe/foa-2058-front-end-engineering-design-feed-studies-carboncapture- systems-coal-and-natural-gas>.
16. Global CCS Institute (2016), Understanding Industrial CCS Hubs and Clusters, accessed from https://www.globalccsinstitute.com/wpcontent/uploads/2019/08/Understanding-Industrial-CCS-hubs-andclusters.pdf>.
17. Zapantis, A., Townsend, A. and Rassool, D. (2019), Policy Priorities to Incentivise Large Scale Deployment of CCS, Global CCS Institute, Melbourne, accessed from < https://www.globalccsinstitute.com/wp-content/uploads/2019/04/TL-Report-Policy-prorities-to-incentivise-the-large-scale-deployment-of-CCS-digital-final-2019-1.pdf>.
18. Northern Lights CCS (2019), ‘Northern Lights Project’, accessed from<https://northernlightsccs.eu/>.
3.2 POLICY LEVERS FOR GROWTH
19. OECD/International Energy Agency and United Nations Industrial Development Organization (2011), Technology Roadmap Carbon Capture and Storage in Industrial Applications, available at <https://www.unido.org/sites/default/files/2011-09/CCS_Industry_Roadmap_WEB_1.pdf>.
20. Carbon Pricing Leadership Coalition (2017), Report of the High-Level commission on Carbon Prices, available at <https://static1.squarespace.com/static/54ff9c5ce4b0a53decccfb4c/t/59b7f2409f8dce5316811916/1505227332748/CarbonPricing_FullReport.pdf>.
21. World Bank Group (2018), State and Trends of Carbon Pricing 2018, World Bank Group, Washington DC, available at <https://openknowledge.worldbank.org/bitstream/handle/10986/29687/9781464812927.pdf?sequence=5&isAllowed=y>.
3.3 GLOBAL STORAGE OVERVIEW
22. Sources of data from Storage Map:
ADB (2013), Prospects for carbon capture and storage in Southeast Asia. Asia Development Bank: Manilla.
Aktouf, A. and Bentellis, A. (2016), ‘CO2-storage assessment and effective capacity in Algeria’, Springer Plus. Springer International Publishing, 5(1), pp. 1–24.
7.0 References
77
Carneiro, J. F. and Alberto, M. (2014), ‘Preliminary assessment of CO2 storage potential in the Rovuma sedimentary basin, Mozambique’, Energy Procedia. Elsevier B.V., 63, pp. 5141–5152..
Carbon Storage Taskforce (2010), ‘National Carbon Mapping and Infrastructure Plan – Australia’. Energy and Tourism: Canberra. P. 138.
Poulsen, N. et al. (2011), ‘CO2StoP Final Report Assessment of CO2 storage potential in Europe. European Commission Contract No ENER / C1 / 154-2011-SI2 . 611598’.
National Energy Technology Laboratory (2015), ‘Carbon Storage Atlas – Fifth Edition’. US Department of Energy, p. 114.
Field, B. et al. (2009), New Zealand carbon dioxide storage site assessment: Phase 2. Cooperative Research Centre for Greenhouse Gas Technologies, Canberra, Australia, CO2CRC Publication Number RPT09-1579. p.58.
Hedriana, O. et al. (2017), ‘Assessment of CO2- EOR and Storage Capacity in South Sumatera and West Java Basins’, Energy Procedia. The Author(s), 114(November 2016), pp. 4666–4678.
International Energy Agency (2015), ‘Storing CO2 through Enhanced Oil Recovery, Combining EOR with CO2 storage (EOR+) for profit’. OECD/INTERNATIONAL ENERGY AGENCY: Paris.
Holloway, S. et al. (2008), ‘A regional assessment of the potential for CO2 storage in the Indian subcontinent’, INTERNATIONAL ENERGY AGENCY GHG R&D Programme. 2008/2, May 2008.
Junin. R. et al. (2016), ‘Evaluation of potential sedimentary basins in Malaysia for carbon dioxide storage. WEENTECH Proceedings in Energy 16 th -18 th August 2016 Heriot-Watt University , Edinburgh United Kingdom Volume 3 : International Conference on Energy ’.
Kim, A. et al. (2014), ‘Site characterization and geotechnical aspects on geological storage of CO2 in Korea’, Geosciences Journal, 18(2), pp. 167–179.
Norwegian Petroleum Directorate (2011), ‘CO2 Storage Atlas – Norwegian Sea’ Norwegian Petroleum Directorate: Stavanger, p. 60.
Takahashi, T. et al. (2009), ‘Estimation of CO2Aquifer Storage Potential in Japan’, Energy Procedia, 1(1), pp. 2631–2638.
Secretaría de Energía (SENER), (2014), ‘CCUS Technology Roadmap in Mexico. Secretaría de Energía. p.33.
Viebahn, P., Vallentin, D. and Höller, S. (2014), ‘Prospects of carbon capture and storage (CCS) in India’s power sector - An integrated assessment’, Applied Energy. Elsevier Ltd, 117, pp. 62–75.
Viljoen, J. H. A. et al., (2010), Technical Report on the Geological Storage of Carbon Dioxide in South Africa. Council for Geoscience. P. 240.
Wei, N. et al. (2015), ‘Regional resource distribution of onshore carbon geological utilization in China’, Journal of CO2 Utilization, 11, pp. 20–30.
23. Intergovernmental Panel on Climate Change (2018), Global warming of 1.5°C. An IPCC Special Report on the impacts of global warming of 1.5°C above pre-industrial levels and related global greenhouse gas emission pathways, in the context of strengthening the global response to the threat of climate change, accessed from <https://www.ipcc.ch/sr15/>.
24. International Energy Agency (2017), Energy Technology Perspectives 2017, OECD/INTERNATIONAL ENERGY AGENCY, Paris, available at <https://www.International Energy Agency.org/etp/>.
25. Mac Dowell et al. (2017), ‘The role of CO2 capture and utilization in mitigating climate change’, Nature Climate Change, vol. 7, pp. 243-249.
26. International Energy Agency Greenhouse Gas R&D Programme, (2017), CCS Industry Build-out rates – Comparison with industry analogues, 2014/TR6.
27. International Energy Agency (2015), Storing CO2 through Enhanced Oil Recovery: Combining EOR with CO2 storage (EOR+) for profit.
3.4 LEGAL AND REGULATORY OVERVIEW
N/A
4.0 REGIONAL OVERVIEWS 4.1 INTERNATIONAL CLIMATE POLICY OVERVIEW
28. Zakkour, P., and Wolfgang, H., (2019), A Mechanism for CCS in the Post-Paris Era. KS--2018-DP52. Riyadh: KAPSARC. doi: https://doi.org/10.30573/KS--2019-DP52
29. UNFCCC (2019), Communication of long-term strategies, accessed from <https://unfccc.int/process/the-paris-agreement/long-term-strategies>.
30. International Energy Agency (2013), Technology Roadmap – Carbon capture and storage, accessed from <http://www.International Energy Agency.org/publications/freepublications/publication/technology-roadmap-carbon-capture-and-storage-2013.html>.
31. Sources of data for Timeline:
Droge, S. and Rattani, V (2019), “After the Katowice Climate Summit, Building Blocks for the EU Climate Agenda”, SWP Comment 2019/C 09, February 2019, doi:10.18449/2019C09: https://www.swp-berlin.org/10.18449/2019C09/.
Fransen, T., E. Northrop, K. Mogelgaard, and K. Levin (2017) “Enhancing NDCs by 2020: Achieving the Goals of the Paris Agreement.” Working Paper. Washington, DC. World Resources Institute. Available at <http://www.wri.org/publication/ NDC-enhancement-by-2020>.
4.2 AMERICAS
32. Global CCS Institute (2019a), ‘CO2RE Database, Facilities Report’, accessed from <https://CO2RE.co/FacilityData>.
33. Clean Air Task Force (2019), Factsheet: State and utility climate change targets shift to carbon reductions, technology, accessed from <https://www.catf.us/wp-content/uploads/2019/05/CES-June-30-2019.pdf>.
34. United States Environmental Protection Agency (2019), Inventory of U.S. Greenhouse Gas Emissions and Sinks, accessed from <https://www.epa.gov/ghg-emissions/ inventory-us-greenhousegas-emissions-and-sinks>.
35. U.S. Energy Information Association (2019), New U.S. power plants expected to be mostly natural gas combined-cycle and solar PV, accessed from <https://www.eia.gov/todayinenergy/detail.php?id=38612>.
78
46. Drax (2019), Carbon dioxide now being captured in first of its kind BECCS pilot, accessed from, <https://www.drax.com/press_release/world- first-co2-beccs-ccus/>.
47. Pale Blue Dot (2019), Acorn CCS & Hydrogen Project, accessed from <https://pale-blu.com/acorn/>.
48. Global CCS Institute (2016), “Global Status of CCS: Special Report, Understanding industrial hubs and clusters”, available at <https://www.globalccsinstitute.com/wp-content/uploads/2019/08/Understanding-Industrial-CCS-hubs-andclusters. Pdf>
49. Align CCUS (2019), ‘About the Project’, accessed from <http://www.alignccus.eu/about-project>.
50. Figure 19 adapted from:
Overa, S. (2019), Telling the Norwegian CCS Story, Northern Lights: A European CO2 Transport and Storage Project, [Video Webinar], 9 May 2019, available at: < https://www.globalccsinstitute.com/resources/audio-and-visual-library/webinar-telling-the-norwegian-ccs-story-part-iii-northern-lights-a-european-co2-transport-and-storage-project/>.
51. European Commission (2019), The Potential for CCS and CCU in Europe, Report to the thirty second meeting of the European Gas Regulatory Forum 5-6 June 2019, available at <https://ec.europa.eu/info/sites/info/files/ iogp_-_report_-_ccs_ccu.pdf
4.4 MIDDLE EAST AND CENTRAL ASIA
52. International Energy Agency (2018), The Future of Petrochemicals Towards more sustainable plastics and fertilisers, Executive Summary, available at <https://webstore.International Energy Agency.org/download/summary/2310?fileName=English-Future- Petrochemicals-ES.pdf>
53. Consoli, C. (2018), CCS Storage Indicator (CCS-SI), Global CCS Institute, Melbourne, available at <https://globalccsinstitute.com>
54. Jaganathan, J. (2018), ‘Australia grabs world’s biggest LNG exporter crown from Qatar in Nov’, Reuters, 10 December [Online], available at <https://www.reuters.com/article/us-australia-qatar-lng/australia-grabs-worlds-biggest-lng-exporter-crown-from-qatar-in-nov-idUSKBN1O907N>.
55. International Energy Agency (2019), The Future of Hydrogen, Seizing today’s opportunities, INTERNATIONAL ENERGY AGENCY, Paris, available at < https://www.International Energy Agency.org/hydrogen2019/>
56. Adnoc (2019), ADNOC Reinforces Leadership Role and Commitment to Environmental Stewardship as It Strengthens Its Position as One of the Lowest Greenhouse Gas Emitters in the Oil and Gas Industry, accessed from <https://www.adnoc.ae/en/news-and-media/pressreleases/2019/adnoc-reinforces-leadership-role-and-commitment-to-environmental-stewardship>.
57. Saadi, D. (2018), ‘Adnoc to expand carbon capture projects to reduce emissions and boost oil recovery’, The National, 28 November [Online], available at <https://www.thenational.ae/business/energy/adnoc-toexpand-carbon-capture-projects-to-reduce-emissions-and-boost-oil-recovery-1.796756>.
36. Clemmer, S., Richardson, J., Sattler, S. and Lochbaum, D., (2018), The Nuclear Power Dilemma Declining Profits, Plant Closures, and the Threat of Rising Carbon Emissions, Union of Concerned Scientists 2018, accessed from <https://www.ucsusa.org/sites/default/files/attach/2018/11/Nuclear-Power-Dilemma-full-report.pdf>.
37. Nagabhushan, D. and Thompson, J., (2019), Carbon capture and storage in the US power sector - The impact of 45Q Federal Tax Credits, Clean Air Task Force, Boston, accessed from <https://www.catf.us/wp-content/uploads/2019/02/CATF_CCS_United_States_Power_Sector.pdf>.
38. International Energy Agency (2019), Market Report Series: Gas 2019, accessed from <https://webstore.International Energy Agency.org/market-report-series-gas-2019>.
39. Figure 15 Source data:
Bennet, S. and Stanley, T. (2018), Commentary: US budget bill may help carbon capture get back on track, International Energy Agency, Paris, available at: < https://www.iea.org/newsroom/news/2018/march/commentary-us-budget-bill-may-help-carbon-capture-get-back-on-track.html>.
40. Townsend A. and Havercroft, I. (2019), The LCFS and CCS Protocol: An Overview for policymakers and project developers, Global CCS Institute 2019, Melbourne, available at < https://www.globalccsinstitute.com/wp-content/uploads/2019/05/LCFS-and-CCS-Protocol_digital_version-2.pdf>.
4.3 EUROPE
41. European Commission (2018), A European strategic long-term vision for a prosperous, modern, competitive and climate neutral economy, accessed from <https://eur-lex.europa.eu/legal-content/EN/TXT/?uri=CELEX:52018DC0773>.
42. European Commission (2018), Proposal for a Regulation of the European Parliament and of the Council on the establishment of a framework to facilitate sustainable investment, accessed from, <https://ec.europa.eu/info/ law/better-regulation/initiative/1185/publication/238025/attachment/090166e5baea4e23_en>.
43. EU Technical Expert Group on Sustainable Finance (2019), Financing a Sustainable European Economy Taxonomy Technical Report, accessed from <https://ec.europa.eu/info/sites/info/files/business_economy_euro/banking_and_finance/documents/190618-sustainable-finance-teg-report-taxonomy_en.pdf>.
44. CEPS (2018), ‘CCUS in the port of Rotterdam, Project Porthos’, [PowerPoint Presentation], available at <http://www.ceps-ech.eu/sites/default/files/MDriessen_CEPS%20workshop%204%20december%202018.pdf>.
European Commission (2019), Candidate PCI projects in cross-border carbon dioxide (CO2) transport networks in view of preparing the 4th PCI list, accessed from <https://ec.europa.eu/info/sites/info/files/detailed_information_regarding_the_candidate_projects_in_co2_ network_0.pdf>
European Commission (2017), Teesside CO2 hub (United Kingdom,in further phases Netherlands, Belgium, Germany) Cross-border carbone dioxide network, available at <http://ec.europa.eu/energy/maps/pci_fiches/pci_12_1_en_2017.pdf>.
45. European Commission (2019), Innovation Fund, accessed from <https://ec.europa.eu/clima/policies/innovation-fund_en>.
7.0 References
79

5.0 CCS DEVELOPMENT: TECHNOLOGY & APPLICATIONS 5.1 NATURAL GAS: DECARBONISING POWER, INDUSTRY AND KICK-STARTING THE ENERGY TRANSITION
73. International Energy Agency (2019), Market Report Series: Gas 2019, accessed from <https://webstore.International Energy Agency.org/market-report-series-gas-2019>.
74. International Energy Agency (2019), Market Report Series: Gas 2019, accessed from <https://webstore.International Energy Agency.org/market-report-series-gas-2019>.
75. International Energy Agency (2018), World Energy Outlook 2018, International Energy Agency, Paris, available at <https://doi.org/10.1787/weo-2018-en>.
76. International Energy Agency (2018), World Energy Outlook 2018, International Energy Agency, Paris, available at <https://doi.org/10.1787/weo-2018-en>.
77. International Energy Agency (2019), Market Report Series: Gas 2019, accessed from <https://webstore.International Energy Agency.org/market-report-series-gas-2019>.
78. Irlam, L. (2017), Global Costs of Carbon Capture and Storage, Global CCS Institute, accessed from <https://www.globalccsinstitute.com/archive/hub/publications/201688/global-ccs-cost-updatev4.pdf>.
79. International Energy Agency (2018), World Energy Outlook 2018, International Energy Agency, Paris, available at <https://doi.org/10.1787/weo-2018-en>.
80. Global CCS Institute (2019a), ‘CO2RE Database, Facilities Report’, accessed from <https://CO2RE.co/FacilityData>.
81. International Energy Agency (2018), World Energy Outlook 2018, International Energy Agency, Paris, available at <https://doi.org/10.1787/weo-2018-en>.
82. International Energy Agency (2019), Market Report Series: Gas (2019), accessed from <https://webstore.International Energy Agency.org/market-report-series-gas-2019>.
83. International Energy Agency (2018), World Energy Outlook 2018, International Energy Agency, Paris, available at <https://doi.org/10.1787/weo-2018-en>
84. Chevron Australia (2019), Fact Sheet: Gorgon Carbon Dioxide Injection Project, accessed from, <https://australia.chevron.com/-/media/australia/publications/documents/gorgon-co2-injection-project.pdf>.
85. Sepulveda, N. A., Jenkins, J. D., de Sisternes, F. J., & Lester, R. K. (2018). The role of firm low-carbon electricity resources in deep decarbonization of power generation. Joule, 2(11), 2403-2420.
86. International Energy Agency (2019), Carbon capture, utilisation and storage, accessed from <https://www.International Energy Agency.org/topics/carbon-capture-and-storage/>.
87. International Energy Agency (2018), World Energy Outlook 2018, International Energy Agency, Paris, available at <https://doi.org/10.1787/weo-2018-en>.
58. BP (2019), BP Statistical Review – 2019 Middle East’s energy market in 2018, accessed from, <https://www.bp.com/content/dam/bp/business-sites/en/global/corporate/pdfs/energy-economics/statistical-review/bp-stats-review-2019-middle-east-insights.pdf>
59. Zawadzki, S. and Kravtsova, E. (2019), ‘Qatar opens CO2 storage plant, targets 5 mln T a year by 2025’, 8 October [Online] available at, <https://www.nasdaq.com/articles/qatar-opens-co2-storage-plant-targets-5-mln-t-a-year-by-2025-2019-10-08>.
60. Aljazeera (2019), ‘Qatar building large CO2 storage plant’, 8 October [Online] available at, <https://www.aljazeera.com/news/2019/10/qatar-building-massive-co2-storage-plant-191008103148682.html>.
61. International Energy Agency (2019), Statistics data browser, accessed from <https://www.International Energy Agency.org/statistics/>.
4.5 ASIA PACIFIC
62. Carbon Brief (2019), Mapped: The world’s coal power plants, accessed from <https://www.carbonbrief.org/mapped-worlds-coal-power-plants>.
63. International Energy Agency (2018), Coal 2018: Analysis and Forecasts to 2023, International Energy Agency, Paris, available at < https://webstore.International Energy Agency.org/market-report-series-coal-2018>.
64. International Energy Agency (2019), Market Report Series: Gas 2019, available from <https://webstore.International Energy Agency.org/market-report-series-gas-2019>.
65. World Steel Association (2019), World Steel in Figures 2019, accessed from <https://www.worldsteel.org/en/dam/jcr:96d7a585-e6b2-4d63-b943-4cd9ab621a91/World%2520Steel%2520in%2520Figures%25202019.pdf>.
66. Global Cement (2017), Global Cement Top 100 Report 2017 – 2018, accessed from <https://www.globalcement.com/magazine/articles/1054-global-cement-top-100-report-2017-2018>.
67. Global CCS Institute (2019a), ‘CO2RE Database, Facilities Report’, accessed from <https://CO2RE.co/FacilityData>.
68. International Energy Agency (2019), Global Energy and CO2 Status Report, accessed from <https://www.International Energy Agency.org/geco/>.
69. Carbon Brief (2019), Guest post: How plans for new coal are changing around the world, accessed from <https://www.carbonbrief.org/mapped-worlds-coal-powerplants>.
70. Carbon Brief (2019), Guest post: How plans for new coal are changing around the world, accessed from <https://www.carbonbrief.org/mapped-worlds-coal-powerplants>.
71. International Energy Agency (2019), “Transforming Industry through CCUS”, International Energy Agency, Paris, available at <www.International Energy Agency.org/publications/reports/TransformingIndustrythroughCCUS/>.
72. International Energy Agency (2018), “Energy Policies of IEA Countries, Australia 2018 Review”, International Energy Agency, Paris, available at <https://www.iea.org/publications/freepublications/publication/EnergyPoliciesofIEACountriesAustralia2018Review.pdf>
80
5.2 HYDROGEN
88. Kosturjak, A., Dey, T., Young, M.D., Whetton, S. (2019), Advancing Hydrogen: Learning from 19 plans to advance hydrogen from across the globe, Future Fuels CRC, accessed from <https://www.futurefuelscrc.com/blog/2019/07/new-report-shows-global-hydrogen-focus>.
89. International Energy Agency (2019), The Future of Hydrogen, Seizing today’s opportunities, International Energy Agency, Paris, available at < https://www.International Energy Agency.org/hydrogen2019/>.
90. Commonwealth of Australia (2018), Hydrogen for Australia’s Future, available at: <http://www.coagenergycouncil.gov.au>.
91. International Energy Agency (2019), The Future of Hydrogen, Seizing today’s opportunities, International Energy Agency, Paris, available at < https://www.International Energy Agency.org/hydrogen2019/>.
92. International Energy Agency (2019), The Future of Hydrogen, Seizing today’s opportunities, International Energy Agency, Paris, available at < https://www.International Energy Agency.org/hydrogen2019/>.
93. International Energy Agency (2019), The Future of Hydrogen, Seizing today’s opportunities, International Energy Agency, Paris, available at < https://www.International Energy Agency.org/hydrogen2019/>.
94. Global CCS Institute (2019b), ‘CO2RE Database, Climate Change Report’, accessed from <https://CO2RE.co/ClimateChange>.
95. European Commission (2018), A Clean Planet for all A European strategic long-term vision for a prosperous, modern, competitive and climate neutral economy, accessed from <https://ec.europa.eu/clima/policies/strategies/2050_en>.
96. Kosturjak, A., Dey, T., Young, M.D., Whetton, S. (2019), Advancing Hydrogen: Learning from 19 plans to advance hydrogen from across the globe, Future Fuels CRC, accessed from <https://www.futurefuelscrc.com/blog/2019/07/new-report-shows-global-hydrogen-focus>.
97. Committee on Climate Change (2018), Hydrogen in a low-carbon economy, accessed from <https://www.theccc.org.uk/wp-content/uploads/2018/11/Hydrogen-in-a-low-carbon-economy.pdf>.
98. NETL. (n.d.) (2019), Great Plains Synfuels Plant, accessed from <https://www.netl.doe.gov/research/Coal/energy-systems/gasification/gasifipedia/great-plains>.
99. Global CCS Institute (2019a), ‘CO2RE Database, Facilities Report’, accessed from <https://CO2RE.co/FacilityData>.
100. International Energy Agency (2019), The Future of Hydrogen, Seizing today’s opportunities, International Energy Agency, Paris, available at < https://www.International Energy Agency.org/hydrogen2019/>.
101. International Energy Agency (2019), The Future of Hydrogen, Seizing today’s opportunities, International Energy Agency, Paris, available at < https://www.International Energy Agency.org/hydrogen2019/>.
102. International Energy Agency (2018), World Energy Outlook 2018, International Energy Agency, Paris, available at <https://doi.org/10.1787/weo-2018-en>.
103. Bruce S, Temminghoff M, Hayward J, Schmidt E, Munnings C, Palfreyman D, Hartley P (2018), National Hydrogen Roadmap. CSIRO, Australia.
104. Zapantis, A., Townsend, A. and Rassool, D. (2019), Policy Priorities to Incentivise Large Scale Deployment of CCS, Global CCS Institute, Melbourne, accessed from < https://www.globalccsinstitute.com/wp-content/uploads/2019/04/TL-Report-Policy-prorities-to-incentivise-the-large-scale-deployment-of-CCS-digital-final-2019-1.pdf>.
5.3 CCS IN POWER SECTOR
105. oskow, P.L., (2019), Challenges for Wholesale Electricity Markets with Intermittent Renewable Generation at Scale: The U.S. Experience, Oxford Review of Economic Policy, vol 35.2, pp.291–331, accessed from <https://doi.org/10.1093/oxrep/grz001>.
106. Boston, A., Bongers, G., Byrom, S. (2018), Renewables and the NEM: What are the limits and what else is needed to go zero?, Gamma Energy Technology P/L, Brisbane, Australia, accessed from < https://anlecrd.com.au/wp-content/uploads/2019/02/Rpt-2-Final-web.pdf>.
107. International Energy Agency (2018), World Energy Outlook 2018, International Energy Agency, Paris, available at <https://doi.org/10.1787/weo-2018-en>.
108. International Energy Agency (2019), Securing Investments in Low Carbon Power Generation Sources, accessed from <https://webstore.International Energy Agency.org/securing-investments-in-low-carbon-power-generation-sources>.
109. International Energy Agency (2019), Tracking Clean Energy Progress, accessed from <https://www.International Energy Agency.org/tcep/>.
5.4 BIOENERGY WITH CARBON CAPTURE AND STORAGE (BECCS)
110. Intergovernmental Panel on Climate Change (2018), Global warming of 1.5°C. An IPCC Special Report on the impacts of global warming of 1.5°C above pre-industrial levels and related global greenhouse gas emission pathways, in the context of strengthening the global response to the threat of climate change, accessed from <https://www.ipcc.ch/sr15/>.
111. European Academies Science Advisory Council (2018), Negative emission technologies: What role in meeting Paris Agreement targets?, available at <https://www.easac.eu/>.
112. Wilshere, A. and Davies-Barnard, T., (2015), Planetary limits to BECCS negative emissions, 1104872 / AVOID 2 WPD.2a Report 1, available at <http://avoid-net-uk.cc.ic.ac.uk/wp-content/uploads/delightful-downloads/2015/07/Planetary-limits-to-BECCS-negative-emissions-AVOID-2_WPD2a_v1.1.pdf>.
113. FAO (2018), Food Outlook - Biannual Report on Global Food Markets – November 2018. Rome. 104 pp. Licence: CC BY-NC-SA 3.0 IGO.
114. Renewable Fuels Association (2019), Annual Fuel Ethanol Production, available at, <https://ethanolrfa.org/statistics/annual-ethanolproduction>.
7.0 References
81

5.5 DIRECT AIR CAPTURE (DAC)
115. Realmonte, G. et al. (2019), An intermodal assessment of the role of direct air capture in deep mitigation pathways. Nature Communications, Volume 10, p.3277.
116. Climeworks (2019), Interview by the Global CCS Institute [Interview] (2 9 2019).
117. GreenBiz (2019), Inside ExxonMobil’s hookup with carbon removal venture Global Thermostat, accessed from <https://www.greenbiz.com/article/insideexxonmobils- hookup-carbon-removal-venture thermostat>. [Accessed 1 October 2019].
5.6 CO2 UTILISATION
118. Mac Dowell, N, Fennell, PS, Shah, N & Maitland, GC (2017), ‘The role of CO2 capture and utilization in mitigating climate change’, Nature Climate Change, vol. 7, p. 243, accessed from <https://doi.org/10.1038/nclimate3231>.
119. Intergovernmental Panel on Climate Change (2018), Global warming of 1.5°C. An IPCC Special Report on the impacts of global warming of 1.5°C above pre-industrial levels and related global greenhouse gas emission pathways, in the context of strengthening the global response to the threat of climate change, accessed from <https://www.ipcc.ch/sr15/>.
5.7 CCS INNOVATION
120. Rochelle, GT (2009), ‘Amine Scrubbing for CO2 Capture’, Science, vol. 325, no. 5948, pp. 1652 LP – 1654, accessed from <http://science.sciencemag.org/content/325/5948/ 1652.abstract>.
121. Global CCS Institute (2017), Global costs of carbon capture and storage, Melbourne, Australia, accessed from <http://decarboni.se/sites/default/files/publications/201688/global-ccs-cost-updatev4.pdf>.
122. Global CCS Institute (2019a), ‘CO2RE Database, Facilities Report’, accessed from <https://CO2RE.co/FacilityData>.
123. World Coal Association (2015), ‘SaskPower’s Case for Carbon Capture and Storage’, accessed October 1, 2019, from <https://www.worldcoal.org/saskpowers-case-carbon-capture-and-storage>.
124. International CCS Knowledge Centre (2018a), The Shand CCS Feasibility Study Public Report, accessed from <https://ccsknowledge.com/pub/documents/publications/.Shand CCS Feasibility Study Public Report_NOV2018.pdf>.
125. NRDC (2018), NRDC Comments on EPA’s NSPS Review Proposal, accessed from <https://www.nrdc.org/sites/default/files/nrdc-comments-epa-nsps-review-proposal-20190318.pdf>.
126. International CCS Knowledge Centre (2018a), The Shand CCS Feasibility Study Public Report, accessed from <https://ccsknowledge.com/pub/documents/publications/.Shand CCS Feasibility Study Public Report_NOV2018.pdf>.
127. Source data for Figure 27:
International CCS Knowledge Centre (2018a), The Shand CCS Feasibility Study Public Report, accessed from <https://ccsknowledge.com/pub/documents/publications/.Shand CCS Feasibility Study Public Report_NOV2018.pdf>.
Petra Nova Parish Holding LLC (2017), W.A. Parish Post-Combustion CO2 Capture and Sequestration Project - Topical Report, accessed from <https://www.osti.gov/servlets/purl/1344080>.
International CCS Knowledge Centre (2018b), Summary for Decision Makers on Second Generation CCS Based on The Shand CCS Feasibility Study, accessed from <https://ccsknowledge.com/pub/documents/publications/Summary for Decision Makers on Second Generation.pdf>.
Rubin, ES, Davison, JE and Herzog, HJ. (2015), ‘The cost of CO2 capture and storage’, International Journal of Greenhouse Gas Control, vol. 40, pp. 378–400, accessed from <http://www.sciencedirect.com/science/article/pii/S1750583615001814>.
5.8. INDUSTRY’S TRANSITION TO A NET-ZERO FUTURE
128. Intergovernmental Panel on Climate Change (2018), Global warming of 1.5°C. An IPCC Special Report on the impacts of global warming of 1.5°C above pre-industrial levels and related global greenhouse gas emission pathways, in the context of strengthening the global response to the threat of climate change, accessed from <https://www.ipcc.ch/sr15/>.
129. Energy Transitions Commission (2018), Mission Possible Reaching Net-Zero Carbon Emissions from harder-to-abate sectors by mid-century, accessed from <http://www.energy-transitions.org/sites/default/files/ETC_MissionPossible_FullReport.pdf>.
130. International Energy Agency (2019), “Transforming Industry through CCUS”, International Energy Agency, Paris, available at <www.International Energy Agency.org/publications/reports/TransformingIndustrythroughCCUS/>.
131. International Energy Agency (2019), “Transforming Industry through CCUS”, International Energy Agency, Paris available at, <www.International Energy Agency.org/publications/reports/TransformingIndustrythroughCCUS/>.
132. Lehne, J., and Preston, F. (2018), Making Concrete Change Innovation in Low-carbon Cement and Concrete, Chatham House, London, available at <https://reader.chathamhouse.org/making-concrete-change-innovation-low-carbon-cement-and-concrete>.
133. LEILAC (2019), Successful demonstration of CO2 separation at Project LEILAC in Belgium, accessed from, <https://www.project-leilac.eu/successful-co2-separation>.
134. International Energy Agency (2019), Transforming Industry through CCUS, International Energy Agency, Paris, available at <www.International Energy Agency.org/publications/reports/TransformingIndustrythroughCCUS/>.
135. Tata Steel (2019), HIsarna, Sustainable in every sense, accessed from, <https://www.tatasteeleurope.com/en/sustainability/hisarna>.
136. International Energy Agency (2019), Transforming Industry through CCUS, International Energy Agency, Paris, available at <www.International Energy Agency.org/publications/reports/TransformingIndustrythroughCCUS/>.
137. Source data for Figure 28:
International Energy Agency (2019) Tracking Clean Energy Progress, accessed from <https://www.International Energy Agency.org/tcep/>.
82

138. Global CCS Institute (2019b) ‘CO2RE Database, Climate Change Report’, accessed from <https://CO2RE.co/ClimateChange>.
139. Source data for Figure 29:
NETL (2018), Compendium of Carbon Capture Technology 2018, accessed from <https://www.netl.doe.gov/sites/default/files/netl-file/Carbon-Capture-Technology-Compendium-2018.pdf>.
Global CCS Institute (2019a), ‘CO2RE Database, Facilities Report’, accessed from <https://CO2RE.co/FacilityData>.
140. Feron, P, Cousins, A, Jiang, K, Zhai, R, Shwe Hla, S, Thiruvenkatachari, R & Burnard, K (2019), ‘Towards Zero Emissions from Fossil Fuel Power Stations’, International Journal of Greenhouse Gas Control, vol. 87, pp. 188–202, accessed from <http://www.sciencedirect.com/science/article/pii/S1750583618308934>.
141. International Energy Agency Greenhouse Gas R&D Programme (2019), Towards Zero Emissions CCS from Power Stations using Higher Capture Rates or Biomass 2019-02.
142. Source data for Figure 30:
International Energy Agency Greenhouse Gas R&D Programme (2019) Towards Zero Emissions CCS from Power Stations using Higher Capture Rates or Biomass 2019-02.
Intergovernmental Panel on Climate Change (2014), Climate Change 2014: Mitigation of Climate Change: Working Group III Contribution to the IPCC Fifth Assessment Report, Cambridge University Press, Cambridge, accessed from <https://www.cambridge.org/core/books/climate-change-2014-mitigation-of-climate-change/81F2F8D8D234727D153EC10D428A2E6D>.
6.0 APPENDICES 6.3 HYDROGEN STRATEGIES WITH CCS
143. International Energy Agency Greenhouse Gas R&D Programme (2019), The Future of Hydrogen, Seizing today’s opportunities, International Energy Agency, Paris, available at < https:// www.International Energy Agency.org/hydrogen2019/>.
144. Kosturjak, A., Dey, T., Young, M.D., Whetton, S. (2019), Advancing Hydrogen: Learning from 19 plans to advance hydrogen from across the globe, Future Fuels CRC, accessed from <https://www.futurefuelscrc.com/blog/2019/07/new-report-shows-global-hydrogen-focus>.
145. Kosturjak, A., Dey, T., Young, M.D., Whetton, S. (2019), Advancing Hydrogen: Learning from 19 plans to advance hydrogen from across the globe, Future Fuels CRC, accessed from <https://www.futurefuelscrc.com/blog/2019/07/new-report-shows-global-hydrogen-focus>.
146. Fuel Cells and Hydrogen 2 Joint Undertaking (2019), Hydrogen Roadmap Europe: A sustainable pathway for the European Energy Transition, Available at <https://www.fch.europa.eu>.
147. Gigler, J. and Weeda, M. (2018), Outlines of a Hydrogen Roadmap, TKI Nieuw Gas Top Sector Energy (2018), available at <https://www.topsectorenergie.nl/>
ENDNOTES
i. Includes methods of utilisation of CO2 that permanently prevent CO2 from entering the atmosphere, such as in cement curing, contribute to emissions abatement.
ii. Data from the Global CCS Institute CO2RE database as of November 2019 (Global CCS Institute 2019a).
iii. The advanced development stage in a project’s lifecycle means greater detailed investigation through front-end engineering design (FEED) is underway. This may involve steps like choosing the specific technology to use, examining design and overall facility costs, obtaining permits and approvals or assessing key risks to the development. Once this stage is completed, the project may be ready for a final investment decision (FID).
iv. CO2 Geological Storage Study funded by the US Department of Energy.
v. The Institute is liaising with project developers and reviewing proposed CCS facilities with an eye to including them in our CO2RE database in early 2020.
vi. Note that the cost of capture from more concentrated CO2 gas streams, such as biofuel production or hydrogen production from gas or coal, are significantly lower.
vii. GCCSI Analysis based on 8 per cent discount rate, 30 years project life, 2.5 years construction time, capacity factor of 85 per cent. Fuel prices were based on the reported data in the project feasibility and FEED reports. Cost data normalised to 2017 values.
viii. Assuming 50kWh of electricity per kilogram of hydrogen produced.
ix. Conversion from AUD to USD as of 26 November 2019.
x. Estimated electricity generated in 2017 from Nuclear was 2637TWh, from all renewables combined was 6351TWh.
xi. See p.71 for more detailed information about coal fired generators with CCS – Boundary Dam and Petra Nova.
xii. Global CCS Institute analysis of public and GCCSI exclusive project feasibility and FEED reports, NETL 2018 Compendium of Carbon Capture Technology and presentations from NETL 2019 Carbon Capture, Utilization, Storage and Oil and Gas Technologies Integrated Review Meeting.
xiii. Cost is adjusted to 2018 US$ value calculated using the measure of cost used by (Rubin et al 2015). Cost of flue gas desulfurization process is included in Boundary Dam and Shand.
7.0 References
83


Find out moreThe Global CCS Institute provides knowledge, data, networking and advocacy services to its members and offers a comprehensive range of consultancy services related to CCS.
Any QuestionsContact a member of the Advocacy and Communications Team globalccsinstitute.com/contact
Head officeLevel 16, 360 Elizabeth Street, Melbourne VIC 3000 AustraliaP +61 (0)3 8620 7300
©Global Carbon Capture and Storage Institute Ltd 2019 Unless stated otherwise, copyright to this publication is licensed under a Creative Commons Attribution-NonCommercial-NoDerivatives 4.0 International License. The Global CCS Institute has tried to make information in this publication as accurate as possible. However, it does not guarantee that the information in this publication is totally reliable, accurate or complete. Therefore, the information in this publication should not be relied upon solely when making investment or commercial decisions.The Global CCS Institute has no responsibility for the persistence or accuracy of URLs to any external or third party internet websites referred to in this publication and does not guarantee that any content on such websites is, or will remain, accurate or appropriate. To the maximum extent permitted, the Global CCS Institute, its employees and advisers accept no liability (including for negligence) for any use or reliance on the information in this publication, including any commercial or investment decisions made on the basis of information provided in this publication.Please use the following to reference the report: Global CCS Institute, 2019. The Global Status of CCS: 2019. Australia.
The information in this report is current as of November 2019.
85