CLIMATE CHANGE IN CALIFORNIA
119
i CLIMATE CHANGE IN CALIFORNIA: HEALTH, ECONOMIC AND EQUITY IMPACTS January 2006
Transcript of CLIMATE CHANGE IN CALIFORNIA

i
CLIMATE
CHANGE
IN CALIFORNIA: HEALTH, ECONOMIC AND EQUITY IMPACTS
January 2006

ii
CLIMATE CHANGE IN CALIFORNIA:
HEALTH, ECONOMIC AND EQUITY IMPACTS Redefining Progress Redefining Progress is a nonpartisan public policy institute focused on the intersection between economics, social equity, and the environment. RP is a 501 (c) (3) nonprofit organization started in 1994.
Contributing Authors (in alphabetical order): Robert Cordova Michel Gelobter Andrew Hoerner Jennifer R. Love Ansje Miller Calanit Saenger Disha Zaidi

iii
Acknowledgments Redefining Progress extends a sincere thanks to all individuals who took time to assist us with this research. In particular, we acknowledge and thank Northeast States Center for a Clean Air Future (NESCAF), Inc for their support and funding for this work. Nothing in the report should be construed as necessarily reflecting the views of NESCAF. We also wish to thank the Natural Resources Defense Council (NRDC) and the Union of Concerned Scientists (UCS) for sharing their advice and insights as well as related research. We want to thank the organizations that sponsored community meetings. In particular, we thank the American Lung Association of Central California, Bus Riders Union of the Labor Community Strategy Center, Coalition for West Oakland Revitalization, Community Health Initiative of Richmond, Latino Issues Forum, and La Union del Pueblo Entero. We also want to thank Katharine Hayhoe at Atmos Research & Consulting and Larry Kalkstein at Applied Climatologists, Inc., for their significant analytical and data contributions, as well as Brent Takemoto and Linda Smith at the California Air Resources Board for their ongoing insights. Many people and organizations assisted in the conception, creation, and content of this report. In particular, we would like to thank Jose Bravo, Luis Cabrales, Jose Carmona, Henry Clark, Sandra Eaton, Michelle Garcia, Tom Goldtooth, Margaret Gordon, Pam Graybeal, Nancy Halpern Ibrahim, Jill Johnston, Angela Jones, Yuki Kidokoro, Phil Klasky, Emily Lee, Rey Leon, Zuri Maunder, A. J. Napolis, Monsa Nitoto, Shereri Norris, Maria Morales, Karen Pierce, Cynthia Rojas, Liseth Romero-Martinez, Parin Shah, Dong Suh, Manuel Toledo, Jessica Guadalupe Tovar, the Transportation Justice Working Group of the Bay Area Social Equity Caucus, Max Weintraub, Sunyoung Yang, and Lei Zhan. A special thank you goes to Jihan Gearon and Serena Retna, who played a critical role in making the community outreach a success, and Anjali Upadhyay, who assisted with final editing. Cover Photos: 1. Tropical Storm Hilary, Provided by the SeaWiFS Project, NASA/Goddard Space Flight Center, and ORBIMAGE, NASA, 1999. 2. Jones Tract Levee Break, California Department of Water Resources, 2004. 3 and 4. Calanit Saenger, Redefining Progress. 5. Central Valley Pear Factory, California Heartland, Program 220, KVIE–Central Valley PBS station, 1999.

iv
TABLE OF CONTENTS
List of Figures .............................................................................................................................................. vi
List of Tables.............................................................................................................................................. viii
Glossary........................................................................................................................................................ ix
List of Acronyms ......................................................................................................................................... ix
Chapter 1: Background ............................................................................................................................... 1 Report Purpose........................................................................................................................................ 1
Climate Justice ........................................................................................................................................ 3
Modeling and Projections....................................................................................................................... 5 Climate Modeling ................................................................................................................................. 6 California Projections ........................................................................................................................... 7
Chapter 2: Health Impacts of Climate Change........................................................................................ 16 Health Insurance in California ............................................................................................................ 16
Temperature Rise and Heat Waves..................................................................................................... 19 Heat Effects on the Body.................................................................................................................... 21 Heat Wave Projections ....................................................................................................................... 22
Air Pollution–Ozone ............................................................................................................................. 26 Ozone in California............................................................................................................................. 27 Ozone and Climate Change ................................................................................................................ 30 Ozone and Health ............................................................................................................................... 31 Ozone and Vulnerable Populations..................................................................................................... 32
Extreme Weather Events - Droughts and Floods............................................................................... 35
Water- and Vector-borne Diseases ...................................................................................................... 36 Water-borne Diseases ........................................................................................................................ 36 Vector-borne Diseases ........................................................................................................................ 36 Public Health Intervention and the Spread of Infectious Diseases ..................................................... 39
Future of Climate Change and Health Impacts.................................................................................. 39
Chapter 3: Economic Impacts of Climate Change .................................................................................. 41 Agriculture............................................................................................................................................. 41
Rising Temperatures and Agriculture................................................................................................. 42 Water Scarcity and Agriculture .......................................................................................................... 44 Sea level Rise and Agriculture............................................................................................................ 45 Air Quality and Agriculture................................................................................................................ 45 Extreme Weather Events and Agriculture .......................................................................................... 45
Tourism.................................................................................................................................................. 50 Ski Industry and Snowfall Reduction ................................................................................................. 52 Water Recreation and Climate Change............................................................................................... 53 State and National Parks ..................................................................................................................... 54
Infrastructure and Extreme Weather Events..................................................................................... 54

v
Sea Level Rise .................................................................................................................................... 55 Floods ................................................................................................................................................. 55 Fires .................................................................................................................................................... 56 Increased Insurance Needs.................................................................................................................. 57 Impact of Extreme Weather Events on Low-Income Communities ................................................... 57
Price of Necessities ................................................................................................................................ 60 Water Prices........................................................................................................................................ 60 Electricity Prices................................................................................................................................. 60 Food Prices ......................................................................................................................................... 62 Disproportionate Impact of Rising Prices........................................................................................... 63
Disproportionate Impact on Employment .......................................................................................... 65 Agricultural Employment .................................................................................................................. 65 Tourism Employment ......................................................................................................................... 66
Chapter 4: Community Testimony ........................................................................................................... 68 Background on Community Outreach................................................................................................ 68
Methodology for Community Outreach and Assessment .................................................................. 69 Environmental Justice Leaders Surveys ............................................................................................. 69 Community Meetings ......................................................................................................................... 70
Community Findings ............................................................................................................................ 71 Health ................................................................................................................................................. 72 Health Care ......................................................................................................................................... 74 Economic Conditions: ........................................................................................................................ 75 Water and Food................................................................................................................................... 77 Other Themes ..................................................................................................................................... 78
Lessons Learned.................................................................................................................................... 80
Chapter 5: Synthesis for Policymakers..................................................................................................... 83 Synthesis ................................................................................................................................................. 83 Disproportionate Impacts and Climate Change .................................................................................. 83 Existing Inequality and Climate Change ............................................................................................ 84 Prosperity Damage.............................................................................................................................. 85
Policy Implications................................................................................................................................ 86 Key Regions ....................................................................................................................................... 86 Emissions Focus Near-Term Action and Adaptation Assistance........................................................ 86
Conclusion ............................................................................................................................................. 87
References ................................................................................................................................................... 88
Appendices ............................................................................................................................................... 100 Appendix A: Mean Annual Heat Related Deaths in Los Angeles ................................................... 100 Appendix B: Temperature Projections by Ethnicity, Income and Poverty.................................... 101 Appendix C: Demographics of Environmental Justice Leader Survey Responses........................ 102 Appendix D: Community Survey ....................................................................................................... 104 Appendix E: Community Meeting Cards.......................................................................................... 106

vi
LIST OF FIGURES
Figure 1.1: Percent of Population Living in Poverty........................................................ 4 Figure 1.2: Percent of People of Color............................................................................. 5 Figure 1.3: CO2 Emissions Projections for the SRES Emissions Scenarios .................... 7 Figure 1.4: Extreme Precipitation Events and Dry Years Projections ............................. 9 Figure 1.5: Summer Temperature Projections ............................................................... 10 Figure 1.6: Percent Reduction in April 1st Snow pack at Various Elevations................ 11 Figure 1.7: Extreme Precipitation Events Projections.................................................... 13 Figure 1.8: Dry years per Decade Projections................................................................ 14 Figure 2.1: Health Insurance by Income Level for Californians Ages 0-64 .................. 17 Figure 2.2: Health Insurance by Race/Ethnicity for Californians Ages 0-64 ................ 18 Figure 2:3: Health Insurance by Region for Californians Ages 0-64............................. 18 Figure 2.4: Urban Heat Island Temperature Profile....................................................... 20 Figure 2.5: Heat Wave Projections for Five Cities in California ................................... 24 Figure 2.6: Relative Heat Wave Mortality Rates by Race/Ethnicity for Los Angeles... 26 Figure 2.7: Days of AAQS Violations for Selected California Air Basins, 2003........ ..28 Figure 2.8: California Non-Attainment Designations, 2003; Air Basin Delineations ... 29 Figure 2.9: Future Temperature Increases and People of Color and in Poverty ............ 33 Figure 2.10: California Hospital Admission Rate for Asthma, 2001 .............................. 33 Figure 2.11: Asthma Hospitalization in Los Angeles; People of Color in Los Angeles. 34 Figure 2.12: Possible Effects of Climate Change on Vector-Borne Diseases. ................ 37 Figure 3.1: Future Dry Years per Decade and Top Agriculture Counties ..................... 47 Figure 3.2: Future Extreme Precipitation Events and Top Agriculture Counties ......... 49 Figure 3.3: Tourism-Generated Revenues from Popular Winter Destination Counties. 52 Figure 3.4: Tourism-Generated Employment in Popular Winter Destination Counties 52 Figure 3.5: Historic Monetary Fire Damage, 1943-2002............................................... 56 Figure 3.6: Future Extreme Precipitation Events and Percent Persons in Poverty ........ 59 Figure 3.7: Residential and Commercial Electricity Demand by End-Use, 2001.......... 61 Figure 3.8: Expenditures on Water, Electricity and Food by Income............................ 63 Figure 3.9: Expenditures on Water and Food by Income and Race/Ethnicity ............... 64 Figure 3:10: Agricultural Sector Employment by Race/Ethnicity....................................65 Figure 3.11: Poverty Levels in Top Agricultural Production Counties in California...... 66 Figure 3.12: Percentage People of Color in Tourism-Generated Jobs by Sector ............ 67 Figure 4.1: Distribution of Interest for Study Variables ................................................ 72

vii
LIST OF TABLES
Table 1.1: Climate Projections from HadCM3................................................................... 8 Table 2.1: Physiological Responses to Heat ..................................................................... 21 Table 2.2: Heat Wave Threshold Temperatures. .............................................................. 22 Table 2.3: Relative Heat Wave Mortality Rates by Race/Ethnicity for Los Angeles....... 25 Table 2.4: Air Quality Rankings in California.................................................................. 28 Table 2.5: Summary of Research Needs and Knowledge Gaps. ...................................... 40 Table 3.1: Projected Climate Change Impacts on Agriculture ......................................... 42 Table 3.2: Future Extreme Precipitation Events in Top Agricultural Counties................ 48 Table 3.3: Projected Climate Change Impacts on Tourism .............................................. 51 Table 4.1: Community Meeting Profiles .......................................................................... 70
viii
GLOSSARY Expenditure: A sum of expenses. Total expenditure is used as a proxy for income information because reported income has empirically been unreliable. Many households underreport income either through error or intentionally, while other households either borrow or save money to offset changes in income over longer periods of time. Expenditure quintile: The population-sample is divided into five expenditure groups, such that each group contains 20% of the population. The groups are ranked by expenditure level, from the lowest (1) to the highest (5). Expenditure share: Amount spent on a specific commodity, as a share of total expenditures. Spending as a percentage of total expenditures, rather than as a percentage of total income, provides a normalized and reliable estimate of a group’s vulnerability to changing prices. Person-trips: A person trip refers to a trip taken by an individual. For example, if three persons from the same household go together on a trip, the trip is counted as one household trip and three person-trips. Prosperity Damage: The resulting impacts of a shock, such as a natural disaster, that causes a person or family to suffer a setback which takes an entire lifetime from which to recover. Swiss Reinsurance Company argues that prosperity damage is higher for low-income people as one shock in the life of low-income people might mean a life-long struggle to get back on track. More affluent people have better means to cope.

ix
LIST OF ACRONYMS AN Alaskan Native AAQS Ambient Air Quality Standards AI American Indian ALA American Lung Association ATS American Thoracic Society BLS Bureau of Labor Statistics CARB California Air Resources Board CCSP Climate Change Science Program CDF California Department of Finance CDFA California Department of Food & Agriculture CDFF California Department of Forestry & Fire CDHS California Department of Health Services CDWR California Department of Water Resources CDT California Division of Tourism CEC California Energy Commission CES Consumer Expenditure Survey CFBF California Farm Bureau Federation CFWC California Farm Water Coalition CHIS California Health Interview Survey COES California Office of Energy Services CRAG California Regional Assessment Group CO2 carbon dioxide CO carbon monoxide CWOR Coalition for West Oakland Revitalization DOE Department of Energy EDD Employment Development Department EIA Energy Information Administration EJCCI Environmental Justice & Climate Change Initiative FEMA Federal Emergency Management Agency FPL Federal Poverty Level GCM General Circulation or Global Climate Model GHG Greenhouse Gas HadCM3 Hadley Center Climate Model, version 3 HIS Indian Health Service IOM Institute of Medicine III Insurance Information Institute IPCC Intergovernmental Panel on Climate Change Pb lead MSNBC Microsoft National Broadcasting Company NPCA National Parks Conservation Association NRDC Natural Resources Defense Council NO2 nitrogen dioxide NOx nitrogen oxides

x
OSHPD Office of Statewide Health Planning & Development O3 ozone PCM Parallel Climate Model PM Particulate Matter PSR Physicians for Social Responsibility SLE St Louis Encephalitis SWE Snow Water Equivalent SRES Special Report on Emissions Scenarios SUV Sport Utility Vehicle SOx sulfur oxides UCS Union of Concerned Scientists USBR United States Bureau of Reclamation USCB United States Census Bureau USCCSP United States Climate Change Science Program USDA United States Department of Agriculture USEPA United States Environmental Protection Agency USGS United States Geological Survey VOC Volatile Organic Compound WEE Western Equine Encephalitis WHO World Health Organization

Redefining Progress • Climate Change in California: Health, Economic and Equity Impacts • 1
CHAPTER 1: BACKGROUND Climate change presents significant problems for all of humanity. The question is no longer whether climate change is real. The question is what climate change means for individual communities, businesses, and constituencies. What groups are more vulnerable to climate change impacts? What business sectors have more to lose? What political constituencies face greater health and economic burdens? What are the solutions that will work for everyone? These questions will increasingly influence climate change discourse during this century. This report focuses on a specific population and location—low-income communities and people of color in California—and it demonstrates the degree to which these groups face significant and unequal climate change risks, exposure, and overall burden. The health implications of increased air and water pollution, heat waves, and other weather-related crises result in disproportionate negative impacts for people of color and low-income communities. Similarly, the economic impacts of climate change—such as higher prices for food, water, and energy—will impose new economic burdens on low-income households. Leaders and policymakers need to understand these unequal impacts and must know how the specific communities in their areas will be affected. In looking at the factors (not all of which are geographic) that produce these differences, leaders and policymakers can develop policies to help the constituencies they serve. Local and regional initiatives not only complement global efforts on climate change but also provide opportunities to involve more stakeholders, to act rapidly, and to utilize precise knowledge in assessing the costs and benefits of mitigation and adaptation. California is an established leader in the world—economically, technologically, and politically. The diversity of people, economic sectors, and environments in the state provides a valuable laboratory in which to study the impacts of climate change under varying circumstances. And as the leading greenhouse-gas emitting states in the leading greenhouse gas-emitting nation, California has both a responsibility to lead and an opportunity to deliver benefits to all of humanity.
Report Purpose This report has two primary objectives. First, it synthesizes and extends the body of scientific literature in identifying climate impacts on low-income groups and communities of color in California. Second, the report shares observations and concerns from people living in those communities. These objectives reflect a commitment to the principles of climate justice, discussed in more detail below. For all the roles that every Californian may play, whether as a community leader, political representative, business owner, financial leader, or citizen, this report provides knowledge about the future of climate change in California.

Redefining Progress • Climate Change in California: Health, Economic and Equity Impacts • 2
The scientific analysis revolves around two subjects: human health and economic well-being. In developing this analysis, the report sheds light not only on California’s more vulnerable communities; a significant portion of the findings relate to concerns shared by everyone in the state—particularly for those involved in climate-dependent industries such as tourism and agriculture. The community testimony presented in chapter 4 provides a unique component that many similar reports do not possess. It not only helps leaders understand what these communities experience but adds vividness and context to the scientific findings. The remainder of chapter 1 discusses the climate justice framework and lays out the projections on climate change in California. The projections presented reflect earlier studies as well as our original analysis and projections of extreme weather events (droughts, floods, and fires). Within the climate justice discussion, the report presents current geographic distribution of low-income groups and people of color in California. Chapter 2 presents the health impacts of climate change on low-income communities and people of color in California. The first section addresses health-care access and insurance to demonstrate the role that existing inequalities plays in any analysis of climate change and disproportionate impacts. The following section concentrates on two key health impacts, heat wave-related mortality and ozone pollution. The heat wave section contains original projections for Los Angeles that demonstrate significant racial/ethnic disparities in heat wave mortality rates. The section on ozone emphasizes the role of asthma in determining ozone risk and well-known disparities in the incidence of asthma among different racial/ethnic and income groups. Other health impacts include vector- and water-borne diseases and the impact of extreme weather events. Chapter 3 outlines the economic impacts of climate change on low-income groups and people of color in California. This chapter deals with agriculture and tourism in depth, as well as infrastructure damage and the potential for increased insurance expenditures. Extreme weather events affecting agriculture, tourism, and infrastructure are likewise explored. The last two sections analyze disproportionate impacts regarding employment and prices for basic necessities. Chapter 4 presents the findings from our community outreach efforts, which involved both surveys and community meetings. Stakeholder participation is a vital component of just and sound climate policy. The information presented in this chapter conveys the perspectives and concerns of communities that face the impacts presented in the earlier chapters. Chapter 5 summarizes all the impacts of climate change as they relate to low-income groups and communities of color. The relationship between climate change and the livelihood of low-income groups and people of color in California involves many intersecting and overlapping impacts. This chapter brings the research together in a comprehensive way so the reader can understand the nexus of existing inequality, disproportionate impacts, and climate change. The chapter also shares recommendations for just and sound climate policy.

Redefining Progress • Climate Change in California: Health, Economic and Equity Impacts • 3
Climate Justice Climate justice focuses on the disproportionate impacts of climate change and climate policies. Efforts have been made to clarify the chief principles of climate justice. Such efforts include the “10 Principles of Just Climate Policies in the US” (Miller and Sisco, 2002, see below) and the 27-point “Bali Principles of Climate Justice.” This report relies on a few climate justice assertions:
1. Climate change and the policies to address climate change will have numerous economic and social consequences.
2. The impacts of both climate change and related policies will not be felt uniformly by all members of society; some groups may face more severe and adverse consequences than others.
3. Low-income groups and people of color will likely face more severe impacts than other groups from climate change and related policies.
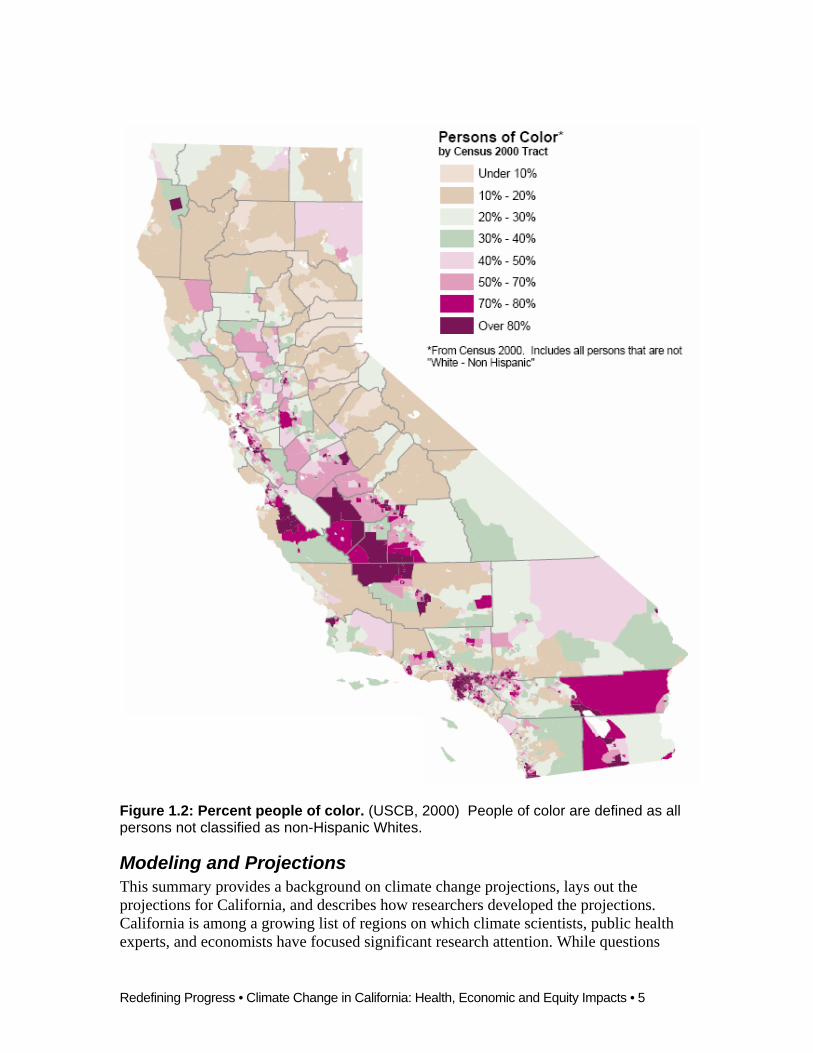
In short, the consequences of climate change will likely have a disproportionate impact on vulnerable communities, and, without proper planning, climate policy itself may impose unequal burdens. In many cases, these differences reflect long-standing systemic and societal inequalities. A primary goal of the climate justice movement is to ensure that no racial, ethnic, or socioeconomic group bears a disproportionate share of the negative consequences of climate change and related policies. Climate justice advocates seek to protect vulnerable communities from the impacts of climate change and to implement policies that provide a just transition for workers and vulnerable communities. Climate justice advocates take an interdisciplinary approach, relying on social science, law, physical science, and interdisciplinary fields such as public and environmental health. Climate justice places great significance on community participation in state decision-making, research, and policy development. The current geographic distributions of low-income groups and people of color in California are shown below. Both low-income groups and communities of color have some distinct distribution patterns. The Central Valley is home to high percentages of low-income populations, with 30% of the region’s residents living in poverty. The region also has high percentages of people of color, ranging from 50% to 80% in different areas. The inland portion of Monterey County, south of Salinas, and portions of southwestern California have populations of

Redefining Progress • Climate Change in California: Health, Economic and Equity Impacts • 4
color above 70%. A large degree of geographic overlap exists between people living in poverty and people of color—particularly in the Central Valley and in urban areas such as Los Angeles, Sacramento, San Bernardino, San Diego, and Oakland. In California overall, 19% of all people of color live below the federal poverty level, compared to 14% of the general population and 8% of the White population. While people of color make up only 54% of the total population, they account for 74% of the population living at or below the federal poverty level.
Figure 1.1: Percent of population living in poverty. (USCB, 2000) Poverty is defined as living at or below 100% of the federal poverty level.
Redefining Progress • Climate Change in California: Health, Economic and Equity Impacts • 5
Figure 1.2: Percent people of color. (USCB, 2000) People of color are defined as all persons not classified as non-Hispanic Whites.
Modeling and Projections This summary provides a background on climate change projections, lays out the projections for California, and describes how researchers developed the projections. California is among a growing list of regions on which climate scientists, public health experts, and economists have focused significant research attention. While questions

Redefining Progress • Climate Change in California: Health, Economic and Equity Impacts • 6
remain regarding the magnitude and distribution of impacts at the regional scale, leaders in California already have a broad base of knowledge to rely upon in developing mitigation and adaptation measures. This report builds on the Intergovernmental Panel on Climate Change synthesis reports (IPCC, 2001a, b, c), U.S. Global Change Research Program’s California Assessment (CRAG, 2002), California-focused research published recently by the Proceedings of the National Academy of Sciences (Hayhoe et al., 2004 a, b; UCS, 2004), and new research on extreme weather events related to climate change, namely droughts, floods, and fires.1 The overview below presents these studies in more detail.
Climate Modeling The primary source of climate projections are the large, three-dimensional general circulation or global climate models (GCM). These models incorporate the latest understanding of the processes at work in the atmosphere and oceans and on the earth’s surface. Only two such models have successfully reproduced observed global climate variations over the past century: the National Center for Atmospheric Research/Department of Energy Parallel Climate Model (PCM) (Washington et al., 2000) and the U.K. Meteorological Office Hadley Centre Climate Model, version 3 (HadCM3) (Gordon et al., 2000; Pope et al., 2000). The models produce daily to monthly projections of precipitation, temperature, pressure, cloud cover, humidity, and a host of other variables. Model climate sensitivity determines the increase in temperature due to a certain level of human-induced greenhouse gas (GHG) emissions. The PCM is a low-sensitivity model and the HadCM3 is a medium-sensitivity model. HadCM3 is also referred to as the Hadley Model. Our study of extreme weather events relied on the mid-range HadCM3 model exclusively. However, many of the previous studies we draw upon in this report used both models. These climate models also take into account plausible pathways of socioeconomic development and resulting emissions from human activities. The climate projections presented in this report correspond to the highest- and lowest-level economic development scenarios from the Special Report on Emissions Scenarios (SRES), produced by the Intergovernmental Panel on Climate Change (Nakicenovic et al., 2000). The A1fi (highest-emissions) and B1 (lowest-emissions) scenarios can be thought of as higher and lower bounds encompassing most, but not all, potential business-as-usual emission trends. At the high end, a rapid introduction of new technologies, extensive economic globalization, and a fossil fuel-intensive energy path lead to A1fi carbon dioxide (CO2) emissions that reach almost 30 Gt/yr, or six times 1990 levels by 2100 (IPCC, 2001a). (Gt/yr means billion metric tons of carbon per year.) Emissions under the B1 scenario are lower, as it assumes transition from an industry based economy to a service and information economy happens rapidly. Carbon dioxide emissions in the B1 1 For more information, refer to “Technical Appendix A: Climate, El Nino, and Flooding in California” and “Technical Appendix B: Wildfire Risk in California,” both available at www.RedefiningProgress.org/CACJ/.

Redefining Progress • Climate Change in California: Health, Economic and Equity Impacts • 7
scenario peak around mid-century at just below 10 Gt/yr—roughly double 1990 levels—and then decline slowly to below current-day levels (IPCC, 2001a). Figure 1.3 shows the CO2 projections for the seven SRES emissions scenarios, including the A1fi (highest-emissions) and B1 (lowest-emissions) scenarios. Figure 1.3: CO2 emission projections for the SRES emissions scenarios. (IPCC, 2001a) This report uses the A1fi (red dotted line) and B1 (green solid line) scenarios. Using a range of possible emission profiles is essential for evaluating the potential and the associated costs of adaptation. The SRES scenarios can be viewed as possible futures, with the actual emissions path depending on technology, economic development, and political will. Hence, the SRES scenarios are not assigned a probability.
California Projections Climate change under the higher-emission scenarios is much more pronounced than under the lower-emissions scenarios. Generally, the difference between scenarios is slight at the mid-century mark but widens strikingly as the century ends. Due to the long lifetime of CO2, future changes are actually established by emissions that occur in the first few decades of this century. Significant near-term actions could limit the extent of climate change. Current policy decisions that lower emissions now and in the near future produce great cumulative changes over the course of the entire century. The projections summarized below are those produced by the HadCM3 model. The projections are moving averages for 30-year time periods, allowing long-term trends to emerge from year-to-year fluctuations. The four 30-year averages include 2010–2039, 2020–2049, 2040–2069, and 2070–2099. Throughout the report, the 2020–2049 and 2040–2069 time periods are referred to as “mid-century,” and the 2070–2099 time period is referred to as “end-of-century.”

Redefining Progress • Climate Change in California: Health, Economic and Equity Impacts • 8
Table 1.1 and Figure 1.4 provide summarize the climate change projections. Table 1.1 gives an overview of climate projections for temperature, precipitation, sea level rise, snow pack and reservoir inflow for California in the coming century, listing the average values for the years 1961-1990 and the projected increases or decreases for both emissions scenarios from these averages for mid-century and end-of-century. The projections in Table 1.1 come from research conducted by Hayhoe et al. (2004a).
Baseline Change from Baseline
2020–2049 2070–2099 Climate Change Indicator Units 1961–1990
B1 A1fi B1 A1fi
Annual °F 59.0 2.9 3.6 5.9 10.4
Summer (JJA) °F 73.0 4.0 5.6 8.3 14.9 Statewide Average
Temperature Winter (DJF) °F 45.7 2.5 2.6 4.1 7.2
Annual mm 544 +6 -70 -117 -157
Summer (JJA) mm 20 -1 -7 -5 -1 Statewide Average
Precipitation Winter (DJF) mm 269 +4 -44 -79 -92
Sea-Level Rise cm - 11.6 12.7 26.8 40.9
April 1 Snowpack SWE a % 12.4 km3 -26 -40 -72 -89
Annual Reservoir Inflow b % 21.7 km3 5 -10 -24 -30
Apr-Jun Reservoir Inflow b % 9.1 km3 -11 -19 -41 -54
Water-Year Flow Centroid b,c days 3/26 -15 -7 -23 -32 Table 1.1: Climate projections from HadCM3. (Modified from Hayhoe et al., 2004a) a for elevations of 1,000–4,000 meters; SWE is snow-water equivalent; b inflows for seven dams and reservoirs in the San Joaquin/Sacramento water system (Shasta, Oroville, Folsom, New Melones, New Don Pedro, Lake McClure, Pine Flat); c water-year flow centroid, or the date when half of the total annual inflow had occurred. Figure 1.4 contains an overview of climate projections for the occurrence of droughts (dry years) and floods (seven-day extreme precipitation events) in California over the coming century, showing historical and future statewide averages. The data in Table 1.1 and Figure 1.4 will be expanded upon in subsequent chapters. The most well-defined climate change projections relate to temperature. There is high certainty that temperatures will increase in California in the coming years and moderate certainty as to the degree of change.2 Figure 1.5 shows the projected increases for both mid-century and end-of-century and both low- and high-emissions scenarios in June, July, and August. By the end of the century (2070–2099), the projected temperature change under the A1fi scenario is twice that of the B1 scenario. 2 For more information, refer to “Technical Appendix A: Climate, El Nino, and Flooding in California,” available at www.RedefiningProgress.org/CACJ/.

Redefining Progress • Climate Change in California: Health, Economic and Equity Impacts • 9
Figure 1.4: Extreme precipitation events and dry year projections. (Technical Appendix A3) Statewide number of seven-day extreme precipitation events per decade (left) (1900–1999 historical average two per decade). Statewide number of dry years per decade (right) (1960–1999 historical average one per decade). The earliest and most severe temperature increases will likely occur in the Central Valley and Western Sierras (an increase of over 16° F by the end of the century for the high-emissions scenario in summer). The San Francisco Bay Area, with the temperature-moderating influence of the Pacific Ocean, is projected to have the smallest temperature increase. Increase in temperature would have concurrent impacts on extreme heat events, heat-related mortality, snowpack loss, agriculture, and vegetation (Hayhoe et al., 2004a). Temperature is a key driving force behind many climate change phenomena. One of the primary and far-reaching manifestations of climate change will be the changes induced in California’s hydrologic cycle. The projected decreases in precipitation, snowpack, and stream flow, and the increase in sea level may change California’s water supply and distribution. The warmer temperatures and decreased winter precipitation projected to occur under either emissions scenario by the end of the century and by mid-century under the high-emissions scenario would produce a significant reduction in the Sierra Nevada snowpack—which provides at least 50% of California’s water supply (CEC, 2003a). Figure 1.6 shows the anticipated reductions in Sierra snowpack for elevations between 1,000 and 4,000 meters, given in 1,000-meter increments. Snowpack reduction at the lowest elevations (1,000–2,000 m) is projected to be significant by mid-century, with losses of 58% and 66% for low- and high-emissions scenarios, respectively. By the end of the century, snowpack reductions of greater than 90% are expected at some elevations under the high-emissions scenario.
3 Ibid.
0
2
4
6
8
2010-2039 2040-2069 2070-2099
Extr
eme
Prec
ipita
tion
Ev
ents
per
Dec
ade
Low Emissions (B1)
High Emissions (A1fi)
Historical Average 1900-1999
0
1
2
3
4
2010-2039 2040-2069 2070-2099
Dry
Yea
rs p
er D
ecad
e
. Low Emissions (B1)
High Emissions (A1fi)
Historical Average1960-1999

Redefining Progress • Climate Change in California: Health, Economic and Equity Impacts • 10
Figure 1.5: Summer temperature projections; HadCM3. (Hayhoe et al., 2004a) Average summer temperature increase in degrees Fahrenheit for June, July, and August compared to 1990–1999 average for both low-emissions (left) and high-emissions (right) scenarios, and for both mid-century (top) and end of the century (bottom).
Redefining Progress • Climate Change in California: Health, Economic and Equity Impacts • 11
-10
0
10
20
30
40
50
60
70
80
90
100
B1 A1fi B1 A1fi
2020-2049 2020-2049 2070-2099 2070-2099
% re
duct
ion
in sno
wpa
ck
1000-2000m2000-3000m3000-4000m
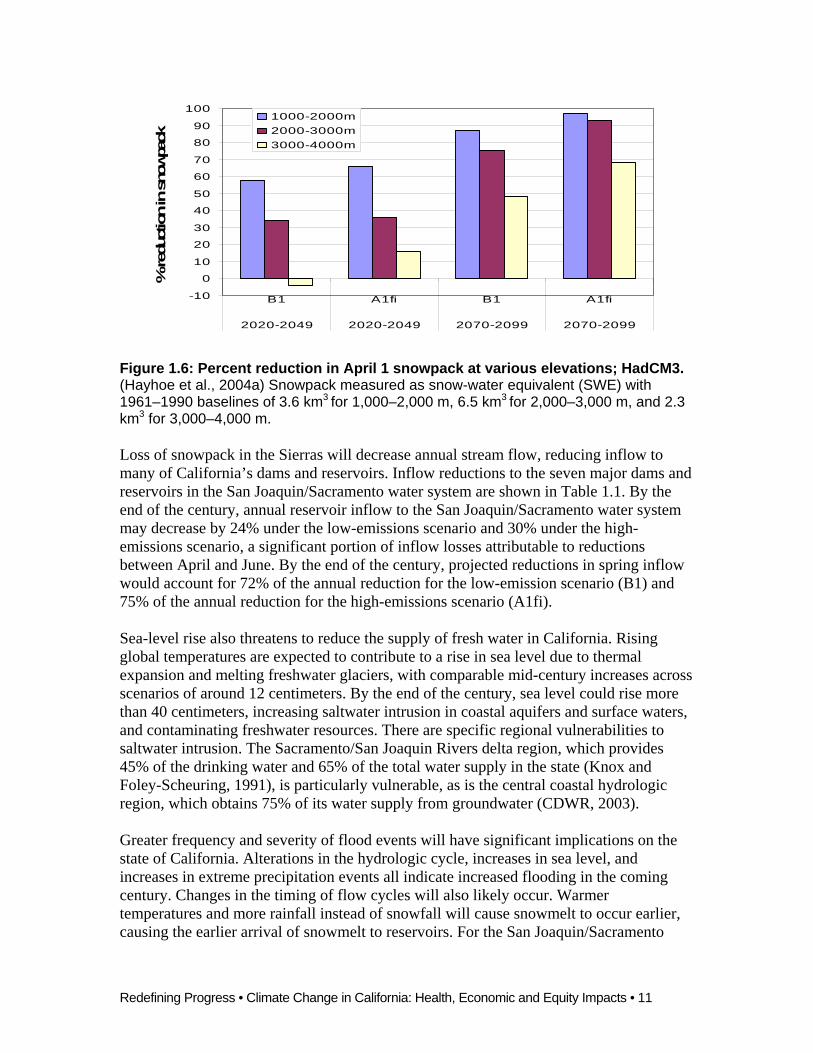
Figure 1.6: Percent reduction in April 1 snowpack at various elevations; HadCM3. (Hayhoe et al., 2004a) Snowpack measured as snow-water equivalent (SWE) with 1961–1990 baselines of 3.6 km3 for 1,000–2,000 m, 6.5 km3 for 2,000–3,000 m, and 2.3 km3 for 3,000–4,000 m. Loss of snowpack in the Sierras will decrease annual stream flow, reducing inflow to many of California’s dams and reservoirs. Inflow reductions to the seven major dams and reservoirs in the San Joaquin/Sacramento water system are shown in Table 1.1. By the end of the century, annual reservoir inflow to the San Joaquin/Sacramento water system may decrease by 24% under the low-emissions scenario and 30% under the high-emissions scenario, a significant portion of inflow losses attributable to reductions between April and June. By the end of the century, projected reductions in spring inflow would account for 72% of the annual reduction for the low-emission scenario (B1) and 75% of the annual reduction for the high-emissions scenario (A1fi). Sea-level rise also threatens to reduce the supply of fresh water in California. Rising global temperatures are expected to contribute to a rise in sea level due to thermal expansion and melting freshwater glaciers, with comparable mid-century increases across scenarios of around 12 centimeters. By the end of the century, sea level could rise more than 40 centimeters, increasing saltwater intrusion in coastal aquifers and surface waters, and contaminating freshwater resources. There are specific regional vulnerabilities to saltwater intrusion. The Sacramento/San Joaquin Rivers delta region, which provides 45% of the drinking water and 65% of the total water supply in the state (Knox and Foley-Scheuring, 1991), is particularly vulnerable, as is the central coastal hydrologic region, which obtains 75% of its water supply from groundwater (CDWR, 2003). Greater frequency and severity of flood events will have significant implications on the state of California. Alterations in the hydrologic cycle, increases in sea level, and increases in extreme precipitation events all indicate increased flooding in the coming century. Changes in the timing of flow cycles will also likely occur. Warmer temperatures and more rainfall instead of snowfall will cause snowmelt to occur earlier, causing the earlier arrival of snowmelt to reservoirs. For the San Joaquin/Sacramento
Redefining Progress • Climate Change in California: Health, Economic and Equity Impacts • 12
water system, a shift in the water-year flow centroid of a full month is projected to occur by the end of the century for the high-emissions scenario. Earlier snowmelt could have important implications for reservoir management.4 A change in snowmelt regime requires decision makers to choose flood prevention or water storage, as early runoff will compromise the reservoir system as a flood protection tool. Flooding may occur during extreme precipitation when heavy rain falls on saturated soils and full rivers. Long periods of rainfall (seven days) provide a proxy for flood conditions. Statewide, the frequency of seven-day extreme precipitation events is projected to increase at least twofold under the low-emissions scenario and nearly fourfold under the high-emissions scenario by the end of the century (Figure 1.4). Figure 1.7 shows the projected percent increase in extreme precipitation events per decade. The historical average is two extreme precipitation events per decade for the years 1900–1999. The projected increases in extreme precipitation events for the end-of-century high-emissions (A1fi) scenario are clearly more than for the end-of-century low-emissions counterpart. Extreme precipitation events, however, exhibit considerable regional variation—more than seen with other climate change variables. For the high-emissions scenario (A1fi), extreme precipitation events increase or remain the same in all locations in California from mid-century to the end of the century. For the low-emissions scenario (B1), extreme precipitation events increase in some areas but decrease in others from mid-century to the end of the century. Such events also show significant inter-annual and inter-decadal variations that, from decade to decade, can mask the longer-term trend. At mid-century, the low-emissions scenario projections are higher than the high-emissions scenario projections. Overall, extreme precipitation events are likely to become more frequent. More frequent coastal flooding is another serious concern. Such flooding is caused by several factors, including winter storm frequency, magnitude, and direction, wind direction, storm surge, and precipitation. Timing of the storms—whether at low or high tide—and long-term sea-level rise make coastal areas more susceptible to flooding. While the projected rise in sea level has a high certainty of occurring, research provides less certainty as to what impact climate change may have on winter storm frequency and severity and El Niño events. Drought is another great concern for California. Droughts occur when water storage is depleted by long periods or successive years of below-average precipitation. The changes in annual precipitation, snowpack accumulation, runoff amount and timing, and stream flow will likely cause more frequent dry years. Frequency of dry years, currently at one per decade on average, could increase more than threefold by the end of the century (Figure 1.4), although with significant inter-decadal variability.5 Figure 1.8 shows the projected increase in dry years per decade over the historical (1960–1999) average of one per decade for both emissions scenarios at mid-century and the end of the century.
4 Ibid. 5 Ibid.

Redefining Progress • Climate Change in California: Health, Economic and Equity Impacts • 13
Figure 1.7: Extreme precipitation events. (Technical Appendix A6) Percent increase in seven-day extreme precipitation events over the baseline 1969–1999 average of two per decade for both low-emissions (left) and high-emissions (right) scenarios, and for both mid-century (top) and end of the century (bottom).
6 Ibid.

Redefining Progress • Climate Change in California: Health, Economic and Equity Impacts • 14
Figure 1.8: Dry years per decade projections; HadCM3. (Technical Appendix A7) Percent change in the number of dry years per decade from baseline 1960-1999 average of one per decade for both low-emissions (left) and high-emissions (right) scenarios, and for both mid-century (top) and end of the century (bottom).
7 Ibid.

Redefining Progress • Climate Change in California: Health, Economic and Equity Impacts • 15
At mid-century, the high-emissions scenario predicts a greater increase in the frequency of dry years than the low-emissions scenario. By the end of the century, projected increases in the frequency of dry years remain higher for the high-emissions scenario than the low-emissions scenario, but the difference is less pronounced. The agriculturally rich Central Valley will be one of the areas affected most; nearly four out of every ten years are projected to be dry years in this region by the end of the century. Though counterintuitive, increased flooding and increased drought are not incompatible projections. California’s precipitation cycle is driven by intra-seasonal oscillations, such as the El Niño Southern Oscillation, and exhibits significant inter-decadal variability.8 Precipitation cycle variability may lead to alternating wet and dry periods. Furthermore, flooding events occur over short time periods (hours to days) in response to rapid increases in water volume, whereas drought conditions occur when water supplies are depleted over long time periods (multiple years). Therefore, a severe storm or rapid snowmelt can cause flooding in a year that, overall, has below-average precipitation and drought conditions. Greater incidence of wildfire in California is also a cause for alarm. California’s summers are projected to be significantly hotter with decreased soil moisture and a potential for increased average wind speeds. Increased frequency of long-term droughts, reduced snowpack, and a possible reduction in winter rainfall are projected to become more common. Such conditions increase the likelihood of fires throughout California. Furthermore, vegetation patterns are projected to shift toward faster-growing grasses and shrubs that can fuel more frequent and faster-moving fires. Population increases and human encroachment into high-risk fire areas can also increase the incidence of fire. Roughly 97% of California’s wildfires are started by humans. Additionally, fire suppression activities reduce the occurrence of natural fires, thereby increasing the fuel load and fire risk.9 Statewide, fires have increased by three to four times since the first half of the century. The combination of projected climate changes, alteration of vegetation patterns, and population growth indicates that the frequency of wildfires is likely to increase further in the coming century.
8 Ibid. 9 For more information, refer to “Technical Appendix B: Wildfire Risk in California,” available at: www.RedefiningProgress.org/CACJ/.

Redefining Progress • Climate Change in California: Health, Economic and Equity Impacts • 16
CHAPTER 2: HEALTH IMPACTS OF CLIMATE CHANGE Greater climate variability and overall climate change will have a number of direct and indirect effects on public health. Direct effects involve physical impacts that cause immediate physiologic stress or bodily injury. Indirect effects of climate change include malnutrition caused by drought-induced reductions in crop yields, increased incidence of water- and vector-borne diseases, exacerbated by damage to sanitation and water treatment plants, and poor air quality caused by increased ground-level ozone . While all Californians are vulnerable to the health impacts caused by climate change, low-income groups and communities of color face even greater risk and exposure due to both pre-existing inequalities and disproportionate impacts. Pre-existing inequalities include unequal access to health care and a lack of resources for mitigation. Predicting how, when, where, and to what extent overall health may be affected is a difficult task (Balbus and Wilson, 2000). Some linkages are well defined, such as with extreme heat and heat-related mortality. Others linkages, such as the impact of climate change on vector-borne diseases, are more challenging to study as the impacts are region-specific and often highly indirect. Nevertheless, sufficient research exists to move forward with an assessment of potential impacts on health. The potential scope and severity of these health implications call for as much depth and specificity as possible. This chapter concentrates first on the prevalence of health insurance among low-income groups and people of color and then addresses four specific projected impacts: (1) the effects of heat waves on human mortality rates, (2) the linkage between ozone and asthma, (3) the impact of floods and droughts on human health, and (4) the incidence of water- and vector-borne diseases.
Health Insurance in California Human health is affected by many demographic, social, and temporal factors. Vulnerability to health risks may be influenced not only by exposure to hazards but also by access to medical care in times of need and by basic health maintenance practices. Those who lack health insurance are more likely to go without treatment when needed (Schoen and DesRoches, 2000), receive fewer preventive services, and get less regular care for chronic conditions (Ayanian et al., 2000; Baker et al., 2000). These differences in access to health care result in distinct differences in both life expectancy and quality of life between those with and those without insurance (IOM, 2001). Additionally, when health care is required, the resulting medical bills can cause financial hardships for those individuals and families that lack insurance (IOM, 2002). Disparities in health insurance coverage exist for different income groups, races/ethnicities, and geographical regions in California. Variations in health insurance

Redefining Progress • Climate Change in California: Health, Economic and Equity Impacts • 17
Figure 2.1: Health insurance by income level for Californians ages 0–64, 2001. (CHIS, 2001)
0%
20%
40%
60%
80%
100%
<100% 100-200% 200-300% >300%
Income (% Federal Poverty Level)
Uninsured Medi-Cal Other PublicJob-based Privately Purchased
coverage also relate to employment status, as it affects eligibility for job-based insurance, and access to public insurance programs such as Medi-Care. The 2001 California Health Interview Survey10 (CHIS) provides a wealth of data on health insurance coverage in California (Brown et al., 2002). This data reflects responses from non-elderly Californians (ages 0–64 years) regarding three categories of insurance sources: (1) job-based insurance, which is subsidized by the employer but requires varying levels of contribution from the employee, (2) public coverage, including Medi-Cal, which serves low-income families, and 3) privately purchased insurance. The results are sobering:
• 4.5 million non-elderly Californians lacked health insurance. • 1.7 million others went without coverage during part of the preceding year. • Thus, a total of 6.3 million non-elderly Californians (21%) lacked health
insurance coverage for all or some of the year. • 42.6% of the currently uninsured attributed their lack of coverage to unaffordable
premiums; some could not afford the contribution required by their employer, but most did not have access to job-based insurance.
A number of respondents reported other barriers to getting or maintaining coverage, including (1) changes in personal circumstances due to divorce or death of a coverage provider, (2) ineligibility for public coverage, (3) difficulties in acquiring insurance, and (4) lack of information about insurance options or how to procure it. Citizenship or immigration status was attributed as the cause for not having insurance by 7.4% of those who were uninsured, especially as it related to eligibility for public insurance programs. Figure 2.1 presents a breakdown of types of insurance coverage by income level, with income represented as a percentage of the federal poverty level (FPL). Uninsured rates increase as income decreases, with those in the lowest income category (<100% FPL)
being five times more likely to be uninsured than those in the highest income category (>300% FPL). In the lowest income category, job-based insurance is scarce. This group is three times more likely to rely on Medi-Cal and two times more likely to be uninsured than to have job-based insurance. Comparatively, the percentage of job-based insurance is more than five times higher for those with incomes greater than 300% of the FPL than for those making less than 100% of the FPL. The CHIS also found that 67% of those who are
10 The CHIS sample consisted of 55,000 California households.

Redefining Progress • Climate Change in California: Health, Economic and Equity Impacts • 18
Figure 2.2: Health insurance by race/ethnicity for Californians ages 0–64, 2001. (CHIS, 2001) AI & AN = American Indian and Alaskan Native
0%
20%
40%
60%
80%
100%
White Hispanic Black AI & AN Asian Other
Uninsured Medi-Cal Other Public
Job-based Privately Purchased
Figure 2.3: Health insurance by region for Californians ages 0–64, 2001. (CHIS, 2001)
0%
20%
40%
60%
80%
100%
Northern
& Sier
ra
Greater
Bay Area
Sacram
ento Area
San Jo
aquin
Valley
Centra
l Coas
t
South
Coast
Califor
nia
Uninsured Medi-Cal Other PublicJob-based Privately Purchased
uninsured (i.e., more than 3 million Californians) have incomes below 200% of the FPL. Private health care is often unaffordable for low-income individuals. Disparities also exist in health insurance coverage among different ethnic groups. Figure 2.2 presents a breakdown of insurance coverage by race/ethnicity and source of insurance. All communities of color have higher uninsured rates than Whites. Hispanics are the worst off, being three times more likely than Whites to lack insurance. Hispanics suffer a double blow in this regard; their uninsured rate is higher than any other group, and 67% have household incomes below 200% of the FPL, compared to 19% for Whites. Native Americans have the second-highest uninsured rates, being more than twice as likely as Whites to go without health insurance. Only about one in ten Native American adults in California reported that they obtained medical care through the Indian Health Service.11
Similar figures exist regarding Medi-Cal coverage. Compared to Whites, Hispanics, Blacks, and Native Americans are all more than three times as likely to utilize Medi-Cal insurance. Conversely, Whites are the most likely and Hispanics the least likely to have job-based insurance.
11 The United States government has a trust responsibility to provide health care to all federally recognized American Indians and Alaskan Natives. To be eligible for the Indian Health Service (IHS) is not equivalent to being insured. IHS facilities are not accessible to a majority of indigenous people, owing to their location. Hence, American Indians and Alaskan Natives who do not have any other coverage are considered by the U.S. Census Bureau to be uninsured.

Redefining Progress • Climate Change in California: Health, Economic and Equity Impacts • 19
Regional disparities in health insurance rates in California are shown in Figure 2.3.12 The Sacramento and San Francisco Bay regions have the best insurance coverage profile, with the lowest rates of uninsured and Medi-Cal users and the highest rates of job-based insurance. The South Coast region, including the Los Angeles area, has the highest uninsured rate (18%). However, the Northern and Sierra, Central Coast, and San Joaquin Valley regions had similarly high uninsured rates. The San Joaquin Valley had the highest rate of Medi-Cal usage (21%), followed closely by the Northern and Sierra and the South Coast regions. The San Joaquin Valley and the Northern and Sierra regions had the lowest rates of job-based insurance. The San Joaquin Valley and South Coast regions, which have high rates of uninsured and Medi-Cal users, are also the areas with the highest percentages of low-income groups and people of color in the state (Figures 1.1 and 1.2, respectively). The 25 counties represented by the Northern and Sierra region constitute less than 4% of California’s total population. Statewide averages for insurance coverage are dominated by the patterns in the South Coast region, as more than half of all Californians live in this region.
Temperature Rise and Heat Waves Warmer weather in California will increase the risk of overexposure to heat, resulting in increased heat-related mortality. In addition to raising average temperatures (Figure 1.5), climate change is also projected to increase the severity and frequency of heat waves throughout the state. Studies of heat waves in urban areas have demonstrated a correlation between increased mortality and higher temperatures, whether measured by maximum or minimum temperature, heat index (a measure of temperature and humidity), or “oppressive” air mass conditions that combine heat with humidity for extended periods of time (Semenza et al., 1996; Kalkstein and Greene, 1997). In addition, heat waves often lead to elevated ground-level ozone concentrations and photochemical smog (Epstein, 2004), exacerbating the risk to human health. Within a given region, the distribution of heat-related illness and mortality is uneven. People suffering from chronic medical conditions, for example, are at greater risk of dying during heat waves (Epstein and Rogers, 2004), although excessive heat exposure alone can cause death. Socioeconomic factors play a critical role in determining risk levels. Poor and socially isolated groups without access to air-conditioning are disproportionately affected by heat waves (Epstein and Rogers, 2004). The Intergovernmental Panel on Climate Change (IPCC) found that, in addition to affecting the elderly, children, and the infirm, heat waves have a particularly strong impact on urban populations, especially the urban poor. 12 Northern & Sierra Counties: Alpine, Amador, Butte, Calaveras, Colusa, Del Norte, Glenn, Humboldt, Inyo, Lake, Lassen, Mariposa, Mendocino, Modoc, Mono, Nevada, Plumas, Shasta, Sierra, Siskiyou, Sutter, Tehama, Trinity, Tuolumne, Yuba; Greater Bay Area Counties: Alameda, Contra Costa, Marin, Napa, San Francisco, San Mateo, Santa Clara, Solano, Sonoma; Sacramento Counties: El Dorado, Placer, Sacramento, Yolo; San Joaquin Valley Counties: Fresno, Kern, Kings, Madera, Merced, San Joaquin, Stanislaus, Tulare; Central Coast Counties: Monterey, San Benito, San Luis Obispo, Santa Barbara, Santa Cruz, Ventura; South Coast Counties: Imperial, Los Angeles, Orange, Riverside, San Bernardino, San Diego.

Redefining Progress • Climate Change in California: Health, Economic and Equity Impacts • 20
Urban cores experience higher heat indexes and more incidents of heat-related mortality than surrounding suburban and rural areas (Landsberg, 1981) in part because congested urban areas retain more heat through the night. Owing to typical development patterns, many U.S. cities experience an inner-city “heat-island effect,” with higher air temperatures at the city’s core tapering off toward the city’s edge. Figure 2.4 shows a schematic temperature profile for an idealized urban heat island. Pockets of warm air and cool air (usually parks) contribute to the thermal topography of the heat island. The urban heat island has many impacts on the climate of a city. During winter it reduces heating needs, snowfall amounts, and snow cover duration in many cities. It may also alter wind speed and direction (interacting with other urban elements), cloud cover, precipitation, and air quality throughout the year. However, the impact of the heat island effect is greatest during the summer.
Figure 2.4: Temperature profile of an urban heat island. (http://www.epa.gov/globalwarming/greenhouse/greenhouse14/reduction.html)
Low-income urban communities, which contain a high percentage of people of color, are particularly susceptible to increased temperatures and heat waves, as many households lack the means to afford air-conditioning or travel from the urban area during hot spells. Lack of adequate health care and a higher probability of pre-existing respiratory illnesses such as asthma also make the urban poor more vulnerable to climate-induced increases in smog (Bloomfield et al., 2001). More deaths due to heat waves occur early in the summer rather than later. Although long-term physiological adaptation—a process where people become less sensitive to heat events over time—has been theorized but not documented, such adaptation does not appear to occur over a single summer season (Kalkstein and Smoyer, 1993). The ultimate

Redefining Progress • Climate Change in California: Health, Economic and Equity Impacts • 21
impact of higher temperatures will depend on the extent to which people are able to acclimate and adapt to increased heat. Acclimatization can be physiological, as the human body adapts to higher temperatures, or behavioral, as people learn to modify their daily activities under extreme heat conditions. Adaptation to heat can also involve the use of technology, such as an increase in air-conditioning. The relationship between air-conditioning usage and heat-related mortality is not well established, but some decrease in mortality can be anticipated (Bloomfield et al., 2001); as such, some cities open cooling centers during heat waves to provide refuge for those who lack home air-conditioning. Of course, increased use of air conditioners will boost energy demand during the heat-wave season, leading to higher emissions of air pollutants and greenhouse gases if the electricity is generated from fossil-fuel combustion.
Heat Effects on the Body Human bodies dissipate heat by varying rates of blood circulation, by losing water through the skin and sweat glands, and by panting. When heat gain exceeds the level the body can dissipate, or when the body cannot compensate for fluids and salt lost through perspiration, body temperature starts to rise and heat-related illness may develop. Table 2.1 shows the probable heat disorders associated with various heat levels. Even though, heat disorders range in severity, they share a common feature. The individual is overexposed or over-exercised for his/her age and physical condition given the existing thermal environment.
Heat Index (° F) Physiological Response to Heat Exposure
80–90 Fatigue possible with prolonged exposure and/or physical activity
90–105 Sunstroke, heat cramps, and heat exhaustion possible with prolonged exposure and/or physical activity
105–130 Sunstroke, heat cramps or heat exhaustion likely. Heatstroke possible with prolonged exposure and/or physical activity.
>130 Heatstroke/sunstroke highly likely with continued exposure.
Table 2.1: Physiological responses to heat. (CRAG, 2002)
Temperature variability, rather than the magnitude of temperature highs, can also be a crucial determinant of heat-related mortality (Keatings, 2003). If climate change increases temperature variability, this effect may in fact outweigh the effects of mean temperature increases. Models indicate that populations most susceptible to heat-related illness and death are in cities with extremely high but infrequent temperature spikes, such as Philadelphia, New York, Chicago, Milwaukee, and St. Louis (McGeehin and Mirabelli, 2001). West Coast cities with similarly high mortality rates include Los Angeles, San Francisco, Portland, and Seattle (Davis et al., 2003).
Redefining Progress • Climate Change in California: Health, Economic and Equity Impacts • 22
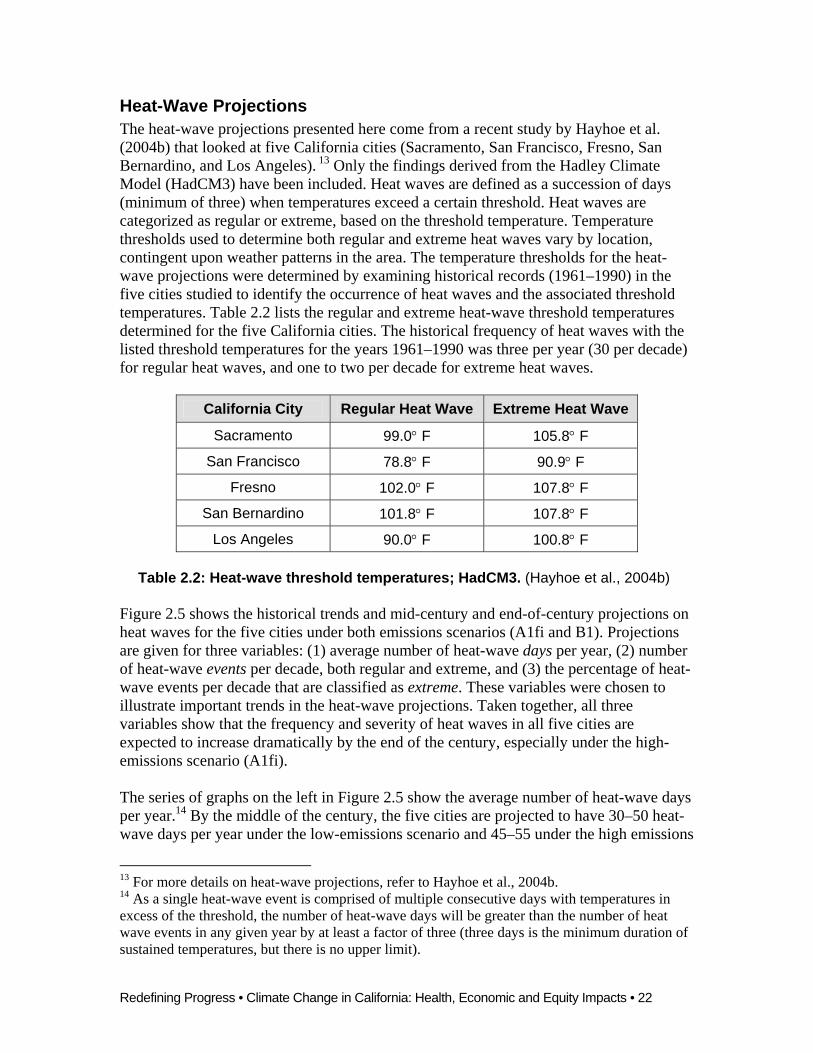
Heat-Wave Projections The heat-wave projections presented here come from a recent study by Hayhoe et al. (2004b) that looked at five California cities (Sacramento, San Francisco, Fresno, San Bernardino, and Los Angeles). 13 Only the findings derived from the Hadley Climate Model (HadCM3) have been included. Heat waves are defined as a succession of days (minimum of three) when temperatures exceed a certain threshold. Heat waves are categorized as regular or extreme, based on the threshold temperature. Temperature thresholds used to determine both regular and extreme heat waves vary by location, contingent upon weather patterns in the area. The temperature thresholds for the heat-wave projections were determined by examining historical records (1961–1990) in the five cities studied to identify the occurrence of heat waves and the associated threshold temperatures. Table 2.2 lists the regular and extreme heat-wave threshold temperatures determined for the five California cities. The historical frequency of heat waves with the listed threshold temperatures for the years 1961–1990 was three per year (30 per decade) for regular heat waves, and one to two per decade for extreme heat waves.
California City Regular Heat Wave Extreme Heat Wave
Sacramento 99.0° F 105.8° F
San Francisco 78.8° F 90.9° F
Fresno 102.0° F 107.8° F
San Bernardino 101.8° F 107.8° F
Los Angeles 90.0° F 100.8° F
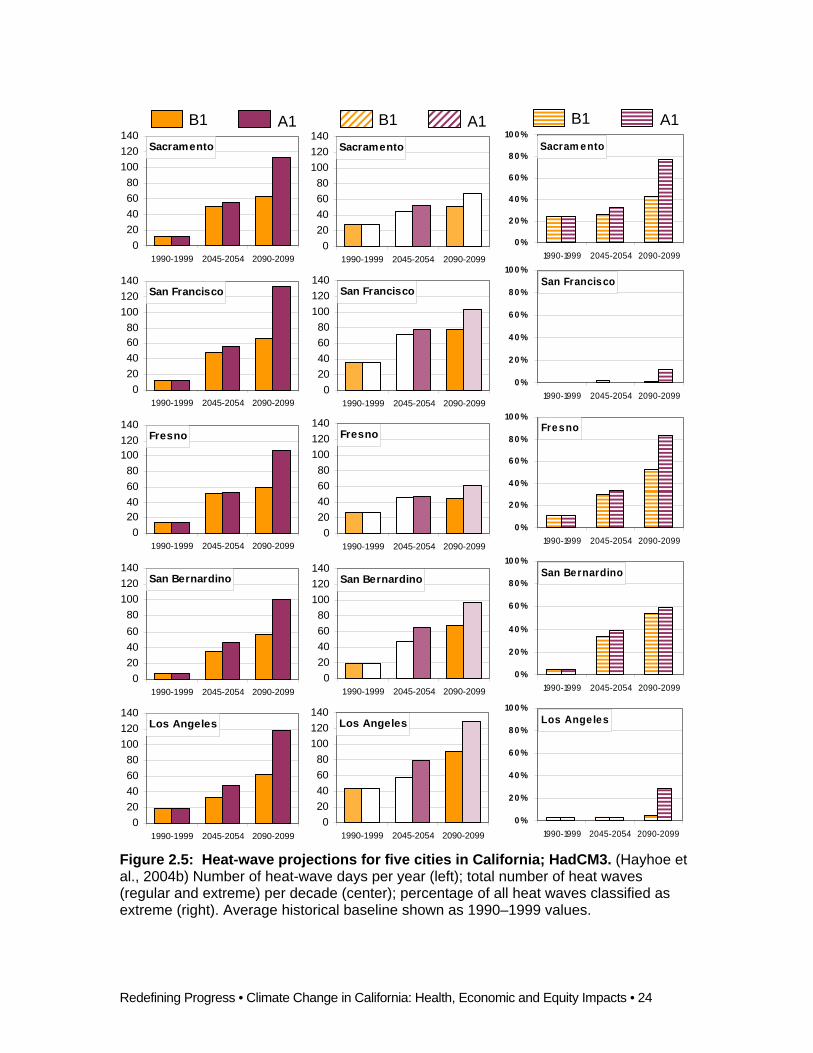
Table 2.2: Heat-wave threshold temperatures; HadCM3. (Hayhoe et al., 2004b) Figure 2.5 shows the historical trends and mid-century and end-of-century projections on heat waves for the five cities under both emissions scenarios (A1fi and B1). Projections are given for three variables: (1) average number of heat-wave days per year, (2) number of heat-wave events per decade, both regular and extreme, and (3) the percentage of heat-wave events per decade that are classified as extreme. These variables were chosen to illustrate important trends in the heat-wave projections. Taken together, all three variables show that the frequency and severity of heat waves in all five cities are expected to increase dramatically by the end of the century, especially under the high-emissions scenario (A1fi). The series of graphs on the left in Figure 2.5 show the average number of heat-wave days per year.14 By the middle of the century, the five cities are projected to have 30–50 heat-wave days per year under the low-emissions scenario and 45–55 under the high emissions
13 For more details on heat-wave projections, refer to Hayhoe et al., 2004b. 14 As a single heat-wave event is comprised of multiple consecutive days with temperatures in excess of the threshold, the number of heat-wave days will be greater than the number of heat wave events in any given year by at least a factor of three (three days is the minimum duration of sustained temperatures, but there is no upper limit).

Redefining Progress • Climate Change in California: Health, Economic and Equity Impacts • 23
scenario, with Los Angeles and San Bernardino having the fewest. By the end of the century, most cities would see a modest additional increase in heat-wave days under the low-emissions scenario. Under high emissions, on the other hand, the end-of-century projections show a drastic increase in the number of heat-wave days, such that temperatures are expected to be above the respective thresholds for 100–130 days per year. Such a high number of heat-wave days could easily translate into a single massive heat wave that lasted virtually the entire summer season (three to four months). Furthermore, where Los Angeles and San Francisco had the fewest heat-wave days at mid-century, these cities would have the most heat waves by the end of the century. The series of graphs in the center column of Figure 2.5 show the number of heat-wave events (both regular and extreme) per decade. The projections for three of the cities (San Francisco, San Bernardino, and Los Angeles) exhibit the familiar patterns of increasing frequency throughout the century and greater frequency under the high-emissions scenario. Important regional variations can be observed, attributable to differences in both the threshold temperatures that define heat waves for the various cities and the changes in temperature that will occur in the various regions. Los Angeles is projected to have the most heat waves among the five cities, with approximately 130 heat-wave events per decade by the end of the century under the high-emissions scenario; San Bernardino and San Francisco are expected to have around 100. On the other hand, Fresno and Sacramento show a smaller increase in the number of heat-wave events across the different time periods and emissions scenarios. The series of graphs on the right in Figure 2.5 show the percentage of heat-wave events per decade classified as extreme. Extreme heat waves carry a higher risk for causing heat-related morbidity and mortality. As such, significant increases in the number of such events would have important implications for health. Extreme heat-waves currently constitute about two percent of all heat waves, but this proportion is projected to increase, particularly under the high-emissions scenario and for inland locations like Sacramento, Fresno, and San Bernardino. By the end of the century, the vast majority of heat-wave events projected for Fresno and Sacramento, around 80%, are expected to be extreme heat waves under the high-emissions scenario; in San Bernardino the figure is nearly 60%. Los Angeles and San Francisco are projected to experience many fewer extreme heat-wave events, with virtually none expected to reach the extreme level until the end of the century, and then only for the high-emissions scenario.
Redefining Progress • Climate Change in California: Health, Economic and Equity Impacts • 24
Figure 2.5: Heat-wave projections for five cities in California; HadCM3. (Hayhoe et al., 2004b) Number of heat-wave days per year (left); total number of heat waves (regular and extreme) per decade (center); percentage of all heat waves classified as extreme (right). Average historical baseline shown as 1990–1999 values.
Sacramento
020406080
100120140
1990-1999 2045-2054 2090-2099
San Francisco
020406080
100120140
1990-1999 2045-2054 2090-2099
Fresno
020406080
100120140
1990-1999 2045-2054 2090-2099
San Bernardino
020406080
100120140
1990-1999 2045-2054 2090-2099
Los Angeles
020406080
100120140
1990-1999 2045-2054 2090-2099
B1 A1 B1 A1 B1 A1
Los Angeles
0 %
2 0 %
4 0 %
6 0 %
8 0 %
10 0 %
1990-1999 2045-2054 2090-2099
San Bernardino
0 %
2 0 %
4 0 %
6 0 %
8 0 %
10 0 %
1990-1999 2045-2054 2090-2099
Fresno
0 %
2 0 %
4 0 %
6 0 %
8 0 %
10 0 %
1990-1999 2045-2054 2090-2099
San Francisco
0 %
2 0 %
4 0 %
6 0 %
8 0 %
10 0 %
1990-1999 2045-2054 2090-2099
Sacram ento
0 %
2 0 %
4 0 %
6 0 %
8 0 %
10 0 %
1990-1999 2045-2054 2090-2099

Redefining Progress • Climate Change in California: Health, Economic and Equity Impacts • 25
The heat-wave mortality projections by race/ethnicity for Los Angeles outlined in this report reveal that Blacks are especially susceptible to temperature increases and heat waves. These projections are probably conservative, as they assume that the percentage of each group in the total population remains constant over time. Heat wave-related mortality rates were calculated from race-specific algorithms, based on historical relationships between mortality for these races and heat waves observed in Los Angeles during the historical reference period (1989–1998). Using HadCM3 and PCM temperature projections for mid-century (2050s) and end of the century (2090s), and for high-emissions (A1fi) and low-emissions (B1) scenarios, future changes in heat-related mortality were estimated by applying the algorithms to all days in Los Angeles with maximum temperatures projected to be at or above 93° F, which is the threshold for Los Angeles beyond which heat-related mortality increases. Presented below are the mortality rates per 100,000 by race determined from these algorithms.
Heat-Wave Mortality Rate for Los Angeles per 100,000 Decade and Emissions Scenario White Asian Black Hispanic
1989–1998 3.04 1.69 5.55 0.90 2050s A1 9.06 – 13.99 4.45 – 5.60 14.86 – 15.64 1.58 – 2.592050s B1 5.58 – 7.20 2.49 – 3.56 7.21 – 11.87 0.85 – 2.032090s A1 21.29 – 34.77 9.16 – 14.94 30.06 – 51.14 4.71 – 9.592090s B1 8.04 – 14.26 3.73 – 6.31 12.09 – 20.97 1.77 – 3.42
Table 2.3: Heat-wave mortality rates by race/ethnicity for Los Angeles per 100,000. A comparison of heat-related mortality rates per 100,000; actual historical values (1989-1998) and projected future values (2050s and 2090s) for the high-emissions (A1fi) and low-emissions (B1) scenarios. The ranges of mortality rates arise from differences in temperature projections from the two climate models used (HadCM3 and PCM). Source: 2000 Census and author’s calculations. Table 2.3 shows historical and future heat wave-related mortality rates per 100,000 by race for Los Angeles at mid-century and end-of-century for both climate models based on the population distribution of the 2000 census. The values for the time period 1989–1998 are actual historical data. The ranges given for the projected mortality rates represent estimates derived from the different climate models (HadCM3 and PCM). These projections show what the death rates in 2000 would look like if 2000 had been as warm as what the climate models predict for 2050 and 2090. This data does not take into account growth in overall population or changes in racial distribution over time. This also does not allow for adaptation to gradually increasing temperatures over time. This may bias the heat mortality rates upward. Surprisingly, the mortality rate for whites is relatively high and grows rather quickly. One likely reason is that a greater proportion of the white population is elderly, who are more susceptible to heat death, than the other racial/ethnic populations. In the future, we hope to account for distribution in age and adaptive measures.
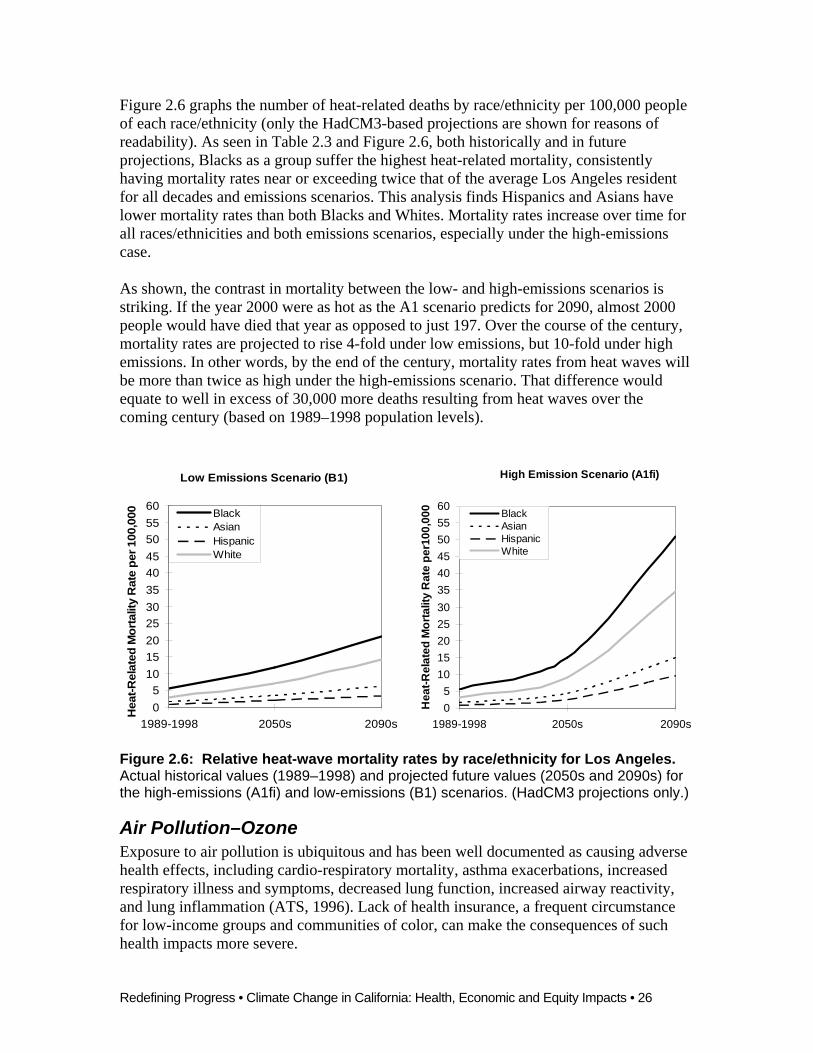
Redefining Progress • Climate Change in California: Health, Economic and Equity Impacts • 26
Low Emissions Scenario (B1)
0
3
6
9
12
15
18
1989-1998 2050s 2090s
Rel
ativ
e H
eat-R
elat
ed M
orta
lity
Rat
e .
BlackAsianHispanicWhite
High Emission Scenario (A1fi)
0
3
6
9
12
15
18
1989-1998 2050s 2090s
Rel
ativ
e H
eat-R
elat
ed M
orta
lity
Rat
e .
BlackAsianHispanicWhite
Figure 2.6 graphs the number of heat-related deaths by race/ethnicity per 100,000 people of each race/ethnicity (only the HadCM3-based projections are shown for reasons of readability). As seen in Table 2.3 and Figure 2.6, both historically and in future projections, Blacks as a group suffer the highest heat-related mortality, consistently having mortality rates near or exceeding twice that of the average Los Angeles resident for all decades and emissions scenarios. This analysis finds Hispanics and Asians have lower mortality rates than both Blacks and Whites. Mortality rates increase over time for all races/ethnicities and both emissions scenarios, especially under the high-emissions case. As shown, the contrast in mortality between the low- and high-emissions scenarios is striking. If the year 2000 were as hot as the A1 scenario predicts for 2090, almost 2000 people would have died that year as opposed to just 197. Over the course of the century, mortality rates are projected to rise 4-fold under low emissions, but 10-fold under high emissions. In other words, by the end of the century, mortality rates from heat waves will be more than twice as high under the high-emissions scenario. That difference would equate to well in excess of 30,000 more deaths resulting from heat waves over the coming century (based on 1989–1998 population levels).
Figure 2.6: Relative heat-wave mortality rates by race/ethnicity for Los Angeles. Actual historical values (1989–1998) and projected future values (2050s and 2090s) for the high-emissions (A1fi) and low-emissions (B1) scenarios. (HadCM3 projections only.)
Air Pollution–Ozone Exposure to air pollution is ubiquitous and has been well documented as causing adverse health effects, including cardio-respiratory mortality, asthma exacerbations, increased respiratory illness and symptoms, decreased lung function, increased airway reactivity, and lung inflammation (ATS, 1996). Lack of health insurance, a frequent circumstance for low-income groups and communities of color, can make the consequences of such health impacts more severe.
High Emission Scenario (A1fi)
05
1015202530354045505560
1989-1998 2050s 2090s
Hea
t-Rel
ated
Mor
talit
y R
ate
per1
00,0
00 .
BlackAsianHispanicWhite
Low Emissions Scenario (B1)
05
1015202530354045505560
1989-1998 2050s 2090s
Hea
t-Rel
ated
Mor
talit
y R
ate
per 1
00,0
00.
BlackAsianHispanicWhite
Redefining Progress • Climate Change in California: Health, Economic and Equity Impacts • 27
Ozone Formation Tropospheric, or ground-level, ozone is a secondary air pollutant that forms when its chemical precursors—nitrogen oxides (NOx) and volatile organic compounds (VOCs)—interact in the atmosphere in the presence of sunlight. The ozone precur-sors are emitted directly from both human and natural sources. NOx is primarily of anthropogenic origin, forming during high-temperature combustion of fossil fuels. Motor vehicles, power plants, and other industrial uses of combustion are major sources of NOx. Anthropogenic sources of VOCs include fossil fuel combustion and evaporation of petroleum products and solvents. Accumulation of ozone depends not only on the presence of the precursors but also on local weather patterns. Tem-perature, solar radiation, precipitation, cloud cover, atmospheric water vapor, wind speed, and wind direction all play a role in the production, destruction, and transport of ozone and its precursors, and ultimately, therefore, local ambient ozone levels (Bernard et al., 2001).
Air pollution and its impact on public health has long been an issue of concern. Since the enactment of the 1970 Clean Air Act, air pollutant emissions have declined and air quality has improved dramatically in the United States. However, many areas of the country currently fall well short of meeting the health-based Ambient Air Quality Standards (AAQS) established by the EPA for one or more of the six criteria pollutants [ozone (O3), particulate matter (PM10), carbon monoxide (CO), nitrogen dioxide (NO2), sulfur oxides (SOx), and lead (Pb)]. And in the absence of stringent controls on vehicle emissions, climate change will most likely have a negative effect on air quality in California, increasing human health problems related to air pollution. In California, ozone is a criteria pollutant of concern for a number of reasons, listed here and expanded on below. First, the downward trend in ozone concentrations that started in the 1970s began to level off in the 1990s. As such, ozone has proven to be the criteria pollutant most resistant to improvement efforts (NRDC, 2004; Bernard et al., 2001). Second, ozone is the criteria pollutant that is most sensitive to temperature and weather and is therefore more likely to be impacted by climate change (NRDC, 2004; Bernard et al., 2001). Third, California already has the worst ambient ozone levels in the nation; it is the only state with counties that have non-attainment classifications of “severe” and “serious” (National 8-hour AAQS). Fourth, the areas in California with the most severe ozone problems are also the areas with the highest densities of people of color and low-income residents. The impact of climate change on ozone-related health effects should therefore be a priority for California, especially with regard to those communities that may be more severely impacted. The following discussion begins with an explanation of California’s current ozone problem, followed by a qualitative discussion of the impact of climate change on future ozone levels. A brief review of the established health effects of ozone is presented. Finally, the impact of ozone on vulnerable populations is discussed, including the susceptibility of asthmatics to ozone, with a particular focus on racial/ethnic and income disparities related to asthma.
Ozone in California Tropospheric (ground-level) ozone is the primary pollutant in what is commonly referred to as smog. Ozone pollution results from a complex interplay of chemical reac-tions and meteorological conditions, which

Redefining Progress • Climate Change in California: Health, Economic and Equity Impacts • 28
Figure 2.7: Days of AAQS violations for selected California air basins in 2003. (CARB, 2004a)
0
20
40
60
80
100
120
140
CA 1-hr US 1-hr US 8-hr
Day
s A
AQ
S Ex
ceed
ed
Sacramento Metropolitan AreaSan Diego Air BasinSan Francisco Bay Air BasinSan Joaquin Valley Air BasinSouth Coast Air Basin
are briefly explained in the sidebar at right. As previously mentioned, California has the most severe ozone problems of any region in the United States. According to the American Lung Association’s 2003 “State of the Air” national report, California has 6 of the 7 most ozone-polluted metropolitan areas in the U.S., and 12 of the 15 most ozone-polluted counties in the U.S. (Table 2.4).
Table 2.4: Air quality rankings in California (based on ozone pollution). (ALA, 2003)
California’s distinction of having the nation’s worst ozone-related air quality is based on the frequency and degree with which ambient ozone levels in various regions within the state violate the AAQS established by the EPA. The U.S. EPA and California EPA have set primary standards for ozone, as listed in the box at right. The primary AAQS are intended to protect public health with a margin of safety for sensitive populations such as asthmatics, children, and the elderly. Areas with ozone levels above the AAQS are designated as non-attainment areas, and these are further categorized according to the severity and frequency of AAQS violations. Figure 2.7 shows the number of days the various federal and state AAQS were violated in 2003 for the five air basins with the highest populations (CARB, 2004a). Ozone levels exceeded AAQS far
California’s Air Quality Distinctions Areas of Distinction (National Rank)
6 of top 7 most ozone-polluted metropolitan areas in U.S.—including the top 4
Los Angeles-Riverside-Orange County (1), Fresno (2), Bakersfield (3), Visalia-Tulare-Porterville (4), Sacramento-Yolo (6), Merced (7)
12 of top 15 most ozone-polluted counties in U.S.—including the top 5
San Bernardino (1), Fresno (2), Kern (3), Tulare (4), Riverside (5), Los Angeles (7), El Dorado (8), Merced (9), Kings (10), Nevada (13), Ventura (14), Sacramento (15)
Ambient Air Quality Standard
Ozone Concentration
(ppb) California 1-hour 90 National 1-hour* 120 National 8-hour 85
*being phased out

Redefining Progress • Climate Change in California: Health, Economic and Equity Impacts • 29
more frequently in the San Joaquin Valley and South Coast air basins than in the other California air basins. Ozone violation days occur almost exclusively in the summer months, such that in the San Joaquin Valley and South Coast air basins, ambient ozone levels are above the health-based standards somewhere within both basins almost every day between mid-May and mid-October. Figure 2.8 shows the non-attainment designations as of 2003 for the California 1-hour AAQS (A) and the corresponding air basins (B), which are delineated according to topographic air drainage features. The South Coast and San Joaquin Valley air basins are the areas in California with the worst ozone non-attainment designations. In fact, as of April 2004, the San Joaquin Valley air basin has been downgraded from “severe” to “extreme” non-attainment status.
Figure 2.8: California 1-hour AAQS non-attainment designations in 2003; air basin delineations. (A: http://www.arb.ca.gov/desig/adm/s_classif.pdf; B: http://www.arb.ca.gov/ei/maps/statemap/abmap.htm) *In April 2004, the San Joaquin Valley Air Basin was downgraded from “severe” to “extreme” non-attainment status. The extreme ozone problems in the San Joaquin Valley and South Coast air basins are related to the specific anthropogenic emissions, as well as the topography and meteorological conditions, in these two basins. Both areas have significant emissions of the ozone precursor pollutants (NOx and VOCs), most of which arise from vehicles. Both the San Joaquin Valley and South Coast air basins are bordered by mountains and are subject to meteorological inversions, which act in concert to trap pollutants within the air basin and prevent vertical mixing. Furthermore, the climate of both areas is characterized by warm, dry summers (Barba et al., 2004; Bloomfield et al., 2001). Hence, the conditions that lead to the production and retention of significant concentrations of ozone
EXTREME SEVERE * SERIOUS MODERATE NONATTAINMENT ATTAINMENT UNCLASSIFIED
(A) Nonattainment Designations (B) Air Basin Delineations

Redefining Progress • Climate Change in California: Health, Economic and Equity Impacts • 30
(ample precursor emissions, warm stagnant air, and bright sunny days) occur more frequently in these regions than in other parts of California. Ambient ozone levels do not necessarily translate directly into human exposure to ozone. Actual exposure depends on many factors, including the duration, frequency, and timing of outdoor activities; level of exertion and breathing rate; and location. However, these levels do indicate a potential for exposure. In particular, ozone concentrations in excess of the AAQS may be used to indicate a risk of exposure to ozone levels that can result in adverse health effects.
Ozone and Climate Change Projecting future ozone concentrations is a difficult task. Ozone formation and accumulation is a complex process involving many variables, all of which are difficult to forecast with any degree of certainty. Nonetheless, there is sufficient scientific data and reasoned analysis to allow that, in the absence of stringent emission controls, ozone levels are likely to increase in California as a result of climate change. Climate change may have an effect on air pollutant exposures by (1) altering weather patterns that influence atmospheric chemical reactions and affect the transport processes that impact the production, destruction, and movement of air pollutants, and (2) by affecting anthropogenic and natural emissions of air pollutants (Patz et al., 2000). The increase in average temperatures associated with climate change may contribute to increases in future ozone levels in several ways. First, higher temperatures could result in increased emissions of the ozone precursors (VOCs and NOx). Anthropogenic VOC emissions would rise due to increased evaporation. Higher temperatures also increase natural VOC emissions from vegetation. Anthropogenic emissions of NOx and VOCs will also increase if higher temperatures lead to an increased demand for air-conditioning in homes, workplaces, and transportation, provided energy continues to be derived to a significant degree from fossil fuels. In addition to potential increases in ozone precursors, higher temperatures could impact ozone formation directly. As with any chemical reaction, the processes that form ozone are influenced by temperature. Higher temperatures increase the rate of the reaction, speeding up ozone formation and potentially leading to higher ozone levels. A number of sophisticated modeling studies have predicted increases in ozone concentration under simulated conditions of increased temperature for various climate change scenarios (Morris et al., 1989; Deuel et al., 1999; Penner et al., 1989). A model simulation of the central California region showed a 20% increase in ozone when temperature increased by 7.2 °F (Morris et al., 1989). Temperature increases of this magnitude have been projected to occur throughout California by mid-century under the high-emissions scenario and by the end of the century under both the high- and low-emissions scenarios. (Figure 1.5 in chapter 1). Additionally, analyses of past and current ozone and temperature data typically reveal a positive correlation, with higher temperatures and higher ozone concentrations coinciding (Aw and Kleeman, 2003; Kelly and Gunst, 1990; USEPA, 1996). Likewise, the vast majority of ozone AAQS violations occur in the warm summer months.

Redefining Progress • Climate Change in California: Health, Economic and Equity Impacts • 31
In addition to temperature increases, climate change may have additional local and regional impacts that would influence tropospheric ozone formation, including (1) changes in solar radiation and cloud cover, (2) changes in the pattern and persistence of high-pressure systems and related changes in mixing, temperature, and wind fields, (3) changes in dry and wet deposition rates, and (4) changes in atmospheric water-vapor content (USEPA, 1989). These factors could either increase or decrease ozone levels. As a result, the overall magnitude of the climate change impact on ozone levels is difficult to quantify. In addition to local factors, emissions across the globe are a serious concern for ozone levels in California. Evidence for intercontinental transport of hitherto “local” pollutants from urban areas in the U.S., Europe, and Asia is substantial (Holloway et al., 2003). Long-range transport of Asian emissions to the west coast of the United States, as documented by Jaffe et al. (2003), has the potential to raise background ozone levels. As background ozone levels increase, the amount of local ozone precursor emissions required to violate AAQS will decrease. Future ozone levels in California will also be affected by factors unrelated to climate change, particularly population growth and emissions-control efforts. Each additional person and household adds to the emission of ozone precursors through increased energy demand and activities such as driving and home maintenance. In addition, development patterns and the technology used to support population growth can add to the burden of increasing population. Urban sprawl development increases commute distances, thereby increasing vehicle emissions; if fuel-inefficient vehicles such as SUVs are used for that commute, emissions will increase even further. Discrepancies in the locations of jobs and affordable housing are already causing growing numbers of Bay Area workers to move into the San Joaquin Valley, adding pollutant stress to a system that is already overburdened (Barba et al., 2004). Ozone is not a new problem in California; the state has been actively addressing the issue for decades. All the non-attainment areas have outlined plans to bring ozone levels within regulated limits, primarily by limiting and decreasing the emission of ozone precursors. However, as previously observed, the downward trend in ozone levels has slowed in the past decade, suggesting that existing efforts have reached the limit of their ability to improve the situation. In the near and long term, measures to bring ozone levels in line with AAQS will have to overcome not only the current lag in progress but also the impending increases in ozone levels that are likely to result from climate change and population growth, both in California as well as in other regions from which pollutants are transported into California’s airspace.
Ozone and Health Numerous animal toxicological studies and in vitro experiments, human clinical exposures, and epidemiological studies have resulted in a well-established list of the adverse health effects of ozone exposure. Ozone-related health effects are diverse in scope, severity, and duration (ALA, 2001). Exposure to even relatively low

Redefining Progress • Climate Change in California: Health, Economic and Equity Impacts • 32
concentrations of ozone has been shown to cause lung inflammation, acutely decreased lung functions, and respiratory impairment in healthy adults and children (Bernard et al., 2001). Exposure to elevated ozone levels can cause shortness of breath, painful breathing, and severe coughing (USEPA, 1997). Ozone is known to aggravate existing respiratory ailments, including asthma, chronic bronchitis, pneumonia, and emphysema. Epidemiological studies have even shown links between elevated ambient ozone levels and mortality (Goldberg et al., 2001; O’Neill et al., 2004). Recent studies conducted in southern California have found connections between air pollution and the development of respiratory impairment and disease in children. McConnell et al. (2002) found that air pollution and outdoor exercise could contribute to the development of asthma in children. Similarly, Gauderman et al. (2004) found that air pollution exposure was correlated with deficits in the respiratory growth of children, resulting in significant deficits in lung function by adulthood, although ozone was not specifically implicated. The authors note that lung function is an important determinant of morbidity and mortality. The development of permanent respiratory ailments, especially asthma, leads to a lifelong susceptibility to the health impacts of ozone exposure.
Ozone and Vulnerable Populations Certain populations are more at risk for adverse health effects from ozone exposure, including children, the elderly, outdoor athletes and laborers, and those with pre-existing respiratory ailments. For low-income communities and people of color, the risks are compounded by socioeconomic factors such as disparities in health-care access, health insurance coverage, and routine health maintenance practices (ALA, 2001). In addition, these groups are heavily represented in the areas with the worst ozone levels. Figures 2.7 and 2.8 present evidence of the severity of the ozone problem in the San Joaquin Valley and South Coast regions. A comparison of these patterns with the distribution of low-income groups and people of color (Figures 1.1 and 1.2, respectively) reveals that the areas with the worst ozone problem coincide with areas that are heavily populated by low-income groups and communities of color. The South Coast and San Joaquin Valley also have the highest percentages of people without insurance in the state (Figure 2.3). Together, these circumstances suggest that low-income groups and people of color may face disproportionately greater risks from increased ozone pollution. Existing patterns of risk will be further reinforced as climate change is expected to cause an increase in ozone levels in the coming century, unless stringent emissions controls are adopted. Figure 2.9, which shows an overlay of current persons of color (left) and poverty (right) distributions with temperature projections for the end-of-century high emissions scenario (A1fi), illuminates the multiple dimensions of the problem that low-income groups and communities of color may face with ozone in the coming decades. Temperatures and ozone precursor emissions will rise, creating ideal conditions for substantial ozone formation, especially in the topographically confined San Joaquin Valley and South Coast regions where most of California’s low-income groups and communities of color reside.

Redefining Progress • Climate Change in California: Health, Economic and Equity Impacts • 33
0
100
200
300
400
500
Stat
ewid
e
Whi
te
Blac
k
Hisp
anic
Asia
n &
PIN
ative
Am
eric
anAst
hma
Hos
ptia
lizat
ion
Rat
e .
(per
100
,000
) .
AdultsChildren
Figure 2.10: California hospital admission rate for asthma in 2001. (OSHPD, 2003)
Figure 2.9: Future temperature increases and percent people of color and in poverty. (Hayhoe et al., 2004a; USCB, 2000) Average summer temperature increase for June, July, and August compared to 1990–1999 average for high-emissions scenario and end of the century. Also shown: percentage persons of color (left), and percentage of population living below the federal poverty level (right). Of special importance to California is the susceptibility of asthmatics to the adverse impacts of ozone exposure. California leads the nation in estimated number of people affected by asthma, with an estimated 3.9 million asthmatics (Meng et al., 2003). Approximately 40,000 Californian’s are hospitalized each year because of asthma (CDHS, 2000). Racial/ethnic and income disparities play an increasingly clear role in the prevalence of asthma-related morbidity and mortality. The African-American population appears to have a much higher incidence of asthma-related health problems than other racial and ethnic groups, including an asthma mortality rate 2.5 times

Redefining Progress • Climate Change in California: Health, Economic and Equity Impacts • 34
higher than that of Whites (ALA, 2001). A study by Ray et al. (1998) investigated asthma hospitalization in California in 1993 and found a number of income- and race/ethnicity-related differences. Most notably, hospitalization rates for African-Americans were approximately four times higher than for the other groups, including Hispanics, Asians, and Whites. Furthermore, this association was independent of income. A separate finding of the study was that asthma hospitalization rates were one and a half times higher for residents living in areas with median household incomes below $35,000 than for those living in areas with median household incomes above $35,000. The California Office of Statewide Health Planning and Development’s analysis of hospital admissions for adult and pediatric asthma for 2001 also found significant race/ethnicity differences (OSHPD, 2003), with Blacks (adults and children) having hospital admission rates more than three times higher than non-Hispanic Whites (Figure 2.10). In addition to containing the worst ozone areas in the state, the Los Angeles metropolitan area also has the most asthma-related hospitalizations of any county, with almost one-third of all California’s asthma-related hospitalizations in 2000 (Stockman et al., 2003). Furthermore, as shown in Figure 2.11, the areas with the greatest numbers of asthma hospitalizations within Los Angeles coincide with areas that have high percentages of people of color.
Figure 2.11: Asthma hospitalization in Los Angeles in 1996; percent people of color in Los Angeles. (Bloomfield et al., 2001; USCB, 2000)
The preceding discussion in no way implies that ozone pollution was the main cause of asthma or asthma hospitalizations. However, asthma is a risk factor for being negatively impacted by exposure to ozone, and asthmatics living in areas with high ozone levels will be at greater risk than those without the condition. The high rate of asthma among Blacks
Percent of Population that is People of Color
< 10 - 20 - 30 - 40 - 50 - 70 - > 10% 20 30 40 50 70 80 80%
East LA
South Central
LA
Number of Asthma Hospitalizations, 1996 1 - 50 - 100 - 150 - 200 - no 50 100 150 200 259 data

Redefining Progress • Climate Change in California: Health, Economic and Equity Impacts • 35
implies that this racial group may be disproportionately affected by increases in ozone concentrations caused by climate change.
Extreme Weather Events – Droughts, Floods and Wild Fires Extreme weather events such as floods and droughts have taken a toll on the health of California’s people, ecosystems, and economy. With its extensive coastline, California is especially vulnerable to predicted sea-level rise. Floods and droughts can reduce water quality and lead to damage from landslides, dust storms, and forest fires. As discussed in chapter 1, the frequency of floods, droughts, and wild fires is projected to increase over the coming century (Figures 1.7 and 1.8). An increase in these extreme weather events could lead to water contamination, human illness and injury, and destruction of ecosystems (PSR, 2003). Both floods and droughts can influence the distribution of water- and vector-borne diseases, which are discussed later in this chapter. Floods are the leading cause of death from drowning and account for 40% of all injuries resulting from natural disasters (Greenough et al., 2001). During the El Niño years of 1997 and 1998, floods in the nine-county San Francisco Bay Area and Central Valley forced hundreds of people to leave their homes. Statewide, El Niño-related weather events caused 17 deaths and 29 major injuries, and inflicted more than $700 million in damage to public and private property (FEMA, 1999). Thirty-five counties were declared federal disaster areas (PSR, 2003). Property damage and fatalities from floods have increased in the last 25 years, largely because more people live and work in higher-risk coastal and floodplain areas (Kunkel et al., 1999). Flooding also spreads contaminants from fields, roadways, and industrial sites and may cause overflows of sewage drains, water-treatment centers, and agricultural lagoons, polluting surface water supplies. Droughts that occur in poor regions of the world have traditionally been associated with crop failure, malnutrition, and starvation, although such severe impacts are unlikely to occur in the U.S. But dry conditions in California do typically result in more frequent and severe wildfires, which pose a direct threat to human safety and degrade air quality, with repercussions for respiratory health (Elliott et al., 2004). The dwindling of reservoirs can also increase the concentration of contaminants in water supplies. Natural disasters, such as floods, drought, and wildfires, often hit low-income groups and people of color particularly hard, as they may not have the resources to cope with losses. This is true both globally and regionally. For example, the primarily agricultural communities of the Central Valley, particularly the workers who rely on short-term contracts, may be left unemployed in the event of a natural disaster that shuts down agriculture, impacting their ability to afford basic necessities like food and shelter. Other groups of outdoor workers, such as those that work in construction, landscaping, and recreation, would be similarly impacted in the event of extreme weather and natural disasters.

Redefining Progress • Climate Change in California: Health, Economic and Equity Impacts • 36
Water-Borne and Vector-Borne Diseases
Water-Borne Diseases Climate change has the potential to be a major factor in the spread of infectious diseases. Weather and climate can affect host defenses, vectors, pathogens, and habitat (Epstein, 2002). Weather patterns have been directly associated with water-borne disease agents, such as Vibrio bacteria, viruses, and toxic algal blooms. Changes in precipitation, temperature, humidity, salinity, and wind have a considerable effect on the quality of water used for drinking, recreational, and commercial purposes, and as a habitat for fish and shellfish. Water-borne pathogens can be ingested by drinking contaminated water, eating seafood from contaminated water bodies, or eating fresh produce irrigated or processed with contaminated water (Tauxe, 1997). People may also be exposed to water-borne diseases through commercial fishing or swimming (Coye and Goldoft, 1989). Protection against outbreaks of food- and water-borne diseases is provided by sewage and sanitation systems and food-storage infrastructure, as well as by monitoring of beach and recreational water quality (USEPA, 1999). During and after extreme weather events such as floods, however, these systems can break down, placing affected communities at serious risk of infection.
Vector-Borne Diseases Many environmental factors determine the survival and transmission of vector-borne diseases, and, as such, climate change may play an important role in their prevalence and spread. Diseases in this class, which includes malaria, plague, yellow fever, and dengue fever, are transmitted to humans by intermediate carriers known as vectors. Common vectors include rodents and blood-feeding arthropods such as insects, ticks, and mites. The disease-causing agent can be a pathogen or parasite. Vector-borne diseases are widespread, ranging from the tropics and subtropics to temperate climate zones, but rarely occur in the colder climates of the world. Vectors require specific ecosystems for survival and reproduction. The occurrence of vector-borne diseases is determined mainly by (1) the abundance of vectors and hosts, (2) the prevalence of disease-causing parasites and pathogens suitably adapted to the vectors and hosts, (3) the resilience and behavior of the host population, which must be in dynamic equilibrium with the parasites and pathogens, and (4) local environmental conditions. The environmental conditions that influence the suitability of a particular ecosystem include temperature, precipitation, relative humidity, wind, solar radiation, topography, and fresh water sources (e.g., ponds, rivers, and lakes) (WHO, 1990). Changes in any of these factors affect the survival and, thus, the distribution of vectors (Kay et al., 1989). A permanent change in one of the factors may alter the equilibrium of the ecosystem, resulting in creation of more or less favorable vector habitats. Therefore, projected climatic changes are likely to have a considerable impact on the distribution of vector-borne diseases. Figure 2.12 shows some of the connections between climate change-induced alterations of environmental factors and vector-borne diseases.
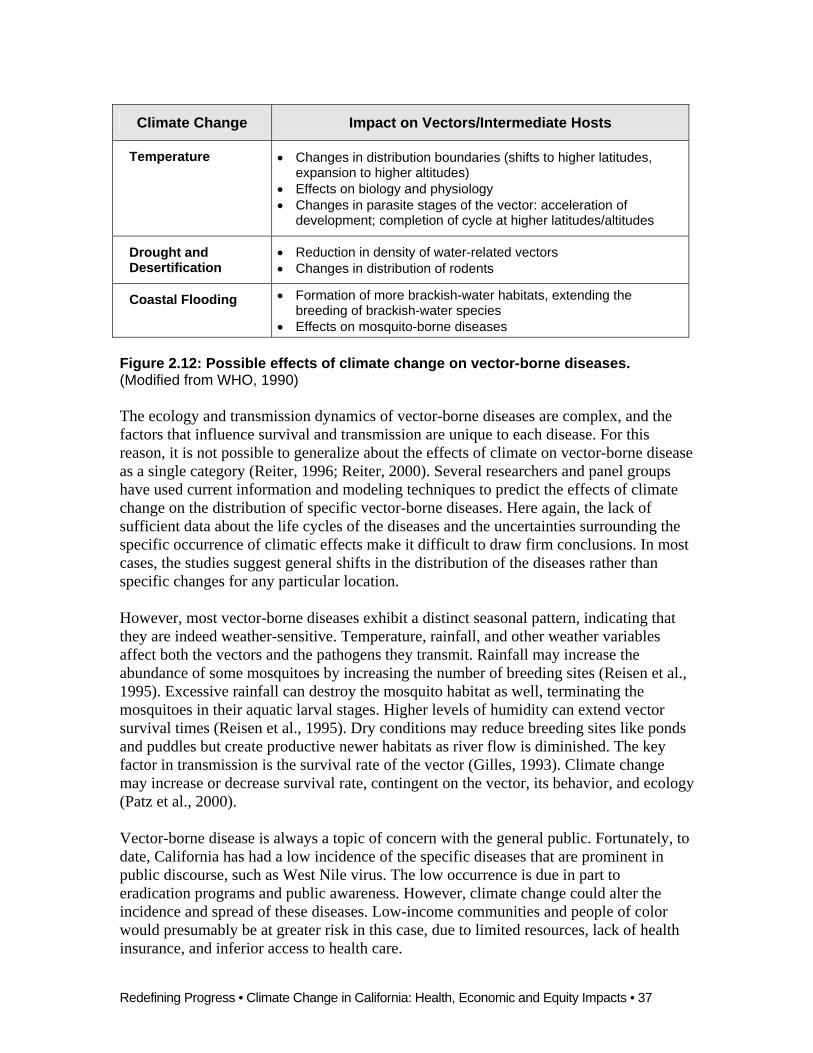
Redefining Progress • Climate Change in California: Health, Economic and Equity Impacts • 37
Figure 2.12: Possible effects of climate change on vector-borne diseases. (Modified from WHO, 1990) The ecology and transmission dynamics of vector-borne diseases are complex, and the factors that influence survival and transmission are unique to each disease. For this reason, it is not possible to generalize about the effects of climate on vector-borne disease as a single category (Reiter, 1996; Reiter, 2000). Several researchers and panel groups have used current information and modeling techniques to predict the effects of climate change on the distribution of specific vector-borne diseases. Here again, the lack of sufficient data about the life cycles of the diseases and the uncertainties surrounding the specific occurrence of climatic effects make it difficult to draw firm conclusions. In most cases, the studies suggest general shifts in the distribution of the diseases rather than specific changes for any particular location. However, most vector-borne diseases exhibit a distinct seasonal pattern, indicating that they are indeed weather-sensitive. Temperature, rainfall, and other weather variables affect both the vectors and the pathogens they transmit. Rainfall may increase the abundance of some mosquitoes by increasing the number of breeding sites (Reisen et al., 1995). Excessive rainfall can destroy the mosquito habitat as well, terminating the mosquitoes in their aquatic larval stages. Higher levels of humidity can extend vector survival times (Reisen et al., 1995). Dry conditions may reduce breeding sites like ponds and puddles but create productive newer habitats as river flow is diminished. The key factor in transmission is the survival rate of the vector (Gilles, 1993). Climate change may increase or decrease survival rate, contingent on the vector, its behavior, and ecology (Patz et al., 2000). Vector-borne disease is always a topic of concern with the general public. Fortunately, to date, California has had a low incidence of the specific diseases that are prominent in public discourse, such as West Nile virus. The low occurrence is due in part to eradication programs and public awareness. However, climate change could alter the incidence and spread of these diseases. Low-income communities and people of color would presumably be at greater risk in this case, due to limited resources, lack of health insurance, and inferior access to health care.
Climate Change Impact on Vectors/Intermediate Hosts
Temperature • Changes in distribution boundaries (shifts to higher latitudes, expansion to higher altitudes)
• Effects on biology and physiology • Changes in parasite stages of the vector: acceleration of
development; completion of cycle at higher latitudes/altitudes
Drought and Desertification
• Reduction in density of water-related vectors • Changes in distribution of rodents
Coastal Flooding • Formation of more brackish-water habitats, extending the breeding of brackish-water species
• Effects on mosquito-borne diseases

Redefining Progress • Climate Change in California: Health, Economic and Equity Impacts • 38
Hantavirus pulmonary syndrome: The pulmonary Hantavirus epidemic in the southwestern United States is believed to have been caused by an upsurge of rodent populations related to climate and ecological conditions (Wenzel, 1994; Engelthaler et al., 1999). Six years of drought followed by very heavy rains in 1993 resulted in a tenfold increase in the population of deer mice, which can carry Hantavirus. Clusters of the disease have been spatially linked to areas with higher rainfall and increased vegetation following El Niño events (Glass et al., 2000). Drought may also lead to changes in the populations of rodents that are vectors for diseases such as Hantavirus. Many Hantavirus infections occur in persons of lower socioeconomic status, where poor housing and agricultural activities favor closer contact between humans and rodents (Schmaljohn and Hjelle, 1997). California has had the third-highest number of human cases in the U.S. (18 cases, 8 deaths), after New Mexico (29 cases) and Arizona (22 cases). Encephalitis: Encephalitis is an acute infection and inflammation of the brain, typically caused by viral infection. Arboviruses, which are spread by blood-sucking insects such as mosquitoes and ticks, are responsible for West Nile, Japanese, La Crosse, St. Louis, and equine encephalitis. Age, season, geographic location, regional climate conditions, and strength of the immune system play a role in development and severity of the illness. Most encephalitis cases reported in the U.S are mosquito-borne. St. Louis encephalitis (SLE) is the most prevalent (Shope, 1980). La Crosse encephalitis and western, eastern, and Venezuelan equine encephalitis also occur. Although mosquito longevity diminishes as temperatures rise, viral transmission rates rise sharply at higher temperatures, as with dengue fever (Hardy, 1988; Reisen et al., 1995; Reeves et al., 1994). In field studies of California, researchers have predicted that a temperature increase of 5°–9° F, as is expected to occur throughout the state by mid-century under both emissions scenarios, will cause a northern shift in the distribution of both western equine encephalitis (WEE) and SLE outbreaks, with disappearance of WEE in southern endemic regions (Reeves et al., 1994). Human outbreaks of SLE are correlated with periods of several days when temperatures exceed 86° F (Monath and Tsai, 1987), as was the case in the 1984 epidemic. Analysis of the historical monthly climate data has shown that outbreaks are often preceded by higher-than-usual rainfall in January and February, in combination with droughts in July (Bowen and Francy, 1980). Such patterns of warm, wet winters followed by hot, dry summers resemble some of the predictions for climate change over much of the U.S. (Schneider, 1990; IPCC, 1996), and for California in particular. California is the second-most heavily affected state by West Nile virus in the U.S., and the incidence of the disease is on the rise. Most cases of West Nile occur during the warm-weather months, but the mild climate in southern regions is expected to sustain the mosquitoes beyond those months. The top three counties in California for number of West Nile cases reported to date (as of 2004) were Los Angeles (134 cases), Riverside (64 cases), and San Bernardino (134 cases).
Public Health Intervention and the Spread of Infectious Diseases The role of public health infrastructure is important and affects how well the spread of a disease may be controlled by involved authorities. In the United States, improved
Redefining Progress • Climate Change in California: Health, Economic and Equity Impacts • 39
housing, sanitation, and public health interventions have controlled many infectious diseases that are felt to be climate-sensitive (e.g., dengue, malaria, cholera). Of greatest concern are insect-borne diseases that may increase as the result of changing climate. In addition to climate, the risk of many vector-borne diseases is linked to lifestyle, hygiene, housing construction, trash removal, and a host of other socioeconomic factors. Thus, infectious disease risk may increase or decrease with climate change, depending upon the interplay of the above factors within a specific region. For the United States, the success of public health interventions in eradicating malaria and other vector-borne diseases early in the twentieth century underscores the importance of continued public health surveillance and prevention in protecting the U.S. population from any climate-induced enhancement in vector-borne disease transmission. Maintenance and strengthening of public health infrastructure, especially surveillance and vector control, will be critical to preventing significant outbreaks in the future. Inclusion of public health and climate change experts in planning regarding land-use and utility infrastructure will also help assure maximal protection of public health during this upcoming period of climate change.
Future of Climate Change and Health Impacts Much research remains to be done to better understand how climate change will affect human health in California. Table 2.5 lists some of the most important areas for further study. The research community is currently addressing some of the issues listed here, and significant headway has been made is some areas.
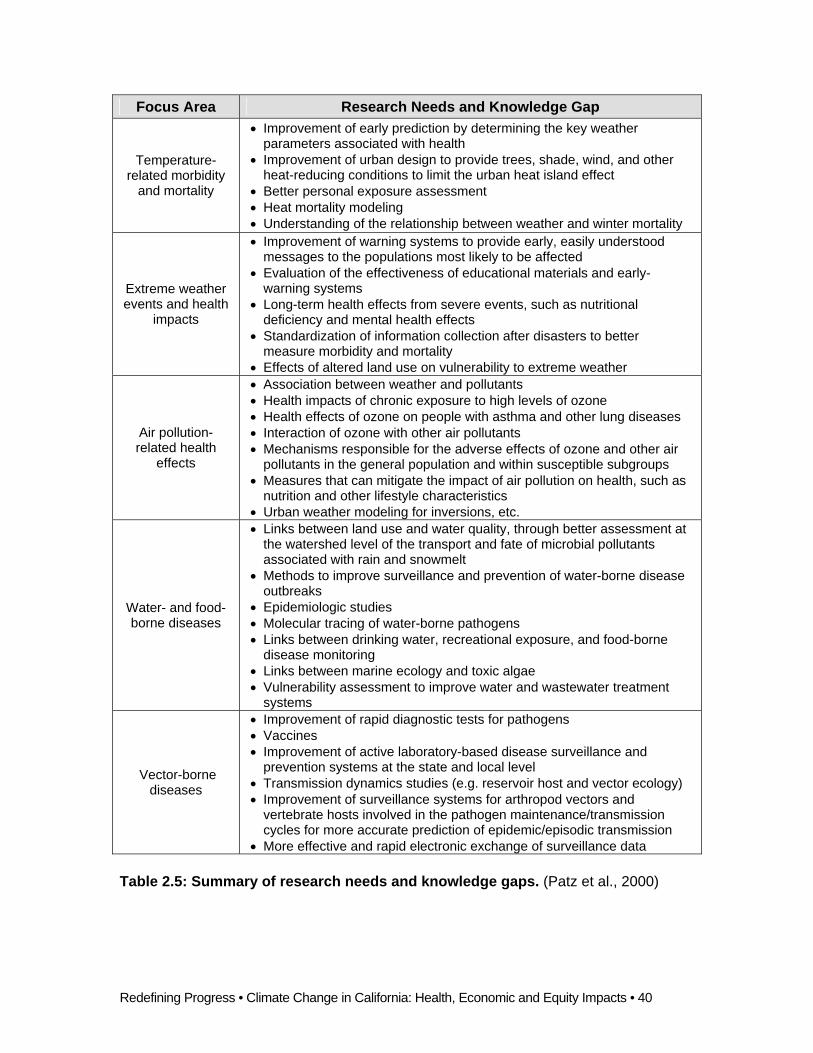
Redefining Progress • Climate Change in California: Health, Economic and Equity Impacts • 40
Table 2.5: Summary of research needs and knowledge gaps. (Patz et al., 2000)
Focus Area Research Needs and Knowledge Gap
Temperature-related morbidity
and mortality
• Improvement of early prediction by determining the key weather parameters associated with health
• Improvement of urban design to provide trees, shade, wind, and other heat-reducing conditions to limit the urban heat island effect
• Better personal exposure assessment • Heat mortality modeling • Understanding of the relationship between weather and winter mortality
Extreme weather events and health
impacts
• Improvement of warning systems to provide early, easily understood messages to the populations most likely to be affected
• Evaluation of the effectiveness of educational materials and early-warning systems
• Long-term health effects from severe events, such as nutritional deficiency and mental health effects
• Standardization of information collection after disasters to better measure morbidity and mortality
• Effects of altered land use on vulnerability to extreme weather
Air pollution-related health
effects
• Association between weather and pollutants • Health impacts of chronic exposure to high levels of ozone • Health effects of ozone on people with asthma and other lung diseases • Interaction of ozone with other air pollutants • Mechanisms responsible for the adverse effects of ozone and other air
pollutants in the general population and within susceptible subgroups • Measures that can mitigate the impact of air pollution on health, such as
nutrition and other lifestyle characteristics • Urban weather modeling for inversions, etc.
Water- and food-borne diseases
• Links between land use and water quality, through better assessment at the watershed level of the transport and fate of microbial pollutants associated with rain and snowmelt
• Methods to improve surveillance and prevention of water-borne disease outbreaks
• Epidemiologic studies • Molecular tracing of water-borne pathogens • Links between drinking water, recreational exposure, and food-borne
disease monitoring • Links between marine ecology and toxic algae • Vulnerability assessment to improve water and wastewater treatment
systems
Vector-borne diseases
• Improvement of rapid diagnostic tests for pathogens • Vaccines • Improvement of active laboratory-based disease surveillance and
prevention systems at the state and local level • Transmission dynamics studies (e.g. reservoir host and vector ecology) • Improvement of surveillance systems for arthropod vectors and
vertebrate hosts involved in the pathogen maintenance/transmission cycles for more accurate prediction of epidemic/episodic transmission
• More effective and rapid electronic exchange of surveillance data
Redefining Progress • Climate Change in California: Health, Economic and Equity Impacts • 41
CHAPTER 3: ECONOMIC IMPACTS OF CLIMATE CHANGE
California is the most populous state in the nation and the fifth-largest economy in the world (CDF, 2002). Its economic strength derives in part from the diversity of its population and geography. California hosts the nation’s largest agricultural industry, concentrated in the Central Valley, the core of the high-tech industry in Silicon Valley, and the entertainment industry in Los Angeles. A variety of activities and landscapes attract visitors from around the globe, making tourism one of California’s top industries. Abundant access to natural resources and a unique climate allow the Californian economy to flourish. However, its natural environment also represents a source of economic vulnerability. Climate change threatens to reduce already scarce water supplies and alter vegetation patterns—posing significant problems for the state’s crucial agriculture and tourism industries and, thus, the state’s economy. An increased incidence of extreme weather events could also generate economic instability and threaten property and infrastructure. This chapter uses the climate change projections outlined in chapter 1 to evaluate the potential economic effects, focusing on sectors of California’s economy that face the most severe potential impacts from climate change. Particular attention is paid to the consequences for low-income groups and people of color. Drawing on historical examples and future projections, the chapter begins with an in-depth analysis of agriculture and tourism—both very climate-sensitive industries. The following section discusses impacts on California’s infrastructure. Finally, the chapter addresses the effects on the prices of basic necessities and employment in climate-sensitive industries.
Agriculture California leads the nation in agricultural production, growing more than half of the country’s fruit, nuts, and vegetables. Roughly 350 different crops are grown in the state, 13 of which are grown in California exclusively. In 2002, the state’s agricultural sector generated over $27.5 billion in revenues (CDF, 2002). Historically, the success of agriculture in California has been due in part to relatively stable weather conditions. During this century, however, the agricultural sector is likely to face higher risks posed by weather variability and extreme weather events. Table 3.1 outlines some specific impacts. Not only is agriculture a major contributor to the state’s economy, it is a significant source of employment for low-income groups and people of color. Shocks experienced by the industry could disproportionately affect these communities.
Rising Temperatures and Agriculture Livestock: Dairy production is California’s top agricultural sector, producing one-fifth of the nation’s milk supply. In 2001, milk and cream accounted for over $4.6 billion in revenues and provided over 120,000 jobs in production and industry-related businesses in the state (CDFA, 2002a). Higher temperatures are known to lower milk productivity and, thus, threaten to reduce the size of the state’s dairy sector.
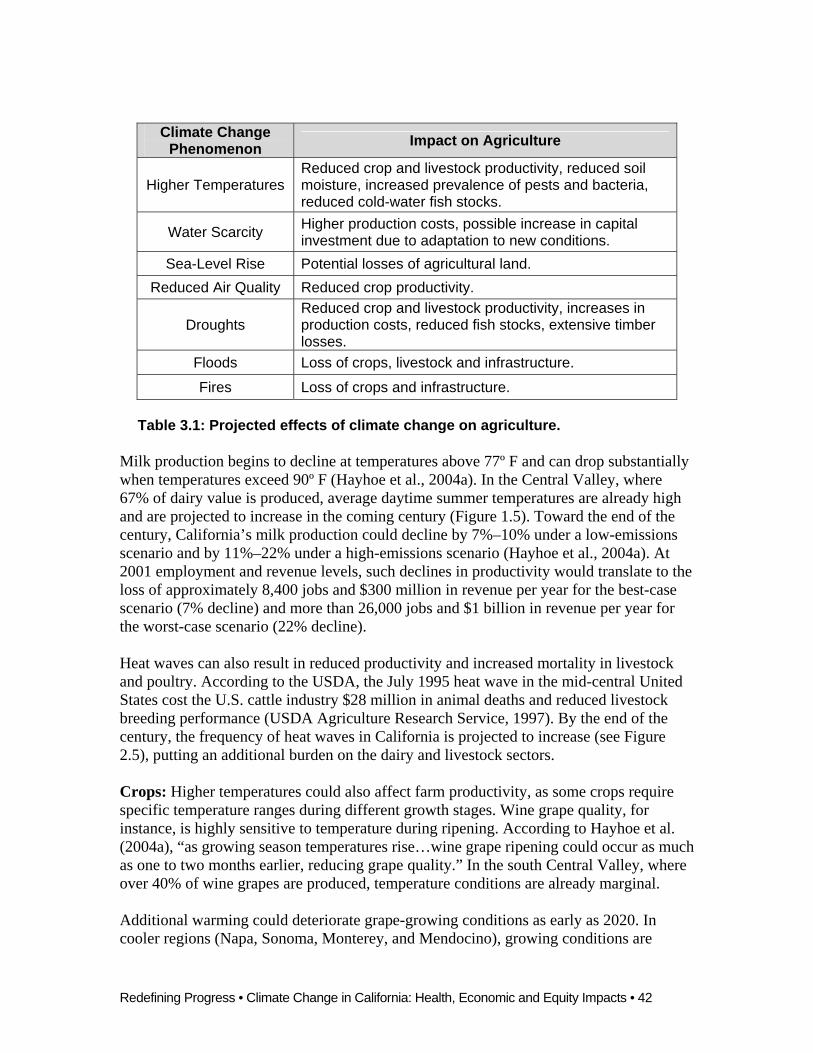
Redefining Progress • Climate Change in California: Health, Economic and Equity Impacts • 42
Table 3.1: Projected effects of climate change on agriculture.
Milk production begins to decline at temperatures above 77º F and can drop substantially when temperatures exceed 90º F (Hayhoe et al., 2004a). In the Central Valley, where 67% of dairy value is produced, average daytime summer temperatures are already high and are projected to increase in the coming century (Figure 1.5). Toward the end of the century, California’s milk production could decline by 7%–10% under a low-emissions scenario and by 11%–22% under a high-emissions scenario (Hayhoe et al., 2004a). At 2001 employment and revenue levels, such declines in productivity would translate to the loss of approximately 8,400 jobs and $300 million in revenue per year for the best-case scenario (7% decline) and more than 26,000 jobs and $1 billion in revenue per year for the worst-case scenario (22% decline). Heat waves can also result in reduced productivity and increased mortality in livestock and poultry. According to the USDA, the July 1995 heat wave in the mid-central United States cost the U.S. cattle industry $28 million in animal deaths and reduced livestock breeding performance (USDA Agriculture Research Service, 1997). By the end of the century, the frequency of heat waves in California is projected to increase (see Figure 2.5), putting an additional burden on the dairy and livestock sectors. Crops: Higher temperatures could also affect farm productivity, as some crops require specific temperature ranges during different growth stages. Wine grape quality, for instance, is highly sensitive to temperature during ripening. According to Hayhoe et al. (2004a), “as growing season temperatures rise…wine grape ripening could occur as much as one to two months earlier, reducing grape quality.” In the south Central Valley, where over 40% of wine grapes are produced, temperature conditions are already marginal. Additional warming could deteriorate grape-growing conditions as early as 2020. In cooler regions (Napa, Sonoma, Monterey, and Mendocino), growing conditions are
Climate Change Phenomenon Impact on Agriculture
Higher Temperatures Reduced crop and livestock productivity, reduced soil moisture, increased prevalence of pests and bacteria, reduced cold-water fish stocks.
Water Scarcity Higher production costs, possible increase in capital investment due to adaptation to new conditions.
Sea-Level Rise Potential losses of agricultural land. Reduced Air Quality Reduced crop productivity.
Droughts Reduced crop and livestock productivity, increases in production costs, reduced fish stocks, extensive timber losses.
Floods Loss of crops, livestock and infrastructure.
Fires Loss of crops and infrastructure.

Redefining Progress • Climate Change in California: Health, Economic and Equity Impacts • 43
projected to improve initially but then deteriorate toward the end of the century, especially in Sonoma and Napa counties, where California’s top-quality wines are currently produced. The wine grape industry is currently estimated to produce $3.2 billion in annual revenue and employ over 200,000 people directly and in affiliated businesses in California (Wine Institute, 2004). The overall impact of rising temperatures is likely to lower revenues and possibly hurt employment in the wine grape industry. Higher nighttime temperatures may also reduce productivity of deciduous fruits and nuts that require cooler temperatures at night to develop successfully. In this group, almonds, walnuts, and peaches are among California’s top twenty commodities and together produced over $1.3 billion in revenues in 2001 (CDFA, 2002b). A heat wave in April 2003 hurt a number of crops. The 2003–2004 California lemon forecast was down 25% from the previous year. Olive productivity and apple quality for the 2003–2004 growing season were also reduced (CDFA, 2004a, b). In the Central Valley, where most of these crops are grown, the projected temperature increases (Figure 1.5) could result in significant productivity losses. Pest populations: Higher temperatures may create environments more suitable for some pests, although pests preferring cooler temperatures may be reduced. Increased pest populations can affect both crops and livestock, increasing the need for certain pesticides. As a result, farm production costs could rise by millions of dollars per year. At the same time, externalities associated with pesticide use, such as groundwater contamination and crop workers’ health, would deteriorate. The pink bollworm, which has infested Imperial Valley cotton, is currently unable to develop in the San Joaquin Valley, partly because of lower average temperatures (Knox and Foley-Scheuring, 1991). As temperature increases, the pink bollworm range could extend into the San Joaquin Valley, threatening the nearly 700,000 acres of cotton grown there, valued at nearly $1 billion annually. According to the Cooperative Pink Bollworm Program, a management program of the California Department of Food and Agriculture (CDFA), an estimated additional seven pounds per acre of pesticides would have to be used every year to control pink bollworm if it becomes established in the San Joaquin Valley. This could increase cotton growers' production costs by $90–$100 per acre, reaching a total cost of $63 million to $70 million annually (CDFA, 2004c). The Mexican fruit fly is a pest that has threatened southern California’s fruit crop, and it may pose a risk to northern fruit crops as temperatures become more suitable for the fly’s growth cycle, a likely outcome of climate change. Current regulations and inspection have managed to prevent a lasting infestation in southern California, but in November 2002, San Diego farmers lost $12 million worth of crops due to a Mexican fruit fly infestation that high temperatures exacerbated. Eradication costs added $15 million to the economic impact of that event. The CDFA estimates the potential damages of a widespread infestation at $1.9 billion (CDFA, 2004d). Fisheries: Higher temperatures will affect the composition of oceanic ecosystems and will specifically hurt cold-water fish. Anadromous fish such as salmon and steelhead

Redefining Progress • Climate Change in California: Health, Economic and Equity Impacts • 44
trout, which migrate from saltwater to spawn in freshwater streams, will be highly affected by higher water temperatures and lower summer and fall river runoff, as their spawning requires specific water temperatures. Moreover, California currently supports several endangered and threatened salmonid species, including the Sacramento River winter-run Chinook salmon and the California coastal Coho salmon. Changes in seasonal stream flow and temperature may have detrimental effects on these stocks, while resulting protection measures, such as increased water diversion, are likely to be considerable. Changes in temperature and water flows are likely to reduce commercial fishing revenues. Ocean harvests of Chinook salmon (primarily the Sacramento River fall run) are the fourth-largest source of income in California’s fishing industry, with revenues of $7.6 million in 2002 (CDF, 2002). The September 2002 Klamath River fish kill provides a grim example of how changing environmental conditions could have disastrous impacts. In September 2002, roughly 34,000 adult Chinook salmon died in the Klamath River, one of California’s largest Chinook runs. Warm water temperatures along with low water flows and an above-average run of salmon, created an environment ideally suited to the rapid spread of pathogens, resulting in the extensive kill (CDFG, 2004). This episode illustrates how a combination of changing conditions, all projected to become common with climate change, could have a direct and severe impact on vulnerable species with additional economic and cultural effects that far exceed the estimates of impacts based on revenue losses.
Water Scarcity and Agriculture The agricultural sector uses about 80% of California’s developed water supply, in large part because nearly 90% of the state’s agricultural land is irrigated (UCS, 1999). Climate change threatens to reduce California’s water resources (as discussed in chapter 1) and puts the productivity and stability of agriculture in the state at risk. Water scarcity would significantly impact the major agricultural areas of the state, the Sacramento and San Joaquin Valleys. According to projections presented in a California Energy Commission (CEC) report, by the end of the century, the Sacramento Valley could face 70%–80% reductions in water deliveries, contributing to a 60% reduction in agricultural land use and a 33%–50% reduction in agricultural income in the area (CEC, 2003a). As water becomes scarcer, water prices are likely to increase, raising farmers’ production costs, shifting cultivation patterns, and increasing prices of fresh produce to consumers. The CEC study estimated that throughout California, water scarcity could result in an annual reduction of $1 billion to $1.5 billion in the gross value of farm production, assuming acreage reductions are concentrated in the lower value, water-inefficient crops. Farmers will presumably adapt by shifting to more water-efficient crops and by using more efficient irrigation technologies. However, this assumption regarding adaptation via crop shifts neglects the fact that the two most heavily irrigated crops, alfalfa and grazing land, are significant contributors to the state’s top agricultural sector, dairy production (CRAG, 2002). As a result, adaptation

Redefining Progress • Climate Change in California: Health, Economic and Equity Impacts • 45
to water scarcity may be limited by the dependence of the dairy sector on water-inefficient crops, leading to higher income losses in agriculture than predicted. In any case, adaptation would require significant capital investment, possibly affecting decisions on other inputs, notably labor.
Sea-Level Rise and Agriculture Increased sea level threatens to submerge agricultural land in the San Joaquin/Sacramento delta that is already 10–25 feet below sea level (CRAG, 2002). This land is protected with levees that need to be constantly maintained. Currently 520,000 acres are cultivated in the delta, producing gross annual sales of over $500 million (Association of Bay Area Governments, 2003). The recent Jones Tract levee failure in the delta inundated over 12,000 acres of agricultural land, causing more than $30 million in damage to agriculture alone (COES, 2004). An increase in sea level would necessitate additional levee protection investments. Some areas may not be protected, due to physical limitations or high investment costs, resulting in a loss of productive agricultural land.
Air Quality and Agriculture Carbon dioxide: Carbon dioxide (CO2), the primary greenhouse gas, is also a necessary component of plant growth and survival. Clusters of vegetation, particularly forests, are often an important sink for CO2. In lab conditions, increased CO2 concentrations have been found to have a positive effect on plant growth for some varieties. However, CO2 fertilization is predicated on access to an adequate supply of water and nutrients, conditions that will likely change under different climate scenarios, especially for non-irrigated products such as timber (Hall and Howarth, 2001). In addition, another effect of higher CO2 concentrations is a reduction in the protein content of some crops, mainly grains (IPCC, 2001). Furthermore, new research has shown that higher CO2 concentrations also contribute to increased weed growth, which can reduce crop productivity and trigger increased herbicide use (USCCSP, 2004). The IPCC concludes that it is difficult to determine the combined effect of increased CO2 concentrations along with other climate changes on overall plant growth. Ozone: In addition to its public health consequences, ozone pollution has adverse effects on plant health, significantly lowering crop productivity. Ozone-related yield losses estimated at 12%–31% have been observed in cantaloupes, grapes, cotton, oranges, onions, and beans, among other crops (Mutters and Soret, 1998). San Joaquin Valley is home both to these products and to some of the worst ozone pollution in the state. Currently, the valley experiences nearly 140 days of ozone pollution violations in the period between May and September, the main growing season for these crops (Figure 2.8). Without stringent controls, ozone in the San Joaquin Valley is projected to increase over the next century, potentially reducing crop productivity and incomes in the region.
Extreme Weather Events and Agriculture Droughts: Unlike other extreme weather events, which are generally abrupt in character, droughts are multi-year phenomena that have gradual effects on all agricultural sectors as

Redefining Progress • Climate Change in California: Health, Economic and Equity Impacts • 46
Bark beetle damage (brown trees) at Lake Arrowhead in San Bernardino County. (CDFF, 2004a)
stream flows decline and water storage is depleted. Farm productivity is severely affected by droughts, primarily due to decreased soil moisture that reduces crop resilience. In 1992, the last year of a six-year drought, the Sacramento and San Joaquin Valleys suffered from a 465,000-acre-foot water shortage. Estimated losses to farmers and related industries, such as food processing, machinery and equipment supplies, and banking, reached nearly a quarter of a billion dollars (CFWC, 1995). The drought hurt a variety of other sectors, too. For example, low water flows affected water quality and fisheries. In 1991, the Coho and Chinook salmon catch off the coast of California was reduced to 16% of the 1988 harvest. Similarly, low freshwater inflows to the ocean dramatically reduced populations of striped bass and herring, as coastal water salinity increased above normal levels (Gleick and Nash, 1991). Drought conditions also increase tree mortality. In some Sierra Nevada forests, 30%–80% of the trees died during the drought of 1987–1992 (Gleick and Nash, 1991). Subsequent statewide timber losses were estimated at roughly 8 billion board-feet (CDWR, 2000). Dead trees leave forests exposed to higher fire risk. Stressed trees are also more vulnerable to insect infestations. In southern California, a four-year drought left forests vulnerable to a bark beetle infestation that killed millions of trees (photo to right), depressing timber production, wildlife populations, and recreation opportunities (CDFF, 2004a). The prevalence of bark beetles will likely increase with temperature; increasing droughts can weaken trees and provide easy targets for beetles (Logan and Powell, 2001). As discussed in chapter 1, California is expected to experience droughts more frequently. More dry years will likely result in higher water demand for irrigation, owing to higher rates of evaporation and reduced soil moisture. Figure 3.1 shows end-of-century projections for the number of dry years per decade under the high-emissions scenario. It also outlines the top ten agricultural counties, as measured by revenue. As shown, California’s top agricultural counties could experience a threefold increase in the number of dry years per decade. An increase in drought prevalence could result in high agricultural losses of crops, fishery, and timber, as illustrated by historical examples.

Redefining Progress • Climate Change in California: Health, Economic and Equity Impacts • 47
Figure 3.1: Future dry years per decade and top agriculture counties. (Technical Appendix A; CDFA, 2002) Percent change in the number of dry years per decade (from baseline 1960–1999 average) by the end of the century under high-emissions scenario. Also shown, ten highest agriculture-producing counties, as measured by revenue. Floods: Floods threaten to inundate crops and damage infrastructure, causing millions of dollars in losses. In 1997, northern California experienced flooding caused by heavy rainfall and high mountain stream flow; nearly 300 square miles of agricultural land was flooded (photo below), causing economic damage valued at almost $300 million. Damage to infrastructure—irrigation systems, roads, buildings, fences, and workers’

Redefining Progress • Climate Change in California: Health, Economic and Equity Impacts • 48
Flooded agricultural land in Yuba County (CDWR, 1997)
housing—accounted for more than a third of the losses. The other two thirds consisted mainly of crop losses (CDWR, 1997). The 1998 El Niño-related floods and mudslides caused a $532 million loss to agriculture (FEMA, 1999).
High-Emissions Scenario Low-Emissions Scenario County 2010-
2039 2040-2069
2070-2099
2010-2039
2040-2069
2070-2099
1 Fresno 100% 35% 235% 15% 85% 115% 2 Tulare 85% 85% 235% 65% 100% 150% 3 Monterey 85% 85% 235% 65% 100% 150% 4 Kern 65% 135% 235% 115% 115% 185% 5 Merced 100% 35% 235% 15% 85% 115% 6 San Joaquin 100% 35% 235% 15% 85% 115% 7 Stanislaus 100% 35% 235% 15% 85% 115% 8 San Diego 85% 100% 235% 35% 35% 35% 9 Riverside 85% 115% 325% 35% 65% 40% 10 Ventura 65% 135% 235% 115% 115% 185%
Table 3.2: Future extreme precipitation events in top agricultural counties. (Technical Appendix A15; CDFA, 2002) Percent increase in seven-day extreme precipitation events (over baseline 1990–1999 average of two per decade). Projections are given under both high- and low-emissions scenarios for three time periods: near-term (2010–2039), mid-century (2040–2069), and end-of-century (2070–2099).
Climate projections strongly suggest that major flood damage in agricultural counties can be expected as soon as 2010.16 Flooded areas will potentially become breeding grounds for bacteria and mosquitoes, leading to increased disease among livestock, poultry, and humans. The number of extreme precipitation events that lead to floods will likely increase significantly throughout the century. Table 3.2 summarizes projections of extreme precipitation events (percent change from last century’s decadal average) for California’s ten most productive agricultural counties for near-term, mid-century, and end-of-century changes under both emissions scenarios. Figure 3.2 highlights the end-of-century projections for extreme precipitation events under the high-emissions scenario.
15 For more information refer, to “Technical Appendix A: Climate, El Nino, and Flooding in California,” available at: www.RedefiningProgress.org/CACJ/. 16 Ibid.

Redefining Progress • Climate Change in California: Health, Economic and Equity Impacts • 49
Figure 3.2: Future extreme precipitation events and top agriculture counties. (Technical Appendix A17; CDFA, 2002) Percent increase in seven-day extreme precipitation events (over baseline 1990–1999 average of two per decade) by the end of the century under high-emissions scenario. Also shown, ten highest agriculture-producing counties, as measured by revenue.
17 Ibid.

Redefining Progress • Climate Change in California: Health, Economic and Equity Impacts • 50
Avocado crops were heavily damaged in the 2003 southern California wildfires, causing $28 million in damages (CFBF, 2003).
As seen in Figure 3.2 and Table 3.2, by the end of the century, extreme precipitation events are expected to increase more than twofold from the historical average (two per decade) for nine of the ten leading agricultural counties and more than threefold for Riverside County. Under the low-emissions scenario, the increase is less severe by the end of the century, but still above historical baselines. In general, the low-emissions model predicts a gradual increase in extreme precipitation over the coming century. The high-emissions projections fluctuate, with near-term increases temporarily easing at mid-century for some counties, prior to the end-of-century increase. Importantly, extreme precipitation events could increase by more than 100% as early as 2010. Fires: Hotter and drier summers would create conditions for increased wildfires and pose a threat to timber forests and other cultivated areas. Statewide fire frequencies have increased by three to four times since the first half of the century. This pattern is likely to continue if climate change projections of increased temperature, decreased precipitation in some areas, and alteration of vegetation come to pass. Climate induced fire risks will be exacerbated by California’s projected population growth as more people push into wilderness and fire-prone areas.18 In the last 30 years, over 400,000 acres of timberland managed by the California Department of Fire and Forestry alone were lost in fires (CDFF, 2004b). In the recent southern California fires (November 2003), over 8,500 acres of cultivated land burned (photo at right), causing $28.4 million in agricultural damage (San Diego Union-Tribune, 2003). The combination of climate change impacts and population growth in California is likely to increase fire prevalence, leading to a rise in fire damage, including losses incurred by farmers.
Tourism California offers a multitude of attractions—winter sports, outdoor activities, amusement parks, world-renowned cities, more than 800 miles of diverse coastline, and unique national, state, and regional parks containing lakes, rivers, forests, and wetlands. This natural and cultural richness makes California one of the top tourist destinations in the nation. According to the California Division of Tourism (CDT, 2003), “California annually generates more than $75 billion in direct travel spending into the economy,
18 For more information, refer to “Technical Appendix B: Wildfire Risk in California,” available at www.RedefiningProgress.org/CACJ/.

Redefining Progress • Climate Change in California: Health, Economic and Equity Impacts • 51
directly supports jobs for more than one million Californians and generates $5 billion in direct state and local tax revenue. Tourism is California's third-largest employer and fifth-largest contributor to the gross state product.” In 2002, over 85 million people visited California’s 280 state parks, and 34 million people visited 23 national parks located in California (CDT, 2003). Tourism-generated revenues and employment are dispersed among several economic sub sectors, including entertainment, dining, lodging, transportation, and retail. As with agriculture, tourism is a significant source of employment for low-income people and people of color. California’s diverse recreational opportunities depend to varying degrees on climate patterns and the availability of natural resources. Therefore, climate change in the state could significantly impact the tourism industry. However, variations in visitor spending reflect a multitude of other factors such as changes in personal income and international exchange rates. Also, many sectors within the tourist industry, such as dining and transportation, are affected by local economic trends as well. Hence, it is sometimes difficult to separate out the effects of changing weather patterns. However, it is clear that some of the projected effects of climate change will directly impact recreational activities such as skiing and fishing. Table 3.3 outlines some of the possible consequences of specific climate change phenomena on California’s tourism industry and the regions in California where these impacts are likely to occur. The topics presented in Table 3.3 will be discussed in depth in the coming pages.
Climate Change Phenomenon Impact on Tourism Affected Region
Snowpack loss and less snowfall
Shortened ski season; possible need to relocate or rely
on artificial snow Sierra Nevada
Sea-level rise Loss of coastline and recreational infrastructure Coastal counties
Depleted water resources
Adverse impact on rafting, boating, and fishing as river flows
and lake levels decline
Sierra Nevada and San Joaquin/Sacramento Delta
Fires Increased park closures; destruction of recreational forests
Sierra Nevada, Cascade Ranges, northwestern and
central coast
Air quality Reduced visibility in California’s
most popular national parks; damage to natural vegetation
Sierra Nevada, in particular Yosemite and Sequoia
National Parks Table 3.3: Projected climate change impacts on tourism.
Ski Industry and Snowfall Reductions Snowfall reduction coupled with earlier snowmelt caused by higher temperatures could have devastating effects on winter recreation in California. For example, during the winter of 1990–1991, poor snow conditions led to a loss of $85 million for the ski industry (Gleick and Nash, 1991). Figure 3.3 shows the tourism-generated revenues for

Redefining Progress • Climate Change in California: Health, Economic and Equity Impacts • 52
0
10
20
30
40
50
60
Alpine
Calave
ras
El Dorado
Mariposa
Mon
o
Sierra
Tuolum
ne
Tour
ism
Em
ploy
men
t (%
of t
otal
)
Figure 3.4: Tourism-generated employment (as percentage of total employment) in popular winter destination counties. (Runyan, 2004)
0
100
200
300
400
500
600
Alpine
Calave
ras
El Dorado
Mariposa
Mono
Sierra
Tuolumne
Tour
ism
Rev
enue
(mill
ions
$)
Figure 3.3: Tourism-generated revenues from popular winter destination counties. (Runyan, 2004)
California’s most popular winter destination counties.19 Together, these seven counties generate nearly $1.5 billion a year in revenues from tourism (Runyan, 2004). Aside from providing local communities a considerable source of income and tax revenue, winter tourism in these counties is a significant source of employment (Figure 3.4). In Mariposa County, 47% of the labor force works in the tourism sector; in Mono County, where five of the nine biggest employers are tourist-related businesses, the share is 53% (Runyan, 2004).
Most of California’s 34 ski resorts are based at altitudes between 2,000 and 2,500 meters, elevations that are projected to have 75%–93% reductions in snowpack by the end of the century (Figure 1.6). Hayhoe et al. (2004a) project that under both emission scenarios, California’s ski season will shorten as a result of reduced snowfall and early snowmelt. Should ski conditions be marginal during the holiday season, mid-December to mid-January, delays could result in significant losses to the industry. By the end of the century, a delay of 36 days in the start of the ski season is projected under the low-emissions scenario, leading to significant revenue loss, as the season would start in late December. More strikingly, under the high-emissions scenario, by the end of the century, the two inches of snowfall that marks the beginning of the ski season may never occur. Additionally, by the end of the century, the ski season could be shortened by 49 days under the low-emissions scenario and by 103 days under the high-emissions scenario (Hayhoe et al., 2004a). Based on revenues in 2001, these lost days would mean annual
19 California’s top winter destination counties are Alpine, Calaveras, El Dorado, Mariposa, Mono, Sierra, and Tuolumne.
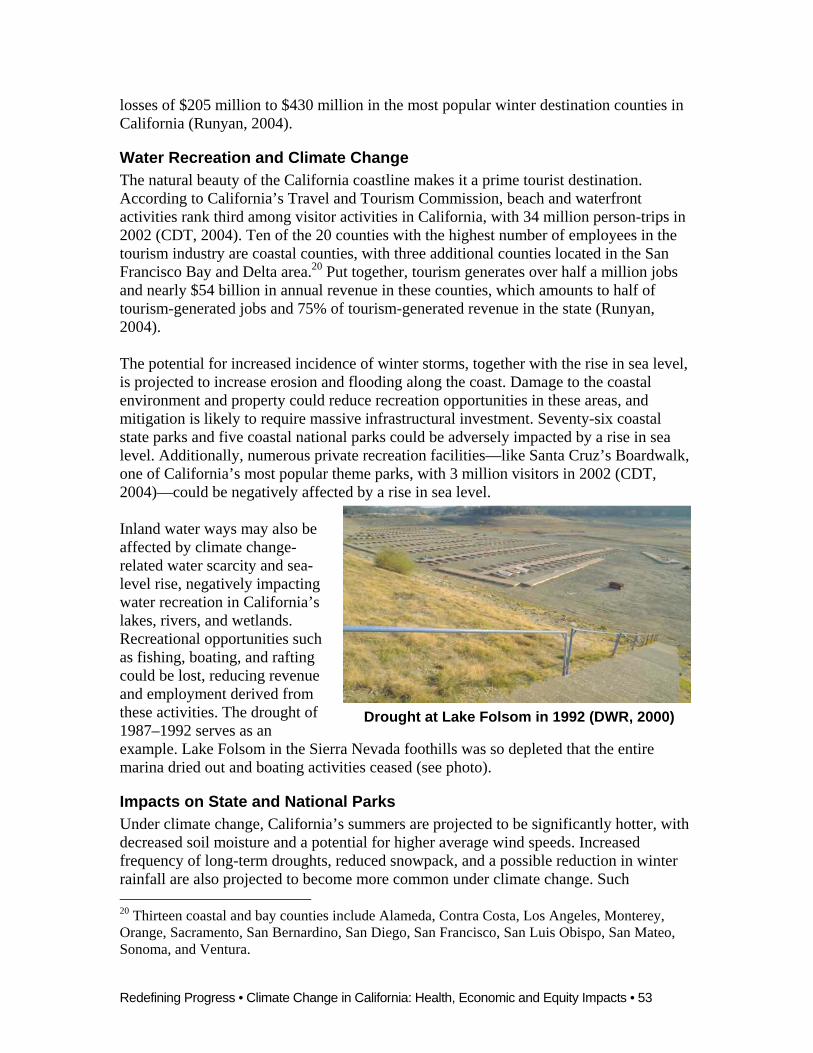
Redefining Progress • Climate Change in California: Health, Economic and Equity Impacts • 53
Drought at Lake Folsom in 1992 (DWR, 2000)
losses of $205 million to $430 million in the most popular winter destination counties in California (Runyan, 2004).
Water Recreation and Climate Change The natural beauty of the California coastline makes it a prime tourist destination. According to California’s Travel and Tourism Commission, beach and waterfront activities rank third among visitor activities in California, with 34 million person-trips in 2002 (CDT, 2004). Ten of the 20 counties with the highest number of employees in the tourism industry are coastal counties, with three additional counties located in the San Francisco Bay and Delta area.20 Put together, tourism generates over half a million jobs and nearly $54 billion in annual revenue in these counties, which amounts to half of tourism-generated jobs and 75% of tourism-generated revenue in the state (Runyan, 2004). The potential for increased incidence of winter storms, together with the rise in sea level, is projected to increase erosion and flooding along the coast. Damage to the coastal environment and property could reduce recreation opportunities in these areas, and mitigation is likely to require massive infrastructural investment. Seventy-six coastal state parks and five coastal national parks could be adversely impacted by a rise in sea level. Additionally, numerous private recreation facilities—like Santa Cruz’s Boardwalk, one of California’s most popular theme parks, with 3 million visitors in 2002 (CDT, 2004)—could be negatively affected by a rise in sea level. Inland water ways may also be affected by climate change-related water scarcity and sea-level rise, negatively impacting water recreation in California’s lakes, rivers, and wetlands. Recreational opportunities such as fishing, boating, and rafting could be lost, reducing revenue and employment derived from these activities. The drought of 1987–1992 serves as an example. Lake Folsom in the Sierra Nevada foothills was so depleted that the entire marina dried out and boating activities ceased (see photo).
Impacts on State and National Parks Under climate change, California’s summers are projected to be significantly hotter, with decreased soil moisture and a potential for higher average wind speeds. Increased frequency of long-term droughts, reduced snowpack, and a possible reduction in winter rainfall are also projected to become more common under climate change. Such 20 Thirteen coastal and bay counties include Alameda, Contra Costa, Los Angeles, Monterey, Orange, Sacramento, San Bernardino, San Diego, San Francisco, San Luis Obispo, San Mateo, Sonoma, and Ventura.
Redefining Progress • Climate Change in California: Health, Economic and Equity Impacts • 54
conditions will increase the likelihood of fires throughout California’s forests, reducing public access to state and national parks. In summer 2004, Yosemite National Park, the third-most visited national park in the country (National Park Service, 2004), lost nearly 5,000 acres in a wildfire. During the fire, park accessibility was limited, and continued smoke conditions further reduced park attendance during the busy summer season. If more parks close because of increased fire threats, recreational opportunities and the revenues they generate will decline. Air quality is another growing concern for California’s parks. Yosemite and Sequoia National Parks are among the most polluted parks in the nation. According to the National Parks Conservation Association (NPCA, 2003a), Sequoia National Park has the worst smog of any park in the United States, with unhealthy ozone levels similar to those in Los Angeles. Sequoia also has limited visibility due to smog and is among the haziest parks in the country. Similarly, Yosemite ranked sixth in dangerous ozone levels and poor visibility. Air pollution prevents park visitors from enjoying scenic views and harms vegetation and forests (NPCA, 2003a). In the absence of stringent controls on transportation-related emissions, climate change in California is likely to worsen air quality, especially in the areas already polluted. Yosemite and Sequoia are not just natural wonders; they are a significant source of income and employment to neighboring communities. In 2001, these two parks alone generated nearly $420 million and supported over 11,000 jobs (NPCA, 2003b). In Inyo County, on the western border of Sequoia National Park, nearly 24% of employees work in tourism-related jobs (Runyan, 2004). If poor air quality decreases park attendance, due to dangerous pollution levels and poor visibility, the economic benefits to neighboring communities will decline as well.
Infrastructure and Extreme Weather Events California’s economic stability is supported by a strong infrastructure base. A complex network of highways and roads, large ports, numerous airports, water transfer canals, and utility provision infrastructure carries an enormous volume of commercial traffic. Extreme weather events such as floods, fires, and storms, as well as higher temperatures, all threaten to damage the infrastructure system and disrupt economic activity. Throughout the 1990s, weather-related events illustrated how vulnerable California’s infrastructure is to changing climate conditions. Airports became flooded, rail lines and highways were closed during storms, power lines and pipelines were damaged, and property was lost (CRAG, 2002). As the frequency of some extreme weather events is projected to increase throughout the century, damage to California’s infrastructure is likely to increase significantly. Massive amounts of infrastructure are managed and maintained by California’s government agencies. Understanding the possible impacts of climate change will help government realize the responsibilities it will face in safeguarding, maintaining, and repairing infrastructure. In addition, management of public expenditures on infrastructure could have a direct impact on low-income communities. Historically, governmental

Redefining Progress • Climate Change in California: Health, Economic and Equity Impacts • 55
assistance programs that support low-income communities have often experienced cutbacks when state resources are limited. If part of the state budget is diverted to cope with infrastructure damage caused by climate change, fewer resources would be available to support education, health, and public transportation programs, which would especially hurt low-income Californians.
Sea-Level Rise Rising sea levels threaten the integrity of California’s coastal infrastructure. Many roads, airports, and ports will face increased erosion and possible submersion. Major investment in levee construction will be needed to protect port facilities in Oakland and Los Angeles, as well as airports in San Francisco, Oakland, and Santa Barbara (CRAG, 2002). Higher sea level would also increase damage from winter storms along the coast by setting a higher baseline on top of which the damaging waves and storm surges occur. During the 1982–1983 El Niño, elevated sea levels from winter storms caused $100 million in damages to coastal property (CRAG, 2002). During the 1997 El Niño event, tides were two feet higher than usual, increasing the severity of damage from the storm (USGS, 2000). In addition, increased coastal erosion that results from sea-level rise and storm activity can generate mudslides and jeopardize property located on coastal cliffs. Given the high monetary value of California’s coastal property, public and private investment in mitigation and adaptation is likely to be high.
Floods Heavy precipitation and increased runoff during winter months are likely to increase the incidence of floods. As a result, damage to roads, sewage and utility infrastructure, and private property is likely to increase. In 1989, El Niño-related floods and extreme precipitation caused an estimated $1 billion in damage to utility (electric and gas) infrastructure alone (CRAG, 2002). The 1998 El Niño caused $200 million in damage to roads and highways and overall damages of nearly $1 billion (FEMA, 1999). The most destructive El Niño-related floods occurred in January 1997 in northern California; 300 square miles of land were flooded, damaging or destroying 30,000 residential and 2,000 business properties. Losses were estimated at nearly $2 billion, with damage to public infrastructure estimated to exceed $1 billion. That event resulted in the largest sheltering operation in California’s history, as more than 120,000 people were forced from their homes (CDWR, 1997). The costs associated with flood damage are likely to rise in California, as the frequency of floods is projected to increase throughout the century.
Fires Historically, wildfires have often caused massive property damage in California. The value of losses caused by fires fluctuates from year to year, as the annual incidence and severity of fires is highly variable. However, as illustrated in Figure 3.5, there is a clear trend over the last 50 years of increasing losses in monetary terms. Since 1970, 12 catastrophic fires in California have caused over $5 billion in damages (III, 2004). California’s 20 largest documented fires were responsible for the cumulative loss of nearly 14,000 structures and more than a million acres of burned land (CDFF, 2002).

Redefining Progress • Climate Change in California: Health, Economic and Equity Impacts • 56
Figure 3.5: Historic monetary losses from fire damage (in millions of year-2000 dollars), 1943–2002. (CDFF, 2004c) The November 2003 fires in southern California destroyed 4,700 structures, burned 700,000 acres, and caused the loss of 20 lives. Overall costs for those fires were estimated at $2 billion (CFBF, 2003). The fires also caused significant damage to electric poles and roads; tens of thousands of residents and businesses lost electricity, adding to economic losses. The impact of fire extends to an increase in the likelihood of floods and mudslides, due to changes in soil structure and vegetation. The 2003 San Bernardino Christmas mudslides, which caused the death of 15 people (MSNBC, 2004), are an example of how fire dangers do not necessarily end when the fires are controlled. For northern California, Fried et al. (2004) predict the number of extreme fires that escape suppression. The type that causes the most damage could double, in part due to climate change-induced alterations in vegetation regimes. The effects of climate change, coupled with high population growth and increased population density, could lead to more frequent and more severe wildfires. As a result, fire damage is likely to take an escalating toll on California’s population and economy. Differences in projected climate change effects between the low- and high-emissions scenarios would translate into differences in infrastructure damage on the order of billions of dollars when all the various impacts, including damage from fire, flooding, and rising sea level are taken into account.
Increased Insurance Needs The increased frequency of extreme weather events threatens to put more property at risk. California’s property insurance premiums are likely to increase if the incidence of fires,
0
50
100
150
200
250
1943
1946
1949
1952
1955
1958
1961
1964
1967
1970
1973
1976
1979
1982
1985
1988
1991
1994
1997
2000
Mon
etar
y Fi
re D
amag
e (m
illio
ns $
)
Fitted exponential

Redefining Progress • Climate Change in California: Health, Economic and Equity Impacts • 57
floods, and other weather-related damage rise. The last catastrophic fire in southern California (October 2003) increased insurer instability21 and raised concern over increasing premiums. According to Robert Hartwig, chief economist at the Insurance Information Institute, “The general trend toward more frequent and more severe wildfire events in the West generally, and in California specifically, is a factor in higher homeowner insurance rates” (San Jose Mercury News, 2003). Crop insurance needs could also rise. Traditionally, crop insurance has been largely provided by public agencies. With greater adverse impacts on agriculture, an increase in public expenditures to compensate farmers for losses is likely. Flood insurance is of particular concern, as 75% of the counties in California have land susceptible to flooding (Knox and Foley-Scheuring, 1991). The Federal Emergency Management Agency (FEMA) is responsible for providing government flood insurance when coverage is not available privately. Although floods already pose a major risk to many Californians, flood insurance coverage remains minimal, and government agencies bear most of the financial burden when flooding occurs. During the 1997 floods, only 6% of residential property was insured, putting stress on the assistance resources of government and private agencies (CDWR, 1997). In 2003, only 250,000 flood insurance policies were in force in California (FEMA, 2003). With more floods, the state government will likely be forced to divert resources from existing programs. As the impacts of climate change mount in the course of this century, insurance needs will increase. At the same time, the elevated risk associated with extreme weather events will likely lead to higher insurance premiums for individuals and businesses, making insurance less affordable. The cost of living and the cost of doing business in California will rise, with negative consequences for economic activity in the state.
Impacts of Extreme Weather Events on Low-Income Communities During an extreme weather event, the highest monetary losses are typically concentrated among affluent communities, since their property is more valuable. However, low-income communities are more likely to suffer lasting damages and a longer recovery period. As noted in a recent study, “being poor or disadvantaged affects one’s experiences in a disaster, from risk perception, to the post-disaster reconstruction of lives and communities” (Fothergill and Peek, 2004). Low-income populations tend to live in older, poor-quality housing and are thus more vulnerable to extreme weather events, seismic activity, and fire. For example, the Loma Prieta earthquake displaced mostly elderly and low-income Hispanics in Santa Cruz County. Mobile homes are more exposed to floods and weather damage. Some research has shown that lower-income households experience a higher rate of injury in disasters, especially as a result of floods and earthquakes (Fothergill and Peek, 2004). Poor populations are less financially able to prepare for disaster, less likely to evacuate owing to lack of transportation, and less likely to relocate owing to lack of affordable housing 21 “Insurer instability” occurs when insurers must pay out on many policies at one time and go bankrupt as a result.

Redefining Progress • Climate Change in California: Health, Economic and Equity Impacts • 58
alternatives. Low mobility and literacy rates also put obstacles between low-income communities and relief assistance (Fothergill and Peek, 2004). In a disaster event such as a flood or fire, the greatest monetary burden is borne by the more affluent, as they typically have more valuable possessions. However, those who are insured can rebound, and eventually many go on with their lives much as before. In low-income communities, by contrast, the destruction caused by an extreme weather event can entail a lifelong struggle to recuperate. “Prosperity damage” is said to occur when a shock permanently damages a person’s economic prospects (Swiss Re, 1994). One disaster in the life of a low-income individual can impair lifetime prosperity. Aside from insurance coverage, other factors make recovery an inequitable process. Higher-income individuals are more likely to know what assistance they are eligible to receive and how to obtain it. Likewise, loans are mostly available to those with stable employment or above-average income. In addition, a disaster is likely to exacerbate shortages of low-income housing; such housing units are more likely to be damaged, and property owners have less incentive to invest in repairs and replacement. Following a disaster, replacement of low-income housing units can take three to eight years, while most single-family homes are rebuilt within one year of the disaster. Post-disaster loss of affordable housing aggravates homelessness and displacement among low-income and disadvantaged communities (Fothergill and Peek, 2004). The poorest counties in California are projected to experience an increase of 200%–300% in seven-day extreme precipitation events under the high-emissions scenario and 100%–200% under the low-emissions scenario.22 Figure 3.6 shows the distribution of low-income communities by extreme precipitation events under the high-emissions scenario. As climate change increases the frequency of extreme weather events, vulnerable communities that lack access to disaster-alleviating mechanisms such as savings and insurance will suffer disproportionately. Natural disasters are likely to destabilize employment in the areas affected and may lead to increased homelessness and shortages of affordable housing. Such events will also increase pressure on state finances, possibly limiting public assistance to vulnerable communities.
22 For more information, refer to “Technical Appendix A: Climate, El Nino, and Flooding in California,” available at www.RedefiningProgress.org/CACJ/.

Redefining Progress • Climate Change in California: Health, Economic and Equity Impacts • 59
Figure 3.6: Future extreme precipitation events and poverty rates. Percent increase in seven-day extreme precipitation events (over baseline 1990–1999 average of two per decade) by the end of the century under high-emissions scenario. Also shown, percentage of population currently living below the federal poverty level. (Technical Appendix A23; USCB, 2000)
23 For more information, refer to”Technical Appendix A: Climate, El Nino, and Flooding in California,” available at: www.RedefiningProgress.org/CACJ/.

Redefining Progress • Climate Change in California: Health, Economic and Equity Impacts • 60
Price of Necessities
Water Prices The combination of high population growth, a large agricultural industry, and a relatively dry central region makes water one of California’s most valuable and contested natural resources. Climate change is projected to have a potentially devastating impact on California’s water supply, impacting the state’s economy through higher water prices. Industries that are heavily dependent on water, such as agriculture and tourism, could be significantly affected under projected scarce-water conditions. Urban consumers—who already pay the highest water rates (CDWR, 1994)—are likely to face disproportionate burdens if water becomes more costly. The anticipated reduction of inflow to reservoirs in the Sacramento/San Joaquin River system, and the possible intrusion of saltwater into surface waters in the Sacramento/San Joaquin Delta and groundwater aquifers in the central coast region would seriously impact California’s supply of fresh water. A reduction in water supply could translate into higher prices for consumers. Contamination of freshwater sources by saltwater intrusion could also result in higher prices, as it would be necessary to treat the water or transport supplies from outside the region. The drought of 1987–1992 provides an example of circumstances where water scarcity has affected pricing. According to California’s Department of Water Resources, “During the 1987-92 drought, many water purveyors adopted higher rates to encourage water conservation. Several even implemented drought penalty rates designed to drastically reduce water use. These policies reduced water use; however, an unwanted consequence of reduced water use was reduced revenues to the agencies, which still had to pay their system's fixed costs plus the costs of expanded conservation programs. To remain solvent, many water agencies had to increase rates several times during the drought” (CDWR, 1994). Further exacerbating the projected reduction in water supply is expected population growth in California and the related increase in demand for water. According to one estimate, annual urban water demand will increase by more than 60% from 2020 to 2100 (CEC, 2003a). Though water prices are subject to regulatory controls, reduced supply and higher demand are a classic formula for increasing water prices.
Electricity Prices The impacts of climate change coupled with population pressures are also likely to raise the price of electricity in California over the coming century. Demand for electric power may rise as a result of (1) population growth, (2) increased energy-intensive groundwater pumping in response to water scarcity, and (3) greater cooling needs. Price increases for electricity, in turn, could result from (1) growth in electricity demand outpacing supply, (2) climate change-induced reduction in hydroelectric generation, and (3) damage to electrical infrastructure from increases in extreme weather events. The following paragraphs elaborate on a few of the key effects of climate change on the demand and price of electricity.

Redefining Progress • Climate Change in California: Health, Economic and Equity Impacts • 61
Residential Peak by End-Use2001
Air Conditioning40%
Hot W ater3%
Laundry7%
Miscellaneous16%
Refrigeration12%
Televisions3%
Other3%
Pools & Spas6%
Cooking8%
Freezers2%
Commercial Peak by End-Use2001
Air Conditioning36%
Cooking1%
Exterior Lighting1%Interior Lighting
30%
Office Equipment1%
Other18%
Refrigeration6%
Ventilation7%
As average temperatures in California rise, greater demand for cooling will follow, increasing electricity loads during the summer. Currently, residential and commercial cooling consumes the largest share of electricity in California, as shown in Figure 3.7. From 1978 to 1997, household ownership of air conditioners in the Pacific region (CA, OR, WA, AK, and HI) increased by 36% (EIA, 2000), and if summers become hotter and the frequency of heat waves increases, this trend is likely to continue. While warmer winters will reduce the need to heat homes, according to the California Energy Commission, increased summer demand for cooling needs will exceed decreased winter heating needs (CEC, 2003a). In the commercial sector, industries such as food storage and preparation and biotechnology labs, heavy users of electricity, would require additional electrical capacity for cooling during hotter summers.
Figure 3.7: Residential and commercial electricity demand by end-use, 2001. Pacific region only, includes CA, OR, WA, AK, and HI. (CEC, 2003b) Climate change is likely to reduce hydroelectric production. About 20% of California’s electricity is generated in 340 hydroelectric power plants (CEC, 2004a, b). The relatively constant level of production depends in large part on water flows from the Sierra snowpack. The projected reduction in the snowpack is likely to result in a decrease in hydroelectric output. This reduction would further exacerbate discrepancies in supply and demand caused by climate change and population growth, and will most likely contribute to rising electricity prices. Historical evidence supports the conclusion that reduced hydroelectric production will result in higher electricity prices. Gleick and Nash (1991) estimate that during the 1987–1992 drought, California’s electricity consumers paid an extra $3 million as a result of reduced hydroelectric capacity. Additionally, overall higher demand coupled with decreased hydroelectric supply may lead to greater dependence on fossil fuels that exacerbate air pollution and increase electricity prices even further (USBR, 2004).

Redefining Progress • Climate Change in California: Health, Economic and Equity Impacts • 62
Increased frequency of extreme weather events will have a direct impact on the electrical infrastructure. Electrical poles and wires may be damaged during fires and floods, leaving areas without electricity and resulting in higher transmission and distribution expenses. In 1989, El Niño-related floods and extreme precipitation caused an estimated $1 billion in damage to Pacific Gas & Electric infrastructure alone (CRAG, 2002). During the 2003 southern California wildfires, nearly 1,500 electrical poles and 220 transformers were lost or damaged, leaving 300,000 people without electricity for varying time periods (DOE, 2003). Electrical outages add to the economic costs of extreme weather events by disrupting business operations. The overall impacts of higher temperatures in California are higher electricity demand and higher electricity expenditures for households and businesses, and expenditures are likely to increase even more in the likely case of increasing prices. A study by the California Energy Commission (CEC, 2003a) estimated that by the end of the century, due to increased cooling needs, total spending on energy in the state could rise as much as 21%. More specifically, the study estimated expenditure increases of $1.9 billion to $3.5 billion for a 2.7° F warming, and $9.4 billion to $18.9 billion for a 9° F warming. Furthermore, the study noted that “increased expenditures are 10% to 24% higher when long-term modifications such as additional installations of air-conditioning are taken into account” (CEC, 2003a). The temperature projections presented in this report (Table 1.1 and Figure 1.5) predict a statewide annual average increase in temperature of 5.9° F under the low-emissions scenario and 10.4° F under the high-emissions scenario by the end of the century, both higher than estimated by the CEC study. Recent projections suggest that total electricity expenditure in the state may be even higher than estimated by the California Energy Commission.
Food Prices Climate change is expected to have numerous impacts on agricultural yield and production, which are likely to translate into increases in the prices of food grown and raised in California. As discussed earlier, climate change could increase the prices of water and electricity, which would result in increased production costs for farmers. Warmer temperatures could also lead to a greater need for pesticides, likewise raising production costs. Similarly, greater weather variability and increased incidence of extreme weather events is likely to increase insurance needs and might lead to periodic productivity losses, further influencing food prices. Not all food consumed in California is produced in California, thus the impact of global climate change on global food prices should be considered. According to the IPCC, by 2080, cereal prices are expected to increase by 13%–45%, based on varying climate conditions around the world. Other studies reviewed by the IPCC suggest possible productivity gains in cooler areas, leading to reductions in some commodity prices. Three studies presented by the IPCC projected “that a global temperature rise of greater than 2.5º C is likely to exceed the capacity of the global food production system to adapt without price increases” (IPCC, 2001). However, the geographical variation of climate change and the varying degrees of adaptation make it difficult to reach a definite conclusion about the future of global food prices.

Redefining Progress • Climate Change in California: Health, Economic and Equity Impacts • 63
Disproportionate Impact of Rising Prices As climate change manifests throughout the coming century, the prices of basic life necessities are likely to increase. Although prices may increase uniformly for all consumers, low-income communities will be impacted more severely. The burden of rising prices affects low-income households disproportionately because they spend more of their income on necessities than do high-income households. This point is illustrated in Figure 3.8, which shows the percentage of a household’s total expenditures accounted for by water, electricity, and food as income increases. The figure uses total expenditure (the sum of expenses) as a proxy for income. Income groups are determined by expenditure as follows: The population sample is ranked according to expenditure level and divided into five groups (quintiles) of equal size (each containing 20% of the population); the quintiles are ranked by total expenditure level from lowest (1) to highest (5). As seen in Figure 3.8, low-income groups (quintile 1) allocate a larger proportion of their total spending toward buying basic necessities than do high-income groups. This pattern holds for all of the basic necessities. Between the top and bottom quintiles, there is a nearly threefold difference in the percentage of total spending allocated to water purchases. Households in the bottom quintile use more than twice as much of their total expenditures on electricity. Of the three necessities shown, food purchases consume the largest portion of total spending for all five quintiles, and differences between income groups are particularly pronounced. The twofold difference in the share of food in total expenditure between the top and bottom quintiles translates into an extra 10% of household budgets in the low-income group.
Figure 3.8: Household expenditures on water, electricity, and food by income group (as percentage of total expenditures). Expenditure quintile is a proxy for income with quintile 1 representing the lowest-income households and quintile 5 representing the highest-income households. (BLS, 2002) An increase in the prices of basic necessities would impact low-income households disproportionately because purchases of such goods take up a larger share of their total spending. In other words, a larger share of low-income households’ expenses would be affected. For example, if food prices rise, a fifth of a poor household’s expenditure would become more expensive. In an affluent household, however, only a tenth of total expenditures would be affected by the rising prices.
0.0%
0.5%
1.0%
1.5%
2.0%
2.5%
1 2 3 4 5Expenditure Quintile
% o
f Tot
al E
xpen
ditu
res
0.0%
0.5%
1.0%
1.5%
2.0%
2.5%
3.0%
1 2 3 4 5Expenditure Quintile
% o
f Tot
al E
xpen
ditu
res
0%
4%
8%
12%
16%
20%
1 2 3 4 5Expenditure Quintile
% o
f Tot
al E
xpen
ditu
res
Water Electricity Food

Redefining Progress • Climate Change in California: Health, Economic and Equity Impacts • 64
People of color and low-income communities are more vulnerable to changes in water prices—particularly where the two groups overlap. As seen in Figure 3.9, significant differences in expenditure patterns are evident among different races/ethnicities, especially in the lowest quintile. In the case of water purchases, Blacks use a larger share of their budgets on water, especially for the two lowest expenditure quintiles. Hispanics spend a larger share on water than do Whites, but only for those in the two lowest quintiles. The largest differences are seen in the bottom quintile, with Blacks spending as much as 65% more of their expenditure share on water than Whites, and Hispanics spending nearly 40% more than Whites.
As with water, race/ethnicity-based differences also occur in food purchases, as seen in Figure 3.9. In every quintile, Blacks spend proportionately less on food than the other two groups. Hispanics, on the other hand, spend a higher share of their budgets on food than Whites. The most striking differences in food expenditure can be seen in the two bottom quintiles. In the lowest quintile, Hispanics spend nearly 40% more of their total expenditure on food than Whites. The low-income Hispanic population is disproportionately affected by fluctuating food prices because food consumption is such a large share of their expenditure. These results emphasize the vulnerability of the low-income Hispanic community to shocks in the agriculture sector, both as consumers and laborers, as discussed in the following section on employment.
Figure 3.9: Household expenditures on water and food (as percentage of total expenditures) by income (expenditure quintile) and race/ethnicity. Expenditure quintile is a proxy for income with quintile 1 representing the lowest-income households and quintile 5 representing the highest-income households. (BLS, 2002)
0%
1%
2%
3%
4%
1 2 3 4 5
Expenditure Quintile
% o
f Tot
al E
xpen
ditu
re
BlacksHispanicsWhites
0%
5%
10%
15%
20%
25%
30%
1 2 3 4 5Expenditure Quintile
% o
f Tot
al E
xpen
ditu
res
HispanicsWhitesBlacks
Water Food

Redefining Progress • Climate Change in California: Health, Economic and Equity Impacts • 65
White, 16%
Black, 3%
Native American,
0.5%
Asian, 4%
Hispanic, 77%
Figure 3.10: Agricultural sector employment by race/ethnicity. (EDD, 2003)
Disproportionate Impact on Employment
Agricultural Employment Climate change will impact agricultural employment through two main channels: (1) increased incidence of extreme weather events will expose the sector to greater risks and possible revenue losses that could lead to abrupt layoffs, and (2) changing weather patterns would require costly adaptation, such as shifting crop varieties or changing cultivation locations, possibly causing local job loss. As weather variability increases overall risk and capital needs, populations that depend on agriculture for employment are likely to be adversely affected. The impacts of climate change on agricultural sector employment have important equity dimensions. In California, agricultural laborers are predominantly Hispanic and typically part of the low-income community. As seen in Figure 3.10, more than 75% of those employed in agriculture are Hispanic. Agriculture provides close to half a million jobs in California (EDD 2003), with 315,000 of them held by Hispanics. The hourly wage in the agricultural sector is no more than $7.50 (EDD, 2003). Low wages, coupled with seasonality of labor demand, contribute to California’s top agricultural counties being among the poorest in the state. Figure 3.11 illustrates this point, showing the percentage of the population that lives below the federal poverty line for the ten counties that have the highest agriculture production (measured in dollars).

Redefining Progress • Climate Change in California: Health, Economic and Equity Impacts • 66
Figure 3.11: Poverty levels in California’s top agricultural counties. (USCB, 2000) As climate change adversely impacts agriculture in California, employees of the agricultural sector are going to be significantly affected. Low-income Hispanic communities would bear a disproportionate burden of the economic hardships associated with shocks in agriculture, as they would be vulnerable to job losses. These impacts would be felt especially by communities in the Central Valley, where agriculture is a major source of employment, and where there is a heavy concentration of low-income Hispanics residents (Figures 1.1 and 1.2).
Tourism Employment Climate change could also have significant impacts on employment in tourism. The tourist industry is already vulnerable to changing market conditions, as travel is affected by changes in disposable income. Changing weather patterns are likely to add to the economic volatility of the industry. This in turn could reduce local revenues and employment in communities where tourism is an integral part of the local economy. For example, poor snow conditions during the winter of 1990–1991 reduced tourism-related employment in the Sierras to half of normal levels (Gleick and Nash, 1991). With shortened seasons and more frequent extreme weather events, the capacity of tourism to provide stable employment may erode. Workers in this sector may face more layoffs, shorter employment periods, and possibly lower wages as the industry copes with damages to infrastructure and to the natural environment. Low-income communities and people of color would be especially hurt by such shocks, as they represent a large share of tourism-generated employment in such areas as traveler
0
5
10
15
20
25
1 - Fresn
o
2 - Tulare
3 - Monter
ey
4 - Kern
5 - Merce
d
6 - San Jo
aquin
7 - Stanisla
us
8 - San D
iego
9 - Rive
rside
10 - Ventu
ra
County, ranked by agriculture production (in $)
% b
elow
pov
erty
line

Redefining Progress • Climate Change in California: Health, Economic and Equity Impacts • 67
accommodations, food preparation, and transportation. Figure 3.12 shows the percentage of tourist industry employment accounted for by people of color. In all of the major tourism sub sectors except entertainment, people of color constitute the majority of the workforce and would thus bear a disproportionate burden of any economic hardships associated with disruptions in tourism caused by climate change.
0 20 40 60 80
Traveler Accomodation
Food
Air Transportation
Ground Transportation
Retail
Travel Arrangements
Entertainment
Percent People of Color
Figure 3.12: Percentage people of color in tourism-generated jobs, by sector. (CDT, 2003; EDD, 2003)

Redefining Progress • Climate Change in California: Health, Economic and Equity Impacts • 68
CHAPTER 4: COMMUNITY TESTIMONY
Background on Community Outreach Climate change is not merely a question of changing temperatures. It has a significant impact on the prosperity of communities and individuals. As the chapters on economic and health impacts suggest, climate change is likely to impose significant and disproportionate burdens on low-income communities and people of color in California, in part because these groups often have fewer resources than others to adapt to changing weather conditions or mitigate their effects. Understanding the specific vulnerability of these communities to climate change impacts is crucial to ensuring the development and adoption of just climate policies that address the needs of all Californians. As discussed in chapter 1, a central tenet of the climate justice framework is the principle “we speak for ourselves.” To that end, this report relies not only on data sets, literature reviews, and computer models for answers, but also collects expert testimony from the people living in low-income neighborhoods and communities of color on how climate change affects their lives. As mentioned in chapter 1, the climate justice philosophy is a framework for guiding this report. One of the prominent climate justice principles is the importance of community participation in the decision-making process. The Environmental Justice and Climate Change Initiative’s 10 Principles of Just Climate Policies in the U.S. states: “At all levels and in all realms, people must have a say in the decisions that affect their lives” (Miller and Sisco, 2002). Climate justice and environmental justice both emphasize community participation in research and decision making. To resolve existing structural injustice, political leaders and policymakers must talk to the people who face that injustice. Oral history, local community experience, and indigenous knowledge provide a critical addition to technical expertise. Policymakers must rely on supplementary sources of knowledge from a widened coalition of community experts. The U.S. Environmental Protection Agency focuses on the principle of community involvement in its definition of environmental justice (USEPA, 2004), identifying the need for “fair treatment and meaningful involvement of all people regardless of race, color, national origin, or income with respect to the development, implementation, and enforcement of environmental laws, regulations, and policies”(emphasis added). The EPA expands on the significance of “meaningful involvement,” focusing in particular on participation, influence, consideration in decision making, and state facilitation of that process. This emphasis reflects a larger effort to bring community members and technical experts together, as part of the legislative process. The previous chapters presented scientific analysis of the potential health and economic impacts of climate change on Californians. This chapter goes beyond the science to present observations from the people who may experience the greatest challenge under any climate change scenario. Our objective was to find out what the data actually mean to low-income groups and people of color, and what individuals in these communities
Redefining Progress • Climate Change in California: Health, Economic and Equity Impacts • 69
experience now and expect to experience in the future. Community testimony provides an additional perspective to interpret, understand, and address these issues. The community testimony comes from a two-step process. First, surveys were sent to leaders in the field of environmental justice. Several community-based groups helped to conduct the second step: gathering testimony through community meetings. This chapter begins with a brief explanation of the methodology. Next, the findings from both the surveys and community meetings are presented, organized by topic. Finally, the chapter concludes with lessons learned from the community testimony experience.
Methodology for Community Outreach and Assessment
Surveys of Environmental Justice Leaders Surveys were sent to 50 environmental justice leaders throughout California. Our goals in conducting these initial surveys were, first, to gather a preliminary round of information from people with broad expertise in community concerns and related justice issues; and second, to identify opportunities to hold community meetings. The meetings are critical for three reasons: (1) to encourage greater participation at the community meetings, (2) to build climate justice capacity in community-based organizations, and (3) to connect the issues discussed in the meetings to opportunities for action at the local level. Since the focus of this report is on how climate change affects California’s low-income groups and communities of color, we first approached environmental justice (EJ) leaders in these communities as people who have a wealth of expertise on the effects of environmental disruption on their communities. The organizations and people were identified through two sources: the Environmental Justice and Climate Change Initiative (EJCCI) and the 2000 Directory of People of Color Environmental Groups (Bullard, 2000). Along with the survey, we sent a letter introducing the report and its purpose, as well as basic information on climate change, environmental justice, and California Assembly Bill (AB) 1493 (CARB, 2004b).24 We received 26 responses from the surveys (see Appendix C for a list of participating organizations). Three organizations were represented by two different people. In addition, two organizations requested they not be identified. Eighty-one percent of the survey respondents represented Latin American/Hispanic or African American/Black communities. The remainder represented majority Asian/Pacific Islander or Native American communities or were multi-ethnic. The overwhelming majority (92%) of respondents represented low-income communities. Additionally, urban communities were almost twice as represented as rural communities. The people in this survey sample responded as an organization and described the community that they represented rather than their individual designations.
24 AB 1493 is a California law to restrict greenhouse gas emissions from passenger vehicles. The California Air Resources Board adopted regulations as required by this legislation in September 2004. The information accompanied the survey letter to provide a policy context for this study.

Redefining Progress • Climate Change in California: Health, Economic and Equity Impacts • 70
In the survey, we asked what climate change impacts the community is already experiencing and what they expected to experience. Through a literature review, we identified likely areas of concern. To help guide the discussion, we categorized impacts into health, economic (such as employment and price effects), and social (such as community culture and leisure activities). In addition, we asked how access to health care and climate-related migration (variables previously identified in vulnerability studies) would factor into dealing with climate change (Miller et al., 2000; IPCC, 2001). Finally, in order to help guide the study, we asked respondents to prioritize the variables studied in the other chapters of this report (see Appendix D for the complete survey).
Community Meetings From the surveys, we identified four communities in which to hold meetings: two in the San Francisco Bay Area (West Oakland and Richmond) and one each in the Central Valley (Fresno) and South Coast (Los Angeles) areas. All the meetings were conducted in communities that have a majority of low-income groups and people of color. For each meeting, we worked with a host organization in the area, usually identified during the survey process. We facilitated all meetings except the West Oakland meeting, which, after two preparatory sessions, was facilitated by the host organization (Coalition for West Oakland Revitalization, CWOR) with technical assistance by the authors. Table 4.1 lists the meeting locations, dates, host organizations, and participant profiles.
Table 4.1: Community Meeting Profiles As this was the first introduction to the science of climate change and its impact on low-income groups and communities of color in California for many participants, the meetings began with an overview of these topics. The overview, also called Climate Justice 101, outlined the basic science of the causes and potential effects of climate change and explained the disproportionate impacts that climate change is likely to have on low-income groups and people of color. The overview was followed by a general discussion among all participants. Various tools were utilized to guide and prompt the
Location Date Host and Participants
Richmond August 26, 2004
Host: Community Health Initiative; 19 Black participants
Fresno September 23, 2004
Hosts: Latino Issues Forum, Lung Association of Central California, and La Union del Pueblo Entero;
8 primarily Latino/Hispanic participants
Los Angeles September 27, 2004
Hosts: Busriders Union of the Labor, Community Strategy Center;
12 Latino/Hispanic, Black, and Korean participants
West Oakland
October 4, 2004
Host: Coalition for West Oakland Revitalization; 10 Black and Latino/Hispanic participants

Redefining Progress • Climate Change in California: Health, Economic and Equity Impacts • 71
“We are not ignorant of what’s going on”
– Fresno participant
discussion. At all meetings, blank surveys identical to the ones sent to the EJ leaders were used. In addition to the surveys, at the Richmond, Los Angeles, and West Oakland meetings, an interactive exercise was performed with the aim of both reinforcing the information given in the overview and facilitating discussion. The interactive exercise required participants to match pairs of two-part flash cards where one part had text and the other a matching image (see Appendix E). The ultimate purpose of the meetings was to obtain community testimony, so participants were encouraged to discuss their own experiences with and thoughts about climate change. The community meeting process varied, depending on the needs of the local community. Fresno and Los Angeles participants filled out individual surveys in addition to having a group discussion. In Richmond and West Oakland, participants discussed the survey questions as a group. Consequently, the results in the following discussion are quantified only for the EJ leaders’ surveys, where responses were collected uniformly. The community meeting responses are presented qualitatively.
Community Findings The objectives of this synthesis are to present observations and highlight those observations that resonated repeatedly among community members. Of particular interest to community members were impacts on human health. The beginning of this section will discuss the cluster of health variables studied in this report, including respiratory ailments due to air pollution (the highest priority for respondents), heat wave-related death and illness, and finally infectious diseases. The ability to deal with these health impacts is dependent upon access to health care, so the discussion shifts to community concerns over health care (the second-highest priority). The concerns were grouped into various economic conditions and occupational challenges, such as employment and price projections for climate-sensitive industries, and impacts on food prices and agricultural employment. Water supply and resource availability, and fishing and hunting are grouped under water and food. Finally, participants raised a number of concerns that did not fit into the aforementioned groupings, including transportation (raised primarily at the community meetings) and migration (primarily from the surveys).
Figure 4.1 shows the survey responses of the EJ community leaders. Participants were asked “which of the following study variables are most important to you.” As the figure indicates, there was a broad distribution of interest in the various study variables. It is striking that of the 26 survey respondents, only 2 did not prioritize respiratory ailments. Respiratory ailments, health insurance rates, and impacts on food prices were the three issues of most concern, while fishing and hunting garnered the least interest. Issues raised in the “Other” category are described in the “Other concerns” section and are discussed later in this chapter.

Redefining Progress • Climate Change in California: Health, Economic and Equity Impacts • 72
62%
19%
54%
54%
73%
73%
62%
62%
92%
0% 20% 40% 60% 80% 100%
Other
Fishing and hunting
Water storage and resource availability
Employment and price projections
Impacts on food prices and agriculturalemployment
Health insurance rates
Infectious diseases
Heat wave death and illness
Respiratory ailments due to air pollution
Figure 4.1: Distribution of interest for study variables. Percentage of survey respondents indicating the topic was a priority.
Health Health, especially respiratory health, clearly weighs heavily on the minds of community members. Ninety-two percent of the survey respondents note concerns about increased rates of respiratory ailments such as asthma and allergies. Impacts on human health are of particular concern as many community members lack adequate access to health care. (Before being specifically asked about access to health care, one-quarter of the EJ leaders surveyed raised the issue in the discussion about climate impacts on human health.) Health impacts discussed at the meetings fall into three categories: respiratory ailments due to air pollution, heat wave-related death and illness, and infectious diseases. Respiratory ailments due to air pollution: As mentioned previously, respiratory illness due to air pollution is the most frequently cited climate change impact of concern for survey respondents. It also gained predominance in all of the community meetings, as air pollution-induced respiratory ailments are currently a top concern in vulnerable communities. Richmond participants talked about the three freeways that surround their community. People said that diesel trucks often travel these roads and leave behind an unhealthy layer of particulate matter. One participant noted that Chevron used to produce pesticides in the neighborhood, and the refineries that are still there leave layers of dust in the community.

Redefining Progress • Climate Change in California: Health, Economic and Equity Impacts • 73
“Can we get used to the toxins? We used to smell the terrible chemicals. Now I don’t smell them, but we still feel sick.”
– Los Angeles participant
Participants also addressed high rates of asthma in their community. “It has been documented that our children are three to four times more likely to go to the emergency room,” noted one Richmond participant. In response to the currently high rates of asthma in the community, some community groups now go to neighborhood homes to teach people to recognize asthma triggers. Los Angeles meeting participants were also particularly concerned with asthma and other respiratory ailments. Some noted that people experienced decreased lung capacity “all the time.” Climate change could bring “more smog with the intense [and] worsening heat—pulmonary conditions [could increase].” Yet again, in West Oakland asthma was a big issue and there was concern that climate change would worsen the problem. “Sometimes a small change in weather will make asthma flare up,” said a participant at the Oakland community meeting. As another participant noted, “more human beings will have respiratory problems—asthma, coughing, dizziness, allergies.” Another said: “More people than ever have asthma and quite a number of people in West Oakland did not have asthma before they moved here but now have it.” As in Richmond, the community in West Oakland is also surrounded by freeways and is located next to a heavily trafficked port. The port and freeways create a lot of diesel pollution from both ships and the trucks that transport goods inland. Heat wave-related death and illness: One-quarter of the EJ leaders mentioned that death and illnesses from heat exposure were becoming more frequent and anticipated that the trend would continue. Chapter 2 demonstrates that people of color are especially susceptible to temperatures increases and heat waves. This was a controversial topic at the Richmond meeting, where one participant, originally from Africa, took issue with that notion. She pointed out that in Africa and many other developing regions, it is much hotter than here, and people of color (and Blacks in particular) are used to being outside in high temperatures. Several participants responded that things are different in the United States, citing the examples of devastating heat waves in Chicago in the Northeast. While the scientific background in chapter 2 provides us with a statistical overview of the issues, community members offered reasons behind the numbers. For example, community members in Richmond indicated that it is really secondary factors, such as inadequate air conditioners, poor housing stock, and seniors’ poor health that cause the poor and people of color to be more affected by heat waves. Additionally, people of color (and again Blacks in particular) suffer disproportionately from high blood pressure and other diseases. The medication for these diseases and the diseases themselves put the sufferers at extra risk during heat waves. Participants in West Oakland also connected an increase in temperatures to an increase in emotional challenges. As temperatures rise, so do physical aggression, anger, road rage, and domestic violence.

Redefining Progress • Climate Change in California: Health, Economic and Equity Impacts • 74
“Why is it that people of color [are] twice as likely to be uninsured?”
– Los Angeles participant
Infectious diseases: Chapter 2 focuses on two types of infectious diseases, water-borne and vector-borne. Water-borne diseases did not receive significant discussion in either the surveys or the community meetings, but there was some discussion about the connection between climate change and West Nile virus. Participants in West Oakland mentioned that several people in the Bay Area were recently diagnosed with the disease. Richmond residents noted that insects breed in standing water, which is common in their community. Los Angeles residents observed, “This year we have West Nile virus—more deaths, more illness, more costs.” One Los Angeles participant speculated, “More rain and heat leads to more mosquitoes, which leads to more infections of diseases like West Nile and malaria.”
Health Care Consistent with the low rates of health insurance among Blacks and Hispanics described in chapter 2, 89% of the EJ leaders surveyed indicated that access to health care is an issue for their community. Both the survey respondents and the participants at the community meetings felt the lack of access to health care will make adapting to climate change harder. Low-income people and people of color have concerns about access to health care for two reasons: (1) many community members lack health insurance, and (2) public health care is in jeopardy because of budget cuts and closures of hospitals and clinics. Several people noted problems with the health care system that affected their community, such as lack of knowledge about environmental health, difficulty retaining health-care professionals in their community, and people going to Tijuana for over-the-counter medication such as penicillin (a practice that encourages people to self-diagnose their medical problems). As one person said: “The County is facing massive budget cuts, and the first services to go
are health-care facilities. As climate change impacts are felt more, this shortage of access to health care can mean life-or-death situations for many people.” Participants in both Richmond and Los Angeles raised the fact that people of color disproportionately remain without health coverage in the United States. An
Oakland participant noted: “Some people who get sick won’t go to the hospital. They have no health insurance and don’t go because they’re ashamed. If people look at them funny, they’ll leave. They don’t offer you the same choices if you’re poor.” As an example, he noted that if you go to the dentist without private insurance or the ability to pay for premium services, the dentist will just pull your teeth rather than capping them, which is more expensive. A Los Angeles participant noted, “Asthma is a manageable disease if people have really good health care—if not, you end up in the hospital all the time.” The key reason mentioned for lack of health care was its high cost; going to the
“My family is uninsured and make[s] below $20,000 a year. I can predict future costs in terms of treatment for West Nile virus; also, with ground-level ozone or smog increasing with the heat, my family will most likely contract some kind of respiratory problem—not that we’re not suffering from the consequences of bad air already in LA.”
– Los Angeles participant

Redefining Progress • Climate Change in California: Health, Economic and Equity Impacts • 75
“Because we are very poor, we do not have any option to move ourselves. It affects us by putting us in an economic crisis.”
– Los Angeles participant
hospital is “too expensive, [and we do not have] enough income. With climate change there are more health risks, but we can’t go to [the] hospital.” In summary, access to health care is fundamental in successfully dealing with the health impacts of climate change. However, in low-income groups and communities of color, getting the health care that people need is difficult owing to the lack of affordable insurance and the disappearance of medical facilities as a result of government budget cuts. A response from the EJ leaders’ surveys captures the sentiments of many of the people we heard from:
My family is uninsured and make[s] below $20,000 a year. I can predict future costs in terms of treatment for West Nile virus; also, with ground-level ozone or smog increasing with the heat, my family will most likely contract some kind of respiratory problem—not that we're not suffering from the consequences of bad air already in Los Angeles.
Economic Conditions Chapter 3 presents scientific analysis on the economic impacts of climate change. The chapter focuses on the price of such necessities as water, electricity, and food; climate impacts on the agriculture and tourism industries; and the effect of extreme weather events on California’s infrastructure. Community testimony did not cover infrastructure, but there was a fair amount of discussion about prices, employment, and occupational challenges. This section addresses the two economic study variables: (1) employment and price projections for climate-vulnerable industries and (2) impacts on food prices and agriculture. In the discussions, these two variables had overlapping responses. Approximately one-third of the EJ leaders surveyed cited concerns about climate change and its impact on agriculture and food prices. Some of these concerns were related specifically to increased food prices and access to affordable, healthy food, while others were related to the economic impact that agriculture has on the community. Employment: From the EJ leader surveys, the most commonly cited effect (24%) on the work environment was related to employment and occupational hazards for farm and construction workers. The second-most common observation was that increased respiratory illness (from worsening air pollution) would result in more frequent work absences due to the health problems of workers and their children. Another concern was that greater dependence on air-conditioning in offices would trigger allergies. People were also interested in how climate change would affect the cost of doing business in California, and possible impacts on employment due to increased outsourcing. Other concerns included effects on tourism and the resulting impact on local economies, mold and mildew problems in old and substandard housing, and loss of workdays in construction caused by more frequent storms and extreme weather events.

Redefining Progress • Climate Change in California: Health, Economic and Equity Impacts • 76
“The majority of oppressed nationalities, i.e., colored folks and indigenous people don't have health care, and as more and more public health facilities are shutting down due to government sellout, most poor people of color living in air pollution-concentrated urban areas like Los Angeles are suffering from climate change and global warming illnesses and dying. Poor people can't afford air-conditioning, and now that the county is planning to close the trauma center in King/Drew hospital that means more people who are getting heat stroke will not get the efficient treatment they need. The environmental catastrophe caused by unsustainable lifestyles of the few privileged majority White society is destroying the lives of poor oppressed nationalities who are being exploited by this racist exploitive system already economically coupled with government abandonment of some of the last social protection measures, which once again screws these people with nowhere to turn to. Major violation of human rights, founded on the very racist and destructive system that we live in. This is the multiplied effect of climate change coupled with bad racist social/political policies on me and my family and the rest of the oppressed nationalities throughout southern California.”
– Survey respondent
Occupational conditions were among the most unexpected issues addressed during the community meetings. Richmond participants discussed how farm workers in the San Joaquin Valley constantly face exposure to pesticides and feared that this situation might worsen with climate change. The participants felt that businesses put farm workers in the field without any protection, knowing that the workers lack citizenship and thus the ability to voice any grievances. Oakland and Los Angeles participants both addressed occupational conditions. One Oakland resident noted that in construction and landscaping, “when the weather is bad, people can’t work and don’t get paid.” Another observed, “Some people’s jobs will be lost” (e.g., fisherman). Another Oakland participant noted, “If it rains or we have bad weather, you may not be able to work” (e.g., construction, drilling oil wells). A third person said, “Anyone who works outside or rides the bus will be affected if it’s too hot [or] cold.”
Prices: Community comments about prices focused on three areas: food, health care, and costs of avoiding heat exposure. A number of survey respondents and community meeting participants indicated that food prices are expected to increase. The primary reason cited for rising food prices is related to water needs: Plants will need more water because of the heat, and drought and altered rainfall patterns will make irrigation more important and expensive. One Richmond participant addressed problems in the Central Valley: “In Fresno, when the sun is too hot, all the grapes dry up. The heat can burn up
“[We may see] higher cooling and water rates, as these are issues that we are starting to deal with now, but the full brunt of the impact hasn’t really hit yet.”
– San Diego survey respondent

Redefining Progress • Climate Change in California: Health, Economic and Equity Impacts • 77
stuff, ruining the field.” As one Los Angeles participant said, we will see “more fluctuation in food prices because of freaky weather and crop productivity.” This sentiment is of particular concern in areas that already face challenges in food security (accessible and affordable food). Many low-income communities and people of color suffer from a lack of grocery markets and are dependent upon expensive corner stores that mostly carry packaged food (often less healthy than fresh food) and alcohol. As indicated in the health and health-care section, both survey respondents and community meeting participants reported the health impacts of climate change would increase health costs for community members. Community members speculated that some people would have to spend more on air-conditioning (for those that have it) to keep cool, and people would need to purchase more bottled water, juices, and ice. A survey respondent noted that more air-conditioning would be needed, especially at night, which is “more costly and more polluting.” An increasing reliance on air conditioners would only exacerbate the air quality concerns mentioned in the health section above. A San Diego survey respondent noted that we might see “higher cooling and water rates, as these are issues that we are starting to deal with now, but the full brunt of the impact hasn’t really hit yet.”
Water and Food Water storage and resource availability: In all of the community meetings, participants voiced several concerns regarding the future availability of water resources in the state, focusing on shrinking snowpack as a significant problem for California’s water flows and economy. Concerns in this area fell into three categories: (1) the Central Valley and agriculture, (2) Los Angeles’ water supply, and (3) the San Francisco Bay. First, there was a feeling that water quality was already an issue for Central Valley residents. This concern was raised in all meetings, not just in the Central Valley. For example, this issue was heavily discussed in the Richmond meeting, where one participant noted that the EPA recently put out a statement that all waterways are contaminated with mercury, affecting fish and food. Second, Los Angeles depends upon snowmelt for its water. Finally, residents in the Bay Area were concerned that when water is in short supply in other parts of the state, prices go up, forcing people in the Bay Area to use less water. One southern California respondent noted the importance of water resources along the U.S.-Mexico border: “It's going to add to issues of safety. It is getting much tougher to fight fire with scarce water. The reason there is fire is because forests are depleted by lack of water. More immigrants are dying because of water issues—[for] a couple of reasons. Some are because of draconian operations pushing people toward desert areas, and we are seeing record temperatures. Over 3,000 people died as of Sunday trying to cross over the border. People didn't go through such conditions before.” Fishing and hunting: When asked whether climate changes would impact the plants and animals that they depend upon, 40% of the EJ leaders surveyed raised concerns about access to affordable fresh food from fishing, agriculture, and home gardens. Other issues

Redefining Progress • Climate Change in California: Health, Economic and Equity Impacts • 78
raised were the impact on local economies that depend upon agriculture, fishing, gardening and medicinal plants. In the San Francisco Bay Area, both survey respondents and meeting participants were concerned about the impact on fishing, both as a food source and as a cultural activity. Another concern was the impact of low snowmelt on fish in San Francisco Bay: “You don’t catch good fish. The fish are smaller, and you cannot catch many of the freshwater game fish.” Another participant observed that the toxins dumped in the bay by U.S. military and industrial facilities compound the fishing problems: “Though the sediment supposedly stays at the bottom, the fish still get contaminated.” One southern California survey respondent noted that fishing has become much more difficult: “My brother does a lot of fishing. They have to go farther and farther out. In talking with some of the folks who have charters, [they said] before they used to go for half a day. Now it's a day and a half to find a fair amount of fish. They believe it's because the water is getting warmer.” One fisherman he talked with believes that the current is getting stronger because of polar ice melt. Oceanside has an inlet of the Alaskan current that dips into land, and as that current changes, so does the habitat for fish. He continues, “My brother and I recently took my daughters fishing. It's more expensive. He says that he spends a lot more on diesel to go out and get fish.” A few Oakland participants focused on food. In response to the question of whether plants and animals will experience habitat impacts, one person said, “Everything we eat [will be impacted]. If animals or plants die or get sick, we’ll have less. Plants are kind of funny—one degree higher or lower can make them angry.” Another participant raised concerns about climate change-induced fish migration.
Other Themes Climate, temperature, and weather: Seventy-three percent of the survey respondents have already noticed changes in their local climate. One-half of the respondents commented that temperatures seem to be getting warmer and particularly noted the greater number of hot days encountered. Twenty-three percent of those surveyed added that the heat has caused a noticeable increase in air pollution and smog. Another common observation was that weather has become more extreme and unseasonable. An Oakland participant summed up the topic of weather variability, stating, “Basically, the weather is unpredictable.” Added another, “By this time of year it’s supposed to be windy, but it’s not.” One Oakland participant elaborated, “Some people are not used to changing weather, and it can make them sick.” Similarly, a Los Angeles participant stated that temperature fluctuations could aggravate physical ailments such as arthritis. In addition to the health concerns regarding heat discussed earlier, survey respondents and community meeting participants noted that the heat will also affect social activities. For example, an increase in heat waves will restrict outdoor activities, limiting children’s recreational options, creating problems for businesses that depend on foot traffic, hampering social gatherings, and discouraging civic participation.

Redefining Progress • Climate Change in California: Health, Economic and Equity Impacts • 79
While much of the literature on the impacts of climate change is concerned with an increase in extreme weather events such as hurricanes, people in this study did not believe this would be a concern for California residents. However, a number of people in the community meetings referred to hurricanes in Florida (which had occurred just prior to several of the meetings) as the kind of events that are supposed to get worse as the climate changes. A Los Angeles participant described how he talks with other people about climate change by telling them, “What’s happening in Florida—that is not an isolated case, it is coming every 50 years.” Climate observations most clearly break down along regional lines. While heat and weather variability, including rain, are the primary concerns for San Francisco Bay Area residents, people in southern California more often raised concerns about drought and fire, while Fresno residents described the negative effect of changing temperatures on agriculture. Migration: The EJ leaders surveyed who identified migration as a possible concern (80%) were mainly alarmed by the possibility that climate change could make some areas harder to live in, due to higher temperatures or more frequent extreme weather events. Testimony about migration fell into two categories: local impacts of climate change that would make living conditions less hospitable, and climate change impacts elsewhere in the world that would send environmental refugees into California communities. Most of the survey respondents noted that many in their community do not have the resources to move to new locations, even if their homes or jobs are threatened. As one Los Angeles community member said, “Because we are very poor, we do not have any option to move ourselves. It affects us by putting us in an economic crisis.” A southern California survey respondent similarly notes:
Honestly, for many poor people of color, mobility is nonexistent. We live [here] not because we chose to, but because the economic/social/political conditions are set where we live… There is no other option, despite all the problems. How will severe weather affect me and my family as well as the rest of folks like me? Good question, but here's a better one: Where would we go?
Additionally, the EJ leaders surveyed were concerned about climate change inducing domestic and international immigration. An increase in immigration into the San Francisco Bay Area would increase population pressures, which in turn would increase competition for low-wage jobs. Population pressure would also negatively impact community diversity by raising housing prices and making neighborhoods affordable only to wealthier people.
“[Climate change] could affect the diversity of the community. It could worsen gentrification since people who have the ability to move are the people who have the resources to do so.”
– Henry Clark, West County Toxics Coalition

Redefining Progress • Climate Change in California: Health, Economic and Equity Impacts • 80
The U.S.-Mexico border has its own unique immigration challenges. There are many unincorporated areas where people don’t have public infrastructure to help them adapt to climate change. A participant noted, “Many of the communities are set up on land that is woefully inadequate, on flood plains and riverbeds. As we get more rain we have more impact pressures on the waterways, particularly by washing fine particles and pollutants into the waterways.” Devastating stories were collected about torrents of water that would carry people away. Transportation: Transportation concerns fell into two major categories: increased fuel expenditure and the effect of heat and increased weather variability on public transit riders. These concerns reflect the fact that many low-income people and certain communities of color rely on public transportation or drive older, less fuel-efficient vehicles. Fresno participants spoke extensively on the lack of a reliable and accessible public transportation system in Fresno. Several noted that the development pattern forces people to use their own cars and that poor people often rely on older, less fuel-efficient cars that increase personal expenditures on transportation and add to air pollution. One concern raised was the impact of higher temperatures on farm workers, many of whom are prevented from getting driver’s licenses because of their immigration status. These workers are dependant upon public transit and will have no option but to wait in the heat. “There is no water, and no shades by the bus stops,” making it hard for people to tolerate the scorching heat. An elderly Los Angeles resident noted that fluctuating weather patterns could limit the mobility of elders, as rain and high temperatures would make it more difficult for the elderly to do errands such as grocery shopping.
Lessons Learned In keeping with the environmental justice principle of “we speak for ourselves,” the authors of this report sought out the opinions of environmental justice leaders and community members. From these conversations, we gained insight into the needs and desires of the communities that will be especially hard hit by climate change. There were two main lessons learned from our outreach effort: (1) how to better engage disadvantaged communities in the climate-change debate, and (2) the extent to which the issues being addressed by scientists and policymakers match the actual concerns of these communities. Here we briefly discuss these two aspects. Engaging the community in the debate: The community meetings shed light on the need to raise awareness about the impacts of climate change on California’s diverse communities. We found that the level of familiarity with the issue varied widely among community members, from those who knew virtually nothing about the topic, to those who had some background on the impacts of climate change but did not identify it as an immediate concern for their communities, to those who were fully knowledgeable and engaged in the debate. At each meeting, community members covering the full spectrum of understanding were present. Varying levels of familiarity pose difficulties for community outreach because each level requires a somewhat different educational approach.

Redefining Progress • Climate Change in California: Health, Economic and Equity Impacts • 81
Some community members with less exposure to the science and impacts of climate change required rudimentary explanations—which, we discovered, can be challenging. For one thing, we found that the terminology used in the public debate was not always effective in communicating our message. For example, many scientists and advocates use the term “greenhouse” as a metaphor for climate change—the process by which the earth is warmed is called the “greenhouse effect,” the gases that cause climate change are called “greenhouse gases.” Unfortunately, several participants in urban areas were unfamiliar with greenhouses, so the metaphor was more confusing than helpful in explaining the science of climate change. Clearly, for effective education in these communities, the concepts and issues of climate change need to be presented in language that can be more easily understood. For those community members possessing some general knowledge of how climate change will impact California, the critical objective was to connect climate change as an abstract global issue to their everyday lives and existing concerns. In other words, we needed to explain how climate change would exacerbate existing health and economic issues and discuss the disproportion-ate impacts likely to be felt by vul-nerable communities. Once we made the initial connections at community meetings, people engaged in mean-ingful discussions and came out with a better understanding of the risks they face. On a daily basis, vulnerable communities face great challenges: poverty, pollution, unemployment, crime, bad schools, and poor-quality housing. For many, the impact of climate change has little relevance to their daily struggles. One EJ leader summed up this concern as follows: “There are so many other things that the community is worried about. It’s hard to draw attention to the issue of climate change because there are problems happening now—communities that have poverty, live in [the] shadow of power plants, ports, refineries.” Environmental justice leaders need to connect projected future impacts to existing difficulties so the urgency of the climate change issue can be better grasped. We were able to make this connection at the community meetings, and we hope that this report will help to inform more people and communities. Extent to which community concerns are being addressed today: Through the community testimony process, we were able to identify the issues of particular concern to vulnerable communities and incorporate them into the analysis in this report. We found that with some issues, there was ample research and even efforts to address the concerns through public policy. This was the case, for instance, with the disproportionate effects of ozone pollution, the prevalence of asthma among Blacks in California being well documented in the scientific literature. There were a few issues raised in the meetings that we were not able to cover in the analytical sections of this report, either because there was not sufficient data or because they did not fit within the scope of the report. Several of these issues merit further study, which would undoubtedly aid policymakers in developing more effective programs. For
“We need to tie the issue of global warming to larger environmental justice and environ-mental health issues.” – Jose Carmona, Center for Energy Efficiency and
Renewable Technologies
Redefining Progress • Climate Change in California: Health, Economic and Equity Impacts • 82
example, community members were able to provided insights into the statistics on the disproportionate impact of heat wave-related death and illness in communities of color, insights that suggest policymakers need to focus more on addressing housing quality, availability of neighborhood cooling centers, and public health education. The issues of migration and transportation also emerged through community testimony, and they warrant further research. A better understanding of the how climate change will affect these issues could help policymakers in finding ways to mitigate the impacts, for instance, with relocation assistance in the event of floods, fires, or other climate-related events. In areas where climate change is expected to increase rainfall, local governments may want to improve bus shelters and provide paratransit for the elderly. As a final point, we want to highlight the importance of including all vulnerable populations in discussions of the disproportionate impacts of climate change. As with many people of color, Native Americans often belong to low-income groups and therefore face extra burdens associated with poverty. While we were not successful at engaging members of indigenous communities in this study, we feel that it is critical to do so in future work. The scientific data available for indigenous communities is often sparse, but increased research efforts should help fill gaps in our understanding.
Redefining Progress • Climate Change in California: Health, Economic and Equity Impacts • 83
CHAPTER 5: SYNTHESIS FOR POLICYMAKERS The implications of climate change will affect the lives of all Californians in the years to come, though the form and magnitude of these impacts are likely to differ across regions and demographic groups. The primary objective of this report is to determine the extent to which the major economic and health costs of climate change in California are disproportionately borne by low-income communities and people of color. Awareness of these distributional effects enables lawmakers to craft policies that best serve everyone. The goal of this chapter is to bring together the health, economic, and community components of the report in three ways. First, these separate strands of the analysis are integrated to clarify why and how low-income groups and people of color are especially hard hit by climate change. Next, the various impacts discussed throughout this report are organized by geographic region, to suggest a potentially efficient way of targeting state resources on these issues. Finally, some preliminary thoughts are presented on how policymakers can begin to address the unequal burdens faced by vulnerable communities.
Synthesis The chapters on economics and health analysis show how climate change will have disproportionate impacts on low-income communities and people of color. The causes include differential work hazards, existing structural and historic inequalities, close proximity to industrial and consumer pollution, and, most critically, differing access to resources for mitigation and adaptation. When considered together, the result of these various impacts suggests that low-income groups and people of color face greater economic and public health pressures resulting in “prosperity damage,” as elaborated on below, as well as in the economic analysis chapter.
Disproportionate Impacts and Climate Change Disproportionate effects of climate change fall into four primary health and economic categories: heat wave-related mortality, increases in ambient ozone, employment risk, and prices of basic necessities. Heat wave-related mortality: Climate change projections suggest a significant increase in the frequency and severity of heat waves in this century (Figure 2.5) and an accompanying increase in heat-induced illness and mortality. The projections of heat wave-related mortality for Los Angeles demonstrate that people of color will face higher rates of death than Whites, with Blacks having the highest rates of any race or ethnic group (Table 2.3 and Figure 2.6). Existing income disparities and race/ethnicity-based inequalities in health-care access (Figures 2.1 and 2.2, respectively) are major factors contributing to this higher level of risk. To moderate the impacts of heat waves, people will face rising expenditures for air-conditioning and heat-related ailments. Increases in ambient ozone: Unhealthy ozone levels do and will continue to pose health problems for Californians. Higher temperatures resulting from climate change are likely to increase ozone levels and the rate of hospital admissions for asthma. Such hospital

Redefining Progress • Climate Change in California: Health, Economic and Equity Impacts • 84
admissions already show substantial racial disparities, with Blacks, for example, three times more likely to be hospitalized for asthma-related health problems than Whites (Figure 2.10). Employment risk: Agriculture and tourism in California will likely suffer widely from climate change due to flooding (Figure 1.7 and 3.1), droughts (Figures 1.8 and 3.2) and other nontrivial concerns (Table 3.1). These sectors employ many low-income people of color. Periodic shocks and long-term capital-intensive adjustments, such as shifting cultivation areas in agriculture or building coastal infrastructure to cope with rising sea levels, are expected to reduce overall employment and undermine employment stability. Abrupt crop losses clearly would devastate farm workers. If important crop varieties can no longer be grown in the state, related agricultural jobs may be permanently lost. In California, the majority of agricultural labor, about 77%, is Hispanic (Figure 3.10). This labor force already faces significant challenges, as nearly 75% of agricultural workers in California have no health insurance and only 7% are covered by a government-funded program intended to serve low-income groups (Villarejo et al., 1999). Tourism is also vulnerable to climate change. The visitors industry is the third-largest employer in the California economy and the fifth-largest contributor to the gross state product. This industry relies heavily on people of color for labor in areas such as tourist accommodations, food preparation, and transportation (Figure 3.12). These workers may face shorter employment periods as winter tourism seasons shorten. Additionally, damages caused by extreme weather events, such as fires, could result in layoffs and wage cuts. Weather-dependent recreation such as skiing, boating, and fishing will likely see negative impacts, which may harm affiliated businesses and employees. Prices for basic necessities – water, food, and electricity: It is fairly certain that climate change will have a negative effect on water supply, electricity requirements, and agricultural productivity, resulting in increases in the cost of basic necessities. When the price of a basic commodity rises, low-income people are disproportionately affected because they spend a significantly greater share of their household budgets on such products—two to three times more, as a percentage of income, than the more affluent (Figure 3.8). Major differences in expenditures on necessities are evident among the different races/ethnicities, especially in the lowest income groups, with low-income Blacks having the highest expenditures for water and low-income Hispanics having the highest expenditures for food (Figure 3.9).
Existing Inequality and Climate Change The negative impacts of climate change on low-income communities and people of color are magnified by existing structural and historical inequalities. These inequalities especially affect health-care access, exposure to extreme weather events, dependence on public services (which may face cutbacks), and disease risks. Health-care access: Low-income communities and people of color are particularly susceptible to negative health impacts from climate change because they often lack health

Redefining Progress • Climate Change in California: Health, Economic and Equity Impacts • 85
insurance. Because of high premiums for private coverage and the role of employment status in the U.S. insurance system, health coverage tends to increase as income rises (Figure 2.1). Differences in health insurance coverage are also evident with regard to race and ethnicity (Figure 2.2); Hispanics are far more likely to be uninsured than other groups, even when income is held constant. Exposure to extreme weather events: Flood-related property damage and loss of life is well documented (FEMA, 1999). Drought-related increases in wildfires can also have direct, adverse economic impacts (e.g., property damage) and health effects (fire-related mortality and respiratory ailments). During an extreme weather event, wealthier people often bear the highest monetary loss, as their property tends to be more valuable. However, low-income people often face a far more difficult recovery process, as they typically lack sufficient disposable income to purchase life and property insurance. Also, low-income groups often live in poorer-quality housing and face income constraints in preparing for extreme weather. Risk of cutbacks in social programs: Increased damage to public infrastructure, as a result of extreme weather events, as well as massive investments in levees to protect coastal areas from rising sea levels, will likely drain state budgets. Public infrastructure is heavily dependent on state agencies and funding in California. Under these circumstances, government social assistance programs, on which many low-income people rely, are likely to face pressure for budget cuts. Water- and vector-borne diseases: The incidence of water- and vector-borne diseases such as encephalitis is expected to rise, although the role of public health infrastructure will affect the severity. If outbreaks occur, low-income individuals and communities of color will likely suffer greater impacts due to lack of health insurance and less awareness of government-funded intervention programs.
Prosperity Damage Disproportionate impacts from climate change and existing inequalities present real challenges to low-income communities and people of color. A useful framework for viewing these impacts is provided by the concept of “prosperity damage,” which we discussed in chapter 3. The global re-insurer Swiss Re uses this term to mean the “pronounced worsening of…development possibilities” (Swiss Re, 1994). Even in a highly developed economic system such as ours, where the risk of prosperity damage is relatively low, “certain communities will presumably never be able to make up for the losses they suffered…and the individual livelihoods [that] have been totally destroyed.” In the context of this report, unrecoverable losses to livelihood that low-income communities may face under climate change could well lead to such lasting prosperity damage. Causes include greater uncertainties with respect to stable employment and wages, rising prices for basic necessities, and the limited availability of low-cost health insurance. Lack of other forms of insurance such as property and disaster insurance also hinder these communities in recovering from the impacts of catastrophic losses.

Redefining Progress • Climate Change in California: Health, Economic and Equity Impacts • 86
Policy Implications This report does not purport to provide a set of full-fledged policy recommendations. Further discussions are required on responsibility for emissions and appropriate policy structure, and additional community outreach is needed. However, the conclusions drawn in this report do shed light on basic principles that ought to guide California’s policymakers in shaping climate change policies. In addition, this analysis provides limited, yet valuable, insight into local policy recommendations.
Key Regions Identifying geographically disproportionate impacts will help policymakers more efficiently utilize state resources in addressing climate change concerns. Policymakers and elected officials that represent regions within the state can especially benefit from a geographical breakdown. An emphasis on these geographic distinctions should not overshadow other disproportionate impacts that do not posses geographic properties. However, in some cases, the disproportionate impacts do have a clear geographic component, for example, Hispanic farmworkers in the Central Valley face specific adverse health and economic impacts due to climate change. The highest-priority regions from a geographic perspective have two specific attributes: (1) they contain significant populations of low-income people and people of color, and (2) they may experience well-understood, negative effects from climate change in either economic or public health terms. Four regions meet this profile:
• The top agricultural regions, including the San Joaquin/Central Valley (Fresno, Kern, Merced, San Joaquin, Stanislaus, and Tulare) and elsewhere (Monterey, Riverside, San Diego, and Ventura);
• The snow-dependent economies in the Sierra Nevada range, including the counties of Alpine, Calaveras, El Dorado, Mariposa, Mono, Sierra, and Tuolumne;
• The top ozone-polluted regions—the San Joaquin Valley and the South Coast, including the counties of El Dorado, Fresno, Kern, Kings, Los Angeles, Merced, Nevada, Riverside, Sacramento, San Bernardino, Tulare, and Ventura; and
• The four largest cities and their surrounding areas (San Francisco Bay Area, Los Angeles, San Diego, and San Jose)—to the extent that heat wave-related mortality results for Los Angeles apply to large cities across the state.
Additional potential regions of concern that this report does not focus on include the Bay Delta and a few coastal areas that contain significant vulnerable communities.
Emissions Focus, Near-Term Action, and Adaptation Assistance The analytical chapters, the community testimony chapter, and the above synthesis all point to a few clear policy directions that will help California prepare for climate change:
1) Focus on policies that reduce emissions in order to mitigate climate change impacts on California.

Redefining Progress • Climate Change in California: Health, Economic and Equity Impacts • 87
2) Act now; do not delay climate change policy development any further. 3) Provide adaptation assistance for low-income communities and people of color as
they face the impacts of climate change. Public policy choices over the next decade will determine whether California contributes to higher or lower global emissions scenarios. Climate change under a lower- emissions scenario means fewer and less severe negative impacts. Policymakers need to focus their efforts toward putting California on a path toward a lower-emissions scenario. For the sake of California’s economy and the health of its people, policies that focus on emissions reduction must be implemented now. The difference in climate impacts between the low- and high-emissions scenarios widens throughout the century. More immediate action by policymakers will result in greater emissions reductions and reduce the need for costly adaptation policies in the future. Public agencies will need to provide adaptation assistance to low-income groups and people of color to mitigate the greater health risks they face from climate change. There are fundamental equity issues at stake here, for just as the burden of climate change is disproportionate, so is the responsibility for climate change. While the most vulnerable communities face a greater share of the costs, affluent communities contribute more to the causes of climate change through greater energy use and greenhouse gas emissions. This relationship has been well established throughout the nation (Elliott et al., 2004). In addition to these preliminary policy recommendations, the chapters on health impacts and community testimony provide suggestions for further study. As the impacts of climate change and climate policies grow, there is an ongoing need for analysis of the effects on different communities. Chapter 2 identifies several area of research (Table 2.5), such as public transportation and international migration. This research will help develop adaptation policies to assist the most vulnerable Californians. However, these potential avenues of research must not prolong the development of effective climate change policy. Sufficient scientific evidence and understanding of the impacts already exist to guide public policy, and the time for action on reducing emissions is now. Waiting for further study to determine how deleterious the problem will become is not wise. Another far more challenging obstacle that extends beyond climate change is the need to address existing structural and historic inequality. Conclusion California is an economic, technological, and regulatory leader. It has a unique capacity to take the lead on cutting-edge climate change policy for the twenty-first century. Climate change in California will not be experienced equally, even though exposure to climate change will be widespread. Because of existing inequalities and disparities in health and economic factors, climate change is likely to hit the state’s most vulnerable communities and populations especially hard. The principles of climate justice that guide this report, and a clear understanding of the unequal impacts of climate change, must also guide policymakers as they set out to shape fair and efficient policies for all Californians.

Redefining Progress • Climate Change in California: Health, Economic and Equity Impacts • 88
REFERENCES ALA (American Lung Association). “State of the Air 2003.” 2003. American Lung Association, New York. ALA (American Lung Association). “Urban Air Pollution and Health Inequities: a Workshop Report.” 2001. Environmental Health Perspectives, 109 (suppl. 3): 357-374. Association of Bay Area Governments. “State of Estuary Report.” 2003. San Francisco Estuary Project, Association of Bay Area Governments, Oakland. ATS (American Thoracic Society) “Health Effects of Outdoor Air Pollution. Committee of the Environmental and Occupational Health Assembly of the American Thoracic Society.” 1996. American of Journal Respiratory and Critical Care Medicine, 153: 3-50. Aw, J. and Kleeman, M. J. “Evaluating the First-order Effect of Interannual Temperature Variability on Urban Air Pollution.” 2003. Journal of Geophysical Research, 108 (D12): 4365. Ayanian, J. Z., Weissman, J. S., Schneider, E. C., Ginsburg, J. A., and Zaslavsky, A. M. “Unmet Health Needs of Uninsured Adults in the United States”. 2000. Journal of the American Medical Association, 284(16):2061–2069. Balbus, J. and Wilson, M. “Human Health and Global Climate Change: A Review of Potential Impacts in the United States.” 2000. Pew Center on Global Climate Change, Arlington. Baker, D. W., Shapiro, M. F., and Schur, C. L. “Health Insurance and Access to Care for Symptomatic Conditions”. 2000. Archives of Internal Medicine, 160(9):1269–1274. Barba, J., Echavarria, C., Heinen, G., Hunsaker, D., Nunes D., Ramalingam, R., Kaduwela, A., Karperos, K., and Anderson, C. “Extreme Ozone Attainment Demonstration Plan–Draft.” 2004. San Joaquin Valley Unified Air Pollution Control District, Fresno. Bernard, S. M., Samet, J. M., Grambsch, A., Ebi, K.L. and Romieu, I. “The Potential Impacts of Climate Variability and Change on Air Pollution-related Health Effects in the United States.” 2001. Environmental Health Perspectives, 109 (suppl. 2): 199-209. Bloomfield, J., Koteen, L., Eichler, T., Tonne, C., Young, R., Poulshock, H. and Sosler, A. “Hot Prospects: The Potential Impacts of Global Warming on Los Angeles and the Southland.” 2001. Environmental Defense, New York. BLS (Bureau of Labor Statistics). “Consumer Expenditure Survey”. 2002. Bureau of Labor Statistics, Washington DC.

Redefining Progress • Climate Change in California: Health, Economic and Equity Impacts • 89
Bowen S. G. and Francy D. B. “Surveillance.” 1980. St. Louis Encephalitis. American Public Health Association, Washington DC. Brown, R.E., Ponce N. and Rice T. “The State of Health Insurance in California: Recent Trends, Future Prospects.” 2002. UCLA Center for Health Policy Research, Los Angeles. Bullard, R. “Directory of People of Color Environmental Groups”. 2000. Charles Stewart Mott Foundation, Flint. CARB (California Air Resources Board). Non-attainment designations map, Figure 2.7A. (http://www.arb.ca.gov/desig/adm/s_classif.pdf accessed: Sep. 2004). CARB (California Air Resources Board). Air basins delineations map, Figure 2.7B. (http://www.arb.ca.gov/ei/maps/statemap/abmap.htm accessed: Sep. 2004) CARB (California Air Resources Board). Air Quality Management Information System; Annual Ozone Summaries for Selected Regions 2003. 2004a. (http://www.arb.ca.gov/adam/cgi-bin/db2www/ozonereport_annual.d2w/start accessed: September 2004). CARB (California Air Resources Board). “Initial Statement of Reasons for Proposed Rulemaking, Public Hearing to Consider Adoption of Regulations to Control Greenhouse Gas Emissions from Motor Vehicles.” 2004b. Staff Report. Mobile Source Control Division, Sacramento. CDF (California Department of Finance). California Statistical Abstract. 2002. California Department of Finance, Economic Research Unit, Sacramento. CDFG (California Department of Fish and Game). Turek, S., Rode, M., Cox, B., Heise, G., Sinnen, W., Reese, C., Borok, S., Hampton, M., and Chun, C. “September 2002 Klamath River Fish Kill: Final Analysis of Contributing Factors and Impacts.” 2004. California Department of Fish and Game, Sacramento. CDFA (California Department of Food and Agriculture). California Dairy 2001, Statistics and Trends. 2002a. California Department of Food and Agriculture, Sacramento. CDFA (California Department of Food and Agriculture). California Agricultural Statistical Review. 2002b. California Department of Food and Agriculture, Sacramento. CDFA (California Department of Food and Agriculture). “CDFA Releases Crop Production Forecast for July.” 2004a. News Release. California Department of Food and Agriculture, Sacramento.
Redefining Progress • Climate Change in California: Health, Economic and Equity Impacts • 90
CDFA (California Department of Food and Agriculture). “August Crop Production.” 2004b. News Release. California Department of Food and Agriculture, Sacramento. CDFA (California Department of Food and Agriculture). Pink Bollwarm Program Homepage. 2004c. http://www.cdfa.ca.gov/phpps/ipc/pinkbollworm/pbw_hp.htm. CDFA (California Department of Food and Agriculture). “Protecting California from Biological Pollution.” 2004d. California Department of Food and Agriculture, Sacramento. CDFF (California Department of Forestry and Fire Protection). “20 Largest California Wildland Fires.” 2002. California Department of Forestry and Fire Protection, Sacramento. CDFF (California Department of Forestry and Fire Protection). “Southern California Beetle Infestation.” 2004a. California Department of Forestry and Fire Protection, Sacramento. CDFF (California Department of Forestry and Fire Protection). “Commercial Timberland Acres Burned within CDF Jurisdiction.” 2004b. California Department of Forestry and Fire Protection, Sacramento. CDFF (California Department of Forestry and Fire Protection). “CDF Jurisdiction: Fires, Acres and Dollar Damage.” 2004c. California Department of Forestry and Fire Protection, Sacramento. CDHS (California Department of Health Services). “California County Asthma Hospitalization Chart Book.” 2000. Environmental Health Investigations Branch, California Department of Health Services. CDWR (California Department of Water Resources). “The California Water Plan Update.” 1994. Main, B., Talley, M., Dyer, A., Li, X., Goettl, G., and Pierce, J., eds. Bulletin 160-98. California Department of Water Resources, Sacramento. CDWR (California Department of Water Resources). “Final Report of the Flood Emergency Action Team.” 1997. California Department of Water Resources, Sacramento. CDWR (California Department of Water Resources). “Preparing for California’s Next Drought, Changes Since 1987–92.” 2000. California Department of Water Resources, Sacramento. CDWR (California Department of Water Resources). “California’s Groundwater Update.” 2003. Bulletin 118. California Department of Water Resources, Sacramento. CDT (California Division of Tourism). “Tourism and the State’s Economy.” 2003. California Division of Tourism, Sacramento.
Redefining Progress • Climate Change in California: Health, Economic and Equity Impacts • 91
CDT (California Division of Tourism). “California Fast Facts.” 2004. California Division of Tourism, Sacramento. CEC (California Energy Commission). “Global Climate Change and California: Potential Implications for Ecosystems, Health, and the Economy.” 2003a. Publication 500-03-058CF. California Energy Commission, Sacramento. CEC (California Energy Commission). “Energy Efficiency and Conservation: Trends and Policy Issues.” 2003b. Publication 100-03-008F. California Energy Commission, Sacramento. CEC (California Energy Commission). “2003 Net System Power Calculations.” 2004a. Publication 300-04-001R. California Energy Commission, Sacramento. CEC (California Energy Commission). “2004 Database of California Power Plants.” 2004b. California Energy Commission, Sacramento. CFBF (California Farm Bureau Federation). “Recovery under Way for Southland Fire Victims.” Agriculture News Alert. 2003. California Farm Bureau Federation, Sacramento. CFWC (California Farm Water Coalition). “Economic Impact Study-Water Shortages.” 1995. California Farm Water Coalition, Sacramento. CHIS (California Health Interview Survey). “ask CHIS 2.0, online database of CHIS 2001 data.” 2001. Source for Figures 2.1, 2.2, and 2.3. (http://www.chis.ucla.edu/). COES (California Office of Emergency Services). “Upper Jones Levee Break.” 2004. (http://wwwowe.water.ca.gov/newsreleases/2004/06-16-04floodpics.html accessed: September 2004). CRAG (California Regional Assessment Group). Wilkinson, R., Clarke, K., Goodchild, M., Reichman, J. and Dozier, J. “Preparing for a Changing Climate: The Potential Consequences of Climate Variability and Change for California.” 2002. US Global Change Research Program, Washington, DC. Coye, M. J. and Goldoft, M. “Microbiological Contamination of the Ocean and Human Health.” 1989. New Jersey Medicine, 86:533–538. Davis, R.E., Knappenberger, P.C., Micheals, P.J., and Novicoff, W.M. “Changing Heat-Related Mortality in the United States.” 2003. Environmental Health Perspectives, 111:1712–1718. Deuel, H. P. Guthrie, P., Moody, W., Deck, L., Lange, S., Hameed, F., Castle, J., and Mearns, L. “Potential Impacts of Climate Change on Air Quality and Human Health.”

Redefining Progress • Climate Change in California: Health, Economic and Equity Impacts • 92
1999. Air & Waste Management Association (92nd Annual Meeting and Exhibition), St. Louis. DOE (Department of Energy). “California Wildfires—Energy Infrastructure Impacts.” 2003. DOE Office of Energy Assurance, Washington DC. Elliott, M., Winslow, M., and Hoerner, A. “African Americans and Climate Change: An Unequal Burden.” 2004. Congressional Black Caucus Foundation, Washington DC. EDD (California Employment Development Department). “Occupational Employment (2002) and Wage (2003) Data, Occupational Employment Statistics Survey Results.” 2003. California Employment Development Department, Sacramento. (http://www.calmis.cahwnet.gov/file/occup$/oeswages/Cal$oes2003.htm. accessed: September 2004). Engelthaler, D. M., Mosley, D .E., Cheek, J. E., Levy, C. E., Komatsu, K. K., Ettestad, P., Davis, T., Tanda, D. T., Miller, L., Frampton, J. W., Porter, R., Bryan, R. T. “Climatic and Environmental Patterns Associated with Hantavirus Pulmonary Syndrome, Four Corners Region, United States.” 1999. Emerging Infectious Diseases. 5: 87–94. EIA (Energy Information Administration). “Trends in Residential Air-Conditioning Usage from 1978 to 1997.” 2000. Energy Information Administration, Washington DC. EJCCI (Environmental Justice and Climate Change Initiative). 10 Principles for Just Climate Change Policies in the U.S.” 2004. (http://www.ejcc.org/ejcc10short_usa.pdf. accessed: October 2004) Epstein, P. R., “Climate Change and Infectious Disease: Stormy Weather Ahead?” 2002. Epidemiology, 13 (4): 384-93. Epstein, P. R. and Rogers, C. “Inside the Greenhouse: The Impacts of CO2 and Climate Change on Public Health in the Inner City.” 2004. Center for Health and the Global Environment, Boston. FEMA (Federal Emergency Management Agency). “El Nino: Gone but Not Forgotten.” 1999. FEMA Region IX, Oakland. FEMA (Federal Emergency Management Agency). “Policy Statistics by State.” (table) 2003. FEMA, National Flood Insurance Program, Washington DC. UCS (Union of Concerned Scientists). Field, C., Daily, G., Davis, W., Gaines, S., Matson, P., Melack, J., and Miller, N. “Confronting Climate Change in California, Ecological Impacts on the Golden State.” 1999. UCS Publications, Cambridge. Fothergill, A. and Peek, L. A., “Poverty and Disasters in the United States: A Review of Recent Sociological Findings.” 2004. Natural Hazards Journal, 32(1): 89–110.

Redefining Progress • Climate Change in California: Health, Economic and Equity Impacts • 93
Fried, J. S., Torn, M. S. and Mills, E. “The Impact of Climate Change on Wildfire Severity: A Regional Forecast for Northern California.” 2004. Climate Change, 64: 169–191. Gauderman, W. J., Avol, E., Gilliland, F., Vora, H., Thomas, D., Berhane, K., McConnell, R., Kuenzli, N., Lurmann, F., Rappaport, E., Margolis, H., Bates, D. and Peters, J. “The Effect of Air Pollution on Lung Development from 10 to 18 Years of Age.” 2004. The New England Journal of Medicine, 351(11): 1057–1067. Gilles, H. M. “Epidemiology of Malaria.” 1993. Essential Malariology, p.124–163. Edward Arnold Division of Hodder & Stoughton, London. Glass, G. E., Cheek, J. E., Patz, J. A., Shields, T. M., Doyle, T. J., Thoroughman, D. A., Hunt, D. K., Enscore, R. E., Gage, K. L., Irland, C., Peters, C. J., and Bryan, R. “Using Remotely Sensed Data to Identify Areas at Risk for Hantavirus Pulmonary Syndrome.” 2000. Emerging Infectious Disease, 6: 238–247. Gleick, P. H. and Nash, L., The Societal and Environmental Costs of the Continuing California Drought. 1991. Pacific Institute for Studies in Development, Environment and Security, Berkeley. Goldberg, M. S., Burnett, R. T., Brook, J., Bailar, J. C., Valois, M. F. and Vincent, R. “Associations between Daily Cause-Specific Mortality and Concentrations of Ground-Level Ozone in Montreal, Quebec.” 2001. American Journal of Epidemiology, 154 (9): 817-826. Gordon, C., Cooper, C., Senior, C. A., Banks, H., Gregory, J. M., Johns, T. C., Mitchell, J. F. B. and Wood, R. A. “The Simulation of SST, Sea Ice Extents and Ocean Heat Transports in a Version of the Hadley Centre Coupled Model without Flux Adjustments.” 2000. Climate Dynamic, 16: 147-168. Greenough, G., McGeehin, M., Bernard, S. M., Trtanj, J., Riad, J. and Engelberg, D. “The Potential Impacts of Climate Variability and Change on Health Impacts of Extreme Weather Events in the United States.” 2001. Environmental Health Perspectives, 109: 191–198. Hall, D. C. and Howarth, R. B., eds. “The Long-Term Economics of Climate Change: Beyond A Doubling of Greenhouse Gas Concentrations.” 2001. Elsevier, Amsterdam. Hardy, J. “Susceptibility and resistance of vector mosquitoes.” 1988. The Arboviruses: Epidemiology and Ecology, Volume 1, p.87–126. CRC Press, Boca Raton. Hayhoe, K., Cayan, D., Field, C. B., Frumhoff, P. C., Maurer, E. P., Miller, N. L., Moser, S. C., Schneider, S. H., Cahill, K. N., Cleland, E. E., Dale, L., Drapek, R. , Hanemann, R. M., Kalkstein, L. S., Lenihan, J. , Lunch, C. K., Neilson, R. P., Sheridan, S. C. and
Redefining Progress • Climate Change in California: Health, Economic and Equity Impacts • 94
Verville, J. H. “Emissions Pathways, Climate Change, and Impacts on California.” 2004a. Proceedings of the National Academy of Sciences, 101(34): 12422-12427. Hayhoe, K., Kalkstein, L., Moser, S., and Miller, N. “Rising Heat and Risks to Human Health: Technical Appendix.” 2004b. Union of Concerned Scientists Publications, Cambridge. Holloway, T., Fiore, A. and Hastings, M. G. “Intercontinental Transport of Air Pollution: Will Emerging Science Lead to a New Hemispheric Treaty?” 2003. Environmental Science & Technology, 37: 4535–4542. IOM (Institute of Medicine). “Health Insurance is a Family Matter.” 2002. National Academy Press, Washington, DC. IOM (Institute of Medicine). “Coverage Matters: Insurance and Health Care.” 2001. National Academy Press, Washington, DC. III (Insurance Information Institute). “Catastrophic Wildland Fires in the United States, 1970-2003.” 2004. Insurance Information Institute, New York. (http://www.iii.org/media/facts/statsbyissue/catastrophes/?table_sort_735775=6. IPCC (Intergovernmental Panel on Climate Change). “Climate Change 2001, IPCC Third Assessment Report, Working Group I, the Scientific Basis.” 2001a. (http://www.grida.no/climate/ipcc_tar/wg1/index.htm) IPCC (Intergovernmental Panel on Climate Change). “Climate Change 2001, Third Assessment Report, Working Group II, Impacts, Adaptation, and Vulnerability.” 2001b. (http://www.grida.no/climate/ipcc_tar/wg2/index.htm) IPCC (Intergovernmental Panel on Climate Change). “Climate Change 2001, Third Assessment Report, Working Group III, ‘Mitigation.” 2001c. (http://www.grida.no/climate/ipcc_tar/wg3/index.htm) IPCC (Intergovernmental Panel on Climate Change). “Climate Change 1995, Impacts, Adaptations and Mitigation of Climate Change: Scientific Technical Analysis.” 1996. p. 58. Cambridge University Press, Cambridge. Jaffe, D., McKendry, I., Anderson, T., and Price, H. “Six ‘New’ Episodes of Transpacific Transport of Air Pollutants.” 2003. Atmospheric Environment, 37: 391–404. Kalkstein, L. S. and Greene, J. S. “An Evaluation of Climate/Mortality Relationships in Large U.S. Cities and the Possible Impacts of Climate Change.” 1997. Environmental Health Perspectives, 105: 84–93. Kalkstein, L. S. and Smoyer, K. E. “The Impact of Climate Change on Human Health: Some International Implications.” 1993. Experientia, 49: 969–979.

Redefining Progress • Climate Change in California: Health, Economic and Equity Impacts • 95
Kay, B. H., Fanning, I. D., and Mottram, P. “Rearing Temperature Influences Flavivirus Vector Competence of Mosquitoes.” 1989. Medical and Veterinary Entomology, 3: 415–422. Kelly, N. A. and Gunst, R. F. “Response of Ozone Changes in Hydrocarbon and Nitrogen Oxide Concentrations in Outdoor Smog Chambers filled with Los Angeles Air.” 1990. Atmospheric Environment, 24 (12): 2991–3005. Knox, J. B. and Foley-Scheuring, A. Global Climate Change and California, Potential Impacts and Responses. 1991. University of California Press, Berkeley. Kunkel, K. E., Pielke, R. A. and Changnon, S. A. “Temporal Fluctuations in Weather and Climate Extremes that Cause Economic and Human Health Impacts: A Review.” 1999. Bulletin of the American Meteorological Society, 80: 1077–1098. Landsberg H. E. The Urban Climate. 1981. Academic Press, New York. Logan, J. A. and Powell, J. A., “Ghost Forests, Global Warming and the Mountain Pine Beetle.” 2001. American Entomologist, Fall: 160–173. McConnell, R., Berhane, K., Gilliland, F., London, S. J., Islam, T., Gauderman, W. J., Avol, E., Margolis, H. G. and Peters, J. M. “Asthma in Exercising Children Exposed to Ozone: a Cohort Study.” 2002. The Lancet, 359: 386–391. McGeehin, M. A. and Mirabelli, M. “The Potential Impacts of Climate Variability and Change on Temperature-related Morbidity and Mortality in the United States.” 2001. Environmental Health Perspectives, 109: 185–189. Meng, Y.Y., Babey, S.H., Malcolm, E., Brown, E.R., and Chawla, N. “Asthma in California: Findings from the 2001 California Health Interview Survey.” 2003. UCLA Center for Health Policy Research, Los Angeles. Miller, A. and Sisco, C. “Ten Actions of Climate Justice Policies.” Environmental Justice and Climate Change Initiative. 2002. Second National People of Color Environmental Leadership Summit—Summit II Resource Paper Series. (http://www.ejrc.cau.edu/summit2/SummIIClimateJustice.pdf. accessed: November 2004) Miller, A. K., Sethi, G., and Wolff, G. H. “What’s Fair? Consumers and Climate Change.” 2000. Redefining Progress. San Francisco, CA. Monath, T. P. and Tsai, T. F. “St Louis encephalitis: Lessons from the Last Decade.” 1987. American Journal of Tropical Medicine and Hygiene, 37: 40–59.

Redefining Progress • Climate Change in California: Health, Economic and Equity Impacts • 96
Morris, R. E., Gery, M. S., Liu, M. K., Moore, G. E., Daly, C., and Greenfield, S. M. “Sensitivity of a Regional Oxidant Model to Variations in Climate Parameters.” 1989. The Potential Impacts of Global Climate Change on the United States, Appendix F. EPA Office of Policy, Planning and Evaluation, Washington DC. MSNBC News. “Final Victim Sought in Mudslides’ Path.” 2004. Associated Press. December 30, 2004. Mutters, R. G. and Soret, S., “Statewide Potential Crop Yields Loss from Ozone Exposure.” 1998. Contract No. 94-345. California Air Resources Board, Sacramento. Nakicenovic, N., Davison, O., Davis, G., Grubler, A., Kram, T., La Rovere, E.L., Metz, B., Morita, T., Pepper, W., Pitcher, H., Sankovski, A., Shukla, P., Swart, R., Watson, R. and Dadi, Z. “IPCC Special Report on Emissions Scenarios.” 2000. Cambridge University Press, Cambridge. NPCA (National Parks Conservation Association). Ayers, H. and Oakes, J. “Code Red: America’s Five Most Polluted National Parks.” 2003a. National Parks Conservation Association, Washington DC. NPCA (National Parks Conservation Association). Garrett, B. and Wu, F. Economic Impacts of Visitors Spending in California’s National Parks, 2003b. National Parks Conservation Association. National Park Service. “10 Most Visited Parks in 2003.” (Table) 2004. National Park Service, Washington DC. http://www.infoplease.com/ipa/A0004743.html. NRDC (National Resources Defense Council). “Heat Advisory: How Global Warming Causes More Bad Air Days.” 2004. National Resources Defense Council, New York. O´Neill, M. S., Loomis, D. and Borja-Aburto, V. H. “Ozone, Area Social Conditions, and Mortality in Mexico City.” 2004. Environmental Research, 94 (3): 234–242. OSHPD (Office of Statewide Health Planning and Development). “Racial and Ethnic Disparities in Healthcare in California.” 2003. California Fact Book. Office of Statewide Health Planning and Development, Sacramento. Patz, J. A., McGeehin, M. A., Bernard, S. M., Ebi, K. L., Epstein, P. R., Grambsch, A., Gubler, D. J., Reiter P., Romieu I., Rose, J. B., Samet, J. M. and Trtanj, J. “The Potential Health Impacts of Climate Variability and Change for the United States: Executive Summary of the Report of the Health Sector of the U.S. National Assessment. 2000. Environmental Health Perspectives. 108 (4): 367–376. Penner, J., Connell, P., Wuebbles, D., and Covey, C. “Climate Change and Its Interaction with Air Chemistry: Perspectives and Research Needs.” 1989. The Potential Impacts of Global Climate Change on the United States, Appendix F. EPA Office of Policy, Planning and Evaluation, Washington DC.
Redefining Progress • Climate Change in California: Health, Economic and Equity Impacts • 97
Pope, V., Gallani, M., Rowntree, P. and Stratton, R. “The Impact of New Physical Parameterisations in the Hadley Centre Climate Model: HadAM3.” 2000. Climate Dynamics, 16: 123-146. PSR (Physicians for Social Responsibility). “Degrees of Danger—How Smarter Energy Choices Can Protect Our Health in California.” 2003. Ray, N. F., Thamer M., Fadillioglu, B. and Gergen, P. J. “Race, Income, Urbanicity, and Asthma Hospitalization in California, A Small Area Analysis.” 1998. Chest, 113 (5): 1277–1284. Reeves, W. C., Hardy, J. L., Reisen, W. K. and Milby, M. M. “Potential Effect of Global Warming on Mosquito-Borne arboviruses.” 1994. Journal of Medical Entomology, 31: 323–332. Reisen, W. K, Lothrop, H. D. and Hardy, J. L. “Bionomics of Culex tarsalis (Diptera: Culicidae) in relation to arbovirus Transmission in Southeastern California.” 1995. Journal of Medical Entomology, 32: 316–327. Reiter, P. “Global Warming and Mosquito-Borne Disease in USA.” 1996. The Lancet, 348: 622. Reiter, P. “From Shakespeare to Defoe: Malaria in England in the Little Ice Age.” 2000. Emerging Infectious Disease, 6: 1–11. Runyan, D. “California Travel Impacts by County, 1992-2002, 2003 Preliminary State Estimates.” 2004. Prepared for California Division of Tourism by Dean Runyan Associates, Portland. Source of Figures 3.3 and 3.4. (http://www.deanrunyan.com/pdf/ca03.pdf) San Diego Union-Tribune. “San Diego County Firestorms Aftermath: Crop losses estimated at $28 million.” 2003. November 11. San Jose Mercury News (Deborah Lonse). “Fire Could Bring Rise in Insurance Premiums.” October 29, 2003. Schmaljohn, C. and Hjelle, B. 1997. “Hantavirus: a global disease problem.” Emerging Infectious Diseases, 3: 95-104. Schneider, S. H. Global Warming: Are We Entering the Greenhouse Century? 1990. Vintage Books, New York. Schoen, C. and Des Roches, C. “Uninsured and Unstably Insured: The Importance of Continuous Insurance Coverage”. 2000. Health Services Research, 35(1): 187–206.

Redefining Progress • Climate Change in California: Health, Economic and Equity Impacts • 98
Semenza, J. C., Rubin, C. H. and Falter, K. H. “Heat-Related Deaths during the July 1995 Heat Wave in Chicago.” 1996. New England Journal of Medicine, 335: 84-90. Shope, R. E., “Arbovirus Related encephalitis.” 1980. Yale Journal of Biology and Medicine, 53: 93-99. Stockman, J., Von Behren, J., Shaikh, N., and Kreutzer, R. “California Asthma Facts.” 2003. Environmental Health Investigations Branch, California Department of Health Services. Swiss Re. “Global Warming—Element of Risk.” 1994. Swiss Reinsurance Company, Zurich. Tauxe, R. V. “Emerging Foodborne Diseases: An Evolving Public Health Challenge.” 1997. Emerging Infectious Diseases, 3: 425–434. UCS (Union of Concerned Scientists). “Choosing Our Future, Climate Change in California—Rising Heat and Risks to Human Health.” 2004. Union of Concerned Scientists, Berkeley. http://www.ucsusa.org/news/press_release.cfm?newsID=420. USBR (United States Bureau of Reclamation). “The Role of Hydropower Development in the U.S. Energy Equation.” 2004. United States Bureau of Reclamation, Washington DC. USCB (United States Census Bureau). “Statistical Abstract of the United States: 2000.” 2001. United States Census Bureau, Washington DC. USCB (United States Census Bureau). “State and County QuickFacts.” 2000. United States Census Bureau, Washington DC. USCCSP (United States Climate Change Science Program). “Our Changing Planet.” 2004. United States Climate Change Science Program, Washington DC. USDA (United States Department of Agriculture). Agricultural Research Service, “Heat Waves Forecasts Could Help Save Cattle.” 1997. USDA Agricultural Research Service, Washington DC. May 30. USEPA (United States Environmental Protection Agency). “The Potential Impacts of Global Climate Change on the United States: Report to Congress.” 1989. Report EPA-230-05-89-058, Washington DC. USEPA (United States Environmental Protection Agency). “Air Quality Criteria for Ozone and Related Photochemical Oxidants.” 1996. Report EPA/600/p-93/004-a-cF. EPA Office of Research and Development, Washington DC.

Redefining Progress • Climate Change in California: Health, Economic and Equity Impacts • 99
USEPA (United States Environmental Protection Agency). “Climate Change and California.” 1997. Report 230-F-97-008e. Environmental Protection Agency, Washington DC. USEPA (United States Environmental Protection Agency). “Action Plan for Beaches and Recreational Waters.” 1999. Report 600/R-98/079. EPA Office of Research and Development, Washington DC. USEPA (United States Environmental Protection Agency). “Inside the Greenhouse, Summer 2001: Heat Island Reduction Initiative.” 2001. EPA-430-N-01-002. Source for Figure 2.4: Urban Heat Island Temperature Profile (http://www.epa.gov/globalwarming/greenhouse/greenhouse14/reduction.html) USEPA (United States Environmental Protection Agency). 2004. Environmental Justice Definition. (http://www.epa.gov/compliance/environmentaljustice accessed: October, 2004) USGS (United States Geological Survey). “El Niño Sea-Level Rise Wreaks Havoc in California's San Francisco Bay Region.” 2000. Fact Sheet 175-99. United States Geological Survey, Washington DC. Villarejo, D., Lighthall, D., Williams, D., Souter, A., Mines, R., Bade, B., Samuels, S., and McCurdy, S.A. “Suffering in Silence: A Report on the Health of California’s Agricultural Workers.” 1999. California Institute for Rural Studies. Washington, W., Weatherly, J., Meehl, G., Semtner, A., Bettge, T., Craig, A., Strand, W., Arblaster, J., Wayland, V., James, R. and Zhang, Y. “Parallel climate model (PCM) control and transient simulations.” 2000. Climate Dynamics, 16: 755-774. Wenzel, R. P. “A New Hantavirus Infection in North America.” 1994. New England Journal of Medicine, 330: 1004–1005. WHO (World Health Organization). “Potential Health Impacts of Climatic Change.” 1990. WHO Taskgroup, Geneva. (http://www.ciesin.org/docs/001-007/001-007.html). Wine Institute. “California Wine has $45.5 Billion Economic Impact on the State.” News Release. 2004. Wine Institute, San Francisco.

Redefining Progress • Climate Change in California: Health, Economic and Equity Impacts • 100
APPENDIX A. Mean Annual Heat-Related Deaths in Los Angeles A comparison of observed heat-related mortality rates during the decade 1989-1998 with projected future mortality rates during the 2050s and 2090s as calculated by the PCM and HadCM3 climate models for the SRES high (A1fi) and low (B1) emission scenarios. The proportions given in each scenario are deaths per 100,000 people in Los Angeles County recorded by the 2000 Census of the Population. The population figures in the bottom row exclude people who identified as more than one race.
Mean annual heat-related deaths, Los Angeles MEAN ANNUAL
MODEL WHITE ASIAN BLACK HISPACTUAL 1989-1998 Deaths (per year) 90 19 50 38 Deaths per 100,000 relative to all races 1.42 0.79 2.60 0.42PCM 2050s high (A1) Deaths (per year) 414 63 141 67 Deaths per 100,000 relative to all races 1.88 0.75 2.11 0.21PCM 2050s low (B1) Deaths (per year) 165 28 65 36 Relative mortality rate (%) 1.75 0.78 2.26 0.27PCM 2090s high (A1) Deaths (per year) 630 103 271 200 Deaths per 100,000 relative to all races 1.63 0.70 2.30 0.36PCM 2090s low (B1) Deaths (per year) 238 42 109 75 Deaths per 100,000 relative to all races 1.60 0.74 2.40 0.35Hadley 2050s high (A1) Deaths (per year) 269 50 134 110 Deaths per 100,000 relative to all races 1.49 0.73 2.44 0.43Hadley 2050s low (B1) Deaths (per year) 213 40 107 86 Deaths per 100,000 relative to all races 1.49 0.74 2.46 0.42Hadley 2090s high (A1) Deaths (per year) 1029 168 461 407 Deaths per 100,000 relative to all races 1.55 0.67 2.29 0.43Hadley 2090s low1 (B1) Deaths (per year) 422 71 189 145 Deaths per 100,000 relative to all races 1.59 0.70 2.34 0.38Population by Race, 2000 Population (per 100,000) 29.6 11.25 9.01 42.42 The algorithms used for the purpose of this analysis are: Whites: 78.80 + 0.604 A + 1.51 S Asians: 6.32 + 0.108 A + 0.147 S Blacks: 10.91 + 0.157 A + 0.345 S Hispanics: 8.80 + 0.540 A + 0.108 S
where A = maximum apparent temperature, S = day in sequence (May 15 = 1, June 15 = 31, etc.). These algorithms only work beyond apparent temperature threshold for LA.

Redefining Progress • Climate Change in California: Health, Economic and Equity Impacts • 101
B. Temperature Projections by Ethnicity, Income and Poverty The below tables are temperature projections by ethnicity, per capita income and federal poverty levels for A1 and B1 emission scenarios. They suggest a trend in temperature change by income. However, the problem is that temperature change is fairly well-distributed, not a lot of spatial variations. While temperature changes are relatively well-distributed (although with some suggestion of larger increases for lesser-income areas), the impacts are not—which is important.
Temperature change by poverty level (census tract) A1 B1
% poverty 2010-2039 2040-2069 2070-2099 2010-2039 2040-2069 2070-2099 0-10 3.63 8.04 13 3.11 5.17 7.4210 to 20 3.82 8.43 13.22 3.32 5.39 7.6820-30 3.90 8.56 13.38 3.39 5.45 7.7730-40 3.97 8.66 13.48 3.46 5.50 7.8240-60 4.11 8.93 13.94 3.55 5.73 8.1960-100 4.09 8.88 13.91 3.46 5.63 8.11Consistent pattern observed in %poverty table – Census tracts with higher poverty levels experience higher temperatures for both scenarios.
Temperature Change by Income (census tract) A1 B1
income 2010-2039 2040-2069 2070-2099 2010-2039 2040-2069 2070-2099 0-20 3.934591 8.579103 13.31529 3.45334 5.403542 7.67756720-40 3.936296 8.630521 13.48403 3.428742 5.506611 7.83014140-60 3.819932 8.415263 13.20669 3.310679 5.387015 7.67947160-80 3.595029 7.975444 12.63724 3.065882 5.137689 7.38979380-100 3.550895 7.862365 12.46027 3.015539 5.055504 7.292512100-120 3.455445 7.673138 12.18229 2.924872 4.920497 7.115768120-140 3.392989 7.547835 12.03304 2.846502 4.860552 7.058949140-160 3.410824 7.575376 12.17545 2.786741 4.933166 7.234898160-180 3.483976 7.711282 12.21156 2.964503 4.944566 7.143625180-200 3.262139 7.282461 11.69727 2.672255 4.680601 6.875466Income table shows a consistent pattern of low-income groups experiencing higher temp.s for both scenarios.
Temperature Change by Race (current census tract data) A1 B1 2010-2039 2040-2069 2070-2099 2010-2039 2040-2069 2070-2099
Native Americans 3.93 8.65 13.64 3.37 5.60 7.99White Non Hispanic 3.76 8.31 13.13 3.22 5.37 7.68Hispanic 3.82 8.37 13.05 3.34 5.30 7.54Black 3.69 8.15 12.80 3.19 5.20 7.43Asian 3.59 7.93 12.55 3.05 5.10 7.35Most affected = Native AmericansSecond most affected group=Hispanics in 2010-2039 period for A1 and B1 scenario. Alternatesbetween Hispanics and White Non-Hispanics in subsequent periods.

Redefining Progress • Climate Change in California: Health, Economic and Equity Impacts • 102
C. Demographics of Environmental Justice Leader Survey Responses Organization What racial/ethnic group
comprises the majority of your group's constituents or the community you represent?
Please check the item(s) below that accurately describes the constituent groups you serve or communities you represent.
American Lung Association of Central California
White/Caucasian - 40to45% African American/Black - 8%, Latino - 40 to 65% Native American/Indian - 3%, Asian/Pacific Islander - 15-20% Native Hawaiian - very small. These are statistics for the entire Central Valley. The numbers will vary from community to community. Thailand and Laos
Low income Middle income Urban Rural Coalition
Asian Health Services Asian/Pacific Islander Low income Urban
Bayview Hunters Point Community Advocates
African American/Black Asian
Low income Urban
California League of Conservation Voters
Latino Low income Middle income Urban Rural
Chinese Progressive Association Asian/Pacific Islander Low income Environmental Justice and Health Union
- -
Esparanza Community Housing Corporation
African American/Black -28%, Latin American - 74%
Low income Urban
West County Toxics Coalition African American/Black Latino
Low income Urban
Pacoima Beautiful Latino Low income American Lung Association of Central Valley
African American/Black Latino
Low income Middle income Urban Rural Coalition
Coalition for West Oakland Revitalization
African American/Black Low income Urban
Community Toolbox for Children's Environmental
African American/Black Latino Native American/Indian Asian/Pacific Islander Native Hawaiian Multi-ethnic
Low income Urban Rural Church-based
Communities for a Better Environment (CBE)
African American/Black Latino Multi-ethnic
Low income
Coalition for West Oakland Revitalization
African American/Black Low income Urban
Center for Energy Efficiency and Renewable Technologies
Latino Low income Middle income

Redefining Progress • Climate Change in California: Health, Economic and Equity Impacts • 103
Rural Asian Immigrant Women Advocates
Asian/Pacific Islander Low income
Cultural Conservancy Latino Native American/Indian Multi-ethnic
Low income Urban Rural Reservation Coalition
Labor/Community Strategy Center and Bus Riders Union
African American/Black Latino Asian/Pacific Islander
Low income Urban
Latino Issues Forum Latino Low income Rural
Greenaction African American/Black Latino
Low income Urban Rural Church-based Coalition
Indian Children United Against Global Warming
Latino Native American/Indian
Low income Rural Reservation
Intertribal Council on Utility Policy, ICLEI
Multi-ethnic Middle income Urban
Just Transition Alliance Multi-ethnic Low income Urban Rural Reservation
West Oakland Environmental Indicators Project
African American/Black Low income Urban
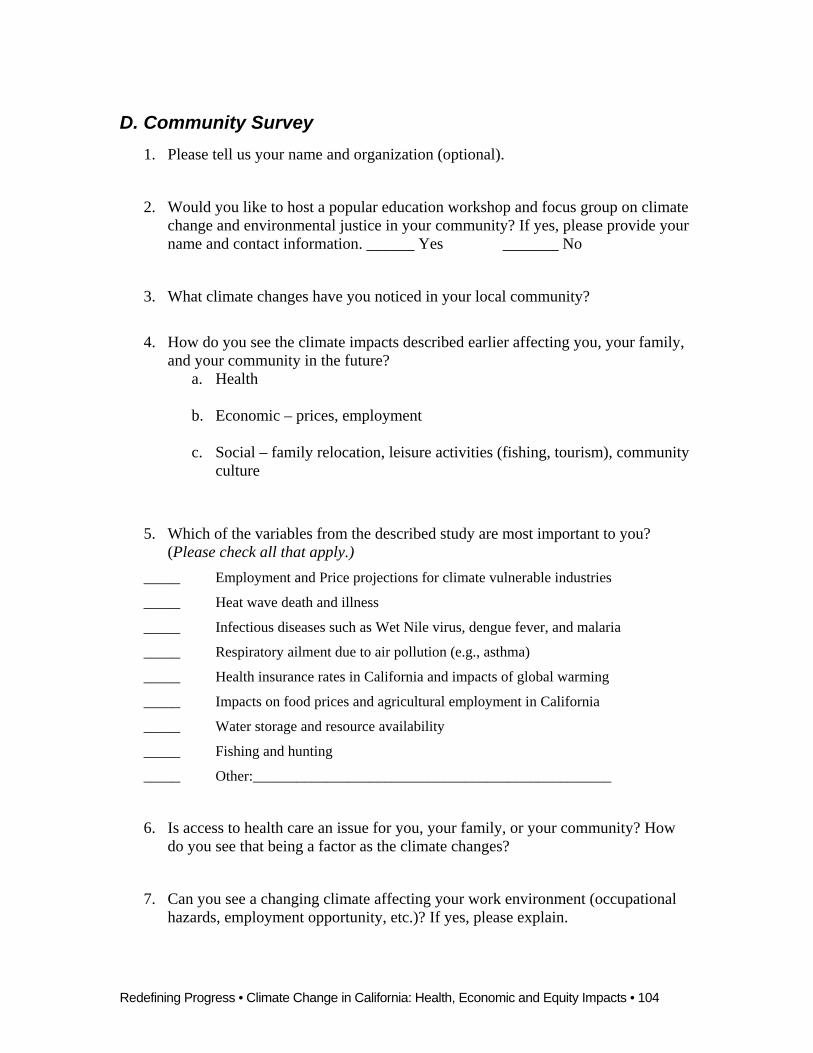
Redefining Progress • Climate Change in California: Health, Economic and Equity Impacts • 104
D. Community Survey 1. Please tell us your name and organization (optional).
2. Would you like to host a popular education workshop and focus group on climate change and environmental justice in your community? If yes, please provide your name and contact information. ______ Yes _______ No
3. What climate changes have you noticed in your local community?
4. How do you see the climate impacts described earlier affecting you, your family, and your community in the future?
a. Health b. Economic – prices, employment c. Social – family relocation, leisure activities (fishing, tourism), community
culture
5. Which of the variables from the described study are most important to you? (Please check all that apply.)
_____ Employment and Price projections for climate vulnerable industries
_____ Heat wave death and illness
_____ Infectious diseases such as Wet Nile virus, dengue fever, and malaria
_____ Respiratory ailment due to air pollution (e.g., asthma)
_____ Health insurance rates in California and impacts of global warming
_____ Impacts on food prices and agricultural employment in California
_____ Water storage and resource availability
_____ Fishing and hunting
_____ Other:_________________________________________________
6. Is access to health care an issue for you, your family, or your community? How do you see that being a factor as the climate changes?
7. Can you see a changing climate affecting your work environment (occupational hazards, employment opportunity, etc.)? If yes, please explain.

Redefining Progress • Climate Change in California: Health, Economic and Equity Impacts • 105
8. Are there plants and animals that you depend upon whose habitat might be affected by a warmer climate? Please explain.
9. As global warming increases the severity and frequency of storms, people might be forced to migrate more often. How will this affect you, your family, and your community?
10. Are there any other relevant factors not listed that you think we should consider?
11. What racial/ethnic group comprises the majority of your group’s constituents or the community you represent?
____ African American/Black
____ Latin American/Hispanic
____ Native American/Indian
____ Asian/Pacific Islander
____ Native Alaskan
____ Native Hawaiian
____ Multi-ethnic
____ White/Caucasian
____ Other: _____________
12. Please check the item(s) that accurately describes the constituent group you serve or communities you represent.
____ Low income
____ Middle income
____ Urban
____ Rural
____ Reservation
____ Church-based
____ Coalition
Thank you for taking the time to fill out this survey. If you need to contact us please e-mail [email protected].

Redefining Progress • Climate Change in California: Health, Economic and Equity Impacts • 106
E. Community Meeting Cards
GROUND-LEVEL OZONE
(SMOG)
Forms in air when sunlight interacts with local toxic pollution. Warmer temperatures from climate change
will increase this formation. Causes respiratory ailments such as asthma, bronchitis, severe coughing,
shortness of breath, pain when breathing and lung inflammation.
More than 95% of Californians live in areas that fail to meet federal air standards. In Southern California, 71% of Blacks, 50% of Latinos, and 34% of Whites
live in nonattainment areas.
People of color are almost three times more likely than whites to be hospitalized or die from asthma and
other respiratory illnesses linked to air pollution.
TROPICAL DISEASES SUCH AS MALARIA, WEST NILE VIRUS,
DENGUE FEVER, HANTAVIRUS
Warmer temperatures combined with periods of drought followed by intense rains
lead to the spread of disease-carrying rodents and insects such as mosquitoes and
ticks. Access to health care is critical in coping with these diseases. The uninsured rate for people of color is twice the rate for
whites.
HEAT DEATH AND ILLNESS SUCH AS HEAT STRESS, HEART
ATTACKS AND STROKE
This will result from increased heat waves from climate change. The number of very hot days and nights in CA has increased
during the past 50 years. Climate change is expected to increase the number of heat
deaths nationally by 90-540 percent. People of color are twice as likely to die in a heat wave. Urban residents are at greater
risk.
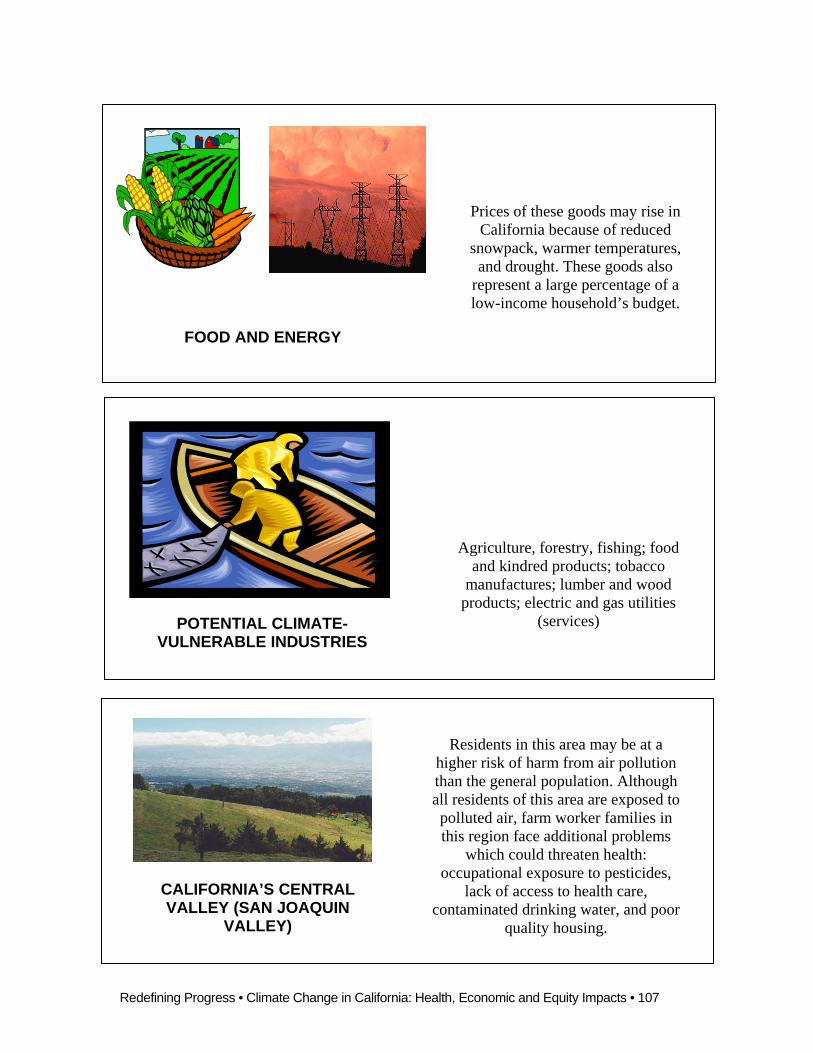
Redefining Progress • Climate Change in California: Health, Economic and Equity Impacts • 107
FOOD AND ENERGY
Prices of these goods may rise in California because of reduced
snowpack, warmer temperatures, and drought. These goods also
represent a large percentage of a low-income household’s budget.
Agriculture, forestry, fishing; food and kindred products; tobacco
manufactures; lumber and wood products; electric and gas utilities
(services)
POTENTIAL CLIMATE-VULNERABLE INDUSTRIES
CALIFORNIA’S CENTRAL VALLEY (SAN JOAQUIN
VALLEY)
Residents in this area may be at a higher risk of harm from air pollution than the general population. Although all residents of this area are exposed to polluted air, farm worker families in this region face additional problems
which could threaten health: occupational exposure to pesticides,
lack of access to health care, contaminated drinking water, and poor
quality housing.

Redefining Progress • Climate Change in California: Health, Economic and Equity Impacts • 108
Increased food and energy prices, changes in employment,
increased insurance prices, relocation costs, impacts on buildings and infrastructure
from flooding and fires.
ECONOMIC IMPACTS OF CLIMATE CHANGE
Respiratory ailments, tropical diseases, heat death and illness,
allergies, loss of traditional medicinal plants, increased
pesticide exposure, water-borne illness like diarrhea, malnutrition
and hunger. HEALTH IMPACTS OF CLIMATE
CHANGE
IMPACTS OF GLOBAL WARMING ON WATER
Warmer temperatures due to climate change would mean earlier and faster
snowmelt in the mountains where much of California’s supplies of this originate, thereby altering the timing of the runoff. Greater floods in winter and spring and lower summer flows are possible for some watersheds.
Levees in the Sacramento-San Joaquin Delta are already vulnerable to storms,
high runoff, and seismic action. A rising sea level will put additional
stress on these levees.
Redefining Progress • Climate Change in California: Health, Economic and Equity Impacts • 109
Environmental Justice Advocates
These leaders are already on the frontline of the fight for climate action. Climate change is caused primarily by the burning of fossil fuels for energy. Since these communities live on the frontlines of the production facilities, their fight for a cleaner community is the same fight for a stable climate.
Psychological impacts, family relocation due to extreme weather events, impacts on leisure activities (heat, changes in species, snowmelt), changes to subsistence lifestyles, cultural traditions/knowledge dependent upon the environment.
CHAPTER 2: SOCIAL AND CULTURAL IMPACTS OF CLIMATE CHANGE