Uncertainty analysis of NO production during methane combustion
15
Uncertainty Analysis of NO Production During Methane Combustion I. GY. ZS ´ ELY, J. Z ´ ADOR, T. TUR ´ ANYI Laboratory for Chemical Kinetics, Institute of Chemistry, E ¨ otv¨ os University (ELTE), Budapest, Hungary Received 27 November 2007; revised 19 April 2008, 31 May 2008; accepted 31 May 2008 DOI 10.1002/kin.20373 Published online in Wiley InterScience (www.interscience.wiley.com). ABSTRACT: Local and Monte Carlo uncertainty analyses of NO production during methane combustion were carried out, investigating the effect of uncertainties of kinetic parameters and enthalpies of formation. In Case I, the original Leeds methane oxidation mechanism with the NO x reaction block was used, but the enthalpies of formation of all species were updated. In Case II, the NCN-containing reactions of the prompt NO formation route were added and the rate parameters of several reactions were also updated. The NO production was examined at the conditions of the Bartok et al. experiments (PSR, T = 1565–1989 K, ϕ = 0.8–1.2, residence time 3 ms). The Monte Carlo analysis provided the approximate probability density function and the variance of the calculated NO concentration, and also its attainable minimum and maximum values. Both mechanisms provided similarly good to acceptable agreement with the experimental results for lean and stoichiometric mixtures, whereas only mechanism Case II could reproduce the experimental data for rich mixtures after a realistic tuning of the parameters. Local uncertainty analysis was used to assess the contribution of the uncertainty of each parameter to the uncertainty of the calculated NO concentration. Enthalpies of formation of NNH and HCCO, and rate parameters of 20 reaction steps cause most of the uncertainty of the calculated NO concentrations at all conditions. The relative importance of the four main NO formation routes was investigated via the inspection of the reaction rates, embedded in the Monte Carlo analysis. NO formation in rich mixtures was dominated by the prompt route, whereas in leaner mixtures the share of the NO formation routes depended very much on the values of rate parameters, when varied within the uncertainty limits of kinetic data evaluations. C 2008 Wiley Periodicals, Inc. Int J Chem Kinet 40: 754–768, 2008 INTRODUCTION Detailed reaction mechanisms are widely used in vari- ous fields, such as combustion, pyrolysis, atmospheric chemistry, and so on, and the proposed mechanisms Correspondence to: T. Tur´ anyi; e-mail: [email protected]. Present address of J. Z´ ador: Combustion Research Facility, Sandia National Laboratories, Livermore, CA. Contract grant sponsor: OTKA. Contract grant number: T68256. c 2008 Wiley Periodicals, Inc. have been tested against measurement data. Usually, there is not a prefect coincidence between the mea- sured and the simulated data, and the level of agreement can be judged only by knowing both the measurement error and uncertainty of simulation results. Although there is a well-established practice of the assessment of measurement error, investigation of the uncertainty of simulation results of chemical kinetic models received more attention only recently. Uncertainty analysis of atmospheric chemical and air quality models has been carried out for several decades. There are fewer examples for the application
Transcript of Uncertainty analysis of NO production during methane combustion

Uncertainty Analysis of NOProduction During MethaneCombustionI. GY. ZSELY, J. ZADOR, T. TURANYI
Laboratory for Chemical Kinetics, Institute of Chemistry, Eotvos University (ELTE), Budapest, Hungary
Received 27 November 2007; revised 19 April 2008, 31 May 2008; accepted 31 May 2008
DOI 10.1002/kin.20373Published online in Wiley InterScience (www.interscience.wiley.com).
ABSTRACT: Local and Monte Carlo uncertainty analyses of NO production during methanecombustion were carried out, investigating the effect of uncertainties of kinetic parametersand enthalpies of formation. In Case I, the original Leeds methane oxidation mechanismwith the NOx reaction block was used, but the enthalpies of formation of all species wereupdated. In Case II, the NCN-containing reactions of the prompt NO formation route wereadded and the rate parameters of several reactions were also updated. The NO production wasexamined at the conditions of the Bartok et al. experiments (PSR, T = 1565–1989 K, ϕ = 0.8–1.2,residence time 3 ms). The Monte Carlo analysis provided the approximate probability densityfunction and the variance of the calculated NO concentration, and also its attainable minimumand maximum values. Both mechanisms provided similarly good to acceptable agreementwith the experimental results for lean and stoichiometric mixtures, whereas only mechanismCase II could reproduce the experimental data for rich mixtures after a realistic tuning of theparameters. Local uncertainty analysis was used to assess the contribution of the uncertainty ofeach parameter to the uncertainty of the calculated NO concentration. Enthalpies of formationof NNH and HCCO, and rate parameters of 20 reaction steps cause most of the uncertainty ofthe calculated NO concentrations at all conditions. The relative importance of the four mainNO formation routes was investigated via the inspection of the reaction rates, embedded inthe Monte Carlo analysis. NO formation in rich mixtures was dominated by the prompt route,whereas in leaner mixtures the share of the NO formation routes depended very much on thevalues of rate parameters, when varied within the uncertainty limits of kinetic data evaluations.C© 2008 Wiley Periodicals, Inc. Int J Chem Kinet 40: 754–768, 2008
INTRODUCTION
Detailed reaction mechanisms are widely used in vari-ous fields, such as combustion, pyrolysis, atmosphericchemistry, and so on, and the proposed mechanisms
Correspondence to: T. Turanyi; e-mail: [email protected] address of J. Zador: Combustion Research Facility,
Sandia National Laboratories, Livermore, CA.Contract grant sponsor: OTKA.Contract grant number: T68256.
c© 2008 Wiley Periodicals, Inc.
have been tested against measurement data. Usually,there is not a prefect coincidence between the mea-sured and the simulated data, and the level of agreementcan be judged only by knowing both the measurementerror and uncertainty of simulation results. Althoughthere is a well-established practice of the assessment ofmeasurement error, investigation of the uncertainty ofsimulation results of chemical kinetic models receivedmore attention only recently.
Uncertainty analysis of atmospheric chemical andair quality models has been carried out for severaldecades. There are fewer examples for the application
UNCERTAINTY ANALYSIS OF NO PRODUCTION DURING METHANE COMBUSTION 755
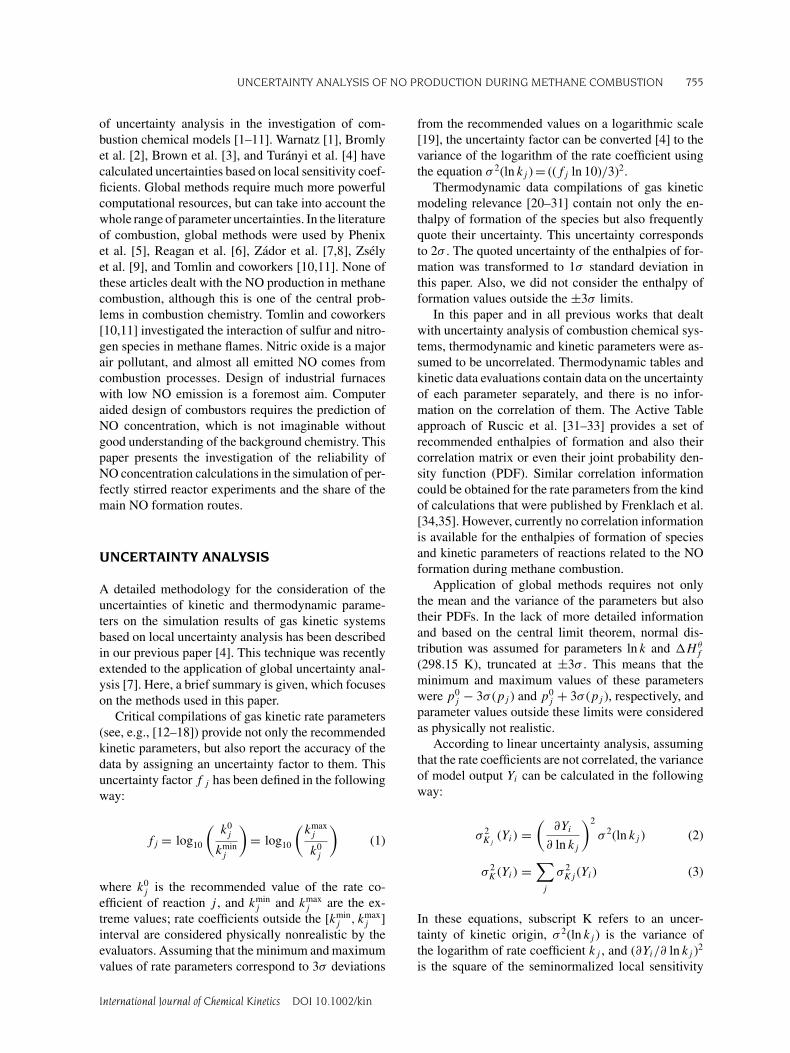
of uncertainty analysis in the investigation of com-bustion chemical models [1–11]. Warnatz [1], Bromlyet al. [2], Brown et al. [3], and Turanyi et al. [4] havecalculated uncertainties based on local sensitivity coef-ficients. Global methods require much more powerfulcomputational resources, but can take into account thewhole range of parameter uncertainties. In the literatureof combustion, global methods were used by Phenixet al. [5], Reagan et al. [6], Zador et al. [7,8], Zselyet al. [9], and Tomlin and coworkers [10,11]. None ofthese articles dealt with the NO production in methanecombustion, although this is one of the central prob-lems in combustion chemistry. Tomlin and coworkers[10,11] investigated the interaction of sulfur and nitro-gen species in methane flames. Nitric oxide is a majorair pollutant, and almost all emitted NO comes fromcombustion processes. Design of industrial furnaceswith low NO emission is a foremost aim. Computeraided design of combustors requires the prediction ofNO concentration, which is not imaginable withoutgood understanding of the background chemistry. Thispaper presents the investigation of the reliability ofNO concentration calculations in the simulation of per-fectly stirred reactor experiments and the share of themain NO formation routes.
UNCERTAINTY ANALYSIS
A detailed methodology for the consideration of theuncertainties of kinetic and thermodynamic parame-ters on the simulation results of gas kinetic systemsbased on local uncertainty analysis has been describedin our previous paper [4]. This technique was recentlyextended to the application of global uncertainty anal-ysis [7]. Here, a brief summary is given, which focuseson the methods used in this paper.
Critical compilations of gas kinetic rate parameters(see, e.g., [12–18]) provide not only the recommendedkinetic parameters, but also report the accuracy of thedata by assigning an uncertainty factor to them. Thisuncertainty factor f j has been defined in the followingway:
fj = log10
(k0j
kminj
)= log10
(kmaxj
k0j
)(1)
where k0j is the recommended value of the rate co-
efficient of reaction j , and kminj and kmax
j are the ex-treme values; rate coefficients outside the [kmin
j , kmaxj ]
interval are considered physically nonrealistic by theevaluators. Assuming that the minimum and maximumvalues of rate parameters correspond to 3σ deviations
from the recommended values on a logarithmic scale[19], the uncertainty factor can be converted [4] to thevariance of the logarithm of the rate coefficient usingthe equation σ 2(ln kj ) = ((fj ln 10)/3)2.
Thermodynamic data compilations of gas kineticmodeling relevance [20–31] contain not only the en-thalpy of formation of the species but also frequentlyquote their uncertainty. This uncertainty correspondsto 2σ . The quoted uncertainty of the enthalpies of for-mation was transformed to 1σ standard deviation inthis paper. Also, we did not consider the enthalpy offormation values outside the ±3σ limits.
In this paper and in all previous works that dealtwith uncertainty analysis of combustion chemical sys-tems, thermodynamic and kinetic parameters were as-sumed to be uncorrelated. Thermodynamic tables andkinetic data evaluations contain data on the uncertaintyof each parameter separately, and there is no infor-mation on the correlation of them. The Active Tableapproach of Ruscic et al. [31–33] provides a set ofrecommended enthalpies of formation and also theircorrelation matrix or even their joint probability den-sity function (PDF). Similar correlation informationcould be obtained for the rate parameters from the kindof calculations that were published by Frenklach et al.[34,35]. However, currently no correlation informationis available for the enthalpies of formation of speciesand kinetic parameters of reactions related to the NOformation during methane combustion.
Application of global methods requires not onlythe mean and the variance of the parameters but alsotheir PDFs. In the lack of more detailed informationand based on the central limit theorem, normal dis-tribution was assumed for parameters ln k and �Hθ
f
(298.15 K), truncated at ±3σ . This means that theminimum and maximum values of these parameterswere p0
j − 3σ (pj ) and p0j + 3σ (pj ), respectively, and
parameter values outside these limits were consideredas physically not realistic.
According to linear uncertainty analysis, assumingthat the rate coefficients are not correlated, the varianceof model output Yi can be calculated in the followingway:
σ 2Kj
(Yi) =(
∂Yi
∂ ln kj
)2
σ 2(ln kj ) (2)
σ 2K (Yi) =
∑j
σ 2Kj (Yi) (3)
In these equations, subscript K refers to an uncer-tainty of kinetic origin, σ 2(ln kj ) is the variance ofthe logarithm of rate coefficient kj , and (∂Yi/∂ ln kj )2
is the square of the seminormalized local sensitivity
International Journal of Chemical Kinetics DOI 10.1002/kin

756 ZSELY, ZADOR, AND TURANYI
coefficient. Partial variance σ 2Kj
(Yi) is the contributionof the uncertainty of the rate coefficient of reaction j
to the variance of model output Y i .The influence of the enthalpy of formation data on
the model result can be calculated in a similar way,assuming that the data are uncorrelated:
σ 2T j (Yi) =
(∂Yi
∂�Hθf (j )
)2
σ 2(�Hθ
f (j ))
(4)
σ 2T(Yi) =
∑j
σ 2Tj (Yi) (5)
where subscript T refers to thermodynamic uncer-tainty; ∂Yi/∂�Hθ
f (j ) is the local enthalpy of formationsensitivity coefficient, which is a linear estimation ofthe effect of changing the enthalpy of formation; σ 2
T (Yi)is the variance of model output Yi due to the uncertain-ties of the enthalpies of formation of all species. Partialthermodynamic uncertainty contribution σ 2
T j (Yi) is thecontribution of the uncertainty of the enthalpy of for-mation of species j to the variance of model output Yi .The sum of the variances of kinetic and thermodynamicorigin provides the variance of model result:
σ 2(Yi) = σ 2K(Yi) + σ 2
T (Yi) (6)
We can also calculate values
S%ij = σ 2j (Yi)
σ 2(Yi)× 100 (7)
where σ 2j (Yi) is either of kinetic or thermodynamic
origin. This shows the percentage contribution of aparameter to the uncertainty of model output Yi .
Most of the simulation programs in chemical ki-netics include built-in routines to calculate local sen-sitivity coefficients; therefore, the variances and un-certainty contributions above can be easily calculated.The drawback of this method is that the calculated val-ues are local estimates only, and the accuracy of thisapproximation cannot be assessed.
In the Monte Carlo analysis (see, e.g., [36]), a largenumber of parameter sets are generated according tothe PDFs of the parameters. The model is simulatedwith each of these parameter sets, and the resultsare processed with statistical methods. Application ofLatin hypercube sampling (LHS) [36] allows compu-tationally efficient, but unbiased Monte Carlo simula-tions. In LHS, the ranges of parameters are divided intointervals of equal probability. The parameter values arerandomly and independently sampled in each interval,and the selected values of the parameters are randomly
grouped without repetition. This way, all parametersare changed simultaneously and the parameter setscover the whole available parameter space. Therefore,the minimum and maximum values collected from theMonte Carlo analysis results provide a good estimate ofthe attainable minimum and maximum model results.If the experimental data lie outside the range of attain-able results, then the structure of the model is surelywrong (e.g., important reactions are missing), providedthat the PDFs of the parameters have been estimatedcorrectly and the experimental data are accurate.
NO FORMATION IN COMBUSTIONSYSTEMS
In methane combustion systems, NO can be formed infour routes (see, e.g., [37]). At high temperature, NOis formed in the thermal route:
N2 + O = N + NO (R1)
The N-atom produced reacts further in reactionsN + O2 = NO + O and N + OH = NO + H.
When the CH concentration is high, the prompt NOformation is significant.
N2 + CH = HCN + N (R2a)
For decades, reaction (R2a) was considered as the maininitiation step of the prompt NO route, but Moskalevaand Lin [38] debated this reaction, and Smith gave anexperimental evidence of NCN as an intermediate ofthe prompt-NO formation [39].
N2 + CH = NCN + H (R2b)
El Bakali et al. [40] included this prompt NO forma-tion pathway to the GDF-Kin 3.0 reaction mechanism.Recently, Hanson and coworkers [41] studied the re-action between CH and N2 in shock tube experimentsusing CH and NCN laser absorption. The CH measure-ments established NCN and H as the primary productsof the CH + N2 reaction. These results were confirmedby Harding et al. [42], who investigated the potentialenergy surface for the CH + N2 reaction with mul-tireference ab initio electronic structure methods. Inthe cases of both steps ((R2a) and (R2b)), the inter-mediate formed (HCN or NCN) is converted to NOthrough several steps.
The N2O intermediate can be formed in the fol-lowing steps, providing a via N2O formation route of
International Journal of Chemical Kinetics DOI 10.1002/kin

UNCERTAINTY ANALYSIS OF NO PRODUCTION DURING METHANE COMBUSTION 757
NO:
N2 + O(+M) = N2O( + M) (R3)
N2 + OH( + M) = N2O + H(+M) (R4)
N2 + HO2( + M) = N2O + OH(+M) (R5)
N2 + O2(+M) = N2O + O( + M) (R6)
The N2O formed is then mainly converted to NO inseveral steps.
The fourth way for the generation of NO is initiatedby the reaction of N2 with hydrocarbon-free speciesother than O. These species include H, OH, H2, andH2O. This is called the via NNH formation route of NO.The possible initiation reactions are the following:
N2 + H = NH + N (R7)
N2 + OH = NH + NO (R8)
N2 + H = NNH (R9)
N2 + OH = NNH + O (R10)
N2 + H2 = NNH + H (R11)
N2 + H2O = NNH + OH (R12)
The NNH produced is also converted mainly to NO.In this paper, the investigations are based on the
Leeds methane oxidation mechanism [43] with theNOx reaction block extension [44]. The publishedworks of Hughes et al. [43,44] contain results of com-prehensive testing of the mechanism against experi-mental data. Two different versions of the Leeds mech-anism were used. The mechanism used in Case I isidentical to the Leeds methane oxidation mechanismwith the NOx block, but the enthalpies of formation ofall species were revised and updated. The revised val-ues for the C/H/O species have been published in [4]and [7], whereas the revised enthalpies of formationof nitrogen-containing species are given in Table I. Touse a consistent set of data, in most cases the valuesrecommended by Burcat [29] were applied.
This paper investigates the NO formation duringmethane combustion, so the complete neglect of thepossible role of NCN in the prompt route could becriticized. For this reason, similarly to the paper of ElBakali et al. [40], we created a modified version of theLeeds mechanism (Case II): the debated reaction (R2a)was replaced with reaction (R2b) and NCN reactionswere added (see Table II). In Case II, the highest sensi-tivity N-species reactions were identified and the ratecoefficients of these reactions were updated. Table IIcontains also the updated reactions. This mechanismhas not been comprehensively tested and cannot be
Table I Enthalpies of Formation of the N-ContainingSpecies and Their Standard Deviation
�Hθf 1σ standard
(298.15 K) deviation of �Hθf
Species kJ mol−1 (298.15 K)a kJ mol−1 Reference
CN 438.807b 0.26b [29]HCN 129.799b 0.19b [29]N 472.459b 0.02b [29]NH 358.78b 0.185b [29]NO 91.097b 0.043b [33]HNO 106.842b 0.0625b [29]NH2 186.422b 0.10b [58]H2NO 66.184 4.25 [59]NCO 128.04 2.1 [29]N2O 82.58b 0.05b [29]NO2 34.025b 0.043b [33]N2H2 211.859 5.0 [29]HOCN −15.456 10.0 [29]H2CN 240.162 5.0c [29]NNH 251.776 4.0 [29]NH3 −45.567b 0.015b [29]N2H3 220.58b 0.67b [29]C2N2 309.28b 0.52b [29]HNCO −118.6 2.1 [29]NCN 465.89b 0.89b [29]
aDerived by halving the reported 95% confidence interval.bThe value was determined by the ATcT method [32].cEstimated value (see text).
considered as an updated version of the NOx block ofthe Leeds methane oxidation mechanism.
The Leeds methane oxidation mechanism has beenutilized [4,7] for uncertainty studies. In this work, thesame uncertainty factors were used to the kinetic andthermodynamic parameters of N-atom-free reactionsand species, respectively, as in our former articles[4,7]. As a first step in the extension of these stud-ies to NOx systems, uncertainties had to be assigned tothe enthalpies of formation of all N-containing speciesby processing thermodynamic data collections [12,14–17,20–29]. In most cases, the variances recommendedin the databases were in agreement. Table I containsalso the variances of the enthalpies of formation ofthe N-containing species. Some of the enthalpies offormation are based on active table calculations (seethe footnote in Table I), but the quoted uncertaintiesrefer to each species separately. No recommended un-certainty was found for the enthalpy of formation ofH2CN, and the quoted uncertainty value is estimated.
Based on kinetic data evaluations, uncertainty fac-tors fj were also assigned to the rate coefficients ofN-containing reactions. All reaction steps in the mech-anism are reversible; therefore, altered enthalpies of
International Journal of Chemical Kinetics DOI 10.1002/kin

758 ZSELY, ZADOR, AND TURANYI
Table II Added Reactions and Updated Rate Coefficients of N-Chemistry in Case II
Reaction Step A n E f Reference
N2 + CH = NCN + H 5.11E + 12 0.00 56.90 1.0a [40]CN + N2O = NCN + NO 3.84E + 03 2.60 15.46 0.3 [60]CN + NCO = NCN + CO 1.80E + 13 0.00 0.00 1.0a [61]NCN + H = HCN + N 1.00E + 14 0.00 0.00 1.0a [61]NCN + O = CN + NO 1.00E + 14 0.00 0.00 1.0a [61]NCN + OH = HCN + NO 5.00E + 13 0.00 0.00 1.0a [61]NCN + O2 = NO + NCO 1.00E + 13 0.00 0.00 1.0a [61]NO + NH = N2 + OH 6.86E + 14 −0.78 0.33 0.5 [18]NO + NH = N2O + H 2.75E + 15 −0.78 0.33 0.5 [18]NO2 + H = NO + OH 2.53E + 14 0.00 2.82 0.3 [18]HCN + OH = CN + H2O 3.91E + 06 1.83 43.07 0.5 [18]O + NNH = NH + NO 4.45E + 14 0.00 87.63 0.5 [18]O + NCO = NO + CO 4.33E + 13 0.00 0.00 0.3 [18]NO2 + O = NO + O2 3.92E + 12 0.00 1.00 0.7a [13]CH3 + N = H2CN + H 7.10E + 14 0.00 0.00 0.5 [62]
Units are mol, cm3, and kJ.aEstimated uncertainty factors.
formation also changed the calculated rates of back-ward reactions.
For the simulations, the PSR code [45] of theCHEMKIN-II package [46] was used. The code wasmodified to allow the sequential calculations withmany parameter sets for the Monte Carlo simulationsand for the calculation of the local sensitivity co-efficients of the enthalpies of formation. The localsensitivities were converted to uncertainty featuresusing program KINALC [47]. Generation of Latin hy-percube samples and analysis of Monte Carlo resultswere carried out using purpose written Fortran codes.Three Monte Carlo analyses were accomplished, andthe number of simulations was increased in steps 1000,3162, and 10,000. The averages and standard devia-tions did not change significantly from 1000 to 10,000strata. The results presented in this paper correspondto 10,000 runs for each equivalence ratio and case.
UNCERTAINTY ANALYSIS OF THE NOX
MECHANISM
A generally used benchmark experiment for NO forma-tion during methane combustion was made by Bartoket al. [48]. In this series of experiments, methane andair was preheated to the desired inlet temperature andpremixed. The mixture was injected into a sphericaljet-stirred reactor, which was designed to be close toa perfectly stirred reactor (PSR). The temperature wasvaried between 1565 and 1989 K. Equivalence ratioϕ and residence time τ were changed from 0.6 to 1.6and 1.2 to 3.0 ms, respectively. Atmospheric pressure
Table III Equivalence Ratios and the CorrespondingGas Temperatures of the Bartok et al. ExperimentsSimulated in This Paper
Equivalence Ratio Temperature (K)
0.67 15650.76 18020.89 18740.935 18961.06 19891.205 19771.30 19371.54 18691.75 1809
Pressure was always 1 atm and the residence time was 3 ms.
was kept in the reactor. Table III contains the equiv-alence ratios and the corresponding gas temperaturesof the experiments. The residence time was 3 ms in allsimulated cases.
The reason of the reputation of the Bartok et al.series of experiments [48] is that the applied domain ofpressure, temperature, residence time, and equivalenceratio is close to the conditions of an industrial furnace.This experiment is widely used (see, e.g., publications[44,49,50]) for testing mechanisms of NO formationduring methane oxidation.
In all figures in this paper, the results are presentedusing the Case I and Case II mechanisms in paral-lel. Figure 1 shows the measured outlet NO concen-tration (solid dots) as a function of the equivalenceratio and the corresponding measurement error(vertical lines) estimated on the basis of the work of
International Journal of Chemical Kinetics DOI 10.1002/kin

UNCERTAINTY ANALYSIS OF NO PRODUCTION DURING METHANE COMBUSTION 759
(a) (b)
0.6 0.8 1.0 1.2 1.4 1.6 1.80.0
0.5
1.0
1.5
2.0
2.5
3.0
3.5
4.0
4.5
10
4x N
O
Equivalence ratio
0.6 0.8 1.0 1.2 1.4 1.6 1.80.0
0.5
1.0
1.5
2.0
2.5
3.0
3.5
4.0
4.51
04x N
O
Equivalence ratio
Figure 1 Results at the conditions of the Bartok et al. experiments, indicating the measured data (solid dots), the simulationresults (empty squares), the 1σ error limits of the experimental and simulation data (vertical lines), and the limits of simulationresults by tuning all parameters simultaneously within their physically realistic limits (boxes); (a) in Case I and (b) in Case II.
Bartok et al. [48]. This 1σ uncertainty reflects the er-ror of the chemical analysis only, and possible sys-tematic errors are not included. The simulated con-centrations (empty squares) are in fair agreement withthe measured data at lean compositions in both cases.The agreement is getting worse with increasing equiva-lence ratio, and the simulated concentrations underpre-dict the measured NO concentration. Note that the GRI2.11 mechanism provided a good agreement [44,49,50]with the Bartok et al. data, but the latter 3.0 version [50]strongly overpredicted the NO concentration.
Monte Carlo analysis is an accurate method forthe determination of the uncertainty of model results.Figure 1 shows the 1σ standard deviation of NO con-centration as vertical lines determined by the MonteCarlo analysis. If equivalence ratio ϕ is less than 1.1,the 1σ standard deviation of the experimental and sim-ulation results overlap in both cases. At large equiva-lence ratios, the experimental points are outside the 1σ
standard deviation of the simulation results.Tuning all parameters simultaneously within their
physically realistic limits, minimum and maximumvalues of the results at physically realistic parame-ter combinations can be obtained, and these limits,shown as boxes in Fig. 1, can also be acquired fromthe Monte Carlo results. In Case I, at equivalence ra-tio ϕ = 1.2 and at leaner mixtures, the experimentalpoints are within these boxes. This means that keepingthe present set of elementary reactions and changingthe parameters within the realistic limits, the exper-imental points could be reproduced. At equivalenceratios ϕ = 1.3 or higher, the experimental data can-not be reproduced using the current set of reactionsteps. In Case II the situation is much better. For allfuel-to-air ratios, the experimental points are within(or close to) these limits, showing that the experimen-
tal points could be obtained by an optimized set ofparameters.
Figure 2 shows the histograms of the calculated NOconcentrations at equivalence ratios ϕ = 0.76, 1.06, and1.54. These histograms reveal the shape of the PDFsof the NO concentrations. At each equivalence ratio,the distribution has a tail toward the high NO con-centrations. This characteristic shape is in accordancewith the lognormal distributions of the rate parame-ters for ϕ = 0.76 and 1.54, whereas the PDFs have twopeaks for ϕ = 1.06. This bimodal distribution was re-produced by using other random parameter sets. Wehave not found an explanation to this interesting fact.
Variance of simulation results can be obtained notonly by Monte Carlo but also using local uncertaintyanalysis (see Eq. (6)). The latter method is frequentlycriticized due to its local manner and linear approxi-mation, but in our previous investigations [7–9], in allcases good agreement was found between the 1σ stan-dard deviations obtained from local uncertainty andMonte Carlo calculations. Figure 3 shows the 1σ stan-dard deviation of the calculated NO concentration as apercentage of the mean value. Below the stoichiomet-ric equivalence ratio, it is in the order of 20%–40%,whereas above this threshold it is in the range of 60%–90%. The only exception is ϕ = 0.67 in Case I, in whichthe 1σ standard deviation is quite high, 50%–60% withboth methods. There is always a fairly good agreementbetween the 1σ standard deviations calculated by theMonte Carlo and the local uncertainty analyses.
The great advantage of local uncertainty analysisis that the origin of the calculated uncertainty can betraced back to the various parameters. Partial variancesσ 2
K j (Yi) and σ 2Tj (Yi), and their percentage contribution
to the overall variances indicate the share of the uncer-tainty of parameter j to the uncertainty of result i. In
International Journal of Chemical Kinetics DOI 10.1002/kin

760 ZSELY, ZADOR, AND TURANYI
II esaC(b)I esaC (a)
0.76
0
20
40
60
80
100
0.00000 0.00005 0.00010 0.00015 0.00020 0.000250
200
400
600
800
1000
1200
1400
Cou
nts
NO mole fraction
Cu
mu
lativ
eco
unts
0
20
40
60
80
100
0.00000 0.00005 0.00010 0.00015 0.00020 0.000250
200
400
600
800
1000
1200
1400
Cou
nts
NO mole fraction
Cu
mu
lativ
eco
unts
1.06
0
20
40
60
80
100
0.00000 0.00005 0.00010 0.00015 0.00020 0.000250
200
400
600
800
1000
1200
1400
Cou
nts
NO mole fraction
Cu
mu
lativ
eco
unts
0
20
40
60
80
100
0.00000 0.00005 0.00010 0.00015 0.00020 0.000250
200
400
600
800
1000
1200
1400
Cou
nts
NO mole fraction
Cu
mu
lativ
eco
unts
1.54
0
20
40
60
80
100
0.00000 0.00005 0.00010 0.00015 0.00020 0.000250
200
400
600
800
1000
1200
1400
Cou
nts
NO mole fraction
Cu
mu
lativ
eco
unts
0
20
40
60
80
100
0.00000 0.00005 0.00010 0.00015 0.00020 0.000250
200
400
600
800
1000
1200
1400
Cou
nts
NO mole fractionC
um
ula
tive
counts
Figure 2 The approximate probability density function (PDF) and cumulative distribution function (CDF) of the calculatedNO concentration at equivalence ratios ϕ = 0.76, 1.06, and 1.54; (a) in Case I and (b) in Case II. [Color figure can be viewed inthe online issue, which is available at www.interscience.wiley.com.]
(a)
0.67
0.76
0.89
0.935
1.06
1.205
1.3
1.54
1.75
0 20 40 60 80 100
Percentage 1σ deviation
Eq
uiv
ale
nce
ra
tio
(b)
0.67
0.76
0.89
0.935
1.06
1.205
1.3
1.54
1.75
0 20 40 60 80 100
Percentage 1σ deviation
Eq
uiv
ale
nce
ra
tio
Figure 3 Comparison of the 1σ standard deviations, given as a percentage of the mean value, calculated by the Monte Carlomethod (white bar) and local uncertainty analysis (gray bar); (a) in Case I and (b) in Case II.
International Journal of Chemical Kinetics DOI 10.1002/kin

UNCERTAINTY ANALYSIS OF NO PRODUCTION DURING METHANE COMBUSTION 761
Figure 4 The main contributing rate parameters and enthalpies of formation to the uncertainty of NO concentration atequivalence ratios ϕ = 0.76, 1.06, and 1.54. Only contributions higher than 3% are plotted; (a) in Case I and (b) in Case II.
these simulations, there were only 4–9 parameters foreach equivalence ratio that contribute to NO concen-tration uncertainty with more than 3%, as defined byEq. (7). Figure 4 shows the main contributing rate pa-rameters and enthalpies of formation to the uncertaintyof NO concentration, at equivalence ratios ϕ = 0.76,1.06, and 1.54 in both cases. A parameter has high un-certainty contribution, if it is an influential parameter(i.e., it has a high sensitivity coefficient) and also if theparameter value has high uncertainty.
Comparing the two cases at all equivalenceratios, there are several common sources of theuncertainty. In lean mixtures (ϕ = 0.76), in bothcases the main sources of uncertainty are therate parameters of reactions NO + N = N2 + O,NO + NH = N2O + H, O2 + H + M = HO2 + M (to-gether with O2 + H + H2O = HO2 + H2O), and
N2O + M = N2 + O + M. However, in Case I theenthalpy of formation of species NNH and reactionO + NNH = NH + NO appears, both correspondto the route NNH. In Case II these are present inthe mechanism, but do not appear to be important.Instead, the CH and NCN reactions are highlighted,showing the increasing importance of the promptroute in this mechanism. In near stoichiometricmixtures (ϕ = 1.06), rate parameters of reactionsH + CH2 = CH + H2 and H2O + CH = CH2O + Hhave high uncertainty contribution in both cases.In Case I reaction N2 + CH = HCN + N appears,which is not present in Case II. Instead of this,two NCN reactions cause high uncertainty at thisequivalence ratio in Case II: NCN + H = HCN + Nand NCN + OH = HCN + NO. In rich mixtures(ϕ = 1.54), the high uncertainty share belongs to
International Journal of Chemical Kinetics DOI 10.1002/kin
762 ZSELY, ZADOR, AND TURANYI
rate parameters of reactions H2O + CH = CH2O + H,C2H2 + CH = C2H + CH2, and enthalpy of formationof species HCCO in both cases. The important reactionNCN + O2 = NO + NCO in Case II is missing fromthe mechanism in Case I. Instead of this reaction,several hydrocarbon reactions and the HCN formationreaction (N2 + CH = HCN + N) cause significantuncertainty of the calculated NO concentration. Allin all, 20 reactions are listed in Fig. 4. This meansthat only a small fraction of the reaction steps causethe main part of the uncertainty of the calculated NOconcentration. The uncertainty of the simulated NOconcentration can be decreased, if the values of theseparameters were known more precisely. The above listof reactions may be used as a guideline for planningexperimental studies for the investigation of nitrogenchemistry in hydrocarbon flames.
It is clear from Fig. 4 that rate parameters havehigher uncertainty contributions than the thermody-namic parameters (enthalpies of formation). The in-fluence of the uncertainty of the thermodynamic andkinetic parameters on the uncertainty of the calculatedNO concentration is contrasted in Fig. 5 by comparingthe extent of the terms σ 2
K and σ 2T of Eq. (7) to the
overall variance σ 2j (Yi). The contribution of thermo-
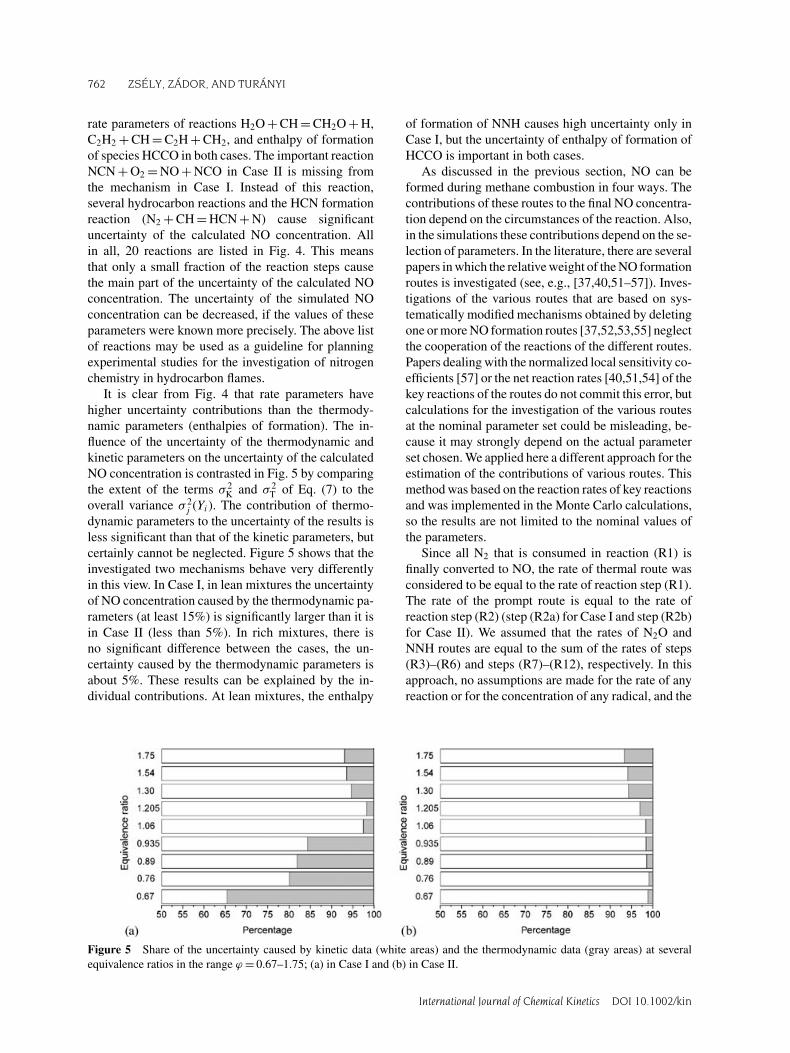
dynamic parameters to the uncertainty of the results isless significant than that of the kinetic parameters, butcertainly cannot be neglected. Figure 5 shows that theinvestigated two mechanisms behave very differentlyin this view. In Case I, in lean mixtures the uncertaintyof NO concentration caused by the thermodynamic pa-rameters (at least 15%) is significantly larger than it isin Case II (less than 5%). In rich mixtures, there isno significant difference between the cases, the un-certainty caused by the thermodynamic parameters isabout 5%. These results can be explained by the in-dividual contributions. At lean mixtures, the enthalpy
of formation of NNH causes high uncertainty only inCase I, but the uncertainty of enthalpy of formation ofHCCO is important in both cases.
As discussed in the previous section, NO can beformed during methane combustion in four ways. Thecontributions of these routes to the final NO concentra-tion depend on the circumstances of the reaction. Also,in the simulations these contributions depend on the se-lection of parameters. In the literature, there are severalpapers in which the relative weight of the NO formationroutes is investigated (see, e.g., [37,40,51–57]). Inves-tigations of the various routes that are based on sys-tematically modified mechanisms obtained by deletingone or more NO formation routes [37,52,53,55] neglectthe cooperation of the reactions of the different routes.Papers dealing with the normalized local sensitivity co-efficients [57] or the net reaction rates [40,51,54] of thekey reactions of the routes do not commit this error, butcalculations for the investigation of the various routesat the nominal parameter set could be misleading, be-cause it may strongly depend on the actual parameterset chosen. We applied here a different approach for theestimation of the contributions of various routes. Thismethod was based on the reaction rates of key reactionsand was implemented in the Monte Carlo calculations,so the results are not limited to the nominal values ofthe parameters.
Since all N2 that is consumed in reaction (R1) isfinally converted to NO, the rate of thermal route wasconsidered to be equal to the rate of reaction step (R1).The rate of the prompt route is equal to the rate ofreaction step (R2) (step (R2a) for Case I and step (R2b)for Case II). We assumed that the rates of N2O andNNH routes are equal to the sum of the rates of steps(R3)–(R6) and steps (R7)–(R12), respectively. In thisapproach, no assumptions are made for the rate of anyreaction or for the concentration of any radical, and the
Figure 5 Share of the uncertainty caused by kinetic data (white areas) and the thermodynamic data (gray areas) at severalequivalence ratios in the range ϕ = 0.67–1.75; (a) in Case I and (b) in Case II.
International Journal of Chemical Kinetics DOI 10.1002/kin

UNCERTAINTY ANALYSIS OF NO PRODUCTION DURING METHANE COMBUSTION 763
II esaC )(b I esaC (a)
0.76
Thermal
Prompt
Via N2O
Via NNH
−0.4 −0.2 0.0 0.2 0.4 0.6 0.8 1.0 1.2 1.4
Relative contribution
Thermal
Prompt
Via N2O
Via NNH
−0.4 −0.2 0.0 0.2 0.4 0.6 0.8 1.0 1.2 1.4
Relative contribution
1.06
Thermal
Prompt
Via N2O
Via NNH
−0.4 −0.2 0.0 0.2 0.4 0.6 0.8 1.0 1.2 1.4
Relative contribution
Thermal
Prompt
Via N2O
Via NNH
−0.4 −0.2 0.0 0.2 0.4 0.6 0.8 1.0 1.2 1.4
Relative contribution
1.54
Thermal
Prompt
Via N2O
Via NNH
−4 −2 0 2 4 6
Relative contribution
Thermal
Prompt
Via N2O
Via NNH
−0.4 −0.2 0.0 0.2 0.4 0.6 0.8 1.0 1.2 1.4
Relative contribution
Figure 6 The relative importance of the NO formation routes at equivalence ratios ϕ = 0.76, 1.06, and 1.54; (a) in Case I and(b) in Case II. The symbols indicate the averages of the relative importance of the NO formation routes; the vertical lines, the1σ error limits of the simulation data. The boxes show the achievable range by tuning all parameters simultaneously within theirphysically realistic limits.
reaction mechanisms were not modified. However, wehave to note that the N2O route is overpredicted in thismethod, because significant amount of N2O leaves thereactor without conversion to NO.
During the Monte Carlo analysis, at each parameterset, the rates of the NO formation routes were calcu-lated and the share of the routes was obtained. Theresults were analyzed by statistical methods: The av-erage, minimal, and maximal values were determinedand approximate PDFs were plotted. The results arepresented in Figs. 6–8. Figure 6 presents the relative
importance of the NO formation routes at ϕ = 0.76,1.06, and 1.54 in both cases. Figures 7 and 8 show thedistribution of the four formation routes as histogramsat equivalence ratios ϕ = 0.76 and ϕ = 1.06 in Cases Iand II, respectively. The histograms corresponding toϕ = 1.54 are not presented, because at this equivalenceratio the prompt route is the most significant, and itwould have been difficult to create a sensible graph.
At ϕ = 0.76 and in Case I, the main route is viaN2O, which gives almost 80% of the NO produced.In Case II, there is no such main route, but all routes
International Journal of Chemical Kinetics DOI 10.1002/kin

764 ZSELY, ZADOR, AND TURANYI
60.1 67.0
0
20
40
60
80
100
0
200
400
600
800
1000
1200
1400
1600
Cou
nts
Rate of the thermal NO route
Cum
ula
tive
counts
0
20
40
60
80
100
0
200
400
600
800
1000
1200
1400
1600
Cou
nts
Rate of the prompt NO route
Cum
ula
tive
cou
nts
0
20
40
60
80
100
0
200
400
600
800
1000
1200
1400
1600
Co
un
ts
Rate of the via N2O NO route
Cu
mu
lativ
eco
unts
0
20
40
60
80
100
0
200
400
600
800
1000
1200
1400
1600
Co
un
ts
Rate of the via NNH NO route
Cu
mu
lativ
eco
unts
0
20
40
60
80
100
0
200
400
600
800
1000
1200
1400
1600
Cou
nts
Rate of the thermal NO route
Cu
mula
tive
counts
0
20
40
60
80
100
0
200
400
600
800
1000
1200
1400
1600
Cou
nts
Rate of the prompt NO route
Cum
ula
tive
counts
0
20
40
60
80
100
0
200
400
600
800
1000
1200
1400
1600
Counts
Cum
ula
tive
counts
0
20
40
60
80
100
0
200
400
600
800
1000
1200
1400
1600
Cou
nts
Rate of the via NNH NO route
Cum
ula
tive
counts
Rate of the via N2O NO route
Figure 7 The approximate PDF and CDF of the rates of the four main routes leading to NO formation at equivalence ratiosϕ = 0.76 and 1.06 in Case I. [Color figure can be viewed in the online issue, which is available at www.interscience.wiley.com.]
International Journal of Chemical Kinetics DOI 10.1002/kin

UNCERTAINTY ANALYSIS OF NO PRODUCTION DURING METHANE COMBUSTION 765
60.1 67.0
0
20
40
60
80
100
0.00E+0000
200
400
600
800
1000
1200
1400
1600
1800
Counts
Rate of the thermal NO route
0
20
40
60
80
100
00
200
400
600
800
1000
1200
1400
1600
1800
Co
un
ts
Rate of the thermal NO route
Cu
mu
lativ
eco
unts
0
20
40
60
80
100
0
200
400
600
800
1000
1200
1400
1600
1800
Co
un
ts
Rate of the prompt NO route
Cu
mu
lativ
eco
unts
Cu
mu
lativ
eco
unts
0
20
40
60
80
100
0
200
400
600
800
1000
1200
1400
1600
1800
Co
un
ts
Rate of the prompt NO route
Cum
ula
tive
counts
0
20
40
60
80
100
0
200
400
600
800
1000
1200
1400
1600
1800
Co
un
ts
Rate of the via N2O NO route
Cum
ula
tive
cou
nts
0
20
40
60
80
100
0
200
400
600
800
1000
1200
1400
1600
1800
Co
un
ts
Rate of the via N2O NO route
Cu
mula
tive
counts
0
20
40
60
80
100
0
200
400
600
800
1000
1200
1400
1600
1800
Co
un
ts
Rate of the via NNH NO route
Cu
mu
lativ
eco
unts
0
20
40
60
80
100
0
200
400
600
800
1000
1200
1400
1600
1800
Co
un
ts
Rate of the via NNH NO route
Cum
ula
tive
counts
Figure 8 The approximate PDF and CDF of the rates of the four main routes leading to NO formation at equivalence ratiosϕ = 0.76 and 1.06 in Case II. [Color figure can be viewed in the online issue, which is available at www.interscience.wiley.com.]
International Journal of Chemical Kinetics DOI 10.1002/kin

766 ZSELY, ZADOR, AND TURANYI
contribute to the NO formation significantly. In Case I,the absolute contribution of the route through N2Odoes not change when the equivalence ratio increasesto 1.06, while the other routes are enhanced, especiallythe prompt route. This implies that the relative impor-tance of the N2O route is decreasing. At ϕ = 1.54, theprompt route is almost the unique route for the NO for-mation. However, it is interesting that for some param-eter sets negative values appear in Fig. 6. This meansthat there were parameter sets that defined mechanismsin which the NO, formed in one or other routes, waspartially converted back to N2 by the key reactions ofother route(s). For example, in Case I at ϕ = 1.54, it ispossible that some NO formed by the prompt route ispartially converted back to N2 by the N2O route initi-ation steps. In Case II the N2O route is almost never asink of NO at the same conditions. Figures 7 and 8 in-dicate that the prompt route has the highest uncertainty,which can be understood, because the uncertainty ofthe reactions of C/H species has a significant contribu-tion to the uncertainty of NO formation via the promptroute. This uncertainty is more emphasized at higherequivalence ratios. These results on the relative con-tributions of the NO formation routes are generally inaccordance with the general rules derived by the com-mon textbooks, but there are some unexpected ones.For example, it was not expected that at lean and sto-ichiometric conditions the contribution of the variousNO formation routes could vary from insignificant todominant, depending on the values of parameters bychanging these values within their realistic limits. Thisrevealed how misleading the similar investigations lim-ited to the nominal values of parameters could be.
CONCLUSIONS
Nitric oxide is a major air pollutant, and almost allemitted NO comes from combustion processes. Thegood understanding of the NO formation chemistry isvery important. This includes the knowledge of thereliability of the NO concentration calculations in thesimulation of perfectly stirred reactor experiments andthe share of the main NO formation routes.
In this paper, two versions of the Leeds methaneoxidation mechanism with the NOx reaction blockwere used. In Case I, the enthalpies of formation ofall species were updated to reflect the development inthe accuracy of thermodynamic data since the publi-cation [44] of the mechanism. There is an accumu-lating body of evidence that the major intermediateof the prompt NO formation is not HCN, as it waspreviously assumed, but NCN. For this reason, wecreated a modified version of the Leeds mechanism,
called Case II mechanism, in which the debated reac-tion N2 + CH = HCN + N was replaced with reactionN2 + CH = NCN + H. Other producing and consum-ing reactions of NCN were also added to the mecha-nism. In Case II, the rate parameters of the high sensi-tivity reactions of the N-species were also updated.
The present calculations confirm that simple com-parison of the experimental data and the resultsof chemical kinetic simulations is not informativeenough. For lean and stoichiometric mixtures, the ex-perimental data of Bartok et al. [48], considering theiruncertainty, are within the 1σ standard deviation ofthe simulation results in both cases. In Case I at thesimulation of rich mixtures, no realistic tuning of theparameters could reproduce the measured NO concen-trations. Inclusion of the NCN reactions (Case II) gen-erally decreased the uncertainty of the calculated NOconcentrations. In Case II at rich mixtures, the exper-imental points were outside the 1σ standard deviationof the simulation results, but the calculations indicatedthat a realistic set of rate parameters for this extendedmechanism could reproduce the experimental data.
The standard deviations of the calculated NO con-centrations were calculated by both local uncertaintyand Monte Carlo analyses, and good agreement wasfound between the two methods at each equivalenceratios in both cases.
Parameters having the highest uncertainty contribu-tions were identified. The important parameters weremainly related to reactions of NO formation routes. Thelists of the important reactions in both cases are similar,but the prompt route related reactions are much moreemphasized in Case II. The uncertainty of NO concen-tration caused by enthalpies of formations of specieswas smaller than those of the rate coefficients of reac-tions. Only the enthalpy of formation of NNH plays asignificant role in lean mixtures, and only in Case I. De-termination with lower uncertainty of these Arrheniusparameters, and enthalpies of formation would sig-nificantly lower the uncertainty of the calculated NOconcentration. In lean mixtures, the uncertainty contri-butions of enthalpies of formation were much larger inCase I than in Case II. In rich mixtures, the contribu-tions of enthalpies of formation were small and therewas no significant difference between the cases.
A reaction rate-based method was introduced andapplied in the Monte Carlo calculations to determinethe contribution of the various NO formation routes.The results were not limited to the nominal valuesof the parameters and, unlike in some previous pub-lications, untruncated mechanisms were used. In richmixtures, the prompt route was the only significantone in both cases. In lean mixtures the Case I mech-anism favored the via N2O route, whereas using the
International Journal of Chemical Kinetics DOI 10.1002/kin

UNCERTAINTY ANALYSIS OF NO PRODUCTION DURING METHANE COMBUSTION 767
Case II mechanism all routes had similar share. Thedependence of the relative contributions of the NO for-mation routes on the values of parameters was usuallyquite large, which showed that taking into account therelative contributions at the nominal parameter valuesonly might lead to misinterpretations.
The unpublished review of Prof. Lajos Zalotai on the rec-ommended values and uncertainties of the enthalpies of for-mation of N-containing species was utilized. The authorsthank the helpful discussions on the thermodynamic data ofnitrogen species with Dr. Branko Ruscic.
BIBLIOGRAPHY
1. Warnatz, J. Proc Combust Inst 1992, 24, 553–579.2. Bromly, J. H.; Barnes, F. J.; Muris, S.; You, X.; Haynes,
B. S. Combust Sci Technol 1996, 115, 259–296.3. Brown, M. J.; Smith, D. B.; Taylor, S. C. Combust Flame
1999, 117, 652–656.4. Turanyi, T.; Zalotai, L.; Dobe, S.; Berces, T. Phys Chem
Chem Phys 2002, 4, 2568–2578.5. Phenix, B. D.; Dinaro, J. L.; Tatang, M. A.; Tester,
J. W.; Howard, J. B.; McRae, G. J. Combust Flame1998, 112, 132–146.
6. Reagan, M. T.; Najm, H. N.; Ghanem, R. G.; Knio,O. M. Combust Flame 2003, 132, 545–555.
7. Zador, J.; Zsely, I. G.; Turanyi, T.; Ratto, M.; Tarantola,S.; Saltelli, A. J Phys Chem A 2005, 109, 9795–9807.
8. Zador, J.; Zsely, I. G.; Turanyi, T. Reliab Eng Syst Saf2006, 91, 1232–1240.
9. Zsely, I. G.; Zador, J.; Turanyi, T. Proc Combust Inst2005, 30/(1), 1273–1281.
10. Tomlin, A. S. Reliab Eng Syst Saf 2006, 91, 1219–1231.11. Ziehn, T.; Tomlin, A. S. Int J Chem Kinet 2008, 40,
742–753.12. Warnatz, J. In Combustion Chemistry; Gardiner, W. C.
(Ed.); Springer: New York, 1984; pp. 197–360.13. Tsang, W.; Herron, J. T. J Phys Chem Ref Data 1991,
20, 609.14. Baulch, D. L.; Cobos, C. J.; Cox, R. A.; Esser, C.; Frank,
P.; Just, T.; Kerr, J. A.; Pilling, M. J.; Troe, J.; Walker,R. W.; Warnatz, J. J Phys Chem Ref Data 1992, 21,411–734.
15. Baulch, D. L.; Cobos, C. J.; Cox, R. A.; Frank, P.;Hayman, G. D.; Just, T.; Kerr, J. A.; Murrels, T.; Pilling,M. J.; Troe, J.; Walker, R. W.; Warnatz, J. CombustFlame 1994, 98, 59–79.
16. DeMore, W. B.; Sander, S. P.; Golden, D. M.; Hampson,R. F. J.; Kurylo, M. J.; Howard, C. J.; Ravishankara,A. R.; Kolb, C. E.; Molina, M. J. Evaluation number12, JPL publication 97-4; Jet Propulsion Laboratory,Pasadena, CA, 1997.
17. Atkinson, R.; Baulch, D. L.; Cox, R. A.; Hampson,R. F.; Kerr, J. A.; Rossi, M. J.; Troe, J. J Phys ChemRef Data 1999, 28, 191–393.
18. Baulch, D. L.; Bowman, C. T.; Cobos, C. J.; Cox, R. A.;Just, T.; Kerr, J. A.; Pilling, M. J.; Stocker, D.; Troe, J.;Tsang, W.; Walker, R. W.; Warnatz, J. J. Phys Chem RefData 2005, 34, 757–1397.
19. Baulch, D. L. Personal communication, 1995.20. Stull, D. R.; Prophet, H. JANAF Thermochemical Ta-
bles, 1971, and subsequent updates.21. McMillen, D. F.; Golden, D. M. Ann Rev Phys Chem
1982, 33, 493.22. Burcat, A. In Combustion Chemistry; Gardiner, W. C.
(Ed.); Springer: New York, 1984; pp. 455–504.23. Gurvich, L. V.; Veyts, I. V.; Alcock, C. B. Thermody-
namic Properties of Individual Substances; Hemisphere:New York, 1989.
24. Berkowitz, J.; Ellison, G. B.; Gutman, D. J Phys Chem1994, 98, 2744.
25. Frenkel, M.; Marsch, K. N.; Wilbrit, R. C.; Kabo,G. J.; Roganov, G. N. Thermodynamics of Organic Com-pounds in the Gas State; Thermodynamics ResearchCenter: College Station, TX, 1994.
26. Tsang, W. In Energetics of Organic Free Radicals;Simoes, J. A. M.; Greenberg, A.; Liebman, J. F. (Eds.);Blackie Academic and Professional: London, 1996;pp. 22–58.
27. Kerr, J. A.; Stocker, D. W. In CRC Handbook of Chem-istry and Physics, 81st ed.; CRC Press: Boca Raton, FL,2000–2001; pp. 9-51–9-74.
28. Chase, M. W. J Phys Chem Ref Data 1998, 27, I.29. Burcat, A. Third Millennium Ideal Gas and Condensed
Phase Thermochemical Database for Combustion Tech-nion Aerospace Engineering (TAE) Report number 867,January 2001; available at ftp://ftp.technion.ac.il/pub/supported/aetdd/thermodynamics, http://garfield.chem.elte.hu/Burcat/burcat.html, accessed 2007.
30. Sander, S. P.; Friedl, R. R.; Ravishankara, A. R.; Golden,D. M.; Kolb, C. E.; Kurylo, M. J.; Huie, R. E.; Orkin,V. L.; Molina, M. J.; Moortgat, G. K.; Finlayson-Pitts,B. J. Chemical Kinetics and Photochemical Data forUse in Atmospheric Studies, evaluation number 14, JPLpublication 02-25; Jet Propulsion Laboratory, Pasadena,CA, 2003.
31. Ruscic, B.; Boggs, J. E.; Burcat, A.; Csaszar, A. G.;Demaison, J.; Janoschek, R.; Martin, J. M. L.; Morton,M. L.; Rossi, M. J.; Stanton, J. F.; Szalay, P. G.;Westmoreland, P. R.; Zabel, F.; Berces, T. J Phys ChemRef Data 2005, 34, 573–656.
32. Ruscic, B.; Pinzon, R. E.; Morton, M. L.; Von Laszevski,G.; Bittner, S. J.; Nijsure, S. G.; Amin, K. A.; Minkoff,M.; Wagner, A. F. J Phys Chem A 2004, 108, 9979–9997.
33. Ruscic, B.; Pinzon, R. E.; Morton, M. L.; Srinivasan,N. K.; Su, M.; Sutherland, J. W.; Michael, J. V. J PhysChem A 2006, 110, 6592–6601.
34. Frenklach, M.; Packard, A.; Seiler, P.; Feeley, R. Int JChem Kinet 2004, 36, 57.
35. Feeley, R.; Seiler, P.; Packard, A.; Frenklach, M. J PhysChem A 2004, 108, 9573–9583.
36. Saltelli, A.; Scott, M.; Chen, K. Sensitivity Analysis;Wiley: Chichester, UK, 2000.
International Journal of Chemical Kinetics DOI 10.1002/kin
768 ZSELY, ZADOR, AND TURANYI
37. Guo, H.; Smallwood, G. J.; Fengshan, L.; Ju, Y.; Gulder,O. L. Proc Combust Inst 2005, 30, 303–311.
38. Moskaleva, L. V.; Lin, M. C. Proc Combust Inst 2000,28, 2393–2401.
39. Smith, G. P. Chem Phys Lett 2003, 367, 541–548.40. El Bakali, A.; Pillier, L.; Desgroux, P.; Lefort, B.;
Gasnot, L.; Pauwels, J. F.; da Costa, I. Fuel 2006, 85,896–909.
41. Vasudevan, V.; Hanson, R. K.; Bowman, C. T.; Golden,D. M.; Davidson, D. F. J Phys Chem A 2007, 111,11818–11830.
42. Harding, L. B.; Klippenstein, S. J.; Miller, J. A. J PhysChem A 2008, 112, 522–532.
43. Hughes, K. J.; Turanyi, T.; Clague, A. R.; Pilling, M. J.Int J Chem Kinet 2001, 33, 513–538.
44. Hughes, K. J.; Tomlin, A. S.; Hampartsoumian, E.;Nimmo, W.; Zsely, I. G.; Ujvari, M.; Turanyi, T.; Clague,A. R.; Pilling, M. J. Combust Flame 2001, 124, 573–589.
45. Glarborg, P.; Kee, R. J.; Grcar, J. F.; Miller, J. A. PSR:A Fortran Program for Modeling Well-Stirred Reactors;SAND86-8209, 1986.
46. Kee, R. J.; Rupley, F. M.; Miller, J. A. Chemkin-II: AFortran Chemical Kinetics Package for the Analysis ofGas Phase Chemical Kinetics; SAND89-8009B, 1989.
47. Turanyi, T.; Zsely, I. G. KINALC: A CHEMKIN basedprogram for kinetic analysis, available at http:/garfield.chem.elte.hu/Combustion/Combustion.html, accessed2007.
48. Bartok, W.; Engelman, V. S.; Goldstein, R.; del Valle,E. G. AIChE Symp 1972, 126, 30–38.
49. Bowman, C. T.; Hanson, R. K.; Davidson, D. F.;Gardiner, W. C.; Lissianski, V.; Smith, G. P.; Golden,
D. M.; Frenklach, M.; Goldenberg, M. GRI-Mech 2.11,available at http://www.me.berkeley.edu/gri mech/,accessed 2007.
50. Smith, G. P.; Golden, D. M.; Frenklach, M.; Moriary,N. W.; Eiteneer, B.; Goldenberg, M.; Bowman, C. T.;Hanson, R. K.; Song, S.; Gardiner, W. C.; lissianski,V. V.; Qin, Z. GRI-Mech 3.0, available at http://www.me.berkeley.edu/gri mech/, accessed 2007.
51. Rortveit, G. J.; Hustad, J. E.; Li, S. C.; Williams, F. A.Combust Flame 2002, 130, 48–61.
52. Nishioka, M.; Nakagawa, S.; Ishikawa, Y.; Takeno, T.Combust Flame 1994, 98, 127–138.
53. Miller, J. A.; Bowman, C. T. Prog Energy Combust Sci1989, 15, 287–338.
54. Naha, S.; Aggarwal, S. K. Combust Flame 2004, 139,90–105.
55. Guo, H.; Smallwood, G. J. In 4th Mediterranean Com-bustion Symposium, Lisbon, Portugal, 2005, pp. VII/7.
56. Loffler, G.; Sieber, R.; Harasek, M.; Hofbauer, H.;Hauss, R.; Landauf, J. Fuel 2006, 85, 513–523.
57. Konnov, A. A. Combust Flame 2003, 134, 421–424.
58. Ruscic, B.; Boggs, J. E.; Burcat, A. J Phys Chem RefData 2005, 34, 573.
59. Lin, M. C.; He, Y. S.; Melius, C. F. Int J Chem Kinet1992, 24, 498–516.
60. Tsang, W. J. Phys Chem Ref Data 1992, 21, 753–791.
61. Glarborg, P.; Alzueta, M. U.; Dam-Johansen, K.; Miller,J. A. Combust Flame 1998, 115, 1–27.
62. Davidson, D. F.; Hanson, R. K. Proc Combust Inst 1991,23, 267.
International Journal of Chemical Kinetics DOI 10.1002/kin