Ultrafast laser-induced guided elastic waves in a freestanding ...
10
PHYSICAL REVIEW B 103, 064303 (2021) Ultrafast laser-induced guided elastic waves in a freestanding aluminum membrane Hao Zhang , 1 , * Alessandro Antoncecchi, 1, 2 Stephen Edward , 1, 3 Paul Planken, 1, 3 and Stefan Witte 1, 2 , † 1 Advanced Research Center for Nanolithography, Science Park 106, 1098 XG Amsterdam, Netherlands 2 Vrije Universiteit Amsterdam, De Boelelaan 1105, 1081 HV, Amsterdam, Netherlands 3 Universiteit van Amsterdam, Science Park 904, 1098 XH Amsterdam, Netherlands (Received 21 September 2020; revised 20 January 2021; accepted 25 January 2021; published 4 February 2021) Ultrafast laser-induced guided acoustic waves in thin, freely suspended films are important for many applica- tions adopting the laser-ultrasonics technique. These waves show unique dispersion relations, leading to minimal propagation losses and acoustic energy confinement. While this principle has been known, the separation of various physical effects in the formation of measured signals involving these guided acoustic waves has not been clearly elaborated. Here, we present a combined experimental and theoretical study on all-optical excitation and detection of these waves in a thin, freestanding aluminum membrane. The acoustic dynamics is excited and measured by using a femtosecond time-resolved pump-probe technique with controlled probing position, enabling spatially resolved detection. The measured signals are compared with an advanced numerical model that we developed earlier [H. Zhang et al., Phys. Rev. Appl. 13, 014010 (2020)], showing excellent agreement. The combination of experiment and simulation allows us to decode various physical effects in the signal formation, including different acoustic field components. Unknown material properties, such as acoustic attenuation coefficients, and the two complex photoelastic constants are quantitatively retrieved by fitting the measured signals. Furthermore, we provide evidence of nonlinear propagation of the excited guided acoustic waves. DOI: 10.1103/PhysRevB.103.064303 I. INTRODUCTION Laser-induced high-frequency (GHz-THz range) elastic waves (also referred to as acoustic waves or hypersound) in solids are extensively used in both industrial and academic research. In contrast to light, almost all solids are transpar- ent to sound, including many optically opaque media. For this reason, many noninvasive methods for evaluating bulk materials based on laser-induced elastic excitations are es- tablished. Recent advanced applications include using elastic excitation for communicating with quantum systems [1–3], imaging buried nanostructures [4,5], quantitative retrieval of phononic and mechanical properties [6,7], subsurface detec- tion of alignment gratings for photolithography [8], and more. Earlier studies on laser-induced elastic waves were mostly focused on the investigation of one-dimensional propagation of excited longitudinal phonons [9–14], which have yielded remarkable results about the phonon generation mechanism itself. Further progress in the field has enabled the generation and detection of shear phonons [15–17] and surface acoustic waves [16,18,19]. Among these more complex types of waves, * [email protected] † [email protected] Published by the American Physical Society under the terms of the Creative Commons Attribution 4.0 International license. Further distribution of this work must maintain attribution to the author(s) and the published article’s title, journal citation, and DOI. Lamb waves are attracting increasing attention owing to their unique properties and potential for specialized applications. Lamb waves are guided acoustic wave modes existing in thin and freely suspended films [20]. The propagation behavior of Lamb waves can be used for the nondestructive characteri- zation of thin films. One example is the zero-group-velocity modes, where the group velocity of the Lamb wave vanishes, resulting in acoustic energy localization in the source region [21], offering reduced acoustic losses and enabling local ma- terial sensing and testing applications [22,23]. The excitation of Lamb waves requires a component of the particle movement in the direction parallel to the free surface. In laser ultrasonics, this is usually realized by either tightly focusing the excitation laser pulse [21,24] or by employing nanostructured surfaces [25]. The dynamics of phonon evolu- tion is then detected by a delayed probe pulse in a pump-probe configuration. Despite the already established progress on laser generation and detection of Lamb waves, there is still a need for a comprehensive and detailed comparison between the measured signal and an advanced model describing the dynamics over timescales that span orders of magnitude. Fur- thermore, the role of thermal and acoustic contributions as well as different acoustic field components in the evolution of the signal shape and the evolution of the Lamb waves over propagation distance have not yet been fully investigated. Acoustic attenuation of the Lamb waves is another important factor that is of practical importance, as it limits the interaction distance in various applications. Here, we present a combined experimental and theoreti- cal study of ultrafast laser-induced elastic waves in a thin, freestanding aluminum membrane. In our experiments, we 2469-9950/2021/103(6)/064303(10) 064303-1 Published by the American Physical Society
-
Upload
khangminh22 -
Category
Documents
-
view
1 -
download
0
Transcript of Ultrafast laser-induced guided elastic waves in a freestanding ...
PHYSICAL REVIEW B 103, 064303 (2021)
Ultrafast laser-induced guided elastic waves in a freestanding aluminum membrane
Hao Zhang ,1,* Alessandro Antoncecchi,1,2 Stephen Edward ,1,3 Paul Planken,1,3 and Stefan Witte 1,2,†
1Advanced Research Center for Nanolithography, Science Park 106, 1098 XG Amsterdam, Netherlands2Vrije Universiteit Amsterdam, De Boelelaan 1105, 1081 HV, Amsterdam, Netherlands
3Universiteit van Amsterdam, Science Park 904, 1098 XH Amsterdam, Netherlands
(Received 21 September 2020; revised 20 January 2021; accepted 25 January 2021; published 4 February 2021)
Ultrafast laser-induced guided acoustic waves in thin, freely suspended films are important for many applica-tions adopting the laser-ultrasonics technique. These waves show unique dispersion relations, leading to minimalpropagation losses and acoustic energy confinement. While this principle has been known, the separationof various physical effects in the formation of measured signals involving these guided acoustic waves hasnot been clearly elaborated. Here, we present a combined experimental and theoretical study on all-opticalexcitation and detection of these waves in a thin, freestanding aluminum membrane. The acoustic dynamicsis excited and measured by using a femtosecond time-resolved pump-probe technique with controlled probingposition, enabling spatially resolved detection. The measured signals are compared with an advanced numericalmodel that we developed earlier [H. Zhang et al., Phys. Rev. Appl. 13, 014010 (2020)], showing excellentagreement. The combination of experiment and simulation allows us to decode various physical effects in thesignal formation, including different acoustic field components. Unknown material properties, such as acousticattenuation coefficients, and the two complex photoelastic constants are quantitatively retrieved by fitting themeasured signals. Furthermore, we provide evidence of nonlinear propagation of the excited guided acousticwaves.
DOI: 10.1103/PhysRevB.103.064303
I. INTRODUCTION
Laser-induced high-frequency (GHz-THz range) elasticwaves (also referred to as acoustic waves or hypersound) insolids are extensively used in both industrial and academicresearch. In contrast to light, almost all solids are transpar-ent to sound, including many optically opaque media. Forthis reason, many noninvasive methods for evaluating bulkmaterials based on laser-induced elastic excitations are es-tablished. Recent advanced applications include using elasticexcitation for communicating with quantum systems [1–3],imaging buried nanostructures [4,5], quantitative retrieval ofphononic and mechanical properties [6,7], subsurface detec-tion of alignment gratings for photolithography [8], and more.
Earlier studies on laser-induced elastic waves were mostlyfocused on the investigation of one-dimensional propagationof excited longitudinal phonons [9–14], which have yieldedremarkable results about the phonon generation mechanismitself. Further progress in the field has enabled the generationand detection of shear phonons [15–17] and surface acousticwaves [16,18,19]. Among these more complex types of waves,
*[email protected]†[email protected]
Published by the American Physical Society under the terms of theCreative Commons Attribution 4.0 International license. Furtherdistribution of this work must maintain attribution to the author(s)and the published article’s title, journal citation, and DOI.
Lamb waves are attracting increasing attention owing to theirunique properties and potential for specialized applications.Lamb waves are guided acoustic wave modes existing in thinand freely suspended films [20]. The propagation behavior ofLamb waves can be used for the nondestructive characteri-zation of thin films. One example is the zero-group-velocitymodes, where the group velocity of the Lamb wave vanishes,resulting in acoustic energy localization in the source region[21], offering reduced acoustic losses and enabling local ma-terial sensing and testing applications [22,23].
The excitation of Lamb waves requires a component of theparticle movement in the direction parallel to the free surface.In laser ultrasonics, this is usually realized by either tightlyfocusing the excitation laser pulse [21,24] or by employingnanostructured surfaces [25]. The dynamics of phonon evolu-tion is then detected by a delayed probe pulse in a pump-probeconfiguration. Despite the already established progress onlaser generation and detection of Lamb waves, there is stilla need for a comprehensive and detailed comparison betweenthe measured signal and an advanced model describing thedynamics over timescales that span orders of magnitude. Fur-thermore, the role of thermal and acoustic contributions aswell as different acoustic field components in the evolutionof the signal shape and the evolution of the Lamb wavesover propagation distance have not yet been fully investigated.Acoustic attenuation of the Lamb waves is another importantfactor that is of practical importance, as it limits the interactiondistance in various applications.
Here, we present a combined experimental and theoreti-cal study of ultrafast laser-induced elastic waves in a thin,freestanding aluminum membrane. In our experiments, we
2469-9950/2021/103(6)/064303(10) 064303-1 Published by the American Physical Society

HAO ZHANG et al. PHYSICAL REVIEW B 103, 064303 (2021)
800 nm, 70 fs5.1 MHz Pump @ 400 nm
Probe @ 800 nm
Chopper @ 5 kHz
crystal
Photodetector
DelayLine
Sample
PBS
λ/2
λ/2
λ/4
Lock-in
Dichroic mirror
λ/4λ/2
ObjectiveNA 0.45
L1
L2BS
L3
M1
(a) (b)Pump
Probe
D
FIG. 1. (a) Schematic of the experimental setup. The pump beam is tightly focused on the sample surface using a microscope objective. Theprobe beam is positioned at different distances D with respect to the pump beam. (b) Reflectivity changes measured on a 200 nm aluminumfreestanding membrane, for different values of probe shift. The reflectivity changes are measured through a modulation of the dielectricconstant via the photoelastic effect [Eq. (2)]. The inset in (b) illustrates the excitation of Lamb waves by the tightly focused pump beam, and itsdetection using a spatially shifted probe beam. The black arrows are the displacement vector of the excited Lamb waves (not to scale, only forillustrative purpose). The color circles illustrate the relative position of the focused pump (blue) and probe (red) beams for each measurement.
use a tightly focused laser pulse to generate high-frequencyLamb waves. The optical response is probed at various loca-tions with respect to the focused pump pulse. The measuredsignals are shown to be in excellent agreement with an ad-vanced model that we developed earlier [6]. This combinedexperimental and theoretical approach allows us to addressseveral key aspects of Lamb wave evolution: the separationof signal contribution due to different strain components, thethermo-optical effects, as well as quantitative determinationsof acoustic propagation losses and the complex photoelasticcoefficients. In addition, we present evidence of nonlinearpropagation of the excited high-amplitude Lamb waves andshow that acoustic nonlinearity can alter the measured signalshape.
The paper is organized as follows: In Sec. II, we dis-cuss the experimental setup and the probe position-dependentmeasurements. In Sec. III, we briefly discuss the model wedeveloped earlier and its adaptation to the current experiment,as well as the fitting approach. In Sec. IV, we present theresults and interpretations.
II. POSITION-DEPENDENT PUMP-PROBEMEASUREMENTS
A schematic of the experimental setup is shown inFig. 1(a). The output of a Ti:sapphire oscillator (FemtolasersXL500: wavelength centered at 800 nm, pulse duration 70 fs,repetition rate 5.1 MHz) is split into two beams with a 90:10beam splitter. The beam with higher intensity is used togenerate the second harmonic (400 nm) of the fundamen-tal wavelength using a β-barium borate (BBO) crystal. Thisconverted 400 nm beam is used as the pump beam with avariable optical path length by using a mechanical translationstage (PI) as the optical delay line. This beam is focused by
a microscope objective (Olympus LCPLN20XIR, x20, N.A.0.45) onto the sample surface. The pump power after theobjective is measured to be 5.5 mW. The beam with thefundamental wavelength (800 nm) is used as the probe beam.The probe beam is sent through a telescope system consistingof two lenses: L1 with a focal length of 100 mm and L2 witha focal length of 200 mm. The telescope system expands thebeam such that it fills the entire objective aperture to form adiffraction-limited probe spot. The mirror M1 in front of L1is mounted on a two-axes mirror mount and is imaged ontothe back-focal plane of the objective. By changing the angleof incidence of the beam on the lens L1, an area on the samplesurface can be scanned by the probe beam, while leavingthe pump beam position fixed [26]. We monitor the position ofthe probe spot on the sample using an imaging system com-posed of the objective and the L3 (f = 200 mm) lens whichprojects an image of the sample plane into a CCD camera.With the camera, we also measure the focal waist of the probebeam as wprobe = 1.2 μm at 1/e2 intensity. The physical pixelsize of the camera is 2.2 μm, and with a magnification of 20X,we can determine the probe center position with an accuracyclose to 100 nm. With the CCD camera, we also measurethe focused probe spot size versus the probe displacement.The probe spot size slightly increases as it is moved awayfrom the pump spot. By fitting the probe spot image to atwo-dimensional (2D) Gaussian function, the maximum in-crease in the spot radius is about 100 nm at the largest probingdistance (5.5 μm). The size variations at shorter displace-ments are even smaller. Such small variations of the probesize are far below the spot size itself and estimated lateralacoustic wavelength. Therefore, its effect on the measuredsignals is negligible. The probe light reflected by the sample isfocused on a silicon photodiode (Thorlabs PDA100A2). Thephotodiode signal is sent to a lock-in amplifier referenced by
064303-2
ULTRAFAST LASER-INDUCED GUIDED ELASTIC WAVES … PHYSICAL REVIEW B 103, 064303 (2021)
the chopping wheel which modulates the pump beam at afrequency of 5 kHz. A calibration of the lock-in output signalallows one to record the absolute reflectivity change.
The reflectivity changes are measured for a range ofprobing distances (0–5.5 μm) on an aluminum freestandingmembrane of 200 nm thickness. The maximum probing dis-tance enables the detection of Lamb waves propagating awayfrom the pumped region. Figure 1(b) shows typical pump-probe traces measured at three different probing positions. Forthe zero probing position, a large and sharp peak is observedimmediately after the pump excitation, which is caused by anabrupt heating of the free electrons and lattices. This initialpeak is not fully shown in the graph to better visualize theacoustic signals that are more important for this work. Repet-itive dips are observed after, which corresponds to an acousticpulse bouncing back and forth in the freestanding membrane.Differences in the background shape are also observed fordifferent probing positions. Detailed discussions and interpre-tation will be presented in the following sections.
III. THEORY
A. The numerical model
In order to understand the signal formation and to interpretthe measured data, we use the numerical model developedearlier in our group [6]. In the model, we incorporate thephysics of all the steps involved in a typical picosecond ul-trasonics experiment, i.e., the generation, propagation, anddetection of the ultrasound waves. For the generation, wetreat thermoelasticity as the dominant mechanism in metals[9,10]. The evolution of the lattice temperature is modeled bythe two-temperature model [27] with actual laser irradiationconditions as model inputs. For the sound propagation, wenumerically solve the equation of motion for an isotropicelastic wave, with further incorporation of sound attenuationterms [6,28,29]:
ρ∂2u∂t2
= μ∇2u + (μ + λ)∇(∇ · u) + ∇σth
+ ξ∇2v + (ξ + λv )∇(∇ · v), (1)
where σth is the thermal stress generated by the laser pulse,u is the displacement vector, ρ is the mass density, λ and μ
are the two Lamé parameters, v is the velocity vector, ξ is thecoefficient of shear viscosity, and λv is linked to the coefficientof bulk viscosity η as λv = η − 2ξ/3. The thermal stress σth
is coupled to the generation step of the model through ther-moelasticity.
Equation (1) is solved by the finite-difference time-domain(FDTD) method [30] in a two-dimensional (2D) geometrywith the incorporation of proper boundary conditions. For thefront and back surfaces of the membrane, a free boundarycondition is implemented which requires the total stress at theair-metal interface to vanish. For the two lateral boundaries,perfectly matched layers (PMLs) [31] are implemented toabsorb nonphysical reflections from the edges of the numer-ical grid. By solving Eq. (1), the two strain components sx
and sy as well as the shear strain sxy can be obtained [6].Here, x refers to the axis perpendicular to the sample surface,while y refers to the axis parallel to it. Having those strain
components, the change in the electric permittivity tensorcan be evaluated, provided that the photoelastic tensor isknown. Here we assume the material is isotropic, and thusthe photoelastic tensor has only two unknowns, P11, P12 andP44 = (P11 − P12)/2 [15]. The probe beam at our photodetec-tor position is linearly polarized, and thus we only have toconsider the y component of the electric field of the probebeam. Under these assumptions, the changes in the permittiv-ity tensor elements are
εyy = −ε2r (P11sy + P12sx ); εxy = −ε2
r P44sxy, (2)
where εr is the dielectric constant of aluminum in the unper-turbed state. In our data analysis, we have found that includingεxy does not result in a better model fit through the mea-sured data, indicating its negligible contribution. Thus, in thefollowing analysis, εxy = 0.
Having the value of the permittivity change, the reflectivitychange can be calculated by solving the Maxwell’s equationsfor the probe pulse. In this work, the transform matrix method[32] is used, which also takes into account the permittivitygradient along the propagation direction of the probe pulse.
B. Least-squares fitting the measured data
The model described in the previous section is used to fitthe measured data using the least-squares algorithm. Mate-rial properties such as the electron-phonon coupling constant,thermo-optic coefficient, photoelastic coefficients P11 and P12,acoustic attenuation coefficient, as well as membrane thick-ness are treated as fitting parameters. The longitudinal speedof sound in aluminum is fixed as cl = 6420 m/s [33] dur-ing the fitting. The focal beam waist of the probe beam ismeasured as wprobe = 1.2 μm. The measured signal at dif-ferent probing positions can be seen as a convolution of theprobe beam with the response function induced by the pumpbeam, which already contains information about the size ofthe focused pump beam. Therefore, the focal beam waist ofthe pump beam is treated as an extra fitting parameter. Otherparameters used in the model are either taken from knownliterature values or estimated from experimental conditions.
IV. RESULTS AND DISCUSSION
Measurements were performed on a 200-nm-thick alu-minum freestanding membrane for probing distances from 0to 5.5 μm in 0.5 μm steps. These values refer to the dis-tances from the center of the focused probe beam to thecenter of the focused pump beam. The values are determinedfrom the recorded probe spot images during the measurement.In the data analysis, we found that the best match betweenthe measured data and simulations, especially the determinedlateral propagation speed of the Lamb waves, was foundwhen a scaling factor of 0.8 was applied to these values ofthe probing distance. This is likely due to the uncertainty inthe determination of the magnification factor of our imag-ing system, limiting the accuracy of the determination ofthe probing positions. We therefore applied this scaling tothe probing distances to use as both model inputs forfitting the data and the presentation of the final results. Wenote that the scaling does not change the interpretation of the
064303-3
HAO ZHANG et al. PHYSICAL REVIEW B 103, 064303 (2021)
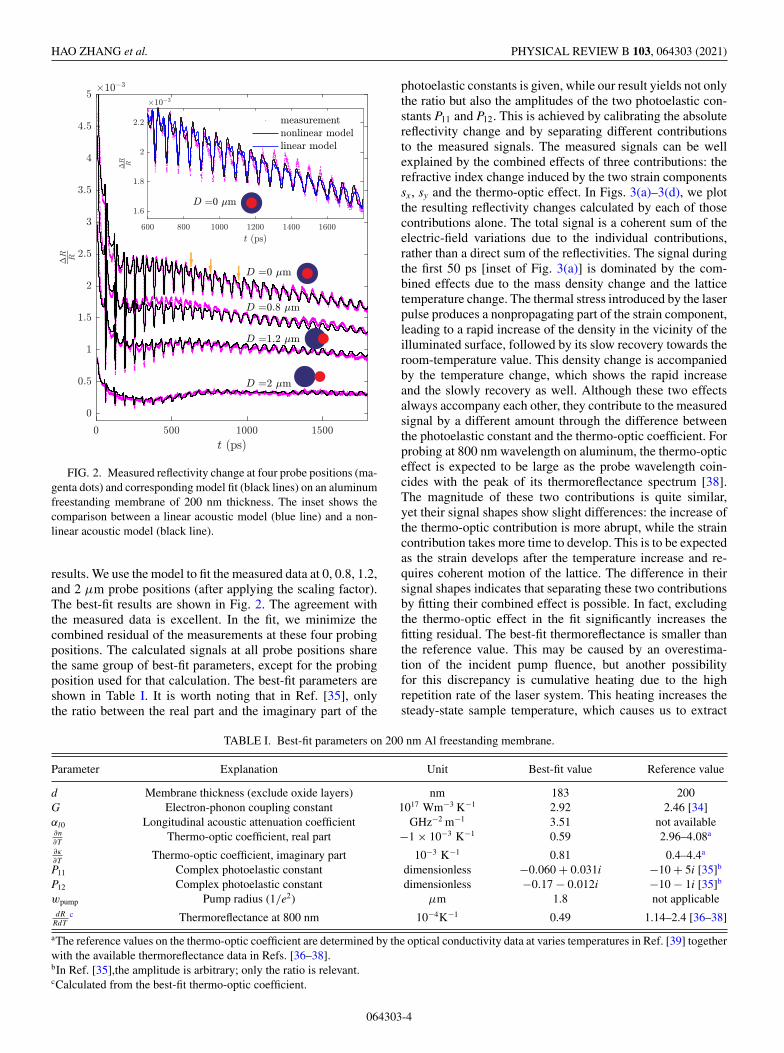
FIG. 2. Measured reflectivity change at four probe positions (ma-genta dots) and corresponding model fit (black lines) on an aluminumfreestanding membrane of 200 nm thickness. The inset shows thecomparison between a linear acoustic model (blue line) and a non-linear acoustic model (black line).
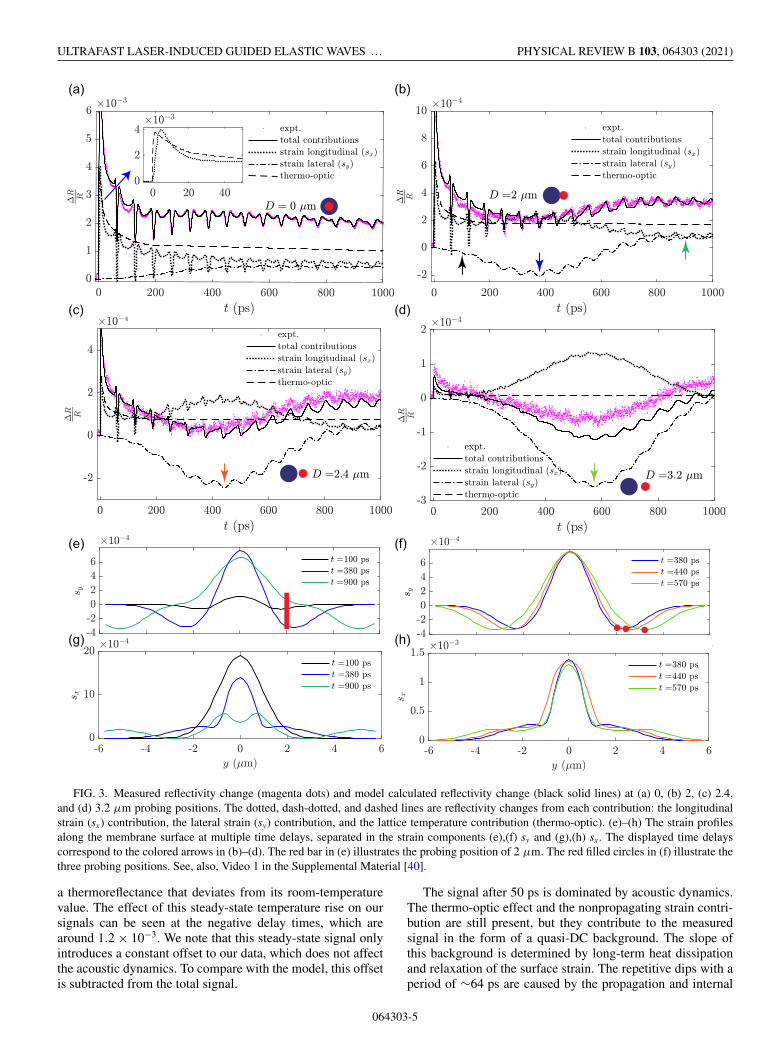
results. We use the model to fit the measured data at 0, 0.8, 1.2,and 2 μm probe positions (after applying the scaling factor).The best-fit results are shown in Fig. 2. The agreement withthe measured data is excellent. In the fit, we minimize thecombined residual of the measurements at these four probingpositions. The calculated signals at all probe positions sharethe same group of best-fit parameters, except for the probingposition used for that calculation. The best-fit parameters areshown in Table I. It is worth noting that in Ref. [35], onlythe ratio between the real part and the imaginary part of the
photoelastic constants is given, while our result yields not onlythe ratio but also the amplitudes of the two photoelastic con-stants P11 and P12. This is achieved by calibrating the absolutereflectivity change and by separating different contributionsto the measured signals. The measured signals can be wellexplained by the combined effects of three contributions: therefractive index change induced by the two strain componentssx, sy and the thermo-optic effect. In Figs. 3(a)–3(d), we plotthe resulting reflectivity changes calculated by each of thosecontributions alone. The total signal is a coherent sum of theelectric-field variations due to the individual contributions,rather than a direct sum of the reflectivities. The signal duringthe first 50 ps [inset of Fig. 3(a)] is dominated by the com-bined effects due to the mass density change and the latticetemperature change. The thermal stress introduced by the laserpulse produces a nonpropagating part of the strain component,leading to a rapid increase of the density in the vicinity of theilluminated surface, followed by its slow recovery towards theroom-temperature value. This density change is accompaniedby the temperature change, which shows the rapid increaseand the slowly recovery as well. Although these two effectsalways accompany each other, they contribute to the measuredsignal by a different amount through the difference betweenthe photoelastic constant and the thermo-optic coefficient. Forprobing at 800 nm wavelength on aluminum, the thermo-opticeffect is expected to be large as the probe wavelength coin-cides with the peak of its thermoreflectance spectrum [38].The magnitude of these two contributions is quite similar,yet their signal shapes show slight differences: the increase ofthe thermo-optic contribution is more abrupt, while the straincontribution takes more time to develop. This is to be expectedas the strain develops after the temperature increase and re-quires coherent motion of the lattice. The difference in theirsignal shapes indicates that separating these two contributionsby fitting their combined effect is possible. In fact, excludingthe thermo-optic effect in the fit significantly increases thefitting residual. The best-fit thermoreflectance is smaller thanthe reference value. This may be caused by an overestima-tion of the incident pump fluence, but another possibilityfor this discrepancy is cumulative heating due to the highrepetition rate of the laser system. This heating increases thesteady-state sample temperature, which causes us to extract
TABLE I. Best-fit parameters on 200 nm Al freestanding membrane.
Parameter Explanation Unit Best-fit value Reference value
d Membrane thickness (exclude oxide layers) nm 183 200G Electron-phonon coupling constant 1017 Wm−3 K−1 2.92 2.46 [34]αl0 Longitudinal acoustic attenuation coefficient GHz−2 m−1 3.51 not available∂n∂T Thermo-optic coefficient, real part −1 × 10⁻³ K−1 0.59 2.96–4.08a
∂κ
∂T Thermo-optic coefficient, imaginary part 10−3 K−1 0.81 0.4–4.4a
P11 Complex photoelastic constant dimensionless −0.060 + 0.031i −10 + 5i [35]b
P12 Complex photoelastic constant dimensionless −0.17 − 0.012i −10 − 1i [35]b
wpump Pump radius (1/e2) μm 1.8 not applicabledR
RdTc Thermoreflectance at 800 nm 10−4K−1 0.49 1.14–2.4 [36–38]
aThe reference values on the thermo-optic coefficient are determined by the optical conductivity data at varies temperatures in Ref. [39] togetherwith the available thermoreflectance data in Refs. [36–38].bIn Ref. [35],the amplitude is arbitrary; only the ratio is relevant.cCalculated from the best-fit thermo-optic coefficient.
064303-4
ULTRAFAST LASER-INDUCED GUIDED ELASTIC WAVES … PHYSICAL REVIEW B 103, 064303 (2021)
(a) (b)
(c) (d)
(e) (f)
(g) (h)
FIG. 3. Measured reflectivity change (magenta dots) and model calculated reflectivity change (black solid lines) at (a) 0, (b) 2, (c) 2.4,and (d) 3.2 μm probing positions. The dotted, dash-dotted, and dashed lines are reflectivity changes from each contribution: the longitudinalstrain (sx) contribution, the lateral strain (sy) contribution, and the lattice temperature contribution (thermo-optic). (e)–(h) The strain profilesalong the membrane surface at multiple time delays, separated in the strain components (e),(f) sy and (g),(h) sx . The displayed time delayscorrespond to the colored arrows in (b)–(d). The red bar in (e) illustrates the probing position of 2 μm. The red filled circles in (f) illustrate thethree probing positions. See, also, Video 1 in the Supplemental Material [40].
a thermoreflectance that deviates from its room-temperaturevalue. The effect of this steady-state temperature rise on oursignals can be seen at the negative delay times, which arearound 1.2 × 10⁻³. We note that this steady-state signal onlyintroduces a constant offset to our data, which does not affectthe acoustic dynamics. To compare with the model, this offsetis subtracted from the total signal.
The signal after 50 ps is dominated by acoustic dynamics.The thermo-optic effect and the nonpropagating strain contri-bution are still present, but they contribute to the measuredsignal in the form of a quasi-DC background. The slope ofthis background is determined by long-term heat dissipationand relaxation of the surface strain. The repetitive dips with aperiod of ∼64 ps are caused by the propagation and internal
064303-5
HAO ZHANG et al. PHYSICAL REVIEW B 103, 064303 (2021)
reflection of the longitudinal strain component sx. The periodof these longitudinal echoes is equal to one round-trip timeof the acoustic pulse. In Fig. 3(a), we see the broadeningand damping of the longitudinal echoes. This is caused bythe combined effect of acoustic attenuation and diffraction.In the model, we assume a frequency-dependent acoustic at-tenuation which is proportional to the square of the acousticfrequency [6]: αl (ω) = αl0ω
2. The attenuation coefficient αl0
is treated as a fitting parameter, which yields the value αl0 =3.51 GHz−2 m−1. The quadratic dependence indicates moreattenuation for higher frequencies, effectively broadening theacoustic pulse. At this stage, we cannot completely rule outthe possibility of interface scattering loss to the attenuationof the acoustic pulse. However, the microscopic roughness atthe metal/air interface is expected to be much finer than theacoustic wavelength, and thus scattering loss at our frequencyrange is expected to be small. The diffraction of the longi-tudinal acoustic wave also broadens the echo. The acousticdiffraction produces off-axis propagation with a slight angle,which effectively dissipates the energy and elongates the echo.
A striking aspect is the increase in the contribution of thelateral strain component (sy), which, at zero probing position,gradually reaches its maximum at ∼600 ps. The tightly fo-cused pump beam means that the effect of acoustic diffractionand the redistribution of acoustic energy from longitudinalstrain (sx) to lateral strain (sy) significantly changes the signalshape and thus can be measured. If the contribution of sy onlyslightly changes the signal shape measured at zero probingposition, its contribution becomes increasingly important anddominates the overall background shape at large off-centerprobing positions. In Figs. 3(b)–3(d), we plot the measuredsignal at three off-center probing positions and the separationof contributions by the model calculations. One interesting ob-servation is the initial decrease and the follow-up increase ofthe background signal, forming broad dips for these off-centerpositions. By looking at the sx contribution, such a broad dipis absent for D = 2 μm. For D = 2.4 and D = 3.2 μm, thesx contribution does show a broad peak at the correct tim-ing; however, it is of the opposite sign as the measurements.On the contrary, the sy contribution remarkably reproducesboth the timing and the sign of these broad dips. The sy con-tribution even goes to negative and back to positive again. Theoff-center probe measures the “passing by” of the Lamb wavestraveling in the lateral direction. In Figs. 3(e) and 3(f), weshow the lateral strain (sy) profiles along the surface of themembrane at selected time instants corresponding to the cen-ter of these broad dips. At t = 100 ps, the surface wave is justgenerated at the edges of the pump spot. At later times, thesurface wave is fully formed and starts to propagate outwardfrom the pumped region. The leading part of this wave isnegative in sy, while positive in its trailing part. The off-centerprobing positions therefore undergo relatively slow compres-sions, followed by expansions caused by the passing by ofthe lateral strain component. In Figs. 3(g) and 3(h), we showthe longitudinal strain (sx) profiles at the same time instants.The sx at these timings are all positive, and partially cancelout the reflectivity changes from the sy component. The slightdisagreement in the amplitude of the broad dip in Fig. 3(d)is expected to be caused by the geometrical diverging effect.For a diverging guided (propagating) acoustic wave spreading
from a point source in a two-dimensional space as in theexperiment, the wave energy is spread out over the cylindricalsurface area 2πrh, where r is the distance from the wavefront to the point source and h is the membrane thickness.Because of energy conservation, this leads to a 1/r decay ratefor the wave intensity. Since, for a propagating acoustic wave,the intensity is proportional to the wave amplitude squared[41,42], it translates to a 1/
√r law for the wave amplitude.
This geometrical diverging effect is absent in the 2D simula-tions. The diverging effect can be ignored inside the sourceregion, the size of which can be estimated as equal to ourfocused pump beam size (≈2wpump = 3.6 μm). For probingpositions within this range, especially for Figs. 3(a)–3(c), thediverging effect is minimum and can be neglected.
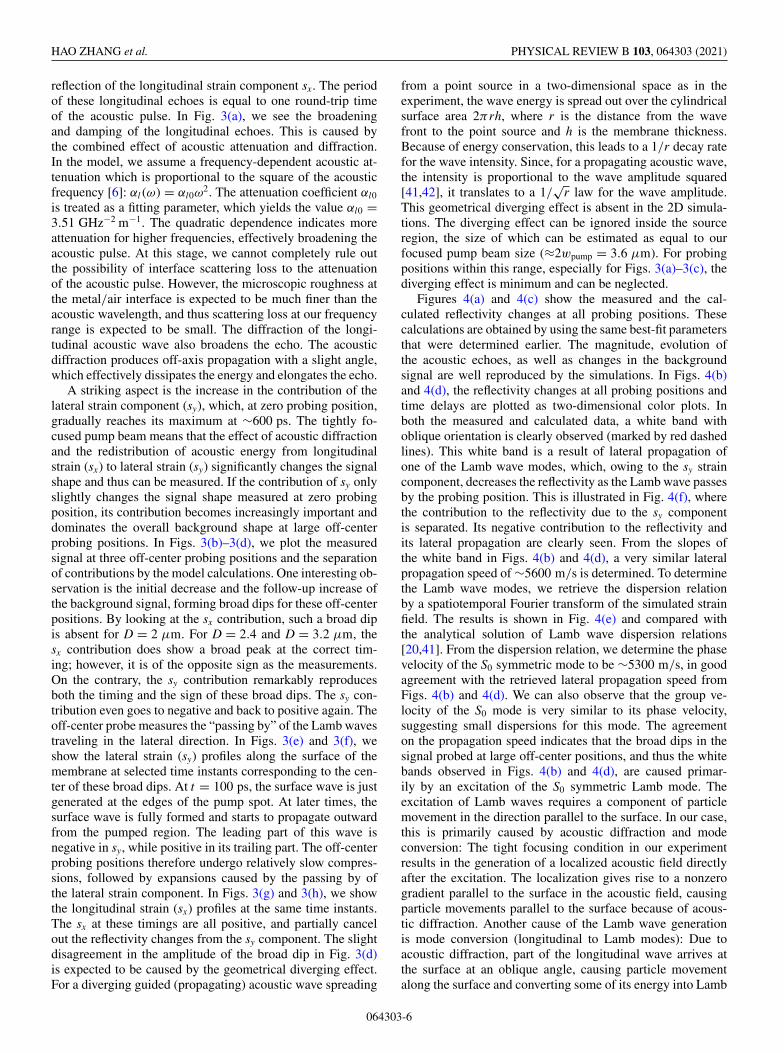
Figures 4(a) and 4(c) show the measured and the cal-culated reflectivity changes at all probing positions. Thesecalculations are obtained by using the same best-fit parametersthat were determined earlier. The magnitude, evolution ofthe acoustic echoes, as well as changes in the backgroundsignal are well reproduced by the simulations. In Figs. 4(b)and 4(d), the reflectivity changes at all probing positions andtime delays are plotted as two-dimensional color plots. Inboth the measured and calculated data, a white band withoblique orientation is clearly observed (marked by red dashedlines). This white band is a result of lateral propagation ofone of the Lamb wave modes, which, owing to the sy straincomponent, decreases the reflectivity as the Lamb wave passesby the probing position. This is illustrated in Fig. 4(f), wherethe contribution to the reflectivity due to the sy componentis separated. Its negative contribution to the reflectivity andits lateral propagation are clearly seen. From the slopes ofthe white band in Figs. 4(b) and 4(d), a very similar lateralpropagation speed of ∼5600 m/s is determined. To determinethe Lamb wave modes, we retrieve the dispersion relationby a spatiotemporal Fourier transform of the simulated strainfield. The results is shown in Fig. 4(e) and compared withthe analytical solution of Lamb wave dispersion relations[20,41]. From the dispersion relation, we determine the phasevelocity of the S0 symmetric mode to be ∼5300 m/s, in goodagreement with the retrieved lateral propagation speed fromFigs. 4(b) and 4(d). We can also observe that the group ve-locity of the S0 mode is very similar to its phase velocity,suggesting small dispersions for this mode. The agreementon the propagation speed indicates that the broad dips in thesignal probed at large off-center positions, and thus the whitebands observed in Figs. 4(b) and 4(d), are caused primar-ily by an excitation of the S0 symmetric Lamb mode. Theexcitation of Lamb waves requires a component of particlemovement in the direction parallel to the surface. In our case,this is primarily caused by acoustic diffraction and modeconversion: The tight focusing condition in our experimentresults in the generation of a localized acoustic field directlyafter the excitation. The localization gives rise to a nonzerogradient parallel to the surface in the acoustic field, causingparticle movements parallel to the surface because of acous-tic diffraction. Another cause of the Lamb wave generationis mode conversion (longitudinal to Lamb modes): Due toacoustic diffraction, part of the longitudinal wave arrives atthe surface at an oblique angle, causing particle movementalong the surface and converting some of its energy into Lamb
064303-6
ULTRAFAST LASER-INDUCED GUIDED ELASTIC WAVES … PHYSICAL REVIEW B 103, 064303 (2021)
(a)
(b)
(c)
(d)
(e)
(f)
FIG. 4. (a),(b) Measured and (c),(d) calculated reflectivity changes at all probing positions. (b),(d) The red dashed lines highlight thecontribution from the lateral propagation of the Lamb waves. Red and green represent higher values, while blue and white represent lowervalues. (e) The Lamb wave dispersion relation retrieved from the simulation shown as a colored plot. The black and red dots are solutionsof the analytical expression of Lamb wave dispersion relations. The black dots correspond to the asymmetric modes and the red dots to thesymmetric modes. (f) The calculated reflectivity contribution from the sy component, where the red arrow illustrates the propagation of the S0
Lamb mode.
waves [6]. A secondary cause is the nonzero gradient in thethermal stress along the surface direction, which can directlyfacilitate parallel particle movements. In pump-probe experi-ments using a conventional geometry, i.e., a large pump spotand a small probe spot, the lateral dynamics or Lamb wavesare expected to have negligible or minor contributions to thesignals. The gradient in the temperature and the acoustic fieldin the forward direction is usually quite large in metals due toa shallow light-penetration depth and limited thermal-energydiffusion because of high electron-phonon coupling strength.For the lateral dynamics to significantly change the measuredsignals, the pump beam needs to be tightly focused. Oursimulations with a variety of pump spot sizes show that thelateral dynamics only significantly influences the signal shapewhen the pump spot radius is smaller than 1 or 2 micrometers.
Several aspects of the data analysis need to be furtheraddressed. First, in the calculations, two aluminum oxide(Al2O3) layers with a thickness of 6 nm on both sides of thefree membrane are included. Ellipsometry measurement onthe sample confirms the presence of 6-nm-thick oxide layers.Second, the heat dissipation is expected to be caused by heatdiffusion in all lateral directions. However, our 2D simulationresults in a slower decay than what is observed in the experi-ment. To correct for this, we introduced an extra heat-loss termin the lattice temperature equation of the two-temperaturemodel. This term is in the form of −(1/τ )[Cl (Tl − T0)], whereCl is the lattice heat capacity, Tl is the lattice temperature, andT0 = 300 K is the environmental temperature. The parame-
ter τ determines the rate of heat dissipation away from thepumped area and it is treated as a fitting parameter. The best-fitτ is 5.2 ns. We note that this term does not change the simu-lated acoustic dynamics. Third, we find that adding acousticnonlinearity in the calculations significantly improves theagreement between the measured and calculated signals. Acomparison between the best-fit results using a linear acousticmodel and a nonlinear acoustic model at zero probing positionis shown in the inset of Fig. 2. The nonlinear model betterreproduces the sawtooth signal shape especially observed atlonger time delays. Acoustic nonlinearity is incorporated intothe model by adding a second-order term in the strain-stressrelation [6]: σx = −(λ + 2μ)sx − λsy + (γ /4)s2
x . The best-fitnonlinearity constant γ is found to be 1.2 × 10¹³ Pa.
Our 2D nonlinear model shows the formation of sawtooth-like temporal shapes. However, due to the complexity of themodel, the point-source excitation, and the combined influ-ence of several physical effects, an intuitive picture explainingthe formation of such signal shapes is not readily obtained.To better show the influence of nonlinear effects, we study asimpler system which qualitatively shows the same nonlineardynamics. Here we simulate the nonlinear propagation of a 1Dstrain in a 200 nm aluminium freestanding membrane. Thestrain pulse is launched in the simulation by a hypotheticalsource: we assume that the temperature of the surface layerof the membrane is increased by 40 K, with a rising time of5 ps. The surface expansion caused by this swift temperatureincrease generates a strain pulse propagating into the interior
064303-7
HAO ZHANG et al. PHYSICAL REVIEW B 103, 064303 (2021)
(a)
(b) (c) (d)
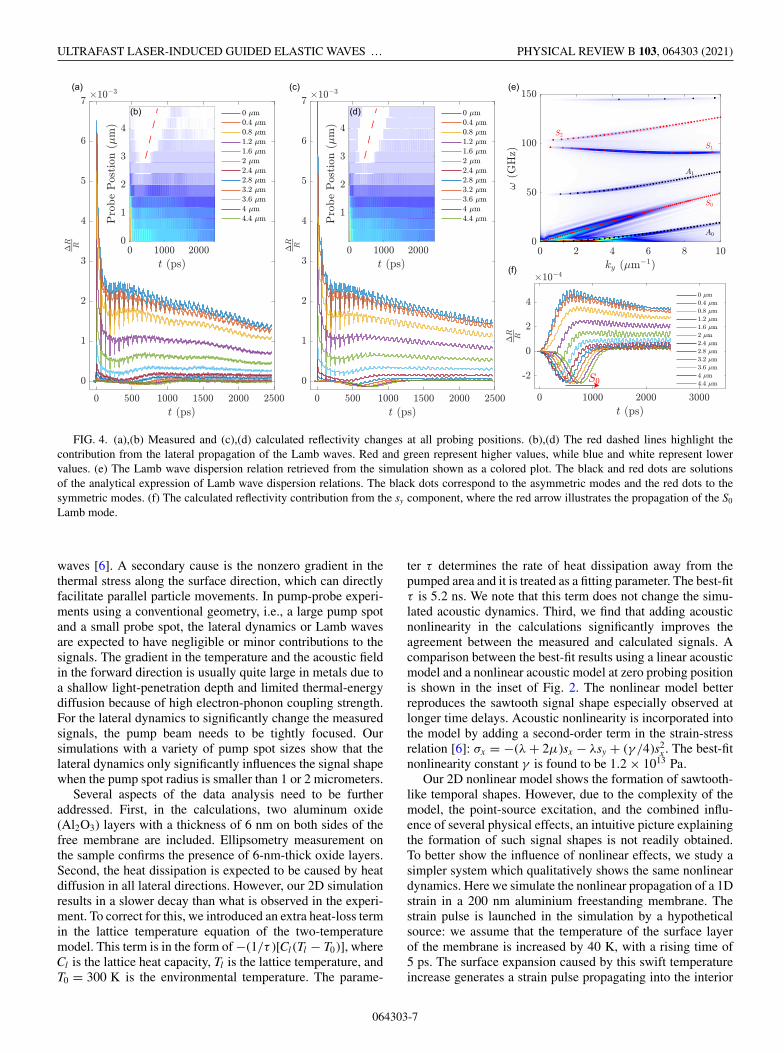
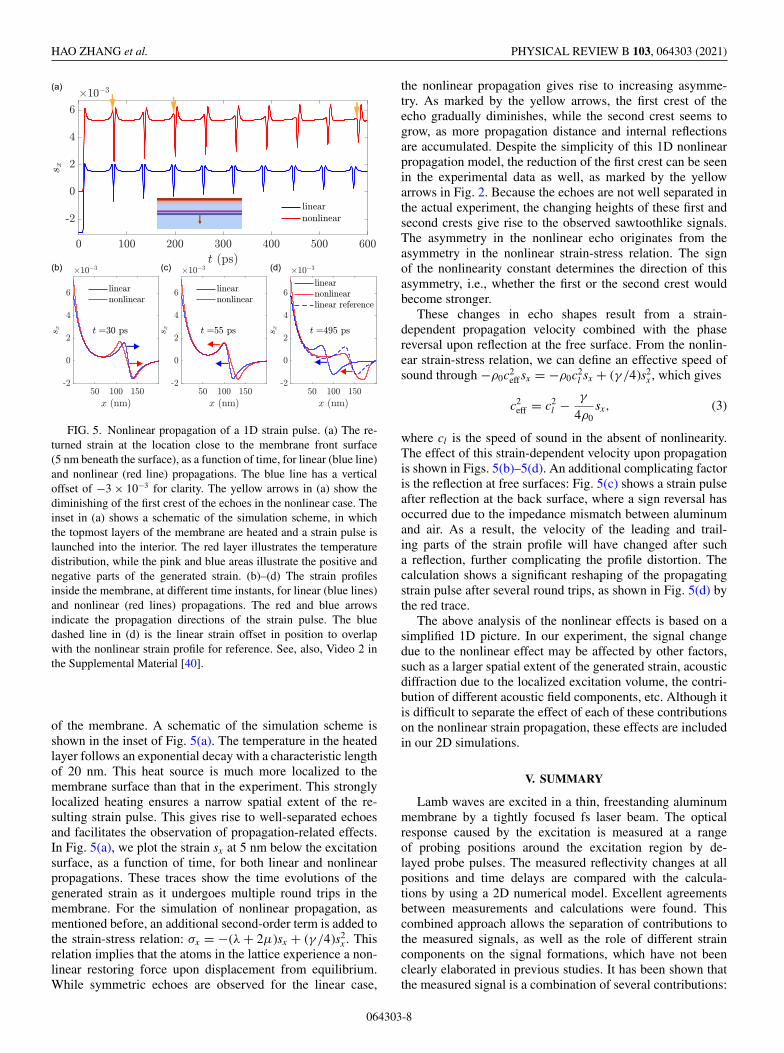
FIG. 5. Nonlinear propagation of a 1D strain pulse. (a) The re-turned strain at the location close to the membrane front surface(5 nm beneath the surface), as a function of time, for linear (blue line)and nonlinear (red line) propagations. The blue line has a verticaloffset of −3 × 10⁻³ for clarity. The yellow arrows in (a) show thediminishing of the first crest of the echoes in the nonlinear case. Theinset in (a) shows a schematic of the simulation scheme, in whichthe topmost layers of the membrane are heated and a strain pulse islaunched into the interior. The red layer illustrates the temperaturedistribution, while the pink and blue areas illustrate the positive andnegative parts of the generated strain. (b)–(d) The strain profilesinside the membrane, at different time instants, for linear (blue lines)and nonlinear (red lines) propagations. The red and blue arrowsindicate the propagation directions of the strain pulse. The bluedashed line in (d) is the linear strain offset in position to overlapwith the nonlinear strain profile for reference. See, also, Video 2 inthe Supplemental Material [40].
of the membrane. A schematic of the simulation scheme isshown in the inset of Fig. 5(a). The temperature in the heatedlayer follows an exponential decay with a characteristic lengthof 20 nm. This heat source is much more localized to themembrane surface than that in the experiment. This stronglylocalized heating ensures a narrow spatial extent of the re-sulting strain pulse. This gives rise to well-separated echoesand facilitates the observation of propagation-related effects.In Fig. 5(a), we plot the strain sx at 5 nm below the excitationsurface, as a function of time, for both linear and nonlinearpropagations. These traces show the time evolutions of thegenerated strain as it undergoes multiple round trips in themembrane. For the simulation of nonlinear propagation, asmentioned before, an additional second-order term is added tothe strain-stress relation: σx = −(λ + 2μ)sx + (γ /4)s2
x . Thisrelation implies that the atoms in the lattice experience a non-linear restoring force upon displacement from equilibrium.While symmetric echoes are observed for the linear case,
the nonlinear propagation gives rise to increasing asymme-try. As marked by the yellow arrows, the first crest of theecho gradually diminishes, while the second crest seems togrow, as more propagation distance and internal reflectionsare accumulated. Despite the simplicity of this 1D nonlinearpropagation model, the reduction of the first crest can be seenin the experimental data as well, as marked by the yellowarrows in Fig. 2. Because the echoes are not well separated inthe actual experiment, the changing heights of these first andsecond crests give rise to the observed sawtoothlike signals.The asymmetry in the nonlinear echo originates from theasymmetry in the nonlinear strain-stress relation. The signof the nonlinearity constant determines the direction of thisasymmetry, i.e., whether the first or the second crest wouldbecome stronger.
These changes in echo shapes result from a strain-dependent propagation velocity combined with the phasereversal upon reflection at the free surface. From the nonlin-ear strain-stress relation, we can define an effective speed ofsound through −ρ0c2
eff sx = −ρ0c2l sx + (γ /4)s2
x , which gives
c2eff = c2
l − γ
4ρ0sx, (3)
where cl is the speed of sound in the absent of nonlinearity.The effect of this strain-dependent velocity upon propagationis shown in Figs. 5(b)–5(d). An additional complicating factoris the reflection at free surfaces: Fig. 5(c) shows a strain pulseafter reflection at the back surface, where a sign reversal hasoccurred due to the impedance mismatch between aluminumand air. As a result, the velocity of the leading and trail-ing parts of the strain profile will have changed after sucha reflection, further complicating the profile distortion. Thecalculation shows a significant reshaping of the propagatingstrain pulse after several round trips, as shown in Fig. 5(d) bythe red trace.
The above analysis of the nonlinear effects is based on asimplified 1D picture. In our experiment, the signal changedue to the nonlinear effect may be affected by other factors,such as a larger spatial extent of the generated strain, acousticdiffraction due to the localized excitation volume, the contri-bution of different acoustic field components, etc. Although itis difficult to separate the effect of each of these contributionson the nonlinear strain propagation, these effects are includedin our 2D simulations.
V. SUMMARY
Lamb waves are excited in a thin, freestanding aluminummembrane by a tightly focused fs laser beam. The opticalresponse caused by the excitation is measured at a rangeof probing positions around the excitation region by de-layed probe pulses. The measured reflectivity changes at allpositions and time delays are compared with the calcula-tions by using a 2D numerical model. Excellent agreementsbetween measurements and calculations were found. Thiscombined approach allows the separation of contributions tothe measured signals, as well as the role of different straincomponents on the signal formations, which have not beenclearly elaborated in previous studies. It has been shown thatthe measured signal is a combination of several contributions:
064303-8
ULTRAFAST LASER-INDUCED GUIDED ELASTIC WAVES … PHYSICAL REVIEW B 103, 064303 (2021)
the thermo-optic contribution, and the strain-optic contribu-tion due to longitudinal and lateral strains. The off-centerprobe registers the lateral propagation of the excited Lambwaves, which is identified as the S0 symmetric Lamb modeby comparing with simulations. In addition, the excellentmodel fit to the measured signals allows one to retrieve quan-titative information on several parameters, such as the twocomplex photoelastic coefficients and the acoustic attenuationcoefficient. Furthermore, evidence of acoustic nonlinearity inthe excited Lamb waves was found and a nonlinearity constantis extracted.
ACKNOWLEDGMENTS
This research was supported by the European ResearchCouncil (ERC Starting Grant No. 637476) and the Nether-lands Organization for Scientific Research (NWO). Thiswork was conducted at the Advanced Research Center forNanolithography, a public-private partnership between theUniversity of Amsterdam, Vrije Universiteit Amsterdam, theNetherlands Organization for Scientific Research (NWO), andthe semiconductor-equipment manufacturer ASML.
H.Z. and A.A. contributed equally to this work.
[1] M. Metcalfe, S. M. Carr, A. Muller, G. S. Solomon, and J.Lawall, Resolved Sideband Emission of InAs/GaAs QuantumDots Strained by Surface Acoustic Waves, Phys. Rev. Lett. 105,037401 (2010).
[2] K. J. Satzinger, Y. P. Zhong, H. S. Chang, G. A. Peairs, A.Bienfait, M.-H. Chou, A. Y. Cleland, C. R. Conner, E. Dumur,J. Grebel, I. Gutierrez, B. H. November, R. G. Povey, S. J.Whiteley, D. D. Awschalom, D. I. Schuster, and A. N. Cleland,Quantum control of surface acoustic-wave phonons, Nature(London) 563, 661 (2018).
[3] Y. Chu, P. Kharel, W. H. Renninger, L. D. Burkhart, L. Frunzio,P. T. Rakich, and R. J. Schoelkopf, Quantum acoustics withsuperconducting qubits, Science 358, 199 (2017).
[4] B. C. Daly, N. C. R. Holme, T. Buma, C. Branciard, and T. B.Norris, Imaging nanostructures with coherent phonon pulses,Appl. Phys. Lett. 84, 5180 (2004).
[5] K.-H. Lin, C.-T. Yu, S.-Z. Sun, H.-P. Chen, C.-C. Pan, J.-I.Chyi, S.-W. Huang, P.-C. Li, and C.-K. Sun, Two-dimensionalnanoultrasonic imaging by using acoustic nanowaves, Appl.Phys. Lett. 89, 043106 (2006).
[6] H. Zhang, A. Antoncecchi, S. Edward, I. Setija, P. Planken, andS. Witte, Unraveling Phononic, Optoacoustic, and MechanicalProperties of Metals with Light-Driven Hypersound, Phys. Rev.Appl. 13, 014010 (2020).
[7] J. N. Hernandez-Charpak, K. M. Hoogeboom-Pot, Q. Li, T. D.Frazer, J. L. Knobloch, M. Tripp, S. W. King, E. H. Anderson,W. Chao, M. M. Murnane, H. C. Kapteyn, and D. Nardi, Fullcharacterization of the mechanical properties of 11-50 nm ul-trathin films: Influence of network connectivity on the poisson’sratio, Nano Lett. 17, 2178 (2017).
[8] S. Edward, H. Zhang, I. Setija, V. Verrina, A. Antoncecchi, S.Witte, and P. Planken, Detection of Hidden Gratings throughMultilayer Nanostructures using Light and Sound, Phys. Rev.Appl. 14, 014015 (2020).
[9] C. Thomsen, H. T. Grahn, H. J. Maris, and J. Tauc, Surfacegeneration and detection of phonons by picosecond light pulses,Phys. Rev. B 34, 4129 (1986).
[10] O. B. Wright, Ultrafast nonequilibrium stress generation in goldand silver, Phys. Rev. B 49, 9985 (1994).
[11] A. Devos and C. Lerouge, Evidence of Laser-Wavelength Effectin Picosecond Ultrasonics: Possible Connection with InterbandTransitions, Phys. Rev. Lett. 86, 2669 (2001).
[12] T. F. Crimmins, A. A. Maznev, and K. A. Nelson, Transientgrating measurements of picosecond acoustic pulses in metalfilms, Appl. Phys. Lett. 74, 1344 (1999).
[13] T. Saito, O. Matsuda, and O. B. Wright, Picosecond acousticphonon pulse generation in nickel and chromium, Phys. Rev. B67, 205421 (2003).
[14] P. J. S. van Capel and J. I. Dijkhuis, Time-resolved interfero-metric detection of ultrashort strain solitons in sapphire, Phys.Rev. B 81, 144106 (2010).
[15] O. Matsuda, O. B. Wright, D. H. Hurley, V. Gusev, and K.Shimizu, Coherent shear phonon generation and detection withpicosecond laser acoustics, Phys. Rev. B 77, 224110 (2008).
[16] C. Rossignol, J. M. Rampnoux, M. Perton, B. Audoin, and S.Dilhaire, Generation and Detection of Shear Acoustic Wavesin Metal Submicrometric Films with Ultrashort Laser Pulses,Phys. Rev. Lett. 94, 166106 (2005).
[17] B. Giammarinaro, D. Espindola, F. Coulouvrat, and G. Pinton,Focusing of Shear Shock Waves, Phys. Rev. Appl. 9, 014011(2018).
[18] J. J. Kasinski, L. Gomez-Jahn, K. J. Leong, S. M. Gracewski,and R. J. D. Miller, Optical generation of coherent surfaceacoustics: An optically based probe of surface structure anddynamics, Opt. Lett. 13, 710 (1988).
[19] Q. Li, K. Hoogeboom-Pot, D. Nardi, M. M. Murnane, H. C.Kapteyn, M. E. Siemens, E. H. Anderson, O. Hellwig, E.Dobisz, B. Gurney, R. Yang, and K. A. Nelson, Generationand control of ultrashort-wavelength two-dimensional surfaceacoustic waves at nanoscale interfaces, Phys. Rev. B 85, 195431(2012).
[20] H. Lamb, On waves in an elastic plate, Proc. R. Soc. London A93, 114 (1917).
[21] Q. Xie, S. Mezil, P. H. Otsuka, M. Tomoda, J. Laurent, O.Matsuda, Z. Shen, and O. B. Wright, Imaging gigahertz zero-group-velocity lamb waves, Nat. Commun. 10, 2228 (2019).
[22] S. Mezil, F. Bruno, S. Raetz, J. Laurent, and D. Royer, Inves-tigation of interfacial stiffnesses of a tri-layer using zero-groupvelocity Lamb modes, J. Acoust. Soc. Am. 138, 3202 (2015).
[23] G. Yan, S. Raetz, N. Chigarev, V. E. Gusev, and V. Tournat,Characterization of Progressive Fatigue Damage in Solid Platesby Laser Ultrasonic Monitoring of Zero-Group-Velocity LambModes, Phys. Rev. Appl. 9, 061001(R) (2018).
[24] D. M. Photiadis, M. K. Zalalutdinov, A. S. Bracker, S. G.Carter, D. Gammon, and B. H. Houston, Photoexcited elasticwaves in freestanding GaAs films, Phys. Rev. B 101, 245304(2020).
[25] M. Grossmann, O. Ristow, M. Hettich, C. He, R. Waitz, E.Scheer, V. Gusev, T. Dekorsy, and M. Schubert, Time-resolveddetection of propagating Lamb waves in thin silicon membranes
064303-9
HAO ZHANG et al. PHYSICAL REVIEW B 103, 064303 (2021)
with frequencies up to 197 GHz, Appl. Phys. Lett. 106, 171904(2015).
[26] T. Tachizaki, T. Muroya, O. Matsuda, Y. Sugawara, D. H.Hurley, and O. B. Wright, Scanning ultrafast Sagnac interfer-ometry for imaging two-dimensional surface wave propagation,Rev. Sci. Instrum. 77, 043713 (2006).
[27] S. I. Anisimov, B. L. Kapeliovich, and T. L. Perel’man, Electronemission from metal surfaces exposed to ultrashort laser pulses,Sov. Phys.-JETP 39, 375 (1974).
[28] P. M. Shearer, Introduction to Seismology (Cambridge Univer-sity Press, New York, 2009).
[29] R. D. Blandford and K. S. Thorne, Modern Classical Physics:Optics, Fluids, Plasmas, Elasticity, Relativity, and StatisticalPhysics (Princeton University Press, Princeton, NJ, 2017).
[30] K. Yee, Numerical solution of initial boundary value problemsinvolving Maxwell’s equations in isotropic media, IEEE Trans.Antennas Propag. 14, 302 (1966).
[31] D. M. Sullivan, Electromagnetic Simulation using the FDTDMethod (IEEE Press, New Jersey, 2000).
[32] M. Born and E. Wolf, Principles of Optics (Cambridge Univer-sity Press, Cambridge, 1999).
[33] D. R. Lide, CRC Handbook of Chemistry and Physics, InternetVersion 2005 (CRC Press, Boca Raton, FL, 2005).
[34] Z. Lin, L. V. Zhigilei, and V. Celli, Electron-phonon cou-pling and electron heat capacity of metals under conditions
of strong electron-phonon nonequilibrium, Phys. Rev. B 77,075133 (2008).
[35] T. Dehoux, N. Chigarev, C. Rossignol, and B. Audoin,Three-dimensional elasto-optical interaction for reflectometricdetection of diffracted acoustic fields in picosecond ultrasonics,Phys. Rev. B 76, 024311 (2007).
[36] T.Favaloro, J.-H. Bahk, and A. Shakouri, Characterization ofthe temperature dependence of the thermoreflectance coefficientfor conductive thin films, Rev. Sci. Instrum. 86, 024903 (2015).
[37] Y. Wang, J. Y. Park, Y. K. Koh, and D. G. Cahill, Ther-moreflectance of metal transducers for time-domain thermore-flectance, J. Appl. Phys. 108, 043507 (2010).
[38] R. B. Wilson, B. A. Apgar, L. W. Martin, and D. G. Cahill,Thermoreflectance of metal transducers for optical pump-probestudies of thermal properties, Opt. Express 20, 28829 (2012).
[39] A. G. Mathewson and H. P. Myers, Optical absorption in alu-minium and the effect of temperature, J. Phys. F: Metal Phys. 2,403 (1972).
[40] See Supplemental Material at http://link.aps.org/supplemental/10.1103/PhysRevB.103.064303 for videos of calculated dis-placement vector and strain.
[41] J. L. Rose, Ultrasonic Guided Waves in Solid Media (CambridgeUniversity Press, New York, 2014).
[42] B. Lüthi, Physical Acoustics in the Solid State (Springer, Berlin,2005).
064303-10