Ultrafast dynamics in asymmetrical multiple quantum well SOAs
Upload
khangminh22Category
view
2download
0
Ultrafast Infrared Studies of Chemical Reaction Dynamics in Room-Temperature Liquids
Haw Yang Ph.D. Thesis
Department of Chemistry University of California, Berkeley
and
Chemical Sciences Division Ernest Orlando Lawrence Berkeley National Laboratory
University of California Berkeley, CA 94720
November 1999
LBNL-44634
This work was supported by the Director, Office of Science, Office of Basic Energy Sciences, Chemical Sciences Division, of the U.S. Department of Energy under Contract No. DE-AC03-76SF00098.
DISCLAIMER
This report wa~ .prepared as an account of work sponsored by an agency of the United States Government. Neither the United States Government nor any agency thereof, nor any of their employees, make any warranty, express or implied, or assumes any legal liability or responsibility for the accuracy, completeness, or usefulness of any information, apparatus, product, or process disclosed, or represents that its use would not infringe privately owned rights. Reference herein to any specific commercial product, process, or service by trade name, trademark, manufacturer, or otherwise does not necessarily constitute or imply its endorsement, recommendation, or favoring by the United States Government or any agency thereof. The views and opinions of authors expressed herein do not necessarily state or reflect those of the United States Government or any agency thereof.

DISCLAIMER
Portions of this document may be illegible in electronic image products. Images are produced from the best available original document.
Ultrafast Infrared Studies of Chemical Reaction Dynamics in RoomTemperature Liquids
Copyright © 1999
by
Haw Yang
The u.s. Department of Energy has the right to use this document for any purpose whatsoever including the right to reproduce all or any part thereof.

ULTRAFAST INFRARED STUDIES OF CHEMICAL REACTION
DYNAMICS IN ROOM-TEMPERATURE LIQUIDS
by
Haw Yang
B. S. (National Taiwan University) 1991
A dissertation submitted in partial satisfaction of the
requirements for the degree of
Doctor of Philosophy in
Chemistry
in the
GRADUATE DIVISION
of the
UNIBSERSITY OF CALIFORNIA, BERKELEY
Committee in charge:
Professor Charles B. Harris, Chair Professor Robert G. Bergman
Professor Roger Falcone
Fall 1999
Abstract
Ultrafast Infrared Studies of Chemical Reaction Dynamics in Room-Temperature Liquids
by
Haw Yang
Doctor of Philosophy in Chemistry
University of California at Berkeley
Professor Charles B. Harris, Chair
Femtosecond infrared spectroscopy provides sufficient spectral and temporal
resolution to support a detailed investigation of the early events of a photochemical
reaction. Previously unreported transient species that arise as intermediates during the
course of a reaction may have lifetimes that are too short for conventional
characterization. For these species, quantum-mechanical (density functional theoretical
and ab initio) electronic structure calculations provide invaluable insight into chemical
properties including molecular structure and energetics. With the combination of
experimental and theoretical results, it is possible to assemble a comprehensive picture of
the reaction dynamics of a system that is intricately influenced by the surrounding solvent
molecules.
The mechanisms of several important organometallic reactions, such as alkane C
H bond activation by 113-Tp 'Rh(CO), silane Si-H bond activation by 115 -CpMn(CO)2 and
115 -CpRe(COh, as well as chlorinated methane C-Cl bond cleavage by the Re(CO)5
radical are elucidated. The results demonstrate the importance of molecular morphology
change (C-H and Si-H activation), solvent rearrangement (Si-H activation), intersystem
. crossing (Si-H activation), and solvent caging (C-Cl cleavage) in understanding the
1

reactivity of the organometallic species. The nature of the apparent free-energy barrier
for C-H, Si-H, and C-Cl bond activation reaction is found to be cleavage of an alkane
C-H bond, rearrangement of a silane molecule HSiR3 (R = alkyl group) from a non
reactive alkyl site to the reactive Si-H bond, and Cl atom transfer from a chlorinated
. methane molecule to Re(CO)s, respectively. These results support previous ab initio
calculations for C-H and Si-H bond activation reaction profiles which suggest that
cleavage of an alkane C-H bond by a transition metal center, unlike that of a silane Si-H
bond, involves a precursor complex. The results of C-Cl bond activation by a transition
metal radical call for a re-examination of existing models that invoke an intermediate
with either nineteen valence electrons at the metal center or charge-transfer character.
2
To my family:
Chih-1vl0 Yang, Hsiu-Ching Tseng, and Chia-Yi Yang
111
Table of Contents
1 Introduction ........................................................................................... 1
1.1 Background ........................................................................................................ 2
1.2 Dissertation Overview ......................................................................................... 5
2 Methodology ............................................ , ............................................ 7
2.1 Instrumentation of Femtosecond Infrared Spectroscopy ................................... 8
2.2 IR Focal Plane Array (IR-FPA) Detector ......................................................... 15
2.3 Frequency Chirping at the Vicinity of a Strongly-Absorbing IR Band ............. 17
2.3.1 Theory ........................................................................................................ 18
2.3.2 Comparison with Experiments ..................................................................... 22
2.4 The Vibrational Stark Effect ............................................................................. 23
2.4.1 An Analytical Model ................................................................................... 23
2.4.2 First-Principle Calculations ........................................................................ 25
2.5 Classical Molecular Dynamics Simulation ....................................................... 30
2.5.1 Potential Models ......................................................................................... 30
2.5.2 Simulation Details ...................................................................................... 32
2.5.3 Results ........................................................................................................ 33
2.6 Conclusion ........................................................................................................ 37
3 C-H Bond Activation by 113-Tp*Rh(CO)2 ............................................ 38
3.1 The Dynamics of Reaction Intermediates-Vibrational Relaxation and
Molecular Morphology Change ........................................................................ 39
3.2 The Activation Barrier-the Bond-Breaking Step ............................................ 42
3.3 The Reaction Mechanism .................................................................................. 43
4 Femtosecond Infrared Studies of Si-H Bond Activation by 115-
CpMn(CO)3 ........ : ............................................................................... 46
iv

4.1 Background ....................................................................................................... 47
4.2 Results and Discussions .................................................................................... 48
4.3 Conclusion ........................................................................................................ 53
5 The reaction mechanism of Si-H bond activation studied using
femtosecond to nanosecond IR spectroscopy and ab initio methods ... 55
5.1 Introduction ...................................................................................................... 55
5.2 Results ............................................................................................................... 58
5.2.1 Activation of the Silicon-Hydrogen Bond of Et3SiH by CpMn(COJJ. ............ 58
5.2.2 Activation of the Silicon-Hydrogen Bond of EtSiH by CpRe(CO);. ............. 63
5.2.3 ab initio Calculation Results .. ..................................................................... 70
5.3 Discussion ......................................................................................................... 75
5.3.1 Activation of the Silicon-Hydrogen Bond of Et3SiH by CpMn(CO)j ............. 76
5.3.2 Activation of the Silicon-Hydrogen Bond of Et3SiH by CpRe(COJJ .............. 82
5.4 Closing Remarks ............................................................................................... 84
5.5 Supplementary ................................................................................................... 86
6 Femtosecond Infrared Studies of a Prototypical One-Electron Oxidative
Addition Reaction: Chlorine Atom Abstraction by the Re(CO)5 Radical.
........................................................................................................... 88
6.1 Introduction ...................................................................................................... 88
6.2 Results and Discussion ............................................ , ......................................... 89
6.3 Conclusion ........................................................................................................ 93
6.4 Supplementary ................................................................................................... 96
6.4.1 Methods ...................................................................................................... 96
6.4.2 Diffusion Modelfor Geminate Recombination of Re(CO)5 Radicals ............ 98
7 Conclusion ........................................................................................ 106
8 Appendices ...................................................................................... ,. 110
v
8.1 Example Input Files for the Quantum Chemical Calculation Package
GAMESS ......................................................................................................... 110
8.1.1 The Input Filefor Calculating the CASSCF-PT2 Energy of the Singlet
CpMn(CO)2 . ...................................................................... ....................... 110
8.1.2 The Input Filefor Calculating the CASSCF-PT2 Energy of the Triplet
CpMn(CO)2 . ............................................................................................. 113
8.2 Quantitative Considerations of the Triplet-Singlet Intersystem Crossing in
Coordinatively Unsaturated Organometallic Compounds ............................... 114
8.2.1 A Summary of Theoretical Models ............................................................ 115
8.2.2 The Input Filefor Calculating the Spin-Orbital Coupling Constant of
CpMn(COh Using MCSCF Wave functions ............................................... 116
8.2.3 A MATlAB Scriptfor Calculating the Overlap of Vibrational Waveflmctions
between the Singlet and Triplet States ......... ............................................ .. 120
9 Bibliography ...................................................................................... 125
vi

List of Figures
Figure 1.1 An illustration of one- and two-electron oxidative addition ........................... 2
Figure 1.2 A bonding model for a dihydrogen metal complex ........................................ 3
Figure 1.3 A schematic illustration of nineteen-electron intermediate in one-electron
oxidative addition .......................................................................................... 4
Figure 2.1 Schematics of the experimental setup ........................................................... 12
Figure 2.2 Auto-correlation plots of the three laser pulses ............................................. 13
Figure 2.3 Spectral analyses of the ultrafast pulses ........................................................ 14
Figure 2.4 Schematics of the IR-array setup .................................................................. 16
Figure 2.5 Comparison of experiments with theory for pump induced IR chirping ........ 22
Figure 2.6 Evaluation of ab initio vibrational Stark effect for CO ................................. 27
Figure 2.7 Evaluation of ab initio vibrational Stark effect for CH3CN ........................... 28
Figure 2.8 Evaluation of ab initio vibrational Stark effect for C6HsCN ......................... 29
Figure 2.9 Characterization of a MD simulation engine for CH3CN .............................. 34
Figure 2.10 Non-equilibrium MD simulation of dipole solvation for a sudden dipole
change of 8.45 Debye ................................................................................... 35
Figure 2.11 Non-equilibrium MD simulation of dipole solvation for a sudden dipole
change of ··8.45 Debye .................................................... ~ .............................. 36
Figure 3.1 C-H bond activation by 113-Tp ·Rh(CO) ........................................................ 38
Figure 3.2 Ultrafast IR spectra of 113 - Tp*Rh(CO)2 in alkane solution following 295-nm
excitation ...................................................................................................... 39
Figure 3.3 Ultrafast kinetics ofl13-Tp*Rh(CO)2 in alkane solution ................................ 41
Figure 3.4 Photodissociation of 112-Bp*Rh(COh ........................................................... 42
Figure 3.5 Nanosecond kinetics of 113-Tp*Rh(COh in alkane solution .......................... 43
Figure 3.6 A proposed reaction mechanism for the alkane C-H bond activation by
,,3 _ Tp*Rh(CO)2 covering the ultrafast dynamics to nanosecond kinetics ...... .44
Figure 4.1 A bonding model for C-H bond a-comple ................................................... 46
vii

Figure 4.2 Ultrafast IR spectra of CpMn(CO)3 in triethylsilane following 295-nm
photolysis ..................................................................................................... 49
Figure 4.3 Ultrafast IR kinetics of CpMn(COh in triethylsilane following 295-nm
photolysis ........................... , ......................................................................... 50
Figure 4.4 A proposed reaction mechanism for the photochemical Si-H bond activation
of Et3SiH by CpMn(COh, Suggestive chemical structures are in brackets ... 53
Figure 5.1 IR band assignments of chemical species involved in S-H bond activation by
CpM(CO)2, M == Mn, Re ............................................................................... 56
Figure 5.2 Ultrafast IR spectra of CpMn(CO)3 in triethylsilane following 325-nm
excitation ...................................................................................................... 59
Figure 5.3 Ultrafast IR kinetics of CpMn(CO)3 in triethylsilane following 325-nm
excitation ...................................................................................................... 60
Figure 5.4 Nanosecond kinetics of CpMn(CO)3 in neat triethylsilane following 295-nm
excitation ...................................................................................................... 62
Figure 5.5 Ultrafast IR spectra of CpRe(CO)3 in triethylsilane following 295-nm
excitation ...................................................................................................... 64
Figure 5.6 UltrafaSl'IR kinetics of CpRe(COh in triethylsilane following 295-nm
excitation .............. ; ....................................................................................... 66
Figure 5.7 Modeling of the observed transient traces of CpRe(COh ............................ 68
Figure 5.8 Nanosecond kinetics of CpRe(CO)3 following 295-nm excitation ................ 69
Figure 5.9 Geometries of the parent molecules, the ethane-solvate, and the final product
optimized at the MP2 / lanl2dz level of theory ....................................... : ...... 70
Figure 5.10 Side view and top view for the MP2 / lanl2dz optimized geometries of the
16-e- species ................................................................................................. 72
Figure 5.11 UV / Vis spectra of CpMn(CO)3 and CpRe(COh ...................................... 76
Figure 5.12 Comparison of ultrafast kinetics of CpMn(CO)3 at different pump
wavelengths .................................................................................................. 78
Figure 5.13 Proposed reaction mechanism for the silicon-hydrogen bond activation by
CpMn(CO)3 covering the ultrafast dynamics to nanosecond kinetics ............ 81
viii

Figure S.14 Proposed reaction mechanism for the silicon-hydrogen bond activation by
CpRe(COh covering the ultrafast dynamics to microsecond kinetics ............ 83
Figure 6.1 Previously proposed reaction schemes for CI atom abstraction by Re(CO)5 .. 89
Figure 6.2 Transient difference spectra in the CO stretching region for Re2(CO)10 in neat
CClt and hexanes ......................................................................................... 90
Figure 6.3 Fits of ultrafast kinetics to a diffusion model. ............................................... 91
Figure 6.4 DFT structures for the final product and transition-state structures ............... 94
Figure 6.S Detailed fitting of ultrafast kinetics to a diffusion model. ........................... 104
Figure 6.6 Nanosecond kinetics of Cl-atom abstraction reaction .................................. 1OS
Figure 7.1 An illustration for solvation / spin crossover process .................................. 107
Figure 8.1 Illustraion of Landau-Zener spin crossover. ................................................ 116
Figure 8.2 Graphical representation of the vibrational quantum numbers that contribute
to the spin crossover rate ............................................................................ 120
IX
List of Tables
Table 2.1 Selected results for characterization of different ab initio approaches to
calculating the vibrational tuning rate ........................................................... 27
Table 2.2 Intermolecular parameters for acetonitrile MD simulation ............................. 31
Table 5.1. Critical bond distances (in A) of the important structures for the Si-H bond
activation reactions optimized at the MP2 / lanl2dz level of theory. a ............. 71
Table 5.2. Calculated MP2 / lanl2dz binding energies (in kcallmol) for singlet
115_CpM(COhL, M = Mn, Re.a ..................................................................... 74
Table 5.3. Comparison of the energy difference, .1.E=E(singlet)-E(triplet), between the
singlet and triplet 115 -CpM(CO)2 calculated using different methods (in
kcallmol) ...................................................................................................... 74
Table 6.1. Summary of Electron-Population Analysis for the Re and CI Centers In\'olved
in the Reaction of CI-Atom Abstraction by the Re(CO)s Radical. ............... 103
x

Acknowledgment
I am grateful for having had the privilege of working with excellent colleagues
and for having made so many good friends during my years at Berkeley. I would like to
thank Charles Harris for creatinga stimulating research environment in which his group
members enjoy great intellectual latitude. Charles showed me, through casual
conversions and by his example, how to define and approach a problem and then to look
at it from an entirely different perspective. Tim Lian taught me femtosecond infrared
spectroscopy in his two-year stay at Berkeley, from construction of the laser system to
carrying out experiments. Since then, he has continued to give me advises and
sometimes kind reproof, both as a friend and as a mentor. In my early days as a graduate
student studying C-H bond activation, I had the good fortune of learning directly from
one of the leading scientists in the field, Bob Bergman. I am especially grateful for Bob's
enormous patience in teaching me how to express ideas rigorously. I am thankful to
Heinz Frei for his guidance through the step-scan FTIR experiments and for his sharing
the views about contemporary issues in science. I am also indebted to Roger Falcone,
who was always ready to lend a helping hand at critical times, especially in the beginning
of femtosecond IR projects. The outstanding technical and administrative personnel in
the department, particularly Vijaya Narasimhan who was key in keeping the researches
going in our group, were indispensable in the research. The work included in this
dissertation could not have been possible without the financial support from the National
Science Foundation and specialized equipment supported by U.S. Department of Energy.
The senior members, Steve Bromberg, Matt Asplund, Jason King, Robert Lingle,
Robert Jordan, Nein-Hui Ge, Jason McNeill, and Steve Gadd provided the much needed
help and guidance during my trying first year in graduate school. With their help, much
of my scattered technical perception was consolidated to scientific understanding. Robert
Lingle and Tim further sharpened my logical acuity through frequent spontaneous
debates over various issues. Steve Bromberg and Robert Jordan was always willing to
xi

explain to me, with great patience, matters ranging from scientific concepts to hard-rock
concerts. From Jason McNeill and Matt Asplund, I learned how to administrate a cluster
of UNIX workstations. Ken Kotz and I collaborated fruitfully on various projects; jointly
we strode past obstacles that had lied in the path of a project. Through him, I had the
pleasure to befriend with P.J. Alaimo who, together with Bruce McNamara and lake
Yeston, showed me how to think from the viewpoint of an inorganic chemist. The
research projects gained extra momentum from Preston Snee who seemed to take upon
difficult tasks with smiles. Ken, Preston, Matt Wilkens, and later Christine Payne helped
me better understand many issues that I once thought I understood. It was a great honor
of mine to be able to work side by side with these talented scientists.
I would also like to thank Nien-Hui Ge, Chung Wong, Kelly Gaffney, Andre
Miller, and Simon Liu for spending time explaining to me their latest experimental
results. Exchange of ideas with Andre, Simon, and later with Paul Szymanski continued
either on a ski slope or around a campfire. Graduate school would have been less
interesting were it not for the weekly shopping / luncheon / science forum with Chung.
Like a spoiled child, I much enjoyed the generous friendship extended by Judy Kim,
Mike Tauber, Travis Taylor, Melonie Hall and many other friends, who not only taught
me science and beyond, but also infused my stint at Berkeley with warmth. Finally, I
owe it to my Family who have fostered, and continued to support, my love for the Nature:
"Thanks to the human heart by which we live,
Thanks to its tenderness, its joys, and fears,
To me the meanest flower that blows can give
Thoughts that do often lie too deep for tears."
Stanza XI in Ode: Intimations of Immortality from Recollections of Early Childhood
William Wordsworth, 1803-6.
Xll

1 INTRODUCTION
When describing chemical dynamics, one usually refers to a simplified system
consisting of only the reactive site and its immediate surroundings. The basis for
conceptualizing chemical reactivity depends upon the knowledge of elementary steps that
occur at the active site. The elementary steps include changes in electron distribution,
molecular structure, translocation of chemical moieties, and solvent rearrangement to
accommodate the new chemical environment. These processes are inevitably modulated
by the surrounding media on time scales of picoseconds or less. Therefore, a critical test
of our fundamental understanding of chemical reactivity requires experimental
techniques that allow resolution of those ultrafast events. Femtosecond infrared (fs-IR)
offers such an opportunity due to its ability to deliver chemically specific information.
The study of transition-metal mediated chemical reactions that are thought to take
place at unsaturated metal sites is one problem that is amenable to the femtosecond
infrared spectroscopic technique. Those reactions range from industrial process such as
petroleum refining to biological cycles such as nitrogen fixation and photosynthesis.
Ideally, one would like to observe the chemical events that evolve around such an active
site as a reaction develops. This can be accomplished by using a CO ligand attached to
the reactive metal center as a local probe. Due to CO-a ~ metal-dcr coordination and
metal-dn ~ CO-n* back-donation, the infrared vibrational frequency of the CO ligand is
a very sensitive measure of the chemical environment of the metal. Qualitatively, an
increase (or decrease) of the metal electron density reduces (augments) the c-o bond
order, resulting in a lower (higher) CO stretching frequency. Experimentally, an ultrafast
UV pulse dissociates a photo labile ligand from an organometallic compound to result in a
reactive intermediate with an unsaturated metal center. A cascade of chemical events, for
example processes that ultimately lead to oxidative addition, then ensues. The thesis of
-1-
this dissertation is the study of the important class of organometallic reactions--oxidative
addition reactions-utilizing femtosecond infrared spectroscopy. Since numerous
excellent reviews have been given to this subject, only a brief account is presented below.
1.1 Background
16-e- complex
(q) k hv )0 [L M.] act)o
(b) LnM-MLn n X-y
17-e- complex
X (q+2)/
Ln_1M" y
(q+l)
(2-electron)
LnM-X + Y (l-electron)
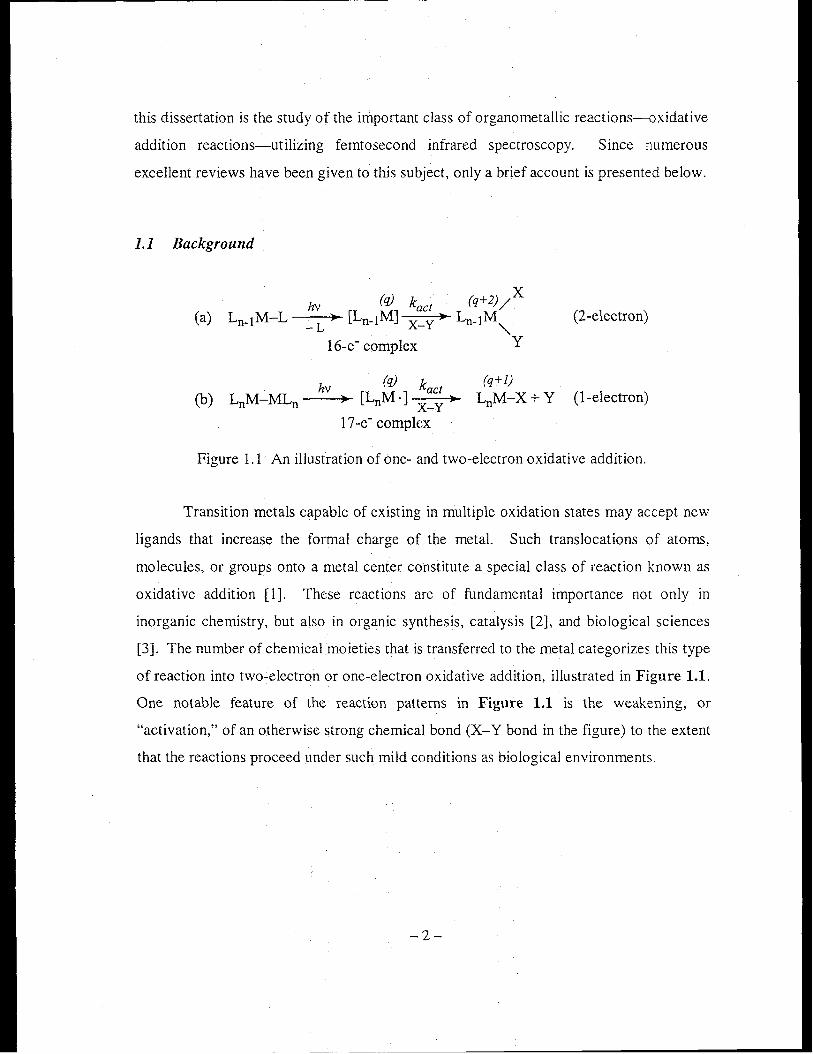
Figure 1.1 An illustration of one- and two-electron oxidative addition.
Transition metals capable of existing in multiple oxidation states may accept new
ligands that increase the formal charge of the metal. Such translocations of atoms,
molecules, or groups onto a metal center constitute a special class of reaction known as
oxidative addition [I]. These reactions are of fundamental importance not only in
inorganic chemistry, but also in organic synthesis, catalysis [2], and biological sciences
[3]. The number of chemical moieties that is transferred to the metal categorizes this type
of reaction into two-electron or one-electron oxidative addition, illustrated in Figure 1.1.
One notable feature of the reaction patterns in Figure 1.1 is the weakening, or
"activation," of an otherwise strong chemical bond (X-Y bond in the figure) to the extent
that the reactions proceed under such mild conditions as biological environments.
-2-
cr*
cr
cr*
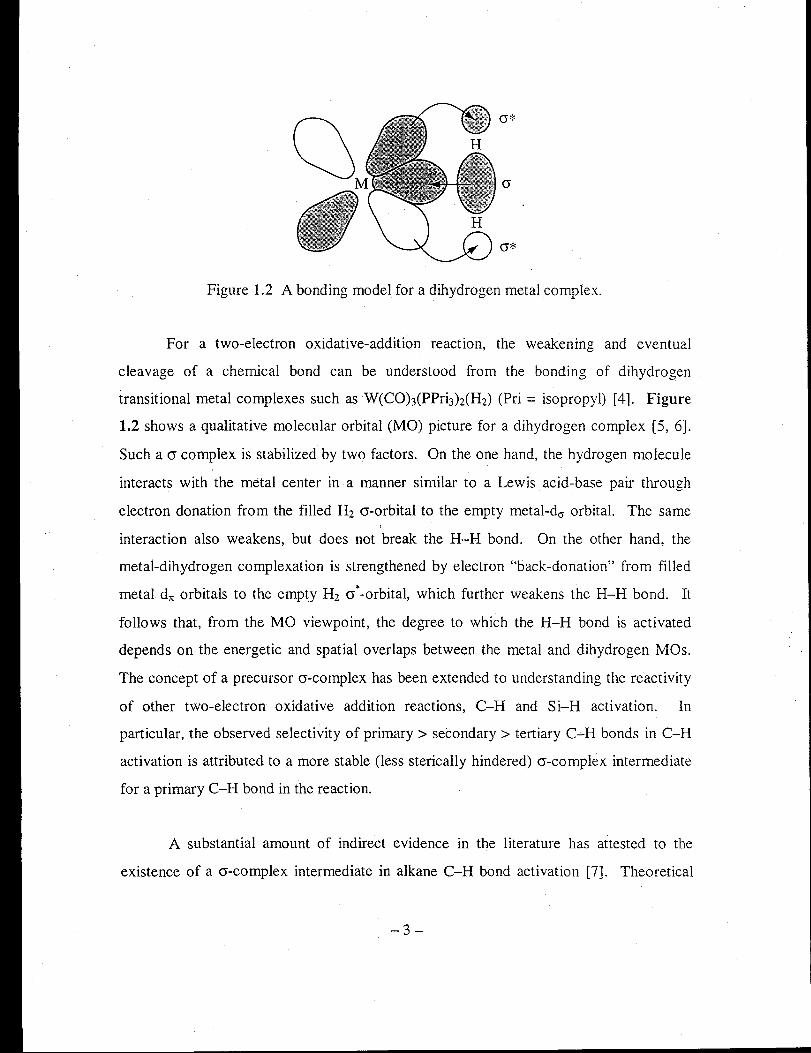
Figure 1.2 A bonding model for a dihydrogen metal complex.
For a two-electron oxidative-addition reaction, the weakening and eventual
cleavage of a chemical bond can be understood from the bonding of dihydrogen
transitional metal complexes such as W(COh(PPrbh(H2) (Pri = isopropyl) [4]. Figure
1.2 shows a qualitative molecular orbital (MO) picture for a dihydrogen complex [5, 6].
Such a cr complex is stabilized by two factors. On the one hand, the hydrogen molecule
interacts with the metal center in a manner similar to a Lewis acid-base pair through
electron donation from the filled H2 cr-orbital to the empty metal-do- orbital. The same
interaction also weakens, but does not break the H-H bond. On the other hand, the
metal-dihydrogen complexation is strengthened by electron "back-donation" from filled
metal d1t orbitals to the empty H2 cr"-orbital, which further weakens the H-H bond. It
follows that, from the MO viewpoint, the degree to which the H-H bond is activated
depends on the energetic and spatial overlaps between the metal and dihydrogen MOs.
The concept of a precursor cr-complex has been extended to understanding the reactivity
of other two-electron oxidative addition reactions, C-H and Si-H activation. In
particular, the observed selectivity of primary> secondary> tertiary C-H bonds in C-H
activation is attributed to a more stable (less sterically hindered) cr-complex intermediate
for a primary C-H bond in the reaction.
A substantial amount of indirect evidence in the literature has attested to the
existence of a cr-complex intermediate in alkane C-H bond activation [7]. Theoretical
-3-

calculations also provide much insight into the possible involvement of a precursor
intermediate in a two-electron oxidative-addition reaction. For example, Musaev and
Morokuma have computed the reaction profiles for a-bond activation of H2, ClL, NH3,
H20, and Si.fL by 115 -CpRh(CO) (Cp = CsHs). Their calculations predict a precursor
complex in the activation of C-H, N-H, and O-H bonds but not in the activation of H-H
or Si-H bonds [8]. The marked difference along the calculated reaction coordinates for
the isoelectronic C-H and Si-H bonds can be understood by the aforementioned MO
picture. The Si d-orbitals allow a better interaction between the Si-H bond and the metal
d-orbitals such that the reaction proceeds to completion without passing through a
precursor complex.
.. .. LnM ' + :~-CR3 --+ LnMCD~-CR3 --+ LnM-X + ·CR3
17-e- complex 19-e" complex
/-CXa*
d -"-0" '-.
"-"-" ex 0"
Figure 1.3 A schematic illustration of nineteen-electron intermediate in one-electron oxidative addition.
Along a parallel vein, it has also been proposed that a 19-electron intermediate
may be involved in atom-abstraction reactions via one-electron oxidative addition to
open-shell 17 -electron organometallic compounds [9-12]. In a halogen-atom abstraction
reaction, for example, the unpaired metal de; orbital spatially overlaps with the halogen
lone-pair orbital to form an intermediate that has 19 formal electrons in the coordination
shell (Figure 1.3). Energetically, the metal dO" orbital interacts with the C-X 0'* orbital,
leading to reduction of the C-X bond order and eventually resulting in cleavage of the C
X bond [13].
-4-

It is evident in the light of the above discussion that intermediates playa critical
role in oxidative-addition reactions. As such, a detailed knowledge of the dynamics of
the intermediates is crucial for our fundamental understanding of oxidative addition
reactions and of the nature of chemical bonds. Recently, development in this area has
greatly accelerated owing to the increasingly sophisticated and efficient quantum
chemical computational methods. Theoretical calculations provide valuable insight (e.g.,
the electronic structure and chemical bonding) for transient intermediates the lifetimes of
which are too short for conventional characterization [14]. However, they also
oftentimes rely on a priori knowledge of an approximate, sometimes idealized, reaction
coordinate. Without experimental results, theoretical consideration may easily overlook
such aspects as the dynamic partitioning of reaction pathways in the excited state or
during solvation, such as those that occur in Si-H bond activation which will be
discussed later. Therefore, a close interplay between experiment and theory will be
necessary in order to unveil the reaction dynamics underlying a complicated reaction.
1.2 Dissertation Overview
This dissertation includes the development, implementation, and application of
techniques suitable for the study of liquid-phase reaction dynamics. Chapter 2 describes
the instrumentation of the fs-IR spectrometer and aspects of signal analysis that have not
been fully discussed in the literature. Also contained in Chapter 2 are the development
and unpublished results of a classical molecular dynamics simulation engine that serves
to statistically connect the molecular motions to the ensemble averaged experimental
observables. Chapters 3 through 6 consist of published results utilizing these techniques
to study a special class of reaction that is central to our understanding of inorganic
chemistry and chemical bonds. They include the studies of the prototypical oxidative
addition of the two-electron C-H (Chapter 3) [15, 16] and Si-H bonds (Chapters 4 and 5)
[17,18], and of the one-electron CI atom (Chapter 6) [19] to organometallic compounds.
Chapter 7 summarizes the main results that may be generalized to other classes of
-5-
chemical reactions [20, 21]. Finally, unpublished calculation details that may merit
future studies are included in Chapter 8.
-6-
2 METHODOLOGY
This chapter provides a general description of the techniques used for the study of
liquid-phase reaction dynamics. Approaching chemical problems from a quantum
mechanical perspective has now become a well-accepted tactic and has been routinely
employed to augment experimental results in many laboratories. As such. density
functional theoretical and first-principle (ab initio) calculations play an integral part of
the researches presented in this dissertation. Since all the calculation details will be
explained in the individual chapters, they will not be repeated here. Nonetheless, certain
types of computation, including the multi-configurational complete-active-space
calculations, are more involved such that it is not obvious to compose proper input files.
For those calculations, representative input scripts are included in the Appendices.
During the course of the research, several computer programs have been developed.
These include (1) a data-processing program written for collating spectral data taken with
the single-element detectors, "spa" (1084 lines); I (2) a non-linear data fitting program,
"kinfit" (1722 lines); (3) a molecular simulation program that is capable of performing
equilibrium or non-equilibrium simulations, "nemd" (6356 lines); and (4) a data
acquisition program, "spec" (5977 lines).l Due to the length of these programs, they are
not included in this chapter but printed out in a separate volume and archiyed in the
laboratory.
The rest of the chapter is organized as follows. The configuration of the fs-IR
setup is outlined in Section 2.1 to deliver ageneral idea of the experimental setup. Up-to
date vendor information for system-specific components and maintenance notes are
supplied at appropriate places. Section 2.2 discusses briefly the installation of the IR
I This program uses binary-tree data structure to process the data. Such a data structure frees the user from constraints of experimental setup including the number of scans and ordering of spectral (or temporal) scans.
-7-
Focal Plane Array detector (IR-FP A), which allows simultaneous acquisition of an IR
spectrum of -70 cm- I on a shot-to-shot basis. Theoretical aspects in the femtosecond
infrared spectroscopy that are not obvious in the relevant publications but may appear in
the future research projects are discussed in Sections 2.3 and 2.4. Section 2.5 briefly
introduces a molecular simulation engine. Some simulation results that may help to
understand the solvent dynamics during the course of a chemical reaction are also
presented and discussed in this section.
2.1 Instrumentation of Femtosecond Infrared Spectroscopy
The fs-IR spectrometer can be roughly divided into three parts: the oscillator, the
dye-chain amplifier, and the detector. A schematic layout is displayed in Figure 2.1.
Although the entire system spans three optical tables (the outlining boxes), one
experiences very little alignment drift over the course of a one-week long experiment. As
it will become clear in the next paragraph, the quality of the oscillator output dictates the
performance of the entire system.
The solid-state Ti:sapphire oscillator (Murnane-Kapteyn design) is pumped by a
commercial 5-W Ar+ laser (Coherent Innova 310, all lines) to produce pulses of full
width-half-maximum (FWHM) -60 fs at -800 nm with a repetition rate of -80 MHz
when it is mode locked. The -5-nJ pulses2 are further amplified by a series of two prism
bored Bethune dye amplifiers [22],3 the diameters of which are indicated in the diagram.
The dye cells are pumped by the second harmonics (532 nm) of a commercial )l"d:Y AG
laser (Quanta-Ray GCR-5) with a repetition rate of 30 Hz. Therefore, the maximal rate
of data acquisition for this system is limited to 30 Hz. In order to synchronize the 80-
I The core assembly codes that interface the program to the frame grabber are provided by Talktronics. Inc .. 2 Typical power output is 400 m W, measured using a Coherent Fieldmaster power meter coupled with a Coherent power meter head model LM-lO. 3 The Exciton LDS798 dye is used for 800-nm lines.
-8-
MHz oscillator and the 30-Hz pump laser, a fast-response photodiode l is situated at the
back of the high-reflecting end mirror of the oscillator to pick up the residual fs pulses.
The output of the photodiode is then fed into a pulse divider circuit (a variant of Schmidt
trigger), which triggers both the Nd:YAG flash lamp and a digital delay generator
(Stanford Research DG535). DG535 also controls the synchronization among Y AG Q
switch, computer data acquisition, and IR-FP A gating (to be discussed later). At this
stage, each laser shot has energy of about 7 111 but its temporal profile is substantially
elongated? In order to make them suitable for subsequent continuum generation In
sapphire windows,3 these laser pulses are recompressed with a pair of prisms (comp 1 in
the diagram). A 'A/2 plate (c) is necessary to rotate the beam polarization such that it is at
the Brewster angle against the prism surface. After recompression, the temporal FWHM
is about 66 fs.
In our experimental scheme ofUV-Vis pump and IR probe (cf. Figure 1.1), three
different colors are required: an 800-nm and a 690-nm beam to generate the -5~m probe,
and a 580-nm beam to generate the -290-nm pump. As will become clear later, the
spectrometer is not limited to these wavelengths. For clarity, however, the following
description uses these three colors as examples to demonstrate the working of the dye
amplifying chain. Approximately 20% of the recompressed 800-nm light is further
amplified by a 3-mm Bethune cell to give -19-111 pulses with unnoticeable pulse
broadening. The remaining 80% of the 800-nm light is further divided into two arms
(50%:50%) and focused through a pair of sapphire windows to generate white-light
continuum. Note that another critical requirement for a stable continuum generation is a
good spatial mode from the seeding light. The white light is amplified by a I-mm
amplification ceU4 before passing through a bond-pass filter (FWHM = 10 nm), which
selects the 690-nm (or 580-nm) portion of the continuum. The amplification of selected
1 EG&G C30971 series or equivalent that have a response time < 1 ns at 90-100 V inversed bias. 2 Measured using a pyroelectric joule meter (Molectron model 14-05, response = 0.44 !l1/mV). 3 The typical conditions are E -1 !l1/pulse, temporal FWHM < 100 fs. 4 The Exciton LDS698 and LDS610 dyes are used for the 690-nm and 580-nm lines, respectively.
-9-

wavelengths is completed by another two-stage dye cells to give -120 III pulses for the
690-nm line (or -410 IlJ for the 580-nm line). Again, multiple-stage dye amplification
broadens the pulse width. Therefore, an additional pair of prisms are used to recompress
the 580-nm line to give -290-fs pulses. The 690-nm line does not require recompression
because the IR pulse width is determined by the 800-nm line. This scheme allows a
broad range of pump and probe wavelengths simply by selecting appropriate dyes and
band-pass filters. Optimal dye concentrations and preparation steps are well documented
in the laser logs. Auto-correlation plots for the 800, 690, and 680 nm pulses are
displayed in Figure 2.2.
The 580-nm beam is relay-imaged through a translation stage, I which provides
the required time delay between pump and probe. The 290-nm pulses for initiating the
chemical reaction are generated by frequency-doubling the 580-nm light in a 300-llm
BBO-II doubling crystal. The typical energy and pulse width at the sample are
-5 j.ll/pulse and 290 fs, respectively. The -51lm probe light is generated by mixing the
800-nm and 690-nm light in a 2-mm, type-II Lil03 crystal. The resulting IR pulses have
a temporal FWHM of -70 fs, a pulse energy of -2 Ill, and a polarization parallel to the
optical table. Spectral analyses of the 690, 800, and IR beams are displayed in Figure
2.3. Since we are mostly interested in the population dynamics in the chemical systems,
the pump and probe have a polarization angle of 54.7° (the magic angle). This is
achieved by a ).J2 plate placed in the 580-nm line, because it is more difficult to
manipulate the IR beam. To reduce shot-to-shot noise,2 the IR beam is separated
(50%:50%) into a signal and a reference beam. The signal beam is focused onto a disk of
1 The Klinger translation stage has a stepper drive control whose maximal resolution is 0.25 )lm, and is interfaced with the data acquisition computer via a GPIB control unit, Klinger MC4. Since Klinger has merged with Newport, product support is now provided by NewporLProgramming details for this setup can be found in the C codes that control the data-collection operation, which are included in a separate volume in our laboratory archive. 2 Laser systems of low-repetition rate such as the system describeq here tend to have a greater shot-ta-shot noise; on the other hand, laser systems of higher repetition rate (hundreds Hz or kHz) tend to have lowfrequency drift. Therefore, the normalization scheme will be different.
-10-

diameter < 200 11m at the sample. It is important to have a probe focal spot smaller that
the pump focal spot to minimize concentration gradient and pronounced transient /
thermal lensing from the pump. Since the sample preparation and setup vary in different
experiments, they will be described separately in each chapter.
Two detection schemes have been used in the work described in this dissertation.
The main difference is the use of a pair of single-element detectors as opposed to a focaI
plane-array detector. While the latter will be described in more detail in next section, the
former single-element scheme is briefly described below. The above-mentioned signal
and reference beams are focused into a monochromator (CVI DK-240) with a grating of
150 grove/mm and a blazing wavelength of 4 11m. The configuration of the frequency
resolving instrument determines the spectral resolution of the fs-IR spectrometer. Our
configuration has a typical resolution of -4 cm-'. After passing through the
monochromator, the reference and signal beams are respectively focused onto a pair of
matched liquid-nitrogen-cooled mercury-cadmium-telluride (MCT) detectors.' The AC
outputs from the on-board pre-amps of the detectors are integrated by boxcar integrators
(Stanford Research SR250). Finally, the boxcar outputs are digitized by the existing
CAMAC (Computer Automated Measurement And Control) system. The detailed
interfacing information can be found in the supplementary volumes of Ph.D. theses of
former graduate student, Dr. D. 1. Russel and Dr. M. C. Asplund, and will not be repeated
here. Noise reduction is achieved by rejecting the digitized data points whose counts are
below (0; above) certain thresholds.2
1 They were acquired from Electro-Optical Systems, Inc., model MCTlO-020-E for the detectors and PSI for the power supply. Under operational conditions, the thermal noise is about 50 mY/shot at I-MQ impedance. 2 Current CAMAC is a II-bit digitizer, which affords a dynamics range of 0-2047 counts. Typical upper and lower bounds are 1800 and 600, respectively. Because of the limited dynamic range, neutral-density filters in the IR range are required to normalize the reference and signal beam to optimize the experimental condition.
- 11 -

'Tj oq' C '""1 (t>
!V ...... C/J ()
::r (t>
S p:l .... o·
...... en
tv 0 ~ .... ::r (t>
(t>
X '0
(t> .... s· (t>
::l ,..... r::.. en (t> ,.... c
'"?
~~"'U;"""'.1''''''''''''''''h"''/'~~''~''Y~Y''Y'''N''''''.1'''''YN'''N''''/:''''//-'''''' •• ...,..y .... : ..... y,h .... "',N •• Y •• ,U ... ;". .. HhY ...... ". ..... ,.. ...... 'j.~-( .............. =~.
I ~ i ~ ~ ~ ~
~ I ~ '" compi ! ~ " $. 1··········· Coherent Innova 310 cw 5W all lines ~ " */)yp/ ...... H~fw/ ... H#~ ~ J I ~~ ~ I-r------a--:;::--:.-------I
III c! I : ~O-~l\-~ : I _. . ........ ·a··l11------- \t?---\\:
~i 3 mm b 1 mm L _ _ _ _ _ _ _ _ _ _ _ _ _ _ ____ .J
~ : a) Ti:Sapphire Crystal ~ . i~'m ... wm.w'm~.m~,\ .. e <;pd ~? ~~t~~~t: Cell
j 1r ~ d) Microscope Objective ;:.t"',.; ........ /. .... h/...-//..W .................. H ............ HH ...... ..:ry ......... HN ............ hU" ... ...: 1 mm ) S h' W' d ; ~r e app Ire In ow J 1 mm f) 10 nm Bandpass Filter
rmwHmw''''''''-'''''''''''''"r :' f g) 300 ~lm.BBO Doubling Crystal
r'"".·.·'ow.w'"".w.vowow'~.w,.......=I. oW'··'···OJ 3 mm h) 2 mm Lli03 TYPE II :> j' ~ I ~ . A ~) Sample Flow Cell :111 :.'U: i<ff<'''.''.M''W/HH/H'#~/~"lO·O jl'\ J) HgCdTe IR Detector g... ~ i l 'p
cd:::. :.~ ~ i 1 :] ! -- 5 flm, -70 fs, -2 flJ . '. ~ . 6 mm .. : i·: '?<,,<w<m"'''''''''''-'##'#'H)(''''#'''/j'#''"'''O: i 800 nm -66 fs -19 flJ ~ .... ..... A' ~ I ~ ,:comp2 " .'?!>. 1" ~ ; OJ: " .·w······" 690 nm -300 fs -1201lJ ! 3 mm: " " ,.... 1 ' ,~",w,W<"~YH..,"*'«#~N i : 16······· 580 nm -165 fs - 410 flJ
t==~~~=~~~I=~:~"="~~ .. 'J ~- 290 nm: -290 ts: -5.3 flJ
1'1
cp IT
..... '«
Monochromator
jf~ ~~ cl-
,..---
I- .. ~
cp h···:\-····
~p.
Quanta-Ray GCR5 Nd:YAG
250 mJ, 532 nm, 30 Hz 2 ns

In spite of its relatively easy setup, the single-element scheme has several
drawbacks. For example, it requires typically one or two weeks of continuous run (24
hours) to obtain an IR spectrum in the CO stretching region with a sparse spectral density
of -2.5 cm-I/point. This spectral density is certainly not enough to resolve overlapping
peaks that are bound to appear as the research evolves to include systems that are more
complicated. In addition, the long data-taking time makes it almost impossible to have
more than one project going at the same time. An IR focal-plane-array (IR-FP A)
detector, which affords acquiring a -70 cm-I spectrum at one laser shot, improves the
situation largely.
1 (a) 800 nm
>-...... 0 'w c 1 (b) 690 nm CD ...... C
-0 CD N (ij E
0 ..... 0
Z (c) 590 nm
O"--~~T---T---~~~'" -750 -500 -250 o 250 500 750
Time Delay (femtoseconds)
Figure 2.2 Auto-correlation plots of the three laser pulses.
-13-
~ '00 (a) -800-nm beam c: Q) -c:
~
~ £ « 0 +-, --&.-----.-----'-------'-----"T'
770 780 790 800 810 820 830 840 850 Wavelength (nm)
~ '00 (b) -690-nm beam c: Q)
C
~ ~ -:0 4: 0 +-1 --i...-'W---..,...---:--.----'----=-F' ..... r--~
~
~ :e «
670 675 680 685 690 695 700 705 710 Wavelength (nm)
(c) -5 11m IR
o .1-, --=-______ --'-_____ --= ___ --.J
1800 2000 2200 2400 2600
Wavenumber (cm-1)
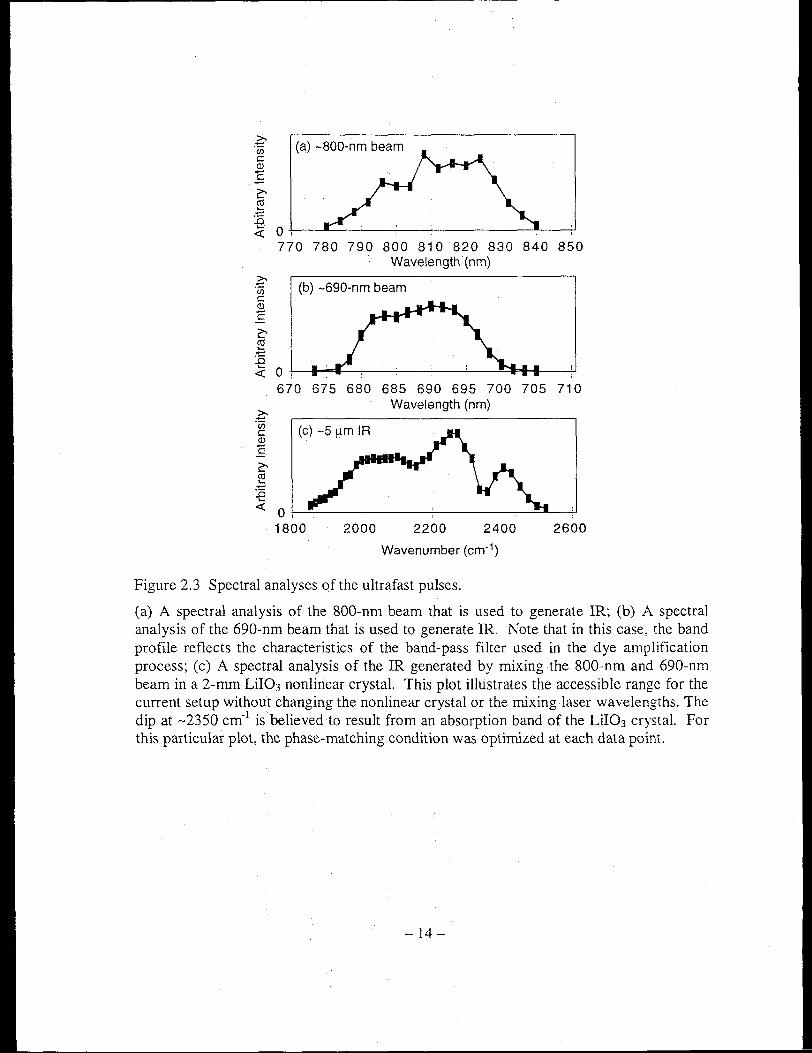
Figure 2.3 Spectral analyses of the ultrafast pulses.
(a) A spectral analysis of the 800-nm beam that is used to generate lR; (b) A spectral analysis of the 690-nm beam that is used to generate lR. Note that in this case, the band profile reflects the characteristics of the band-pass filter used in the dye amplification process; (c) A spectral analysis of the lR generated by mixing the 800-nm and 690-nm beam in a 2-mm Lil03 nonlinear crystal. This plot illustrates the accessible range for the current setup without changing the nonlinear crystal or the rr..ixing laser wavelengths. The dip at -2350 cm· l is believed to result from an absorption band of the Lil03 crystal. For this particular plot, the phase-matching condition was optimized at each data point.
-14-

2.2 IR Focal Plane Array (IR-FPA) Detector
The heart of the IR-FP A detector is an engineer grade, 256x256-element HgCdTe
(MCT) sensor chip of dimension 1.28x1.28 cm2 (or 50x50 )...lm2 per pixel). Although the
chip can be operated at room temperature, it is kept in contact with a 4-L liquid nitrogen
dewar to increase its sensitivity in the IR range. To minimize the shot-to-shot fluctuation
and transient heating of the detector, the IR probe pulses are separated into a reference
beam and signal beam, and are normalized as the data are being co llected. These two
beams are focused into an astigmatism-corrected spectrographic monochromator (150
grove/mm, 4.0 )...lm blazed grating) that form two spectrally resolved images on the FP A
chip. The two stripes are collected by two windows of 12x200 pixels, which allow
simultaneous normalization of a -70 cm- I spectrum. The long-time temperature drift is
minimized by normalizing the gain against the FPA readouts from a small region far
away from the illuminated area. Rejection of bad laser shots further improves the SIN
ratio. With a data acceptance ratio of about 0.5 and a 30-Hz laser repetition rate, it takes
about 1 minute to acquire signals on the order of 1 % absorbance change with 10: 1 SIN
ratio after signal averaging for 1000 valid laser shots. On the other hand, it would take
approximately 10 minutes using single-element detectors to obtain a fs-IR spectrum with
the same SIN ratio at the same spectral density (200 points over -70 cm- I). Therefore,
the new FPA detector gives a 10-fold speed boost in taking fs-IR spectra. The time
required for kinetic data acquisition is also greatly reduced. The kinetics of a certain
chemical species can be obtained by summing the desired IR band across lO's of spectral
points. Assuming that every pixel is independent of each other and that they have similar
intrinsic noise level, this summation scheme gives effectively more than 10-fold speed
increase in acquiring kinetic data. The increased spectral data density also allows a more
detailed analysis of spectra that contain overlapping bands, as will be explained in the C
CI bond activation chapter.
-15 -

'-Q)
i+ 0' 0 1
( 0' r!
i
Personality board and preamp r T - -,-
I
I 4-L dewar I
I '---
- - - l Spectrograph
~ 0 II Sync / Integrator - .- - -i- J
Power Supply I Signal/ Reference
Figure 2.4 Schematics of the IR-array setup.
Setup. To replace the single-element detector with the FP A, one simply exchanges the
original detection system including the monochromator (enclosed by the dashed line in
Figure 2.1) with the FP A setup. Figure 2.4 shows a block diagram of the FP A setup that
fits into the existing laser system. Both the dewar assembly and the spectrograph sit on
separate tilt-adjustable plates to compensate for mismatch in mechanical mounting. Once
the initial optimization is complete, it is a simple matter to remove / reinstall the dewar
assembly for maintenance. A nitrogen line is connected to the spectrograph to keep
moisture from condensing on the interior or the front window of the detector.
The details of the modifications made to the Sync-integrator unit have been
annotated in the original schematics! and described in the laboratory notebook.! Briefly,
the analog amplifying chain has been boosted from 3 to 114. Together with the gain
provided by preamp (1. Ix), the total gain is about 125. It was found that the amplifying
chains are very sensitive to temperature. Therefore, a warm-up time of 20 min is
required for the system to reach thermal equilibrium. After setting up the analog gain,
one has to balance the odd- and even-channel.s. This has been achieved by adjusting the
T 1 to Ts variable resisters on the chain-amplifiers. The analog-to-digital conversion
1 Schematics title: High-Speed Signal Chain; Revision H; Schematics date: May 30, 1997.
-16-
CADC) board has a 16-bit resolution, which affords a dynamic range of 0-65535 for each
pixel. In practice, only half of the available dynamic range is utilized. The origin of the
background noise is believed to be due to the quality of the chip (engineer grade) and
incomplete discharge of the capacitor. The latter can be alleviated by continuously
discarding a few data points before accepting one and has been encoded into the
software. The integration time also affects the background noise. It can be changed by
flipping the dip-switches on the J7 board.2 The current setting is 1.6 I-Ls. The optimal
integration time may vary with system. In the event that the opamps employed in the
above setup require replacement, it would be necessary to go through the procedure
outlined above to calibrate the system. Other settings including the bias potentials are not
expected to change for the same sensor chip; therefore, one can leave them as they are at
the optimized settings.
Software. Additional drivers for our shutter and translation stage are encoded into the
interface program3 that came with the IR-FP A. Efforts have been made on the software
level to minimize the signal fluctuation. The source codes are archived in the computer
archives of our laboratory. Modification of the program should be straightforward for
persons with minimal C-programming knowledge. Note that it can only be successfully
compiled with "Microsoft C++ 7.0" because some of the low-level drivers were written
with specific dependencies on the 7.0 libraries.
2.3 Frequency Chirping at the Vicinity of a Strongly-A.bsorbing IR Band
Most of the theoretical framework of UV -Vis pump, IR probe spectroscopy has
been established in the mid-90's [23, 24]; therefore, they will not be recounted here.
1 H. Yang's notebook volume IV, dated Mar. 6, 1997 to May 17, 1998. 2 A table of dip switch settings and corresponding integration time can be found on page 122 in the previously mentioned notebook. 3 Part of the interface program is credited to Dr. Tom Dougherty while he was at NIST.
-17-
However, there were two transient features that puzzled us in our initial studies of dipolar
solvation of LDS-7S0 dye (styrine 7) in nitrile solutions. With the publication of a
related study by Kovalenko et. al. [25], the wavelength-independent transient that
exhibits a longer decay time in longer-chain nitrile solutions appears to be the transient
absorption of a low-lying electronic excited state. The other unassigned transient feature
can now be attributed to pump induced chirping described below.
The intense pump field induced change in the refraction index, or transient
grating, has been intensively investigated in the past decade [26]. The majority of the
studies were conducted in the off-resonant optical region where appropriate
approximations can be made to simplify data analysis; sometimes it is possible to arrive
at an analytical expression. However, in the infrared region, a -100-fs IR pulse that
spans -150 cm- I in frequency may cover several vibrational transitions such that many
approximations that are taken for granted in the analysis of optical experiments are no
longer valid. This section explains one aspect of nonlinear optical-pump, IR-probe
spectroscopy that has not been clearly discussed in the literature. The complication arises
when the pump field is not in resonance with the sample, be it pure liquid or solution, but
the probe field covers at least one vibrational transition. Therefore, additional analyses
seem necessary to understand the transient signals that appear in such experiments.
2.3.1 Theory
In the following, it is assumed that the system consists of only pure liquid (the
medium) that has an intense infrared absorption overlapping with the probe field.
Extension to solutions of more than one component and/or to molecular media with
multiple IR transitions should be straightforward. One starts by writing down the
expression for frequency-resolved probe signal Iprobi Ctl tdel) In a pump-probe
configuration [27],
-18 -

Equation 2.1
where tdel is the pump-probe delay and I1OJ(t,tdel ) is the new frequency component
introduced by the pump. The l' probe is the probe field envelope centered at OJo and can
be well represented by a Gaussian function,
Equation 2.2 , _ ( 2) [ OJ - OJo 2) 1 probe(t,OJ)-exp-(t/(jprobe) exp -( ) (j (VO
In the above expression, (j probe and (j (VO are the pulse width and the spectral width of the
probe.
The intense pump laser beam (off' resonance) interacts with the medium to induce
a change in the index ofrefraction, On,
Equation 2.3 on(t) = n2 (OJ pump' OJ probe)1 pump (t),
where, to a very good approximation, the pump field envelope can be represented by a
Gaussian function,
Equation 2.4
and n2( utump, C4robe) is the nonlinear index of refraction which depends on both the pump
and probe frequencies [28]. For a time-varying pump field, the induced third-order
response introduces a time-dependent phase shift,
Equation 2.5 o¢(t) = ;1CL on(t) , probe
where L is the sample thickness and Aprobe is the wavelength of the probe. When the
probe pulse passes through the medium, the time-dependent phase modulation caused by
the pump field introduces new frequency components into the probe field (frequency
chirping):
-19-
Equation 2.6 a
1:101 = -8dJ(t). at '
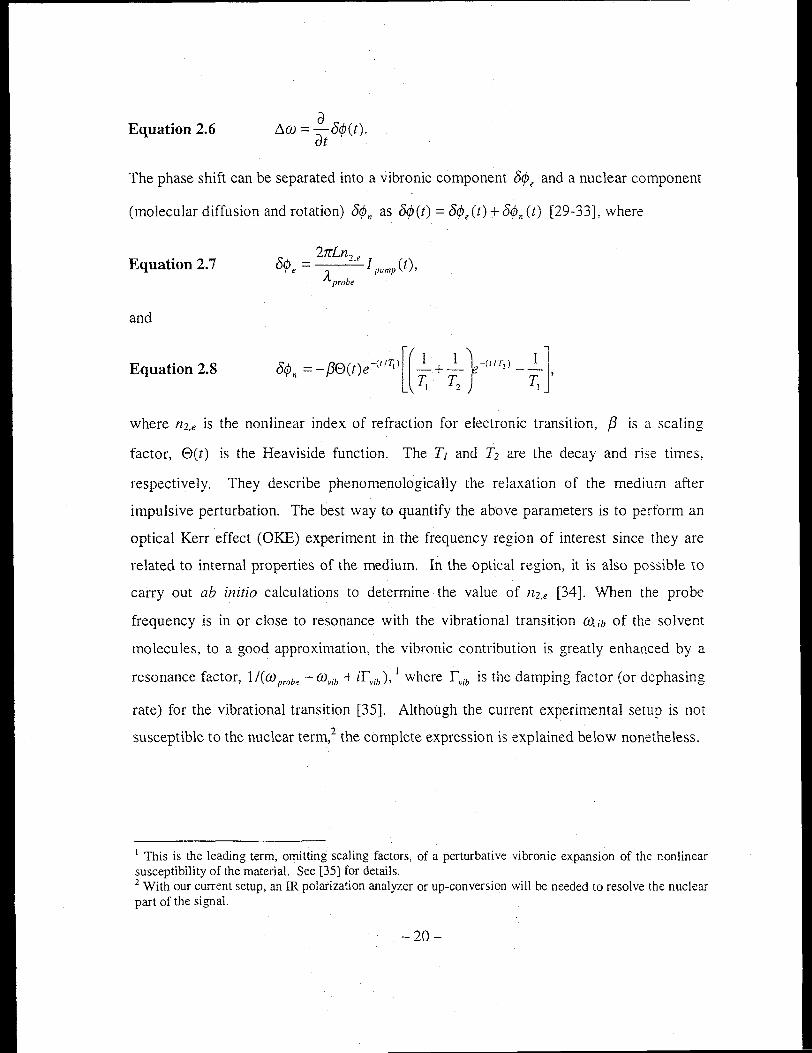
The phase shift can be separated into avibronic component 8¢e and a nuclear component
(molecular diffusion and rotation) 8¢n as 8¢(t) = 8¢e (t) + 8¢n (t) [29-33], where
Equation 2.7 2nLn1.e
8¢ e = I pump (t), Ilprobe
and
Equation 2.8
where n2,e is the nonlinear index of refraction for electronic transition, f3 is a scaling
factor, eu) is the Heaviside function. The TI and T2 are the decay and rise times,
respectively. They describe phenomenologically the relaxation of the medium after
impulsive perturbation. The best way to quantify the above parameters is to perform an
optical Kerr effect (OKE) experiment in the frequency region of interest since they are
related to internal properties of the medium. In the optical region, it is also possible to
carry out ab initio calculations to determine the value of H2.e [34]. When the probe
frequency is in or close to resonance with the vibrational transition O1.ib of the solvent
mo lecules, to a good approximation, the vibronic contribution is greatly enhanced by a
resonance factor, 1 /(m probe - O1vib + ilvib)' I where IVib is the damping factor (or dephasing
rate) for the vibrational transition [35]. Although the current experimental setup is not
susceptible to the nuclear term,2 the complete expression is explained below nonetheless.
1 This is the leading term, omitting scaling factors, of a perturbative vibronic expansion of the nonlinear susceptibility of the material. See [35] for details. 2 With our current setup, an IR polarization analyzer or up-conversion will be needed to resolve the nuclear part of the signal.
-20-
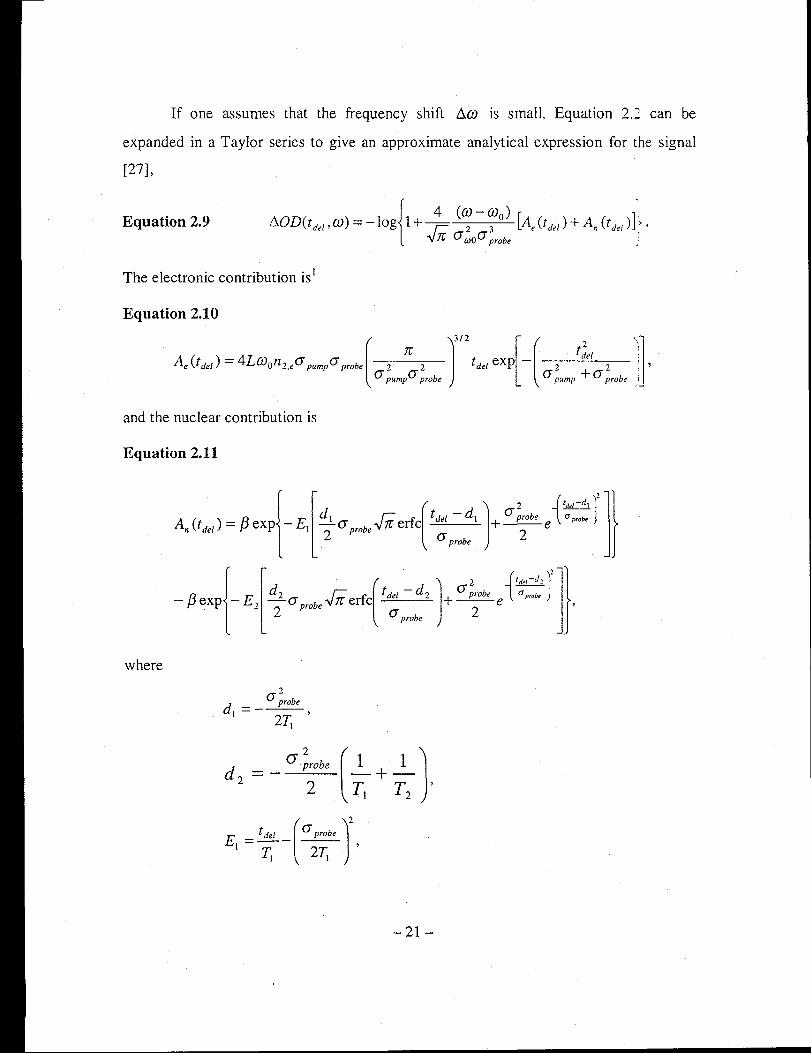
If one assumes that the frequency shift t3.W is small, Equation 2.2 can be
expanded in a Taylor series to give an approximate analytical expression for the signal
[27],
Equation 2.9
The electronic contribution is 1
Equation 2.10
[ J3/2 [[ ? \-rc t del '
Ae (tdel ) = 4Lwon 2.ea pump a probe 2 2 tdel exp - 2 2: ,
a pumpa probe a pump + a probe j...;
and the nuclear contribution is
Equation 2.11
where
?
d - _ a;robe
1 - ,
2Tl
2
d - _ (j probe
2 -2
- 21-
( 1 1 J [a probe ( 1 1 J] 2
EI =tdel TI + T2 - -2- :~ + T2
2.3.2 Comparison with Experiments
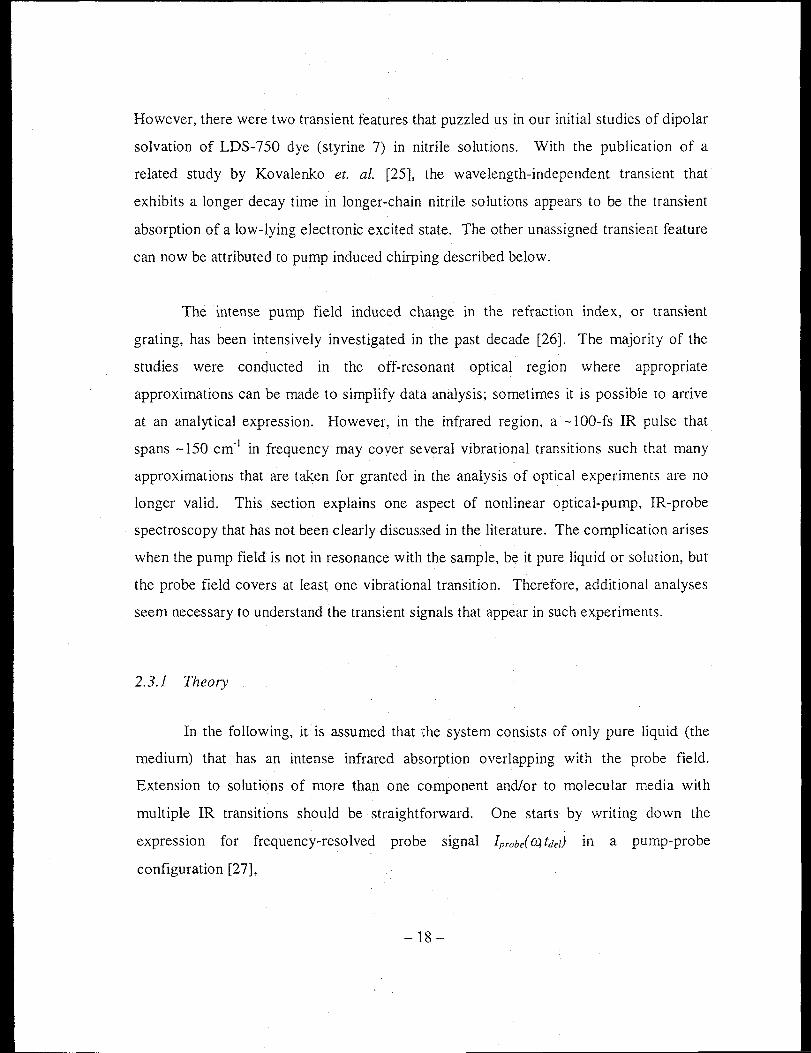
I
(a) 2206.8 cm-1
o ~-r-"""""'~-"'--'-/'-"-';~\r-::-'Il\/ < , < ...... v ~ v "\, I'
1 I 1 I
(b) 2228.8 cm-1
1 I 1 I I I 1
(d) 2266.8 cm-1
""' ~
/' I \. , / /' 0 '" . ./"
I
, I
-3 -2 -1 o 2 3
Time Delay (ps)
Figure 2.5 Comparison of experiments with theory for pump induced IR chirping.
Figure 2.5 compares the transient signals (long dashed lines, pumping at 580 nm)
of neat benzonitrile to the theory (solid lines). In the experiment, the IR beam was
optimized at 2000 cm- I. Therefore, the calculation assumes that the IR has a central
frequency of 2000 em-I, and a spectral bandwidth of 150 em-I. The damping constant
1 There is a mistake in Eq. (11) of Ref. [27], probably a typo~
-22-
rvib z 3.85 cm· l is estimated from the width of the CN stretch (2229.4 cm· l) of the static
FfIR spectrum shown in the insert. The same scaling factor is used for all theoretical
lines. As displayed in the figure, the transients change sign as the pump-probe delay
passes to because the probe field is phase-modulated by the pump (Equation 2.6). The
direction of the modulation is determined by the time-derivative of the pump field, which
changes sign before and after to. The transients also change sign at either side of the CN
band, as a direct result of the near-resonant term, l/(m probe - m"ib + irvib ) .
2.4 The Vibrational Stark Effect
Consider the vibrational motion of a diatomic molecule, say CO, the frequency of
which is determined by the distribution of the electron density. In a static picture, the
electron distribution-or equivalently the force constant of the oscillator-changes when
the molecule is subjected to an external field. For polyatomic molecules, the external
field may also break the symmetry such that new vibrational bands may appear. Such a
change of vibrational frequency due to an external field, or vibrational Stark effect, have
been observed in zeolites [36], adsorbates on metal surfaces [37-41], and biological
samples [42]. These results suggest the potential utilization of vibrational Stark effect as
a probe for the dynamics of local environment. This section discusses some basic aspects
of the vibrational Stark effect (VSE) and methods of calculating the frequency shift.
2.4.1 An Analytical Model
A theoretical model for VSE has been formulated by Lambert in the 80's [38,43].
This section outlines the derivation to illustrate the coupling between the external field
and the frequency shift. In the following discussion, the vibrational coordinate of an
- 23-

oscillator, say CO, IS expressed In normal coordinate Q In the field-free \'ibrational
Hamiltonian,
Equation 2.12 1 ? 1 ??
H = 2J.l PC! + 2. JiorQ- ,
where ~ is the reduced mass, PQ the conjugate momentum, and OJ the \'ibrational
frequency. Qualitatively, the application of a static external electric field causes
redistribution of the electron density and that of the nuclei such that the equilibrium
positions of the nuclei are different from those without an external field. The result is a
change in the vibrational frequency.
To find the frequency shift, one first writes the vibrational potential F that IS
under a static electric field E in the form of perturbative expansion:
Equation 2.13 V(Q, E) = La jkQj Ek • j,k
Recasting the above equation In an expansion with respect to the new equilibrium
position Qo (E) = - ;;;~o E when there is an external field E,
Equation 2.14
where
Equation 2.15
Expressions of en in terms of aij are found by comparing the Taylor expansion of
Equation 2.13 to Equation 2.14. One finds that
Equation 2.16 = ano + a ll+1.0 (n + l)Q •
The v = 0-"71 transition frequency derived from Equation 2.14 is
-24-
Equation 2.17 1 (2C )~ VOl = - __ 2 + higher order terms • 2Tr J.1 .
Hence, the frequency shift with respect to the external field, the vibrational Stark tuning
rate, is
Equation 2.18
In the above expression, the coefficients a20 and a30 are related to the field-free
molecular vibrational frequency and anharmonicity, which can be obtained from gas
phase spectroscopy; whereas estimation of the other two parameters a 21 and all require
additional experiment data under external fields. Using the above expression, Lamben
was able to estimate the contribution of higher-order terms to the vibrational tuning rate
and found that the second- and third-order terms contribute less than 511 000 of the total
magnitude.
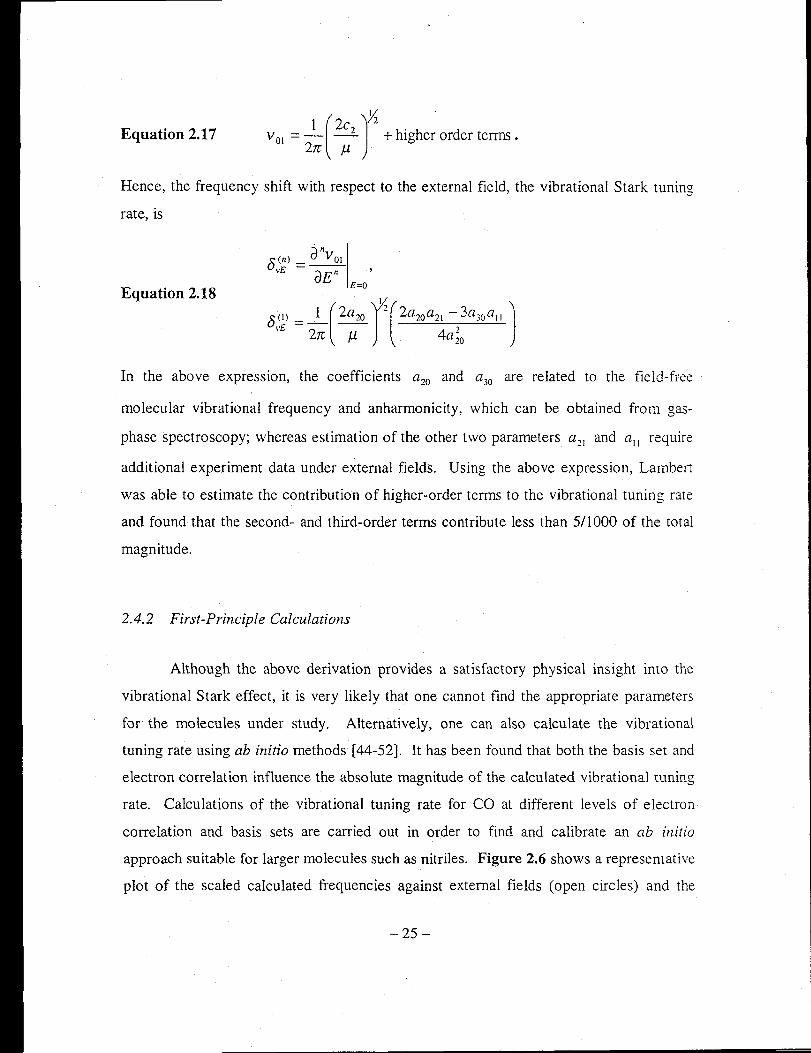
2.4.2 First-Principle Calculations
Although the above derivation provides a satisfactory physical insight into the
vibrational Stark effect, it is very likely that one cannot find the appropriate parameters
for the molecules under study. Alternatively, one can also calculate the vibrational
tuning rate using ab initio methods [44-52]. It has been found that both the basis set and
electron correlation influence the absolute magnitude of the calculated vibrational tuning
rate. Calculations of the vibrational tuning rate for CO at different levels of electron
correlation and basis sets are carried out in order to find and calibrate an ab initio
approach suitable for larger molecules such as nitriles. Figure 2.6 shows a representative
plot of the scaled calculated frequencies against external fields (open circles) and the
-25-

polynomial fit (solid line) that determines the vibrational tuning rate 0VE' Selected
results are listed in Table 2.1,1 which shows. that the use of the 6-311G(d,p) basis set at
the Hartree-Fock level produces the best result comparing to the experimental value (-
5.09 ± 1.0)xlO-7 cm- I (V/cmrl [38]. Therefore, the same methodology is applied to
calculating 0VE for the eN stretch of acetonitrile and benzonitrile. Figure 2.7 shows the
results for acetonitrile. The directions of the external field and the molecular dipole are
indicated in the insert. It is evident from the plots that higher-order terms of 0,.[ become
important at greater field strength. In general, an acetonitrile molecule tends to align its
dipole with the field (positive direction on the plots), thus shifting its \'ibrational
frequency to the red while augmenting its vibrational intensity. Similar conclusions can
be made to benzonitrile, results shown in Figure 2.8.
With these results, one can estimate the frequency shift that may result from a
dipole change of, say, 10 Debye of a probe molecule. If one assumes a continuous
dielectric medium of acetonitrile and estimates the frequency shift of acetonitrile at 4 A
away from the probe molecule, one obtains only 0.8-cm-1 shift. However, if one assumes
vacuum between the probe molecule and an acetonitrile, the result becomes 27 cm-1! A
more reliable calculation would be to perform a molecular dynamics simulation, to be
described in the next section. Nonetheless, the above calculations suggest that it is
possible to utilize the VSE as a probe for the dynamics of the local environment.
Potential applications include probing the local response to a charge-transfer reaction and
following the backbone dynamics of a macromolecule.
I The calculations were carried using Gf\MESS-US, Ref. [53].
-26-

Table 2.1 Selected results for characterization of different ab initio approaches to calculating the vibrational tuning rate.
~ 'S
Method
HF/6-311G(d,p) MP2/6-311G(d,p)a HF/6-311G(d,p)b HF/6-31 G(d,p)C
-6. 17xlO-1
-1.94xlO-7
-5.59xlO-7
-5.82xlO-7
a A scaling factor of 0.9496 is applied for this calculation [54]. a A scaling factor of 0.9051 is applied for this calculation [54]. a A scaling factor of 0.8992 is applied for this calculation [54].
2300~~------------------------------,
~ 2250 g <D
g. 2200 ... ~
:g 2150 0\ ci '--' "0
"* 2100 o
U)
SCF/6-31lg(d,p) 2050~~~~~~~~~~~~~~~~~~
-250 -200 -150 -100 -50 0 50 100 150 200 250
Field Strength (MY/cm)
feE) = -6. 134698x1O-16 X E2 - 5.586121x1O-7 X E + 2201.271
Expt = (-5.09 ± 1.0) x 10-7 (V/cmt1 cm- l
Figure 2.6 Evaluation of ab initio vibrational Stark effect for CO.
-27-
2380 .....
E .( . Ll
2360 H3CDC=N <..l
;: 2340 .( ..... <..l E c OJ 2320 :::l
~ 2300 feE) = -7 .552952xlO-26 E3 LL
"0 2280 -1.l48790x10-15 E2 OJ co 2260 -3.029997xlO-7 E <..l
(J) + 2352.671 2240
-200 -100 0 100 200 Field Strength (MV/cm)
4 0J I(E) = 8.840049xlO-35 E4 .
+ 3.402086xlO-27 E3 :::l ~ 3 + 3.880190xlO-17 E2 C\I OJ
+ 7.037772xlO-9 E >. ..0 OJ 2 e, + 0.3141020
.£ (/) 1 c OJ C O+,~--~&-~~~~--~~~
-200 -100 0 100 200 Field Strength (MV/cm)
Figure 2.7 Evaluation of ab initio vibrational Stark effect for CH3CN.
-28-

2360~----------------------~
~E 2350 .s. g 2340 (lJ ::J
~ 2330 LL <:J '* 2320 u CI)
f(E) = -2.407840xlO- 15 E2
+ 4.575420xlO-7 E + 2341.521
2310+-~~~~~~--~~~~~
-60 -40 -20 o 20 40 60
N"3
Field Strength (MV/cm)
I(E) = 2.552047xIO-16 E2
-3.217388xlO-8 E + 1.042237
O~~~~~~~~~----~~
-60 -40 -20 o 20 40 60 Field Strength (MV/cm)
Figure 2.8 Evaluation of ab initio vibrational Stark effect for C6HSCN.
-29-
2.5 Classical Molecular Dynamics Simulation
The physical picture for the dynamics of a liquid-phase chemical reaction cannot
be complete without including the surrounding solvent molecules. The previous two
sections have covered theoretical bases for the design and interpretation of femtosecond
IR experiments to directly monitor such solvent dynamics. However, the experimental
results are essentially ensemble averages of the observables. A direct means of
connecting the microscopic molecular motion to the experimental observable is through
statistic analysis of molecular dynamics (MD) simulations. This section summarizes the
development and implementation of a MD engine that is suitable for those purposes.
2.5.1 Potential Models
The potential model is a modified version of the three-site SPC model of Edwards
et. al. [55] that was parameterized to experimental thermodynamic properties. This
model, as originally devised, assumes a rigid molecular structure of the acetonitrile
molecule. The current implementation adopts the same intermolecular interaction form,
on top of which an intramolecular potential is grafted for simulations of flexible
acetonitrile.
The intermolecular interactions consist of Lennard-Jones potentials and
Coulombic interactions between different atomic sites. The form of the intermolecular
potential function is given by
Equation 2.19
N-j
U(2) Crl ,r2 ) = I.. i~l
f [( J6 ( J12] } Nn n (j (j I..l: 2: 4£ ~ - ~ +_l_qaqb +c. .
j=i+l a=l b=l l a.b ria,jb r ia. jb 47r£o r ia . jb w.,b
-30-
where N is the number of molecules being simulated and na is the number of atoms in a
molecule. The indices i and j refer to the molecules, whereas the subscripts a and b
represent the methyl (Me) group, the carbon or the nitrogen atom sites. The qa and qb are
the fractional charges in units of e, Co is the permittivity of free space and Cia,jb is the
constant for correcting the Lennard-Jones cut-off:
when ria,jb S RcUl = 2.Scy a,b
Equation 2.20 when ria,jb > RcUl
The cross interaction parameters are determined by the combining rules
Equation 2.21
The numerical values of the parameters are given in Table 2.1.
Table 2.2 Intermolecular parameters for acetonitrile MD simulation.
Parameter CH3 C N q (e-) 0.269 0.129 -0.398 cy(}\) 3.6 3.4 3.3 c (K) 191 50 50
r(H3C-C) = 1.458 A, r(C-N) = 1.157 A.
The harmonic intramolecular potential is a quadratic form in L1r" L1r2 , and L18 :
Equation 2.22
where L18 is the change in Me-C-N angle and L1r" L1r2 are the stretches in the Me-C
and C-N bond lengths, respectively. The force constants k], k2, and ke are calculated
from gas-phase spectroscopic data [56] by the standard "FG" matrix decomposition
method [571. Parameters used for intramolecular potential are: k/ = 0.3066551978, kJ =
1.0695597563, and ke = 0.0096949221.
- 31-

------------------------------------------------------~-------------------------------- .. ----
2.5.2 Simulation Details
All bulk acetonitrile simulations are performed with 108, 256, or 500 acetonitrile
molecules in a periodically replicated cubic box of length L such that the density is at its
ambient value, 0.78745 g cm-3 [58]. The long-range Coulombic forces are treated by
standard Ewald sums method [59] with a total number of 221 k-vectors. The minimum
image convention is used for Lennard-Jones interactions with truncation length Ll2. A
"weak-coupling" constant temperature algorithm [60] with a coupling constant of 0.4 ps
yields an average temperature of -300 K. Care has been taken to ensure equipartition of
energies among all degrees of freedom. A separate temperature scaling scheme [61] for
center-of-mass motions and internal degrees of freedom (vibrational and rotational) is
utilized for simulations of flexible CH3CN. As Wallqvist and Teleman have discussed in
a simulation of flexible water [61], it takes more than 100 ps to equipartition the energy
among all modes for a harmonic model when the Coulombic forces are treated without
the Ewald summation. However, the relaxation time reduces to - 100 ps when the Ewald
summation is used. With their separate temperature-scaling scheme, the equilibrating
time further reduces to within 4 ps. In this work, the relaxation time is also found to be
within 4 ps.
For simulations of flexible acetonitrile, the equations of motion are integrated
usmg the reversible reference system propagator algorithm (r-RESPA) developed by
Tuckerman, Berne, and Martyna [62]. In the present implementation, the intramolecular
forces are considered as "hard forces" and the corresponding motions are integrated at
time steps of 0.75 fs. The "soft forces" consisting of the Lennard-Jones and Coulombic
interactions are integrated at time steps of 3.75 fs. The r-RESPA method provides a
computational saving of a factor of 4 in this application. The equations of motion for
rigid acetonitrile are solved with the Singer·-Taylor's method [63] and integrated using
the Verlet leapfrog algorithm [59]. The time step for rigid acetonitrile simulations is 10
-32-

fs. The energy fluctuations for both the flexible model and the rigid model are found to
be within 0.5%.
For each run, the system is prepared in an a-f.c.c. configuration, allowed to
equilibrate for -100 ps, and then run out up to -1 ns. The thermodynamic data are then
sampled at every lOps. These equilibrated configurations serve as the starting
configurations for later nonequilibrium simulations. The dynamic properties are
calculated from a -20-ps run after a 10-ps equilibration time starting with an equilibrated
configuration. All MD codes are written in C and run on UNIX workstations.
2.5.3 Results
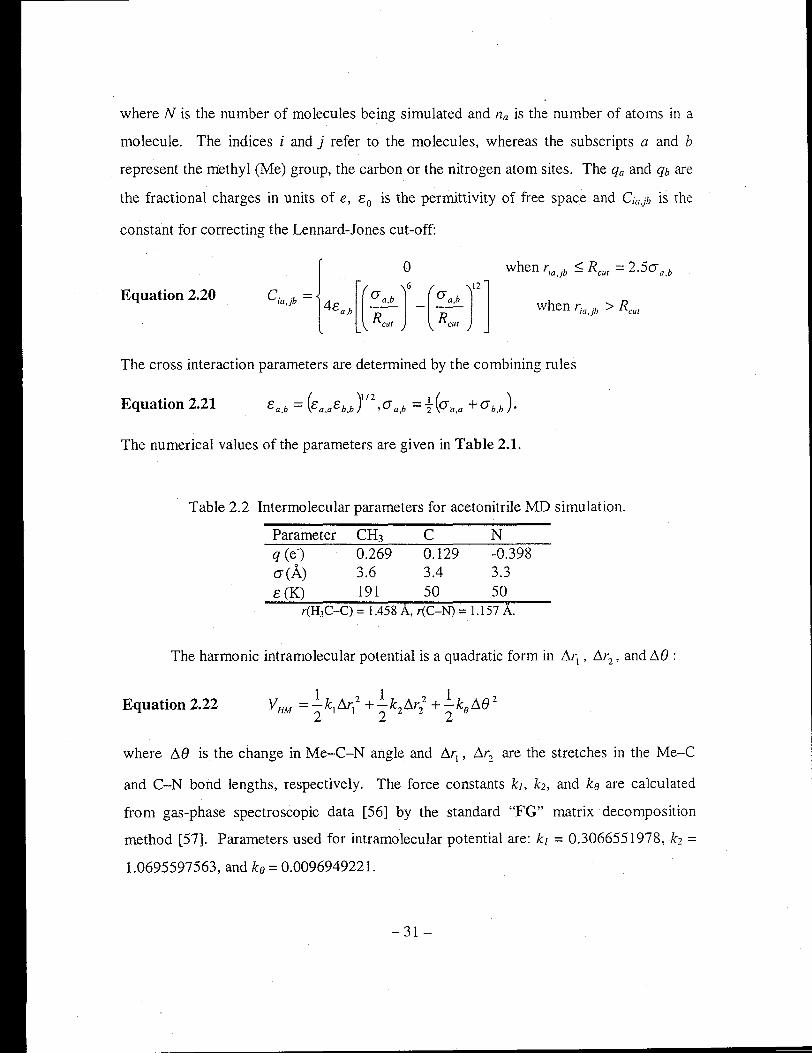
Figure 2.9 shows representative diagnostic results from equilibrium runs of the
flexible acetonitrile. The velocity-velocity autocorrelation functions of each site shown
in Figure 2.9a demonstrate the available frequency components for such a model liquid.
The four distinct spectral features are the nuclear motion, the CH3-C-N bending, the
CHrC stretching, and the C-N stretching, respectively. The center-of-mass particle
particle autocorrelation function shown in Figure 2.9b clearly demonstrates the solvent
shell structure around a tagged solvent molecule. Such a long-range structure disappears
when the tagged solute is charged or has a permanent dipole moment as will be
demonstrated in the next two figures.
-33-
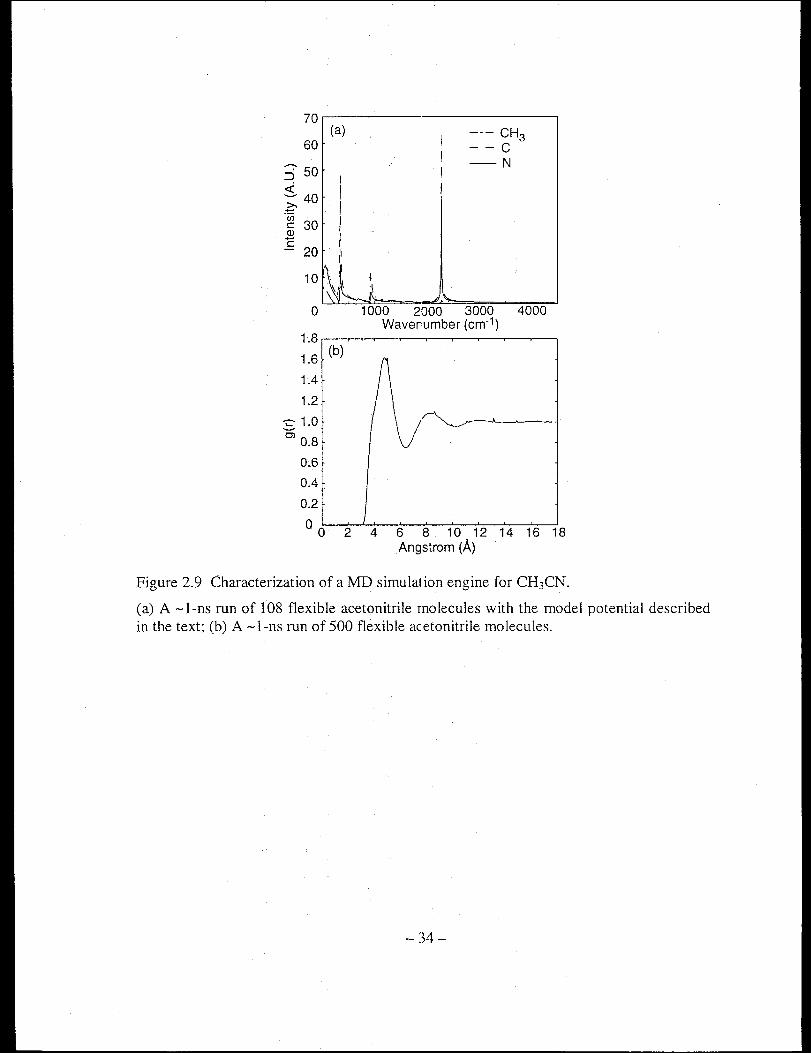
70~----------------------~
(a) --- CH3 60
;- 50 <i ....... 40 .£ ~ 30 (])
C
I I I I I
20 II
- - C -N
10 h: I
1~ll L o 1000 2000 3000
Wavenumber (cm-1) 1.8
1.6 (b)
1.4
1.2
:s 1.0 OJ 0.8
0.6
0.4
0.2
4000
00 2 4 6 8 10 12 14 16 18
Angstrom (A)
Figure 2.9 Characterization of a MD simulation engine for CH3CN.
(a) A -l-ns run of 108 flexible acetonitrile molecules with the model potential described in the text; (b) A -l-ns run of 500 flexible acetonitrile molecules.
-34-
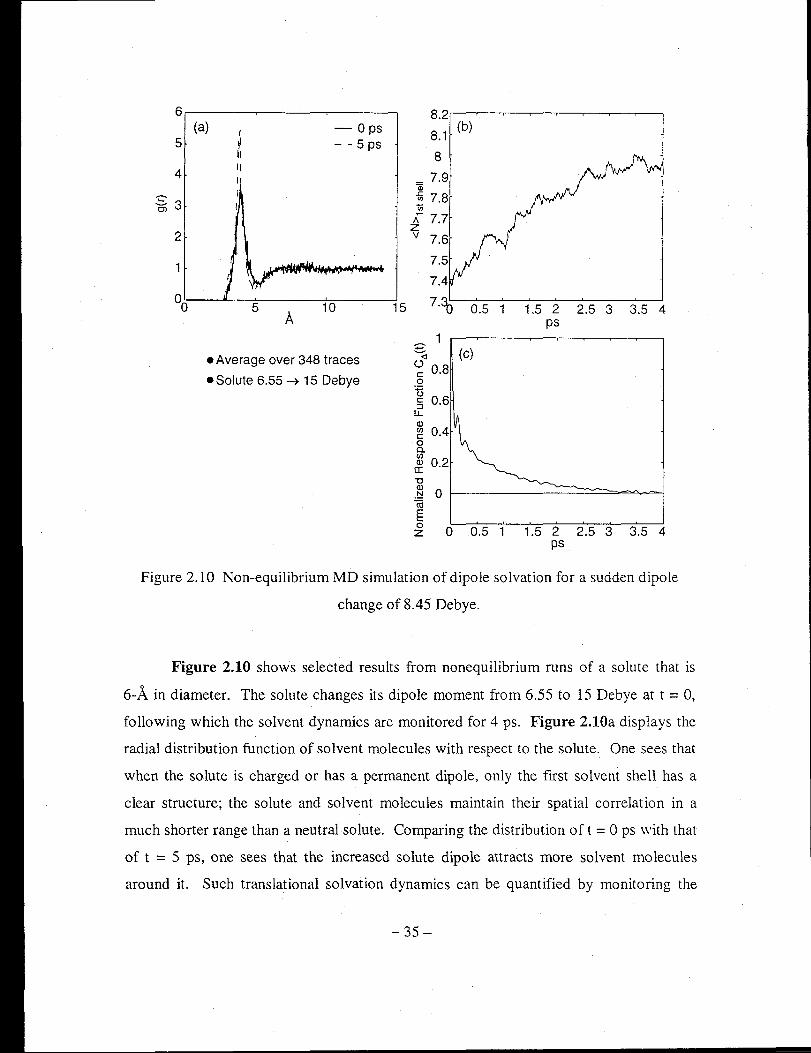
6 8.2 (a) - Ops
8.1 (b)
5 - - 5 ps 8
4 II _ 7.9 Qj
;; 3 ii 7.8 tii ;: 7.7 z
2 v 7.6
00 A
10 15 7·30 0.5 1 1.5 2 2.5 3 3.5 4 ps
~ - (c) _Average over 348 traces '<l ()
- Solute 6.55 -+ 15 Debye c 0.8 0
n § 0.6
LL (!)
~ 0.4 0 a. U1 £ 0.2 "0 Q)
0 .~ Cii E 0
0 0.5 1 1.5 2 2.5 3 3.5 4 z ps
Figure 2.10 Non-equilibrium MD simulation of dipole solvation for a sudden dipole
change of 8.45 Debye.
Figure 2.10 shows selected results from nonequilibrium runs of a solute that is
6-A in diameter. The solute changes its dipole moment from 6.55 to 15 Debye at t = 0,
following which the solvent dynamics are monitored for 4 ps. Figure 2.10a displays the
radial distribution function of solvent molecules with respect to the solute. One sees that
when the solute is charged or has a permanent dipole, only the first solvent shell has a
clear structure; the solute and solvent molecules maintain their spatial correlation in a
much shorter range than a neutral solute. Comparing the distribution of t = ° ps with that
of t = 5 ps, one sees that the increased solute dipole attracts more solvent molecules
around it. Such translational solvation dynamics can be quantified by monitoring the
-35 -
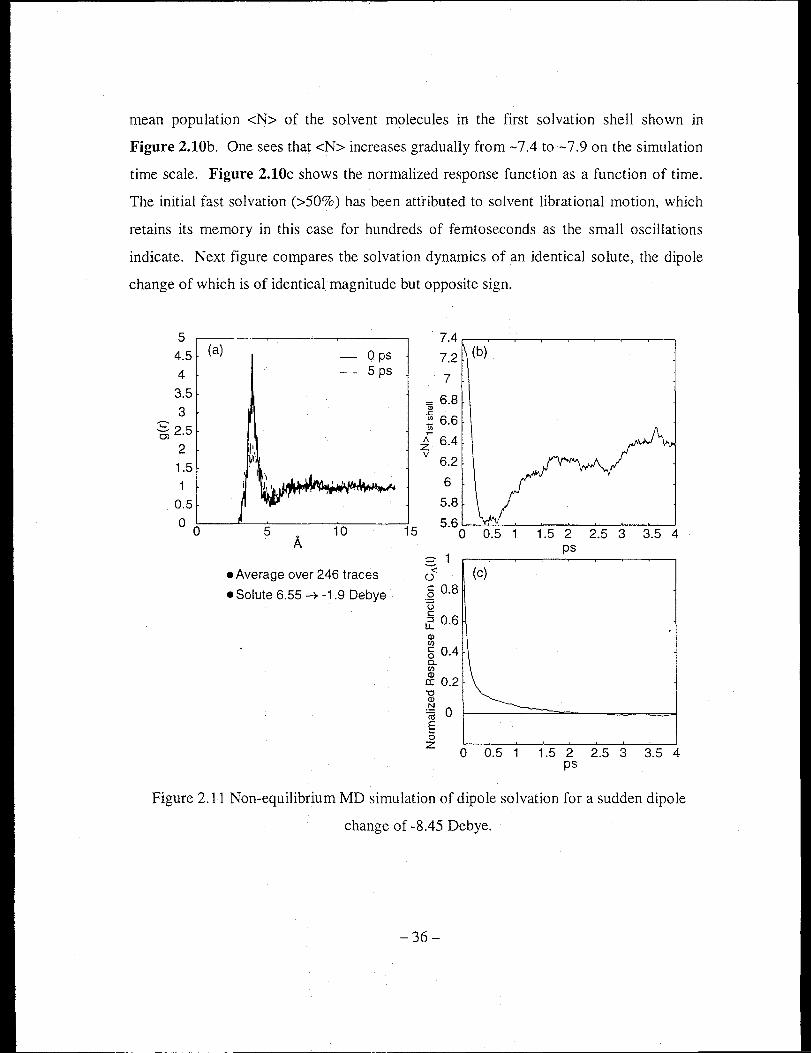
mean population <N> of the solvent molecules in the first solvation shell shown in
Figure 2.10b. One sees that <N> increases gradually from -7.4 to -7.9 on the simulation
time scale. Figure 2.10c shows the normalized response function as a function of time.
The initial fast solvation (>50%) has been attributed to solvent librational motion, which
retains its memory in this case for hundreds of femtoseconds as the small oscillations
indicate. Next figure compares the solvation dynamics of an identical solute, the dipole
change of which is of identical magnitude but opposite sign.
5
4.5 (a) o ps
4 5 ps
3.5
3
'6; 2.5
2 1.5
0.5
o 0 A
15
• Average over 246 traces
• Solute 6.55 ~ -1.9 Debye
7.4
7.2
7
= 6.8 '" ..c: ~ 6.6 (/)
A 6.4 z v
6.2
6
5.8
5.6
=- 1 <J o .§ 0.8 t5 c tI 0.6 Q) (/)
is 0.4
(b)
0 0.5 1.5 2 2.5 3 3.5 4 ps
(c)
{O.2~ 'fa 0 E o z 0 0.5 1 1.5 2 2.5 3 3.5 4
ps
Figure 2.11 Non-equilibrium MD simulation of dipole solvation for a sudden dipole
change of -8.45 Debye.
-36-
One sees that in this case the mean-population of the first-solvation shell
decreases when the solute changes its sign and magnitude. Figure 2.11b shows that <.;,\>
firstly decreases from -7.4 to -5.6 within 500 fs, then recovers to -6.4 at 4-ps after
dipole change. This can be understood as follows. Before t = 0, the solute has a greater
dipole moment such that acetonitrile is better aligned with the solute dipole. "''hen the
solute dipole suddenly reverses its direction and reduces the magnitude, the solyent
molecules no longer experience an attracting force from the solute, but a strong repulsing
field. This results in the initial ballistic motion of the solvent to move away from the
energetically unfavorable solute within 500 fs. At a longer time scale, the soh'ent
molecules rearrange to accommodate themselves for the new field the system gradually
reaches a new equilibrium. It is interesting to note that the energy correlation function
plotted in Figure 2.1lc exhibits a smooth, monotonic decay (>80% within 500 fs) as
opposed to small oscillations observed in the previous case. Both Figure 2.llb and
Figure 2.1lc are consistent with the picture that, for this case, the initial ballistic motion
of the first solvent shell is greatly "frustrated" by the outer-shell solvent molecules. 1
2.6 Conclusion
This chapter has covered several topics that may be essential for further
development of studying liquid-phase reaction dynamics. In particular, the roles the
solvent molecules partake in a complicated chemical reaction remain unclear and a\\'ait
further elucidation. It is hoped that some of the concepts discussed in this chapter will
eventually contribute to future studies of the fascinating field of chemical reaction
dynamics.
1 During the course of the MD simulation studies, it was found that the solute charge density (charge/size) plays an important in the dynamics of dipolar solvation. In particular, the degree of solvent "frustration" varies with solute charge density. These observations are in line with a very recent paper by Tran and Schwartz [64), who studied effects of solute size in aqueous solutions.
-37 -

3 C-H BOND ACTIVATION BY 113 -TP*RH(CO)z
The natural abundance of alkanes makes them an ideal feedstock for organic
synthesis. The first step towards converting an alkane molecule into other synthetically
useful compounds is to cleave or activate the strong C-H bond (bond energy -100
kcallmol). Consequently, the chemistry needed to selectively activate a C-H bond has
been vigorously pursued in the past decade [65-69]. Advancements in this area include
the development of homogeneous intermolecular C-H bond activation by organometallic
compounds [70, 71]. They offer the possibility to tailor a specific reaction utilizing well
developed synthetic strategies. The rational design of such a reaction relies significantly
on knowledge of both the detailed reaction mechanism and the nature of the reaction
intermediates. Previous mechanistic studies of photochemical C-H bond activation have
focused on the 115 -Cp *M(COh (M = Ir, Rh) compounds, which, unfortunately, have
relatively low quantum yields [72]. Instead, the present work employs 113-Tp"Rh(CO)2
(Tp* = HB-PZ*3, pz* = 3,5-dimethylpyrazolyl, structure shown in Figure 3.1), which has
been shown to photochemically activate alkane C-H bonds to form the final product
113-Tp*Rh(CO)(H)(R) (R = alkyl) with -30% quantum yields [73-76].
hv
RH
Figure 3.1 C-H bond activation by 113 -Tp *Rh(CO).
- 38-

3.1 The Dynamics of Reaction Intermediates-Vibrational Relaxation and
Molecular Morphology Change
1 10 ps ) (a)
O+-=-----~~=---~--~ __ --~~~~~~ -1
66 ps (b) -----::::i 1
$O-l-----""""'--~=::........jl-~-""""--~---~-!.-...j s::. o -1 .-..... fr1 o <n
~ 0
8 -1 s::
200ps (c)
660ps (d) ~ ~ ~ O+-----------~--~~~~------~~~~~ Q
-1
1 FTIR Difference S ectrum
O~~~~~~~~~~ __ ----~~~~----~ (t~ 00)
(e)
-1
1910 1950 1990 2030 2070
Wavenumber (em-I)
Figure 3.2 Ultrafast IR spectra of1l3-Tp*Rh(COh in alkane solution following 295-nm excitation.
Transient difference spectra in the CO stretching region for 113- Tp*Rh(COh in room
temperature alkane solution at various time delays following 295-nm photolysis. Panel (e) is an FTIR difference spectrum before and after 308-nm photolysis. A broad, wavelength independent background signal from CaF2 windows has been subtracted.
Photolysis of a CO ligand from the parent compound initiates the reaction. The
resultant 11 3- Tp *Rh(CO) complex has a coordinatively vacant site that is quickly occupied
by a solvent molecule. The timescale for such a solvation process is generally on the
order of a few ps in room-temperature liquids [77]. The solvated 113-Tp "Rh(CO)(S) (S =
alkane) complex exhibits a single CO stretching band (veo) at 1972 cm'l (the v = 0-71
band) as shown in Figure 3.2a. For this particular system the large excess energy (-40-
-39-
50 kcaVmol) deposited by the UV photon creates a non-Boltzman population distribution
such that higher vibrational levels may also be occupied to the extent that they become
observable. As a result, the v = 1 ~2 and v = 2~3 Veo transitions appear at 1958 and
1945 cm· l, respectively. The two hot bands gradually decay away while the v = 0 band
(1972 em-I) rises as the system approaches thermal equilibrium. The time scale for such
intramolecular relaxation (IVR) is measured by monitoring the population dynamics of
the v = 0 state. The 1972-cm-1 band shows a fast rise of -23 ps, attributed to the above
IVR process, and a slower decay of -200 ps (Figure 3.3a). The -200-ps decay indicates
that the ,,3_ Tp *Rh(CO)(S) solvate reacts to form another species on this time scale.
Indeed, another peak appears at 1990 cm-I at later time delays (Figure 3.2c and Figure
3.2d). The correlation between 113-Tp *Rh(CO)(S) and the 1 990-cm-1 species is
established by the - 200-ps rise of the 1990-cm-1 band (Figure 3.3b) [16].
The 1990-cm-1 band is attributed to an 112-Tp*Rh(CO)(S) solvate where one of the
three chelating pyrazolyl ligands detaches itself from the Rh center. To verify this
assignment the fs-IR spectra following UV photolysis of113-Tp*Rh(CO)2 are compared to
2 * * * . those of an analogous compound 11 -Bp Rh(CO)z (Bp = H2B-Pz 2, structure shown In
Figure 3.4). Photolysis of 112 -Bp *Rh(COh in alkane solutions results in the
112 -Bp *Rh(CO)(S) solvate that also exhibits a single CO stretching band at -1990 cm- l,
thereby providing experimental evidence for the assignment [15]. Theoretically, Zaric
and Hall computed the reaction using CH4 to model the alkane solvent [78]. Their DFT
calculations show that the 112-TpRh(CO)(CH4) (Tp = HB-Pz3, pz = pyrazolyl) complex is
energetically more stable than the 113-TpRh(CO) (CH4) complex by 7.7 kcallmol. In
addition, the DFT frequency of the model 113 complex is found 22-cm-1 higher than that
of the ,,3 complex. The calculated frequency shift in the model systems is consistent with
the observed 18-cm-1 blue shift from 113-Tp*Rh(CO)(S) (1972 cm-l) to 112-Tp*Rh(CO)(S)
(1990 cm-I). On the basis of the above-discussed evidence, it is concluded that the 1990-
cm-I intermediate is assigned as 113-Tp*Rh(CO)(S). Therefore, the observed 200-ps time
-40-
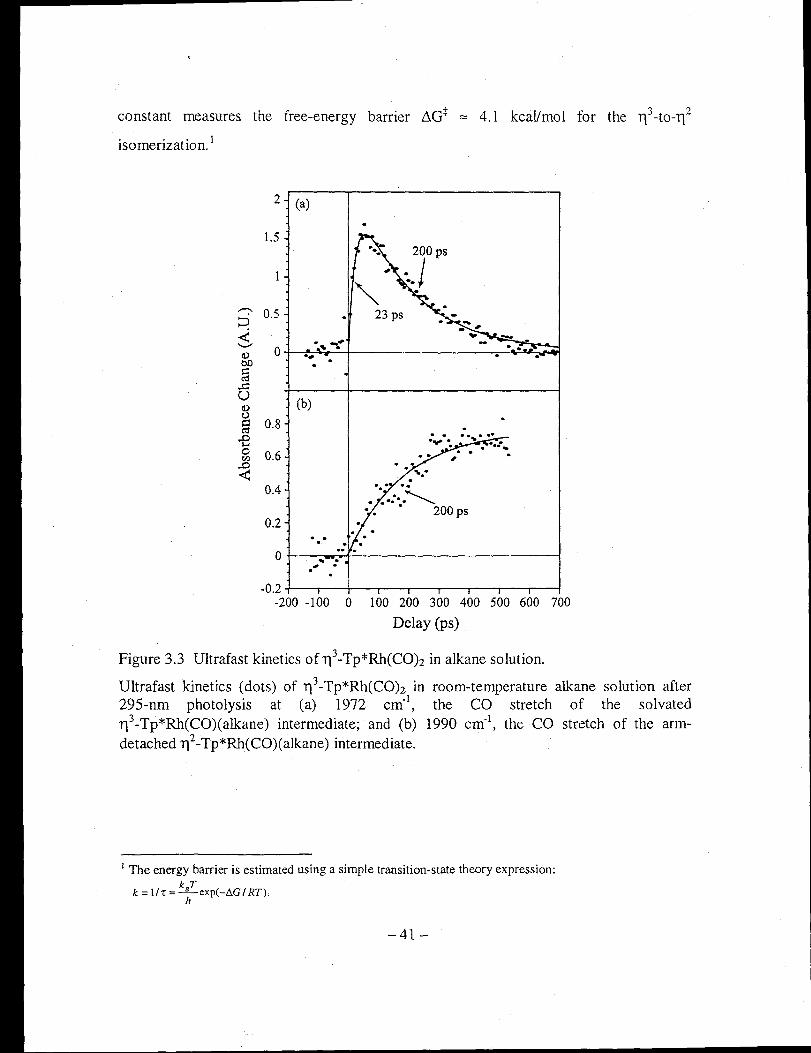
constant measures the free-energy barrier ~G* :::: 4.1 kcallmol for the 113-to-112
isomerization. I
2 (a)
1.5
" 3' 0.5 23 ps
$ .... ' O+-~~~'~·+---------------~~~~~
d)
~ 0.8
-e ~ 0.6
~ 0.4
0.2
(b)
...
. ... . :, .. -.. -.......... •• • 200 ps
O~--,~.~----------------------~ ." .
-0.2 ~--.~-l---.---r----.---"'---.----r--~ -200 -100 0 100 200 300 400 500 600 700
Delay (ps)
Figure 3.3 Ultrafast kinetics of 113 -Tp*Rh(COh in alkane solution.
Ultrafast kinetics (dots) of 113 -Tp*Rh(CO)2 in room-temperature alkane solution after 295-nm photolysis at (a) 1972 cm-!, the CO stretch of the solvated 113-Tp*Rh(CO)(alkane) intermediate; and (b) 1990 cm-I, the CO stretch of the armdetached 112-Tp*Rh(CO)(alkane) intermediate.
1 The energy barrier is estimated using a simple transition-state theory expression: kT
k = liT = _B-exp(-tiGI RT). h
-41-
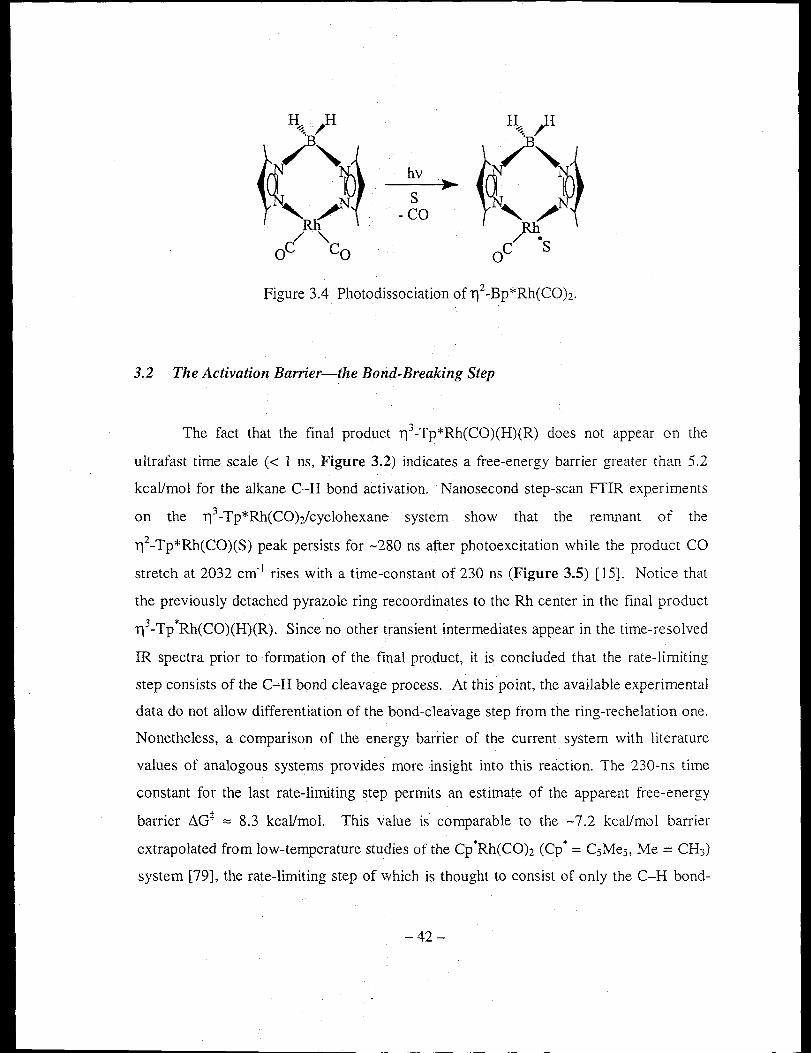
hv
s -co
Figure 3.4 Photodissociation of 112 -Bp*Rh(COh.
3.2 The Activation Barrier-the Bond-Breaking Step
The fact that the final product 113-Tp*Rh(CO)(H)(R) does not appear on the
ultrafast time scale « 1 ns, Figure 3.2) indicates a free-energy barrier greater than 5.2
kcallmol for the alkane C-H bond activation. Nanosecond step-scan FTIR experiments
on the 113-Tp*Rh(COh/cyclohexane system show that the remnant of the
112-Tp*Rh(CO)(S) peak persists for -280 ns after photoexcitation while the product CO
stretch at 2032 cm-! rises with a time-constant of 230 ns (Figure 3.5) [15]. Notice that
the previously detached pyrazole ring recoordinates to the Rh center in the final product
113 -Tp *Rh(CO)(H)(R). Since no other transient intermediates appear in the time-resolved
IR spectra prior to formation of the final product, it is concluded that the rate-limiting
step consists of the C-H bond cleavage process. At this point, the available experimental
data do not allow differentiation of the bond-cleavage step from the ring-rechelation one.
Nonetheless, a comparison of the energy barrier of the current system with literature
values of analogous systems provides more insight into this reaction. The 230-ns time
constant for the last rate-limiting step permits an estimate of the apparent free-energy
barrier ~G+ ::::: 8.3 kcallmol. This value is comparable to the -7.2 keal/mo 1 barrier
extrapolated from low-temperature studies of the Cp *Rh(COh (Cp * = C5Me5, Me = CH3)
system [79], the rate-limiting step of which is thought to consist of only the C-H bond-
-42-
- -----
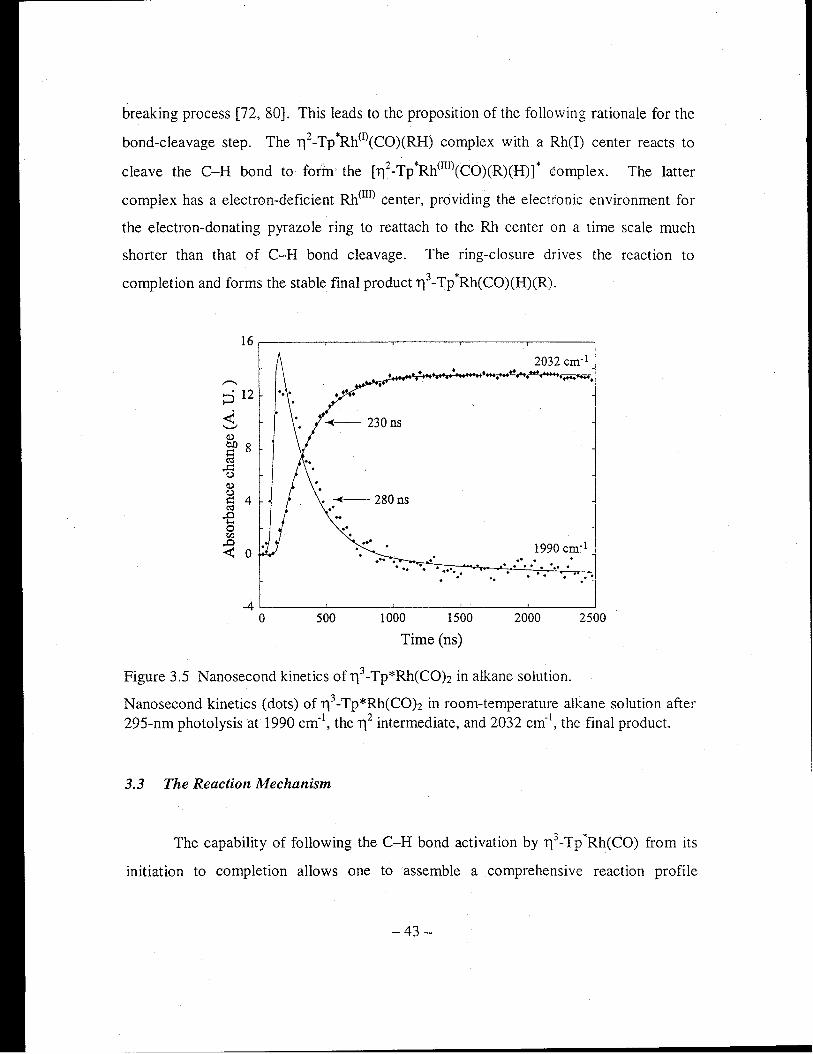
breaking process [72, 80), This leads to the proposition of the following rationale for the
bond-cleavage step, The 112-Tp *Rh(l)(CO)(RH) complex with a Rh(I) center reacts to
cleave the C-H bond to form the [112-Tp*Rh(III)(CO)(R)(H)( complex, The latter
complex has a electron-deficient Rh(III) center, providing the electronic environment for
the electron-donating pyrazole ring to reattach to the Rh center on a time scale much
shorter than that of C-H bond cleavage, The ring-closure drives the reaction to
completion and forms the stable final product 113-Tp*Rh(CO)(H)(R).
I : f ~ 2032 em'! . . ...... • • Itt ...... ' ..... t .. 4 ... u ••••• • ~ ............. • •
." . . ...... . '.
J
1990 em~! ." " ........ ....... . '. . .
4~-----J------~------~------~------~ o 500 1000 1500 2000 2500
Time (ns)
Figure 3.5 Nanosecond kinetics of 113-Tp*Rh(COh in alkane solution.
Nanosecond kinetics (dots) of 113-Tp*Rh(COh in room-temperature alkane solution after 295-nm photolysis at 1990 em'!, the T}2 intermediate, and 2032 cm'l, the final product.
3.3 The Reaction Mechanism
The capability of following the C-H bond activation by 113-Tp -Rh(CO) from its
initiation to completion allows one to assemble a comprehensive reaction profile
-43 -
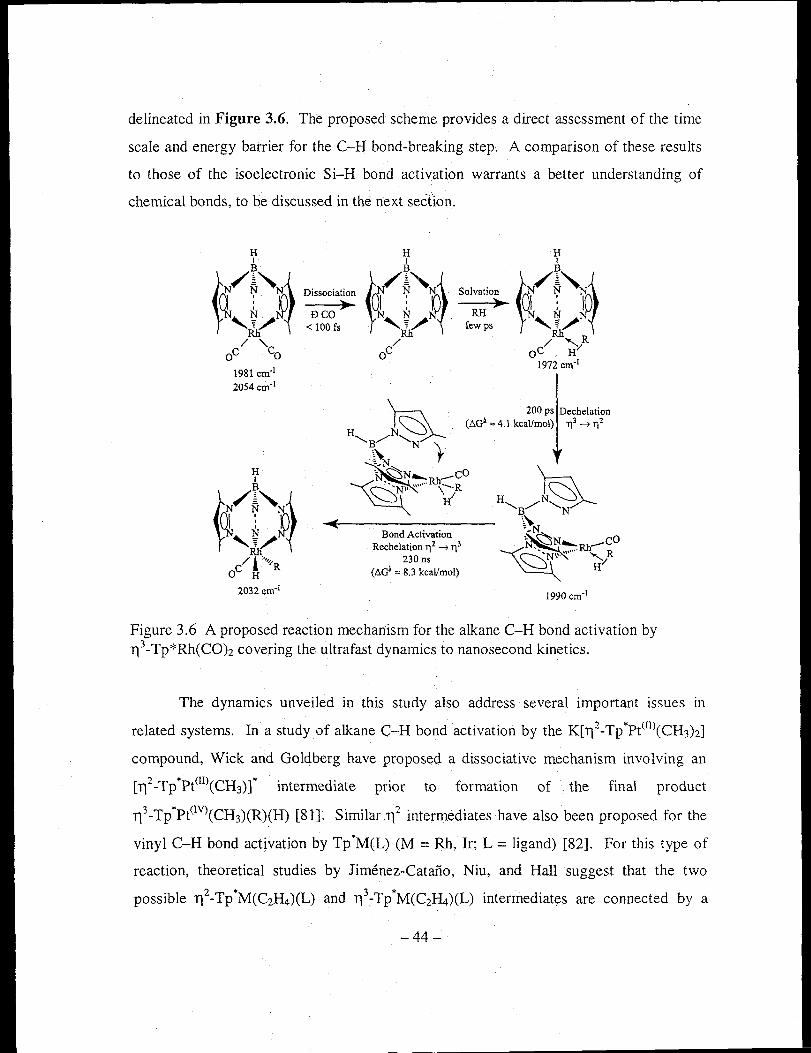
delineated in Figure 3.6. The proposed scheme provides a direct assessment of the time
scale and energy barrier for the C-H bond-breaking step. A comparison of these results
to those of the isoelectronic Si-H bond activation warrants a better understanding of
chemical bonds, to be discussed in the next section.
H I B
Ktp~ / "'-
oC Co
1981 em- l
2054 cm- l
Dissociation .. DCO
< 100 fs
\-~ 200 ps Dechelation I ~, (LlGa = 4.1 kcalfmol) 113 -"""7 ,,2 H N "--.J '\~ 'N ) ~N ___ CO
~, ... ~,;?
Bond Activation RechelatioD. ,,2 -"""7,,3
230 ns (LlGa = 8.3 keaVmol)
1990 crn- l
Figure 3.6 A proposed reaction mechanism for the alkane C-H bond activation by 113-Tp*Rh(COh covering the ultrafast dynamics to nanosecond kinetics.
The dynamics unveiled in this study also address several important issues in
related systems. In a study of alkane C-H bond activation by the K[112-Tp*Pt(II)(CH3)2J
compound, Wick and Goldberg have proposed a dissociative mechanism involving an
[112-Tp*Pt(II\CH3)]* intermediate pnor to formation of the final product
113-Tp*Pt(IV\CH3)(R)(H) [81]. Similar 11z intermediates have also been proposed for the
vinyl C-H bond activation by Tp "M(L) (M == Rh, Ir; L = ligand) [82]. For this type of
reaction, theoretical studies by JimeneZ-Catano, Niu, and Hall suggest that the two
possible 112-Tp*M(C2~)(L) and 113-Tp*M(CzH4)(L) intermediates are connected by a
-44-

small energy barrier. Both intermediates are found to transverse through similar
transition states that involve rechelation of a pyrazolyl ligand before reaching the final
product 11 3- Tp *M(H)(HCCH2)(L) [83]. In all the above examples, the 11 3 -to-112
isomerization plays a significant role in the reactivity of the transition-metal complex. In
this regard, the reaction scheme in Figure 3.6 not only provides a measure of the relevant
time scales but also an understanding of the roles the reactive intermediates assume in the
course of a reaction.
-45 -
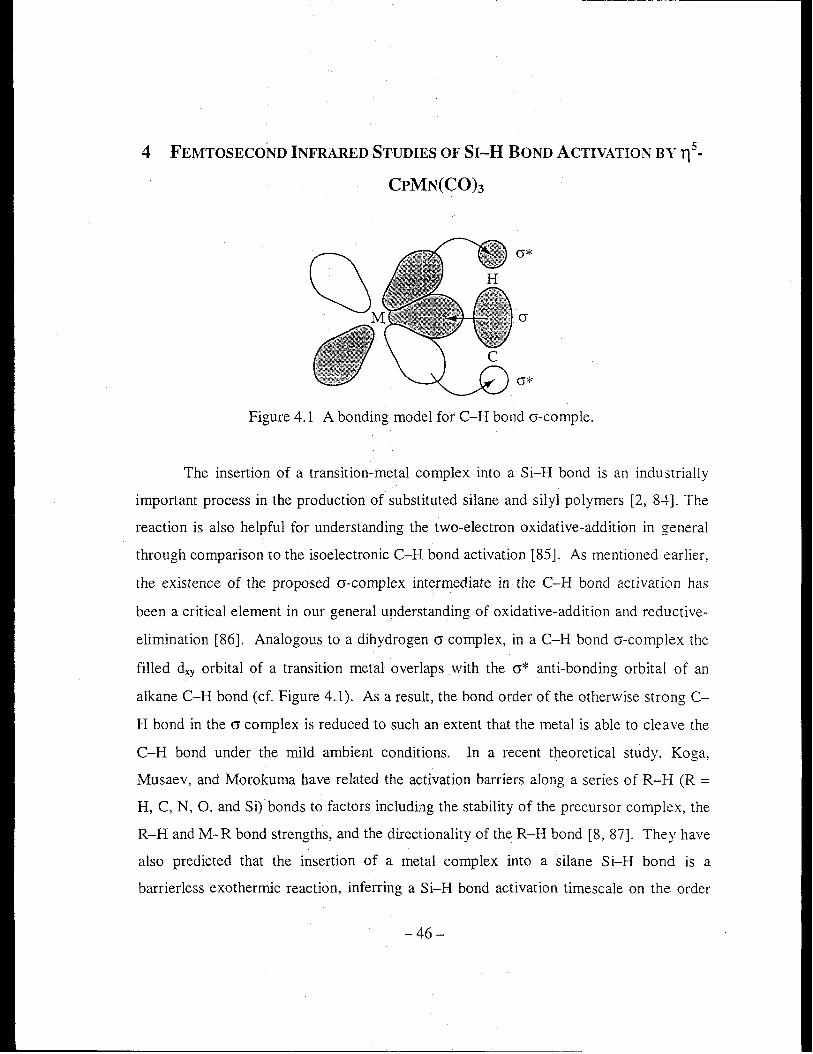
4 FEMTOSECOND INFRARED STUDIES OF SI-H BOND ACTIVATION BY 115 -
CpMN(COh
Figure 4.1 A bonding model for C-H bond cr-comple.
The insertion of a transition-metal complex into a Si-H bond is an industrially
important process in the production of substituted silane and silyl polymers [2, 8-+]. The
reaction is also helpful for understanding the two-electron oxidative-addition in general
through comparison to the isoelectronic C-H bond activation [85]. As mentioned earlier,
the existence of the proposed cr-complex intermediate in the C-H bond activation has
been a critical element in our general understanding of oxidative-addition and reductive
elimination [86]. Analogous to a dihydrogen 0' complex, in a C-H bond cr-complex the
filled dxy orbital of a transition metal overlaps with the 0'* anti-bonding orbital of an
alkane C-H bond (cf. Figure 4.1). As a result, the bond order of the otherwise strong C
H bond in the 0' complex is reduced to such an extent that the metal is able to cleave the
C-H bond under the mild ambient conditions. In a recent theoretical study, Koga,
Musaev, and Morokuma have related the activation barriers along a series of R-H (R = H, C, N, 0, and Si) bonds to factors including the stability of the precursor complex, the
R-H and M-R bond strengths, and the directionality of the R-H bond [8, 87]. They have
also predicted that the insertion of a metal complex into a silane Si-H bond is a
barrierless exothermic reaction, inferring a Si-H bond activation timescale on the order
-46-
...... _-------------------------'-------------------------

of solvent coordination time (- few ps). The theoretical prediction of the Si-H bond
activation barrier contrasts those measured at low-temperatures, which suggest an
enthalpy-barrier of 7.9 kcal/mol.[88-91] In order to determine the timescale of Si-H
bond cleavage-thereby the magnitude of the energy barrier-and to understand the
nature of the apparent rate-limiting step, a knowledge of the mechanism composed of
elementary reaction steps is necessary.
In the initial studies of Si-H bond activation, an unexpected reaction intermediate
was observed. Two possible assignments were proposed for the assignment of the
unknown intermediate: a ring-slipped 113 -CpMn(CO)2, or an T)5 -CpMn(CO)z species in a
different electronic state. In the Communication that reported these findings, a tentative
reaction was proposed assuming a ring-slipped species for the unknown intermediate. To
gain further insight into this type of reaction, more experimental and theoretical
investigations of the system were conducted. The results from the later studies provided
strong evidence supporting a triplet-state assignment for the dicarbonyl species. The rest
of this chapter and the next chapter are reproduced from the initial Communication and
the full article, respectively, which report our studies of Si-H bond activation.
4.1 Background
Cleavage, or activation, of the silicon-hydrogen bond of a silane by a metal center
has been the focus of many recent studies.[8, 89, 91-94] Knowledge of this type of
reaction is relevant to the central ideas of chemical bonding in general and is essential to
the development of catalytic reactions such as hydrosilation. It is commonly accepted
that the photochemical reaction for the oxidative addition of Et3SiH (Et = CzHs) to
CpMn(COh (Cp = CsHs) begins with the loss of a CO ligand as the result of UV
irradiation, producing a coordinatively unsaturated dicarbonyl species [85, 88] which
further reacts to activate the Si-H bond to form CpMn(CO)2(H)(SiEt3). Due to the fast
-47-
reaction rates, however, the detailed reaction mechanism including the initial solvation of
the nascent photogenerated chemical species has remained unclear. With the ad\·ent of
ultrafast spectroscopy, especially in the infrared, it is now possible to identify such events
that occur on a time scale shorter than diffusion to reveal the underlying elementary
reaction steps [16]. In this communication, we report the first ultrafast infrared study on
silicon-hydrogen bond cleavage by CpMn(CO)3.
4.2 Results and Discussions
As a result of photo-dissociating one CO ligand, the kinetics of the parent
molecule recorded at 2028 cm-1 (A, Figure 4.2) shows an instrument limited bleach that
recovers in 32 ± 7.4 ps (Figure 4.3).1 This rapid recovery of the parent bleach is due to
vibrational relaxation in the ground electronic manifold [16, 95, 96]. The 3190 recovery
is in good agreement with reported CO loss quantum yields of 0.65 measured at 313-nm
excitation [97]. Subsequent spectral evolution suggests that photolysis of the parent
molecules leads to two transient species including '115 -CpMn(COh and a pre\·iously
unreported intermediate. These reactive intermediates are solvated within few
picoseconds [98]. The initial solvation of the nascent species through either the ethyl
moiety or the Si-H bond of the solvent partitions the reaction into two channels of
disparate time scales. One channel involves a dissociative rearrangement to form the
final adduct (pathway II, Figure 4.4), while the other channel includes a direct addition of
the Si-H bond to the new intermediate, possibly a ring-slipped '113 dicarbonyl (pathway I,
Figure 4.4).
1 Uncertainties represent one standard deviation.
-48 -
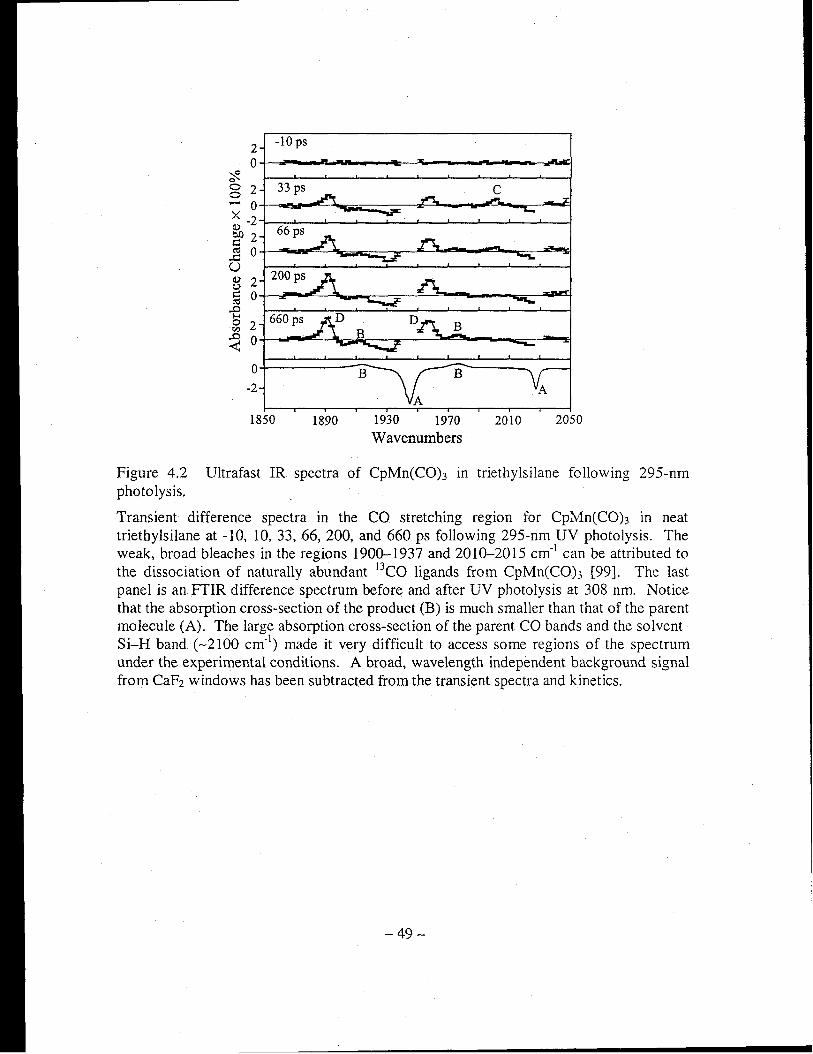
2 -10 ps
0 ';f( 0 2 33 ps 0 - 0 X -2 Q) 66ps 01)2 ~ ~ 0 U
200ps Q) 2 (,)
~ 0
-e 660ps 0 2 B <Il
~ 0
0 B -2
1850 1890 1930 1970 2010 2050
Wavenumbers
Figure 4.2 Ultrafast IR spectra of CpMn(CO)3 in triethylsilane following 295-nm photolysis.
Transient difference spectra in the CO stretching region for CpMn(CO)3 in neat triethylsilane at -10, 10, 33, 66, 200, and 660 ps following 295-nm UV photolysis. The weak, broad bleaches in the regions 1900-1937 and 2010-2015 cm- I can be attributed to the dissociation of naturally abundant I3CO ligands from CpMn(CO)3 [99]. The last panel is an FTIR difference spectrum before and after UV photolysis at 308 nm. Notice that the absorption cross-section of the product (B) is much smaller than that of the parent molecule (A). The large absorption cross-section of the parent CO bands and the solvent Si-H band (-2100 cm-I
) made it very difficult to access some regions of the spectrum under the experimental conditions. A broad, wavelength independent background signal from CaF2 windows has been subtracted from the transient spectra and kinetics.
-49-
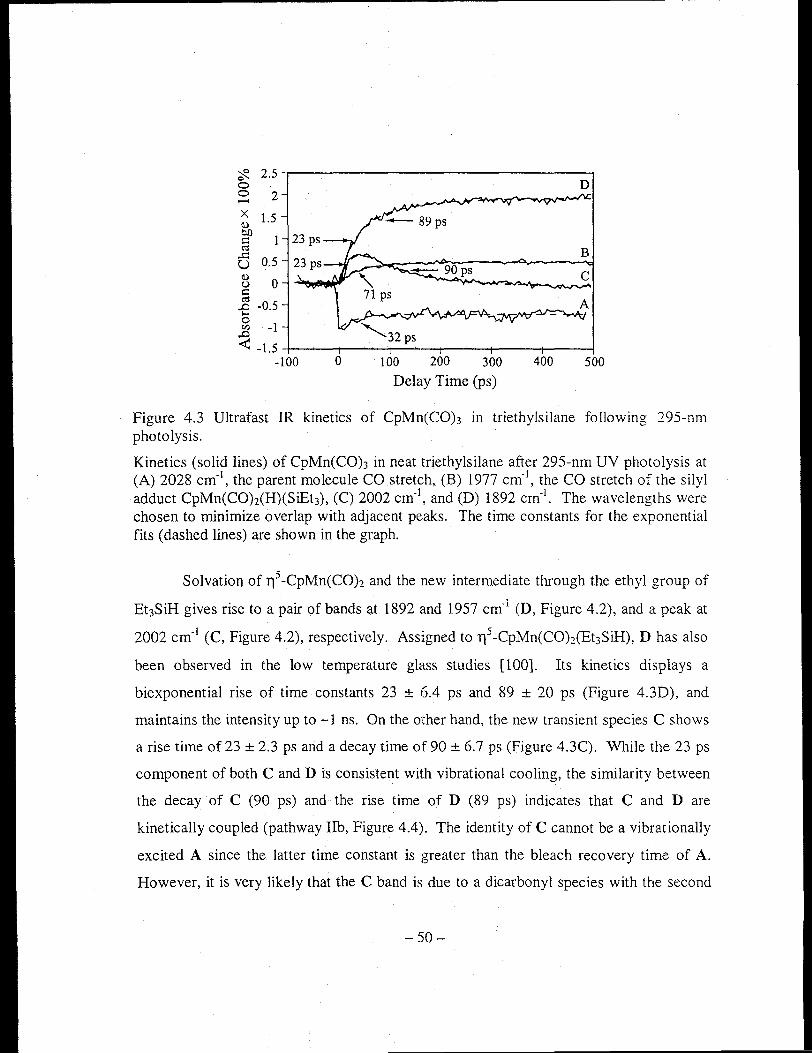
~ 2.5 -r------------------, o D o - 2
X 1.5 ~ bl) ::: ce ..c:
U 0.5 ~ u ::: o E -0.5 H
£ -1 .0
B
c
< -1.5 -+-------t--~-t__---__+--'--_+-~_;_------! -100 o 100 200 300 400 500
Delay Time (ps)
Figure 4.3 Ultrafast IR kinetics of CpMn(CO)3 in triethylsilane following 295-nm photolysis.
Kinetics (solid lines) of CpMn(COh in neat triethylsilane after 295-nm UV photolysis at (A) 2028 cm- I
, the parent molecule CO stretch, (B) 1977 cm- I, the CO stretch of the silyl
adduct CpMn(COh(H)(SiEt3), (C) 2002 cm- I, and (D) 1892 cm- I
. The wavelengths were chosen to minimize overlap with adjacent peaks. The time constants for the exponential fits (dashed lines) are shown in the graph.
Solvation of 115 -CpMn(COh and the new intermediate through the ethyl group of
Et3SiH gives rise to a pair of bands at 1892 and 1957 cm-1 (D, Figure 4.2), and a peak at
2002 cm- I (C, Figure 4.2), respectively. Assigned to 115 -CpMn(CO)2(Et3SiH), D has also
been observed in the low temperature glass studies [l00]. Its kinetics displays a
biexponential rise of time constants 23 ± 6.4 ps and 89 ± 20 ps (Figure 4.3D), and
maintains the intensity up to -1 ns. On the other hand, the new transient species C shows
a rise time of 23 ± 2.3 ps and a decay time of 90 ± 6.7 ps (Figure 4.3C). \-Vhile the 23 ps
component of both C and D is consistent with vibrational cooling, the similarity between
the decay of C (90 ps) and the rise time of D (89 ps) indicates that C and Dare
kinetically coupled (pathway lIb, Figure 4.4). The identity of C cannot be a vibrationally
excited A since the latter time constant is greater than the bleach recovery time of A.
However, it is very likely that the C band is due to a dicarbonyl species with the second
-50-

CO stretching band buried in the weak, broad bleach (1900-1937 cm-!).! Considering
its -45 cm-! blue shift from the higher energy band of D and the chemical reactiyity of
the electron donating Cp ligand, we tentatively assign C as an ethyl-solvated 11 3
dicarbonyl [75]. This assignment is consistent with the observed 30 cm-! blue-shifting of
the CO stretching frequency resulting from lowering of the hapticity of 11 3 -Tp "Rh(COh
(Tp* = tris-3,5-dimethylpyrazolylborato) to form 112-Tp*Rh(CO) [102]? With this
assignment, the -90 ps component can be related to re-chelation from an 113 to an 115
species (pathway IIb, Figure 4.4). Presently, we do not know the detailed structure of
this intermediate C. Nevertheless, in a separate experiment on CpMn(COh in neat n
pentane, a transient absorption at 2000 cm-! with similar kinetic behavior was observed,
which supports our assigning C as an ethyl solvate. With these data, however, we cannot
exclude possible involvement of other electronic states in explaining the intermediate C.
Metastable triplet states have been observed for Fe [103, 104] and Co [105, 106]
complexes, and experimental evidence as well as theoretical modeling [107] suggests that
transition metal complexes in electronic states of different multiplicity may assume
different geometry, which In tum may affect the vibrational frequencies. These
considerations will be addressed in the next chapter.
Eventually, on a time scale> 1 ns as indicated by the absence of D in the static
difference FfIR spectrum (bottom panel, Figure 4.2), D must further rearrange to form
the product. For this rearrangement, two mechanisms have been proposed which are the
"chain-walk" mechanism [108] and the "dissociative" mechanism [109]. The chain-walk
mechanism was first proposed to account for the observed -100 ps rearrangement from
an alkyl-solvated Cr(CO)s(ROH) to the more stable hydroxyl-solvated Cr(CO)5(HOR),
where ROH is I-propanol. If this is the case in our study, assuming that complexed
I The gas-phase stretch frequency of the monocarbonyl CpMn(CO) has been reported to be 1948 cm-!.[101] 2 Generally, the CO stretching frequency of a metal carbonyl complex reflects the charge density on the metal center: the less charge the metal center has to back-donate to CO 1t* orbitals, the higher the CO stretching frequency will be. Therefore, the 45 cm-I blue-shift implies an electron deficient metal center for C.
- 51-

Et3SiH migrates from the terminal carbon of one ethyl group to the silicon atom, one
would expect the rearrangement to be complete within 100 ps. However, the observed
decay time of D is longer than 100 ps, suggesting that a "dissociative" mechanism is
dominant. In such a pathway, CpMn(COh(Et3SiH) thermally dissociates slowly into a
loosely bound CpMn(COh ... (Et3SiH) complex, allowing the metal center to interact with
the Si-H bond of possibly another solvent molecule. The minimum activation energy for
such a dissociative process is then expected to be dictated by the complexation enthalpy
of a CpMn(CO)2 and an alkyl group which is estimated to be -8 kcallmol [110]. At room
temperature, this barrier height corresponds to a reaction time scale of -120 ns, assuming
simple transition-state theory. The observed rearrangement time (> 1 ns) in this study
therefore supports the "dissociative" mechanism (pathway II, Figure 4.4).
Potentially, the bare 113 species may also be solvated through the Si-H bond of the
solvent and lead to the product 115 -CpMn(COh(H)(SiEt3) on a time scale similar to the
decay of C, when the complex changes its hapticity from 113 to 115 thus providing
sufficient electron density for the activation process. Indeed, the product band (B, Figure
4.2) exhibits a rise time of 71 ± 5.4 ps (Figure 4.3B),1 indicating that the Si-H bond may
be activated by direct solvation through the Si-H bond of the solvent (pathway I, Figure
4.4). Furthermore, if the activation barrier of a Si-H bond is comparably small, the
apparent rate determining step would be the dissociative rearrangement from D to B. Our
measured rates for the formation of B are also consistent with the observation that the
overall enthalpy of activation is dominated by the enthalpy of dissociating the solvent
from the reaction site, and that the transition state consists of a very loosely bound R3SiH
[90, 100].
1 For the product band, one may expect a biexponential rise similar to D if the TJs dicarbonyl is also solvated through the Si-H bond of the solvent. However, we did not observe such a behavior. The reason is perhaps due to statistical favor for the ethyl groups over the Si-H a-bond in a triethylsilane. Furthennore, one would expect more steric hindrance for the TJs dicarbonyl to be solvated via the solvent's Si-H bond.
- 52-
----------------------------

Figure 4.4 A proposed reaction mechanism for the photochemical Si-H bond activation of Et3SiH by CpMn(CO)3. Suggestive chemical structures are in brackets.
In the light of the above discussion, the overall reaction mechanism is
summarized in Figure 4.4. Upon UV excitation, A may lose one CO ligand to form
115 -CpMn(CO)z, or lose one CO ligand and at the same time undergo a change in its
hapticity to an 113 species; both dicarbonyls are solvated within few picoseconds.
Solvation of the nascent 113 species via the Si-H bond of the solvent leads to the activated
product on a time scale of 71 ps (pathway I). Solvation of the 113 and 115 dicarbonyls
through the ethyl groups of the solvent results in C and D, respectively, where C evolves
to form D on a time scale of 90 ps (pathway II). Finally, D rearranges dissociatively to
form the product on a time scale greater than one nanosecond.
4.3 Conclusion
This work represents the first study of Si-H bond activation at room temperature
using ultrafast infrared spectroscopic methods, which are proving to be general and
powerful means for studying complex chemical reaction dynamics in condensed phases.
Our results suggest that the formation of 115 -CpMn(CO)2(H)(SiEt3) is partitioned by the
initial solvation into two possible pathways: (1) formation through a new intermediate,
possibly a photogenerated ring-slipped species, which decays to form the product on a
-53 -

time scale of about 71 ps; and (2) formation through an ethyl-solvated dicarbonyl species
CpMn(COh(Et3SiH), which eventually dissociatively rearranges to form the product on a
time scale greater than 1 ns. This observation is consistent with the low reaction barrier
for Si-H bond activation, in sharp contrast to -10 kcalfmo1 barrier in acti\-ating an
isoelectronic C-H bond [15].
-54-

5 THE REACTION MECHANISM OF SI-H BOND ACTIVATION STUDIED USING
FEMTOSECOND TO NANOSECOND IR SPECTROSCOPY AND AB ~ITIO
METHODS
5.1 Introduction
The photochemical oxidative addition of a Si-H bond to certain transition-metal
complexes has been the focus of many research efforts since its initial discovery [Ill].
This type of reaction which cleaves, or activates a Si-H bond is critical in hydrosilation
[85, 112]. In addition, it provides a direct comparison to another important bond
cleavage reaction, C-H bond activation by similar transition metal complexes [15, 65,
67]. As such, knowledge of the reaction mechanism may facilitate the development of
homogeneous catalysis [2, 84] and lead ultimately to a general understanding of the
chemistry of bond-cleavage reactions.
Many of the previous studies have used group VllB, d6 compounds 115 -CpM(CO)3
(M = Mn, Re, Cp = C5HS) as model reagents. They provide an interesting contrast of
reactivity in that the extent of the Si-H bond cleavage varies with the type of metal; the
rhenium complex breaks the Si-H bond completely whereas there remains residual
Si. .. H interaction in the manganese case. 1 Mechanistically, Young and Wrighton have
established that at low temperatures the primary photochemical product upon UV
irradiation of CpMn(CO)3 is the coordinatively unsaturated, 16-e' CpMn(CO)2 (Figure
S.la) [88]. Further studies have shown that the resulting dicarbonyl is complexed by the
solvent to form CpMn(COh(solvent), and that the apparent rate-determining step
1 For example, the distance between the silicon and the hydrogen at~m in the adduct CpRe(CO):(H)(SiPh3)
is 2.19 A (Ph = phenyl, C6Hs)[113] compared to 1.80 A for the similar Mn compound, MeCpMn(CO)z(H)(SiPh2F) (MeCp = CH3CsIL).[114, 115J
-55 -
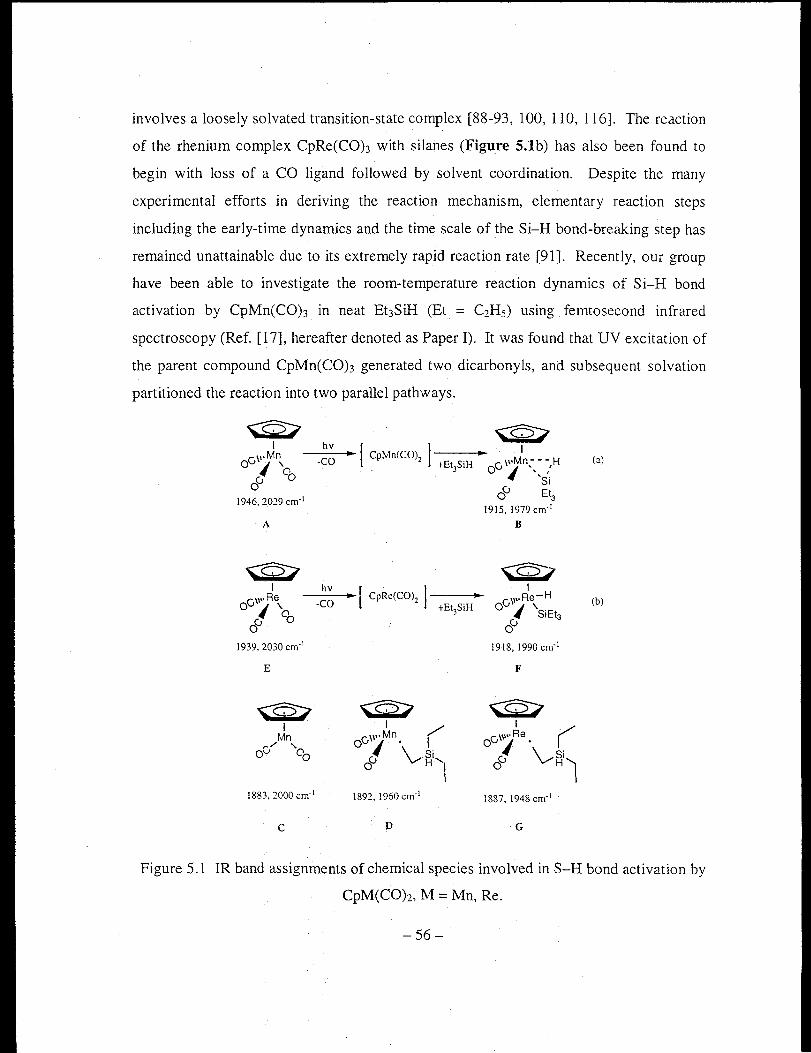
involves a loosely solvated transition-state complex [88-93, 100, 110, 116]. The reaction
of the rhenium complex CpRe(CO)3 with silanes (Figure 5.1b) has also been found to
begin with loss of a CO ligand followed by solvent coordination, Despite the many
experimental efforts in deriving the reaction mechanism, elementary reaction steps
including the early-time dynamics and the time scale of the Si-H bond-breaking step has
remained unattainable due to its extremely rapid reaction rate [91]. Recently, our group
have been able to investigate the room-temperature reaction dynamics of Si-H bond
activation by CpMn(COh in neat Et3SiH (Et = C2Hs) using femtosecond infrared
spectroscopy (Ref. [17], hereafter denoted as Paper I). It was found that UV excitation of
the parent compound CpMn(COh generated two dicarbonyls, and subsequent solvation
partitioned the reaction into two parallel pathways.
q5/ I
c,\\.Mn o , '0
o 0 o
1946.2029 em,l
A
E
~ I
Mn c,/
a , °0
1883. 2000 em,l
C
«?? hv .. [CPMn(CO) I .. I
,CO . 2 +Et}SiH oc, \,"Mn,-,~ ~,H
q5/ I
c,\".Mn ( 0, . 0° ~~i'l
1892.1960cm,1
D
Si 0° Et3
1915. 1979 em,l
B
F
~ I
oc,\\,,·Re. (
I \--S;I o H
1887.1948 em,l
G
(a)
(b)
Figure 5,1 IR band assignments of chemical species involved in S-H bond activation by
CpM(COh, M = Mn, Re,
- 56-
In this article, we report the use of a combination of theoretical modeling and
experimental measurements to continue pursuing this important reaction (Figure 5.1).
The elementary reaction steps from initial photolysis to completion of the reaction were
studied to derive a comprehensive reaction mechanism. Due to the complexity of the
reaction and for clarity, we summarize below some important findings of this work (cf.
Figure 5.13 and Figure 5.14) and leave the technicalities for later sections. The final
results can be summarized as follows: (1) The early-time reaction dynamics depend
critically on the electronic structure of the organometallic complex. For the manganese
complex, there are two overlapping electronic bands in accessible UV region (cf. Figure
5.11). The higher-energy band is related to formation of an unsolvated singlet dicarbonyl
D* (an asterisk indicates excited state) and the lower one to triplet dicarbonyl C. A
typical UV excitation of the parent molecule will populate both states, resulting in C or
D* through paraUel reaction channels. The branching ratios A~C~D:A~D* ~D for
these two parallel channels measured at 295-nm and 325-nm excitations are
approximately 50%:50% and 75%:25%, respectively. For the rhenium complex. there
appears only one electronic band in the UV region; photolysis of the rhenium parent
molecule leads exclusively to a singlet rhenium dicarbonyl G*. (2) For both metal
complexes, initial solvation of the nascent coordinatively unsaturated dicarbonyls (C, D*,
and G*) either via the ethyl moiety or the Si-H bond of the solvent molecule Et3SiH
partitions the reaction into two pathways. Solvation of the metal dicarbonyl through the
Si-H bond leads directly to the final products B or F on the ultrafast time scale.
Solvation through an ethyl group results in reactive intermediates D or G, which reacts
further to form the final products in 177 ns and 6.8 ~s, respectively. (3) The relative
probabilities of (solvation through the ethyl moiety):(solvation through the Si-H bond)
for the Mn and Re complexes are 5.3 and 3, respectively. The differences are attributed
to steric effects. The larger diameter of the rhenium atom allows equivalent sampling of
the chemically different sites in a solvent molecule (3 ethyl groups and 1 Si-H bond). (4)
The apparent rate-determining step for both reactions is the dissociative rearrangement
- 57-

from the ethyl solvates D or G to the final products. The corresponding free-energy
barriers for the manganese and rhenium complexes, determined from simple transition
state theory, are 8.25 ± 0.03 kcallmol and 10.41 ± 0.02 kcallmol, respectively. (5) The
time scale for a Si-H bond-breaking process is for the first time estimated to be 4.4 ± 2.6
ps, indicative of a low barrier, if any, reaction.
The paper is organized as follows: The results and detailed data analysis are
presented in 5.2, in the order of manganese/experimental, rhenium/experimental. and
theoretical results. Implications of the results are discussed in 5.3. In particular, for the
manganese complex, we discuss the effects of sampling different regions of electronically
excited potential energy surface, the nature of the observed transient intermediates. and
their interaction with solvent. Comprehensive reaction mechanisms are described in the
end of Section 5.3.1 for Mn and in 5.3.2 for Re. Finally, current results are compared to
the C-H bond activation in 5.4.
5.2 Results
The infrared spectra in the CO stretching region are presented in a form of
difference absorbance in which positive bands indicate the appearance of new species
while negative bands (bleaches) represent the depletion of parent molecules. In the
ultrafast spectra of each metal complex, the bottom panel is an FTIR difference spectrum
of the sample taken a few minutes after prolonged exposure to 308-nm UV pulses from
an excimer laser.
5.2.1 Activation of the Silicon-Hydrogen Bond of Et3SiH by CpMn(COh
-58 -

2 -10 ps
0
2 10 ps
C C D D 0
0 33 ps 0 2 ...... X
0 Q) (.)
~ 66ps ~ 2 -e 0 0 en
~ <l 2
0
2
O~~~~~~~--~~~~--~~~~~~
o -+--------0--
-2 A
4~--~--.---~--r--,r--.--_.--_o--_r--~ 1860 1900 1980 2020 2060
Wavenumber (em-1 )
Figure 5.2 Ultrafast IR spectra of CpMn(COh in triethylsilane following 325-nm excitation.
Transient difference spectra in the CO stretching region for CpMn(CO)3 in neat triethylsilane at -10, 10,33,66,200, and 660 ps following 325-nm UV photolysis. Under the experimental conditions, the large cross-section of the solvent Si-H band (-2100 em-I) and the parent CO bands (1947 and 2028 em-I) make it difficult to access some regions of the spectrum. I The last panel is an FTIR difference spectrum before and after UV photolysis at 308 nm.
I The extinction coefficients e for v (CO) of CpMn(COh are 12700 M-I em-I for the 1947- and 2028-cm-1
peaks, respectively.[IOO] To prepare a sample which has an OD - 1 at the pump wavelength of 325 nm, the IR absorbance of the 1947- and 2028-cm-1 bands are calculated to be 9.2 and 3.3 OD, respectively (9 mM, 630-).lIU cell). A thinner cell was used to acquire kinetics for the parent molecule. Such an experimental difficulty is expected when the sample has a low absorption cross section in the UV but a high extinction coefficient in the probe IR region. A sample calculation to estimate the signal strength is included in footnote 1 on page 63.
- 59-

1.2
D ...-... 00 0
::)
$0.8 Q) b1)
§ 0.6 ...c: U
Q) 0.4 u ~ ro 0.2 .D .... 0 00 0 .D <
-0.2 -\---...,----,----r----,.----r----!
-100 o 100 200 300 400 500 Time Delay (ps)
Figure 5.3 Ultrafast IR kinetics of CpMn(CO)3 in triethylsilane following 325-nm excitation.
Ultrafast kinetics of CpMn(CO)3 in neat triethylsilane after 325-nm UV photolysis at (B) 1979 cm- I
, the CO stretch of the silyl adduct CpMn(COh(H)(SiEt3) (open triangles); (C) 2002 cm- I (filled circles); (D) 1892 cm- I (open circles). The wavelengths were chosen to minirrtize overlap with adjacent peaks. The time constants for the exponential fits (dashed lines) areshown in the graph.
Shown in Figure 5.2 are the fs-IR spectra of r{CpMn(COh in neat Et3SiH
following excitation at 325 nm. The peaks at 1892 and 1960 cm- I are assigned to
115 -CpMn(CO)2(Et3SiH), denoted D (Figure 5.1). Having also been observed in low
temperature studies [91, 100], D is attributed to solvation of 115 -CpMn(CO)2 through the
ethyl moiety of Et3SiH. In the 10 ps panel of Figure 5.2, the two bands at -2000 and
-1883 cm- I which disappear at longer time scales are attributed to a triplet dicarbonyl
species, denoted C (see 5.3.1 for assignment). Figure 5.3 shows the kinetic traces of D,
C, and the final product B following 325-nm excitation. The kinetics of C recorded at
2000 cm-l exhibit a rapid rise and an 105 ± 8.0 ps decay.l The product band at 1979 cm-l
displays a single exponential rise of 115 ± 14 ps.
1 Uncertainties represent one standard deviation_
-60-

The kinetic trace of D at 1892 cm"1 exhibits a fast rise, then gradually grows to a
constant leveL It can be described by the equation,
Equation 5.1
where 't is a formation time constant, and C1 and C2 are amplitude constants. This same
equation will be used later in modeling kinetic traces of similar behavior. The fitted
numeric values for 't, C1, and C2 are 107 ± 8.9 ps, 0.73 ± 0.033, and 0.25 ± 0.033,
respectively. Clearly, the decay of the intermediate C is correlated to the formation of
both the ethyl-solyate D and the final product B. Equation 5.1 implies two channels for
the formation of the ethyl solvate 115 -CpMn(COhCEt3SiH), the branching ratio of which is
represented by the relative magnitude of C1 to C2. With a typical solvation time of a few
ps in mind, the channel that contributes to the fast rise C2 of the transient of D is
attributed to solvation of a singlet 115 -CpMn(CO)2, denoted D*. The other channel that
contributes to the 107 ps rise is attributed to interconversion from C. Consequently, the
branching ratio of the reaction pathway A~C~D to the pathway A~D* ~D in this case
is approximately 3: 1. The implications of these results will be discussed in 5.3.
The long-time behavior of the reaction was studied using a nanosecond step-scan
FfIR spectrometer. Displayed in Figure 5.4 are the kinetics of D and that of the product
B, recorded at 1892 cm"l and 1979 cm"l, respectively. D shows an instrument-limited
rise and then decays with a time constant of 183 ± 8 ns. B exhibits a fast rise and an
exponential growth of 177 ± 7 ns. The rapid rise of B is from the remnant of the initial
Si-H solvate that forms in the ultrafast time scale. As has been discussed in Paper I, the
latter exponential rise of B is due to the dissociative rearrangement from D [17, 109].
The nanosecond kinetics of B can also be modeled with Equation 5.1. In this case the
coefficients C1 and C2 represent the relative probability of the initial solvation through
the ethyl moiety (84%) or the Si-H bond (16%), respectively. These numbers, however.
should be treated in a qualitative manner. The greater excitation photon flux in our
-61-
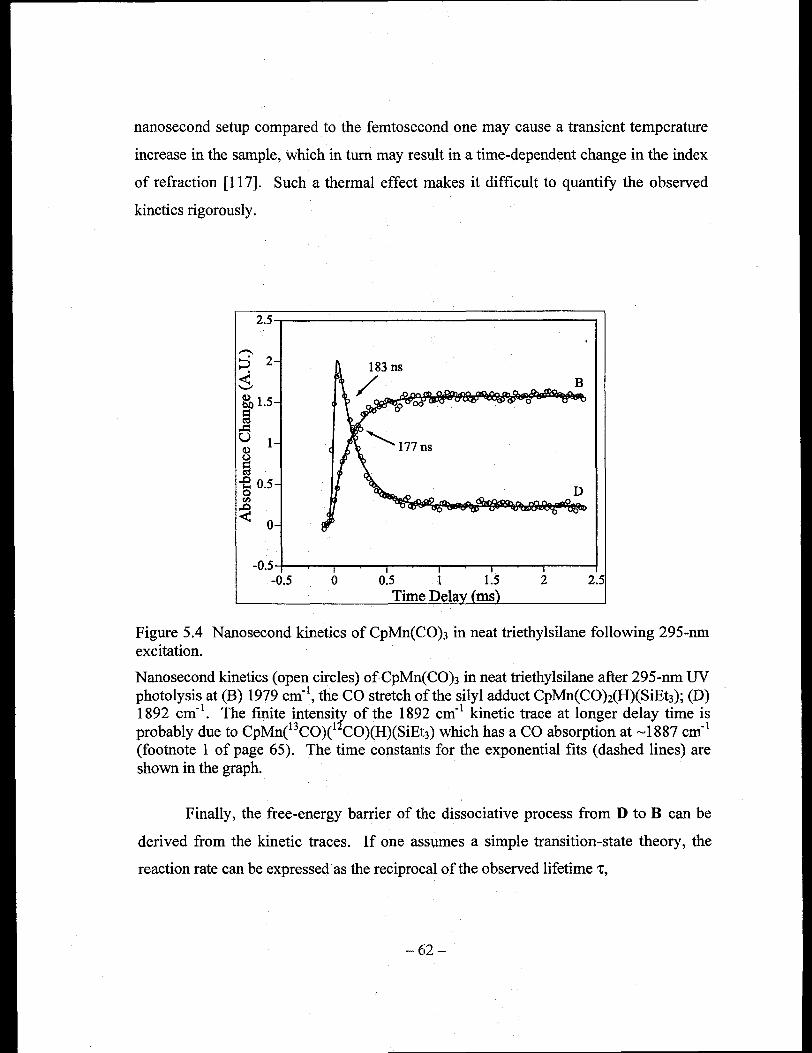
nanosecond setup compared to the femtosecond one may cause a transient temperature
increase in the sample, which in turn may result in a time-dependent change in the index
of refraction [117]. Such a thermal effect makes it difficult to quantify the observed
kinetics rigorously.
2.5-.---------------------,
-0.5-+----,.-~--r__-.-,__.-....--__r-..--_r_--.-_f
-0.5 o 0.5 1 1.5 2 2.5 Time Dela
Figure 5.4 Nanosecond kinetics of CpMn(CO)3 in neat triethylsilane following 295-nm excitation.
Nanosecond kinetics (open circles) ofCpMn(CO)3 in neat triethylsilane after 295-nm UV photolysis at (B) 1979 em-I, the CO stretch of the silyl adduct CpMn(COh(H)(SiEt3); (D) 1892 em-I. The finite intensity of the 1892 cm- l kinetic trace at longer delay time is probably due to CpMn(13CO)(12CO)(H)(SiEt3) which has a CO absorption at ~1887 cm- l
(footnote 1 of page 65). The time constants for the exponential fits (dashed lines) are shown in the graph.
Finally, the free-energy barrier of the dissociative process from D to B can be
derived from the kinetic traces. If one assumes a simple transition-state theory, the
reaction rate can be expressed as the reciprocal of the observed lifetime 't,
-62-
Equation 5.2 1 k T _6C'
Reaction rate:::::; - = _B - e RT
'r h
where kB is the Boltzmann constant, h Plank's constant, T room temperature (298.15 K),
and ~G+ the free energy of activation. The reaction barrier, estimated from the product
formation time, is ~G+ = 8.25 ± 0.03 kcaVmol. This is in excellent agreement with the
literature value, 8.56 ± 0.49 kcaVmol, which is extrapolated to room temperature using
the activation parameters obtained from low temperature measurements (100],
5.2.2 Activation of the Silicon-Hydrogen Bond of Et3SiH by CpRe(CO);
Displayed in Figure 5.5 are the transient fs-IR spectra of CpRe(COh in neat
Et3SiH following excitation at 295 nm. The bottom panel is an FrIR difference spectrum
taken after prolonged exposure to 308-nm light. The presence of naturally abundant
I3CO stretches is evidenced by the enlarged FrIR spectrum. I
I In the following, we'll use the Re system as an example to estimate the signal size of F in the ultrafast spectra. The same calculation is applicable to Mn spectra. We start by calculating the OD change in one of the parent bands, say the 2030 cm·1 band. The pump beam consists of 295-nm pulses of energy -6 Ill, 75c;7o of which are absorbed by an OD - 0.6 sample. Change in the parent absorbance is calculated by ~OD(E) = e x I x ~cparent' where I is the sample cell thickness, and ~cparent is the concentration change of parent species in the cylindric volume defined by the pump beam. Taking into account the cell thickness (650 11m), the beam size at the sample (-200 11m), quantum yield (-0.3), each pump pulse induces OD change in the parent bleach -0.06. The signal size of F on the ultrafast time scale can be expressed as
~OD(F) = ~OD(E) x X(F) x e(F) J e(E), where X(F) = 0.248±O.079 is the branching percentage for F measured from the nanosecond kinetics, and the extinction coefficient ratio e(F) / e(E) - 2/ 5 measured from the static difference FTIR spectrum on the bottom panel of Figure 5.5. ~ODCF) is thus calculated to be -0.006, which is consistent \\ith what we have measured in the present work. The above calculation also serves as a cross-examination for the measured 25% branching ratio in the initial solvation through the Si-H bond of Et3SiH.
The recorded Be bleach signal in the ultrafast spectra of the Re complex may appear somewhat larger than one would have expected from a simple estimate. In the following. we show that the Re spectra displayed reasonable l3e bleach at 2015 cm'l. Take the 200 ps panel of Figure 5.5 as an example. The numerical values for the 1990 em'] band of F and the Be bleach at 2015 cm') are about 0,0053 ± 0.0005 OD and -0,0036 ± 0.001 OD, respectively. Assuming 3% natural abundance of Be, and taking into account the difference in extinction coefficients e(F) / eCBC) - 2/5 and branching ratios 0.248 ± 0.079, one finds that the estimated signal size of the Be bleach is - -0.0017 ± 0.0005 OD, v.ithin a 95% confidence interval compared to recorded signal size (-0.0036 ± 0.001 OD). Similarly, the corresponding
- 63-
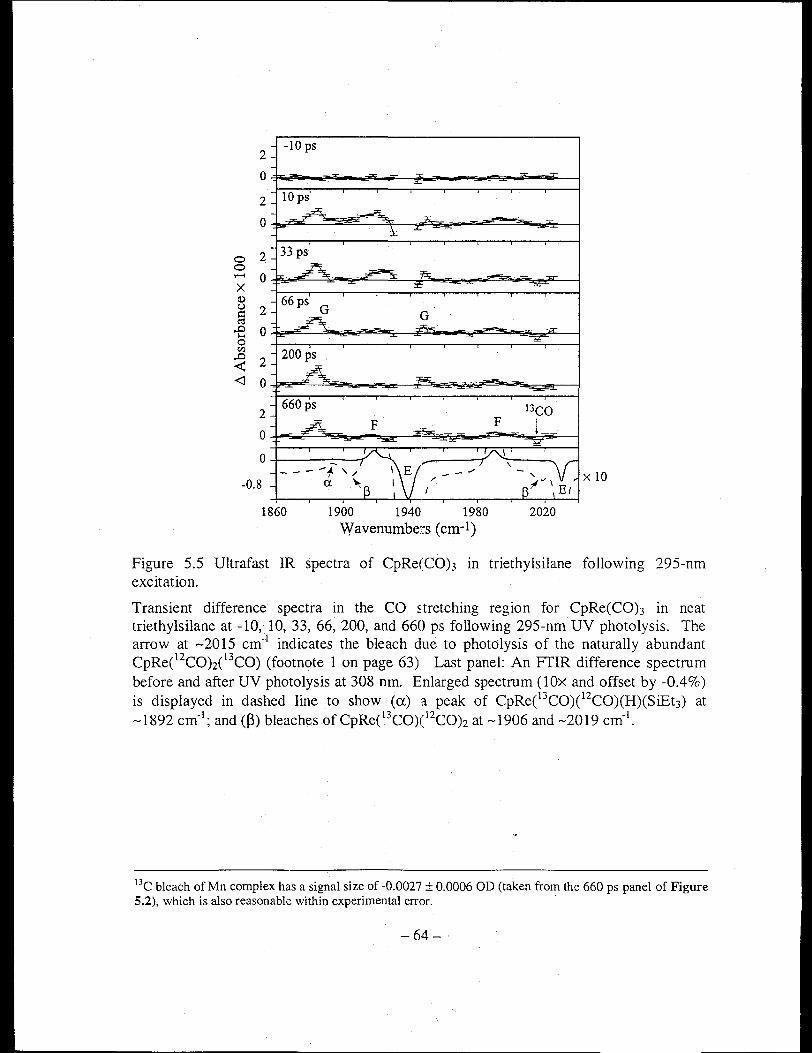
2 -10 ps
0
2 10 ps
0
0 2 33 ps 0 ...... 0 X Q) 66ps G u 2 ~ til G -e 0 0 r:I)
200 ps .n 2 < <1 0
2 660 ps
F 0
0
-0.8 " x 10 ;I" \ EI
1860 1900 1940 1980 2020 Wavenumbers (cm-1)
Figure 5.5 Ultrafast IR spectra of CpRe(COh in triethylsilane following 295-nm excitation.
Transient difference spectra in the CO s.tretching region for CpRe(COh in neat triethylsilane at -10, 10, 33, 66, 200, and 660 ps following 295-nm UV photolysis. The arrow at ..... 2015 cm-1 indicates the bleach due to photolysis of the naturally abundant CpRee2COh(13CO) (footnote 1 on page 63)" Last panel: An FTIR difference spectrum before and after UV photolysis at 308 nm. Enlarged spectrum (10x and offset by -0.4%) is displayed in dashed line to show (ex) a peak of CpRe(13CO)(12CO)(H)(SiEt3) at ..... 1892 cm-1; and (~) bleaches of CpRe( 13CO)( 12CO)2 at ..... 1906 and ..... 2019 cm-1.
I3C bleach of Mn complex has a signal size of -0.0027 ± 0.0006 OD (taken from the 660 ps panel of Figure 5.2), which is also reasonable within experimental error. .
-64-
The small peak at 1892 cm-! is assigned to 115-CpRe(13CO)(12CO)(H)(SiEt3), denoted a in
the enlarged spectrum. The shallow bleaches labeled as ~ are due to depletion of
naturally abundant 115 -CpRe(2CO)z( l3CO)_' At the lOps panel, the pair of bands at
1887 cm-! and 1948 cm-! are assigned to 115 -CpRe(CO)z(Et3SiH) (G), resulting from
solvation of the 115-CpRe(CO)2 (G*) through the ethyl moiety of the solvent [100]. The
final product F appears as two bands at 1918 cm-! and 1990 cm-!, but its early-time
spectra are complicated by absorptions from vibrationally excited parent molecules E
(the 10 and 33 ps panels).
As shown in Figure 5.6a, the kinetics of the parent molecule E taken at 2030 cm-!
display an instrument-limited depletion which recovers with a time constant of 39.3 ± 1.6
ps to 28% of its initial intensity, consistent with the literature quantum yields of 0.30 at
313-nm excitation [97]. The recovery of the parent bleach is attributed to re-establishing
the thermal distribution of vibrational states in the electronic-ground manifold (16, 95,
96, 98, 120], Processes that contribute to this non-equilibrated vibrational distribution
include depletion of the v = 0 state by the pump photon, and population replenished by
. non-dissociative processes. As a consequence of populating the higher vibrational states,
transitions such as v = 1 ~2 and v = 2~3 would become detectable. The broad band at
-1921 cm-! is assigned to the v = 1 ~2 absorption of the 1939 cm-! CO stretching band of
E, which evolves to the blue end of the spectrum and decays completely at later time (l 0
ps panel, Figure 5.5). The observed -18 cm-! anharmonicity is consistent with the
reported anharmonicity of other metal carbonyls [16, 95, 96, 120],
1 CO frequencies of CpRe(I3CO),(12CO)3_, in room-temperature alkane solutions were estimated from an effective force field calculation following the methods in Refs. [118, 119]. The calculated frequencies (in cm-I
) are CpRe(12CO)3 {l939, 2030}; CpRe(I3CO)(12CO)z {l906, 1939, 2019}; CpRe(13COh(12CO) {1895, 1919, 2005}; and CpRe(13CO)3 {1895, 1985}. Similarly, peaks originating from CpM(i3CO)(12CO)(H)(SiEt3) are estimated to be at 1892 and 1974 cm-! for the rhenium complex and at 1887 and 1964 cm-I for the manganese complex.
-65 -
---- -------------------------------------------------------------------.......... -====

(a) 2030 em"!
O.
----~ $
Q -0.
X Q -1.:>;---or-----,..---..,----.,--....,-----I u fa -e 1. o <Il
< O.
-O.:H----r-----r---.-------.----r----I -100 o 100 200 300 400 500
Time Dela
Figure 5.6 Ultrafast IR kinetics of CpRe(CO)3 in triethylsilane following 295-nm excitation.
Ultrafast kinetics (open circles) of CpRe(CO)3 in neat triethylsilane after 295-nm UV photolysis at (a) 2030 cm"l, the A-band of the CO stretches of the parent molecule. A 100-J.lm cell was used to record this kineti(~ trace; (b) 1887 cm"l. The time constants obtained from exponential fits (solid lines) to the kinetic traces are also shown in the graph.
Similarly, the broad bands at ~2004 cm"! and ~1990 cm"l in the 10 ps panel of Figure 5.5
can be assigned to the v = 1-7 2 and v = 2-73 absorption of naturally abundant
CpRe(13CO)(CO)2, respectively. The parent molecules containing one 13CO ligand
manifest themselves as a depletion at 2015 em"l as indicated by the arrow in the 660-ps
panel of Figure 5.5 (see footnote 1 of page 65 for estimation of CO stretching frequencies
of CpRe(13CO)x(12CO)3"x). Unfortunately, this
-66-
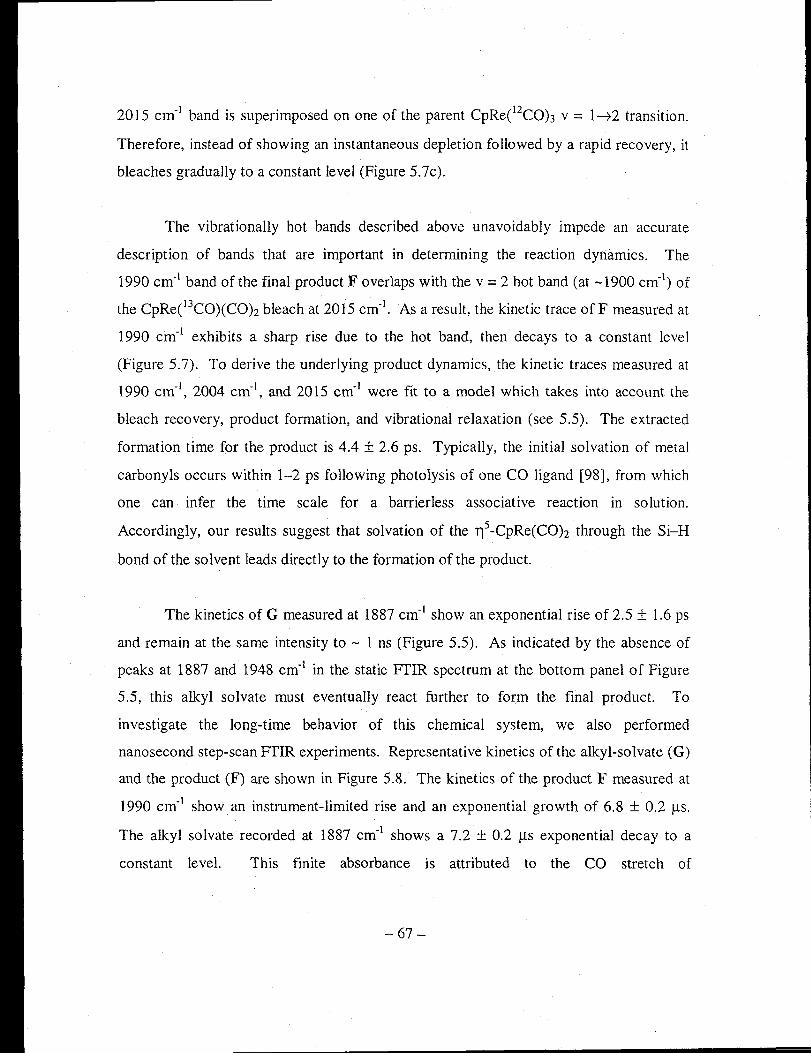
2015 cm- l band is superimposed on one of the parent CpRe(12COh v = 1~2 transition.
Therefore, instead of showing an instantaneous depletion followed by a rapid recovery, it
bleaches gradually to a constant level (Figure 5.7c).
The vibrationally hot bands described above unavoidably impede an accurate
description of bands that are important in determining the reaction dynamics. The
1990 cm-1 band of the final product F overlaps with the v = 2 hot band (at -1900 em-I) of
the CpRe( 13CO)(CO)z bleach at 2015 em-I. As a result, the kinetic trace of F measured at
1990 cm-I exhibits a sharp rise due to the hot band, then decays to a constant level
(Figure 5.7). To derive the underlying product dynamics, the kinetic traces measured at
1990 cm-I, 2004 cm-I, and 2015 cm- l were fit to a model which takes into account the
bleach recovery, product formation, and vibrational relaxation (see 5.5). The extracted
formation time for the product is 4.4 ± 2.6 ps. Typically, the initial solvation of metal
carbonyls occurs within 1-2 ps following photolysis of one CO ligand [98], from which
one can infer the time scale for a barrierless associative reaction in solution.
Accordingly, our results suggest that solvation of the T)5 -CpRe(CO)z through the Si-H
bond of the solvent leads directly to the formation of the product.
The kinetics of G measured at 1887 cm- l show an exponential rise of 2.5 ± 1.6 ps
and remain at the same intensity to - 1 ns (Figure 5.5). As indicated by the absence of
peaks at 1887 and 1948 cm- l in the static FTIR spectrum at the bottom panel of Figure
5.5, this alkyl solvate must eventually react further to for:m the final product. To
investigate the long-time behavior of this chemical system, we also performed
nanosecond step-scan FfIR experiments. Representative kinetics of the alkyl-solvate (G)
and the product (F) are shown in Figure 5.8. The kinetics of the product F measured at
1990 cm- l show an instrument-limited rise and an exponential growth of 6.8 ± 0.2 Ils.
The alkyl solvate recorded at 1887 cm- l shows a 7.2 ± 0.2 Ils exponential decay to a
constant level. This finite absorbance is attributed to the CO stretch of
-67 -
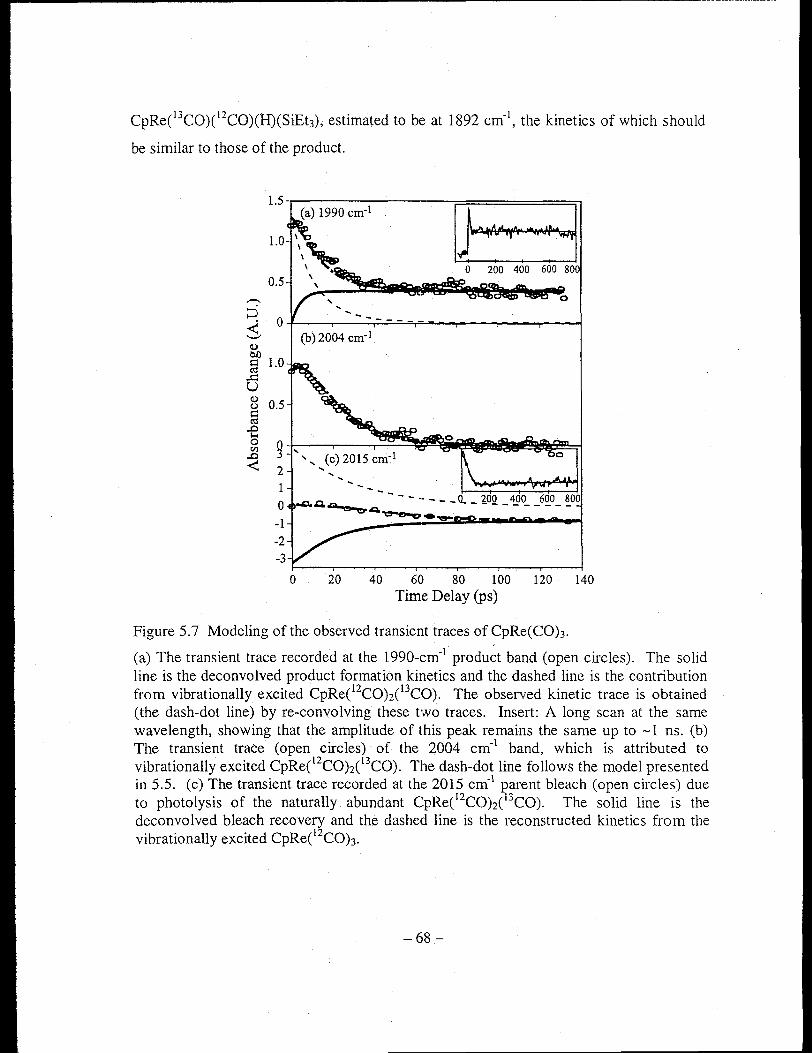
CpRe(13CO)e2CO)(H)(SiEt3), estimated to be at 1892 cm-l, the kinetics of which should
be similar to those of the product.
1.5
1.0
600 800 0.5
---. o ~
0 ~
--.----
11) bl) § 1.0
..s::: U
11) 0.5 (.)
s:: ro .e 0 9 fJl
.r:J o
< 2 1
0 -1 -2 -3
o 20 40 60 80 100 120 140 Time Delay (ps)
Figure 5.7 Modeling of the observed transient traces of CpRe(COh-
(a) The transient trace recorded at the 1990-cm-l product band (open circles). The solid line is the deconvolved product formation kinetics and the dashed line is the contribution from vibrationally excited CpRee2CO)2(13CO). The observed kinetic trace is obtained (the dash-dot line) by re-convolving these two traces. Insert: A long scan at the same wavelength, showing that the amplitude of this peak remains the same up to -1 ns. (b) The transient traCe (open circles) of the 2004 cm-l band, which is attributed to vibrationally excited CpRe(l2COh(13CO). The dash-dot line follows the model presented in 5.S. (c) The transient trace recorded at the 2015 cm-l parent bleach (open circles) due to photolysis of the naturally abundant CpRe(l2COh( 13CO). The solid line is the deconvolved bleach recovery and the dashed line is the reconstructed kinetics from the vibrationally excited CpRee2CO)3.
-68 -
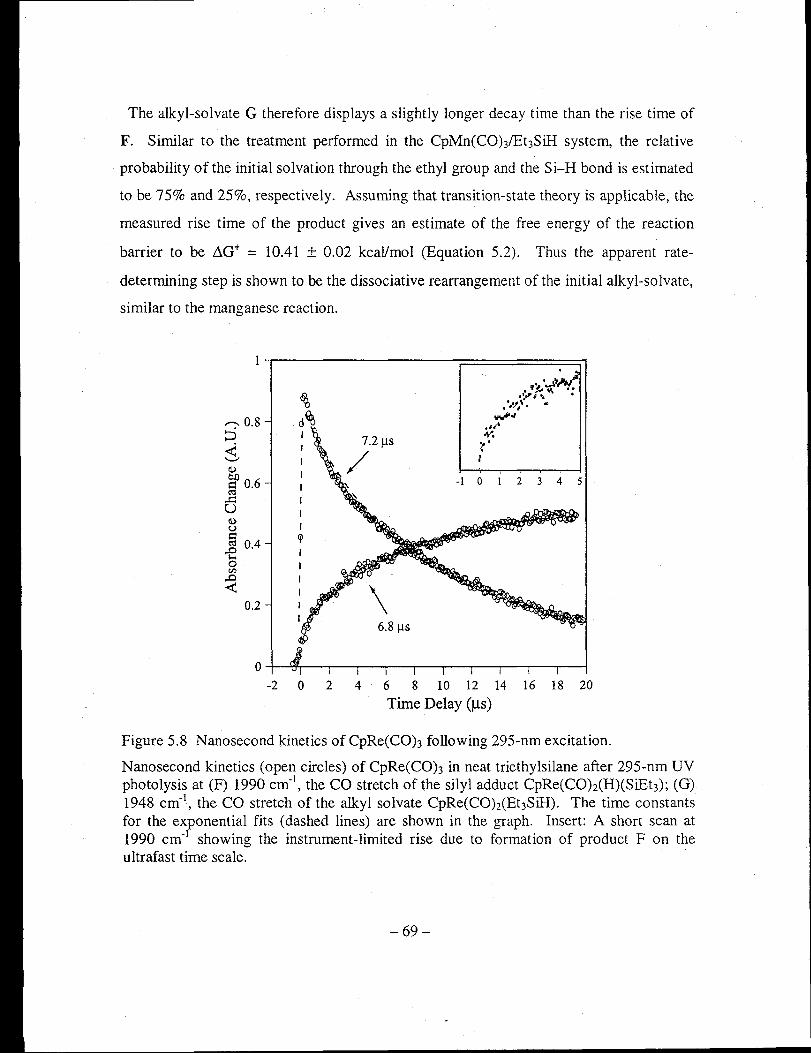
The alkyl-solvate G therefore displays a slightly longer decay time than the rise time of
F. Similar to the treatment performed in the CpMn(COhlEt3SiH system, the relative
probability of the initial solvation through the ethyl group and the Si-H bond is estimated
to be 75% and 25%, respectively. Assuming that transition-state theory is applicable, the
measured rise time of the product gives an estimate of the free energy of the reaction
barrier to be i1G+ = 10.41 ± 0.02 kcaVmol (Equation 5.2). Thus the apparent rate
determining step is shown to be the dissociative rearrangement of the initial alkyl-so Ivate,
similar to the manganese reaction.
0
o°.A~M
~ .. '!.J. ¥. ••
I!'I', • . '.~/\, . ,,-... 0.8 d% wi'J
o,./' ::) .v,
< ~o
'-" 1 Q) 0.0 ::: 0.6 -I 0 1 2 3 4 5 ~ ..r::
U (!)
I (,)
::: .2 0.4 I-<
<jl
0 CI)
< 0.2
6.8 fls
0 -2 0 2 4 6 8 10 12 14 16 18 20
Time Delay (j.ls)
Figure 5.8 Nanosecond kinetics of CpRe(CO)3 following 295-nm excitation.
Nanosecond kinetics (open circles) of CpRe(CO)3 in neat triethylsilane after 295-nm UV photolysis at (F) 1990 cm-1
, the CO stretch of the silyl adduct CpRe(CO)2(H)(SiEt3); (G) 1948 cm-I
, the CO stretch of the alkyl solvate CpRe(COhCEt3SiH). The time constants for the exponential fits (dashed lines) are shown in the graph. Insert: A short scan at 1990 cm-1 showing the instrument-limited rise due to formation of product F on the ultrafast time scale.
-69-
5.2.3 ab initio Calculation Results
CpM(COh
1.14
~ CpM(CO)z( ethane)
OH ~c @o CD SI e Metal = Mn or Re
r(Si-H) = 1.90 for M = Mn 2.35 for M = Re
Figure 5.9 Geometries of the parent molecules, the ethane-solvate, and the final product optimized at the MP2 / lanl2dz level of theory.
The bond lengths are in A and angles in degrees. Parameters for the rhenium complexes are in parenthesis.
Geometry optimization. Figure 5.9 shows the geometries of the parent molecules
T)5-CpM(COh [121], the dicarbonyl metal complexes solvated by an ethane molecule
T)5 -CpM(COh(ethane), and the final products T)5 -CpM(COh(H)(SiH2CH3); all optimized
at the MP21lanl2dz level of theory. As displayed in Table 5.1, the metal-Cp and metal
CO distances for the parent molecules calculated at the MP2 level agree reasonably well
with the experimental values, except for the slightly overestimated C-O bond lengths.
Qualitatively, the metal-ligand distances should reflect the relative sizes of the
manganese and the rhenium atoms. As displayed in Table 5.1, the rhenium complexes
exhibit consistently a longer metal-ligand distance by -0.17 A over the manganese
complexes, indicating a larger diameter for a complexed Re atom over a Mn atom.
-70-
---------------------------------
T~ble 5.1. Critical bond distances (in A) of the important structures for the Si-H bond activation reactions optimized at the MP2 /lanl2dz level of theory.a
compound Cp-M M-CO C-O M-H M-Si Si-H (M-C) (C-H)
TIs -CpMn(COh 1. 77 (1. 77)6 1.74 (1.78)6 1.22 (1.16)6
singlet TIs -CpMn(COh 1.80 {1.86} 1.78 {1.79} 1.21 {1.19} triplet TIs -CpMn(COh 1.84 {1.94} 1.82 {1.83} 1.19 {1.18} TIs -CpMn(COMH3CCH3) 1.79 1.77 1.22 1.77 2.73 1.14 TIs -CpMn(COHH)(H2SiCH3) 1.75 1.73 1.22 1.51 2.44 1.90 TIs -CpRe(CO)3 2.02 (1.96)" 1.96 (1.90)" 1.21 (1.17)C
singlet TIs -CpRe(CO)z 1.94 {1.97} 1.95 {1.89} 1.22 {1.19} triplet TIs -CpRe(CO)z 2.03 {2.04} 1.98 {1.91} 1.19 {1.19} TIs -CpRe(COh(H3CCH3) 1.96 1.95 1.21 1.89 2.84 1.17 TIs -CpRe(CO)z(H)(HzSiCH3) 2.00 1.97 1.21 1.69 2.57 2.35
a Numbers in 0 parenthesis are experimental values, and those in curvy brackets are from DFf calculations. b Fitzpatrick, P. J.; Le Page, Y.; Sedman, J.; Butler, I. S., Inorg. Chem. 1981,20,2852. C Fitzpatrick, P. J.; Le Page, Y.; Sedman, J.; Butler, I. S., Acta Crystallogr .. Sect B, 1981, B37, 1052.
For the ethane dicarbonyl complexes in Figure 5.9, the ethane molecule interacts
with the metal center via one of its C-H bonds through an 112 interaction. The bond
lengths for the coupling C-H bond are 1.14 and 1.17 A for the Mn and Re compounds,
respectively. These calculated C-H bond lengths, compared to 1.10 A for a typical C-H
bond in a saturated alkane from the same level of calculation, show a significantly
extended C-H bond (+0.07 A) when complexed to the Re center but only slight (+0:04
A) extension when coupled to the Mn complex. The more extended C-H bond in the Re
case suggests that the Re atom interacts more strongly with a C-H bond, hence forming a
more stable alkyl complex. Finally, the relative extent of the Si-H bond activation by the
Mn and Re compounds is clearly demonstrated by the Si-H bond distances in the final·
products. The calculated Si-H bond lengths for the Mn and Re complexes are
respectively 1.90 and 2.35 A compared to a typical silane Si-H bond length of 1.49 A. Apparently, the degree of bond-breakage can be inferred from the product Si-H bond
lengths. In the hydridosilyl manganese product, the Si-H bond is 0.41 A longer than a
Si-H bond in an isolated silane. The hydridosilyl rhenium product, on the other hand,
-71-

exhibits a much longer distance (0.86 A longer than an isolated Si-H bond) between the
silicon and the hydrogen atom, marking a completely broken Si-H bond.
128° (121°)
Side View
Top View
~ 64';-1-(60.5')
C2v
singlet CpM(COh
174° (176°)
C2v
triplet CpM(CO)2
Figure 5.10 Side view and top view for the MP2 / lanl2dz optimized geometries of the 16-e- species.
The bond lengths are in A and angles in degrees. Parameters for the rhenium complexes are in parenthesis.
Shown in Figure 5.10 are the geometries for the 16-e- species 115 -CpM(COh in
their singlet and triplet states. Despite the similarity of the structures, one notices a
difference in the OC-M-CO angle. Due to the larger radius of the Re atom and hence
reduced ligand-ligand repulsive interaction, the angle is 93.470 for the Re complex,
compared to 95. 11° for the Mn one; or when projected onto the Cp plane, 1210 for the Re
and 1280 for the Mn species.
-72-
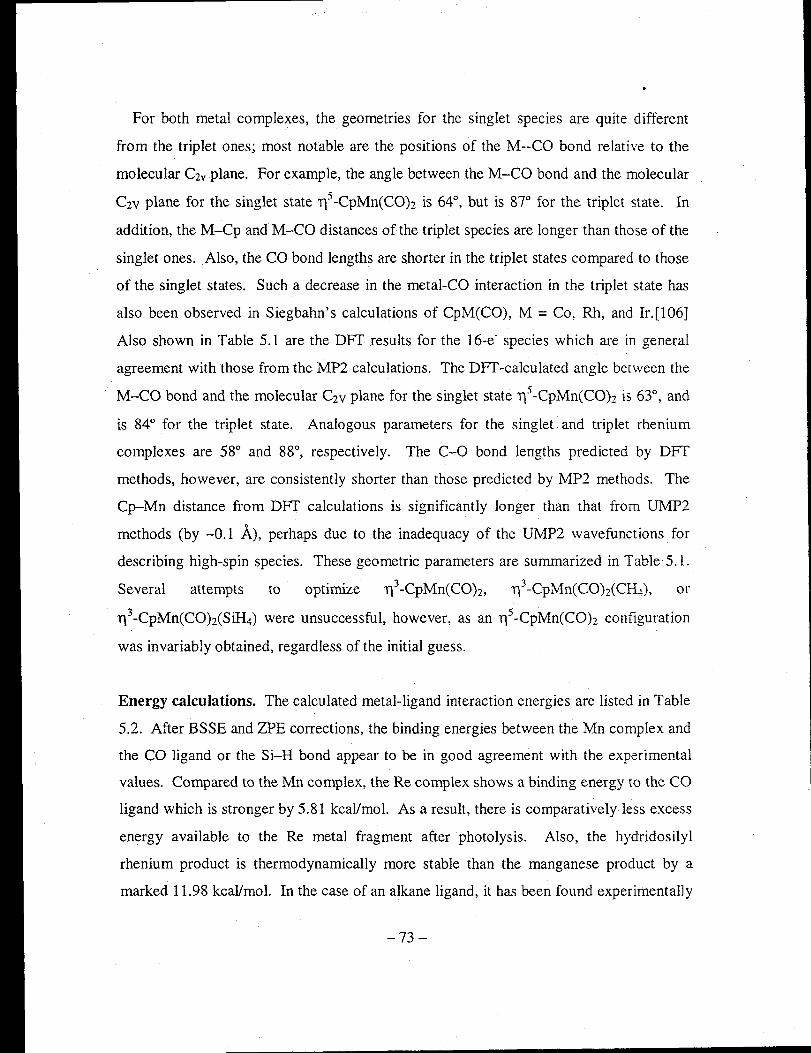
For both metal complexes, the geometries for the singlet species are quite different
from the triplet ones; most notable are the positions of the M--CO bond relative to the
molecular C2y plane. For example, the angle between the M-CO bond and the molecular
C2V plane for the singlet state '115 -CpMn(CO)2 is 64°, but is 87° for the triplet state. In
addition, the M-Cp and M-CO distances of the triplet species are longer than those of the
singlet ones. Also, the CO bond lengths are shorter in the triplet states compared to those
of the singlet states. Such a decrease in the metal-CO interaction in the triplet state has
also been observed in Siegbahn's calculations of CpM(CO), M = Co, Rh, and 1r.[106]
Also shown in Table 5.1 are the DFT results for the 16-e' species which are in general
agreement with those from the MP2 calculations. The DFT -calculated angle between the
M-CO bond and the molecular C2V plane for the singlet state T)5-CpMnCCO)2 is 63°, and
is 84° for the triplet state. Analogous parameters for the singlet. and triplet rhenium
complexes are 58° and 88°, respectively. The C-O bond lengths predicted by DFT
methods, however, are consistently shorter than those predicted by MP2 methods. The
Cp-Mn distance from DFT calculations is significantly longer than that from UMP2
methods (by -0.1 A), perhaps due to the inadequacy of the UMP2 wavefunctions for
describing high-spin species. These geometric parameters are summarized in Table 5.1.
Several attempts to optimize T)3 -CpMn(CO)2, T)3 -CpMn(CO)2(CH4), or
113-CpMnCCO)zCSiH4) were unsuccessful, however, as an T)5-CpMnCCO)z configuration
was invariably obtained, regardless of the initial guess.
Energy calculations. The calculated metal-ligand interaction energies are listed in Table
5.2. After BSSE and ZPE corrections, the binding energies between the Mn complex and
the CO ligand or the Si-H bond appear to be in good agreement with the experimental
values. Compared to the Mn complex, the Re complex shows a binding energy to the CO
ligand which is stronger by 5.81 kcal/mol. As a result, there is comparatively less excess
energy available to the Re metal fragment after photolysis. Also, the hydridosilyl
rhenium product is thermodynamically more stable than the manganese product by a
marked 11.98 kcal/mol. In the case of an alkane ligand, it has been found experimentally
-73-
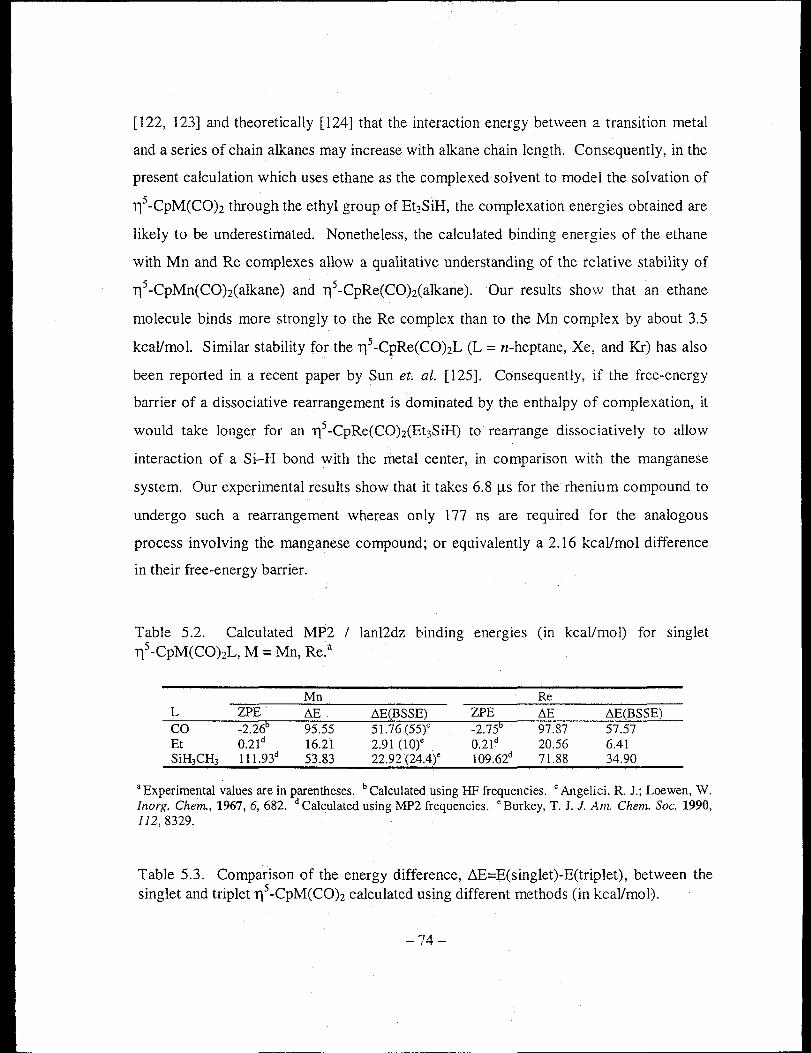
[122, 123] and theoretically [124] that the interaction energy between a transition metal
and a series of chain alkanes may increase with alkane chain length. Consequently, in the
present calculation which uses ethane as the complexed solvent to model the solvation of
115 -CpM(CO)z through the ethyl group of Et3SiH, the complexation energies obtained are
likely to be underestimated. Nonetheless, the calculated binding energies of the ethane
with Mn and Re complexes allow a qualitative understanding of the relative stability of
115-CpMn(CO)2(alkane) and 115-CpRe(CO)z(alkane). Our results show that an ethane
molecule binds more strongly to the Re complex than to the Mn complex by about 3.5
kcallmol. Similar stability for the 115 -CpRe(CO)zL (L = n-heptane, Xe, and Kr) has also
been reported in a recent paper by Sun et. al. [125]. Consequently, if the free-energy
barrier of a dissociative rearrangement is dominated by the enthalpy of complexation, it
would take longer for an 115 -CpRe(CO)z(Et3SiH) to rearrange dissociatively to allow
interaction of a Si-H bond with the metal center, in comparison with the manganese
system. Our experimental results show that it takes 6.8 ~s for the rhenium compound to
undergo such a rearrangement whereas only 177 ns are required for the analogous
process involving the manganese compound; or equivalently a 2.16 kcallmol difference
in their free-energy barrier.
Table 5.2. Calculated MP2 / lanl2dz binding energies (in kcal/mol) for singlet 115-CpM(CO)2L, M = Mn, Re.a
Mn Re L ZPE Llli boE(BSSE) ZPE boE boE(BSSE) CO -2.266 95.55 51.76 (55)" -2.756 97.87 57.57 Et 0.21d 16.21 2.91 (l0),' 0.21d 20.56 6.41 SiH3CH3 111.93d 53.83 22.92 (24.4)" 109.62d 71.88 34.90
a Experimental values are in parentheses. b Calculated using HF frequencies. C Angelici, R. J.; Loewen, W. Inorg. Chem, 1967, 6, 682. d Calculated using MP2 frequencies. e Burkey, T. J. 1. Am. Chem. Soc. 1990, 112,8329.
Table 5.3. Comparison of the energy difference, ~E=E(singlet)-E(triplet), between the singlet and triplet 115 -CpM(CO)2 calculated using different methods (in kcallmol).
-74-
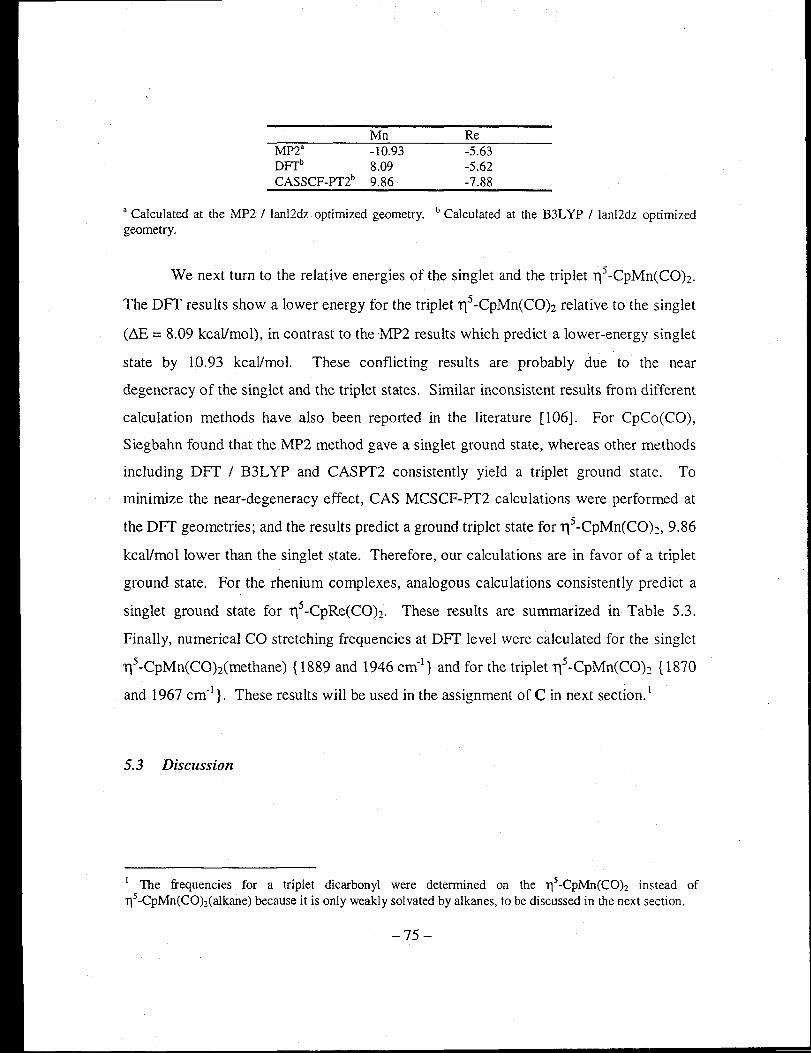
MP2' DFTb CASSCF-PT2b
Mn -10.93 8.09 9.86
Re -5.63 -5.62 -7.88
a Calculated at the MP2 / lanI2dz optimized geometry. b Calculated at the B3L YP / lanl2dz optimized geometry.
We next turn to the relative energies of the singlet and the triplet 115 -CpMn(COh
The DFf results show a lower energy for the triplet 115-CpMn(COh relativetothe singlet
(~E = 8.09 kcaVmol), in contrast to theMP2 results which predict a lower-energy singlet
state by 10.93 kcaVmol. These conflicting results are probably due to the near
degeneracy of the singlet and the triplet states. Similar inconsistent results from different
calculation methods have also been reported in the literature [106]. For CpCo(CO),
Siegbahn found that the MP2 method gave a singlet ground state, whereas other methods
including DFT / B3L YP and CASPT2 consistently yield a triplet ground state. To
minimize the near-degeneracy effect, CAS MCSCF-PT2 calculations were performed at
the DFf geometries; and the results predict a ground triplet state for 115 -CpMn(COh, 9.86
kcallmollower than the singlet state. Therefore, our calculations are in favor of a triplet
ground state. For the rhenium complexes, analogous calculations consistently predict a
singlet ground state for 115 -CpRe(COh- These results are summarized in Table 5.3.
Finally, numerical CO stretching frequencies at DFT level were calculated for the singlet
115 -CpMn(COh(methane) {1889 and 1946 em-]} and for the triplet 115 -CpMn(CO)} {1870
and 1967 cm-] }. These results will be used in the assignment of C in next section. ]
5.3 Discussion
I The frequencies for a triplet dicarbonyI were detennined on the 115 -CpMn(COh instead of 115-CpMn(COMalkane) because it is only weakly solvated by alkanes, to be discussed in the next section.
-75 -
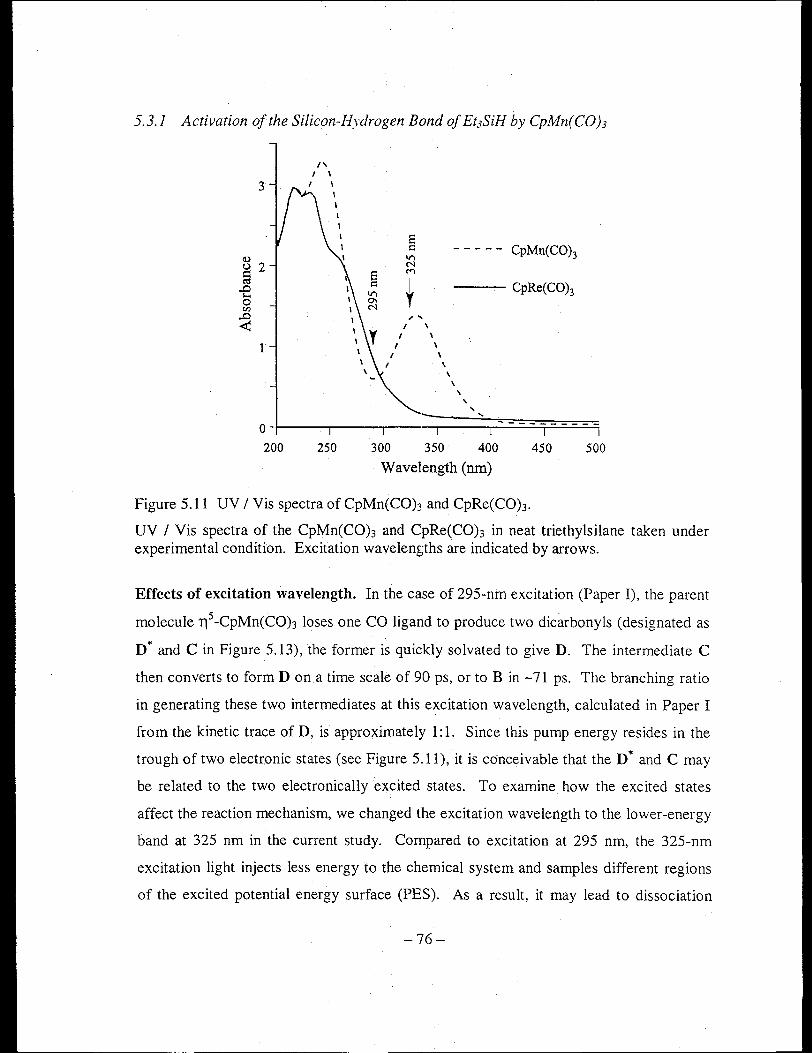
5.3.1 Activation of the Silicon-Hydrogen Bond of Et3SiH by CpMn(COh
3
(\)
c..> 2 :::::: ~ -e 0 til
.D ~
1
/\ I ,
\ \
- - - -- CpMn(CO)3
CpRe(COh
,
\ \
"--O~----'---~---=~====;I~-~-~-~-~I~-~-~-~-~-200 250 300 350 400 450 500
Wavelength (run)
Figure 5.11 UV / Vis spectra of CpMn(CO)3 and CpRe(COh.
UV / Vis spectra of the CpMn(CO)3 and CpRe(COh in neat triethylsilane taken under experimental condition. Excitation wavelengths are indicated by arrows.
Effects of excitation wavelength. In the case of 295-nm excitation (Paper I), the parent
molecule 115 -CpMn(CO)3 loses one CO ligand to produce two dicarbonyls (designated as
D* and C in Figure 5.13), the former is quickly solvated to give D. The intermediate C
then converts to form D on a time scale of 90 ps, or to B in -71 ps. The branching ratio
in generating these two intermediates at this excitation wavelength, calculated in Paper I
from the kinetic trace of D, is approximately 1: 1. Since this pump energy resides in the
trough of two electronic states (see Figure 5.11), it is conceivable that the D* and C may
be related to the two electronically excited states. To examine how the excited states
affect the reaction mechanism, we changed the excitation wavelength to the lower-energy
band at 325 nm in the current study. Compared to excitation at 295 nm, the 32S-nm
excitation light injects less energy to the chemical system and samples different regions
of the excited potential energy surface (PES). As a result, it may lead to dissociation
-76-
channels that have different product energy distribution. Indeed, the kinetics of C and D
following 325-nm excitation show little, if any, excess vibrational energy. This is to be
compared with results from 295-nm excitation, which indicate that -23 ps is required to
dissipate excess vibrational energy. For clarity, the kinetic traces of D recorded at the
two pump energies are reproduced in Figure 5.12. Accessing a different part of the
excited PES also changes the branching ratio from A-7D* -7D:A-7C-7D "'" 1: 1 (295-nm
excitation) to 1:3 (325 nm). This may imply that the lower-energy band at -330 nm
correlates with the dissociation channel that leads to C, and the higher-energy band to D.
The nature of the intermediate C. In Paper I, two possible candidates for the observed
transient intermediate C were proposed: a ring-slipped 113 -CpMn(CO)2 or 11S -'CpMn(CO)2
in another electronic state, presumably a triplet state. The 113-CpMn(COh species [75,
126, 127], however, has only 14 valence electrons for the Mn-a fIrst-row transition
metal-severely violating the 18-e- rule. Our theoretical mode lings also support the
energetic instability of 113 complexes. C is therefore unlikely to be a ring-slipped 14-e
species. Another possible assignment for C is that it is a dicarbonyl in the triplet ground
state. There have been precedents for 16-e- organOrrietallics having a triplet ground state
[128-131], the geometry of which may differ from that of the singlet state to allow a
different ligand vibrational frequency [107, 132]. Our calculations suggest a triplet
ground state for 115 -CpMn(COh We next compare the theoretical CO stretching
frequencies to the experimental results. Recent developments in ab initio methods have
shown promising results in identifying organometallic species through frequency
calculations [78, 133, 134]. The DFT calculations for the triplet dicarbonyl show a +21
cm- l shift of the higher-energy CO band and a -19 cm- l shift of the lower-energy band of
the solvated singlet dicarbonyl, compatible with experimental observation of frequency
shifts of C relative to D. Therefore, it seems reasonable to attribute C to a triplet
115- CpMn(COh.
-77 -

1.2 -r-----,------------------,
1
0.8 .f'
<Il
~ ~ 0.6
'"0 Q) N .-~ 0.4
o Z
0.2
o
r29; = 0.48 x (I- e.;;.) + 0.52 x (1- e'~:')
!U~\1t:~ \ ~-Otn-1J"Co~rJ)Co
Ai CYo~O 0 A~;6 0
)~6l 0/ "
.~ ""-6 I }'325 = 0.74 x (1- elO~~·)+O.26 i~ ~------~ t 0 D (325-nm pump)
rJ - - Fit
A. D (295-nm pump)
- - Fit o C (295-nm pump)
- - Fit
-0.2 +-,.....,.... ........... ..,.....,.....,.....,.......,.....,.,.......,.....,....,.-,-........... -r-:.....-.,.......,.....,....,.......,.......,....-,-.,...;
-100 o 100 200 300 400 500
Time Delay (ps)
Figure 5.12 Comparison of ultrafast kinetics of CpMn(CO)3 at different pump wavelengths.
Ultrafast kinetic traces of D (filled triangles), C (open squares) following 295-nm excitation, and D (open circles) following 325-nm excitation. Also shown are the functions Y295 and Y325 that are used to model the two normalized traces of D. Corresponding fits are shown as dashed lines. Clearly, the relative intensity of C to D is lower when excited at 295 nm compared to that of 325-nm excitation in Figure 5.3. This wavelength dependence can be quantified by comparing the fitting coefficients of Y 295 and Y325. Please see text for details.
Solvation of the triplet and singlet manganese dicarbonyls. In the context of C being
a triplet state 1)5 -CpMn(COh, we next discuss the interaction of C and the solvent.
Unlike the singlet 16-e- species which can be solvated readily by alkanes and rare-gas
atoms (Kr, Xe), it has been suggested theoretically that transition metals in their triplet
state interact only weakly with these solvents [135-137]. This conclusion has been used
to explain the high reactivity of triplet 1)5 -CpCo(CO) towards a free CO in liquidified
-78-

rare-gas solution or in alkane solution [128]. In that case, the incoming CO ligand does
not require much activation energy to displace an alkane or rare-gas molecule which
couples weakly to the metal center of 115 -CpCO(CO). Triplet-to-singlet intersystem
crossing in chemical systems such as triplet 115 -CpCo(CO) or triplet 115 -CpMn(CO)2 is
further complicated by the fact that the complex of interest is always under the influence
of solvent molecules in a liquid environment. It was found by Heilweil et. al. that triplet
115 -CpCo(CO) reacts very quickly « vibrational cooling time) with the strongly-binding
ligand I-hexene to form presumably a singlet TC-complex, in which a I-hexene molecule
complexes to the Co metal through its C=C double bond [120]. This is to be compared
with the lifetime (- rns) of triplet 115 -CpCo(CO) in weakly-binding solvents such as Kr
and Xe [128]. Hence the surrounding solvent molecules, especially those interacting
strongly with the metal center, need to be considered in describing the reaction coordinate
for spin-crossover and solvent exchange. In other words, the interconversion from triplet
C to singlet D should probably be considered as a concerted spin-crossover I solvation
process.
With this picture in mind, the solvation of the initially photo-generated triplet and
singlet dicarbonyls can be described as follows. Probably due to steric hindrance and
statistical favor of the ethyl groups over the Si-H bond, the nascent singlet
115 -CpMn(CO)2 is preferentially solvated via the ethyl moiety of Et3SiH to form D. The
solvation of the triplet dicarbonyl, however, may be quite different. Assuming that a
triplet 115-CpMn(CO)2 interacts initially with the ethyl moiety of an Et3SiH molecule, the
interaction between the alkyl group and a triplet Mn is so weak that the surrounding
solvent molecules have sufficient thermal energy to easily reorient or displace the
interacting Et3SiH, until the triplet Mn encounters a strongly-coupling Si-H site. This
process is expected to be on the order of a few picoseconds, the time scale for typical
solvent motions. It would thus appear that a triplet transition metal complex is
preferentially solvated by the more strongly-coupling sites of a solvent molecule.
Similarly a preferential solvation has also been observed in Heilweil's experiments on
-79 -

CpCo(CO) in neat I-hexene, where one would expect to see solvation of CpCoCCO)
through both the alkyl chain and the C=C bond of I-hexene. The only product observed,
however, was the strongly bound 1t-complex. Our data show that the product kinetics
exhibit only one exponential rise on the ultrafast time scale, which is perhaps due to the
preferential initial solvation of the singlet ,.,5 -CpMn(COh via the ethyl group and the
triplet ,.,5 -CpMn(CO)2 through the stronger-binding Si-H bond of the solvent molecule.
The reaction mechanism. In the light of the above discussion, the photo-chemical Si-H
bond activation reaction of,.,5 -CpMnCCO)3 in neat Et3SiH under the ambient conditions is
summarized in Figure 5.13. We found that there are two excited states involyed in the
experimentally accessible region. The higher-energy UV band is correlated with the
generation of the dicarbonyl,.,5 -CpMn(COh CD*) in its electronic singlet manifold, while
the lower-energy band is correlated to the triplet ,.,5 -CpMn(COh (C). Following previous
discussion on the preferential solvation of D* through the ethyl moiety and that 84% of
the total product comes from D, the branching ratio for A-7D* to A-7C can be calculated
to be 42%:58% at 295-nm excitation. The initial solvation of these two intermediates via
the Si-H bond or the ethyl moiety of the solvent partitions the reaction into two pathways
with a branching ratio close to 1:5.3 (16% through the Si-H bond and 84% through the
ethyl group). Solvation of C via the Si-H bond leads to the final product B on a time
scale of -100 ps, possibly through a concerted coordination/spin-crossover process.
Solvation of D* through the ethyl group of the solvent molecule results in D, whose
population is augmented by interconversion from the triplet C on a similar time scale of
-100 ps. Finally, the ethyl-solvate reacts to form the final product B through a
dissociative rearrangement on a time scale of -177 ns, corresponding to a barrier height
of D.G+ ::.:; 8.25 keal/mol.
- 80-

A
Singlet
oc\@.tco D*
~ I
oC\\\,··Mn ITa Et3SiH
0° :I dissociative D rearrangement
84% (177 ns)
I: initial solvation through the Si-H bond, coordination / spin-crossover (-100 ps) ITa: initial solvation of singlet species through the ethyl moirty (a few ps) IIb: coordination / spin-crossover to fonn an ethyl solvate (-100 ps)
Figure 5.13 Proposed reaction mechanism for the silicon-hydrogen bond activation by CpMn(COh covering the ultrafast dynamics to nanosecond kinetics.
The nascent singlet 115 -CpMn(COh, denoted D*, is also shown for the purpose of discussion. See text for details.
- 81-
5.3.2 Activation of the Silicon-Hydrogen Bond of Et3SiH by CpRe(COh
In comparison to the manganese compound, the photo-chemical reaction of
l1s -CpRe(COh (E) with Et3SiH is much simpler (see Figure 5.14). Photolysis of E
results in a dicarbonyl species, 115 -CpRe(COh (G\ in its singlet electronic ground state.
Subsequent solvation of G* partitions the reaction into two courses to the formation of the
final product. Interaction of G* with the Si-H bond of the solvent molecule leads directly
to the final product 115 -CpRe(CO)2(H)(SiEt3), F, with a time constant of -4.4 ps. Another
pathway proceeds through solvation of G* via the ethyl group of the solvent to form
115-CpRe(CO)2(Et3SiH), G, on a time scale of -2.5 ps, and further reacts to form the final
product F. The relative probability of (solvation through the ethyl moiety)/(solvation
through the Si-H bond) for the rhenium complex is found to be approximately 3,
compared to 5.3 for the manganese complex. The difference may be attributed to steric
interaction from the ligands. The smaller radius of the Mn center may cause increased
steric interaction between the ligands and the solvent molecule's ethyl group when
solvation proceeds through the Si-H bond. Such steric hindrance is reduced when
solvation occurs through the ethyl moiety. The larger diameter of the Re center makes it
more accessible to chemically different sites of a solvent molecule, resulting in a
branching ratio of approximately 3-the ratio of three ethyl groups to one Si-H bond in
an Et3SiH molecule.
-82-

«i?? I
\\. Re OC, ' °0 0°
««? I
C \\·Re o , ' °0 0°
E
*
oc <:{t;j; CO ««? Triplet H* . . . . . . . . (@G*
oC '-=-leO
Singlet
I
25%
F
I: initial solvation through the SiDH bond } a fewps
II: initial solvation through the ethyl moiety
dissociative rearrangement
75% (6.8 ~s)
Figure 5.14 Proposed reaction mechanism for the silicon-hydrogen bond activation by CpRe(CO)3 covering the u1trafa~t dynamics to microsecond kinetics.
The nascent singlet and triplet T\5-CpRe(CO)2, denoted H* and G*, arealso shown for the purpose of discussion. See text for details.
- 83-

5.4 Closing Remarks
Due to the very complicated dynamic processes in a liquid environment,
photochemical reactions such as the bond--activation reactions studied here may span
several orders of magnitude in time-from hundreds of femtosecond for dissociating a
chemical bond to the time scale governed by a diffusional process or an energetic barrier.
Combining the use of the femtosecond and nanosecond UV pump:.IR probe spectroscopy,
the elementary reaction steps including changes in molecular conformation and electronic
multiplicity may be studied by monitoring the time-evolution of the reactive
intermediates. The nature of the intermediates whose lifetimes were too short for
conventional spectroscopic characterization were studied using first-principle quantum
chemical methods. Utilizing these powerful tools, it is also possible to assess the relative
probability of parallel, dynamically partitioned reaction channels. We have im'estigated
photo-chemical Si-H bond activation reaction by group VIIB, d6 transition metal
complexes 115-CpM(CO)3 (M = Mn, Re). The detailed reaction mechanisms are
summarized in Figure 5.13 and Figure 5.14.
Despite the fact that Mn and Re belong to the same group in the periodic table, we
have shown in this paper that the reaction dynamics of 115 -CpMn(COh or 115 -CpRe(CO)3
with Et3SiH is very different on the ultrafast time scale and depends on the nature of
electronic structure of the molecule in question. If more than one dissociation channel
(excited state) are involved in the initial photolysis as in the Mn case, which has two
experimentally accessible UV bands, the reaction may dynamically partition into several
parallel pathways leading to different transient intermediates. The nature of these
transient species have been investigated using ab initio calculations. The calculation
results provided strong evidence that photolysis of the parent 115 -CpMn(CO)3 generates
both singlet and triplet 115 -CpMn(CO)2 species, which accounts for the experimental
-84-

observations consistently. The correlation of these reaction pathways to the excited states
were studied by examination of their branching ratios, which were determined from
ultrafast kinetic traces of the intermediates, at different excitation wavelengths. In the
case of Mn, the higher-energy band was found to associate with formation of singlet
115 -CpMn(CO)2 while the lower-energy band with that of triplet 115 -Cp~ln(COh
Interaction of solvent molecules with the singlet and triplet Mn complexes were also
discussed.
The metal dicarbonyls 115 -CpMn(COh or 115 -CpRe(COh resulting from UV
photolysis of a CO ligand were found to be solvated by a solvent molecule in a few
picoseconds. From this point on, both metal complexes share a common reaction pattern
that solvation through chemically different sites of a solvent molecule further partitions
the reaction into two routes. The final product could form on the ultrafast regime when
the coordinatively unsaturated 16-e" metal complex interacted with the Si-H bond of the
solvent molecule. On longer time scales, both reactions (Mn and Re) were shown to
proceed through a kinetically favored intermediate-a metal dicarbonyl solvated by the
ethyl moiety of solvent molecule. The branching ratio for these solvation-partitioned
reaction pathways, derived from the product kinetic traces taken at ns or J..ls time scales,
was argued to be governed by steric interaction. The apparent rate-determining step was
found to originate from dissociative rearrangement from this ethyl-solvate to the
thermodynamically more stable hydrido-silyl product. The associated free-energy
barriers were also determined and were in excellent agreement with results from previous
low-temperature studies (for Mn).
Through detailed mechanistic study, we were able to experimentally determine
the Si-H bond-breaking step. The time scale for such a process in a liquid em'ironment
was for the first time measured to be 4.4 ps. The result allows an upper bound for the
time scale of the Si-H bond-activation step, confirming ab initio theoretical predictions
[8, 87]. This is in sharp contrast to the analogous C-H bond-cleaving process which
- 85-
--. --. -----------------------------------------------------------------------------

takes approximately 230 ns. In this case, the 8.3 kcaVmol energy barrier corresponding
to cleaving an alkane C-H bond has been attributed to poor spatial overlap and energy
match of the molecular orbitals between an alkane C-H bond and a transition metal
center; the hydrogen atom and an alkyl group have to separate before forming chemical
bonds with the metal center [8, 87]. Extension of the current work, including a close
interplay between experiment and theory,. to other transition metals reacting with
different chemical bonds are expected to provide a better understanding about the
chemistry of bond-cleavage reactions.
5.5 Supplementary
In the ultrafast experiment of 115 -CpRe(CO)3 / Et3SiH, several events that occur
concurrently on the -100 ps time scale have complicated the transient spectra in the
frequency region from 1990 cm- I to 2030 cm- I. These events include the recovery of the
parent 115 -CpRee2COh bleach due to re-equilibration of the vibrational population,
bleach recovery of 115 -CpRect2CO)2( 13CO), and the formation of the product
115 -CpRe(CO)2(H)(SiEt3). Summarized below are these processes and their associated
frequencies:
1990 em-I:
2004 em-I:
2015 cm- I:
2030 cm- I:
product formation, vibrational relaxation of 13v = 2.
vibrational relaxation of 13v = 1.
bleach recovery of 13V = 0, vibrational relaxation of J2v = 1.
bleach recovery of 12V = O.
where superscripts 12 and 13 refer respectively to the parent molecule 115 -CpRe( 12CO)3 and
the naturally abundant 13CO mono-substituted 115 -CpRe(13CO)(12CO)2' To deconvolve
the dynamics of individual events out of the complicated spectra, we first consider the
population· of the ith vibrational state of '115 -CpRe( 13CO)( J2COh Assuming that the
- 86-

relaxation rate of the i state to the (i-i) state is proportional to the population ni, and that
nj is replenished only by relaxation from the (i+ i) state, we can write the coupled rate
equations for vibrational states i = 0, 1, and 2 as
Equation 5.3
13 k .. I l,l-
where the ki.jS are the rate constants for the transition from i state to j state. Similarly, the
population dynamics for CO vibrational states i = 0 and 1 of 1l5-CpRe(12COh can be
expressed as
Equation 5.4 d l2
no 12 12 --= k io n l dt .
Equation 5.5 d 12
n l 12 12 --=- k lo n,
dt .
Finally, the formation of the final product at 1990 cm-I is assumed to be represented by a
single exponential,
Equation 5.6 1 - C (1 -rlr:p"'df(CI) product - product - e
We further assume that the IR absorbance of state i, denoted by h is proportional to its
population ni. The observed kinetic traces can then be fit to this model by solving the
coupled differential equations numerically and collecting terms contributing to the
relevant frequencies. The optimized parameters are: 131 °3 =.0.29 ± 0.15, 131 °2 = 1.30 ±
0.015, 13[ °1 = 0.92 ± 0.070, 13[ °0 = -3.24 ± 0.16 , 13k3.2 = 0.083 ± 0.0036 pS-I, 13k2,J =
0.088 ± 0.0076 pS-l, 13k1 .0 = 0.088 ± 0.015 pS-l, 12kj•o = 0.032 ± 0.0025 pS-l, and ,",product = 4.35 ± 2.6 ps. The deconvolved kinetic traces are displayed in Figure 5.7 and explained
in the figure caption. Note that the intensities at t = 0 of state i, denoted by f i, does not
reflect the initial population on each vibrational state since we do not have a priori
knowledge of the extinction coefficient for each vibrational state.
-87 -

6 FEMTOSECOND INFRARED STUDIES OF A PROTOTYPICAL ONE
ELECTRON OXIDATIVE-ADDITION REACTION: CHLORINE ATOM
ABSTRACTION BY THE RE(CO)S RADICAL.
6.1 Introduction
Oxidative-addition is one class of fundamental reactions of organometallic
complexes. A comprehensive understanding of the mechanism requires knowledge of the
dynamics of all the intermediates. The extremely fast reaction rates, ho\vever, have made
it experimentally challenging to elucidate the reaction scheme. Femtosecond infrared (fs
IR) spectroscopy, which is capable of "real-time" observation and characterization of the
reactive intermediates down to hundreds of femtosecond, offers the poss:ibility of
deducing the elementary steps of a photochemical reaction in room-temperature
solutions. Recently, this technique has been successfully used to unravel the reaction
dynamics on a time scale faster than that of diffusion in the photo-initiated two-electron
oxidative-addition reactions of C-H and Si-H bond activation [15-18, 80]. This
communication reports the use of fs-IR spectroscopy to study a prototypical one-electron
oxidative-addition. The transition-metal complex under study is the 17-e- (CO)sRe
radical, generated by photo-dissociation of the Re-Re bond of Re2(CO)1O. The 17-e
radical reacts to extract a CI atom from a chlorinated methane solvent. The reaction may
proceed through a strongly-solvated 19-e- intermediate, through a charge-transfer
intermediate, or through a weakly-solvated 17-e- intermediate as shown in Figure 6.1 [9-
11]:
-88-

.. (CO)5M ~CI-CR3
( 19-e-) ..
(CO)5Re + CI-R --~ [(CO)5Re+ + Tl-R)
( charge transfer)
(CO)SRe· + CI-R ( solvated 17-e- )
Reaction Intermediate
~ (CO)sRe-CI + R
Figure 6.1 Previously proposed reaction schemes for CI atom abstraction by Re(CO)5.
This aspect is examined directly for the first time by following the reaction from
initiation to completion with 300-fs time resolution. To study the nature of the reaction
barrier, the rates are measured along a series of chlorimited methane solutions under
ambient conditions. The transition states are studied using density-functional theoretical
(DFT) methods.
6.2 Results and Discussion
As shown in the static FTIR in Figure 6.2d, the final product (CO)sReCI in neat
CC4 solution exhibits two CO stretching peaks at 1982 and 2045 cm" [138]. At shorter
time delays (40 ns < 2.5 Ils) in Figure 6.2c,' there appear five additional bands at 1945,
1985, 1998, 2005, and 2055 cm-' that are assigned to the equatorially solvated
nonacarbonyl species eq-Re2(CO)9(CC4), in agreement with low-temperature studies
[139]. On the hundreds of picosecond time scale (Figure 6.2b), one sees a broad feature
centering at around 1990 em", marked by a down-pointing arrow. This spectrum is to be
compared with that taken in the chemically inert hexanes solution (Figure 6.2a), which
also exhibits a broad band centering at around 1992 em-I, assigned to the weakly solvated
Re(CO)s radical in hexanes solution [140]. It follows that the broad feature at
1 Please refer to the supplementary section of this chapter for technical details. All uncertainties reported in herein represent one standard deviation.
-89 -
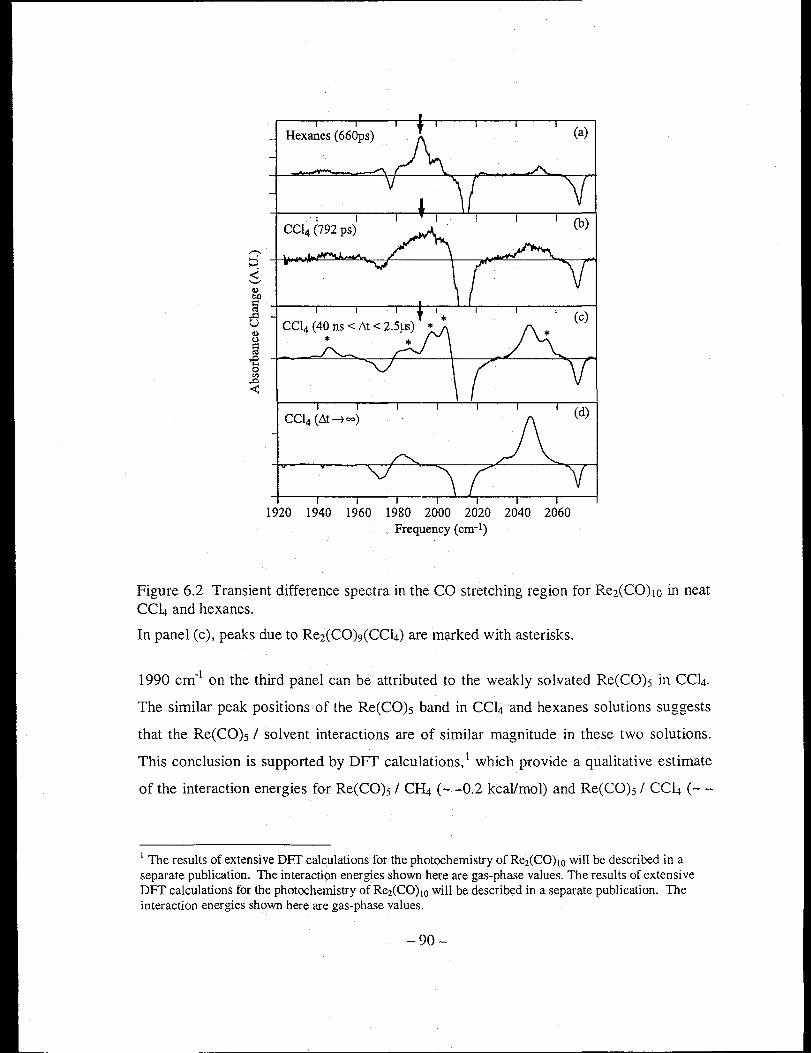
Hexanes (66Ops)
. I I CCl4 (792 ps)
1920 1940 1960 1980 2000 2020 2040 2060 Frequency (cm-l)
(a)
(c)
Figure 6.2 Transient difference spectra in the CO stretching region for Re2(CO)lO in neat CC4 and hexanes.
In panel (c), peaks due to Re2(CO)9(CC4) are marked with asterisks.
1990 cm- I on the third panel can be attributed to the weakly solvated Re(CO)5 in CC4.
The similar peak positions of the Re(CO)s band in CCl4 and hexanes solutions suggests
that the Re(CO)s / solvent interactions are of similar magnitude in these two solutions.
This conclusion is supported by DFT calculations,l which provide a qualitative estimate
of the interaction energies for Re(CO)s / CH4 (- -0.2 kcal/mol) and Re(CO)5 / CC4 (- -
1 The results of extensive DFf calculations for the photochemistry of Re2(CO)10 will be described in a separate publication. The interaction energies shown here are gas-phase values. The results of extensive DFf calculations for the photochemistry of Re2(CO)lO will be described in a separate publication. The interaction energies shown here are gas-phase values.
-90-

0.6 kcaVmol).! Furthermore, the calculated weak interaction energy indicates that the
mean thermal energy - 0.6 kcaVmol at the room temperature is sufficient to disrupt the
formation of a stable complex of the form Re(CO)s. .. (solvent). In other words, a
dynamic equilibrium is established for Re(CO)s. .. (solvent) f-7 Re(CO)s + solvent [10],
the time scale of which is on the order of collision in liquids (- few ps). This allows the
chemically active Re center to undergo recombination reaction with another Re(CO)s
radical to reform the parent Re2(CO)1O molecule. As will be shown later, the
aforementioned processes in general occur on time scale orders of magnitude faster than
that of the C-CI bond activation step, which is in the nanosecond regime.
(a) CC14
2071 em-!
-0.25
(b) Hexanes 2071 em-!
o 0
-0.75
-1~-----.----~-----.-----'-----'r---~
o 100 200 300 400 500 600
Time Delay (ps)
Figure 6.3 Fits of ultrafast kinetics to a diffusion model.
1 The structures of these adducts are similar to those of the corresponding transition states (cf. Figure 6.4); the C-Cl ... Re atoms assume a linear arrangement in the adducts.
-91-
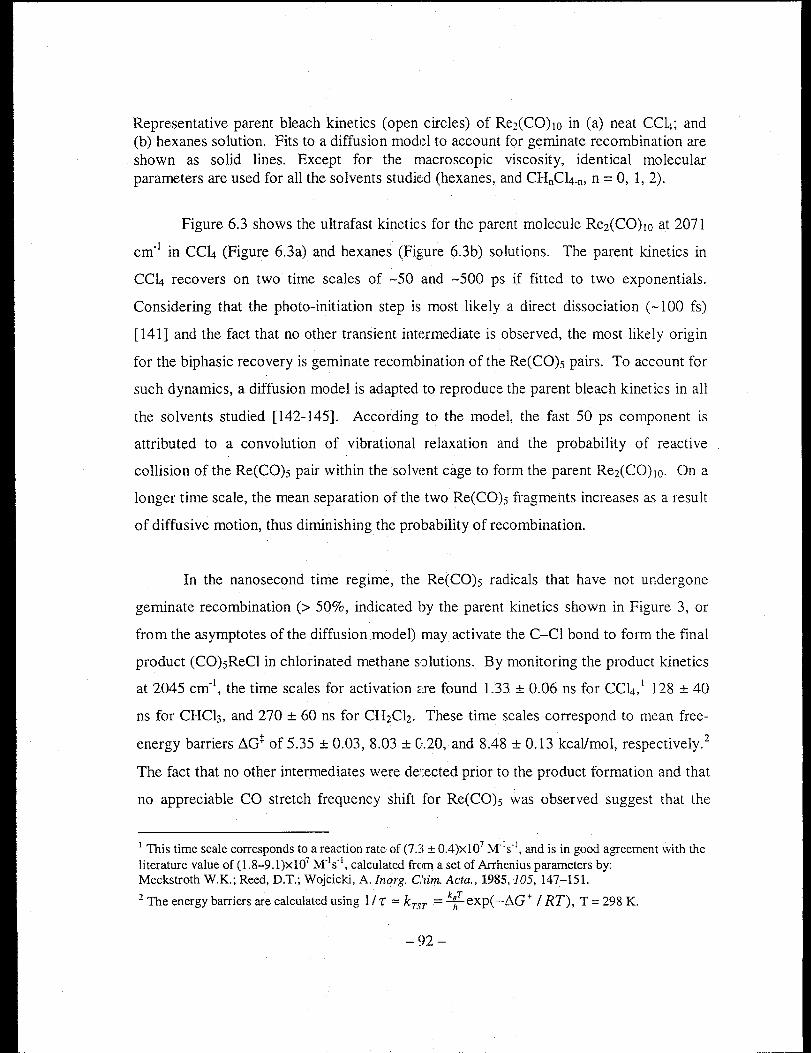
Representative parent bleach kinetics (open circles) of Re2(CO)1O in (a) neat CC4; and (b) hexanes solution. Fits to a diffusion model to account for geminate recombination are shown as solid lines. Except for the macroscopic viscosity, identical molecular parameters are used for all the solvents studied (hexanes, and CHnCI4-n, n = 0, 1, 2).
Figure 6.3 shows the ultrafast kinetics for the parent molecule Re2(CO)1O at 2071
cm-1 in CCl4 (Figure 6.3a) and hexanes (Figure 6.3b) solutions. The parent kinetics in
CC4 recovers on two time scales of -50 and -500 ps if fitted to two exponentials.
Considering that the photo-initiation step is most likely a direct dissociation (-100 fs)
[141] and the fact that no other transient intermediate is observed, the most likely origin
for the biphasic recovery is geminate recombination of the Re(CO)s pairs. To account for
such dynamics, a diffusion model is adapted to reproduce the parent bleach kinetics in all
the solvents studied [142-145]. According to the model, the fast 50 ps component is
attributed to a convolution of vibrational relaxation and the probability of reactive
collision of the Re(CO)s pair within the solvent cage to form the parent Re2(CO)IO. On a
longer time scale, the mean separation of the two Re(CO)s fragments increases as a result
of diffusive motion, thus diminishing the probability of recombination.
In the nanosecond time regime, the Re(CO)5 radicals that have not undergone
geminate recombination (> 50%, indicated by the parent kinetics shown in Figure 3, or
from the asymptotes of the diffusion model) may activate the C-CI bond to form the final
product (CO)5ReCI in chlorinated methane solutions. By monitoring the product kinetics
at 2045 em-I, the time scales for activation are found 1.33 ± 0.06 ns for CC14 ,1 128 ± 40
ns for CHCh, and 270 ± 60 ns for CH2Ch. These time scales correspond to mean free
energy barriers ~G* of 5.35 ± 0.03, 8.03 ± 0.20, and 8.48 ± 0.13 kcaVmol, respectively.2
The fact that no other intermediates were detected prior to the product formation and that
no appreciable CO stretch frequency shift for Re(CO)s was observed suggest that the
1 This time scale corresponds to a reaction rate of (7.3 ± 0.4)x107 M'ls-l, and is in good agreement with the literature value of (1.8-9.1)x107 M-1s-1, calculated from a set of Arrhenius parameters by: Meckstroth W.K.; Reed, D.T.; Wojcicki, A.lnorg. Chim Acta., 1985, 105, 147-151.
2 The energy barriers are calculated using 1/ 'r :::: kTST = k{ exp( -6,.G+ / RT), T = 298 K.
-92-
reaction involve only the rate-limiting Cl-atom transfer step without the 19-e- nor the
charge-transfer intermediates.
To better understand the reactivity, the transition states for the series of reactions
were studied using DFf methods. As illustrated in Figure 6.4, the results show that each
transition state-obtained by locating the saddle point of the multidimensional potential
energy surface of the systern--can be characterized by a single imaginary frequency that
involves simultaneous dissociation of the C-CI bond and formation of the Re-Cl bond.
The structural variation along the series of chlorinated methanes suggests that the
transition state becomes more product-like as the number of hydrogen n in CHnCI4_n
increases. For example, the Re ... Cl distance in (CO)sRe ... Cl...CHnCh_n decreases
monotonically from 2.95 A (n = 0) to 2.84 A (n = 1) to 2.76 A (n = 2), and to 2.52 A for
the final the product (CO)sRe-Cl. The calculated energy barriers LlEo~ in CCI4, CHCh,
and CH2Ch are respectively 0.86, 3.0, and 8.5 kcal/mol, where the solvent effects are
treated self-consistently in the reaction-field approximation. The current level of theory,
however, does not permit an immediate comparison of the experimental energy barriers
to the calculated values. Nonetheless, comparison of the experimental trend and the
qualitative trend from the theoretical calculations along the series of chloromethane
provides greater insight in understanding the reactivity. The observed trends in the
barrier and the transition-state structure are in agreement with Hammond's postulate
[146], which associates a later transition state with a higher energy barrier.
6.3 Conclusion
In summary, femtosecond IR spectroscopy that allows for direct assessment of the
roles of the transient intermediates during a reaction continues to demonstrate its ability
to elucidate otherwise intricate chemical reaction mechanisms. The present work
provides experimental and theoretical evidence that one-electron oxidative-addition of a
-93 -

CI atom (from chlorinated methanes) to the Re(COh radical does not involve an
appreciable 19-e- intermediate. Nor do the results support the idea of a charge-transfer
TS2 ts-Re(CO)s. .. Cl...CHCI2 (306i em-I)
2~~ 180.0. L~7
TSI ts-Re(CO)s. .. CI...CCI3 (253i em-I)
~ ~'08 2:?6-v2.20 ~ 1.74
179.2·
TS3 ts-Re(CO)s. .. CI...CH2CI
(344i em-I)
Figure 6.4 DFf structures for the final product and transition-state structures.
Geometrical parameters are in A for bond lengths and degree for bond angles. Als0 shown are the imaginary vibrational frequencies associated with each transition state.
intermediate [(CO)5Re+ + -Cl-R] for this reaction. 1 For if this is the case, the positively
charged (COhRe+ will exhibit a substantial Vco shift, which was not observed. With the
above evidence and the fact that no other intermediates were observed, it is suggested
that the reaction be considered as involving only the C-CI bond activation process.
Qualitatively, the observed variation in the reaction rate and DFf transition-state
structure is in agreement with Hammond's postulate. More studies are needed in order to
arrive at a model that is capable of predicting, even qualitatively, the reaction rates from
I There is, however, only a limited extent of charge-transfer character in the calculated transition states (Table I of the supporting material).
-94-
macroscopic parameters such as the strength or electron affinity of the carbon-halogen
bond [147, 148].
-95 -
6.4 Supplementary
6.4.1 Methods
Samples. Dirhenium decacarbonyl Re2(CO)1O (98%) and carbon tetrachloride CCl4
(99.9%, d = 1.589 g/cm3) were purchased from Aldrich, Inc .. Hexanes C6 H14 (99.9%, d =
0.664 g/cm3) , trichloromethane CHCh (99%, d = 1.484 g/cm3) , and dichloromethane
CH2Ch (99.9%, d = 1.3255 g/cm3) were purchased from Fisher Scientific, Inc.. All
chemicals were used without further purification. The sample was enclosed in an air
tight, demountable liquid IR flow cell (Harrick Scientific Corporation). The
concentrations of the Re2(CO)lO solutions were approximately 7 mM in hexanes and 4
mM in chlorine substituted methanes.
Femtosecond infrared spectroscopy. Details of the femtosecond IR (fs-IR)
spectrometer setup have been published elsewhere [149]. In brief, the output of a
Ti:sapphire oscillator was amplified in series of dye amplifiers pumped by a 30-Hz
Nd:YAG laser. The UV and IR beams used to initiate and probe the reaction were
generated through nonlinear crystals. The resulting 295-nm UV photons (with energy of
-6 ~/pulse) were focused into a disk of --200 ~m diameter at the sample to initiate
chemical reactions. The -l-IJJ IR pulses having a temporal full-width-half-maximum of
about 70 fs and a spectral band width of about 200 cm-l were split into a signal and a
reference beam to minimize the shot-to-shot fluctuation and transient heating of the
detector. These two beams were then focused into an astigmatism-corrected
spectrographic monochromator (SpectraPro-150, Acton Research Corp .• 150 grove/mm,
4.0 ~m blazed) to form two spectrally resolved images on a focal-plane-array (FP A)
detector. The two frequency-resolved images were digitized by two windows of 12x200
pixels, which allowed simultaneous normalization of a -70 cm-l spectrum. The
censoring chip of the detector was an engineer grade, 256x256-element HgCdTe (MCT)
-96-
matrix of dimensions 1.28x1.28 cm2 (or SOxSO Jlm2 per pixel). During the course of an
experiment, the censoring chip and its immediate circuits were kept in contact with a 4-L
liquid nitrogen dewar to increase its sensitivity in the IR range. The long-time
temperature drift was minimized by normalizing the gain against the FP A readouts from
a small region far away from the illuminated area. Rejection of bad laser shots further
improved the SIN ratio. With a data acceptance ratio of about O.S and a 30-Hz laser
repetition rate, it took about 1 minute to acquire signals on the order of 1 % absorbance
change with 1 0: 1 SIN ratio after signal averaging for 1000 valid laser shots. The typical
spectral and temporal resolution for this setup were -4 cm-1 and -300 fs, respectively.
The polarizations of the pump and the probe pulse were set at the magic angle (S4.7°) to
ensure that all signals were due to population dynamics. All kinetic data have been
corrected for a positive chirp of -1.4 fs/cm- 1, measured from pump-probe cross
correlation using a silicon wafer. A broad, wavelength independent background signal
from CaF2 windows has also been subtracted from the transient spectra and kinetic traces.
Nanosecond step-scan FTIR. Measurements. were made using a Step-Scan FTIR
spectrometer described elsewhere [ISO]. The instrument was based on a Bruker IFS-88
FTIR with a special scanner module to allow step-scanning. An InSb detector with a 40-
ns temporal full-width-half-maximum (FWHM) measured from the IR scatter of 1064-
nm light from a Y AG laser was used. The IR light was focused in the cavity with two
lO-mm focal length BaF2 lenses, which gave beam sizes smaller than comparable curved
mirrors, allowing increased IR throughput and less sample degradation. The sample was
photo-excited with 10-ns pulses from the second harmonic of a dye laser tuned to S90
nm.
Theoretical. In this communication, the gas-phase interaction energies for the metal
fragment / solvent molecule pairs Re(COh / Cf4 and Re(CO)s / CCl4 are reported. For
the Cl-atom abstraction reaction, we compute the system (CO)sRe .. . CHnC4-n (n = 0, 1,
2) at three critical stages along the reaction coordinate: the precursor complex, the
-97 -
transition state, and the final product. In computing the reactive system, the solvent
effects are treated self-consistently in the reaction-field approximation. The exchange
correlation functional employed "in our density functional theoretical (DIT) calculations
was Becke's three-parameter hybrid functional [151] combined with the Lee-Yang-Pai-r
correlation functional [152], commonly denoted as B3LYP [153]. This functional has
been shown to give very good results for transition metal complexes [154, 155]. Except
for complexes with apparent symmetry, no constraint was imposed during geometry
optimization. To make certain that a proper energy extremum-obtained by locating the
local extremum that has a positive second energy derivative with respect to geometry
change-had been located each geometry optimization was followed by a frequency
calculation at the same level of theory. Two basis sets were used in the calculations.
Basis set I consisted of the 6-31G basis functions for H, C, 0, and CI atoms [156, 157],
and the Los Alamos Effective Core Potential (ECP) for Re with the outer-most core
orbitals included in the valence description (ECP+5s5p6s5d6p) [158]. Basis set II
augmented basis set I by placing polarization functions on all atoms except Re. The
smaller basis set I was used for geometry optimization of the ax- and eq
Re2(CO)9(solvent) complexes. All other complexes were optimized using basis set II. It
is well known that it is difficult to obtain a consistent and accurate estimate of the basis
set superposition error (BSSE) along the course of a chemical reaction [159]. Similar
difficulty was also experienced in the course of this work. Therefore, in order to describe
the potential energy surface in a consistent way, the binding energy ~E for a complex XY
was referenced against the energy of an optimized supramolecular configuration where
the X and Y fragments were held at lOA. apart. The ~Eo t reported in the article were
corrected for the zero-point energy at 298 K. The commercial JAGUAR package was
used for the DFf calculations [160].
6.4.2 Diffusion Modelfor Geminate Recombination of Re(CO)J Radicals.
-98 -
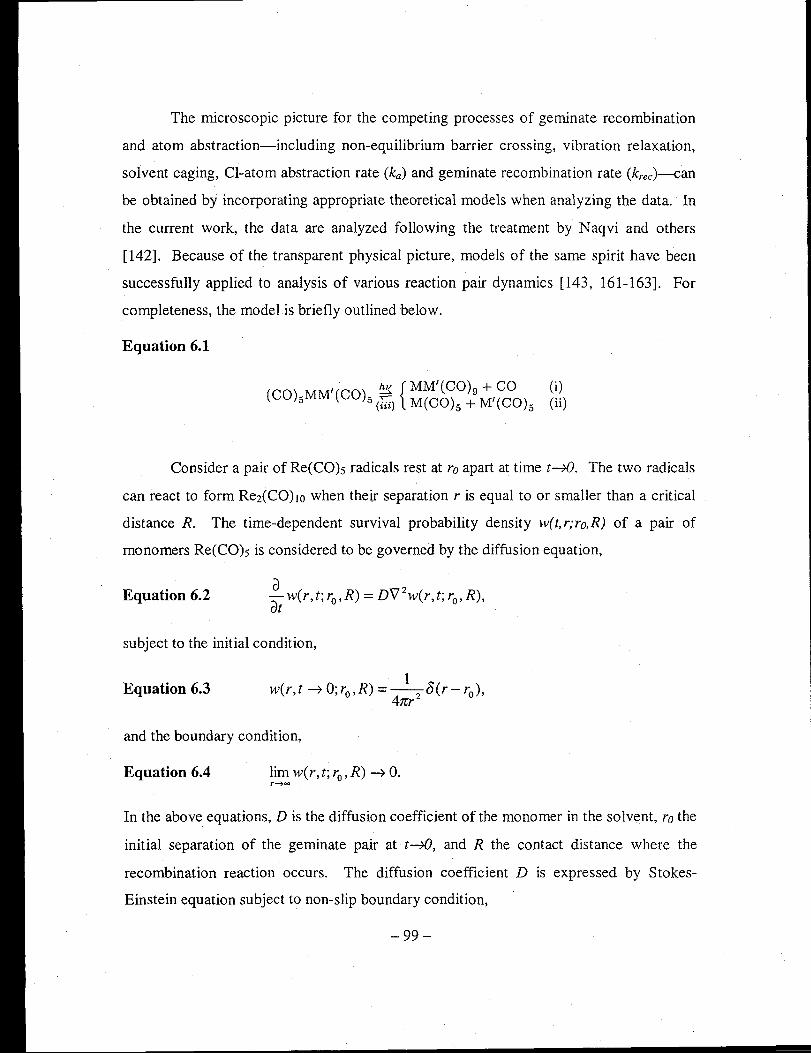
The microscopic picture for the competing processes of geminate recombination
and atom abstraction-including non-equilibrium barrier crossing, vibration relaxation,
solvent caging, Cl-atom abstraction rate (ka) and geminate recombination rate (krec)--can
be obtained by incorporating appropriate theoretical models when analyzing the data. In
the current work, the data are analyzed following the treatment by Naqvi and others
[142]. Because of the transparent physical picture, models of the same spirit have been
successfully applied to analysis of various reaction pair dynamics [143, 161-163]. For
completeness, the model is briefly outlined below.
Equation 6.1
I !!:!{ {MM'(CO)g + CO (i) (COhMM (CO)5 (iii) M(COh + M'(C0>S (ii)
Consider a pair of Re(CO)s radicals rest at ro apart at time t-70. The two radicals
can react to form Re2(CO)1O when their separation r is equal to or smaller than a critical
distance R. The time-dependent survival probability density w(t,r;ro,R) of a pair of
monomers Re(CO)s is considered to be governed by the diffusion equation,
Equation 6.2
subject to the initial condition,
Equation 6.3
and the boundary condition,
Equation 6.4 lim w(r,t;ro,R) ~ o. r~~
In the above equations, D is the diffusion coefficient of the monomer in the solvent, ro the
initial separation of the geminate pair at t-70, and R the contact distance where the
recombination reaction occurs. The diffusion coefficient D is expressed by Stokes
Einstein equation subject to non-slip boundary condition,
-99-

Equation 6.5
where T] is the macroscopic viscosity of the solvent, and a the hydrodynamic radius of the
solute. In this study, we assume a = R. To account for the finite recombination rate, an
additional boundary condition at r = R is imposed,
Equation 6.6 a
D at w(r,t;rO,R)r=R =bw(r,t;ro,R).
Known as the "radiation boundary condition," Equation 6.6 states that the recombination
rate is proportional to the concentration gradient at the contact distance R. The solution
to Equation 6.2 has been explicitly worked out and is given by [164],
Equation 6.7
w(r,t;ro,R) = ~{exp~(r-'ro)2 14Dt]+exp[-(r+ro -2R)2 14Dr] 81CroR reDt
- 2B.JreDt exp[B2 Dt + B(r + ro - 2R) ]erfc[B.JDt + (r -"0) I 2.J Dr]}
where B == biD + 1 I Rand erfc is the complementary error function given by
erfc(x) = .k [ du exp( -u 2). The relation of the proportionality b in Equation 6.6 to the
recombination rate constant can be expressed by,
Equation 6.8
Thus, the time-dependent concentration of the monomer Re(CO)s is given by,
Equation 6.9
Similarly, the instantaneous probability for formation of the parent molecule is,
Equation 6.10
When the model is applied to analysis of the parent bleach recovery, the accumulating
parent molecules are accounted for by integration of Equation 6.10 over time,
-100-
Equation 6.11 pet; ro' R) = f~ dt' p(t'; ro' R).
In the above model, the initial condition implies that the time scale of dissociation
is much shorter than that of subsequent geminate-recombination. This assumption is
justified in view of the similarity in the electronic structure of M2(CO)1O CM = Mn, Re)
and a recent experiment on the photo dissociation of Mn2CCO)!O, which shows that the
time scale of Mn-Mn bond cleavage is on the order of 100 fs [141]. To apply the model
to Equation 6.1, let Qi and Qii denote the fraction of parent molecules that dissociate via
pathways (i) and (ii), respectively. It is assumed that all the excited parent molecules
dissociate following either pathway (i) or (ii) only; in other words, Qi + Q;i = 1. Due to
solvation of Re2(CO)9 in pathway (i), geminate recombination of CO and Re2CCO)9 dose
not contribute appreciably to the reformation of the parent molecule. Photofragments
generated via pathway Cii) are therefore the main source for geminate recombination.
The model is further simplified by assuming that a single rate constant krec describes
vibrational cooling, non-dissociative energy relaxation, and primary geminate
recombination. In this way, the normalized parent bleach signal can be written as,
Equation 6.12 I parent (t) = QJ-l + PCt; ro, R)]- Qi = -1 + Qii X PCt; ro, R).
The physical parameters needed for the analysis of the experimental data are: the
branching ratio Qii, the solvent viscosity 77, the contact distance R, the initial separation
ro, and the recombination rate constant krec. The contact distance R is assigned as twice
of the distance from the center of Re-Re bond to the center of the axial Re-C-O line.
Similar treatments have been employed in the analysis of geminate pair dynamics of
disulfides [143, 144]. Using the crystallographic data of Re2(CO)!O [145], R is estimated
to be 6.256 A. To verify this estimate, the DFf geometry for the Re(CO)s radical, and
the Lennard-Jones parameters for the C and 0 atoms are used to construct a Lennard
Jones Re(CO)s molecule suitable for classical molecular simulation [165]. The contact
-101-

distance in this approach is defined as the diameter of a sphere that encloses the Lennard
Jones Re(CO)s. This procedure gives a contact distance of 6.209 A, consistent with the
first estimate.
For the reaction in CCl4 solution (712o oc = 0.97 cp), the product kinetics and parent
bleach signal of are fitted simultaneously since they draw from the same Re(CO)s source.
Three processes are considered to contribute to the observed product kinetics: vibrational
cooling, non-equilibrium barrier crossing to form the product, and equilibrium barrier
crossing. Incorporating these ideas, the normalized product signal is described as,
Equation 6.13
I product (t) = AVib exp( -t / "Cvib ) + Aneq (1- exp( -t / "C neq) + S; dt' kaM (t'; ro, R).
The first term of Equation 6.13 describes the relaxation of overlapped low-frequency
modes; the second term models the non-equilibrium product formation with a
phenomenological rise time "Cneq; and the last term relates the time-dependent Re(CO)s
concentration M(t';ro,R) from Equation 6.9 to the macroscopic, pseudo first-order rate
constant ka • To account for the non-equilibrium barrier crossing in the CC4 case, the
normalized parent signal in Equation 6.12 becomes,
Equation 6.14 I parent (t) = -1 + (1- Aneq) X Qu X pet; ro ' R).
With R fixed (= 6.256 A) and Qjj (= 0.8) obtained from experiments, the recombination
rate is found to be krec = (1.0 ± 0.2)x1011 M-1s-1, greater than the literature value measured
in CH3CN, (1.0 ± 0.2) x10 IO M-1s-1 [166]. This is not surprising since in the current
simplified model, a single parameter krec is used to encompass all fast dynamics such as
non-dissociative energy relaxation and primary geminate-recombination. The initial
separation of the two Re(CO)s monomers was found to be ro = 8.6 ± 0.2 A, about 2.3 A away from their contact distance. The Cl-atom abstraction rate ka = (7.5 ± OA)XI08
S-l
((7.3 ± 0.4)xl07 M-1s-1) is in very good agreement with the literature value, which is
calculated to be (1.8-9.1)xl07 M-1s-1 from a set of Arrhenius parameters:
-102-

k = Aexp(- :1-), with A = (2.8 ± 0.5)xIQ9 M-1s-1 and Ea = 2.5 ± 0.4 kcallmol in ethanol
[167]. The time constant for the fast rise of product kinetics 1:neq is found to be 2.3 ± 0.9
ps, with an amplitude Aneq = 0.10 ± 0.01. That is, about 10% of the product was produced
through non-equilibrium barrier crossing. Finally, the hot band intensity AVib is found to
be 0.13 ± 0.01 with a vibrational-cooling time 1:vib = 35 ± 14 ps. The resulting traces for
the product and parent kinetics are plotted on top of the experimental data displayed in
Figure 6.5.
Application of the above model to the other solvents, CHCh (1120 ·c = 0.58 cp),
CH2Ch (7]20°C = 0.45 cp), and hexane (7]20 °C = 0.33 cp) demonstrates that the model
captures the essential physics underlying the dynamics of the Re(COh monomers. Note
that except for the bulk viscosity, all the parameters used in these plots are identical to
those obtained from modeling of Re2(COho / CC4,
Table 6.1. Summary of Electron-Population Analysis for the Re and Cl Centers Involved in the Reaction of Cl-Atom Abstraction by the Re(CO)5 Radical.
Complexes Mulliken Charge Atomic Center Re Cia
Transition State ts-(CO)5Re .. . Cl.. .CCI3 -0.222 -0.025 tS-(CO)5Re ... C! ... CHCI2 -0.244 -0.0925 tS-(CO)5Re . .. Cl ... CH2Cl -0.264 -0.144 Product (CO)5ReCl -0.321 -0.209
a Mulliken charge population for a Cl atom in CCI4 is +0.090 e-. b Natural charge population for a Cl atom in CC4 is +0.068 e-.
-103 -
Natural Charge Re Clb
-0.481 -0.168 -0.496 -0.260 -0.508 -0.331
-0.567 -0.477

0.4 (a) Re(CO)sCVCC4 2045 em-!
0.3
0.2 0.
0.1 Q)
b.O 0 ::: " ....... -.
til ,..!:l
2071 em·!
U
0.
2071 em-!
0 0.- - - - - - -
0 0 0. 0. 0.
2071 em·!
-0.5 0 0 0 0 -0. - - -
-1~~~,-~~,,~~-.~~-,~~~~~-i
o 100 200 300 400 500 600 Time Delay (Ps)
Figure 6.5 Detailed fitting of ultrafast kinetics to a diffusion model.
Overlays of the diffusion model (solid lines) for geminate-recombination dynamics and experimental data (open circles). (a) The kinetic trace of the product Re(CO)5CI (2045 cm-1
) in neat CC4 solution. The dashed line is the fit to the rise of the product band and the dash-dot line describes the decay of vibration ally excited CO bands. The parent (Re2(CO)IO, 2071 cm-I
) kinetic traces in CCI4, CHCl) , and CH2Clz are displayed in (b), (c), and (d). The dotted lines indicate the asymptotic values of the diffusion model.
-104-

2080 O~-r~~~~~~rr~~-r~~~~~~
-0.5 o 0.5 1 1.5 2 2.5
Time Delay (J.ls)
Figure 6.6 Nanosecond kinetics of Cl-atom abstraction reaction.
Nanosecond kinetics for Re(CO)5CI in CHCb and CH2Ch taken at the 2045 cm-I. Inserts: The top panel is an ultrafast IR spectrum recorded at 660-ps delay showing a single band due to eq-Re2(CO)9(solvent); the bottom panel is a nanosecond spectrum averaged over 1-2.5 J.ls- The down-pointing arrow indicates where the product band should be. On each nanosecond spectrum, the nonacarbonyl band (-2055 em-I) overlaps with the product band (-2045 cm-I
) in this spectral region, such that the two bands coalesce into one broader band.
-105 -
7 CONCLUSION
Our understanding for the reactivity of complex chemical systems such as
organometallic compounds has greatly advanced in the past decade owing to the vast
development of experimental and computational techniques. Basic principles born of
these collective efforts have guided the thinking of reactions in fields including
chemistry, biological sciences, and material sciences. Yet, the critical examination of the
postulates in the realistic solution phase has been a daunting challenge due to the intricate
liquid dynamics, which render the relevant: time scales to spreading several orders of
magnitude. Femtosecond infrared spectroscopy, which is capable of "real-time"
observation and characterization of a chemical reaction, has been utilized to follow
oxidative-addition reactions of prototypical two-electron C-H and Si-H bonds, and one
electron CI atom to organometallic complexes. This technique affords the description of
not only the static reaction mechanism but also the dynamics of each elementary step,
including vibrational cooling, geminate-pair recombination, morphologic reorganization,
solvation-assisted intersystem crossing, and solvent rearrangement.
The approach described in this work may offer the prospect of providing new
perspectives for reactions, the relevant dynamics of which take place on the ultrafast time
scale. For example, a photochemical reaction such as those discussed in Chapters 4 and 5
can easily span several orders of magnitude in time from its initiation to completion, as
results of the intricate dynamic processes in solution. Following photo-excitation, the
reaction may begin with a dynamic partitioning in the dissociative excited state that, on
the -100 fs timescale, leads to reactive intermediates such as 115 -CpMn(CO)2 in either the
singlet or triplet spin states. The nascent singlet 115 -CpM(COh may interact either with
the chemically inert ethyl site of Et3SiH to form the ethyl solvated
115 -CpM(CO)2(Et3SiH), or with the reactive Si-H bond to form the final product. Under
-106-

the dynamic influence of the solvent bath, the weakly coupled ethyl-solvate together with
the surrounding solvent shell may undergo various reorganization until the metal center
encounters a reactive Si-H bond to complete the reaction. The timescale of such a
procession, ranging from hundreds of picoseconds to a few microseconds, is expected to
depend upon the specific metal-alkane interactions, the number of active sites in a solvent
molecule, and steric interactions. Therefore, the macroscopic reaction rate is determined
by the rearrangement process, which sets the time scales for the two solvation-partitioned
product-formation pathways 3 decades apart.
Metal-solvent Complexation
&r
Figure 7.1 An illustration for solvation / spin crossover process.
Another important aspect brought to light by the aforementioned study is the
realization of the dynamics of a high-spin, 16-electron transition-metal center in two
electron oxidative-addition reaction. As noted earlier, transition metal mediated reactions
normally occur at an unsaturated metal center that may potentially exist in more than one
spin state. Conventional thinking advises that if such a reaction begins with an S ;::: 0
metal center, for example, the system will follow a reaction coordinate in the same
electron-spin manifold. This thinking, together with the prevailing postulate that most
- 107-

organometallic reactions can be understood by invoking 16- or IS-electron intermediates
or transition states [168], has been influential in describing a reaction mechanism. It is
not until recently that the importance of spin-state changes in the reactivity of unsaturated
transition metal complexes has been recognized [169, 170]. For instance, a recent study
by Bengali, Bergman, and Moore shows that photogenerated 115 -CpCo(CO) or
115 -Cp*Co(CO) do not form stable adducts with alkanes or rare-gas atoms (Xe, Kr) but
react readily with CO molecules at a diffusion-limited rate [105]. Utilizing both DFf and
ab initio computational methods, Siegbahn later attributed these observations to an
115 -CpCo(CO) species in the ground triplet manifold. The triplet 115 -CpCo(CO) then
undergoes a rapid spin-flip to form the singlet 115 -CpCo(COh under the influence of an
incoming CO, but not when the incoming ligand is a weaker-binding alkane molecule
[106, 171, 172]. Ultrafast infrared studies by Dougherty and Heilweil show that
115-CpCo(CO) reacts very quickly (faster than vibrational cooling time) with the strongly
binding ligand I-hexene to form presumably a singlet 1t-complex, in which a I-hexene
molecule complexes to the Co metal through its C=C double bond [120]. A similar
reactivity has also been observed in the reaction of CO and N2 with triplet
113_Tpi-Pr.MeCo(CO) (Tpi-Pr.Me = HB_pz/Pr.Me, pzi-Pr.Me = 3-iso-propyl-5-methylpyrazolyl)
[130] or 115 -Cp*MoCI(PMe3) [173, 174], in the oxidative-addition of benzene or aldehyde
C-H bonds to unsaturated 115 -Cp*CO(112 -H2C=CHSiMe3) [175-177], and most recently in
the silane Si-H bond activation by 115-CpV(CO)4 [178]. In view of the above examples.
it would seem that a stronger metal:·ligand interaction tends to facilitate a high-spin to
low-spin crossover in an organometallic compound. Although such an intemwlecular
process can be qualitatively described by Figure 7.1, substantial efforts will be required.
both in experiments and in theoretical development, to reach the same level of
understanding as intramolecular intersystem crossing [179]. The unique information
provided by ultrafast infrared spectroscopy, which includes the dynamics of IVR and
those of molecular morphology-change, is expected to be crucial in the future
developments.
-108 -

Finally, the explicit reaction scheme composed of elementary steps allows an
experimental assessment for the current understanding of the reactivity. For C-H and Si
R bond activation, the present results corroborate the prevailing picture of the reactivity.
For Cl-atom abstraction by the Re(CO)5 radical, however, the present results call for re
examination of the notion of a 19-electron species or a charge-transfer complex as
reactive intermediates. In addition, in each of the reactions discussed the rate
determining process has been determined to be the bond-breaking step for C-H
activation, solvent rearrangement for Si-H activation [180], and atom-transfer step for eCI activation. They represent three stereotypical rate-limiting steps that are expected to
be common to solution-phase reactions. More examples are anticipated to emerge as
more efforts are devoted to the study of complicated chemical processes, which, in time,
will better our picture of reactions in liquids.
-109-
8 ApPENDICES
8.1 Example Input Files for the Quantum Chemical Calculation Package GAMESS
8.1.1 The Input File for Calculating the CASSCF-PT2 Energy of the Singlet
CpMn(COh
The input file included in this section demonstrates the use of GAMESS to
calculate the CASSCF energy to the second order of many-particle perturbation. One
firstly calculates the ROHF wavefunction with the necessary localization directives as
documented in the calculation logs. The localization of the Hartree-Fock orbitals is
necessary for the CASSCF wavefunctions to converge successfully. The ordering of the
localized HF wavefunctions may not necessarily be in the same order as how the activate
space is constructed. As such, reordering of the HF orbitals is often necessary. The bold
faced line illustrates the use of reordering directives to construct the desired active space,
which, in this case, comprise of 5 occupiedd-orbitals of Mn and 5 d-type virtual orbitals.
The converged CASSCF wavefunction is then attached to end of this input file (omitted
here due to length considerations). Note that some of the directives may have changed in
the latest version of GAMESS, which is capable of performing parallel computations
among a cluster of UNIX workstations.
CpMn(CO) 2
July 3D, 1997 First attempt to perform a CASSCF calculation on B3L"YP optimized
singlet geometry. 1. The first run is to generate ROHF orbitals for future MCSCF
runs. 2. Then use this ROHF as initial guess to calculate MP2 energy.
- 110-
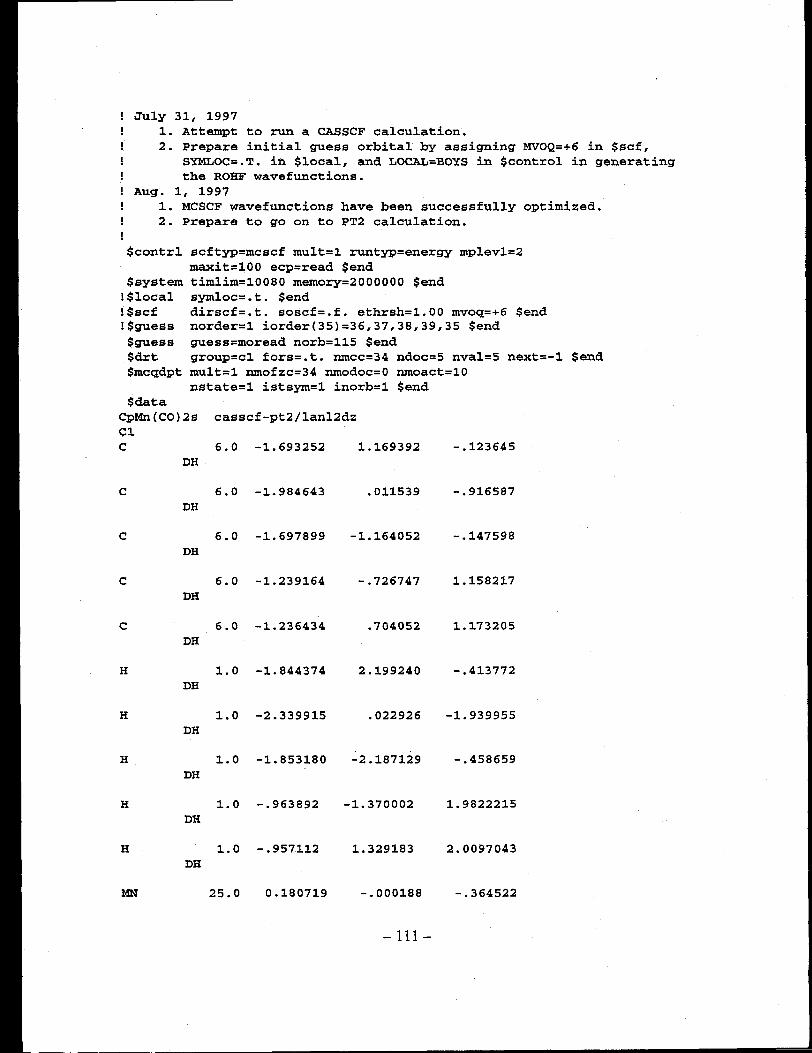
July 31, 1997 1. Attempt to run a CASSCF calculation. 2. Prepare initial guess orbital by assigning MVOQ=+6 in $scf,
SYMLOC=.T. in $local, and LOCAL=BOYS in $control in generating the ROHF wavefunctions.
Aug. 1, 1997 1. MCSCF wavefunctions have been successfully optimized. 2. Prepare to go on to PT2 calculation.
$contrl scftyp=mcscf mult=l runtyp=energy mplevl=2 maxit=100 ecp=read Send
$system timlim=10080 memory=2000000 $end !$local symloc=.t. $end !$scf dirscf=.t. soscf=.f. ethrsh=1.00 mvoq=+6 $end !$guess norder=l iorder(35)=36,37,38,39,35 $end $guess guess=moread norb=115 $end $drt group=c1 fors=.t. nmcc=34 ndoc=5 nval=5 next=-1 $end $mcqdpt mult=1 nmofzc=34 nmodoc=O nmoact=10
nstate=l istsym=l inorb=l Send $data
CpMn(CO)2s casscf-pt2/lanl2dz C1 C 6.0 -1.693252 1.169392
DH
C 6.0 -1.984643 .011539 DH
C 6.0 -1.697899 -1.164052 DH
C 6.0 -1.239164 -.726747 DH
C 6.0 -1. 236434 .704052 DH
H 1. 0 -1. 844374 2.199240 DH
H 1.0 -2.339915 .022926 DH
H 1. 0 -1. 853180 -2.187129 DH
H 1. 0 -.963892 -1. 370002 DH
H 1.0 -.957112 1. 329183 DH
MN 25.0 0.180719 -.000188
-111-
-.123645
-.916587
-.147598
1.158217
1.173205
- .413772
-1. 939955
-.458659
1. 9822215
2.0097043
-.364522
S 4 1 5.91400000 -0.37645080 2 1. 60500000 0.77247890 3 0.62600000 0.47693460 4 0.11150000 0.00000000
S 4 1 5.91400000 0.21199660 2 1.60500000 -0.51994720 3 0.62600000 -0.58576810 4 0.11150000 1.10039640
S 1 1 0.03800000 1. 00000000
P 3 1 18.20000000 -0.04479010 2 2.14100000 0.62603110 3 0.70090000 0.46963290
P 1 1 0.06900000 1. 00000000
P 1 1 0.02100000 1. 00000000
D 4 1 32.27000000 0.03415800 2 8.87500000 0.17611050 3 2.89000000 0.43942980 4 0.87610000 0.59432710
D 1 1 0.21200000 1.00000000
C 6.0 1.358411 1. 318936 -.072387 DH
C 6.0 1.361026 -1. 316648 -.072009 DH
0 8.0 2.137299 2.191364 .120822 DH
0 8.0 2.141728 -2.187407 .121470 DH
Send Seep
C-ECP NONE C-ECP C-ECP C-ECP C-ECP H-ECP NONE H-ECP H-ECP H-ECP H-ECP MN-ECP GEN 10 2
-112 -
3 ----- d potential -10.00000000 1 357.39144690 -60.29902870 2 64.64773890 -10.42178340 2 16.09608330
5 ----- s-d potential 3.00000000
16.25918190 276.93739280 241. 31743420
-146.46353290 5 ----- p-d
5.00000000 5.75897560
285.29186540 143.42226470 -88.70318510
C-ECP C-ECP O-ECP NONE O-ECP
$ end
0 107.41272150 1 111.49589730 2 46.55683460 2 8.36881350 2 7.72374890 potential 0 80.04151030 1 105.60436460 2 40.83004660 2 8.00984570 2 7.33909280
--- OPTIMIZED MCSCF MO-S --- GENERATED AT Fri Aug 1 21:19:28 1997 CpMn{CO)2s E(MCSCF)=
$VEC
$END
casscf/lan12dz -520.7473086024, 10 ITERS, E(NUC)= 566.5208747026
8.1.2 The Input File for Calculating the CASSCF-PT2 Energy of the Triplet
CpMn(CO)z.
The procedure is the same as described in the previous section, only that both the
$data and $ecp segments are omitted.
CpMn(CO} 2
July 30, 1997 First attempt to perform a CASSCF calculation on B3LYP optimized
triplet geometry. 1. The first run is to generate ROHF orbitals for future MCSCF
runs. 2. Then use this ROHF as initial guess to calculate MP2 energy.
July 31, 1997 1. Attempt to run a CASSCF calculation.
-113 -

Aug. 1, 1997 1. Another attempt to do a CASSCF calculation by re-ordering the
virtual orbitals. Aug. 6, 1997
MCSCF converged. Submit a PT2 calculation.
$contrl scftyp=rncscf rnult=3 runtyp=energy rnaxit=100 ecp=read Send
$system tirnlirn=10080 rnemory=4000000 Send !$scf dirscf=.t. soscf=.f. ethrsh=1.00
guess=rnoread norb=115 Send
rnplevl=2
Send $guess $drt $rncqdpt
group=c1 fors=.t. nrncc=34 ndoc=4 nalp=2 nval=4 next=-l Send nrnofzc=34 nrnodoc=O nrnoact=10
$data
$ end $ecp
Send
nstate=l istsyrn=l inorb=O Send
--- OPTIMIZED MCSCF MO-S --- GENERATED AT Wed Aug 6 17:39:46 1997 CpMn(CO)2t casscf/lan12dz E(MCSCF)= -520.7536532526, 44 ITERS, E(NUC)= 566.5208747026
$vec
$ end
8.2 Quantitative Considerations of the Triplet-Singlet Intersystem Crossing in
Coordinatively Unsaturated Organometallic Compounds
In Chapter 5, a concerted spin cross over / solvation process (cf. Figure 7.1) has
been proposed to explain the observed reaction dynamics of Si-H bond activation by
CpMn(CO)2. At the time of preparing that report, there was not enough data (only one
data point, in fact) to formulate a quantitative model for such reactions. This section
supplies quantitative and technical aspects in setting up such a modeL
-114-

8.2.1 A Summary a/Theoretical Models
There have been several excellent reviews for the theory of intramolecular
interconversion or electron transfer [179, 181-183]. In summary, such a process can be
considered from viewpoints of, for instance, a one-dimensional reaction coordinate: (i) a
classical model; (ii) a semi-classical model (Landau-Zener coupling); and (iii) a quantum
mechanical model. In (i), the rate can be expressed as
Equation 8.1 kd=vex+ ~;)-where v is the frequency of a pseudo-particle oscillating in the potential energy surface
(PES) defined by the reaction coordinate (cf. the left-hand well of Figure 7.1), and AEcl
is the energy barrier defined by the crossing points of the two PESs. In (ii), the
probability for y~~ transmission is
Equation 8.2
where v is the velocity of the wave packet, ST and Ss are the slopes of the triplet and
singlet surfaces, respectively, and HST is the coupling between the two states (cf. Figure
8.1). The rate for spin crossover is
Equation 8.3
where
Equation 8.4
In (iii), the rate for intersystem crossing is,
Equation 8.5
- 115-

where co is the frequency of the triplet PES of Figure 7.1, H so is the spin-orbital
operator, and GVib is the vibrational overlap of the two states, G\Oib = (lj/ s Ilj/ T ) .
Figure 8.1 Illustraion of Landau-Zener spin crossover.
Following Figure 7.1, the intramolecular triplet-to-singlet spin crossover rate thus
estimated can be viewed as the upper limit for that of solvation-assisted intersystem.
Vibrational analyses of the singlet and triplet CpMn(COh indicate that the most likely
one-dimensional reaction coordinate is the bending motion of the carbonyls. The
corresponding frequency and shift in normal coordinates are identified as -89 cm-I and
3.93, respectively. With the singlet-triplet splitting energy calculated to be -10.9
kcal/mol/ the overlapping factor GVib is found to be -6.7xlO-6 at room temperature.
Finally, one calculates Hso using ab initio methods and finds IHsol-331 em-I. Using
these numbers, Equation 8.5 gives an upper limit of 100 pS-l for spm-crossover rate,
consistent with experimental measurements of 70-90 pS-I. While this estimate lends
quantitative support for the measured dynamics, more data points are definitely needed in
order to formulate a suitable model that includes the solvation process.
8.2.2 The Input Filefor Calculating the Spin-Orbital Coupling Constant of CpMn(COh
Using MCSCF Wave functions
-116-
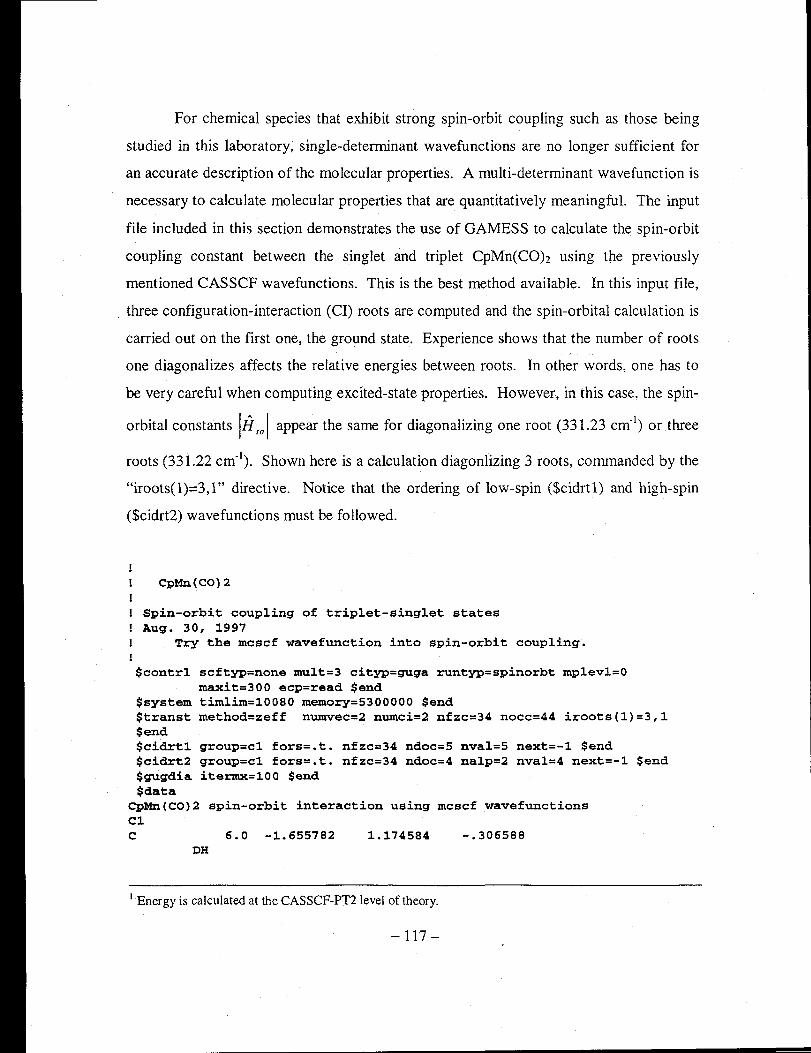
For chemical species that exhibit strong spin-orbit coupling such as those being
studied in this laboratory, single-determinant wavefunctions are no longer sufficient for
an accurate description of the molecular properties. A multi-determinant wavefunction is
necessary to calculate molecular properties that are quantitatively meaningful. The input
file included in this section demonstrates the use of GAMESS to calculate the spin-orbit
coupling constant between the singlet and triplet CpMn(COh using the previously
mentioned CASSCF wavefunctions. This is the best method available. In this input file,
three configuration-interaction (CI) roots are computed and the spin-orbital calculation is
carried out on the first one, the ground state. Experience shows that the number of roots
one diagonalizes affects the relative energies between roots. In other words, one has to
be very careful when computing excited-state properties. However, in this case, the spin-
orbital constants IIi so I appear the same for diagonalizing one root (331.23 cm- l) or three
roots (331.22 cm-\ Shown here is a calculation diagonlizing 3 roots, commanded by the
"iroots(l)==3,l" directive. Notice that the ordering of low-spin ($cidrt 1) and high-spin
($cidrt2) wavefunctions must be followed_
CpMn(CO) 2
Spin-orbit coupling of triplet-singlet states Aug. 30, 1997
Try the mcscf wavefunction into spin-orbit coupling.
$contrl scftyp=none mult=3 cityp=guga runtyp=spinorbt mplevl=O rnaxit=300 ecp=read $end
$system timlim=10080 memory=5300000 $end $transt method=zeff numvec=2 numci=2 nfzc=34 nocc=44 iroots(1)=3,1 $ end $cidrt1 group=c1 fors=.t. nfzc=34 ndoc=5 nval=5 next=-l $end $cidrt2 group=c1 fors=.t. nfzc=34 ndoc=4 nalp=2 nval=4 next=-l $end $gugdia itermx=100 $end $data
CpMn(CO}2 spin-orbit interaction using mcscf wavefunctions C1 C 6.0 -1. 655782 1.174584 -.306588
DH
I Energy is calculated at the CASSCF-PT2Ievel of theory.
-117 -

C 6.0 -1. 706702 .063358 -1.211424 DH
C 6.0 -1.637144 -1.140~~1l - .437748 DH
C 6.0 -1. 600685 -. 773~~41 .965821 DH
C 6.0 -1. 616435 .655976 1.045136 DH
H 1.0 -1. 694780 2.2199H -.581022 DH
H 1.0 -1. 749852 .124S41 -2.290995 DH
H 1.0 -1.665450 -2.149299 -.825587 DH
H 1.0 -1.601322 -1.463l.85 1. 798389 DH
H 1.0 -1. 622683 1. 249S:82 1. 948886 DH
MN 25.0 .250854 .001500 -.001502 S 4
1 5.91400000 -0.37645080 2 1.60500000 0.77247890 3 0.62600000 0.47693460 4 0.11150000 O.OOOOClOOO
S 4 1 5.91400000 0.21199660 2 1. 60500000 -0.51994,720 3 0.62600000 -0.58576810 4 0.11150000 1.10039640
S 1 1 0.03800000 1.0000ClOOO
p 3 1 18.20000000 -0.04479010 2 2.14100000 0.62603110 3 0.70090000 0.46963:290
p 1 1 0.06900000 1.0000ClOOO
p 1 1 0.02100000 1. OOOOClOOO
D 4 1 32.27000000 0.03415800 2 8.87500000 0.176H050 3 2.89000000 0.43942980 4 0.87610000 0.59432710
- 118-
D 1 1 0.21200000 1.00000000
C 6.0 1.407347 1.423265 DH
C 6.0 1.408235 -1.416874 DH
0 8.0 2.153162 2.340154 DH
0 8.0 2.155553 -2.332716 DH
$end $ecp
C-ECP NONE C-ECP C-ECP C-ECP C-ECP H-ECP NONE H-ECP H-ECP H-ECP H-ECP MN-ECP GEN 10 2
3 d potential -10.00000000 1 357.39144690 -60.29902870 -10.42178340
5 ----- s-d 3.00000000
16.25918190 276.93739280 241. 31743420
-146.46353290 5 ----- p-d
5.00000000 5.75897560
285.29186540 143.42226470 -88.70318510
C-ECP C-ECP O-ECP NONE O-ECP
$ end
2 64.64773890 2 16.09608330 potential 0 107.41272150 1 111.49589730 2 46.55683460 2 8.36881350 2 7.72374890 potential 0 80.04151030 1 105.60436460 2 40.83004660 2 8.00984570 2 7.33909280
-.009475
-.009250
-.014617
-.0~4254
--- OPTIMIZED MCSCF MO-S --- GENERATED AT Sat Aug 30 13:49:15 1997 CpMn(CO)2t casscf-pt2/lan12dz singlet fcore E(MCSCF)= -520.7477838773, 12 ITERS, E(NUC)= 556.3890347897
$vec1
-119 -
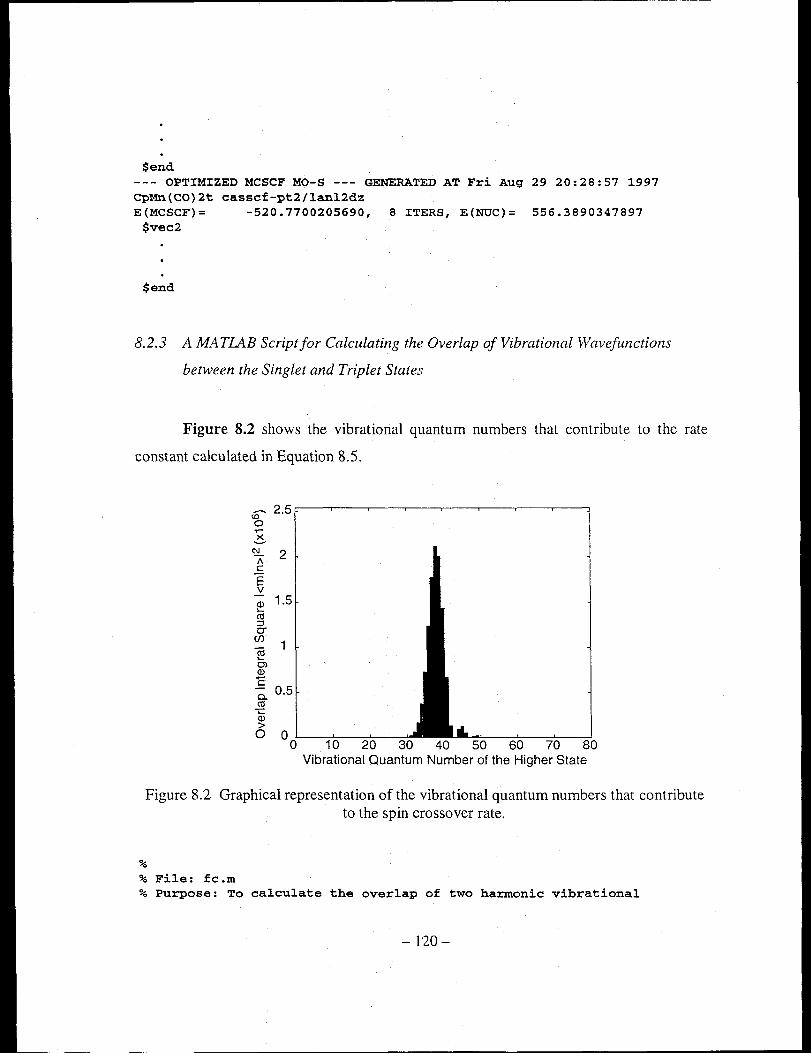
$end --- OPTIMIZED MCSCF MO-S --- GENERATED AT Fri Aug 29 20:28:57 ~997 CpMn(CO}2t casscf-pt2/lan12dz E(MCSCF}= -520.7700205690, 8 ITERS, E(NUC)= 556.3890347897
$vec2
$end
8.2.3 A MATIAB Scriptfor Calculating the Overlap of Vibrational Wavefllnctions
between the Singlet and Triplet States
Figure 8.2 shows the vibrational quantum numbers that contribute to the rate
constant calculated in Equation 8.5.
(i:J 0 .-~ ~
A C
E ::!.. (i) '-ct! :J 0"
(J)
<ti '-0> (i) ....-c 0-ct!
-.:: (i)
> 0
2.5
2
1.5
1
0.5
0 20 30 40 50 60 70 80
Vibrational Quantum Number of the Higher State
Figure 8.2 Graphical representation of the vibrational quantum numbers that contribute to the spin crossover rate.
%
% File: fc.m % Purpose: To calculate the overlap of two har.monic vibrational
-120-
%
%
%
wavefunctions. These two wavefunctions are displaced by dQ in coordinate space, and their energy difference is p vibrational quanta. They are assumed to have the same force
% constant. % Dependent files: % int.m % Creation Date: July 14, 1997 % Modification: July 17, 1997 % Author : Haw Yang % close all; clear all; format long;
global xx integrand; % define global variables
% ---------- User Supplied Variables Plot_wf = 1; massl = 11.2442; mass2 = 11.2442; freql = 88.6951; freq2 =.88.6951; dQ = 3.932086; Delta_E = 10.925928; T = 298.15;
% a switch to turn on/off wavefunction plot % reduced mass of the lower state (g/mol) % reduced mass of the upper state (g/mol) % frequency of the lower state in cm-l % frequency of the upper state in crn-l % horrizontal displacement in Angstrom % vertical displacement, in kcal/mol % temperature
% ---------- Program Constants ----------n_max = 80; % Maximal number of vibrational levels i_max = 2000; % maximal number of points to be calculated
% ---------- Physical Na = 6.02e23;
Constants ----------
h = 6.626e-34; h_bar = h/2/pi; c = 3el0; k_B = 1. 3 8e-23 i
% ---------- Program Starts ml = massl/l000/Nai m2 = mass2/1000/Nai wl = 2*pi*c*freqli w2 = 2*pi*c*freq2i dxx = dQ*le-l0i lumbdal = ml*wl/h_bari lumbda2 = m2*w2/h_bari kT = k_B * Ti D_E = Delta_E*1000*4.18/Na;
% Avogadro's number % Plank's constant
% Light speed, in ern/sec % Boltzmann's constant
% convert g/mole to kg/particle % convert g/mole to kg/particle % convert freq to ornega(w) % convert freq to ornega(w) % convert Angstrom to meter, MKS units % conversion factor % conversion factor
dEl = h_bar*wl; % energy quantum of the lower state dE2 = h_bar*w2; % energy quantum of the upper state ZPE = -dEl+dE2; % zero point energy p = round ( D_E/dEl ); % convert Delta_E to vib. quanta x_maxl = sqrt(2*(n_max+p+l0+l)*h_bar/ml/wl);
-121-

% classi.cal turning point for lower % calculated with 10 extra quanta
x_max2 = sqrt(2*(n_max+10+1)*h_bar/nQ/w2); % classi.cal turning point for upper
x_R = max(x_maxl, x_max2) + dxx; x_L =-max{x_maxl, x_max2); xx = x_L:(x_R-x_L)/(i_max-1):x_R;
% const%uct x-domain array 1 xl = xx*sqrt(lwnbda1); %convert to normalized variable for Hermite x2 = xx*sqrt{lwnbda2); %convert to normalized variabre for Hermite dx1 dx2 v1 = v2 =
= =
dxx*sqrt(lumbda1}; dxx*sqrt(lwnbda2);
0.5*m1 * wl A2 * xx .A2; % the potential energy function 1 0.5*m2 * w2 A2 * (xx-dxx) .A2;
% the potential energy function 2 y1 = exp(-0.5*x1 .A 2); % the exponential function for vib wave 1 y2 = exp(-0.S*(x2-dx2) A 2);% the e.xponential function for vib wave 2
A{i_max} = 0; % reserve memory for the normalization constant H1 {n_max+p, i_max} = 0; % reserve memory for the Hermite polynomial 1 H2(n_max+p,i_max) = 0; % reserve memory for the Hermite polynomial 2 FCs{n_max) = 0; % reserve memory for the F-C factor ~vib = 1; % vibrational partition function
H1 (1, : ) = ones(l,length(xx»; H1(2,:) = 2*x1; H2(l,:) = ones{l,length{xx»; H2{2,:) = 2*(x2-dx2); Al(l) = (lumbdal/pi)A(O.2S);% Al(2) = Al(1)/sqrt(2); % A2(1) = (lumbda2/pi)A{0.2S);% A2{2} = A2(l}/sqrt(2}; %
if Plot_wf == 1 figure; hold on;
end ul(l,:} = A1(l) * Hl (1, : ) * ul (2, : ) = Al(2) * Hl (2, : ) * u2(l,:} = A2(l) * H2 (1, : ) * u2 (2, : ) = A2(2) * H2 (2, : ) * if Plot_wf -- 1
the the the the
y1; y1; y2; y2;
plot{xx, v1, xx, v2+dEl*p); end am1 = ul{l,:); am2 = u2(l,:); if Plot_wf == 1
% Hermite polynomial % Hermite polynomial % Hermite polynomial % Hermite polynomial
normalization constant for n=O normalization constant for n=l normalization constant for n=O normalization constant for n=1.
% nl=O state % nl=l state % n2=0 state % n2=1 state
plot (xx, arn1/max(arnl}*3*dEl+dEl*{0.5), xx, am2/max{am2)*3*dE2+dE2*(0.5)+dEl*p);
end am1 = ul(2,:); am2 = u2(2,:)i if Plot_wf == 1
-122-
n=O n=l n=O n=l state state state state

end
plot {xx, aml/max(aml)*3*dEl+dEl*{O.S), •.. xx, am2/max(am2)*3*dE2+dE2*(O.S)+dEl*p)i
for n = 2: (p+n_max-l),
end;
% ---- recursive relation for Hermite Hl(n+l,:) = 2 .* xl .* Hl(n,:) - 2 * (n~l) .* Hl(n-l,:)i H2(n+l,:) = 2 .* (x2-dx2) .* H2(n,:) - 2 * (n-l) .* H2{n-l,:); % ---- recursive relation for the normalization factor Al(n+l) = Al(n) I sqrt(2*(n-l)}; A2(n+l} = A2(n) / sqrt(2*(n-l»; % ---- construct the wavefunction ul(n+l,:} = Al(n+l) * Hl(n+l,:) * yli u2(n+l,:) = A2(n+l) * H2(n+l,:} .* y2; % ---- plot it if Plot_wf == 1
end
ami = ul(n+l,:); am2 = u2(n+l,:}; plot{xx, aml/max{aml)*3*dEl+dEl*{n+O.S),
xx, am2/max(am2)*3*dE2TdE2*(n+O.S}+dEl*p};
(Lvib = 0; for n = l:n_max, % loop over the upper state
E2 = D_E+ZPE+(n-l)*dE2; pm = round{E2/dEl); if abs{E2-pm*dEl} <= kT
integrand = ul(pm+l,:) .* u2(n,:}; braket = quad8('int',x_L,x_R); FCs(n) = exp(-{n-l}*dE2/kT) * braket A 2;
end; (Lvib = (Lvib + exp(-(n-l)*dE2/kT);
end;
if Plot_wf == 1 hold off;
end
figure; bare (O:n_max-l), FCs}; axis([O n_max 0 max(FCs}*1.2]}i xlabel{'Vibrational Quantum Number of the Higher State'); ylabel ( 'OVerlap Integral Square I <m I n> I A 2' ) ; title('Frank-Condon OVerlap Diagram');
fprintf(l, 'Summation over %i vibrational levels: \n', n_max)i fprintf(l, 'The Frank-Condon factor at %6.2f K is %e \n',
T,sum(FCs}/(Lvib}; fprintf(l, 'The vibrational partition function is %f \n', (Lvib);
% % end of fc.m
-123 -

%
% % File: int.m % Purpose: To supply a functional for integration of <min>, where In>
is a vibrational funciton. % Dependent Files: % fc.m % Creation Date July 14, 1997 % Modification Date: July 14, 1997 % Author: Haw Yang % function zzz = int(z) global xx integrand; zzz = interp1(xx, integrand, z); %
% End of function int %
- 124-

9 BIBLIOGRAPHY
[1] Collman JP, Hegedus LS, Norton JR, and Finke RG, "Principles and Applications
of Organotransition Metal Chemistry." 1987.
[2] Masters C, "Homogeneous Transition-Metal Catalysis - A Gentle Art". London:
Chapman and Hall, 1981.
[3] Lippard SJ and Berg JM, "Principles of Bioinorganic Chemistry". Mill Valley,
California: University Science Books, 1994.
[4] Kubas GJ, Ryan RR, Swanson BI, Vergamini PJ, and Wasserman HJ,
"Characterization of the First Examples of Isolable Molecular Hydrogen'
Complexes, M(CO)3(PR3h(H2) (M = Mo, W; R = Cy, i-Pr). Evidence for a
Side-on Bonded H2 Ligand." 1. Am. Chem. Soc. 1984; 106: 451-452.
[5] Crabtree RH, "Dihydrogen Complexes: Some Structural and Chemical Studies."
Acc. Chem. Res. 1990; 23(4): 95-101.
[6] Kubas GJ, "Molecular Hydrogen Complexes: Coordination of a cr Bond to
Transition Metals." Acc. Chem. Res. 1988; 21: 120-128.
[7] Hall C and Perutz RN, "Transition Metal Alkane Complexes." Chem. Rev. 1996;
96(8): 3125-3146.
[8] Musaev DG and Morokuma K, "Ab Initio Molecular Orbital Study of the
Mechanism of H-H, C-H, N-H, O-H, and Si-H Bond Activation on Transient
Cyclopentadienylcarbonylrhodium" 1. Am. Chem. Soc. 1995; 117(2): 799-805.
[9] Stiegman AE and Tyler DR, "Reactivity of Seventeen- and Nineteen-Valence
Electron Complexes in Organometallic Chemistry." Comments Inorg. Chem.
1986; ~(5): 215-245.
[10] Tyler DR, "19-Electron Organometallic Adducts." Acc. Chem. Res. 1991; 24:
325-331.
[11] Baird MC, "Seventeen-Electron Metal-Centered Radicals." Chem. Rev. 1988; 88:
1217-1227.
-125 -
(12] Astruc D, "Nineteen-Electron Complexes and Their Role m Organometallic
Mechanisms." Chem. Rev. 1988; 88(7): 1189-1216.
[13] Ohkubo K, Kanaeda H, and Tsuchihashi K, "An MO-theoretical Interpretation of
the Reductive Cleavage of Organic Halides by Pentacyanocobaltate(II)." Bull.
Chem. Soc. lpn. 1973; 46(10): 309S-3098.
[14] van Leeuwen PWNM, Morokuma K, and van Lenthe JH, "Theoretical Aspects of
Homogeneous Catalysis". Vol. 18. Catalysis by Metal Complexes, ed. Ugo Rand
James BR. Boston: Kluwer Academic Publishers, 1995.
[1S] Bromberg SE, Yang H, Asplund Me, Lian T, McNamara BK, Kotz KT, Yeston
JS, Wilkens M, Frei H, Bergman RG, and Harris CB, "The Mechanism of a C-H
Bond Activation Reaction in Room-Temperature Alkane Solution." Science 1997;
278: 260-263.
[16] Lian T, Bromberg SE, Yang H, Proulx G, Bergman RG, and Harris CB,
"Femtosecond IR studies of Alkane C-H Bond Activation by Organometallic
Compounds - Direct Observation of Reactive Intermediates in Room Temperature
Solutions." l. Am. Chem. Soc. 1996; 118(1S): 3769-3770.
[17] Yang H, Kotz KT, Asplund MC, and Harris CB, "Femtosecond Infrared Studies
of Silane Silicon-Hydrogen Bond Activation." 1. Am. Chem. Soc. 1997; 119(40):
9564-9565.
[18] Yang H, Asplund MC, Kotz KT, Wilkens MJ, Frei H, and Harris CB, "Reaction
Mechanism of Silicon-Hydrogen Bond Activation Studied Using Femtosecond to
Nanosecond IR Spectroscopy and Ab Initio Methods." J. Am. Chem. Soc. 1998;
120(39): 10154-10165.
[19] Yang H, Snee PT, Kotz KT, Payne CK, Frei H, and Harris CB, "Femtosecond
Infrared Studies of a Prototypical One-Electron Oxidative-Addition Reaction:
Chlorine Atom Abstraction by the Re(CO)s Radical." J. Am. Chem. Soc. 1999;
121(39): 9227-9228.
-126-
[20] Yang H and Harris CB, "Probing Bond Activation Reactions with Femtosecond
Infrared," in Book "Ultrafast Infrared and Raman Spectroscopy," Fayer MD,
Editor. 2000, Marcel Dekker: New York.
[21] Yang H, Kotz KT, Asplund MC, Wilkens MJ, and Harris CB, "Ultrafast Infrared
Studies of Bond Activation in Organometallic Complexes." Acc. Chem. Res.
1999; 32: 551-560.
[22] Bethune DS, "Dye cell design for high-power low-divergence excimer-pumped
dye lasers." Appl. Opt. 1981; 20(11): 1897-1899.
[23] Wynne K and Hochstrasser RM, "The theory of ultrafast vibrational
spectroscopy." Chern. Phys. 1995; 193: 211-236.
[24] Hamm P, "Coherent effects in femtosecond infrared spectroscopy." Chem. Phys.
1995; 200: 415-429.
[25] Kovalenko SA, Ernsting NP, and Ruthmann J, "Femtosecond Stokes shift in
styryl dyes: Solvation or intramolecular relaxation?" 1. Chern. Phys. 1997; 106(9):
3504-3511.
[26] Mukamel S, "Principles of nonlinear optical spectroscopy". New York: Oxford
University Press, 1995.
[27] Akhremitchev B, Wang C, and Walker GC, "A femtosecond absorption
spectrometer tunable from 50000 to 800 cm-1: Nonlinear optics and pump/probe
geometries." Rev. Sci. Instrurn. 1996; 67(11): 3799-3805.
[28] Siegman AB, "Lasers". Mill Valley, California: University Science Books, 1986.
[29] Tokunaga E, Terasaki A, and Kobayashi T, "Femtosecond time-resolved
dispersion relations studied with a frequency-domain interferometer." Phys. Rev . . A 1993; 47(6): R4581-R4584.
[30] Ruhman S and Nelson KA, "Temperature-dependent molecular dynamics of
liquid carbon disulphide: Polarization-selected impulsive stimulated light
scattering data and Kubo line shape analysis." 1. Chern. Phys. 1991; 94(2): 859-
867.
-127 -
[31] Hattori T and Kobayashi T, "Ultrafast optical Kerr dynamics studied with
incoherent light." J. Chern. Phys. 1991; 94(5): 3332-3346.
[32] Ethepare J, Grillon G, Chambaret JP, Hamoniaux G, and Orszag A, "Polarization
selectivity in time-resolved transient phase grating." Opt. Cornrn. 1987; 63(5):
329-334.
[33] Kalpouzos C, McMorrow D, Lotshaw WT, and Kenney-Wallace GA,
"Femtosecond Laser-induced optical Kerr dynamics in CS2/alkane binary
solutions." Chern. Phys. 1988; 150(1,2): 138-146.
[34] Shelton DP and Rice JE, "Measurements and calculations of the
hyperpolarizabilities of atoms and small molecules in the gas phase." Chern. Rev.
1994; 94: 3-29.
[35] Bishop DM, "Molecular vibrational and rotational motion in static and dynamic
electric fields." Rev. Mod. Phys. 1990; 62(2): 343-374.
[36] Foster H and Remmert M, "Infrared studies on the interaction of N20 adsorbed in
transition metal ion-exchange zeolite A." J. Mol. Struct. 1988; 174: 357-362.
[37] Villegas I and Weaver MJ, "Infrared spectroscopy of model electrochemical
interfaces in ultrahigh vacuum: Roles of solvation in the vibrational stark effect."
J. Phys. Chern. 1997; 101(30): 5842-5852.
[38] Lambert DK, "Vibrational Stark effect of CO on Ni(100), and CO in the aqueous
double layer: Experiment, theory, and models." J. Chern. Phys. 1988; 89(6):
3847-3860.
[39] Kunimatsu K, "Adsorption of carbon monoxide on a smooth palladium electrode:
An in-situ infrared spectroscopic study." 1. Phys. Chern. 1984; 88(11): 2195-
2200.
[40] Lambert DK, "Observation of the first-order Stark effect of CO on Ni(1lO)."
Phys. Rev. Lett. 1983; 50(26): 2106-2109.
[41] Lambert DK, "Observation of the first-order Stark effect of CO on Ni(llO)."
Phys. Rev. Lett. 1983; 21(24): 2233.
-128 -

[42] Volk M, Kholodenko Y, Lu HSM, Gooding EA, DeGrado WF, and Hochstrasser
RM, "Peptide conformational dynamics and vibrational Stark effect following
photoinitiated disulfide cleavage." J. Phys. Chern. 1997; 101(42): 8607-8616.
[43] Lambert DK, "Stark effect of adsorbate vibrations." Solid State Cornrn. 1984;
21(5): 297-300.
[44] Hermansson K and Tepper H, "Electric-field effects on vibrating polar molecules:
from weak to strong fields." Mol. Phys. 1996; 89(5): 1291-1299.
[45] Andres JL, Marti J, Duran M, Lled6s A, and Bertran J, "Theoretical study of
infrared spectra perturbed by uniform electric fields: Ab initio calculations on
H20, NH3, H2CO, and C2H4." J. Chern. Phys. 1991; 95(5): 3521-3527.
[46] Luis 1M, Marti J, Duran M, and Andre JL, "Nuclear relaxation and vibrational
contributions to the static electrical properties of polyatornic molecules: beyond
the Hartree-Fock approximation." Chern. Phys. 1997; 217: 29-42.
[47] Andres JL, Bertran J, Duran M, and Martf J, "Perturbed infrared spectrum and
vibrational contribution to electric properties of C02: An ab intio SCF study." J.
Phys. Chern. 1994; 98(11): 2803-2808.
[48] Andres JL, Duran M, Lled6s A, and Bertran J, "Calculation of the vibrational
frequency and line strength versus applied field of carbon monoxide." Chern.
Phys. 1991; 151: 37-43.
[49] Hermansson K, "Electric-field effects on the OH vibrational frequency and
infrared absorption intensity for water." J. Chern. Phys. 1993; 99(2): 861-868.
[50] Duran M, Andres JL, Lled6s A, and Bertran J, "Influence of an external uniform
electric field on harmonic vibrational frequencies. Analytic energy second
derivatives for closed-shell restricted Hartree-Fock wave functions with an
applied uniform electric field." J. Chern. Phys. 1989; 90(1): 328-333.
[51] Andres JL, Bertran J, Duran M, and Marti J, "Vibrational Stark Effect and
Vibrational Static Electric Properties of N20." Int. J. Quant. Chem. 1994; 52: 9-
15.
-129 -
[52] Bagus PS, Nelin CJ, Muller W, Philpott MR, and Seki H, "Field-induced
vibrational frequency shifts of CO and CN chemisorbed on Cu( 100)." Phys. Rev.
Lett. 1987; 58(6): 559-562.
[53] Schmidt MW, Baldridge KK, Boatz JA, Elbert ST, Gordon MS, Jensen JH,
Koseki S, Matsunaga N, Nguyen KA, Su Sl, Windus TL, Dupuis M, and
Montgomery lA, "General Atomic and Molecular Electronic Structure System"
J. Cornput. Chern. 1993; 14: 1347-1363.
[54] Scott AP and Radom L, "Harmonic vibrational frequencies: An evaluation of
Hartree-Fock, M¢ller-Plesset, quadratic configuration interaction, density
functional theory, and semiempirical scale factors." 1. Chern. Phys. 1996;
100(41): 16502-16513.
[55] Edwards DMF, Madden PA, and McDonald IR, "A computer simulation study of
the dielectric properties of a model of methyl cyanide. I. The rigid dipole case."
Mol. Phys. 1984; 21.(5): 1141-1161.
[56] Nakagawa D and Shimanouchi T, Spect. Acta 1962;~: 513.
[57] Steinfeld DI, "Molecules and Radiation". 2 ed, 1985.
[58] Weast RC, Lide DRL, Astle MJ, and Beyer WH, "CRC Handbook of Chemistry
and Physics". 70 ed. Boca Raton: CRC Press, 1989-1990.
(59) Allen MP and Tildesley DJ, "Computer Simulation of Liquids". New York:
Oxford Science Publications, 1986.
[60] Berendsen HJC, Postma JPM, van Gunsteren WF, DiNola A, and Haak JR,
"Molecular Dynamics with Coupling to an External Bath." J. Chern. Phys. 1984;
lil(8): 3684-3690.
[61] Wallqvist A and Teleman 0, "Properties of Flexible Water Modelws." Mol. Phys.
1991; 74(3): 515-533.
[62] Tuckerman T, Berne BJ, and Martyna GJ, "Reversible Multiple Time Scale
Molecular Dynamics." J. Chern. Phys. 1992; 97(3): 19902001.
-130-
[63] Singer K, Taylor A, and Singer JVL, "Thermodynamic and Structural Properties
of Liquids Modelled by '2-Lennard-Jones' Pair Potentials." Mol. Phys. 1977;
33(6): 1757-1795.
[64] Tran V and Schwartz BJ, "Role of Nonpolar Forces in Aqueous Solvation:
Computer Simulation Study of Solvation Dynamics in Water Following Changes
in Solute Size, Shape, and Charge." 1. Phys. Chern. B 1999; 103(26): 5570-5580.
[65] Arndtsen BA and Bergman RG, "Selective Intermolecular Carbon-Hydrogen
Bond Activation by Synthetic Metal Complexes in Homogeneous Solution." Acc.
Chern. Res. 1995; 28: 154-162.
[66] Bengali AA, Arndtsen BA, Burger PM, Schultz RH, Weiller BH, Kyle KR,
Moore CB, and Bergman RG, "Activation of Carbon-Hydrogen Bonds in Alkanes
and Other Organic Molecules by Ir(I), Rh(I), and Ir(II) Complexes." Pure Appl.
Chern. 1995; 67: 281-288.
[67] Bergman RG, "Activation of Alkanes with Organotransition Metal Complexes."
Science 1984; 223: 902-908.
[68] Bergman RG, "A Physical Organic Road to Organometallic C-H Bond Oxidative
Addition Reactions." 1. Organornet. Chern. 1990; 400: 273-282.
[69] Crabtree RH, ''The Organometallic Chemistry of Alkanes." Chern. Rev. 1985; 85:
245-269.
[70] Janowicz AH and Bergman RG, "C-H Activation in Completely Saturated
Hydrocarbons: Direct Observation of M + R-H ~ M(R)(H)." 1. Arn. Chern. Soc.
1982; 104(1): 352-354.
[71] Hoyano JK and Graham WAG, "Oxidative Addition of the Carbon-Hydrogen
Bonds of Neopentane and Cyclohexane to a Photochemically Generated
Iridium(I) Complex." 1. Arn. Chem. Soc. 1982~ 104(13): 3723-3725.
[72] Bromberg SE, Lian TQ, Bergman RG, and Harris CB, "Ultrafast dynamics of
Cp*M(COh (M = Ir, Rh) in solution: The origin of the low quantum yields for C-
H bond activation." 1. Arn. Chern. Soc. 1996; 118(8): 2069-2072. And references
therein.
-131-

[73] Ghosh CK and Graham AG, "Efficient and Selective Carbon-Hydrogen
Activation by a tris(Pyrazolyl)borate Rhodium Complex." 1. Am. Chern. Soc.
1987; 109:4726-4727.
[74] Ghosh CK and Graham AG, "A Rhodium Complex that Combines Benzene
Activation with Ethylene Insertion - Subsequent Carbonylation and Ketone
Formation." 1. Arn. Chern. Soc. 1989; ill: 375-376.
[75] Lees AJ and Purwoko AA, "Photochemical Mechanisms in Intermolecular C-H
Bond Activation Reactions of Organometallic Complexes." Coord. Chern. Rev.
1994; 132: 155-160.
[76] Purwoko AA and Lees AJ, "Photochemistry and C-H Bond Activation Reactivity
of (HBPz* 3)Rh(CO)2 (pz* = 3,5-Dimethylpyrazolyl) in Hydrocarbon Solution."
Inorg. Chern. 1995; 34: 424-425.
[77] Lee M and Harris CB, "Ultrafast Studies of Transition-Metal Carbonyl Reactions
in the Condensed Phase: Solvation of Coordinatively Unsaturated
Pentacarbonyls." 1. Arn. Chern. Soc. 1989; ill(24): 8963-8965.
[78] Zaric S and Hall MB, "Prediction of the reactive intermediates m alkane
activation by tris(pyrazolyl borate)rhodium carbonyl." 1. Phys. Chern. A 1998;
102(11): 1963-1964.
[79] Schultz RH, Bengalli AA, Tauber MJ, Weiller BH, Wasserman EP, Kyle KR,
Moore CB, and Bergman RG, "IR Flash Kinetic Spectroscopy of C-H Bond
Activation of Cyclohexane-Do and Cyclohexane-D12 by Cp*Rh(COh in Liquid
Rare-Gases - Kinetics, Thermodynamics, and An Unusual Isotope Effect." 1. Arn.
Chem. Soc. 1994; 116(16): 7369-7377.
[80] Asbury JB, Ghosh HN, Yeston JS, Bergman RG, and Lian TQ, "Sub-picosecond
IR study of the reactive intermediate in an alkane C-H bond activation reaction by
CpRh(COh." Organometallics 1998; 17(16): 3417-3419.
[81] Wick DD and Goldberg KI, "C-H Activation at Pt(ll) to Form Stable Pt(IV) Alkyl
Hydrides." 1. Am. Chern. Soc. 1997; 119(42): 10235-10236.
-132 -

[82] Gutierrez-Puebla E, Monge A, Nicasio MC, Perez PJ, Poveda ML, Rey L, Rulz C,
and Carmona E, "Vinylic C-H bond Activation and Hydrogenation Reactions of
Tp'Ir(C2H4)(L) Complexes." Inorg. Chem. 1998; 37(18): 4S38-4S46.
[83] Jimenez-Catano R, Niu S, and Hall MB, "Theoretical Studies of Inorganic and
Organometallic Reaction Mechanisms. 10. Reversal in Stability of Rhodium and
Iridium 1l2-Ethene and Hydridovinyl Complexes." Organometallics 1997; lQ(9):
1962-1968.
[84] Moser WR and Slocum DW, "Homogeneous Transition Metal Catalyzed
Reactions". Washington D.C.: American Chemical Society, 1992.
[8S] Schubert U, "112 Coordination of Si-H cr Bonds to Transition Metals." Adv.
Organomet. Chem. 1990; 30: lS1-187.
[86] Crabtree RH, "Aspects of Methane Chemistry." Chem. Rev. 1995; 9S(4): 987-
1007.
[87] Koga Nand Morokuma K, "SiH, SiSi, and CH Bond Activation by
Coordinatively Unsaturated RhCI(PH3)2. Ab Initio Molecular Orbital Study." J.
Am. Chem. Soc. 1993; 11S(1S): 6883-6892.
[88] Young KM and Wrighton MS, "Temperature Dependence of the Oxidative
Addition of Triethylsilane to Photochemically Generated (llS-CsCIs)Mn(COh."
Organometallics 1989; .8.(4): 1063-1066 ..
[89] Palmer BJ and Hill RH, ''The Energetics of the Oxidative Addition of
Trisubstituted Silanes to Photochemically Generated (l1S-CSRS)Mn(CO)2." Can.
J. Chem. 1996; 74: 19S9-1967.
[90] Hart-Davis AJ and Graham WAG, "Silicon-Transition Metal Chemistry. VI.
Kinetics and Mechanism of the Replacement of Triphenylsilane by
Triphenylphosphine III Hydridotriphenylsilyl(n
cyclopentadienyl)dicarbonylmanganese." J. Am. Chem. Soc. 1971; 94(18): 4388-
4393.
-133 -

[91] Hu S, Farrell GJ, Cook C, Johnston R, and Butkey TJ, "Rearrangement of TJ5-
CpMn(COh(HSiEt3): A Missing Step in the Energy Surface for the Oxidative
Addition of Silane to CpMn(CO)2(heptane)." Organornetallics 1994; U(11):
4127-4128.
[92] Burkey TJ, ''Thermochemistry of Silane Substitution of CO on Metal Carbonyl
Complexes. Interaction of Silanes with Metal Centers." 1. Am. Chern. Soc. 1990;
112(23): 8329-8333.
[93] Hester DM, Sun J, Harper AW, and Yang GK, "Characterization of the Energy
Surface for the Oxidative Addition of Silanes to CpMn(CO)2(heptane)." 1. Am.
Chern. Soc. 1992; 114(13): 5234-S240.
[94] Breckenridge WH, "Activation of H-H, Si-H, and C-H bonds by nsnp excited
states of metal atoms." 1. Phys. Chern. 1996; 100(36): 14840-1485S.
[95] Dougherty TP, Grubbs WT, and Heilweil EJ, "Photochemistry of
Rh(CO)2(acetylacetonate) and Related Metal Dicarbonyls Studied by Ultrafast
Infrared Spectroscopy." 1. Phys. Chern. 1994; 98(38): 9396-9399.
[96] Arrivo SM, Dougherty TP, Grubbs WT, and HeilweilEJ, "Ultrafast Infrared
Spectroscopy of Vibrational CO-Stretch Up-Pumping and Relaxation Dynamics
ofW(CO)6-" Chern. Phys. Lett. 1995; 23S: 247-254.
[97] Giordano PJ and Wrighton MS, Inorg. Chern. 1977; lQ: 160.
[98] King JC, Zhang JZ, Schwartz BJ, and Harris CB, "Vibrational relaxation of
M(CO)6 (M=Cr,Mo,W): effect of metal mass on vibrational cooling dynamics
and non-Boltzmann internal energy distributions." 1. Chern. Phys. 1993; 99(10):
7S95-7601.
[99] Butler IS and Fenster AE, 1. Organometl Chem. 1973;~: 307.
[100] Hill RH and Wrighton MS, "Oxidative Addition of Trisubstituted Silanes to
Potochemically Generated Coordinatively Uncaturated Spcies (114-
C4H4)Fe(COh, (11S-CSHS)Mn(COh, and (116-C6H6)Cr(CO)2 and Related
Molecules." Organornetallics 1987; §(3): 632-638.
-134-
[101] Zheng Y, Wang W, Lin J, She Y, and Fu K-J, "Time-Resolved Infrared Studies of
Gas-Phase Coordinatively Unsaturated Photofragments (eta-5-C5H5)Mn(COh (x
= 2 and 1)." 1. Phys. Chern. 1992; 96(19): 7650-7656.
[102] Bloyce PE, Mascetti J, and Rest AJ, "Photochemistry of tris(Dimethylpyrazolyl)-
Boratorhodium Dicarbonyl and bis(Dimethy lpyrazoly 1)-Boratorhodium
Dicarbonyl Complexes in Low-Temperature Media at 12-298 K - Some Insights
into C-H Activation Processes." 1. Organornet. Chern. 1993; 444(1-2): 223-233.
[103] Ryther RJ and Weitz EJ, "Reaction-Kinetics of Coordinatively Unsaturated Iron
Carbonyls Formed on Gas-Phase Excimer Laser Photolysis of Fe(CO)5." J. Phys.
Chern. 1991; 95(24): 9841-9852.
[104] Maciejewski A, Jawoska-Augustniak A, Szeluga Z, and Karolczak J,
"Determination of Ferrocene Triplet Lifetime by Measuring T1 ~Tl Energy
Transfer to Phenylosazone-d-glocise." Chern. Phys. Lett. 1988; IS3(2-3): 227-
232.
[lOS] Bengali AA, Bergman RG, and Moore CB, "Evidence for the Formation of Free
16-Electron Species Rather than Solvate Complexes in the Ultraviolet Irradiation
of CpCo(CO)2 in Liquefied Noble Gas Solvents." 1. Am. Chern. Soc. 1995;
117(13): 3879-3880.
[106] Siegbahn PEM, "Comparison of the C-H Activation of Methane by
M(CSHS)(CO) for M = Cobalt, Rhodium, and Iridium." 1. Am. Chern. Soc. 1996;
118(6): 1487-1496.
[107] Rawlins KA and Lees AJ, "Photophysical Properties of M(CO)4(a,a'-diimine)
(M = Mo,W) Coplexes." Inorg. Chern. 1989; 28(11): 2154-2160. and references
therein.
[108] Xie X and Simon JD, "Picosecond Time-Resolved Absorption Studies of the
Solvation of Cr(CO)s in Alcohols - A Unimolecular Kinetic-Model for the
Formation of Cr(CO)s(OHR) from Photogenerated Cr(CO)s(ROH)." 1. Am.
Chern. Soc. 1990; 112(3): 1l30-1136.
-l3S -
[109] Ladogana S, Nayak SK, Smit JP, and Dobson GR, "Mechanism of Linkage
Isomerization in (eta( 1)-5-chloropentene )pentacarbonylchromium(O)." [norg.
Chern. 1997; 36(4): 6S0-65S.
[110] Klassen JK, Selke M, Sorensen AA, and Yang GK, "Metal-Ligand Bond
Dissociation Energies in CpMn(COhL Complexes." J. Arn. Chern. Soc. 1990;
112: 1267-1268.
[111] Jetz Wand Graham WAG, [norg. Chern. 1971; 10: 4.
[112] Wrighton MS and Schroeder MA, 1. Arn. Chern. Soc. 1974; 96: 6235.
[113] Smith RA and Bennett MJ, Acta Crystallogr., Sect. B 1977; 33: 1113.
[114] Schubert U, Ackermann K, and Warle B, J. Am. Chern. Soc. 1982; 104: 7378.
[115] Schubert U, Scholz G, Muller J, Ackermann K, Warle B, and Stansfield RFD, J.
Organornet. Chern. 1986; 306: 303.
[116] Creaven BS, Dixon Al, Kelly JM, Long C, and Poliakoff M, "Structure and
Reactivity of (eta-5-C5HS)Mn(COh in Room-Temperature Solution - Evidence
for Formation of A Dinuclear Intermediate Detected by Flash-Photolysis and
Time-Resolved Infrared Spectroscopy." Organornetallics 1987; 2(12): 2600-2605.
[117] Yuzawa T, Kato C, George MW, and Hamaguchi H-O, "Nanosecond Time
Resolved Infrared-Spectroscopy with A Dispersive Scanning Spectrometer."
Appl. Spectrosc. 1994; 48(6): 684-690.
[118] Haas H and Sheline RK, 1. Chern. Phys. 1967; 47: 2996.
[119] Wilson lr. EB, Decius lC, and Cross PC, "Molecular Vibrations". New York:
Dover, 1980.
[120] Dougherty TP and Heilweil El, "Transient Infrared Spectroscopy of (l1 S-
CSH5)Co(COh Photoproduct reactions in Hydrocarbon Solutions." 1. Chern.
Phys. 1994; 100(S): 4006-4009.
[121] Bode BM and Gordon MS, "MacMolPlt: A Graphical User Interface for
GAMESS." J. Mol. Graphics Mod. 1998; lQ: 133-138.
-136 -

[122] Brown CE, Ishikawa Y, Hackett PA, and Rayner DM, "Interaction of Alkanes
with Unsaturated Metal Centers. 2. Complexes of Alkanes and Fluoroalkanes with
W(CO)5 in the Gas-Phase." J. Am. Chern. Soc. 1990; 112(7): 2530-2536.
[123] Ishikawa Y, Brown CE, Hackett PA, and Rayner DM, "Interaction of Alkanes
with Unsaturated Metal Centers - The Complex W(CO)5C2H6 in the Gas-Phase."
Chern. Phys. Lett. 1988; 150(6): 506-510.
[124] Zaric S and Hall MB, "Ab Initio Calculations of the Geometry and Bonding
Energies of Alkanes and Fluoroalkanes Complexes with Tungsten
Pentacarbonyl." J. Phys. Chern. A 1997; 101: 4646-4652. and references therein.
[125] Sun X-Z, Grills DC, Nikiforov SM, Poliakoff M, and George MW, "Remarkable
Stability of (eta(5)-C5H5)Re(COhL (L = n-heptane, Xe, and Kr): A Time-
Resolved Infrared Spectroscopic Study of (eta(5)-C5H5)Re(CO)3 In
Conventional and Supercritical Fluid Solution." J. Am. Chern. Soc. 1997; 119(32):
7521-7525.
[126] O'Connor 1M and Casey CP, "Ring-Slippage Chemistry of Transition-Metal
Cyc10pentadienyl and Indenyl Complexes." Chern. Rev. 1987; 87(2): 307-318.
[127] Basolo F, "Ring-Slippage Mechanisms and Kinetics of CO Substitution of Metal
Carbonyls." New J. Chern. 1994; .lli(1): 19-24.
[128] Bengali AA, Bergman RG, and Moore CB, "Evidence for the Formation of Free
16-Electron Species Rather than Solvate Complexes in the Ultraviolet Irradiation
of CpCo(CO)2 in Liquefied Noble Gas Solvents." J. Arn. Chern. Soc. 1995;
117(13): 3879-3880.
[129] Abugideiri F, Keogh DW, and Poli R, "Stable 16-Electron, Paramagnetic
Cyc1opentadienylmolybdenum(II) Complexes." J. Chern. Soc., Chern. Comrnun.
1994(20): 23l7-2318.
[130] Detrich JL, Reinaud OM, Rheingold AL, and Theopold KH, "Can Spin State
Change Slow Organometallic Reactions?" J. Am. Chern. Soc. 1995; 117(47):
11745-11748.
-137 -

[131] Poliakoff M and Weitz E, "Shedding Light on Organometallic Reactions - The
Characterization of Fe(CO)4, A Prototypical Reaction Intermediate." Acc. Chem.
Res. 1987; 20(11): 408-414.
[132] Servaas PC, van Dijk HK, Snoeck TL, Stuhkens DJ, and Oskam A, lnorg. Chem.
1985; 24: 4494.
[133] Jonas V and Thiel W, ''Theoretical Study of the Vibrational Spectra of the
Transition-Metal Carbonyl Hydrides HM(CO)5 (M = Mn, Re), H2M(CO)4 (M =
Fe, Ru, Os), and HM(CO)4 (M = Co, Rh, Ir)." 1. Chern. Phys. 1996; 105(9):
3636-3648.
[134] Zaric S, Couty M, and Hall MB, "Ab Initio Calculations of the Geometry and
Vibrational Frequencies of the Triplet State of Tungsten Pentacarbonyl Amine: A
Model for the Unification of the Preresonance Raman and the Time-Resolved
Infrared Experiments." 1. Am. Chern. Soc. 1997; 119(12): 2885-2888.
[135] Blomberg MRA, Siegbahn PEM, and Svensson M, "Mechanisms for the
Reactions between Methane and the Neutral Transition Metal Atoms from
Yttrium to Palladium" J. Am. Chern. Soc. 1992; 114(15): 6095-6102.
[136] Siegbahn PEM, "Different Electronic Structure Requirements on Precursors and
Transition States for the Oxidative Reaction with Methane." J. Am. Chem. Soc.
1994; 116(22): 10124-10128.
[137] Carroll n, Haug KL, Weisshaar JC, Blomberg MRA, Siegbahn PEM, and
Svensson M, "Gas Phase Reactions of Second-Row Transition Metal Atoms with
Small Hydrocarbons: Experiment and Theory." J. Phys. Chern. 1995; 99(38):
13955-13969.
[138] Wrighton MS and Ginley DS, "Photochemistry of Metal-Metal Bonded
Complexes. II. The Photochemistry of Rhenium and Manganese Carbonyl
Complexes Containing a Metal-Metal Bond." 1. Am. Chern. Soc. 1975; 97(8):
2065-2072.
[139] Firth S, Klotzbuecher WE, Poliakoff M, and Turner n, "Generation of
Re2(CO)9(N2) from Re2(CO)IO: Identification of Photochemical Intermediates
-138 -
by Matrix Isolation and Liquid-Nobel-Gas Techniques." Inorg. Chern. 1987;
26(20): 3370-3375.
[140] Firth S, Hodges PM, Poliakoff M, and Turner n, "Comparative Matrix Isolation
and Time-Resolved Infrared Studies on the Photochemistry of MnRe(CO) 10 and
Re2(CO) 10: Evidence for CO-Bridged MnRe(CO)9." Inorg. Chern: 1986; 25(25):
4608-4610.
[141] Kim SK, Pedersen S, and Zewail AH, "Femtochemistry of Organometallics:
Dynamics of Metal-Metal and Metal-Ligand Bond Cleavage in M2(COho."
Chern. Phys. Lett. 1995; 233: 500-508.
[142] Naqvi KR, Mork KJ, and Waldenstrfm S, "Diffusion-Controlled Reaction
Kinetics. Equivalence of the Particle Pair Approach of Noyes and the
Concentration Gradient Approach of Collins and Kimball." 1. Phys. Chern. 1980;
84(11): l315-1319. And references therein.
[143] Bultmann T and Ernsting NP, "Competition between Geminate Recombination
and Solvation of Polar Radicals following Ultrafast Photodissociation of Bis(p
aminophenyl) Disulfide." 1. Phys. Chern. 1996; 100(50): 19417-19424.
[144] Scott TW and Liu SN, "Picosecond Geminate Recombination of Phenylthiyl
Free-Radical Pairs." 1. Phys. Chern. 1989; 93: 1393.
[145] Churchill MR, Amoh KN, and Wasserman HJ, "Redetermination of the Crystal
Structure of Dimanganese Decacarbonyl and Determination of the Crystal
Structure of Dirhenium Decacarbonyl. Revised Values for the Mn-Mn and Re-Re
Bond Lengths in Mn2(CO)1O and Re2(COho." 1. Inorg. Chern. 1981; 20(5):
1609-1611.
[146] Hammond GS, "A Correlation of Reaction Rates." 1. Am. Chern. Soc. 1954; 77:
334-338.
[147] Herrick RS, Herrinton TR, Walker HW, and Brown TL, "Rates of Halogen Atom
Transfer to Manganese Carbonyl Radicals." Organornetallics 1985; 1(1): 42-45.
-l39 -
[148] Lee K-W and Brown TL, "On the Nature of Halogen Atom Transfer Reactions of
Re(C04)L Radicals." J. Am. Chem. Soc. 1987~ 109(11): 3269-3275.
[149] Lian T, Bromberg SE, Asplund MC, Yang H, and Harris CB, "Femtosecond
Infrared Studies of the Dissociation and Dynamcis of Transition Metla
Carbonyls in Solution." 1. Phys. Chem. 1996~ 100(29): 11994-12001.
[150] Sun Hand Frei H, ''Time-resollved step-scan Fourier transform infrared
spectroscopy of triplet excited duro quinone in a zeolite." J. Phys. Chem. B 1997~
101(2): 205-209.
[151] Becke AD, "Density-Functional Thermochemistry. III. The Role of Exact
Exchange." J. Chem. Phys. 1993; 98(7): 5648-5652.
[152] Lee C, Yang W, and Parr RG, "Development of the Colle-Salvetti Correlation
Energy Formula into a Functional of the Electron-Density." Phys. Rev. 1988~
B41(2): 785-789.
[153] Stephens PJ, Devlin FJ, Chabalowski CF, and Frisch MJ, "Ab Initio Calculation
of Vibrational Absorption and Circular Dichroism Spectra Using Density
Functional Force Fields." J. Phys. Chem. 1994; 98(10): 11623-11627.
[154] Ricca A and Jr. CWE, "A Comparison of Density Functional Theory with Ab
Initio Approaches for Systems Involving First Transition Row Metals." Theor.
Chim. Acta. 1995; 92: 123-131.
[155] Glukhovtsev MN, Bach RD, and Nagel CJ, "Performance of the B3L YPIECP
DFT Calculations of Iron-Containing Compounds." J. Phys. Chem. 1997; 101(3):
316-323.
[156] Francl MM, Petro WJ, Hehre WJ, Binkley JS, Gordon MS, DeFrees DJ, and
Pople JA, "Self-Consistent Molecular Orbital Methods. XXIII. A Polarization
Type Basis Set for Second-Row Elements." J. Chem. Phys. 1982; 77(7): 3654-
3665.
[157] Hehre WJ, Ditchfield R, and Pople JA, "Gaussian-Type Basis Set for Use in
Molecular Orbital Studies of Organic Molecules." J.Chem. Phys. 1972; 56(5):
2257-2261.
-140-

[158] Hay PJ and Wadt WR, "Ab initio Effective Core Potentials for Molecular
Calculations. Potentials for K to Au including the outermost core orbitals." 1.
Chern. Phys. 1985; 82(1): 299-310.
[159] Lendvay G and Mayer I, "Some Difficulties in Computing BSSE-Corrected
Potential Surfaces of Chemical Reactions." Chern. Phys. Lett. 1998; 297: 365-
373. and references therein.
[160] "Jaguar 3.5". Portland, OR: Schroedinger, Inc., 1998.
[161] Hippler H, Otto B, Schroeder J, and Troe J, "Diffusion Controlled Atom
Recombination and Photolytic Cage Effect of Halogen in Compressed Gases and
Liquids." Ber. Bunsenges. Physik. Chern. 1985; 89: 240.
[162] Otto B, Schroeder J, and Troe J, "Photolytic Cage Effect and Atom
Recombination of Iodine in Compressed Gases and Liquids: Experiments and
Simple Models." J. Chern. Phys. 1984; lil(1): 202-213.
[163] Schroeder J and Troe J, "Elementary Reactions in the Gas-Liquid Transition
Range." Ann. Rev. Phys. Chern. 1989; 38: 163.
[164] Carslaw HS and Jaeger JC, "Conduction of Heat in Solids", 1959.
[165] Straub JE and Karplus M, "Molecular dynamics study of the photodissociation of
carbon monoxide from myoglobin: ligand dynamics in the first 10 ps." Chen?
Phys. 1991; 158(2): 221-248.
[166] Sarakha M and Ferraudi G, "Electron-Transfer Reactions of Re(CO)5: Atom-
Transfer-Concerted Mechanism vs. Bimetallic Intermediate Formation." Inorg.
Chern. 1996; 35(2): 313-317.
[167] Meckstroth WK, Reed DT, and Wojcicki A, "Further Pulse Radiolysis Studies of
Decacarbonyldimanganese(O) and Decacarbonyldirhenium(O). Temperature and
Solvent Effects." Inorg. Chirn. Acta 1985; 105: 147-151.
[168] Tolman CA, ''The 16 and 18 Electron Rule in Organometallic Chemistry and
Homogeneous Catalysis." Chern. Soc. Rev. 1972; 1: 337-353.
-141-

[169] Poli R, "Open-Shell Organometallics as a Bridge bewteen Werner-Type and Low
Valent Organometallic Complexes. The Effect of the Spin State on the Stability,
Reactivity, and Structure." Chem. Rev. 1996; 96(6): 2135-2204.
[170J Shaik S, Filatov M, Schroder D, and Schwarz H, "Electronic Structure Makes a
Difference: Cytochrome P-450 Mediated Hydroxylations of Hydrocarbons as a
Two-State Reactivity Paradigm" Chem. Eur. J. 1998; 1(2): 193-199.
[171] Poli R and Smith KM, "Spin State and Ligand Dissociation in [CpCoL2J
Complexes (L = PH3, H2C=CH2): A Computational Study." Ellr. 1. Inorg. Chem.
1999: 877-880.
[172] Smith KM, Poli R, and Legzdins P, "A Computational Study of Two-State
Conformational Change in 16-Electron [CpW(NO)(L)J Complexes (L = PH3, CO,
CH2, HCCH, H2CCH2)." Chem. Eur. J. 1999; ~(5): 1598-1608.
[173] Keogh DW and Po Ii R, "Spin State Change in Organometallic Reactions.
Experimental and MP2 Theoretical Studies of the Thermodynamics and Kinetics
of the CO and N2 Addition to Spin Triplet Cp*MoCI(PMe3)2." J. Am. Chem.
Soc. 1997; 119(10): 2516-2523.
[174] Poli R, "Molybdenum Open-Shell Organometallics. Spin State Changes and
Pairing Energy Effects." Acc. Chem. Res. 1997; 30(12): 494-501.
[175] Lenges CP, White PS, and Brookhart M, "Mechanistic and Synthetic Studies of
the Addition of Alkyl Aldehydes to Vinylsilanes Catalyzed by Co(I) Complexes."
J. Am. Chem. Soc. 1998; 120(28): 6965-6979.
[176] Lenges CP and Brookhart M, "Co (I)-Catalyzed Inter- and Intramolecular
Hydroacylation of Olefins with Aromatic Aldehydes." J. Am. Chem. Soc. 1997;
119(13): 3165-3166.
[177] Lenges CP, Brookhart M, and Grant BE, "HID Exchange Reactions between
C6D6 and C5Me5Co(CH2=CHR)2 (R = H, SiMe3): Evidence for Oxidative
Addition of Csp2-H Bonds to the [CSMe5(L)Co] Moiety." 1. Organomet. Chem.
1997;528: 199-203.
-142-
[178] Snee PT, Yang H, Kotz KT, Payne CK, and Harris CB, "Femtosecond Infrared
Studies of the Mechanism of Silicon-Hydrogen Bond Activation by 115-
CpV(CO)4." 1. Phys. Chem. 1999. Accepted for publication.
[179] Hauser A, "Intersystem Crossing in Iron(II) Coordination Compounds: A Model
Process Bewteen Classical and Quantum Mechanical Behavior." Comments
Inorg. Chem. 1995; 11(1): 17-40. And references therein.
[180] Kotz KT, Yang H, Snee PT, Payne CK, and Harris CB, "Femtosecond Infrared
Studies of Ligand Rearrangement Reaction: Silyl Hydride Products from Group 6
Carbonyls." 1. Organomet. Chem. 1999. Accepted for publication.
[181] Buhks E, Navon G, Bixon M, and Jortner J, "Spin conversion processes In
solutions." 1. Am. Chem. Soc. 1980; 102(9): 2918-2923.
[182] Lin SH, "Rate of Interconversion of Electronic and Vibrational Energy." J. Chem.
Phys. 1966; 44(10): 3759-3767.
[183] Sutin N, "Theory of Electron Transfer Reactions: Insights and Hindsights," in
Book "Prog. Inorg. Chern.," Lippard SJ, Editor. 1983, John Wiley & Sons, Inc. p.
441-498.
-143 -
Copyright © 2022 FDOKUMEN