Towards endoscopic ultrafast laser microsurgery of vocal folds

Chemical Physics
ELSEVIER Chemical Physics 194 (1995) 245-258
Ultrafast energy transfer in light-harvesting chlorosomes from the green sulfur bacterium Chlorobium tepidum
Sergei Savikhin a Paula I. van Noort b Yinwen Zhu b Su Lin b Robert E. Blankenship b, Walter S. Struve a
Ames Laboratory and Department of Chemistry, Iowa State University, Ames, IA 50011, USA Department of Chemistry and Biochemistry and Center for the Study of Early Events in Photosynthesis, Arizona State Unit,ersity, Tempe,
AZ 85287-1604, USA
Received 26 October 1994
Abstract
Two independent pump-probe techniques were used to study the antenna energy transfer kinetics of intact chlorosomes from the green sulfur bacterium Chlorobium tepidum with femtosecond resolution. The isotropic kinetics revealed by one-color experiments in the BChl c antenna were inhomogeneous with respect to wavelength. Multiexponential analyses of the photobleaching/stimulated emission (PB/SE) decay profiles typically yielded (apart from a = 10 fs component that may stem from the initial coherent oscillation) components with lifetimes 1-2 ps and several tens of ps. The largest amplitudes for the latter component occur at 810 nm, the longest wavelength studied. Analyses of most two-color pump-probe profiles with the probe wavelength red-shifted from the pump wavelength yielded no P B / S E rise components. P B / S E components with = 1 ps risetime were found in 790 ~ 810 and 790 ~ 820 nm profiles, in which the probe wavelength is situated well into the BChl a absorption region. A 760 ~ 740 nm uphill two-color experiment yielded a P B / S E component with 4 - 6 ps risetime. Broadband absorption difference spectra of chlorosomes excited at 720 nm (in the blue edge of the 746 nm BChl c Qy band) exhibit = 15 nm red-shifting of the P B / S E peak wavelength during the first several hundred fs. Analogous spectra excited at 760 nm (at the red edge) show little dynamic spectral shifting. Our results suggest that inhomogeneous broadening and spectral equilibration play a larger role in the early BChl c antenna kinetics in chlorosomes from C. tepidum than in those from C. aurantiacus, a system studied previously. As in C. aurantiacus, the initial one-color anisotropies r(0) for most BChl c wavelengths are close to 0.4. The corresponding residual anisotropies r(~c) are typically 0.19-0.25, which is much lower than found in C. aurantiacus (>0 .35) ; the transition moment organization is appreciably less collinear in the BChl c antenna of C. tepidum. However, the final one-color anisotropies at 789 and 801 nm are = 0 and 0.09 respectively, and the final anisotropy in the 780 ~ 800 nm experiment is = -0 .1 . These facts indicate that the BChl a transition moments themselves exhibit some order, and are directed at an angle > 54.7 ° on the average from the BChl c moments. The one-color profiles exhibit coherent oscillations at most wavelengths, including 800 nm; Fourier analyses of these oscillations frequently yield components with frequencies 70-80 and 130-140 c m - i .
Abbreviations: BChl, Bacteriochlorophyll; CD, Circular dichroism; ESA, Excited state absorption; GVD, Group velocity dispersion; LD, Linear dichroism; PB, Photobleaching; SE, Stimulated emission; YAG, yttrium-aluminum garnet
0301-0104/95/$09.50 © 1995 Elsevier Science B.V. All rights reserved SSDI 0301-0104(95)00019-4
246 S. Savikhin et al. / Chemical Physics 194 (1995) 245-258
1. Introduction
Chlorosomes are organelles that contain the bulk of the light-harvesting pigments in green sulfur and green filamentous bacteria [1-3]. The = 1 0 4 antenna pigments in a chlorosome are preponderantly bacteri- ochlorophyll (BChl) c, d, or e, which are assembled into rodlike elements that are large enough (9-10 nm diameter) to be discernible in electron microscopy [2]. Spectroscopic and biochemical evidence suggests that BChl oligomers (rather than BChl pigment-pro- tein interactions) dominate the supramolecular orga- nization in these rods [4-7]. A chlorosome also contains a much smaller number of lower-energy BChl a pigments [8,9], which are complexed with proteins in a baseplate assembly that interfaces the BChl c / d / e rods to reaction centers in the cyto- plasmic membrane. Marked species variations exist in the BChl pigment compositions of the oligomers. BChl c pigments predominate in the rodlike ele- ments of the filamentous bacterium Chloroflexus aurantiacus and of the sulfur bacterium Chlorobium tepidum. Chlorosomes from the sulfur bacterium Chlorobium phaeovibrioides contain only homologs of BChl e, while chlorosomes from Chlorobium vibrioforme contain significant amounts of BChls c and d [10,11].
The kinetics of energy" transfers between the BChl c / d / e and BChl a antennae in whole cells and in isolated chlorosomes have been extensively studied for Chloroflexus aurantiacus. In whole cells, a major rod ~ baseplate energy transfer component occurs with = 15 ps kinetics, as revealed by BChl c decay and BChl a rise behavior in time-resolved fluores- cence [12-14]. In isolated BChl a-containing chloro- somes, a corresponding component with --10 ps lifetime is found in time-correlated photon counting [7] and pump-probe [15] experiments. The kinetics of internal energy transfers within the BChl c an- tenna have remained unclear. Decay-associated spec- tra from analyses of time-resolved fluorescence de- cays in intact BChl a-containing chlorosomes from C. aurantiacus revealed no evidence for spectral equilibration within the BChl c antenna, whereas decay-associated spectra from BChl a-free chloro- somes indicated that energy transfers between BChl c spectral forms occur with -- 5 ps kinetics [7]. Very recently, Savikhin et al. examined the pump-probe
kinetics of BChl a-containing chlorosomes from C. aurantiacus under --100 fs resolution [16]. For combinations of pump and probe wavelengths (710- 770 nm) in the broad BChl c Qy absorption band centered at 740 nm, the photobleaching (PB) and stimulated emission (SE) signals exhibited major decay components with lifetimes of typically 100 fs, 2 ps, and 10 ps. No P B / S E rise components were found for such wavelength combinations, and the broadband BChl c absorption difference spectrum between = 710 and 770 nm displayed remarkably little spectral evolution during the first few picosec- onds under 720 nm excitation. These observations appear to be inconsistent with the occurrence of sequential energy transfers between BChl c spectral forms, such as the BChl c727, c744, and c766 species suggested by the linear dichroism study of Matsuura et al. [17]. They are in qualitative accord with a hole-burning study of C. aurantiacus whole cells, which indicated that homogeneous broadening dominates the shape of the BChl c absorption band [18]. No P B / S E rise behavior was detected for probe wavelengths up to 800 nm when BChl c pigments were excited, even though the BChl a antenna exhibits a well-resolved 795-800 nm peak in the steady-state absorption spectrum of isolated chlorosomes. However, P B / S E rise behavior oc- curred (with lifetime components that mirror the 100 fs, 2 ps, and 10 ps BChl c decay components) when the pump and probe wavelengths were 790 and 820 nm, respectively. Hence, while some BChl a pig- ments receive excitation from the BChl c antenna with --- 10 ps kinetics in isolated chlorosomes from C. aurantiacus, much of the excitation appears to reach the BChl a antenna considerably faster than this. This scenario is supported by broadband absorp- tion difference profiles [16], which show that an appreciable fraction of the maximum P B / S E signal in the 790-800 nm BChl a band develops well before 2 ps.
To date, relatively few time-resolved experiments have probed energy transfer kinetics in chlorosomes from the green sulfur bacteria [19-22]. While the chlorosomes in C. aurantiacus somewhat resemble those in green sulfur bacteria, this green filamentous bacterium is not otherwise closely related to the green sulfur bacteria [23]. The relative BChl a con- tent (-- 1%) in chlorosomes from known sulfur bac-

S. Savikhin et al. / Chemical Physics 194 (1995) 245-258 247
teria is lower by a factor of = 5 than that in C. aurantiacus, with the result that the BChl a compo- nent in the Qy steady-state absorption spectrum of such chlorosomes is buried in the red edge of the BChl c absorption band. Causgrove et al. determined that energy transfers from BChls c, d, and e to BChl a occur with kinetics ranging from 30 to 160 ps, depending on the species [20,21]. In a recent study of isolated chlorosomes from Chlorobium phaeovibri- oides, van Noort et al. found that BChl e excitation becomes trapped in the BChl a antenna with a time constant of = 60 ps [22]. Extensive singlet-triplet annihilation in the BChl a antenna precluded deter- mination of the c / d ~ a energy transfer kinetics in chlorosomes from Chlorobium vibrioforme. In the latter species, energy transfers were observed from short- to long-wavelength absorbing oligomers with a time constant of = 11 ps. This situation contrasts with that in chlorosomes from C. aurantiacus, in which no clear evidence for downhill energy trans- fers within the BChl c antenna was found under 720 nm excitation at its blue edge [16]. Hence, the extent and effects of oligomer spectral heterogeneity may vary with the bacterial species.
Another distinction between the pump-probe ki- netics for the oligomeric antennae of sulfur and filamentous green bacteria arises in their anisotropy decays. For the BChl c antenna in C. aurantiacus, the initial one-color anisotropy observed under either
2 ps or ~ 100 fs resolution is r(0) = 0.4 at 740 nm, and the final anisotropy is on the order of 0.36 [16,24]. These observations indicate that the transi- tion moments of coupled BChl c pigments in these oligomers are highly organized and nearly collinear. In chlorosomes from C. vibrioforme, the initial anisotropy observed under 6 -8 ps instrument func- tion at 755 nm is r(0)--~ 0.2, and it does not decay appreciably thereafter [22]. While these initial anisotropies are not directly comparable owing to the disparate instrument function widths, the contrasting values of r(oo) suggest important structural differ- ences between the oligomeric antennae in C. auran- tiacus and C. vibrioforme. The anisotropies observed in the BChl a absorption region (790-800 nm) of chlorosomes from C. aurantiacus decay to r(oo) = 0 with a major 10 ps component [16], while the 804 nm anisotropy in chlorosomes from C. vibrioforme decays with --- 20 ps kinetics [22]. These anisotropy
decays were assigned to energy transfers between contrastingly oriented BChl a pigments. The slow- ness of the latter time scale prompted van Noort et al. to comment that the BChl a antenna in C. vibrioforme appears to be organized in clusters, rather than with uniform pigment density.
We present the results of pump-probe studies of isolated chlorosomes from the green sulfur bacterium Chlorobium tepidum under --~ 100 fs resolution. As in chlorosomes from C. aurantiacus, the oligomer pigment composition in chlorosomes from C. tepidum is principally BChl c. Since experiments have re- cently been reported on chlorosomes from C. auran- tiacus using the same laser laboratories [16], this work serves to highlight some of the species differ- ences in structure and energy transfer kinetics be- tween the sulfur and filamentous bacterial chloro- somes.
2. Materials and methods
The Ti:sapphire laser and detection system were identical to those used in the earlier work [16] on chlorosomes from Chloroflexus aurantiacus. For one-color experiments, laser tuning was provided by a single-plate birefringent filter, yielding 80-115 fs autocorrelation width and 5-10 nm spectral band- width at wavelengths from 700 to 800 nm (Fig. 1). The laser spectrum was continuously monitored us- ing a Czerny-Turner monochromator (dispersion 7.9 n m / m m ) whose output was imaged onto the linear CCD array of a Unidata BP2048 beam profiler. The average output power varied with wavelength, but was typically 600 mW at 740 nm. In two-color experiments, the Ti:sapphire cavity was operated without the birefringent filter, producing < 40 fs pulse width ( < 60 fs autocorrelation) and 20-40 nm output bandwidth. Interference filters (CVI Corpora- tion, 6 -7 nm transmission bandwidth) shaped the pump and probe pulse spectra to provide jitter-free two-color absorption difference profiles, as shown in Fig. 1. The laser cross-correlation function between pump and probe pulses in two-color experiments was typically 160-220 fs fwhm, depending on the wave- length combination used. The apparatus instrument function for data deconvolution was recorded simul- taneously with every pump-probe scan, by focusing
248 S. Savikhin et al. / Chemical Physics 194 (1995) 245-258
parts of the pump and probe beams into a LilO 3 nonlinear crystal. Time-dependent profiles and in- strument functions were routinely normalized to the pump and probe beam intensities, and accumulated in an Electra 486DX-33 computer. Decays were fitted with convolutions of the instrument function with multiexponential decay models, using a Sim- plex convolute-and-compare algorithm for least- squares optimization. All experimental functions (time delay sweeping, laser beam shutters, data ac- quisition, and data analysis) were controlled by a universal master program. In most experiments, one out of every 100 BChl c pigments was typically excited by each laser pulse ( - 5 )< 10 7
photons/pulse). Samples in pump-probe experi- ments were housed in a 7.6 cm diameter, 0.5 mm path length centrifugal cell [25] that provided rapid circulation of small sample volumes (0.5 ml) at rotation speeds up to = 3000 rpm. Experiments performed at variable laser powers and cell rotation speeds provided information about the chlorosome exciton annihilation kinetics (see below).
The broadband femtosecond spectrometer has been described earlier [26]. Excitation and probe pulses were = 150 fs fwhm at 540 Hz repetition rate. Each time sweep generated 100 digitized spec- tra at different time delays, covering a wavelength span of 140 nm. Absorption difference spectra were
- ,...i ~ 0.5
3 r
0.0 0 750 770
L0
~ 0 . 5
0.0 i '7'30 750 770
Wavelength, nm
0.5
0.0 i . . . . -0.4 0 0.4
1.0
0.5
0.0 -0.4 0 0.4
Time, ps
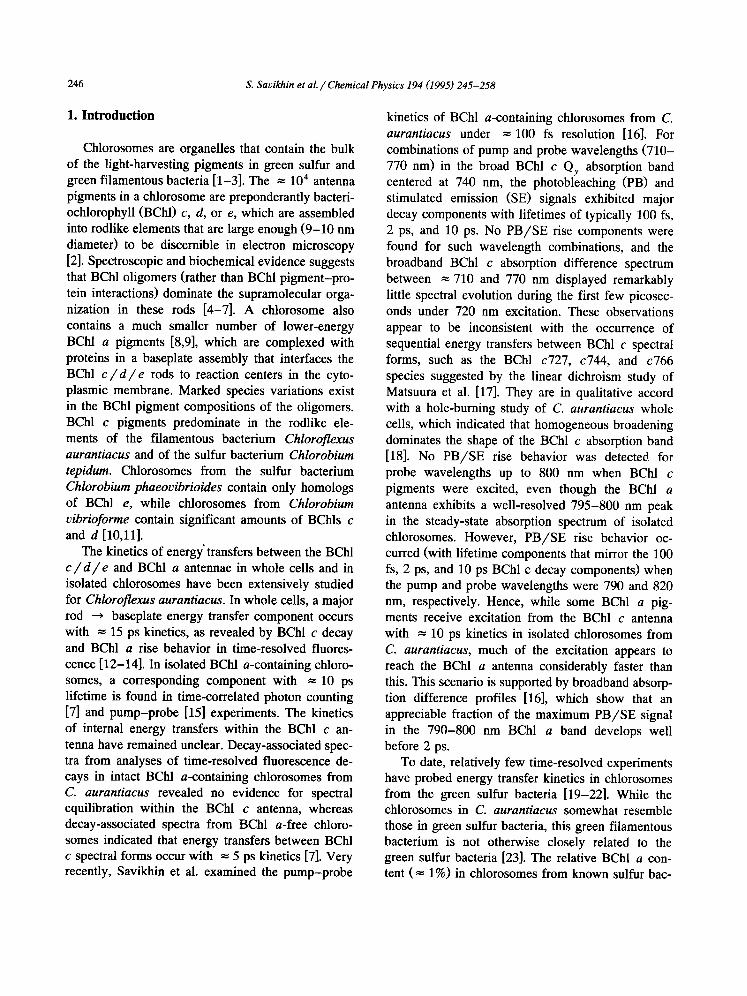
Fig. 1. Typical laser output spectra (left column) and autocorrela- tion functions (right column) in one- and two-color pump-probe experiments. In the one-color experiment (top row), center wave- length is 749 nm, bandwidth is 8.6 nm, and autocorrelation width is 106 fs. In the two-color experiment (bottom row), the transmit- ted wavelength maxima are at 741 and 758 nm (740 and 760 nm ban@ass filters), bandwidths are 6.3 and 7.1 nm, and cross-corre- lation width is 188 fs.
3
3 z
o
"~ ~ 0 700 750 800 850 Wavelength, n m
Fig. 2. Steady-state absorption (curve 1) and fluorescence (curve 2) spectra in the Qy region of isolated chlorosomes from Chloro- bium tepidum. These spectra were obtained in the presence of 10 mM sodium dithionite.
generated at all time points by signal-averaging over 1080 laser pulses.
The chlorosomes were isolated from Chlorobium tepidum according to the method of Gerola and Olson [27], except that the cells were broken using a sonicator instead of a French press. Steady-state absorption and fluorescence spectra of the chloro- some samples are given in Fig. 2. The 746 nm peak position of the BChl c Qy absorption spectrum is red-shifted by = 6 nm from that of the correspond- ing absorption band of chlorosomes from C. auranti- acus. For all experiments, 10 mM sodium dithionite was added to the sample in order to avert the singlet excitation quenching that occurs at high redox poten- tial [10,28-30].
3. Results
3.1. Isotropic kinetics
Fig. 3 shows one-color absorption difference pro- files AA(t) on a coarse time scale (0-82 ps) for several wavelengths in the main BChl c Qy absorp- tion band of chlorosomes from C. tepidum. For these chlorosomes, the zero-crossing point between re- gions where AA(t) is dominated by excited state absorption (ESA) and photobleaching/stimulated emission (PB/SE) occurs near 735 nm (vs -~ 727- 730 nm in C. aurantiacus [24]). P B /S E predomi- nates at wavelengths longer than = 735 nm. Multi- exponential decay laws are required to simulate the kinetics (Table 1). The optimized lifetimes in multi-

S. Savikhin et al. / Chemical Physics 194 (1995) 2 4 5 - 2 5 8 2 4 9
exponential fits to these and other profiles depend on the time window used. In many cases (particularly in profiles accumulated in the narrower time windows), these fits yield a large-amplitude P B / S E decay com- ponent with a typical lifetime of = 10 fs. Part of this component may correspond to the first period in coherent oscillations that are found at very early times (see below). In addition, the shape and inten- sity of the coherent coupling artifact in one-color experiments depends on the sample electronic de- phasing time relative to the laser pulse width, so that such short-lifetime components can arise from the resulting differences between the coherent spike and the laser autocorrelation function [31,32]. Other ma- jor P B / S E decay components, found at wavelengths > 749 nm, have lifetimes of typically 1 -2 and 5 -10
ps. Finally, a major PB/SE decay component with lifetime in the tens of ps (typically 35-50 ps) ap- pears at most wavelengths _> 749 nm; its largest amplitudes occur at the longest wavelength studied, 801 nm. Global analyses of time-correlated single- photon counting profiles of C. tepidum chlorosome fluorescences excited at 590 nm (not shown) yield a decay-associated spectrum (DAS) component with lifetime 39 ps. This component exhibits positive amplitudes for wavelengths 720-808 nm, and nega- tive amplitudes for wavelengths > 808 nm. Hence, this component appears to be associated with BChl c ~ BChl a energy transfer. Fig. 3 emphasizes the strong wavelength heterogeneity of the absorption difference kinetics, even for wavelengths within the BChl c absorption region. While the slowest and
Table 1
Optimized parameters for multiexponential fits to chlorosome one-color isotropic profiles a
h W i n d o w "rl(A 1) ~.2(A2 ) 7 3 ( A 3 ) , r4(A4) r s ( A s ) X 2 b
( n m ) (ps) (ps ) (ps ) (ps ) (ps ) (ps )
7 2 0 5 9 0 3 . 4 ( 8 4 ) 14(10) 6 2 4 ( 5 )
8 0 .2( - 22) 3 . 3 ( 9 0 ) 6 0 0 ( 1 0 )
7 3 9 82 1 . 4 2 ( 2 7 ) 1.6( - 68 ) 15(57) 500(8)
8 0 . 2 3 ( 5 1 ) 5 .2( - 14) 9 . 5 ( 3 6 ) 500(13)
7 4 9 5 9 0 8 .4( - 78 ) 42( - 16) 516 ( - 7)
82 3 .5( - 34) 13( - 58 ) 516( - 8)
8 0.01 0.4( - 15) 5 .2( - 52 ) 33( - 33 )
8 0.01 0.5( - 16) 5 .4( - 67) 516( - 16)
7 5 9 8 0.01 2.3( - 34 ) 9 .6( - 66)
7 6 0 82 0.01 3.5( - 71) 12( - 25 ) 497 ( - 4) 5 8 2
82 0.01 2.7( - 4 6 ) 7 .0( - 48 ) 85( - 6) 500( - l ) 5 6 0
8 0.01 1.8( - 37 ) 7 .3( - 63)
7 6 9 5 9 0 2 .0( - 37 ) 8 .7( - 61) 330( - 3) 104
5 9 0 1.4( - 24 ) 7 0( - 70) 42( - 4) 533 ( - 2) 64
82 0 .01 1.6( - 26 ) 6 .7( - 66 ) 33( - 5) 530( - 3)
8 0 .01 2 .1( - 35 ) 7 .7( - 65 )
771 8 0 . 0 2 1.6( - 22 ) 7 .1( - 78)
7 7 9 82 0 .01 2 . 6 ( - 4 5 ) 9 . 1 ( - 5 4 ) 500( - 1)
8 0 .01 1.5( - 27 ) 6 .9( - 73)
7 8 9 5 9 0 1.4( - 21 ) 7 .4( - 62) 35( - 17)
8 2 0 . 0 9 ( - 34 ) 4 .7( - 50 ) 27( - 16) 6 1 9
8 2 0 .01 1.5( - 25) 6 .6( - 60 ) 34( - 15) 2 7 2
8 0 .01 1.5( - 29) 8 .6( - 71)
801 5 9 0 18( - 50 ) 68( - 50 )
8 2 7 . 1 ( - 2 3 ) 4 1 ( - 6 5 ) 1 0 4 ( - 12) 2 0 8
8 2 0 . 0 6 7 .7( - 27) 48( - 73 ) 5 3 5
8 2 0 . 0 6 1.7( - 12) 15( - 30 ) 54( - 58 ) 2 8 8
8 0.01 1.4( - 12) 28( - 88 )
a Negative amplitudes correspond to P B / S E decays, and sum to - 1 0 0 within roundoff error for each decay; parameters in italics were held fixed. The amplitude of subpicosecond components were not included in the computation of the normalized amplitudes. b The figure of merit is shown only for comparative fits of the same profile with different decay models.

250 S. Savikhin et al. / Chemical Physics 194 (1995) 245-258
1.0
0.5
0 0 2 0 4 0 6 0 8 0
0
0 20 40 60 80 ~ o
<3 749 rum -l.O
0 2 0 4 0 6 0 8 0
-0.5
-1.0 0 8 0 4 0 6 0 8 0
0 8 0 4 0 6 0 8 0
0 2 0 4 0 6 0 8 0
789 nm
0 2 0 4 0 6 0 8 0
0 8 0 4 0 6 0 8 0
Time, ps
Fig. 3. One-color isotropic absorption difference signals for cblorosomes from C. tepidum at eight wavelengths from 720 to 801 nm, shown in 82 ps time window. Parameters for optimized multiexponential fits to these and other one-color isotropic decays are listed in Table 1. Positive and negative signals correspond to ESA and P B / S £ , respectively in this work.
most rapid overall decays are observed at the longest and shortest wavelengths (801 and 720 nm respec- tively), the wavelength trend in the kinetics of Fig. 3 is not monotonic. For example, the empirical 1 /e decay time in the 749 nm PB/SE signal is slower than the corresponding decay time in both the 720 nm ESA signal and the 769 nm PB/SE signal. The PB/SE decay profile at 739 nm (which is close to the zero-crossing point for chlorosomes from C. tepidum) exhibits an unusual convex shape during the first 15 ps. Simulation of this profile required the use of two components with similar lifetimes (1.4 and 1.6 ps) and amplitudes of opposite sign (Table 1).
Several two-color pump-probe profiles are shown in Fig. 4. In most cases, the signal is dominated throughout by PB/SE. In the 740 ~ 760 nm profile (for chlorosomes pumped and probed at 740 and 760 nm, respectively), no PB/SE risetime features emerge from multiexponential analyses in either 8 or 82 ps time windows (Table 2). There is similarly no PB/SE rise behavior in the 780 ~ 800 profile in Fig. 4, even though the probe wavelength in this case lies well inside the BChl a absorption region. Hence, these two-color profiles for probe wavelengths red- shifted by ~-20 nm from the pump wavelength
Table 2 Optimized parameters for multiexponential fits to two-color isotropic profiles for chlorosomes a
A Window "/'l(k 1) T2(A2) r3(A 3 ) ~-4(A 4 ) 75(A5) X 2 (nm) (ps) (ps) (ps) (ps) (ps) (ps)
740-760 82 0.01 3.5( - 64) 11( - 32) 500( - 4) 431 82 0.01 1.8( - 27) 6.3( - 66) 82( - 7) 268
8 2 . 1 ( - 3 7 ) 7 . 9 ( - 6 3 ) 760-740 24 0.01 2.8(47) 2 4 ( - 100)
8 0.01 4.2(57) 2 4 ( - 100) 297 8 0.1 6.4(59) 2 4 ( - 100) 2518
780-800 590 16( - 44) 68( - 55) > 1000( - 2) 82 2.0( - 14) 14( - 36) 73( - 50)
8 0.7( - 13) 25( - 87) 290 8 0.2( - 14) 6.8( - 37) 355( - 49) 207
790-810 590 65( - 100) 82 1.0(8) 6 3 ( - 100)
8 1.1(11) 5 5 ( - 100) 790-820 82 1.1(17) 1 1 0 ( - 100)
a Positive amplitudes correspond to P B / S E rise components; P B / S E decay component ampfitudes sum to - 100 within roundoff error. Parameters in italics were held fixed.

S. Savikhin et al. / Chemical Physics 194 (1995) 245-258 251
-0.5
0 10 20
~- 0.5 ~ o .
"~ -0.5 m
0 10 20 • <3 0
-1.0 i i i
0 10 20
10 20
- 790->8101
10 20
f 790->820
i i
0 10 20
Time, p s
Fig. 4. Two-color isotropic absorption difference signal for several pump-probe wavelength combinations for chlorosomes from C. tepidum. The panel labelled (740 --) 740)-(760 -* 740) is the dif- ference between the respective one- and two-color profiles, mutu- ally normalized at long times. Parameters for optimized multiex- ponential fits to these two-color decays are listed in Table 2.
show no direct evidence for resolvable downhill energy transfers between spectrally distinct BChl c and /or BChl a pigments. However, a -- 1 ps rise feature does appear in the 790 ---) 810 nm and 790 820 nm two-color profiles. This rise component ex- hibits larger amplitude in the latter case than in the former case (Table 2). The rise behavior in these profiles somewhat resembles that previously ob- served in the 790 ---) 810 and 790 ---) 820 nm profiles for chlorosomes from C. aurantiacus [16]. However, the 790 ---) 820 nm profile for C. aurantiacus, unlike the one for C. tepidum, showed pronounced triexpo- nential rise kinetics with lifetime components of -- 100 fs, 1 -2 ps, and = 10 ps.
Of particular interest in Fig. 4 is the 760 ---) 740 nm two-color profile, in which the probe wavelength is shifted 20 nm to the blue from the pump wave- length. Following rapid switching from ESA to P B / S E within the first 50 fs, this profile shows marked P B / S E rise behavior with 4 - 6 ps kinetics (Table 2). Employing a short component with a fixed lifetime appreciably longer than 10 fs (e.g. 100 fs) considerably increases c 2 for multiexponential fits to this profile, as shown in Table 2. Since there is no
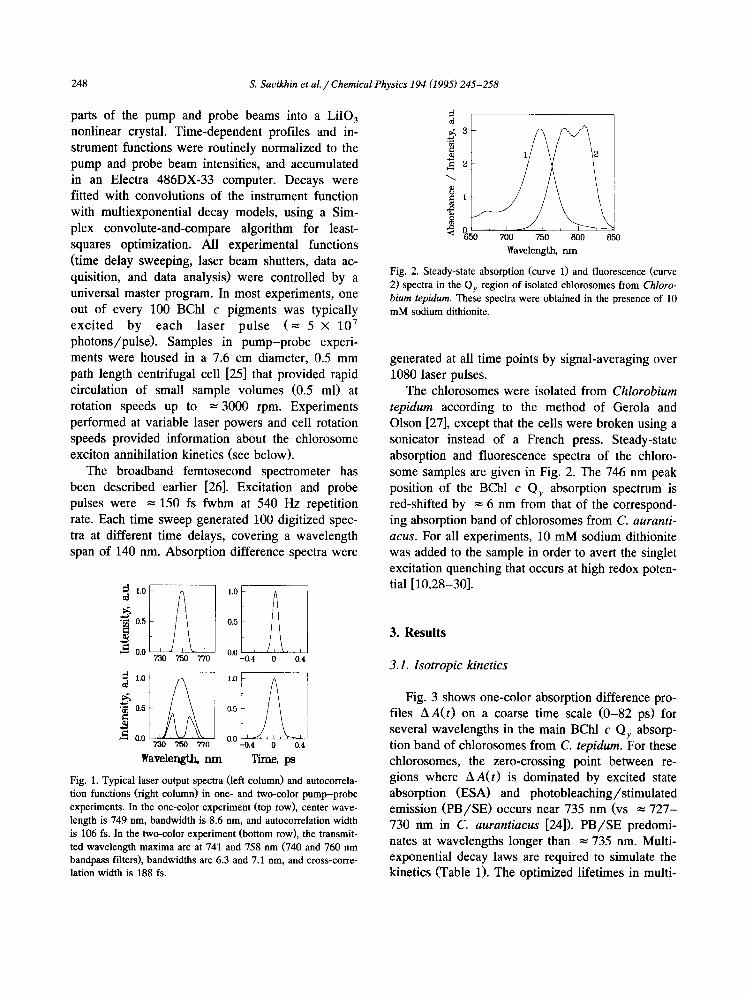
spectral overlap between the pump and probe pulses in this two-color experiment (Fig. 1), this fast com- ponent cannot stem from a coherent coupling arti- fact. Hence, the subpicosecond switching from ESA to P B / S E must correspond either to a previously unresolved energy transfer step, or to relaxation be- tween exciton components in the aggregate antenna. One of the panels in Fig. 4 plots the difference between the 760 --) 740 nm profile and the 740 nm one-color profile. A triexponential fit to the differ- ence profile yields components with lifetimes 10 fs (for the bipolar switching), 450 fs, and 3.8 ps. The presence of P B / S E rise components in the 760 740 nm profile suggests that BChl c spectral hetero- geneity plays a larger role in the internal energy transfer kinetics of the oligomeric antennae in C. tepidum than in C. aurantiacus, because no similar rise behavior was observed in uphill two-color exper- iments in chlorosomes from C. aurantiacus [16]. Such an interpretation is supported by broadband absorption difference profiles for C. tepidum chloro- somes excited at 720 and 760 nm, as shown in Fig. 5. For excitation at the blue edge of the 746 nm BChl c absorption band, the maximum in the P B / S E spectrum exhibits a noticeable dynamic red shift (from = 743 to = 750 nm) during the first 380 fs. No comparable evolution is observed in the BChl c P B / S E spectrum of chlorosomes from C. aurantia- cus excited at 720 nm [16]. Hence, while downhill energy transfers among inequivalent BChl c pig- ments are not evident in the broadband absorption difference spectra of chlorosomes from C. aurantia- cus, they appear to be clearly asserted in the broad- band spectra of C. tepidum. Finally, the lower panel in Fig. 5 shows the difference spectra of chlorosomes excited at the red edge (760 nm) of the BChl c Qy band. For this excitation wavelength, the position of the BChl c P B / S E maximum does not shift appre- ciably during the first few ps. In contrast to C. aurantiacus chlorosomes excited at 760 nm, no sepa- rately resolved BChl a P B / S E absorption difference peak appears at = 800 nm for C. tepidum at early times.
3.2. Annihilation
Fig. 6 shows one-color profiles at 760 nm, ob- tained with the sample cell rotating at maximum
2 5 2 S. Savikhin et al. / Chemical Physics 194 (1995) 245-258
0 . 0 5 . , i , , , i • , , F , , , i . . . i , . . i , . , i
720 nm -__=- - - - - ZZi - iSC ",- . . .
o oo, . . . . . ooo : /
-ol ---1.02p, \ . ~ ~
680 700 720 740 760 780 800
0.04 . , . . . , . . . , . . , . . . , . . , . . . , ~ ~ 760 nm
0.02 ~ . ~ ~ / ~
0
0
<~ -0.04 . . . . . 0.0 ps ".L"
o o 6 o 3 8 ~ \ / - - - 1 . o 2 p, \ /
- 0 . 0 8 - - - 8 0 ps "~Y
- 0 . 1 . , . . . , , , , i , , , , . . . , . . . , , , , i
680 700 720 740 760 780 800
wavelength (nm)
Fig. 5. Absorption difference spectra of chlorosomes excited at 720 nm (top) and 760 nm (bottom), probed at several time delays from 0 to 80 ps.
speed (3000 rpm). The probe power at the sample cell was fixed at 4 mW, while the pump power varied by more than two orders of magnitude from 0.05 mW to 9 mW. The laser spot diameter at the cell was = 50 p,m. Since the bulk of the excitation
0
:d :$
-0 .5
o ¢ # 3
<3 -1
- - v v 1
0 2 4 6
Time ps
Fig . 6. L a s e r p o w e r d e p e n d e n c e o f o n e - c o l o r i s o t r o p i c d e c a y s at
7 6 0 n m . P r o b e b e a m p o w e r w a s f ixed at 4 m W , c u r v e s are g i v e n
fo r p u m p b e a m p o w e r s 9 m W (1), 4 .5 m W (2), 0 . 2 2 m W (3), a n d
0 .05 m W (4). T h e p ro f i l e s a re m u t u a l l y n o r m a l i z e d at the p e a k s igna l .
leaves the BChl c antenna within tens of ps (Figs. 3 and 4 and Tables 1 and 2), the observed differences between the curves in Fig. 6 stem from singlet- singlet rather than singlet-triplet annihilation. At laser powers < 0.2 mW, each chlorosome absorbed < 1 photon/pulse. When the 0.05 mW curve in Fig. 6 was normalized to the 9 mW curve and then subtracted from it, the residual profile (not shown) was well described by a single exponential decay law with lifetime 1.2 ps. This annihilation compo- nent resembles a lifetime that frequently emerges in our analyses of one- and two-color isotropic decays (Tables 1 and 2), and this may be a characteristic timescale of rod-to-rod excitation hopping. It would clearly be of interest to perform similar experiments
- 0 . 5 - 0 . 5
~ - 1 . 0 - 1 . 0
0 10 20
o
0 " 01
•I• - I . i
- 0 . 5
7 8 9 n m
L J I
0 20 40
0.2
0 0 I0 20 0 20 40 0 20 40
r i f f l e , p s
0 20 40
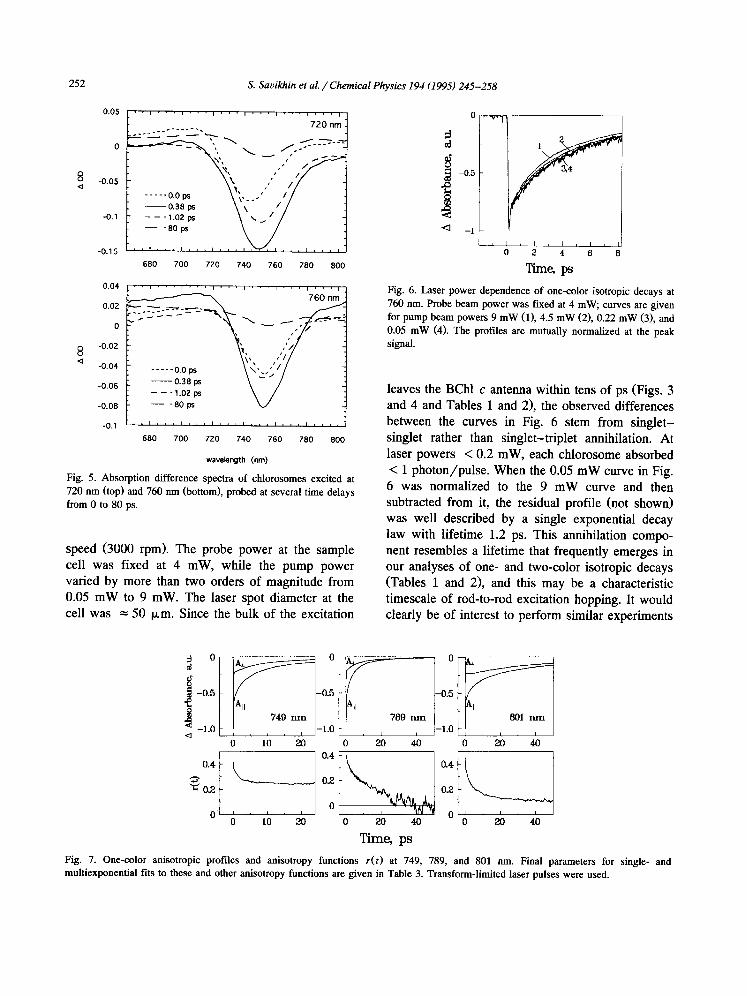
F ig . 7. O n e - c o l o r a n i s o t r o p i c p r o f i l e s a n d a n i s o t r o p y f u n c t i o n s r(t) at 749 , 789 , a n d 8 0 1 n m . F ina l p a r a m e t e r s fo r s ing le - a n d m u l t i e x p o n e n t i a l f i t s to t h e s e a n d o t h e r a n i s o t r o p y f u n c t i o n s a re g i v e n in T a b l e 3. T r a n s f o r m - l i m i t e d l a se r p u l s e s w e r e used .

S. Savikhin et al. / Chemical Physics 194 (1995) 245-258 253
in the BChl a absorption region (790-810 nm), but the low absorption coefficient at these wavelengths precluded measurement of profiles over a range of powers similar to that in Fig. 6.
3.3. Anisotropy decays
The anisotropy decays in chlorosomes from C. tepidum exhibit interesting wavelength dependence, and they differ considerably from those in C. auran- tiacus [16]. Fig. 7 shows representative one-color anisotropic profiles and anisotropy decays obtained at 749, 789, and 801 nm. At 749 nm (which is characteristic of most anisotropy decays found in the BChl c absorption region), the initial anisotropy r(0) is 0.37, and the residual anisotropy r(oo) is 0.25. Single-exponential fits to r ( t ) at this wavelength yield anisotropy decay times of 1.8 and 2.2 ps, respectively, in 8 and 82 ps time windows. At other BChl c wavelengths (up to and including 779 nm), the initial anisotropies range from 0.34 to 0.39, the residual anisotropies range from 0.19 to 0.25, and single-exponential fits yield lifetimes of 1.7 to 3.2 ps, irrespective of whether the window is 8 ps or 82
ps. There is little evidence for the existence of a major, longer-lifetime component in the anisotropy decays at these wavelengths, except possibly at 769 nm (Table 3). These residual anisotropies are far lower than those found in the BChl c antennae of chlorosomes from C. aurantiacus (where r(oo) is typically about 0.36); they are comparable to the residual anisotropy found in chlorosomes from an- other green sulfur bacterium, C. vibrioforme [22]. Our BChl c anisotropy decay times are shorter than the 6 - 8 ps time resolution of the earlier work [22], which may be why the initial anisotropy decay was not observed.
At 801 nm (in the BChl a region), the residual anisotropy r(oo) is 0.09; at the intermediate wave- length of 789 nm, it drops to near 0 (Fig. 7 and Table 3). It was necessary to include a 22 ps lifetime component in addition to a 2 - 3 ps lifetime compo- nent in order to model the 801 nm anisotropy decay.
The 780 ~ 800 nm two-color anisotropy function (Fig. 8 and Table 3) decays to negative values at long times (r(oo) = -0 .11 ) . At least two exponential terms are required to describe this anisotropy decay (yielding lifetimes of 7.7 and 49 ps). An improved fit
Table 3 Optimized parameters for multiexponential fits to one- and two-color anisotropy decays a
A Window rl(A 1 ) ~'2 ( A 2 ) r3(A 3 ) r(OO) r (0) (nm) (ps) (ps) (ps) (ps)
720 24 3.3 (0.14) 0.18 8 2.0 (0.15) 0.19 0.34
739 82 2.0 (0.13) 0.24 8 1.7 (0.13) 0.24 0.37
749 82 2.2 (0.13) 0.25 8 1.8 (0.12) 0.25 0.37
769 82 2.5 (0.15) 0.24 24 3.7 (0.14) 0.23 24 1.8 (0.11) 9.7 (0.07) 0.22 0.39
779 8 3.2 (0.16) < 0.2 b 0.39 789 8 3.9 (0.21) = 0 b 0.39 801 82 3.3 (0.19) 22(0.10) 0.09
8 2.0 (0.23) 22(0.15) 0.02 0.40 740 ~ 760 82 3.2 (0.11) 0.24
8 2.9 (0.13) 0.24 0.37 780 ---' 800 164 7.7(0.22) 49(0.19) -- 0.11
164 1.3 (0.10) 10.1(0.20) 54(0.17) -- 0.11 0.36
The initial anisotropies r(0) are more accurately determined using 8 ps time windows, while profiles from longer time windows yield more accurate residual anisotropies r(oo). Initial anisotropies are obtained by extrapolation of fits excluding the first spike in the isotropic decays. b From fits to anisotropy decays measured using 82 ps time window.

2 5 4 S. Savikhin et al. / Chemical Physics 194 (1995) 245-258
is obtained with a triexponential model, which yields the lifetimes 1.3, 10.1, and 54 ps. An antecedent for the appearance of a negative residual anisotropy in this two-color experiment appears in the work of Otte et al. [10], who measured negative BChl a fluorescence polarizations in chlorosomes of several green sulfur bacteria ( Prosthecochloris aestuarii, C. vibrioforme, and C. phaeovibrioides) upon excitation of their BChl c / d / e antennae.
3.4. Coherent oscillations
As in chlorosomes from C. aurantiacus [16], one-color absorption difference profiles of the BChl c antenna of chlorosomes from C. tepidum show coherent oscillations at very early times (Fig. 9). These oscillations are less pronounced than the ones observed in C. aurantiacus, and they are damped within 1.5-2 ps. Fig. 9 also shows the oscillating parts of the isotropic decays and their Fourier trans- form spectra. The oscillating parts of the signals cannot be uniquely identified, because their defini- tion depends on the fitting procedure used for simu- lating the nonoscillating part. However, recurring components in the Fourier spectra for several wave- lengths emerge at 70-80 and 130-140 cm -1. While no coherent oscillations were found in chlorosomes from C. aurantiacus for wavelengths near 800 nm in the BChl a absorption band (nor were they found in the FMO BChl a pigment-protein complex from C.
0
cd
-0 .5
<3 -1 .0
AAII
~ ' 0 .
0 50 100 150
Time, ps
Fig. 8. Two-color anisotropic profiles and anisotropy function r(t) for pump-probe wavelengths 780 ~ 800 nm. Final parame- ters for bi- and triexponential fits to this anisotropy function are given in Table 3.
A 0
- 1 0 0 i , i , i
0 l 2
~ - I 0 0
"~ 0 1 2 0
- 1 0 0 i , i , i 0 ! 2
13
l rv vv ,
C
1
0 0 100 200 300 0 1 2
0 l 2 0 100 200 300
0 t
- 3
0 0 1 2 0 100 200 300
T i m e , p s F r e q u e n c y , c r a -~
Fig. 9. Coherent oscillations in 759, 779, and 801 nm one-color profiles at early times. Columns show (A) absorption difference profiles, (B) oscillating parts of absorption difference profiles, and (C) Fourier transform spectra of oscillating parts.
tepidum [33,34]), they are observed at 801 nm in chlorosomes from C. tepidum.
4. 4. Discussion
4.1. Annihilation
Annihilation effects are likely to be strongly ac- centuated in the empirical antenna kinetics of chloro- somes from green sulfur bacteria. Only = 1% of the chlorosome pigments are BChl a (1.5% in C. vibrio- forme, 0.9% in C. phaeovibrioides [22]); the remain- der are BChl c / d / e pigments organized into oligomers. Oligomer excitations are sharply funneled with high efficiency (90-100%) into the BChl a baseplate antenna [28,29,35]. Since a green bacterial chlorosome typically contains = 104 BChl pig- ments, some 100 of them are BChl a pigments. In a typical Ti:sapphire pump-probe experiment, the laser beam waist diameter in the sample cell was ~--50 ixm, and the 7.6 cm diameter cell was rotated at a maximum frequency of = 3000 rpm. Under these conditions, the sample translational speed through

s. Savikhin et al. / Chemical Physics 194 (1995) 245-258 255
the beam was -- 10 m/s , and the sample residence time in the beam was ~-5 Vs. During this time, a sample region was exposed to ~- 400 pulses from a 76 Mttz repetition rate Ti:sapphire laser. For a 2 mW average power Ti:sapphire laser beam, a single pulse created --~ 10 BChl c singlet excitations per chlorosome at 746 nm, and fewer than this at other wavelengths. If all of these excitations reached the BChl a antenna and the subsequent BChl a intersys- tem crossing yield was = 0.30, the BChl a antenna became saturated with triplet excitations after only 33 laser pulses at 746 nm. For this reason, singlet- triplet annihilation is likely to play a major role in the BChl a antenna kinetics as revealed by the Ti:sapphire pump-probe experiments.
BChl c triplet accumulation is unlikely to be significant, since BChl c excitations typically reach the BChl a antenna within ~< 40 ps (see below). The effects of BChl c singlet-singlet annihilation, ob- served at 760 nm under conditions where the pump pulse created = 20 excitations/chlorosome and the probe pulses created between 0.25 and 45 excita- tions/chlorosome (Fig. 6), appear to be compara- tively minor. However, these effects may be limited by the relatively small dynamic range ( = 200-fold) of probe pulse intensities used in the Ti:sapphire experiments. More marked pump pulse intensity de- pendence is observed in the broadband absorption difference experiments (not shown), in which the pump pulses contain as much as 1 IxJ. Since the lifetime of the 1.2 ps difference component that arises in comparisons between P B / S E decays evalu- ated at different probe powers in Fig. 6 is similar to that of the major 1-2 ps components found in the BChl c isotropic and anisotropic decays (Tables 1 and 2), this annihilation timescale may simply corre- spond to the mean time required for BChl c excita- tions to diffuse to the nearest excited singlet site.
4.2. Inhomogeneity of BChl c kinetics
The oligomeric antennae of chlorosomes from both C. aurantiacus and C. tepidum are composed principally of BChl c homologs, unlike those in C. vibrioforme and C. phaeovibrioides [22]. Aside from the presence of homologies in their alkyl side groups, both of these BChl c antennae appear to be chemi- cally homogeneous. Hole-burning [18] and pump-
probe experiments [16] indicate that the BChl c antenna in C. aurantiacus is (to a large extent) spectrally homogeneous as well. For example, the BChl c P B / S E spectrum in chlorosomes from C. auranticacus shows little spectral evolution during the first few picoseconds when it is excited at its blue edge at 720 nm. Similarly, no P B / S E rise kinetics are detected in uphill or downhill two-color experiments on these chlorosomes using pump and probe wavelengths in the BChl c absorption region. However, the present experiments show many indi- cations of spectral inhomogeneity in the BChl c antenna of chlorosomes from C. tepidum. The BChl c absorption difference spectrum in this case exhibits a detectable red-shift (Fig. 5) when the chlorosomes are excited at 720 nm. The amplitude distributions for the 35-50 ps P B /S E decay components yielded by multiexponential fits to one-color profiles tend to be concentrated at the longest wavelengths studied (789 and 801 nm), as shown in Table 2. This situa- tion somewhat resembles the one observed in C. phaeovibrioides [22], in which excitation tends to accumulate on the longer-wavelength BChl e pig- ments prior to being transferred to the BChl a antenna with --60 ps kinetics. A 4 -6 ps P B /S E rise component that appears in the 760--* 740 nm two-color experiment in C. tepidum (Fig. 4) has no counterpart in the pump-probe spectroscopy of C. aurantiacus [16]. The latter situation apparently arises because C. tepidum exhibits distinct BChl c spectral forms that are sufficiently well resolved to exhibit rise kinetics due to spectral equilibration in a two- color experiment, whereas C. aurantiacus does not. The question then arises as to why the 740-~ 760 nm two-color experiment does not show rise kinetics as well, stemming from downhill energy transfers between BChl c components absorbing near the respective wavelengths (Table 2). In a such a down- hill pump-probe experiment, SE from the excitation donor species strongly overlaps PB from the accep- tot species at 760 nm, and thus the donor SE decay kinetics can overshadow the acceptor PB rise kinet- ics.
These results indicate that pigment composition (i.e. relative proportions of BChls c, d, and e) may be less important to the oligomer internal energy transfer kinetics than species differences in chloro- some structure. The spectral heterogeneity in the

256 S. Savikhin et al. / Chemical Physics 194 (1995) 245-258
BChl c antenna of C. tepidum appears to stem from organizational features (e.g. chlorosome size, lipids and proteins) that C. tepidum shares with other green sulfur bacteria such as C. vibrioforme and C. phaeovibrioides. It appears not to be a consequence of chemical heterogeneity in the pigments.
The intriguing one-color profile at 739 nm (Fig. 3) can only be simulated by combining a P B / S E decay component with a nominal P B / S E rise com- ponent with slightly shorter lifetime, as shown in Table 1. In an optimized fit to this profile using an 82 ps window, the P B / S E decay and rise times are 1.4 and 1.6 ps, respectively. Since this wavelength is close to the zero-crossing point between empirical BChl c ESA and P B / S E regions, the net absorption difference signal at this wavelength may be due to a superimposition of P B / S E decay in a certain BChl c species, combined with ESA decay (with slightly faster kinetics) in second, longer-wavelength BChl c species. The 1.4-1.6 ps lifetimes are similar to one that appears in the isotropic P B / S E decay kinetics at other BChl c wavelengths (Table 1), and to the BChl c one-color anisotropy decay times (Table 3). The peculiar shape in the 739 nm profile may thus arise from "heterodyning" of similar (but slightly differ- ent) energy transfer kinetics in different portions of the BChl c antenna, and it illustrates the complexity of the experimental kinetics that can arise in spec- trally inhomogeneous antennae. No similar profile was observed in the pump-probe spectroscopy of chlorosomes from C. aurantiacus [16]. BChl c com- ponents with 1-2 ps lifetime were observed in the BChl c antenna kinetics of chlorosomes from C. aurantiacus [16], and it was suggested that they may arise from rod-to-rod energy transfers.
4.3. BChl c ~ BChl a energy transfer kinetics
Global analyses of time-resolved fluorescences excited at 590 nm in chlorosomes from C. tepidum yield a DAS component with 39 ps lifetime, exhibit- ing positive (decay) amplitudes and negative (rise) amplitudes for wavelengths shorter and longer than 808 nm, respectively. This lifetime resembles those of P B / S E decay components (typically 35-50 ps) that appear in the BChl c one-color pump-probe experiments (Table 1). The latter components gain
importance at the longer wavelengths. Hence, the 35-50 ps timescale is likely associated with BChl c ~ BChl a energy transfers. There are several precedents for the observation of BChl c ~ BChl a energy transfers in other green sulfur bacteria with kinetic components in the tens of ps [20-22]. How- ever, the maximum amplitude of the BChl c fluores- cence decay component in the 39 ps DAS spectrum (at = 775 nm) is larger than that of the BChl a rise component (at =8 1 7 nm) by a factor of = 10. While this can be rationalized ad hoc by postulating that the BChl a Qy absorption oscillator strength is smaller than that for BChl c by a similar factor, it fails to explain why no BChl a rise components with lifetimes in the tens of picoseconds are found in our 790 ~ 810 or 790 ~ 820 nm two-color experi- ments on the same chlorosomes. Similarly, the two- color experiments do not show major P B / S E decay components with lifetimes in the hundreds of pi- coseconds (which are typical of BChl a antennae in chlorosomes [16,22]), even though such decay com- ponents appear in the fluorescence DAS spectrum of C. tepidum (lifetime = 540 ps) and in 790 ~ 820 nm two-color experiments on chlorosomes from C. aurantiacus [16]. These differences can probably be attributed to contrasting extents of singlet-triplet annihilation in the BChl a antennae. Such annihila- tion is less prevalent in chlorosomes from C. auran- tiacus, which have a BChl a pigment fraction that is larger by a factor of = 5 (and consequently exhibit less funnelling) than chlorosomes from C. tepidum. It is also less prevalent in the time-correlated photon counting experiments on chlorosomes from C. tepidum (where the higher detection sensitivity al- lows lower excitation densities), although the dispar- ity in amplitudes between the BChl c decay and BChl a rise components suggests that singlet-triplet annihilation still influences the photon counting ki- netics. Singlet-triplet annihilation thus appears to pre-empt 35-50 ps B C h l a P B / S E rise components (and a fortiori BChl a P B / S E decay components with lifetimes in the hundreds of picoseconds) in the Ti:sapphire pump-probe experiments.
While the 790 ~ 810 and 790 ~ 820 nm two- color experiments show no evidence for 35-50 ps P B / S E rise behavior, they do exhibit = 1 ps rise components. This suggests that at lower excitation densities the BChl a antenna would receive excita-

S. Savikhin et al. / Chemical Physics 194 (1995) 245-258 257
tion with multiexponential kinetics, as occurs in chlorosomes from C. aurantiacus [16]. It also im- plies that the singlet-triplet annihilation in the BChl a antenna occurs at a rate that is bounded from above by = 1 ps. In summary, saturation of the BChl a antenna by accumulated triplet excitations in the pump-probe experiments precludes direct obser- vation of the natural BChl c ~ BChl a energy transfer kinetics that would occur under low-level light. Such an observation awaits the development of pump-probe techniques with far higher sensitivity than the present double-modulation detection appara- tus [34].
4.4. Anisotropy
For pump and probe wavelengths in the main BChl c absorption region (720-779 nm), the one- and two-color anisotropy parameters are fairly uni- form. The initial anisotropy r(0) is generally 0.37- 0.40, the residual anisotropy r(~) is 0.19-0.25, and the anisotropy decay time yielded by single-exponen- tial fits to r(t) is usually between 1.7 and 3.5 ps. While these initial anisotropies resemble those found in chlorosomes from C. aurantiacus, the residual anisotropies are considerably lower than those found in C. aurantiacus ( = 0.36). They are far more simi- lar to the residual anisotropies measured by van Noort et al. [22] in chlorosomes from the green sulfur bacterium C. vibrioforme. The probed BChl c transition moments are thus considerably more collinear in the green filamentous bacterium C. au- rantiacus than in the green sulfur bacteria C. tepidum and C. vibrioforme. This result is of particular inter- est, because the pigment composition of the oligomeric antenna in C. tepidum is believed to be far more similar to that in C. aurantiacus (homologs of BChl c only) than to that in C. vibrioforme (homologs of BChl d as well as c). Hence, pigment composition (aside from homolog structure) appears not to be the principal determinant of the transition moment organization in BChl c antennae. It may be revealing to study comparative pump-probe anisotropies in aggregate solutions of BChl c pig- ments extracted from C. tepidum and C. aurantia- cus, to determine whether the reconstituted oligomers structurally resemble the BChl c rods in the respec- tive chlorosomes. Finally, the 1.7-3.5 ps decay times
yielded by single-exponential fits to the BChl c anisotropies (Table 3) may arise from weighted aver- ages of the major 1-2 ps and 5-10 ps decay compo- nents found in the isotropic decays (Table 1). Analo- gous 1-2 ps and = 10 ps components occur in the isotropic BChl c P B / S E decay kinetics of C. auran- tiacus [16]. The comparatively slow 1.7-3.5 ps anisotropy timescale surely does not correspond to single-step energy transfers between BChl c pig- ments in this strongly coupled antenna; energy trans- fers in Fenna-Matthews-Olson (FMO) trimers [34] and the LHC-II light-harvesting antenna in green plants [36] are known to occur within several hun- dred femtoseconds. Hence, significant short-range correlations probably exist in the BChl c transition moment orientations, and the observed depolariza- tion must stem primarily from cumulative or long- range energy transfers.
The one-color residual anisotropy drops to = 0 at 789 nm, and then rises to 0.09 at 801 nm; the 780 ~ 800 nm two-color anisotropy is concomitantly = -0 .1 . These facts collectively imply that long- wavelength pigments absorbing at = 800 nm exhibit transition moments aligned at an angle > 54.7 ° from the shorter-wavelength BChl c transition moments.
Acknowledgements
The Ames Laboratory is operated for the U.S. Department of Energy by Iowa State University un- der Contract No. W-7405-Eng-82. This work was supported in part by the Division of Chemical Sci- ences, Office of Basic Energy Sciences (to WSS) and in part by grant DE-FG-85ER133388 (to REB) from the Division of Energy Biosciences of the U.S. Department of Energy. This is publication number 229 from the Arizona State University Center for the Study of Early Events in Photosynthesis.
References
[1] L.A. Staehelin, J.R. Golecki, R.C. Fuller and G. Drews, Arch. Microbiol. 119 (1978) 269.
[2] J.M. Olson, Biochim. Biophys. Acta 594 (1980) 33. [3] R.E. Blankenship, D.C. Brune and B.P. Wittmershaus, in:
Light energy transduction in photosynthesis: Higher plant and bacterial models, eds. S.E. Stevens and D.A. Bryant
258 S. Savikhin et al. / Chemical Physics 194 (1995) 245-258
(American Society of Plant Biologists, Rockville, MD, 1988) p. 33.
[4] J.M. Olson, P.D. Gerola, G.H. van Brakel, R.F. Meiburg and H. Vasmel, in: Antennas and reaction centers of photosyn- thetic bacteria, ed. M.E. Michel-Beyerle (Springer, Berlin, 1985) p. 67.
[5] D.C. Brune, T. Nozawa and R.E. Biankenship, Biochemistry 26 (1987) 8644.
[6] M. Hirota, T. Moriyama, K. Shimada, M. Miller, J.M. Olson, and K. Matsuura, Biochim. Biophys. Acta 1099 (1992) 271.
[7] A.R. Holzwarth, M.G. Miiller and K. Griebenow, J. Pho- tochem. Photobiol B. Biol. 5 (1990) 457.
[8] J.A. Betti, R.E. Blankenship, L.V. Nagarajan, L.C. Dickin- son and R.C. Fuller, Biochim. Biophys. Acta 680 (1982) 194.
[9] P.D. Gerola and J.M. Olson, Biochim. Biophys. Acta 848 (1986) 69.
[10] S.C.M. Otte, J.C. van der Heiden, N. Pfennig and J. Amesz, Photosynth. Res. 28 (1991) 77.
[11] S.C.M. Otte, E.J. van de Meent, P.A. van Veelen, A.S. Pundsnes and J. Amesz, Photosynth. Res. 35 (1993) 159.
[12] M. Mimuro, T. Nozawa, N. Tamai, K. Shimada, I. Ya- mazaki, S. Lin, R.S. Knox, B.P. Wittmershaus, D.C. Brune and R.E. Blankenship, J. Phys. Chem. 93 (1989) 7503.
[13] M.G. Miiller, K. Griebenow and A.R. Holzwarth, in: Current research in photosynthesis, Vol. II, ed. M. Baltscheffsky (Kluwer Academic Publishers, Dordrecht, 1990) p. 4.177.
[14] T.P. Causgrove, D.C. Brune, J. Wang, B.P. Witmershaus and R.E. Blankenship, Photosynth. Res. 26 (1990) 39.
[15] M. Miller, T. Gillbro and R.P. Cox, in: Current research in photosynthesis, Vol. II, ed. M. Baltscheffsky (Kluwer Aca- demic Publishers, Dordrecht, 1990) p. 4.181.
[16] S. Savikhin, Y. Zhu, S. Lin, R.E. Blankenship and W.S. Struve, J. Phys. Chem. 98 (1994) 10322.
[17] K. Matsuura, M. Hirota, K. Shimada and M. Mimuro, Pho- tochem. Photobiol. 57 (1993) 92.
[18] Z.G. Fetisova and K. Mauring, FEBS Letters 307 (1992) 371.
[19] T. Gillbro, A. Sandstr6m, V. Sundstr6m and J.M. Olson, in:
Green photosynthetic bacteria, eds. J.M. Olson, J.G. Ormerod, J. Amesz, J. Stackebrandt and H.G. Tr~per (Plenum Press, New York, 1988) p. 91.
[20] T.C. Causgrove, D.C. Brune, J. Wang, B.P. Wittmershaus and R.E. Blankenship, Photosynth. Res. 26 (1990) 39.
[21] T.C. Causgrove, D.C. Brune and R.E. Blankenship, J. Pho- tochem. Photobiol. B 15 (1992) 171.
[22] P.I. van Noort, C. Francke, N. Schoumans, S.C.M. Otte, T.J. Aartsma and J. Amesz, Photosynth. Res. 41 (1994) 193.
[23] J. Gibson, W. Ludwig, E. Stackebrandt and C.R. Woese, System. Appl. Microbiol. 6 (1985) 152.
[24] S. Lin, H. van Amerongen and W.S. Struve, Biochim. Bio- phys. Acta 1060 (1991) 13.
[25] S. Savikhin, T. Wells, P.-S. Song and W.S. Struve, Biochem- istry 32 (1993) 7512.
[26] S. Lin, H.-C. Chiou, F.A.M. Kleinherenbrink and R.E. Biankenship, Biophys. J. 66 (1994) 437.
[27] P.D. Gerola and J.M. Olson, Biochim. Biophys. Acta 848 (1986) 69.
[28] R.J. van Dorssen, P.D. Gerola, J.M. Olson and J. Amesz, Biochim. Biophys. Acta 848 (1986) 371.
[29] J. Wang, D.C. Brune and R.E. Blankenship, Biochim. Bio- phys. Acta 1015 (1990) 457.
[30] R.E. Blankenship, P.E. Cheng, T.P. Causgrove, D.C. Brune, S.H. Wang, J. Choh and J. Wang, Photochem. Photobiol. 57 (1993) 103.
[31] S. Savikhin, W. Zhou, R.E. Blankenship and W.S. Struve, Biophys.J. 66 (1994) 110.
[32] M.W. Balk and G.R. Fleming, J. Chem. Phys. 83 (1985) 4300.
[33] P. Cong, H.P. Deuel and J.D. Simon, Chem. Phys. Letters 212 (1993) 367.
[34] S. Savikhin and W.S. Struve, Biochemistry 33 (1994) 1200. [35] Z.G. Fetisova and A. Yu. Borisov, FEBS Letters 114 (1980)
323. [36] M. Du, X. Xie, L. Mets and G.R. Fleming, Photochem.
Photobiol. 57 (1993) 17S.
Copyright © 2022 FDOKUMEN