Photofermentative production of hydrogen from organic acids by the purple sulfur bacterium Thiocapsa...
10
Photofermentative production of hydrogen from organic acids by the purple sulfur bacterium Thiocapsa roseopersicina Andrea Nyilasi a ,E ´ va Molnos a,b,c , Szabolcs La ´nyi c , Iosif Nagy b , Ga ´bor Ra ´ khely a , Korne ´l Lajos Kova ´cs a,d, * a Department of Biotechnology, University of Szeged, Ko ¨ze ´p fasor 52, Szeged H-6726, Hungary b Faculty of Applied Chemistry and Material Science, Politehnica University of Bucharest, Str. Polizu 1-7, Bucures ‚ti RO-011061, Romania c Faculty of Technical and Social Sciences, Sapientia e Hungarian University of Transylvania, P-ta Libert atii 1, Miercurea Ciuc RO-530104, Romania d Institute of Biophysics, Biological Research Center, Hungarian Academy of Sciences, Temesva ´ri krt. 52, Szeged H-6726, Hungary article info Article history: Received 8 November 2012 Received in revised form 11 February 2013 Accepted 18 February 2013 Available online 23 March 2013 Keywords: Biohydrogen Nitrogenase Organic acid Photofermentation Thiocapsa roseopersicina abstract A mutant strain of the anaerobic purple sulfur bacterium Thiocapsa roseopersicina, con- taining only nitrogenase as a functionally active enzyme for H 2 generation was utilized to study the production of H 2 from organic acids (acetate, pyruvate and succinate). Two types of potential substrates for H 2 production, thiosulfate and salts of various organic acids, were compared under photoheterotrophic growth conditions. Thiosulfate proved to be the preferred electron donor for T. roseopersicina; the consumption of organic acids became pronounced only following depletion of the thiosulfate supply. The system is suitable for the generation of H 2 from effluents of heterotrophic dark fermentation processes or waste streams rich in inorganic reduced sulfur compounds and/or simple organic acids. Copyright ª 2013, Hydrogen Energy Publications, LLC. Published by Elsevier Ltd. All rights reserved. 1. Introduction Various strategies have been proposed for biological H 2 pro- duction, including the direct and indirect biophotolysis of water, photofermentation, dark fermentation, or hybrid fermentation technologies [1e3]. H 2 generation in light- dependent (photofermentation) and light-independent (dark fermentation) processes is of practical importance by virtue of the combination of H 2 production with the elimination of organic waste materials in a single step [4]. The dark anaerobic fermentation of a biomass, e.g. cellulose, starch, protein or lipids, usually yields various organic acids as metabolic products [5,6]. Further utilization of the organic acids is feasible energetically only if there is an additional energy input, and these metabolites therefore accumulate in the dark fermen- tation effluents [4]. The additional energy may be introduced in the form of light and a photofermentation step will allow complete conversion of the biomass to biohydrogen. A diverse group of photosynthetic bacteria can utilize organic acids as carbon and energy sources [7]. A two-step strategy H 2 production, involving dark heterotrophic and photofermentation processes, has been proposed to approach the theoretical maximal H 2 yield from a biomass [8,9]. The large-scale industrial application of this technology is limited * Corresponding author. Department of Biotechnology, University of Szeged, Ko ¨ ze ´ p fasor 52, Szeged H-6726, Hungary. Tel.: þ36 62 546940; fax: þ36 62 544352. E-mail addresses: [email protected], [email protected] (K.L. Kova ´ cs). Available online at www.sciencedirect.com journal homepage: www.elsevier.com/locate/he international journal of hydrogen energy 38 (2013) 5535 e5544 0360-3199/$ e see front matter Copyright ª 2013, Hydrogen Energy Publications, LLC. Published by Elsevier Ltd. All rights reserved. http://dx.doi.org/10.1016/j.ijhydene.2013.02.084
Transcript of Photofermentative production of hydrogen from organic acids by the purple sulfur bacterium Thiocapsa...

ww.sciencedirect.com
i n t e r n a t i o n a l j o u r n a l o f h y d r o g e n en e r g y 3 8 ( 2 0 1 3 ) 5 5 3 5e5 5 4 4
Available online at w
journal homepage: www.elsevier .com/locate/he
Photofermentative production of hydrogen from organic acidsby the purple sulfur bacterium Thiocapsa roseopersicina
Andrea Nyilasi a, Eva Molnos a,b,c, Szabolcs Lanyi c, Iosif Nagy b, Gabor Rakhely a,Kornel Lajos Kovacs a,d,*aDepartment of Biotechnology, University of Szeged, Kozep fasor 52, Szeged H-6726, Hungaryb Faculty of Applied Chemistry and Material Science, Politehnica University of Bucharest, Str. Polizu 1-7, Bucures‚ti RO-011061, Romaniac Faculty of Technical and Social Sciences, Sapientia e Hungarian University of Transylvania, P-ta Libert�atii 1, Miercurea Ciuc RO-530104,
Romaniad Institute of Biophysics, Biological Research Center, Hungarian Academy of Sciences, Temesvari krt. 52, Szeged H-6726, Hungary
a r t i c l e i n f o
Article history:
Received 8 November 2012
Received in revised form
11 February 2013
Accepted 18 February 2013
Available online 23 March 2013
Keywords:
Biohydrogen
Nitrogenase
Organic acid
Photofermentation
Thiocapsa roseopersicina
* Corresponding author. Department of Biotefax: þ36 62 544352.
E-mail addresses: [email protected]/$ e see front matter Copyright ªhttp://dx.doi.org/10.1016/j.ijhydene.2013.02.0
a b s t r a c t
A mutant strain of the anaerobic purple sulfur bacterium Thiocapsa roseopersicina, con-
taining only nitrogenase as a functionally active enzyme for H2 generation was utilized to
study the production of H2 from organic acids (acetate, pyruvate and succinate). Two types
of potential substrates for H2 production, thiosulfate and salts of various organic acids,
were compared under photoheterotrophic growth conditions. Thiosulfate proved to be the
preferred electron donor for T. roseopersicina; the consumption of organic acids became
pronounced only following depletion of the thiosulfate supply. The system is suitable for
the generation of H2 from effluents of heterotrophic dark fermentation processes or waste
streams rich in inorganic reduced sulfur compounds and/or simple organic acids.
Copyright ª 2013, Hydrogen Energy Publications, LLC. Published by Elsevier Ltd. All rights
reserved.
1. Introduction products [5,6]. Furtherutilizationof theorganicacids is feasible
Various strategies have been proposed for biological H2 pro-
duction, including the direct and indirect biophotolysis of
water, photofermentation, dark fermentation, or hybrid
fermentation technologies [1e3]. H2 generation in light-
dependent (photofermentation) and light-independent (dark
fermentation) processes is of practical importance by virtue of
the combination of H2 production with the elimination of
organicwastematerials in a single step [4]. The dark anaerobic
fermentation of a biomass, e.g. cellulose, starch, protein or
lipids, usually yields various organic acids as metabolic
chnology, University of Sz
.hu, [email protected] (K.L.2013, Hydrogen Energy P84
energetically only if there is an additional energy input, and
these metabolites therefore accumulate in the dark fermen-
tationeffluents [4]. The additional energymaybe introduced in
the form of light and a photofermentation step will allow
complete conversion of the biomass to biohydrogen.
A diverse group of photosynthetic bacteria can utilize
organic acids as carbon and energy sources [7]. A two-step
strategy H2 production, involving dark heterotrophic and
photofermentation processes, has been proposed to approach
the theoretical maximal H2 yield from a biomass [8,9]. The
large-scale industrial application of this technology is limited
eged, Kozep fasor 52, Szeged H-6726, Hungary. Tel.: þ36 62 546940;
Kovacs).ublications, LLC. Published by Elsevier Ltd. All rights reserved.
i n t e rn a t i o n a l j o u r n a l o f h y d r o g e n en e r g y 3 8 ( 2 0 1 3 ) 5 5 3 5e5 5 4 45536
by the relatively low efficiency of H2 production by photo-
synthetic bacteria, which can be attributed to their slow
growth and ineffective utilization of light energy [4].
From among the different bacteria capable of photo-
fermentative H2 production, the anaerobic, purple sulfur
phototrophic bacterium Thiocapsa roseopersicina was chosen
for this studybecauseof its versatileH2 production capabilities
and because it harbors a nitrogenase in addition to several
hydrogenases [10,11]. In previous work, the H2 productivity of
the soluble cytoplasmatic hydrogenase Hox1 and nitrogenase
in T. roseopersicina were compared by using mutant strains,
and the affinity for simple organic acids was tested. The
overall yield of H2 production via the nitrogenase was higher
than that obtained with Hox1 during the initial phase. The H2
evolution by the Hox1 enzyme, however, was more sustain-
able, and the cumulative total H2 generation capabilities of the
two enzymes were therefore comparable [11,12]. Hox1 in T.
roseopersicina is a constitutive enzyme, which is an advantage
of Hox1-driven H2 production. Nonetheless, the copy number
of the nitrogenase is much higher than that of functionally
active Hox1, and the nitrogenase route may therefore offer
additional benefits for large-scale exploitation.
The aim of the present study was to evaluate the feasibility
of utilizing the organic acids generated from dark fermenta-
tion as substrates for H2 production by photofermentation
with T. roseopersicina. Reduced sulfur compounds such as Na-
thiosulfate or Na-sulfide are the primary electron donors for
photosynthesis in this bacterium [13,14], and the levels of
consumption of thiosulfate in the presence of the organic
acids and the concomitant H2 evolution were therefore
determined.
2. Materials and methods
2.1. Bacterial strains and growth conditions
AmutantofT. roseopersicinaBBS (wild-typestrain), strainM539,
in which the hypF gene had been knocked out, was used
throughout this study. A functional HypF accessory protein is
required for the appropriate assembly of the active center of
[NiFe]-hydrogenases [15]. All the hydrogenases in T. rose-
opersicina are [NiFe]-hydrogenases, and the mutation in hypF
therefore rendered the bacterium unable to produce active
[NiFe]-hydrogenases. Strain M539 is able to evolve H2 only via
the inducible nitrogenase under nitrogen-fixing conditions
[16]. T. roseopersicina strain M539 (DhypF ) was routinely culti-
vated anaerobically in liquid Pfennig’s mineral culture me-
dium (2%NaCl, 0.1% KH2PO4, 0.1%MgCl2, 0.1% KCl, 0.1%NH4Cl
as nitrogen source, 0.2% NaHCO3 as carbon source, 0.4%
Na2S2O3, 20mg/ml vitaminB12, 3.3mg/l Fe-EDTA, 2.975mg/lNa2-
EDTA, 0.3mg/l H3BO3, 0.2mg/l CaCl2, 0.1mg/l ZnSO4, 0.03mg/l
MnCl2, 0.03 mg/l Na2MoO4, 0.713 mg/l NiCl2, 0.01 mg/l CuCl2)
with continuous illumination (35 mmol photons/m2 s light in-
tensity) at 25 �C [10,11,16]. The pH was maintained at 7.2.
The liquid medium used in the H2 production experiments
was the same as that employed for bacterial growth, except
that it did not containNH4Cl andwas supplementedwith salts
of organic acids (acetate, pyruvate or succinate) in various
initial concentrations. The thiosulfate concentration was
varied between 0 and 4.0 g/l. The mineral reaction mix was
filter-sterilized, dispensed into serum bottles (total working
volume 125 ml) under aseptic conditions and inoculated with
3% (v/v) fresh T. roseopersicina culture, and the bottles were
sealed with a rubber septum and Al crimp. The headspace of
the bottles was purged with ultrapure N2 gas to maintain
anaerobic conditions and to provide N-source. The samples
were incubated at 25 �C under continuous illumination for 2
weeks. The standard deviation of at least 3 independent ex-
periments are indicated in the figures.
2.2. Analytical methods
The H2 gas that accumulated in the headspace was sampled
every third day with a gas-tight Hamilton syringe (200 ml) and
was measured by gas chromatography (Agilent Technologies
6890N equipped with a thermal conductivity detector and a
Molesieve 30 m � 0.53 mm � 25 mm column). The operational
temperature of both the oven and the detector was 160 �C. N2
was used as carrier gas.
The concentration of residual organic acid in the culture
medium was determined by using a high-performance liquid
chromatograph (Hitachi Elite) equipped with an ICSep ICE-
COREGEL 64H column and a refractive index detector. 0.1 N
H2SO4 served as the mobile phase at a flow rate of 0.8 ml/min.
The column temperature was 50 �C and the detector temper-
ature was 41 �C. The sample volume used for organic acid
determination was 50 ml, obtained after centrifugation of
0.5 ml of cell suspension at 13,000 rpm for 10 min. The cell
suspensions were harvested after each H2 gas determination,
and were stored at �20 �C until further analyses.
The thiosulfate content of the medium was determined
spectrophotometrically on the supernatant of the cell sus-
pension after centrifugation at 22,500 rpm for 15 min. After
dilution, the thiosulfate content was measured by UV ab-
sorption at 230 nm using quartz cells. The calibration plot for
thiosulfate was linear (A230nm ¼ 0.019 Cthiosulfate þ 0.0029;
R2 ¼ 0.9973) for standard Pfennig mineral medium supple-
mented with 0e4.0 g thiosulfate/l.
The bacterial growth was monitored by determining the
total protein contents of the cell suspensions by the micro-
Lowry method [17], using bovine serum albumin as standard.
3. Results and discussion
Photoheterotrophic bacteria are capable of utilizing a wide
variety of substrates as carbon and nitrogen sources. The
metabolic pathways involved are wide-ranging and differ be-
tween species or even between different strains of the same
species. A variety of substrates can be used for growth, but
only a few are suitable for efficient H2 production [18].
The substrate concentration is one of the most important
parameters in the optimization of the H2 production. The
experiments with organic acids were therefore conducted
with different initial concentrations of the selected substrates.
The biomass accumulation of T. roseopersicina cannot be
monitored with the commonly used method of determining
the optical density of the culture at 660 nm, because sulfur
globules are stored inside the cell during growth on
i n t e r n a t i o n a l j o u r n a l o f h y d r o g e n en e r g y 3 8 ( 2 0 1 3 ) 5 5 3 5e5 5 4 4 5537
thiosulfate. These globules scatter light and therefore inter-
fere with optical density measurements. For this reason, the
rate of bacterial growth was followed by determining the total
protein content of the culture, which is proportional to the
quantity of biomass.
3.1. Growth and production of H2 from acetate andthiosulfate
A common main product of dark anaerobic fermentation is ac-
etate [6], which can be converted to H2 through photo-
fermentation. In the presence of both thiosulfate and acetate,
the metabolic pathways leading to H2 production interact with
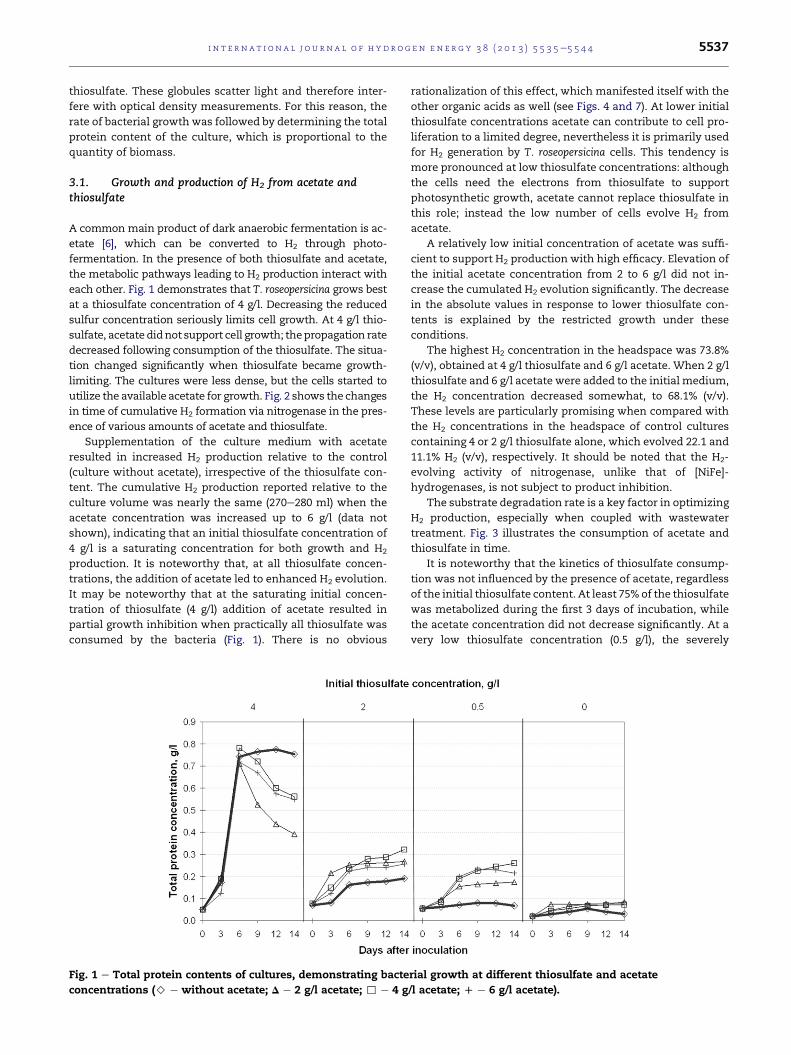
each other. Fig. 1 demonstrates that T. roseopersicina grows best
at a thiosulfate concentration of 4 g/l. Decreasing the reduced
sulfur concentration seriously limits cell growth. At 4 g/l thio-
sulfate, acetate didnot support cell growth; thepropagation rate
decreased following consumption of the thiosulfate. The situa-
tion changed significantly when thiosulfate became growth-
limiting. The cultures were less dense, but the cells started to
utilize the available acetate for growth. Fig. 2 shows the changes
in time of cumulative H2 formation via nitrogenase in the pres-
ence of various amounts of acetate and thiosulfate.
Supplementation of the culture medium with acetate
resulted in increased H2 production relative to the control
(culture without acetate), irrespective of the thiosulfate con-
tent. The cumulative H2 production reported relative to the
culture volume was nearly the same (270e280 ml) when the
acetate concentration was increased up to 6 g/l (data not
shown), indicating that an initial thiosulfate concentration of
4 g/l is a saturating concentration for both growth and H2
production. It is noteworthy that, at all thiosulfate concen-
trations, the addition of acetate led to enhanced H2 evolution.
It may be noteworthy that at the saturating initial concen-
tration of thiosulfate (4 g/l) addition of acetate resulted in
partial growth inhibition when practically all thiosulfate was
consumed by the bacteria (Fig. 1). There is no obvious
Fig. 1 e Total protein contents of cultures, demonstrating bacte
concentrations (> e without acetate; D e 2 g/l acetate; , e 4 g
rationalization of this effect, which manifested itself with the
other organic acids as well (see Figs. 4 and 7). At lower initial
thiosulfate concentrations acetate can contribute to cell pro-
liferation to a limited degree, nevertheless it is primarily used
for H2 generation by T. roseopersicina cells. This tendency is
more pronounced at low thiosulfate concentrations: although
the cells need the electrons from thiosulfate to support
photosynthetic growth, acetate cannot replace thiosulfate in
this role; instead the low number of cells evolve H2 from
acetate.
A relatively low initial concentration of acetate was suffi-
cient to support H2 production with high efficacy. Elevation of
the initial acetate concentration from 2 to 6 g/l did not in-
crease the cumulated H2 evolution significantly. The decrease
in the absolute values in response to lower thiosulfate con-
tents is explained by the restricted growth under these
conditions.
The highest H2 concentration in the headspace was 73.8%
(v/v), obtained at 4 g/l thiosulfate and 6 g/l acetate. When 2 g/l
thiosulfate and 6 g/l acetate were added to the initial medium,
the H2 concentration decreased somewhat, to 68.1% (v/v).
These levels are particularly promising when compared with
the H2 concentrations in the headspace of control cultures
containing 4 or 2 g/l thiosulfate alone, which evolved 22.1 and
11.1% H2 (v/v), respectively. It should be noted that the H2-
evolving activity of nitrogenase, unlike that of [NiFe]-
hydrogenases, is not subject to product inhibition.
The substrate degradation rate is a key factor in optimizing
H2 production, especially when coupled with wastewater
treatment. Fig. 3 illustrates the consumption of acetate and
thiosulfate in time.
It is noteworthy that the kinetics of thiosulfate consump-
tion was not influenced by the presence of acetate, regardless
of the initial thiosulfate content. At least 75% of the thiosulfate
was metabolized during the first 3 days of incubation, while
the acetate concentration did not decrease significantly. At a
very low thiosulfate concentration (0.5 g/l), the severely
rial growth at different thiosulfate and acetate
/l acetate; D e 6 g/l acetate).
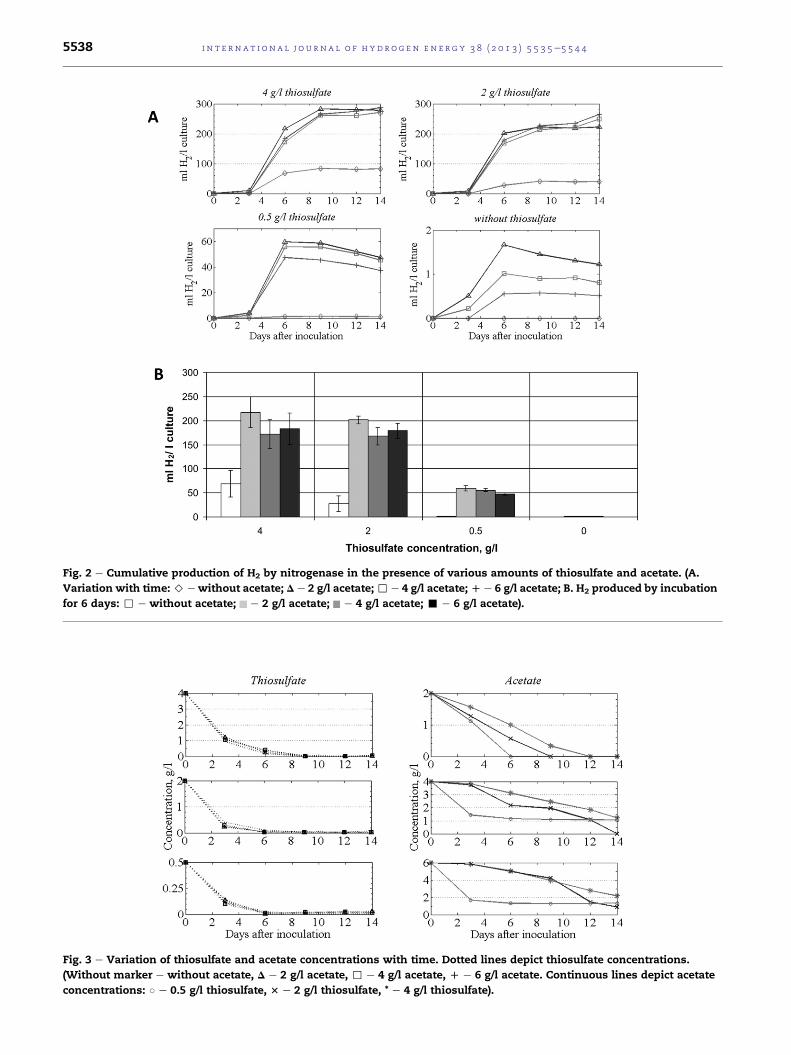
Fig. 2 e Cumulative production of H2 by nitrogenase in the presence of various amounts of thiosulfate and acetate. (A.
Variation with time: > e without acetate; D e 2 g/l acetate; , e 4 g/l acetate; D e 6 g/l acetate; B. H2 produced by incubation
for 6 days: , e without acetate; e 2 g/l acetate; e 4 g/l acetate; - e 6 g/l acetate).
Fig. 3 e Variation of thiosulfate and acetate concentrations with time. Dotted lines depict thiosulfate concentrations.
(Without marker e without acetate, D e 2 g/l acetate, , e 4 g/l acetate, D e 6 g/l acetate. Continuous lines depict acetate
concentrations: B e 0.5 g/l thiosulfate, 3 e 2 g/l thiosulfate, * e 4 g/l thiosulfate).
i n t e rn a t i o n a l j o u r n a l o f h y d r o g e n en e r g y 3 8 ( 2 0 1 3 ) 5 5 3 5e5 5 4 45538

Fig. 4 e Total protein contents of cultures, reflecting bacterial growth at different thiosulfate and pyruvate concentrations.
(> e without pyruvate; D e 2 g/l pyruvate; , e 4 g/l pyruvate; D e 6 g/l pyruvate.)
i n t e r n a t i o n a l j o u r n a l o f h y d r o g e n en e r g y 3 8 ( 2 0 1 3 ) 5 5 3 5e5 5 4 4 5539
starving cells started to utilize acetate earlier, probably due to
the life-threatening stressful conditions. The results corrob-
orate that thiosulfate is consumed by the bacterium primarily
to support photosynthetic growth.
Overall, the data suggest that T. roseopersicina is able to
produce a considerable amount of H2 from acetate, but the cell
growth is limited by thiosulfate. Acetate has a very limited
capacity to replace thiosulfate in supporting bacterial growth.
The supplementation with acetate is primarily beneficial for
H2 production, and nitrogenase utilizes the chemical energy of
these two substrates in partially overlapping, but different
pathways.
3.2. Growth and production of H2 from pyruvate andthiosulfate
Pyruvate is a central metabolite of the carbohydrate meta-
bolism of most organisms, and should therefore be wide-
spread in anaerobic fermentation effluents. We reported
earlier that supplementation of the culture medium contain-
ing 4 g/l thiosulfate (basal medium) with pyruvate resulted in
higher H2 production rates [12], but the systematic co-
metabolism of thiosulfate and pyruvate was not studied.
The growth curves in the presence of various initial amounts
of thiosulfate and pyruvate are shown in Fig. 4. As in the case
of acetate, pyruvate does not appear to support bacterial
growth if a sufficient amount of thiosulfate is present in the
environment. Unexpectedly, pyruvate becomes inhibitory
when the thiosulfate has been consumed by the cells. At lower
thiosulfate concentrations, pyruvate is probably utilized as an
electron source for photoheterotrophic growth, but only a very
small fraction of this substrate can substitute thiosulfate in its
physiological function.
The cumulative production of H2 via nitrogenase at
different initial concentrations of thiosulfate and pyruvate is
depicted in Fig. 5.
A similar response to that of acetate, as regards growth and
H2 evolution, was observed when pyruvate was added to the
growthmediumtogetherwith thiosulfate.Thesupplementation
withpyruvate resulted ina substantial increase inH2production
relative to the control at all thiosulfate concentrations. In these
experiments, the maximum H2 production (w265 ml) was
attained with an initial 4 g/l thiosulfate and 2 g/l pyruvate.
At an initial 2 g/l thiosulfate, the H2 production increased
from 122.7 ml to 228.6 ml when the pyruvate concentration
was raised from 2 to 6 g/l. Similarly, the addition of pyruvate
increased the H2 production at an initial thiosulfate concen-
tration of 0.5 g/l. However, when there was no thiosulfate in
the culture medium, only a pyruvate concentration of 6 g/l
produced ameasurable amount of H2 in the headspace, due to
the inefficient contribution of pyruvate to cell growth. These
results resembled those obtained with acetate supplementa-
tion, indicating that thiosulfate was needed for bacterial
growth and that, when the primary electron donor was un-
available for T. roseopersicina, no growth and consequently no
H2 production took place. Pyruvate could serve as a better
electron source than acetate for photosynthetic growth but its
contribution was limited. A headspace H2 concentration of
68.4% (v/v) was attained at 4 g/l thiosulfate and 2 g/l pyruvate
as substrate. At 2 g/l thiosulfate and 6 g/l pyruvate, the H2
concentration was 58.8% (v/v).
The results verify that T. roseopersicina is able to produce a
significant amount of H2 from pyruvate, but the presence of
thiosulfate is indispensable for bacterial growth. The role of
pyruvate in H2 production becomes significant when the
thiosulfate content is low, as shown in Fig. 6.
In contrast with the contribution from acetate, the con-
sumption of the primary electron donor was influenced by the
presence of pyruvate. As the pyruvate concentration in the cul-
ture medium was increased, the thiosulfate consumption rate
decreased. Itwasnoteworthy that, inanenvironmentcompletely
devoid of thiosulfate, pyruvatewas consumed at a rate similar to
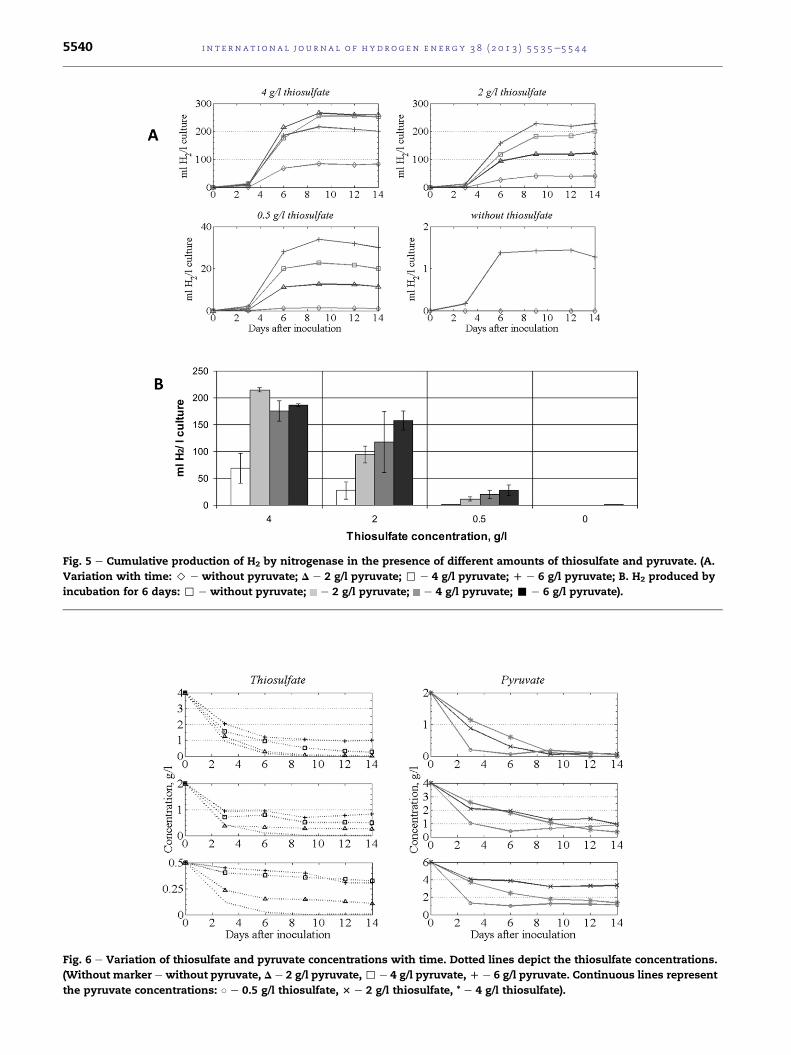
Fig. 5 e Cumulative production of H2 by nitrogenase in the presence of different amounts of thiosulfate and pyruvate. (A.
Variation with time: > e without pyruvate; D e 2 g/l pyruvate; , e 4 g/l pyruvate; D e 6 g/l pyruvate; B. H2 produced by
incubation for 6 days: , e without pyruvate; e 2 g/l pyruvate; e 4 g/l pyruvate; - e 6 g/l pyruvate).
Fig. 6 e Variation of thiosulfate and pyruvate concentrations with time. Dotted lines depict the thiosulfate concentrations.
(Without marker e without pyruvate, D e 2 g/l pyruvate, , e 4 g/l pyruvate, D e 6 g/l pyruvate. Continuous lines represent
the pyruvate concentrations: B e 0.5 g/l thiosulfate, 3 e 2 g/l thiosulfate, * e 4 g/l thiosulfate).
i n t e rn a t i o n a l j o u r n a l o f h y d r o g e n en e r g y 3 8 ( 2 0 1 3 ) 5 5 3 5e5 5 4 45540
i n t e r n a t i o n a l j o u r n a l o f h y d r o g e n en e r g y 3 8 ( 2 0 1 3 ) 5 5 3 5e5 5 4 4 5541
that observed in the thiosulfate-containing medium. Pyruvate
could therefore effectively replace thiosulfate as an electron
donor to the photosynthetic apparatus, although its primary
contribution is toward photoheterotrophic H2 production.
3.3. Growth and production of H2 from succinate andthiosulfate
Succinate is another organic acid which has a beneficial effect
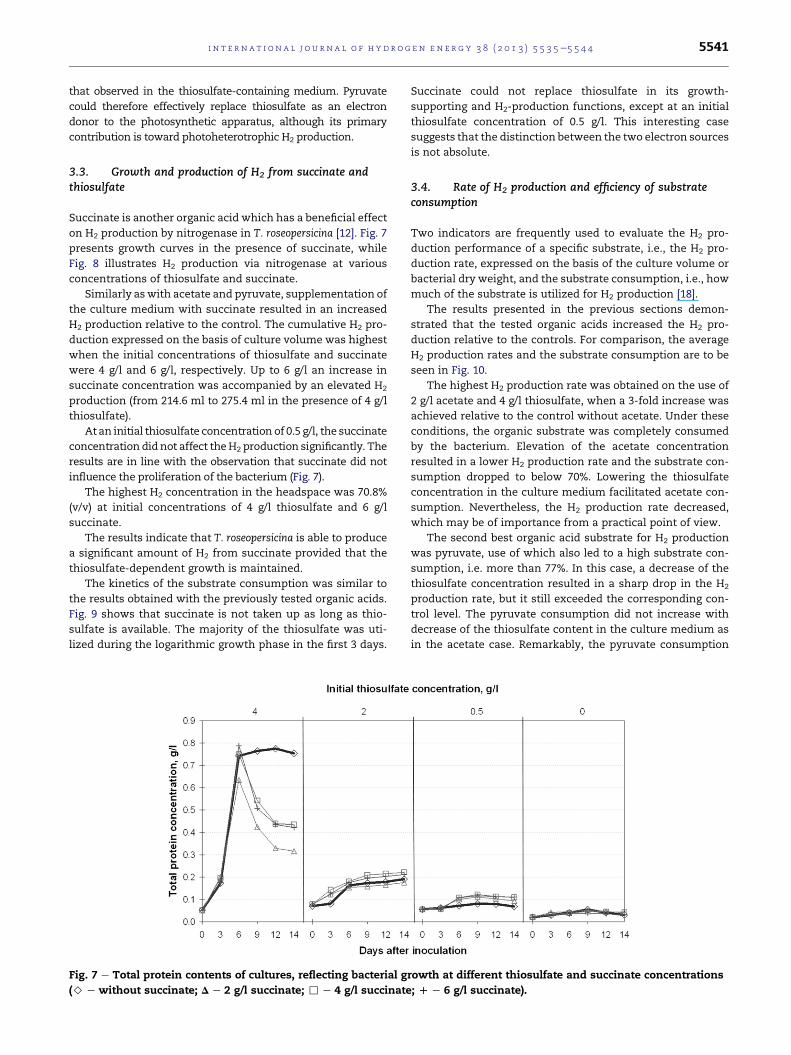
on H2 production by nitrogenase in T. roseopersicina [12]. Fig. 7
presents growth curves in the presence of succinate, while
Fig. 8 illustrates H2 production via nitrogenase at various
concentrations of thiosulfate and succinate.
Similarly aswith acetate and pyruvate, supplementation of
the culture medium with succinate resulted in an increased
H2 production relative to the control. The cumulative H2 pro-
duction expressed on the basis of culture volume was highest
when the initial concentrations of thiosulfate and succinate
were 4 g/l and 6 g/l, respectively. Up to 6 g/l an increase in
succinate concentration was accompanied by an elevated H2
production (from 214.6 ml to 275.4 ml in the presence of 4 g/l
thiosulfate).
At an initial thiosulfate concentration of 0.5 g/l, the succinate
concentration didnot affect theH2 production significantly. The
results are in line with the observation that succinate did not
influence the proliferation of the bacterium (Fig. 7).
The highest H2 concentration in the headspace was 70.8%
(v/v) at initial concentrations of 4 g/l thiosulfate and 6 g/l
succinate.
The results indicate that T. roseopersicina is able to produce
a significant amount of H2 from succinate provided that the
thiosulfate-dependent growth is maintained.
The kinetics of the substrate consumption was similar to
the results obtained with the previously tested organic acids.
Fig. 9 shows that succinate is not taken up as long as thio-
sulfate is available. The majority of the thiosulfate was uti-
lized during the logarithmic growth phase in the first 3 days.
Fig. 7 e Total protein contents of cultures, reflecting bacterial g
(> e without succinate; D e 2 g/l succinate; , e 4 g/l succinate
Succinate could not replace thiosulfate in its growth-
supporting and H2-production functions, except at an initial
thiosulfate concentration of 0.5 g/l. This interesting case
suggests that the distinction between the two electron sources
is not absolute.
3.4. Rate of H2 production and efficiency of substrateconsumption
Two indicators are frequently used to evaluate the H2 pro-
duction performance of a specific substrate, i.e., the H2 pro-
duction rate, expressed on the basis of the culture volume or
bacterial dry weight, and the substrate consumption, i.e., how
much of the substrate is utilized for H2 production [18].
The results presented in the previous sections demon-
strated that the tested organic acids increased the H2 pro-
duction relative to the controls. For comparison, the average
H2 production rates and the substrate consumption are to be
seen in Fig. 10.
The highest H2 production rate was obtained on the use of
2 g/l acetate and 4 g/l thiosulfate, when a 3-fold increase was
achieved relative to the control without acetate. Under these
conditions, the organic substrate was completely consumed
by the bacterium. Elevation of the acetate concentration
resulted in a lower H2 production rate and the substrate con-
sumption dropped to below 70%. Lowering the thiosulfate
concentration in the culture medium facilitated acetate con-
sumption. Nevertheless, the H2 production rate decreased,
which may be of importance from a practical point of view.
The second best organic acid substrate for H2 production
was pyruvate, use of which also led to a high substrate con-
sumption, i.e. more than 77%. In this case, a decrease of the
thiosulfate concentration resulted in a sharp drop in the H2
production rate, but it still exceeded the corresponding con-
trol level. The pyruvate consumption did not increase with
decrease of the thiosulfate content in the culture medium as
in the acetate case. Remarkably, the pyruvate consumption
rowth at different thiosulfate and succinate concentrations
; D e 6 g/l succinate).
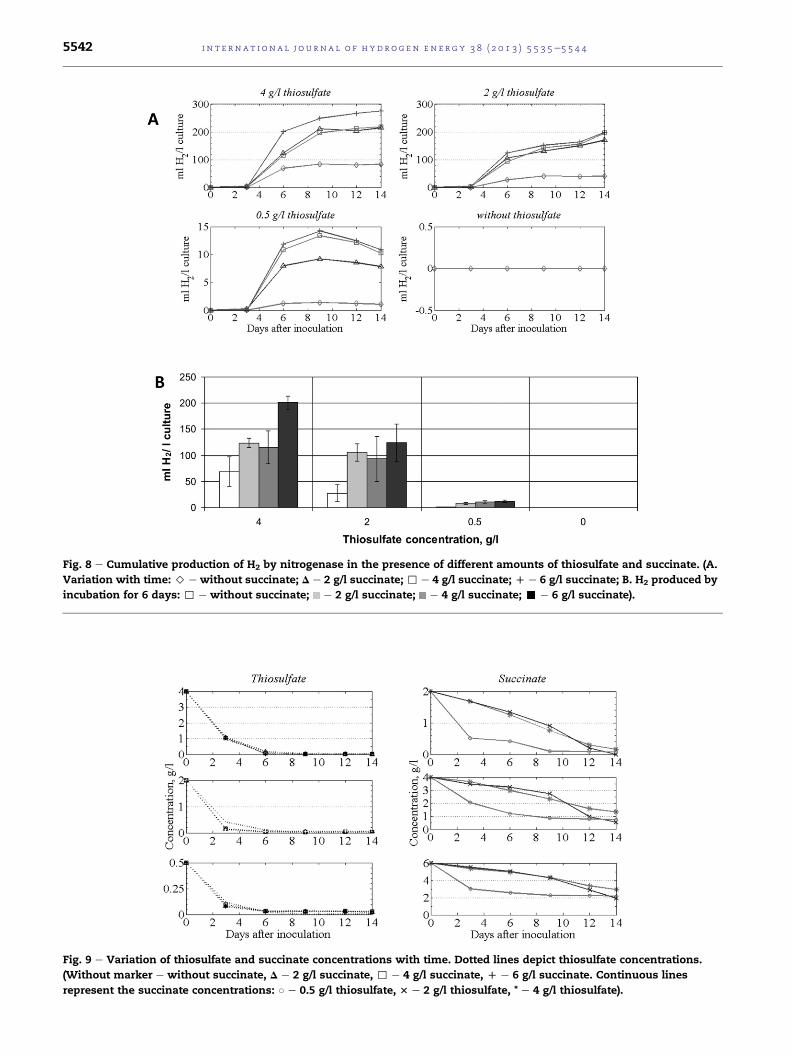
Fig. 8 e Cumulative production of H2 by nitrogenase in the presence of different amounts of thiosulfate and succinate. (A.
Variation with time: > e without succinate; D e 2 g/l succinate; , e 4 g/l succinate; D e 6 g/l succinate; B. H2 produced by
incubation for 6 days: , e without succinate; e 2 g/l succinate; e 4 g/l succinate; - e 6 g/l succinate).
Fig. 9 e Variation of thiosulfate and succinate concentrations with time. Dotted lines depict thiosulfate concentrations.
(Without marker e without succinate, D e 2 g/l succinate, , e 4 g/l succinate, D e 6 g/l succinate. Continuous lines
represent the succinate concentrations: B e 0.5 g/l thiosulfate, 3 e 2 g/l thiosulfate, * e 4 g/l thiosulfate).
i n t e rn a t i o n a l j o u r n a l o f h y d r o g e n en e r g y 3 8 ( 2 0 1 3 ) 5 5 3 5e5 5 4 45542
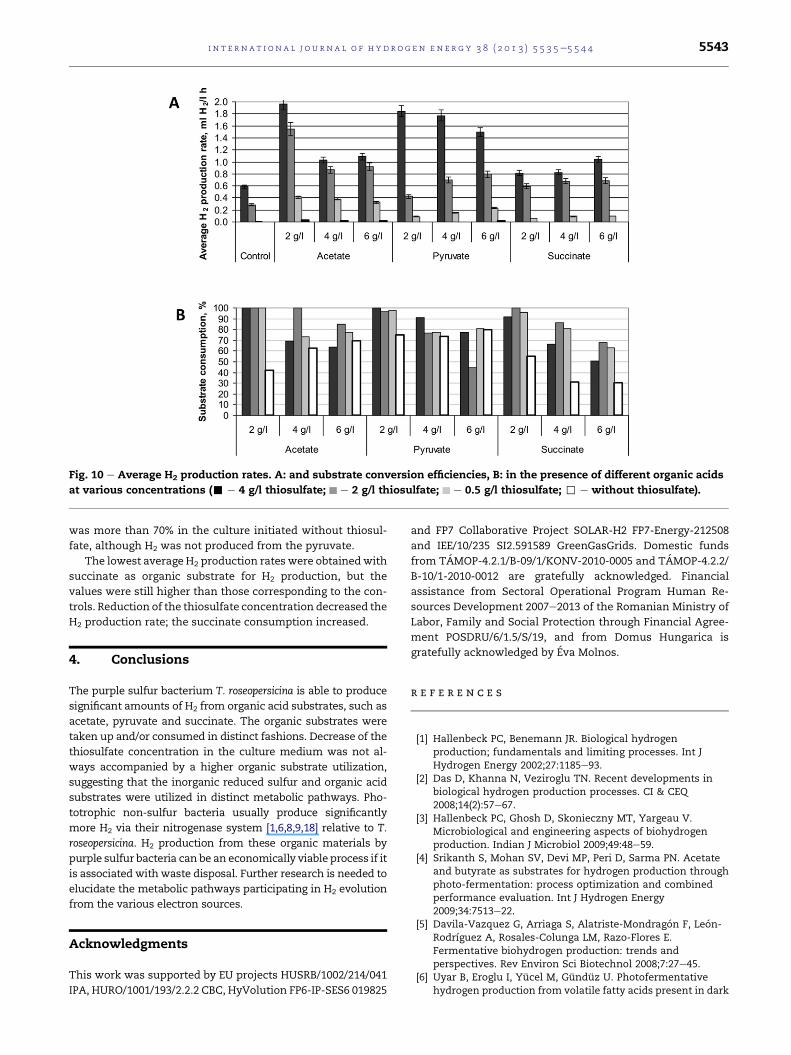
Fig. 10 e Average H2 production rates. A: and substrate conversion efficiencies, B: in the presence of different organic acids
at various concentrations (- e 4 g/l thiosulfate; e 2 g/l thiosulfate; e 0.5 g/l thiosulfate; , e without thiosulfate).
i n t e r n a t i o n a l j o u r n a l o f h y d r o g e n en e r g y 3 8 ( 2 0 1 3 ) 5 5 3 5e5 5 4 4 5543
was more than 70% in the culture initiated without thiosul-
fate, although H2 was not produced from the pyruvate.
The lowest average H2 production rates were obtainedwith
succinate as organic substrate for H2 production, but the
values were still higher than those corresponding to the con-
trols. Reduction of the thiosulfate concentration decreased the
H2 production rate; the succinate consumption increased.
4. Conclusions
The purple sulfur bacterium T. roseopersicina is able to produce
significant amounts of H2 from organic acid substrates, such as
acetate, pyruvate and succinate. The organic substrates were
taken up and/or consumed in distinct fashions. Decrease of the
thiosulfate concentration in the culture medium was not al-
ways accompanied by a higher organic substrate utilization,
suggesting that the inorganic reduced sulfur and organic acid
substrates were utilized in distinct metabolic pathways. Pho-
totrophic non-sulfur bacteria usually produce significantly
more H2 via their nitrogenase system [1,6,8,9,18] relative to T.
roseopersicina. H2 production from these organic materials by
purple sulfur bacteria can be an economically viable process if it
is associated with waste disposal. Further research is needed to
elucidate the metabolic pathways participating in H2 evolution
from the various electron sources.
Acknowledgments
This work was supported by EU projects HUSRB/1002/214/041
IPA, HURO/1001/193/2.2.2 CBC, HyVolution FP6-IP-SES6 019825
and FP7 Collaborative Project SOLAR-H2 FP7-Energy-212508
and IEE/10/235 SI2.591589 GreenGasGrids. Domestic funds
from TAMOP-4.2.1/B-09/1/KONV-2010-0005 and TAMOP-4.2.2/
B-10/1-2010-0012 are gratefully acknowledged. Financial
assistance from Sectoral Operational Program Human Re-
sources Development 2007e2013 of the Romanian Ministry of
Labor, Family and Social Protection through Financial Agree-
ment POSDRU/6/1.5/S/19, and from Domus Hungarica is
gratefully acknowledged by Eva Molnos.
r e f e r e n c e s
[1] Hallenbeck PC, Benemann JR. Biological hydrogenproduction; fundamentals and limiting processes. Int JHydrogen Energy 2002;27:1185e93.
[2] Das D, Khanna N, Veziroglu TN. Recent developments inbiological hydrogen production processes. CI & CEQ2008;14(2):57e67.
[3] Hallenbeck PC, Ghosh D, Skonieczny MT, Yargeau V.Microbiological and engineering aspects of biohydrogenproduction. Indian J Microbiol 2009;49:48e59.
[4] Srikanth S, Mohan SV, Devi MP, Peri D, Sarma PN. Acetateand butyrate as substrates for hydrogen production throughphoto-fermentation: process optimization and combinedperformance evaluation. Int J Hydrogen Energy2009;34:7513e22.
[5] Davila-Vazquez G, Arriaga S, Alatriste-Mondragon F, Leon-Rodrıguez A, Rosales-Colunga LM, Razo-Flores E.Fermentative biohydrogen production: trends andperspectives. Rev Environ Sci Biotechnol 2008;7:27e45.
[6] Uyar B, Eroglu I, Yucel M, Gunduz U. Photofermentativehydrogen production from volatile fatty acids present in dark
i n t e rn a t i o n a l j o u r n a l o f h y d r o g e n en e r g y 3 8 ( 2 0 1 3 ) 5 5 3 5e5 5 4 45544
fermentation effluents. Int J Hydrogen Energy2009;34:4517e23.
[7] Argun H, Kargi F, Kapdan IK. Light fermentation of darkfermentation effluent for bio-hydrogen production bydifferent Rhodobacter species at different initial volatile fattyacid (VFA) concentrations. Int J Hydrogen Energy2008;33:7405e12.
[8] Nath K, Das D. Improvement of fermentative hydrogenproduction: various approaches. Appl Microbiol Biotechnol2004;65:520e9.
[9] Redwood MD, Paterson-Beedle M, Macaskie LE. Integratingdark and light bio-hydrogen production strategies: towardsthe hydrogen economy. Rev Environ Sci Biotechnol2009;8:149e85.
[10] Kovacs KL, Kovacs AT, Maroti G, Bagi Z, Csanadi Gy, Perei K,et al. Improvement of biohydrogen production andintensification of biogas formation. Rev Environ SciBiotechnol 2004;3:321e30.
[11] Kovacs KL, Maroti G, Rakhely G. A novel approach forbiohydrogen production. Int J Hydrogen Energy2006;31:1460e8.
[12] Molnos E, Nyilasi A, Rakhely G, Muntean O, Kovacs KL.Photofermentative production of hydrogen by Thiocapsa
roseopersicina from simple organic substrates. Hungar J IndChem 2010;38(2):117e21.
[13] Dahl C, Rakhely G, Pott-Sperling AS, Fodor B, Takacs M,Toth A, et al. Genes involved in hydrogen and sulfurmetabolism in phototrophic sulfur bacteria. FEMS MicrobiolLett 1999;180(2):317e24.
[14] Frigaard N-U, Dahl C. Sulfur metabolism in phototrophicsulfur bacteria. Adv Microb Physiol 2008;54:103e200.
[15] Bock A, King PW, Blokesch M, Posewitz MC. Maturation ofhydrogenases. Adv Microb Physiol 2006;51:1e71.
[16] Fodor B, Rakhely G, Kovacs AT, Kovacs KL. Transposonmutagenesis in purple sulfur photosynthetic bacteria:identification of hypF, encoding a protein capable ofprocessing [NiFe] hydrogenases in a, b, and g subdivisions ofthe proteobacteria. Appl Environ Microbiol2001;67(6):2476e83.
[17] Yeang HY, Yusof F, Abdullah L. Protein purification for theLowry assay: acid precipitation of proteins in the presence ofsodium dodecyl sulfate and other biological detergents. AnalBiochem 1998;265(2):381e4.
[18] Koku H, Eroglu I, Gunduz U, Yucel M, Turker L. Aspects of themetabolism of hydrogen production by Rhodobactersphaeroides. Int J Hydrogen Energy 2002;27:1315e29.