Synthesis of nano‑fibers containing nano‑curcumin in zein ...
Upload
independentCategory
view
2download
0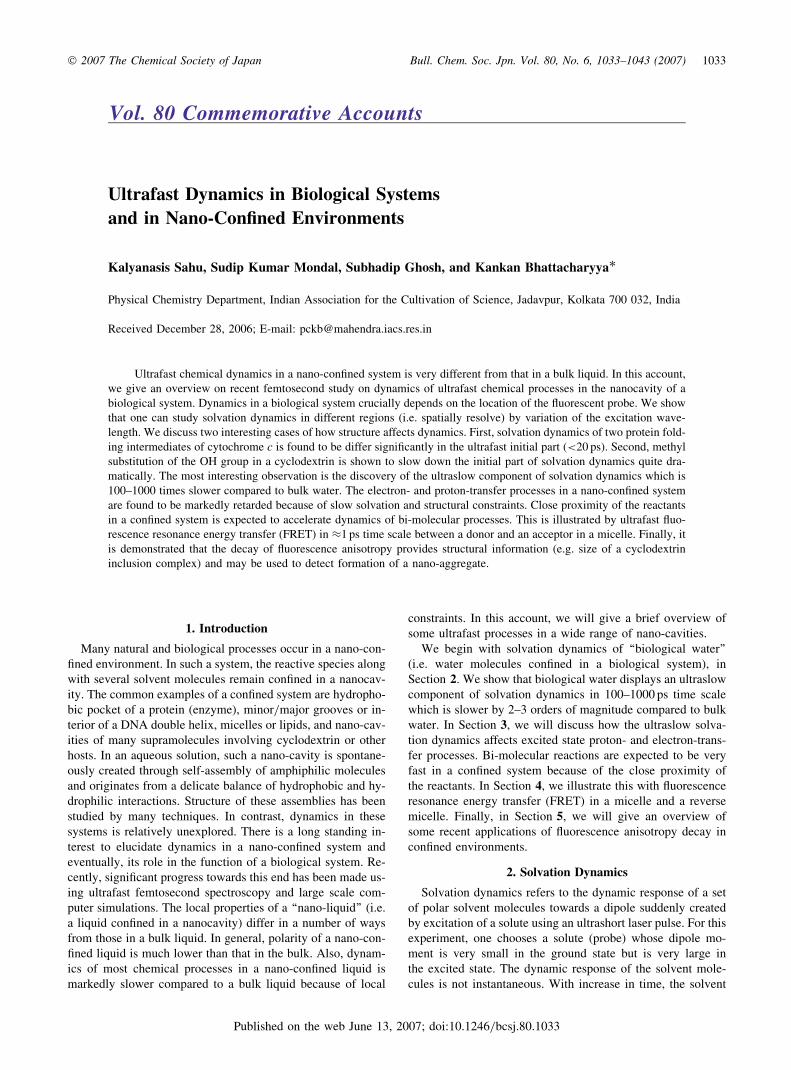
Ultrafast Dynamics in Biological Systems
and in Nano-Confined Environments
Kalyanasis Sahu, Sudip Kumar Mondal, Subhadip Ghosh, and Kankan Bhattacharyya�
Physical Chemistry Department, Indian Association for the Cultivation of Science, Jadavpur, Kolkata 700 032, India
Received December 28, 2006; E-mail: [email protected]
Ultrafast chemical dynamics in a nano-confined system is very different from that in a bulk liquid. In this account,we give an overview on recent femtosecond study on dynamics of ultrafast chemical processes in the nanocavity of abiological system. Dynamics in a biological system crucially depends on the location of the fluorescent probe. We showthat one can study solvation dynamics in different regions (i.e. spatially resolve) by variation of the excitation wave-length. We discuss two interesting cases of how structure affects dynamics. First, solvation dynamics of two protein fold-ing intermediates of cytochrome c is found to be differ significantly in the ultrafast initial part (<20 ps). Second, methylsubstitution of the OH group in a cyclodextrin is shown to slow down the initial part of solvation dynamics quite dra-matically. The most interesting observation is the discovery of the ultraslow component of solvation dynamics which is100–1000 times slower compared to bulk water. The electron- and proton-transfer processes in a nano-confined systemare found to be markedly retarded because of slow solvation and structural constraints. Close proximity of the reactantsin a confined system is expected to accelerate dynamics of bi-molecular processes. This is illustrated by ultrafast fluo-rescence resonance energy transfer (FRET) in �1 ps time scale between a donor and an acceptor in a micelle. Finally, itis demonstrated that the decay of fluorescence anisotropy provides structural information (e.g. size of a cyclodextrininclusion complex) and may be used to detect formation of a nano-aggregate.
1. Introduction
Many natural and biological processes occur in a nano-con-fined environment. In such a system, the reactive species alongwith several solvent molecules remain confined in a nanocav-ity. The common examples of a confined system are hydropho-bic pocket of a protein (enzyme), minor/major grooves or in-terior of a DNA double helix, micelles or lipids, and nano-cav-ities of many supramolecules involving cyclodextrin or otherhosts. In an aqueous solution, such a nano-cavity is spontane-ously created through self-assembly of amphiphilic moleculesand originates from a delicate balance of hydrophobic and hy-drophilic interactions. Structure of these assemblies has beenstudied by many techniques. In contrast, dynamics in thesesystems is relatively unexplored. There is a long standing in-terest to elucidate dynamics in a nano-confined system andeventually, its role in the function of a biological system. Re-cently, significant progress towards this end has been made us-ing ultrafast femtosecond spectroscopy and large scale com-puter simulations. The local properties of a ‘‘nano-liquid’’ (i.e.a liquid confined in a nanocavity) differ in a number of waysfrom those in a bulk liquid. In general, polarity of a nano-con-fined liquid is much lower than that in the bulk. Also, dynam-ics of most chemical processes in a nano-confined liquid ismarkedly slower compared to a bulk liquid because of local
constraints. In this account, we will give a brief overview ofsome ultrafast processes in a wide range of nano-cavities.
We begin with solvation dynamics of ‘‘biological water’’(i.e. water molecules confined in a biological system), inSection 2. We show that biological water displays an ultraslowcomponent of solvation dynamics in 100–1000 ps time scalewhich is slower by 2–3 orders of magnitude compared to bulkwater. In Section 3, we will discuss how the ultraslow solva-tion dynamics affects excited state proton- and electron-trans-fer processes. Bi-molecular reactions are expected to be veryfast in a confined system because of the close proximity ofthe reactants. In Section 4, we illustrate this with fluorescenceresonance energy transfer (FRET) in a micelle and a reversemicelle. Finally, in Section 5, we will give an overview ofsome recent applications of fluorescence anisotropy decay inconfined environments.
2. Solvation Dynamics
Solvation dynamics refers to the dynamic response of a setof polar solvent molecules towards a dipole suddenly createdby excitation of a solute using an ultrashort laser pulse. For thisexperiment, one chooses a solute (probe) whose dipole mo-ment is very small in the ground state but is very large inthe excited state. The dynamic response of the solvent mole-cules is not instantaneous. With increase in time, the solvent
� 2007 The Chemical Society of Japan Bull. Chem. Soc. Jpn. Vol. 80, No. 6, 1033–1043 (2007) 1033
Vol. 80 Commemorative Accounts
Published on the web June 13, 2007; doi:10.1246/bcsj.80.1033

molecules gradually rearrange and reorient around the dipolein the excited state and thus, energy of the excited dipole de-creases. The energy relaxation is manifested in a time-depend-ent red shift of the emission spectrum. This phenomenon isknown as dynamic Stokes shift. In the case of solvation dy-namics, the fluorescence decay exhibits a marked dependenceon the wavelength. At a short emission wavelength, a decay isobserved which arises mainly from the unsolvated species. Ata very long wavelength, where emission from the solvated spe-cies predominates, a rise precedes the decay. The rise at a longwavelength is a clear manifestation of solvation dynamics. Thegradual change in solvation (i.e. solvation dynamics) is moni-tored by the decay of the solvation time correlation function,CðtÞ which is defined as
CðtÞ ¼�ðtÞ � �ð1Þ�ð0Þ � �ð1Þ
; ð1Þ
where, �ð0Þ, �ðtÞ, and �ð1Þ are the observed emission frequen-cies at time zero, t, and infinity, respectively.
Solvation dynamics in bulk water is described by a majorcomponent in 0.1 ps (100 fs) time scale and a minor componentof 1 ps.1–4 Interestingly, solvation dynamics of water confinedin many organized and biological assemblies displays a com-ponent in 100–1000 ps time scale.5–9 The ultraslow compo-nent of solvation dynamics suggests that nano-confined water(‘‘biological water’’) is substantially slower and fundamentallydifferent from ordinary water. Many aspects of ultraslow bio-logical water have been reviewed earlier.5–8 In this account, wefocus only on the latest results.
2.1 Solvation Dynamics in a Cyclodextrin Nanocage. Acyclodextrin is a cyclic polymer containing 6–8 glucose unitswhich is soluble in water and in many other polar liquids. In acyclodextrin (CD) nanocavity, an organic fluorescent probemay be confined along with several (�10) solvent molecules(Fig. 1). Compared to the unsubstituted CD-s, the O-methylor O-hydroxypropyl derivatives are much more soluble in wa-ter. The higher solubility of the substituted CD’s finds usefulapplication in targeted delivery of drugs which are sparinglysoluble in water10 and also, prevents misfolding and aggrega-tion of proteins by encapsulating its aromatic residues.11
Fleming and co-workers first reported that solvation dynam-ics of water is dramatically slowed down inside an unsubstitut-
ed cyclodextrin cavity and displays a component as slow as109 and 1200 ps.12 They suggested three possible sources forthe ultraslow component—the restricted motion of the con-fined water molecules, motion of the guest (probe) in andout of the cavity, and third, the fluctuations of the �-cyclodex-trin ring. Recently, Sen et al. studied the effect of methyl sub-stitution of cyclodextrin on ultrafast solvation dynamics.13 Intrimethyl �-CD, all the three OH groups of the �-CD cavityare replaced by OMe groups. It is observed that solvation dy-namics in trimethyl �-CD displays two very slow compo-nents—240 ps (45%) and 2450 ps (31%) along with a fast com-ponent of 10 ps (24%) (Fig. 2).13 This is significantly slowerthan the solvation dynamics in an un-substituted cyclodextrin.In contrast, dimethyl �-CD (which contains one OH group perglucose unit) exhibits extremely fast dynamics with a major(40%) ultrafast component (<0.3 ps), a fast component of2.4 ps (24%), and two slow components—50 ps (18%) and1450 ps (18%) (Fig. 2).
The surprisingly slow dynamics in trimethyl �-CD is ex-plained as follows. In bulk water, ultrafast solvation dynamicsarises from the extended hydrogen-bonded network.4 In thecase of unsubstituted CD-s, similar network is established be-tween the water molecules inside the cavity with those outsidethe cavity through the OH group of the cyclodextrins. Hence, amajor part of solvation dynamics in an unsubstituted cyclo-dextrin is ultrafast (<2 ps). In the case of trimethyl �-CD,there are no OH groups at the rim of the cyclodextrin cavity.Thus, there is no hydrogen-bond network connecting the watermolecules inside the cyclodextrin cavity and those outside thecavity. As a result, the ultrafast component (�2 ps) vanishesalmost completely in trimethyl �-CD. Because of the presenceof seven OH groups at the rim of dimethyl �-CD, the hydro-gen-bond network is at least partially established. Thus in this
1.0
0.8
0.6
0.4
0.2
0.0
C(t
)
12000800040000
Time/ps
1.0
0.8
0.6
0.4
2520151050a
b
a
b
Fig. 2. Decay of response function, CðtÞ of C153 bound to(a) 130mM trimethyl �-CD ( ) and (b) 130mM dimethyl�-CD ( ) in water. The points denote the actual values ofCðtÞ and the solid line denotes the best fit to an exponentialdecay. Initial parts of the decays of CðtÞ are shown in theinset (Reprinted with permission from Ref. 13. Copyright� 2005 American Chemical Society).
N
O
O
CF3
N
O
O
CF3
(a) (b)
Fig. 1. (a) 1:1 and (b) 1:2 complexes of C153 with methyl-�-cyclodextrin.
1034 Bull. Chem. Soc. Jpn. Vol. 80, No. 6 (2007) ACCOUNTS
case, there is a major (64%) ultrafast component (�0.3 and2.4 ps) of solvation dynamics.
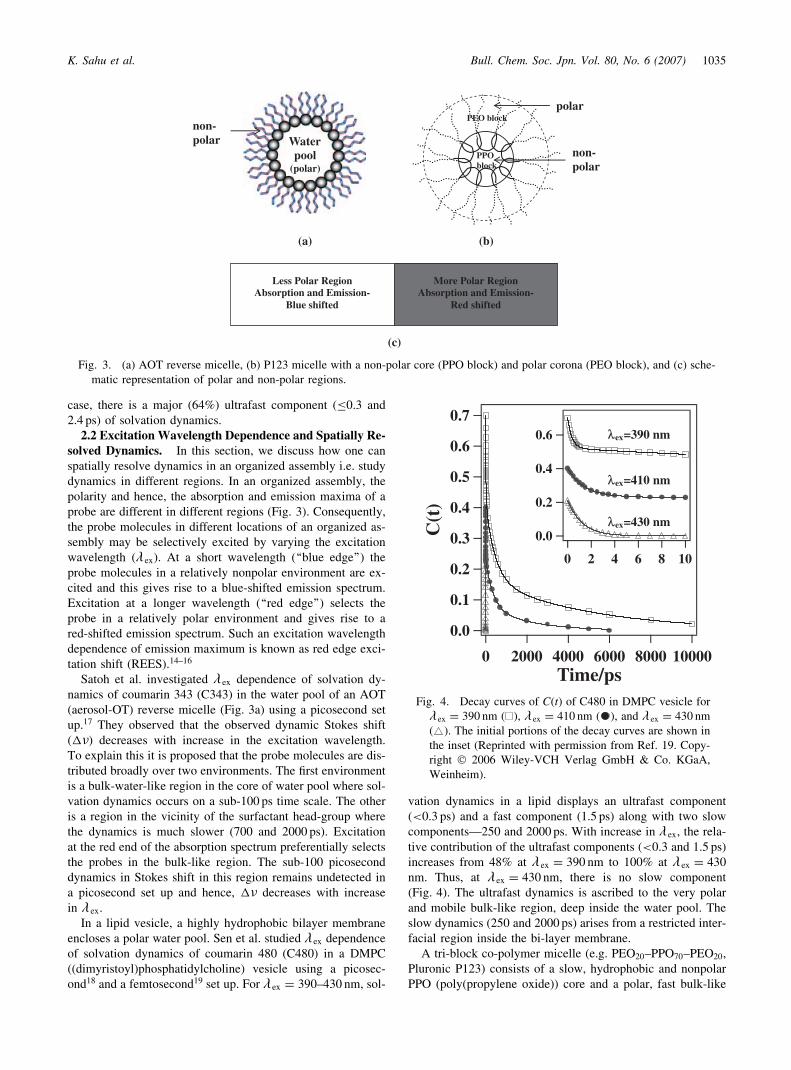
2.2 Excitation Wavelength Dependence and Spatially Re-solved Dynamics. In this section, we discuss how one canspatially resolve dynamics in an organized assembly i.e. studydynamics in different regions. In an organized assembly, thepolarity and hence, the absorption and emission maxima of aprobe are different in different regions (Fig. 3). Consequently,the probe molecules in different locations of an organized as-sembly may be selectively excited by varying the excitationwavelength (� ex). At a short wavelength (‘‘blue edge’’) theprobe molecules in a relatively nonpolar environment are ex-cited and this gives rise to a blue-shifted emission spectrum.Excitation at a longer wavelength (‘‘red edge’’) selects theprobe in a relatively polar environment and gives rise to ared-shifted emission spectrum. Such an excitation wavelengthdependence of emission maximum is known as red edge exci-tation shift (REES).14–16
Satoh et al. investigated � ex dependence of solvation dy-namics of coumarin 343 (C343) in the water pool of an AOT(aerosol-OT) reverse micelle (Fig. 3a) using a picosecond setup.17 They observed that the observed dynamic Stokes shift(��) decreases with increase in the excitation wavelength.To explain this it is proposed that the probe molecules are dis-tributed broadly over two environments. The first environmentis a bulk-water-like region in the core of water pool where sol-vation dynamics occurs on a sub-100 ps time scale. The otheris a region in the vicinity of the surfactant head-group wherethe dynamics is much slower (700 and 2000 ps). Excitationat the red end of the absorption spectrum preferentially selectsthe probes in the bulk-like region. The sub-100 picoseconddynamics in Stokes shift in this region remains undetected ina picosecond set up and hence, �� decreases with increasein � ex.
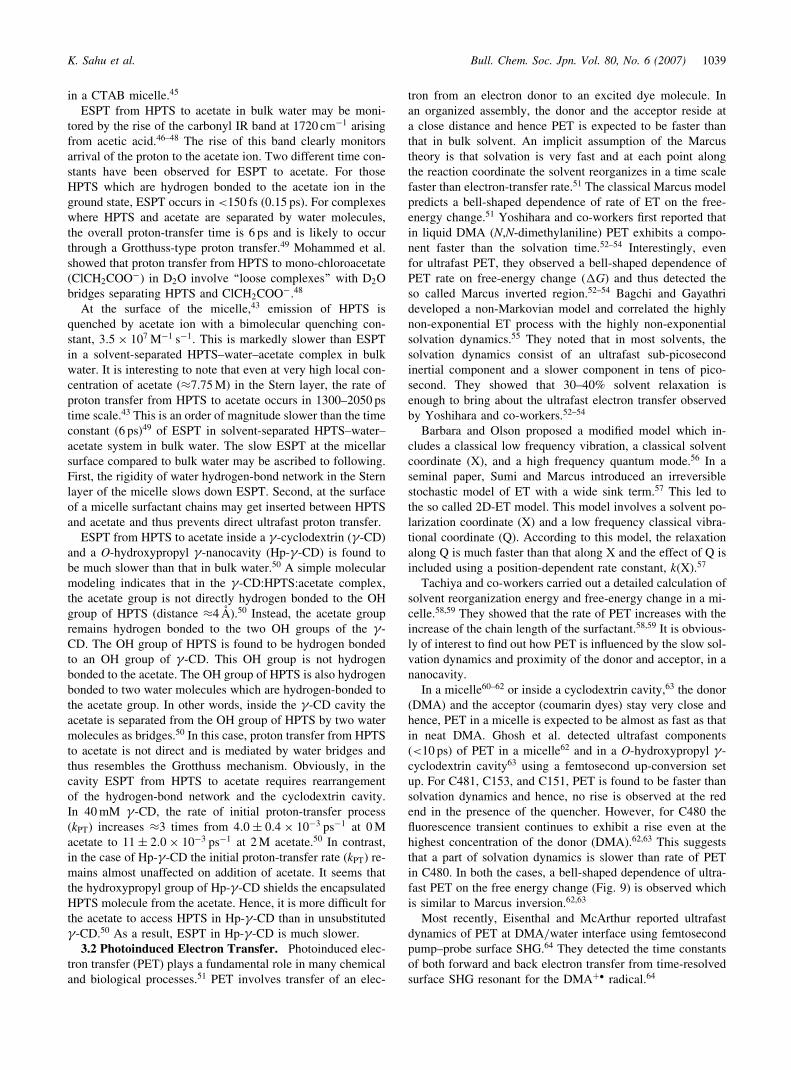
In a lipid vesicle, a highly hydrophobic bilayer membraneencloses a polar water pool. Sen et al. studied � ex dependenceof solvation dynamics of coumarin 480 (C480) in a DMPC((dimyristoyl)phosphatidylcholine) vesicle using a picosec-ond18 and a femtosecond19 set up. For � ex ¼ 390–430 nm, sol-
vation dynamics in a lipid displays an ultrafast component(<0.3 ps) and a fast component (1.5 ps) along with two slowcomponents—250 and 2000 ps. With increase in � ex, the rela-tive contribution of the ultrafast components (<0.3 and 1.5 ps)increases from 48% at � ex ¼ 390 nm to 100% at � ex ¼ 430
nm. Thus, at �ex ¼ 430 nm, there is no slow component(Fig. 4). The ultrafast dynamics is ascribed to the very polarand mobile bulk-like region, deep inside the water pool. Theslow dynamics (250 and 2000 ps) arises from a restricted inter-facial region inside the bi-layer membrane.
A tri-block co-polymer micelle (e.g. PEO20–PPO70–PEO20,Pluronic P123) consists of a slow, hydrophobic and nonpolarPPO (poly(propylene oxide)) core and a polar, fast bulk-like
PEO block
PPO block
(b)
polar
non-polar
Water pool
(polar)
(a)
non-polar
Less Polar RegionAbsorption and Emission-
Blue shifted
More Polar RegionAbsorption and Emission-
Red shifted
(c)
Fig. 3. (a) AOT reverse micelle, (b) P123 micelle with a non-polar core (PPO block) and polar corona (PEO block), and (c) sche-matic representation of polar and non-polar regions.
0.7
0.6
0.5
0.4
0.3
0.2
0.1
0.0
C(t
)
1000080006000400020000Time/ps
0.6
0.4
0.2
0.0
1086420
λex=410 nm
λex=390 nm
λex=430 nm
Fig. 4. Decay curves of CðtÞ of C480 in DMPC vesicle for�ex ¼ 390 nm ( ), �ex ¼ 410 nm ( ), and � ex ¼ 430 nm( ). The initial portions of the decay curves are shown inthe inset (Reprinted with permission from Ref. 19. Copy-right � 2006 Wiley-VCH Verlag GmbH & Co. KGaA,Weinheim).
K. Sahu et al. Bull. Chem. Soc. Jpn. Vol. 80, No. 6 (2007) 1035

peripheral corona containing the PEO (poly(ethylene oxide))block (Fig. 3b). Sen et al. studied solvation dynamics in differ-ent regions of a P123 micelle by varying � ex.
20 With increasein �ex from 375 to 478 nm, the emission maximum of C480exhibits a large red edge excitation shift (REES) by 25 nm.With increase in �ex, solvation dynamics in P123 micelle be-comes faster. The �ex dependence in P123 micelle has been in-terpreted in terms of three regions—the fast PEO-water inter-face with solvation time �2 ps, chain region (60 ps), and a veryslow (4500 ps) hydrophobic core region (PPO–PEO interface).With increase in � ex, contribution of the bulk-like ultrafast dy-namics (�2 ps) increases from 7% at � ex ¼ 375 nm to 78% at� ex ¼ 425 nm. There is a concomitant decrease in the contri-bution of the core-like slow component (4500 ps) from 79%at � ex ¼ 375 nm to 17% at 425 nm.20 Contribution of the of60 ps component, which arises from chain dynamics, decreasesfrom 14% at �ex ¼ 375 nm to 5% at � ex ¼ 425 nm.20
2.3 Solvation Dynamics in Proteins and DNA. Thebiological function of a protein is largely controlled by thequasi-bound biological or structured water molecules at thesurface.5–9 Guha et al.21 studied solvation dynamics at the ac-tive site of an enzyme, glutaminyl-tRNA synthetase (GlnRS)(Fig. 5). For this purpose, they attached a fluorescence probe,acrylodan, at a cysteine residue C229, near the active site. Sol-vation dynamics in GlnRs displays two slow components—400 and 2000 ps. When the amino acid glutamine (Gln) bindsto the enzyme (GlnRS) the 400 ps component slows downabout 2-fold to 750 ps while the 2000 ps component remainsunchanged. When tRNAgln binds to GlnRS the 400 ps compo-nent does not change but the 2000 ps component becomesslower (2500 ps). From this, it is inferred that the 400 ps com-ponent arises from the water molecules at the Gln binding sitewhile the 2000 ps corresponds to the tRNAgln binding site. Amutant Y211H-GlnRS was constructed in which the glutaminebinding site is disrupted. The mutant Y211H-GlnRS labeled atC229 with acrylodan exhibits significantly different solvent re-laxation.21 This demonstrates that the slow dynamics is indeedassociated with the active site.
The mitochondrial respiratory membrane protein cyto-chrome c is cationic in nature and carries a net positive charge(+8) at a neutral pH (�7). Binding of cytochrome c to anionicsurfactants (e.g. sodium dodecyl sulfate, SDS) or membranesresults in partially folded or molten globule-like states(Fig. 5). Cytochrome c forms two partially folded intermedi-ates—I1 (in the presence of SDS) and I2 (in the presence of
SDS and urea).22 Solvation dynamics in these two partiallyfolded states of cytochrome c are found to be drastically differ-ent and the most prominent differences are detected at veryearly times (<20 ps, Fig. 6).23 I1 displays an ultrafast compo-nent—0.5 ps (5%), and two slow components—90 ps (85%)and 400 ps (10%). In the case of I2, there is a major ultrafastcomponent of 1.3 ps (47%) and two slow components—60 ps(12.5%) and 170 ps (10.5%). The faster solvation dynamicssuggests that I2 is more open and labile compared to I1.
23
Samaddar et al. studied solvation dynamics in the pre-moltenglobule state of GlnRS.24 They observed that the solvationtime is of the order, native > molten globule > premoltenglobule.
Sen et al. studied solvation dynamics in hen egg white lyso-zyme in the presence of urea and SDS using coumarin 153(C153) as a probe.25 They found that a small amount of SDS(3mM) causes partial recovery of the urea denatured proteinand solvation dynamics in this system is very close to that inthe native protein. However, large excess of SDS (28mM)causes complete loss of the tertiary structure of the native pro-tein and the SDS micelles are squeezed inside the polypeptidechain of the protein. This results in a 3.5 times retardation ofsolvation dynamics compared to that in the native state.25 Sahuet al. studied interaction of a cationic surfactant cetyltrimethyl-ammonium bromide (CTAB) with the cationic protein lyso-zyme.26 In this case, hydrophobic interaction dominates overthe electrostatic repulsion between the cationic protein andthe cationic surfactant. Solvation dynamics in a lysozyme–CTAB aggregate is much slower than that in a CTAB micelleor in the protein (lysozyme).26
Very recently, several groups have applied large scale mo-lecular dynamics simulations to elucidate solvation dynamicsin different regions of a protein. Bagchi and co-workers inves-tigated solvation dynamics in a 36-residue globular protein,HP-36.27,28 The secondary structure of this protein containsthree short alpha-helices. The solvation dynamics of the polar
(a) (b)
Fig. 5. (a) Structure of GlnRs (PDB entry 1QTQ), (b) neck-lace model of protein–surfactant (cytochrome c–SDS)aggregate.
1.0
0.8
0.6
0.4
0.2
0.0
C(t
)
10008006004002000Time/ps
1.00.80.60.40.20.0
2520151050
I1
I2
Fig. 6. Initial part of the decay of CðtÞ of C153 containing5mM cytochrome c and 2mM SDS (I1) ( ); 5mM cyto-chrome c, 2mM SDS and 5M urea (I2) ( ) (Reprintedwith permission from Ref. 23. Copyright � 2006 Ameri-can Chemical Society).
1036 Bull. Chem. Soc. Jpn. Vol. 80, No. 6 (2007) ACCOUNTS

amino acid residues in helix-2 (h�i ¼ 11 ps) is found to be 2-fold faster than that in the other two helices. Surprisingly, thewater molecules around helix-2 exhibit much slower orienta-tional dynamics than those around the other two helices. It isshown that the dynamics depends on the degree of exposure.An exposed water molecule displays fast solvation dynamicswhile a buried one exhibits slower dynamics.28
Marchi and co-workers studied folding of a zwitterionicalanine octapeptide (A8) in a reverse micelle (RM) by MD(molecular dynamics) simulation.29 They showed that in theconfined environment (RM), the folded structure of a proteinis much more stable than the unfolded structure.29 For a smallRM, a stable helical structure of the polypeptide is detected.With rise in water content (w0) as the size of water pool in-creases, the polypeptide forms an extended structure.29 In aMD simulation, Zhong and co-workers detected multiple timescales of solvent relaxation in a peptide from femtosecond totens of picoseconds.30 Using terahertz spectroscopy and simu-lation, Heugen et al. showed that water molecules near a bio-molecule (lactose) are markedly slow.31 They found that thehydration layer around the carbohydrate extends up to 5.13 Afrom the surface and contains 123 water molecules.31
In contrast to the large body of work demonstrating ultra-slow dynamics near a protein, incoherent quasi-elastic neutronscattering32,33 and NMRD (nuclear magnetic relaxation disper-sion)34 studies suggest very slight slowing down of the watermolecules near a protein. It may be noted that different tech-niques detect different things. First, dielectric relaxation(DR) and dynamic Stokes shift capture collective responseof the solvent (water) dipoles. NMRD and QENS (quasi elasticneutron scattering) describe dynamics of a single water mole-cule in the absence of an electric field (i.e. in an equilibriumsituation). Second, NMRD, QENS, and DR offer no spatialresolution and all the water molecules contribute in these ex-periments. Dynamic Stokes shift, however, is dominated bythe water molecules in the first solvation shell and thus, hasa high spatial resolution. Evidently, the number of quasi-boundwater molecules around a fluorescent probe is very small com-pared to the very large number of water molecules presentaround a protein. NMRD and QENS data are dominated bythe huge number of water molecules, many of which are veryfast (particularly those at the surface of a protein). Thus,NMRD and QENS which detect an average of the water mole-cules at all the sites, often report very fast dynamics or almostbulk-water-like residence times with very small (sometimesnegligible) contribution of the slow water molecules. In con-trast, dynamic Stokes shift reports predominantly the dynamicsof the slow and buried water molecules in deep, hydrophobicpockets and hence, detect a relaxation component which ismarkedly slower compared to bulk water.
Most recently, many groups have studied dynamic Stokesshift in DNA.35–37 Zewail and co-workers studied solvation dy-namics in DNA using 2-aminopurine as an intrinsic probe anda minor groove binding non-covalent probe, pentamidine.35
They detected a bi-exponential decay with an ultrafast sub-picosecond component due to bulk water and a relatively long(�10 ps) component. Berg and co-workers studied a series ofoligo-nucleotides in which a native base pair is replaced bya dye molecule (C480).36 They found that when the probe
(C480) is in the centre of the helix, the time scale of relaxationis broadly distributed over six decades of time scale from 40 fsto 40 ns and obeys a power-law, ð1þ �=�0Þ��. The very long(�40 ns) component is assigned to the reorganization dynam-ics of DNA. Since the interior of the double-helix is devoid ofwater, the observed Stokes shift seems to originate from theelectric field of DNA on the probe. When the probe (C480)is attached at the end of the helix an additional very fast com-ponent of 5 ps is detected.37 The 5 ps component and the in-creased mobility (‘‘fraying’’) at the end of the helix is ascribedto increased exposure of the probe to bulk water and lowercounter ion concentration.37
2.4 Origin of Ultraslow Dynamics of Biological Water.We now discuss a phenomenological model which explainsthe slow dynamics of the ‘‘biological water.’’ According toNandi and Bagchi9 in an organized assembly, the dielectricsresponse arises from two kinds of water molecules—‘‘bound’’and ‘‘free.’’ The ‘‘bound’’ water molecule are those which arehydrogen bonded to a large biological macromolecule andimmobilized losing their translational and rotational degreesof freedom. The free water molecules are hydrogen bondedto other water molecules and retain bulk-like ultrafast mobili-ty. The bound state of water is usually lower in energy thanthat of a ‘‘free’’ water molecule. According to a recent comput-er simulation, a water molecule ‘‘bound’’ to a micelle is stabi-lized by about 8 kcalmol�1 compared to bulk (free) water(Fig. 7).38 In this model, the rate-determining step in solvationdynamics is the rate of inter-conversion of bound-to-free water(kbf),
9
kbf ¼kBT
h
� �exp
�ð�G0 þ�G�ÞRT
� �; ð2Þ
where,�G� is the activation energy for the conversion of free-to-bound water molecules.
In an attempt to verify this model, Sen et al.39 studied tem-perature dependence of solvation dynamics in a micelle, tritonX-100 (TX-100). They found that with rise in temperature sol-vation time in TX-100 micelle decreases. The average solva-tion times are found to be 800, 400, and 110 ps at 283, 303,and 323K, respectively. According to Eq. 2, the plot of loga-rithm of average solvation time against 1=T should be linear.Such a linear plot has been observed for TX-100 micelle,39
a cyclodextrin aggregate40 and in a protein.41 In the case ofTX-100 micelle, from such a plot the activation energy isfound to be 9� 1 kcalmol�1 with a positive entropy factorof 14 cal K�1 mol�1.39 It is interesting to note that the activa-tion energy obtained experimentally from temperature depen-dence of solvation dynamics is very close to the energy differ-ence between bound and free water, estimated in a computersimulation.38 In the case of a cyclodextrin aggregate, the aver-age solvation time decrease dramatically from 660 to 30 pswith increase in temperature from 278 to 318K (Fig. 8).40 Thiscorresponds to an activation barrier of 12.5 kcalmol�1 and anentropy of activation of 28 calmol�1 K�1. Solvation dynamicsof 8-anilino-1-naphthalenesulfonate (ANS) bound to bovineserum albumin (BSA) displays a component (300 ps) whichis independent of temperature in the range of 278–318K anda long component which decreases from 5800 ps at 278K to3600 ps at 318K.41 The temperature independent part (300 ps
K. Sahu et al. Bull. Chem. Soc. Jpn. Vol. 80, No. 6 (2007) 1037

component) is ascribed to a dynamic exchange of bound tofree water with a low barrier. The temperature variation ofthe long component of solvation dynamics corresponds to anactivation energy of 2.1 kcalmol�1. The activation energy isascribed to local segmental motion of the protein along withthe associated water molecules and polar residues. The entropyof activation is found to be �13 cal K�1 mol�1. The observednegative entropy suggests an ordering of the local structureat the transition state of the protein segment during dipolarrelaxation.41
3. Proton and Electron Transfer in a Confined System
In a polar reaction, a non-polar reactant is converted into acharge-separated species. The most common example of sucha reaction is dissociation of an acid into proton and anion andalso electron-transfer reactions. Solvation makes a polar reac-tion more facile. We will now discuss ultrafast excited stateproton- and electron-transfer processes inside a nano-cavity.We will show that in an organized environment ultraslow sol-
vation and unfavorable geometry causes marked retardation ofpolar proton and electron-transfer processes.
3.1 Excited State Proton-Transfer Processes. Acidity ofmany molecules markedly increases in the excited state. Forinstance, pKa of HPTS (8-hydroxypyrene-1,3,6-trisulfonate,HPTS) decreases from 7.4 in the ground state to 0.4 in the firstexcited state.42 Thus in the excited state, acidity of HPTS is�10-million times stronger than that in the ground state andhence, an excited HPTS rapidly transfers a proton to a watermolecule even in a highly acidic media (e.g. pH �1).
Excited state proton transfer (ESPT) in an organized assem-bly differs markedly from that in bulk water. The local pH orpKa of the acid may be very different from those in the bulkbecause of the differences in polarity and presence of counterion and consequent, electrostatic interactions. pH at the surfaceof a cationic micelle (CTAB) has been determined using HPTSas a probe.43 It is observed that at a bulk pH 7, the pH at thesurface of CTAB micelle is �9.5.
ESPT from HPTS to water involves three basic steps—pro-ton transfer (kPT), recombination (krec), and dissociation (kdiss)of the geminate ion pair (Scheme 1). In the reactive stage, afast short range charge separation occurs and a solvent stabi-lized ion pair is formed. The next step is the geminate recom-bination of the ion pair. Confinement of the acid slows downthe initial dissociation because of ultraslow solvent responseand accelerates the recombination of the geminate ion-pair be-cause of close proximity. Mondal et al. investigated ESPT ofHPTS in �-cyclodextrin (�-CD) cavity using picosecond andfemtosecond fluorescence spectroscopy.44 They showed thatthe recombination of the geminate ion pair accelerates butthe initial proton-transfer step and the dissociation of the gemi-nate ion pair slow down inside �-CD. Sahu et al. showed thatdeprotonation, recombination, and dissociation of the geminateion pair in the lysozyme–CTAB aggregate are faster than that
Free Water
Bound Water
Reaction Coordinate
kbf
kfb
Pot
enti
al E
nerg
y
0bf∆G
*∆G
(b)(a)
N
H
O C
N H
C O O
H
H
O
H H
H H
O
H
O H
H
O
H
O
O
Protein
BoundWater
O
H
H
H
H
O H
H
O
FreeWater H H
Fig. 7. (a) Free and bound water in the hydration shell of a protein. (b) Dynamic exchange model (Reprinted with permission fromRef. 6. Copyright � 2003 American Chemical Society).
3.2x10⁻³ 3.4x10⁻³ 3.6x10-320
21
22
23
24
25
ln (1
/<τ>
corr
)
1/T/K-1
Fig. 8. Plot of lnð1=h�sicorrÞ against 1=T for C153 in 40mM�-CD (Reprinted with permission from Ref. 40. Copyright� 2005 American Chemical Society).
A-* + H3O+
kPT
kA-
AH* + H2O (A-*. . . . H3O+)
AH
kAH kA
A- A-
kdiss
kp[H+]krec
Scheme 1. Proton-transfer processes in pyranine.
1038 Bull. Chem. Soc. Jpn. Vol. 80, No. 6 (2007) ACCOUNTS
in a CTAB micelle.45
ESPT from HPTS to acetate in bulk water may be moni-tored by the rise of the carbonyl IR band at 1720 cm�1 arisingfrom acetic acid.46–48 The rise of this band clearly monitorsarrival of the proton to the acetate ion. Two different time con-stants have been observed for ESPT to acetate. For thoseHPTS which are hydrogen bonded to the acetate ion in theground state, ESPT occurs in <150 fs (0.15 ps). For complexeswhere HPTS and acetate are separated by water molecules,the overall proton-transfer time is 6 ps and is likely to occurthrough a Grotthuss-type proton transfer.49 Mohammed et al.showed that proton transfer from HPTS to mono-chloroacetate(ClCH2COO
�) in D2O involve ‘‘loose complexes’’ with D2Obridges separating HPTS and ClCH2COO
�.48
At the surface of the micelle,43 emission of HPTS isquenched by acetate ion with a bimolecular quenching con-stant, 3:5� 107 M�1 s�1. This is markedly slower than ESPTin a solvent-separated HPTS–water–acetate complex in bulkwater. It is interesting to note that even at very high local con-centration of acetate (�7.75M) in the Stern layer, the rate ofproton transfer from HPTS to acetate occurs in 1300–2050 pstime scale.43 This is an order of magnitude slower than the timeconstant (6 ps)49 of ESPT in solvent-separated HPTS–water–acetate system in bulk water. The slow ESPT at the micellarsurface compared to bulk water may be ascribed to following.First, the rigidity of water hydrogen-bond network in the Sternlayer of the micelle slows down ESPT. Second, at the surfaceof a micelle surfactant chains may get inserted between HPTSand acetate and thus prevents direct ultrafast proton transfer.
ESPT from HPTS to acetate inside a �-cyclodextrin (�-CD)and a O-hydroxypropyl �-nanocavity (Hp-�-CD) is found tobe much slower than that in bulk water.50 A simple molecularmodeling indicates that in the �-CD:HPTS:acetate complex,the acetate group is not directly hydrogen bonded to the OHgroup of HPTS (distance �4 A).50 Instead, the acetate groupremains hydrogen bonded to the two OH groups of the �-CD. The OH group of HPTS is found to be hydrogen bondedto an OH group of �-CD. This OH group is not hydrogenbonded to the acetate. The OH group of HPTS is also hydrogenbonded to two water molecules which are hydrogen-bonded tothe acetate group. In other words, inside the �-CD cavity theacetate is separated from the OH group of HPTS by two watermolecules as bridges.50 In this case, proton transfer from HPTSto acetate is not direct and is mediated by water bridges andthus resembles the Grotthuss mechanism. Obviously, in thecavity ESPT from HPTS to acetate requires rearrangementof the hydrogen-bond network and the cyclodextrin cavity.In 40mM �-CD, the rate of initial proton-transfer process(kPT) increases �3 times from 4:0� 0:4� 10�3 ps�1 at 0Macetate to 11� 2:0� 10�3 ps�1 at 2M acetate.50 In contrast,in the case of Hp-�-CD the initial proton-transfer rate (kPT) re-mains almost unaffected on addition of acetate. It seems thatthe hydroxypropyl group of Hp-�-CD shields the encapsulatedHPTS molecule from the acetate. Hence, it is more difficult forthe acetate to access HPTS in Hp-�-CD than in unsubstituted�-CD.50 As a result, ESPT in Hp-�-CD is much slower.
3.2 Photoinduced Electron Transfer. Photoinduced elec-tron transfer (PET) plays a fundamental role in many chemicaland biological processes.51 PET involves transfer of an elec-
tron from an electron donor to an excited dye molecule. Inan organized assembly, the donor and the acceptor reside ata close distance and hence PET is expected to be faster thanthat in bulk solvent. An implicit assumption of the Marcustheory is that solvation is very fast and at each point alongthe reaction coordinate the solvent reorganizes in a time scalefaster than electron-transfer rate.51 The classical Marcus modelpredicts a bell-shaped dependence of rate of ET on the free-energy change.51 Yoshihara and co-workers first reported thatin liquid DMA (N,N-dimethylaniline) PET exhibits a compo-nent faster than the solvation time.52–54 Interestingly, evenfor ultrafast PET, they observed a bell-shaped dependence ofPET rate on free-energy change (�G) and thus detected theso called Marcus inverted region.52–54 Bagchi and Gayathrideveloped a non-Markovian model and correlated the highlynon-exponential ET process with the highly non-exponentialsolvation dynamics.55 They noted that in most solvents, thesolvation dynamics consist of an ultrafast sub-picosecondinertial component and a slower component in tens of pico-second. They showed that 30–40% solvent relaxation isenough to bring about the ultrafast electron transfer observedby Yoshihara and co-workers.52–54
Barbara and Olson proposed a modified model which in-cludes a classical low frequency vibration, a classical solventcoordinate (X), and a high frequency quantum mode.56 In aseminal paper, Sumi and Marcus introduced an irreversiblestochastic model of ET with a wide sink term.57 This led tothe so called 2D-ET model. This model involves a solvent po-larization coordinate (X) and a low frequency classical vibra-tional coordinate (Q). According to this model, the relaxationalong Q is much faster than that along X and the effect of Q isincluded using a position-dependent rate constant, k(X).57
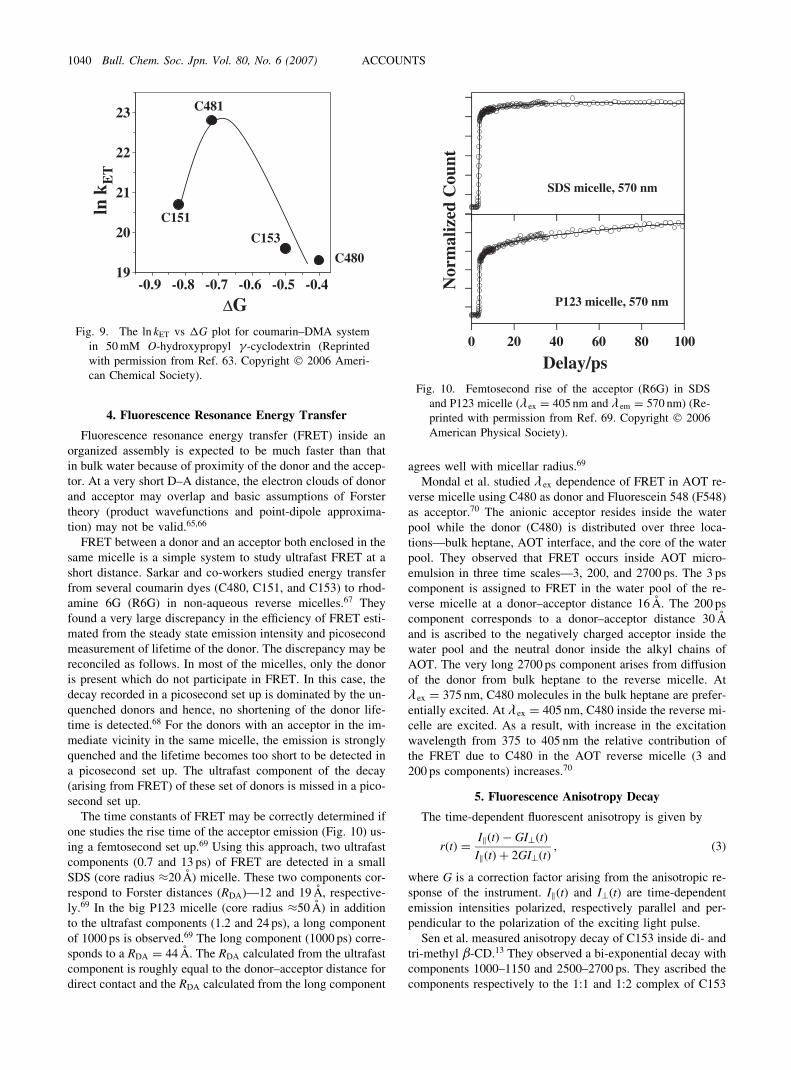
Tachiya and co-workers carried out a detailed calculation ofsolvent reorganization energy and free-energy change in a mi-celle.58,59 They showed that the rate of PET increases with theincrease of the chain length of the surfactant.58,59 It is obvious-ly of interest to find out how PET is influenced by the slow sol-vation dynamics and proximity of the donor and acceptor, in ananocavity.
In a micelle60–62 or inside a cyclodextrin cavity,63 the donor(DMA) and the acceptor (coumarin dyes) stay very close andhence, PET in a micelle is expected to be almost as fast as thatin neat DMA. Ghosh et al. detected ultrafast components(<10 ps) of PET in a micelle62 and in a O-hydroxypropyl �-cyclodextrin cavity63 using a femtosecond up-conversion setup. For C481, C153, and C151, PET is found to be faster thansolvation dynamics and hence, no rise is observed at the redend in the presence of the quencher. However, for C480 thefluorescence transient continues to exhibit a rise even at thehighest concentration of the donor (DMA).62,63 This suggeststhat a part of solvation dynamics is slower than rate of PETin C480. In both the cases, a bell-shaped dependence of ultra-fast PET on the free energy change (Fig. 9) is observed whichis similar to Marcus inversion.62,63
Most recently, Eisenthal and McArthur reported ultrafastdynamics of PET at DMA/water interface using femtosecondpump–probe surface SHG.64 They detected the time constantsof both forward and back electron transfer from time-resolvedsurface SHG resonant for the DMAþ� radical.64
K. Sahu et al. Bull. Chem. Soc. Jpn. Vol. 80, No. 6 (2007) 1039
4. Fluorescence Resonance Energy Transfer
Fluorescence resonance energy transfer (FRET) inside anorganized assembly is expected to be much faster than thatin bulk water because of proximity of the donor and the accep-tor. At a very short D–A distance, the electron clouds of donorand acceptor may overlap and basic assumptions of Forstertheory (product wavefunctions and point-dipole approxima-tion) may not be valid.65,66
FRET between a donor and an acceptor both enclosed in thesame micelle is a simple system to study ultrafast FRET at ashort distance. Sarkar and co-workers studied energy transferfrom several coumarin dyes (C480, C151, and C153) to rhod-amine 6G (R6G) in non-aqueous reverse micelles.67 Theyfound a very large discrepancy in the efficiency of FRET esti-mated from the steady state emission intensity and picosecondmeasurement of lifetime of the donor. The discrepancy may bereconciled as follows. In most of the micelles, only the donoris present which do not participate in FRET. In this case, thedecay recorded in a picosecond set up is dominated by the un-quenched donors and hence, no shortening of the donor life-time is detected.68 For the donors with an acceptor in the im-mediate vicinity in the same micelle, the emission is stronglyquenched and the lifetime becomes too short to be detected ina picosecond set up. The ultrafast component of the decay(arising from FRET) of these set of donors is missed in a pico-second set up.
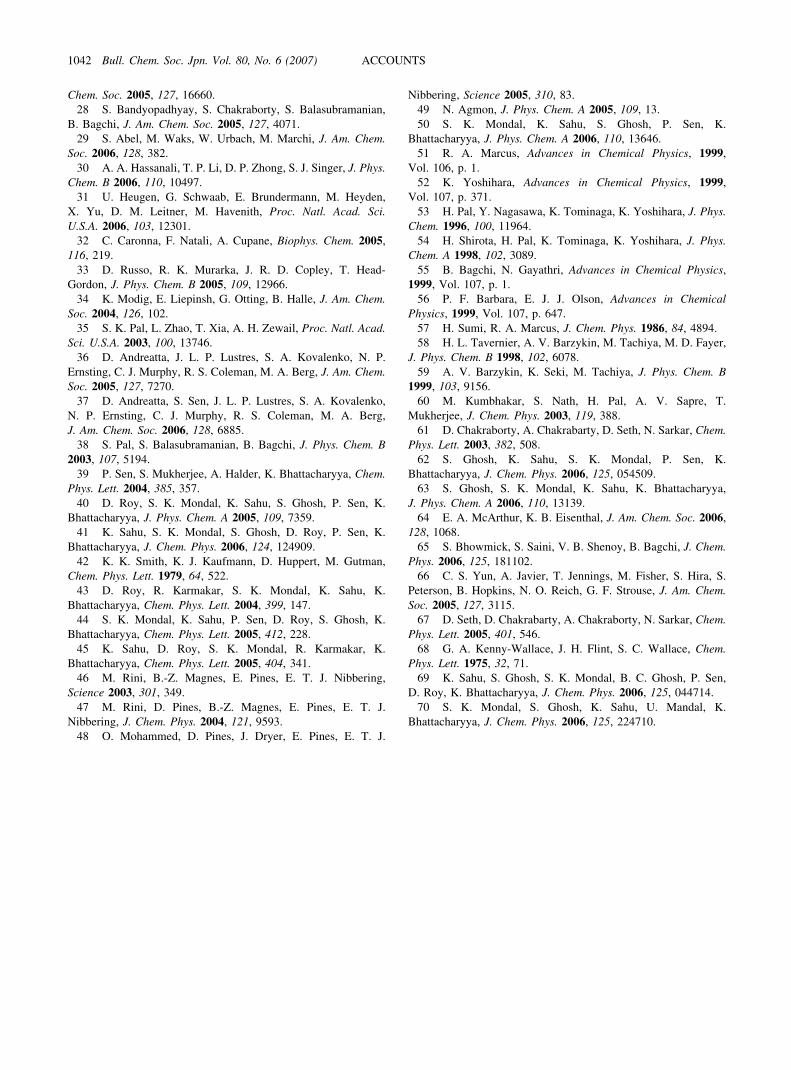
The time constants of FRET may be correctly determined ifone studies the rise time of the acceptor emission (Fig. 10) us-ing a femtosecond set up.69 Using this approach, two ultrafastcomponents (0.7 and 13 ps) of FRET are detected in a smallSDS (core radius �20 A) micelle. These two components cor-respond to Forster distances (RDA)—12 and 19 A, respective-ly.69 In the big P123 micelle (core radius �50 A) in additionto the ultrafast components (1.2 and 24 ps), a long componentof 1000 ps is observed.69 The long component (1000 ps) corre-sponds to a RDA ¼ 44 A. The RDA calculated from the ultrafastcomponent is roughly equal to the donor–acceptor distance fordirect contact and the RDA calculated from the long component
agrees well with micellar radius.69
Mondal et al. studied � ex dependence of FRET in AOT re-verse micelle using C480 as donor and Fluorescein 548 (F548)as acceptor.70 The anionic acceptor resides inside the waterpool while the donor (C480) is distributed over three loca-tions—bulk heptane, AOT interface, and the core of the waterpool. They observed that FRET occurs inside AOT micro-emulsion in three time scales—3, 200, and 2700 ps. The 3 pscomponent is assigned to FRET in the water pool of the re-verse micelle at a donor–acceptor distance 16 A. The 200 pscomponent corresponds to a donor–acceptor distance 30 Aand is ascribed to the negatively charged acceptor inside thewater pool and the neutral donor inside the alkyl chains ofAOT. The very long 2700 ps component arises from diffusionof the donor from bulk heptane to the reverse micelle. At� ex ¼ 375 nm, C480 molecules in the bulk heptane are prefer-entially excited. At � ex ¼ 405 nm, C480 inside the reverse mi-celle are excited. As a result, with increase in the excitationwavelength from 375 to 405 nm the relative contribution ofthe FRET due to C480 in the AOT reverse micelle (3 and200 ps components) increases.70
5. Fluorescence Anisotropy Decay
The time-dependent fluorescent anisotropy is given by
rðtÞ ¼IkðtÞ � GI?ðtÞIkðtÞ þ 2GI?ðtÞ
; ð3Þ
where G is a correction factor arising from the anisotropic re-sponse of the instrument. IkðtÞ and I?ðtÞ are time-dependentemission intensities polarized, respectively parallel and per-pendicular to the polarization of the exciting light pulse.
Sen et al. measured anisotropy decay of C153 inside di- andtri-methyl �-CD.13 They observed a bi-exponential decay withcomponents 1000–1150 and 2500–2700 ps. They ascribed thecomponents respectively to the 1:1 and 1:2 complex of C153
-0.9 -0.8 -0.7 -0.6 -0.5 -0.419
20
21
22
23ln
kE
T
∆G
C151
C481
C153
C480
Fig. 9. The ln kET vs �G plot for coumarin–DMA systemin 50mM O-hydroxypropyl �-cyclodextrin (Reprintedwith permission from Ref. 63. Copyright � 2006 Ameri-can Chemical Society).
100806040200
Nor
mal
ized
Cou
nt
SDS micelle, 570 nm
P123 micelle, 570 nm
Delay/psFig. 10. Femtosecond rise of the acceptor (R6G) in SDS
and P123 micelle (� ex ¼ 405 nm and � em ¼ 570 nm) (Re-printed with permission from Ref. 69. Copyright � 2006American Physical Society).
1040 Bull. Chem. Soc. Jpn. Vol. 80, No. 6 (2007) ACCOUNTS

with cyclodextrin (Fig. 1). The hydrodynamic radius (rh) ofthe complexes may be estimated from the time constant (�R)of fluorescence anisotropy decay using the equation
�R ¼4��r3h3kT
: ð4Þ
The hydrodynamic radius of the 1:1 and 1:2 complexes are8:5� 0:5 and 11:5� 0:5 A, respectively. Since the height ofdimethyl �-CD is 10.9 A.10 This suggests that �5 A the probeis projected out of the cavity in case of the 1:1 complex. Thehydrodynamic diameter (2rh) of 1:2 complex is roughly equalto the sum of height of two CD cavities.13
Most recently, Roy et al. observed an extremely slow aniso-tropy decay (time constant >20 ns) for the C153-�-cyclodex-trin guest–host complex (Fig. 11).40 They attributed the ultra-slow time constant of anisotropy to the formation of a longnano-tube aggregates containing a large number (>50) cyclo-dextrins joined together non-covalently through the guestmolecules (Fig. 11).40
6. Conclusion
In a confined system, disruption of the water–water hydro-gen-bond network, immobilization of the water molecules be-cause of binding with macromolecules and close proximity af-fect the dynamics profoundly. This leads to both ultrafast andultraslow dynamics. As shown in this article, dynamics in anano-confined system is fundamentally different from that ina bulk liquid. The recent results on these systems have impli-cations in many biological processes. Recent progress in thisarea raised the hope that in near future, it will be possible to
unravel dynamics of biological systems in minute details.The ultimately goal of such a study is to understand the rela-tion between dynamics and biological function.
Thanks are due to Department of Science and Technology,India (Project Number: IR/I1/CF-01/2002) and Council ofScientific and Industrial Research (CSIR) for generous re-search grants. KS, SKM, and SG thank CSIR for awardingfellowships. KB thanks Professors B. Bagchi, K. Tominaga,and T. Tahara for many stimulating discussions and usefulcollaborations.
References
1 W. Jarzeba, G. C. Walker, A. E. Johnson, M. A. Kahlow,P. F. Barbara, J. Phys. Chem. 1988, 92, 7039.
2 R. Jimenez, G. R. Fleming, P. V. Kumar, M. Maroncelli,Nature 1994, 369, 471.
3 N. Nandi, S. Roy, B. Bagchi, J. Chem. Phys. 1995, 102,1390.
4 C. J. Fecko, J. D. Eaves, J. J. Loparo, A. Tokmakoff, P. L.Geissler, Science 2003, 301, 1698.
5 N. Nandi, B. Bagchi, K. Bhattacharyya, Chem. Rev. 2000,100, 2013.
6 K. Bhattacharyya, Acc. Chem. Res. 2003, 36, 95.7 B. Bagchi, Chem. Rev. 2005, 105, 3197.8 S. K. Pal, A. H. Zewail, Chem. Rev. 2004, 104, 2099.9 N. Nandi, B. Bagchi, J. Phys. Chem. B 1997, 101, 10954.10 K. Uekama, F. Hirayama, T. Irie, Chem. Rev. 1998, 98,
2045.11 M. Khajehpour, T. Troxler, V. Nanda, J. M. Vanderkooi,
Proteins 2004, 55, 275.12 S. Vajda, R. Jimenez, S. J. Rosenthal, V. Fidler, G. R.
Fleming, E. W. Castner, Jr., J. Chem. Soc., Faraday Trans.1995, 91, 867.13 P. Sen, D. Roy, S. K. Mondal, K. Sahu, S. Ghosh, K.
Bhattacharyya, J. Phys. Chem. A 2005, 109, 9716.14 A. P. Demchenko, Biophys. Chem. 1982, 15, 101.15 J. R. Lakowicz, Biochemistry 1984, 23, 3013.16 D. A. Kelkar, A. Chattopadhyay, J. Phys. Chem. B 2004,
108, 12151.17 T. Satoh, H. Okuno, K. Tominaga, K. Bhattacharyya,
Chem. Lett. 2004, 33, 1090.18 P. Sen, T. Satoh, K. Bhattacharyya, K. Tominaga, Chem.
Phys. Lett. 2005, 411, 339.19 P. Sen, S. Ghosh, S. K. Mondal, K. Sahu, D. Roy, K.
Bhattacharyya, K. Tominaga, Chem. Asian J. 2006, 1, 188.20 P. Sen, S. Ghosh, K. Sahu, S. K. Mondal, D. Roy, K.
Bhattacharyya, J. Chem. Phys. 2006, 124, 204905.21 S. Guha, K. Sahu, D. Roy, S. K. Mondal, S. Roy, K.
Bhattacharyya, Biochemistry 2005, 44, 8940.22 K. Chattopadhyay, S. Mazumdar, Biochemistry 2003, 42,
14606.23 K. Sahu, S. K. Mondal, S. Ghosh, D. Roy, P. Sen, K.
Bhattacharyya, J. Phys. Chem. B 2006, 110, 1056.24 S. Samaddar, A. K. Mandal, S. K. Mondal, K. Sahu, K.
Bhattacharyya, S. Roy, J. Phys. Chem. B 2006, 110, 21210.25 P. Sen, D. Roy, K. Sahu, S. K. Mondal, K. Bhattacharyya,
Chem. Phys. Lett. 2004, 395, 58.26 K. Sahu, S. K. Mondal, D. Roy, R. Karmakar, K.
Bhattacharyya, Chem. Phys. Lett. 2005, 413, 484.27 S. Bandyopadhyay, S. Chakraborty, B. Bagchi, J. Am.
0 4 8 12 16 200.0
0.1
0.2
0.3
0.4r(
t)
Time/ns
(a)
O O
CF3
N
OO
CF3
N
O O
CF3
N O
O
CF3
N
O O
CF3
N
O O
CF3
N
(b)
Fig. 11. (a) Fluorescence anisotropy decay of C153 (�ex ¼405 nm and � em ¼ 490 nm) in 40mM �-CD at 278K.(b) Model of C153: �-CD linear aggregate (Reprintedwith permission from Ref. 40. Copyright � 2005 Ameri-can Chemical Society).
K. Sahu et al. Bull. Chem. Soc. Jpn. Vol. 80, No. 6 (2007) 1041
Chem. Soc. 2005, 127, 16660.28 S. Bandyopadhyay, S. Chakraborty, S. Balasubramanian,
B. Bagchi, J. Am. Chem. Soc. 2005, 127, 4071.29 S. Abel, M. Waks, W. Urbach, M. Marchi, J. Am. Chem.
Soc. 2006, 128, 382.30 A. A. Hassanali, T. P. Li, D. P. Zhong, S. J. Singer, J. Phys.
Chem. B 2006, 110, 10497.31 U. Heugen, G. Schwaab, E. Brundermann, M. Heyden,
X. Yu, D. M. Leitner, M. Havenith, Proc. Natl. Acad. Sci.U.S.A. 2006, 103, 12301.32 C. Caronna, F. Natali, A. Cupane, Biophys. Chem. 2005,
116, 219.33 D. Russo, R. K. Murarka, J. R. D. Copley, T. Head-
Gordon, J. Phys. Chem. B 2005, 109, 12966.34 K. Modig, E. Liepinsh, G. Otting, B. Halle, J. Am. Chem.
Soc. 2004, 126, 102.35 S. K. Pal, L. Zhao, T. Xia, A. H. Zewail, Proc. Natl. Acad.
Sci. U.S.A. 2003, 100, 13746.36 D. Andreatta, J. L. P. Lustres, S. A. Kovalenko, N. P.
Ernsting, C. J. Murphy, R. S. Coleman, M. A. Berg, J. Am. Chem.Soc. 2005, 127, 7270.37 D. Andreatta, S. Sen, J. L. P. Lustres, S. A. Kovalenko,
N. P. Ernsting, C. J. Murphy, R. S. Coleman, M. A. Berg,J. Am. Chem. Soc. 2006, 128, 6885.38 S. Pal, S. Balasubramanian, B. Bagchi, J. Phys. Chem. B
2003, 107, 5194.39 P. Sen, S. Mukherjee, A. Halder, K. Bhattacharyya, Chem.
Phys. Lett. 2004, 385, 357.40 D. Roy, S. K. Mondal, K. Sahu, S. Ghosh, P. Sen, K.
Bhattacharyya, J. Phys. Chem. A 2005, 109, 7359.41 K. Sahu, S. K. Mondal, S. Ghosh, D. Roy, P. Sen, K.
Bhattacharyya, J. Chem. Phys. 2006, 124, 124909.42 K. K. Smith, K. J. Kaufmann, D. Huppert, M. Gutman,
Chem. Phys. Lett. 1979, 64, 522.43 D. Roy, R. Karmakar, S. K. Mondal, K. Sahu, K.
Bhattacharyya, Chem. Phys. Lett. 2004, 399, 147.44 S. K. Mondal, K. Sahu, P. Sen, D. Roy, S. Ghosh, K.
Bhattacharyya, Chem. Phys. Lett. 2005, 412, 228.45 K. Sahu, D. Roy, S. K. Mondal, R. Karmakar, K.
Bhattacharyya, Chem. Phys. Lett. 2005, 404, 341.46 M. Rini, B.-Z. Magnes, E. Pines, E. T. J. Nibbering,
Science 2003, 301, 349.47 M. Rini, D. Pines, B.-Z. Magnes, E. Pines, E. T. J.
Nibbering, J. Chem. Phys. 2004, 121, 9593.48 O. Mohammed, D. Pines, J. Dryer, E. Pines, E. T. J.
Nibbering, Science 2005, 310, 83.49 N. Agmon, J. Phys. Chem. A 2005, 109, 13.50 S. K. Mondal, K. Sahu, S. Ghosh, P. Sen, K.
Bhattacharyya, J. Phys. Chem. A 2006, 110, 13646.51 R. A. Marcus, Advances in Chemical Physics, 1999,
Vol. 106, p. 1.52 K. Yoshihara, Advances in Chemical Physics, 1999,
Vol. 107, p. 371.53 H. Pal, Y. Nagasawa, K. Tominaga, K. Yoshihara, J. Phys.
Chem. 1996, 100, 11964.54 H. Shirota, H. Pal, K. Tominaga, K. Yoshihara, J. Phys.
Chem. A 1998, 102, 3089.55 B. Bagchi, N. Gayathri, Advances in Chemical Physics,
1999, Vol. 107, p. 1.56 P. F. Barbara, E. J. J. Olson, Advances in Chemical
Physics, 1999, Vol. 107, p. 647.57 H. Sumi, R. A. Marcus, J. Chem. Phys. 1986, 84, 4894.58 H. L. Tavernier, A. V. Barzykin, M. Tachiya, M. D. Fayer,
J. Phys. Chem. B 1998, 102, 6078.59 A. V. Barzykin, K. Seki, M. Tachiya, J. Phys. Chem. B
1999, 103, 9156.60 M. Kumbhakar, S. Nath, H. Pal, A. V. Sapre, T.
Mukherjee, J. Chem. Phys. 2003, 119, 388.61 D. Chakraborty, A. Chakrabarty, D. Seth, N. Sarkar, Chem.
Phys. Lett. 2003, 382, 508.62 S. Ghosh, K. Sahu, S. K. Mondal, P. Sen, K.
Bhattacharyya, J. Chem. Phys. 2006, 125, 054509.63 S. Ghosh, S. K. Mondal, K. Sahu, K. Bhattacharyya,
J. Phys. Chem. A 2006, 110, 13139.64 E. A. McArthur, K. B. Eisenthal, J. Am. Chem. Soc. 2006,
128, 1068.65 S. Bhowmick, S. Saini, V. B. Shenoy, B. Bagchi, J. Chem.
Phys. 2006, 125, 181102.66 C. S. Yun, A. Javier, T. Jennings, M. Fisher, S. Hira, S.
Peterson, B. Hopkins, N. O. Reich, G. F. Strouse, J. Am. Chem.Soc. 2005, 127, 3115.67 D. Seth, D. Chakrabarty, A. Chakraborty, N. Sarkar, Chem.
Phys. Lett. 2005, 401, 546.68 G. A. Kenny-Wallace, J. H. Flint, S. C. Wallace, Chem.
Phys. Lett. 1975, 32, 71.69 K. Sahu, S. Ghosh, S. K. Mondal, B. C. Ghosh, P. Sen,
D. Roy, K. Bhattacharyya, J. Chem. Phys. 2006, 125, 044714.70 S. K. Mondal, S. Ghosh, K. Sahu, U. Mandal, K.
Bhattacharyya, J. Chem. Phys. 2006, 125, 224710.
1042 Bull. Chem. Soc. Jpn. Vol. 80, No. 6 (2007) ACCOUNTS
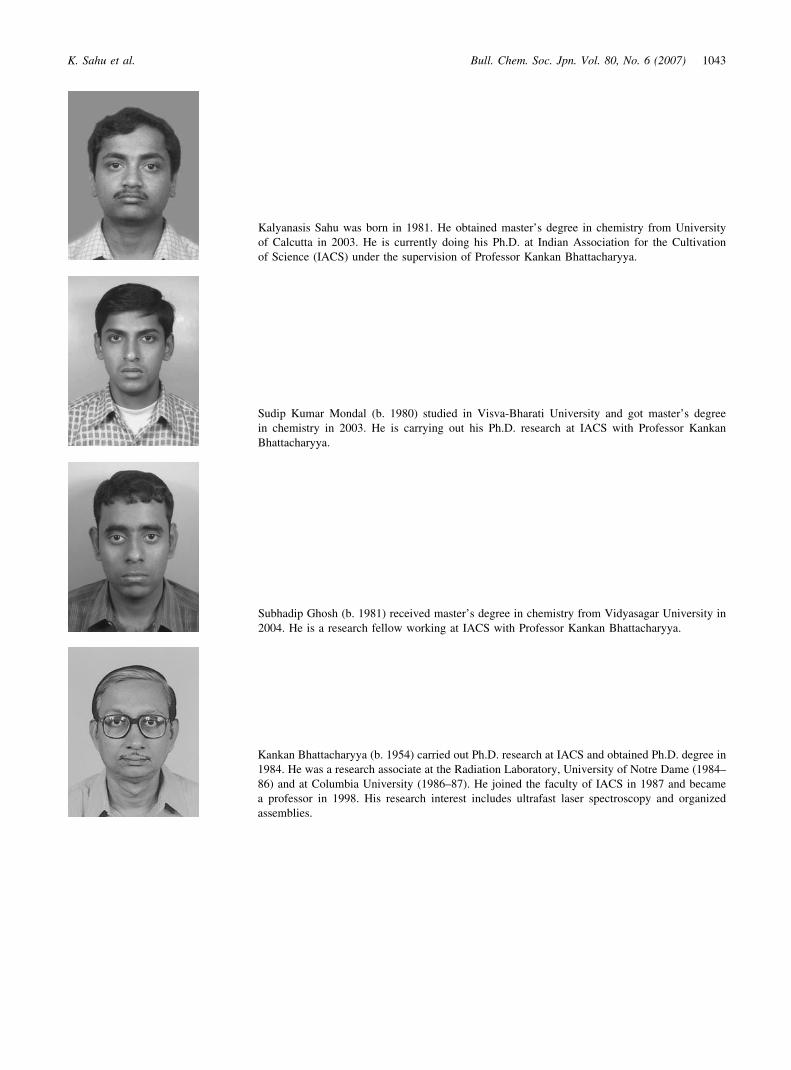
Kalyanasis Sahu was born in 1981. He obtained master’s degree in chemistry from Universityof Calcutta in 2003. He is currently doing his Ph.D. at Indian Association for the Cultivationof Science (IACS) under the supervision of Professor Kankan Bhattacharyya.
Sudip Kumar Mondal (b. 1980) studied in Visva-Bharati University and got master’s degreein chemistry in 2003. He is carrying out his Ph.D. research at IACS with Professor KankanBhattacharyya.
Subhadip Ghosh (b. 1981) received master’s degree in chemistry from Vidyasagar University in2004. He is a research fellow working at IACS with Professor Kankan Bhattacharyya.
Kankan Bhattacharyya (b. 1954) carried out Ph.D. research at IACS and obtained Ph.D. degree in1984. He was a research associate at the Radiation Laboratory, University of Notre Dame (1984–86) and at Columbia University (1986–87). He joined the faculty of IACS in 1987 and becamea professor in 1998. His research interest includes ultrafast laser spectroscopy and organizedassemblies.
K. Sahu et al. Bull. Chem. Soc. Jpn. Vol. 80, No. 6 (2007) 1043
Copyright © 2022 FDOKUMEN