Superconductivity near phase separation in models of correlated electrons
Ultrafast chemical interface scattering as an additional decay channelfor nascent nonthermal electrons in small metal nanoparticles
Christophe Bauer,a) Jean-Pierre Abid, David Fermin, and Hubert H. GiraultLaboratoire d’Electrochimie Physique et Analytique, Institut de Chimie Mole´culaire et Biologique,Facultedes Sciences de Base, Ecole Polytechnique Fe´derale de Lausanne, Switzerland
~Received 12 November 2003; accepted 24 February 2004!
The use of 4.2 nm gold nanoparticles wrapped in an adsorbates shell and embedded in a TiO2 metaloxide matrix gives the opportunity to investigate ultrafast electron–electron scattering dynamics incombination with electronic surface phenomena via the surface plasmon lifetimes. These goldnanoparticles~NPs! exhibit a large nonclassical broadening of the surface plasmon band, which isattributed to a chemical interface damping. The acceleration of the loss of surface plasmon phasecoherence indicates that the energy and the momentum of the collective electrons can be dissipatedinto electronic affinity levels of adsorbates. As a result of the preparation process, gold NPs arewrapped in a shell of sulfate compounds that gives rise to a large density of interfacial moleculesconfined between Au and TiO2 , as revealed by Fourier-transform–infrared spectroscopy. A detailedanalysis of the transient absorption spectra obtained by broadband femtosecond transient absorptionspectroscopy allows separating electron–electron and electron–phonon interaction. Internalthermalization times~electron–electron scattering! are determined by probing the decay of nascentnonthermal electrons~NNEs! and the build-up of the Fermi–Dirac electron distribution, giving timeconstants of 540 to 760 fs at 0.42 and 0.34 eV from the Fermi level, respectively. Comparison withliterature data reveals that lifetimes of NNEs measured for these small gold NPs are more than fourtimes longer than for silver NPs with similar sizes. The surprisingly long internal thermalizationtime is attributed to an additional decay mechanism~besides the classicale–e scattering! for theenergy loss of NNEs, identified as theultrafast chemical interface scatteringprocess. NNEsexperience an inelastic resonant scattering process into unoccupied electronic states of adsorbates,that directly act as an efficient heat bath, via the excitation of molecular vibrational modes. Thetwo-temperature model is no longer valid for this system because of~i! the temporal overlapbetween the internal and external thermalization process is very important;~ii ! a part of the photonicenergy is directly transferred toward the adsorbates~not among ‘‘cold’’ conduction band electrons!.These findings have important consequence for femtochemistry on metal surfaces since they showthat reactions can be initiated by nascent nonthermal electrons~as photoexcited, out of a Fermi–Dirac distribution! besides of the hot electron gas. ©2004 American Institute of Physics.@DOI: 10.1063/1.1710856#
I. INTRODUCTION
The investigation of the interaction of femtosecond laserpulses with metal nanoparticles~NPs! is a growing field dueto the unique possibility of creating a far from equilibriumsituation in systems that can exhibit unexpectedproperties.1–4 Indeed, metal NPs are fascinating materialsdue to their particular electronic, physical and chemical char-acteristics, which are strongly dependent on size.5 The un-derstanding of the dynamics of nonequilibrium electrons incorrelation with surface phenomena is important since non-equilibrium hot electrons drive the most basic reactions suchas desorption, dissociation6,7 or motion of molecules8 on sur-faces. Therefore, interactions of nonequilibrium hot electronwith interfaces control fundamental aspects of surface chem-istry and electrochemical processes.9 Since small NPs showvery high surface-to-volume ratios, they are excellent candi-
dates for the study of ultrafast electronic surface or interfacephenomena. Furthermore, the knowledge of the impact ofrestricted environment or confinement on ultrafast electronicproperties of metal nanoparticles is of fundamental impor-tance for the development of nanoscale devices via the tai-loring of the properties as a function of size.
Information on the initial stage of ultrafast electron dy-namics can be found for clusters of a few atoms.10–12Due tothe lack of information on nonthermal electron dynamics insmall metal NPs (;5 nm) and in order to improve ourknowledge about the role of the interfaces on nonthermalelectron dynamics, it is proposed here to make use of 4.2 nmgold NPs~with a very high surface to volume ratio! embed-ded in a TiO2 matrix. Upon the absorption of femtosecondpulses by a metal, bulk phenomena such as hot electrontransport need to be taken into account while surface effectscan be neglected because of the very low surface-to-volumeratio. On the opposite, electron transport phenomena arenonexistent for small NPs but size and surface effects be-
a!Author to whom correspondence should be addressed. Electronic mail:[email protected]
JOURNAL OF CHEMICAL PHYSICS VOLUME 120, NUMBER 19 15 MAY 2004
93020021-9606/2004/120(19)/9302/14/$22.00 © 2004 American Institute of Physics
Downloaded 18 May 2004 to 128.178.36.23. Redistribution subject to AIP license or copyright, see http://jcp.aip.org/jcp/copyright.jsp
come predominant. Two main parameters are responsible forthe interesting properties of NPs:~i! the electron quantumconfinement effects,~ii ! the surface or interface effects.13
The latter factor may dominate the size effect and govern theemergence of novel behaviors for nascent nonthermal elec-trons when the surface is in close contact with the embed-ding matrix or is modified by adsorbed molecules. The sur-face atom to bulk atom ratio is very high for small NPs.Typically, for 4 nm gold NPs about 35% of all the atoms aresurface atoms.
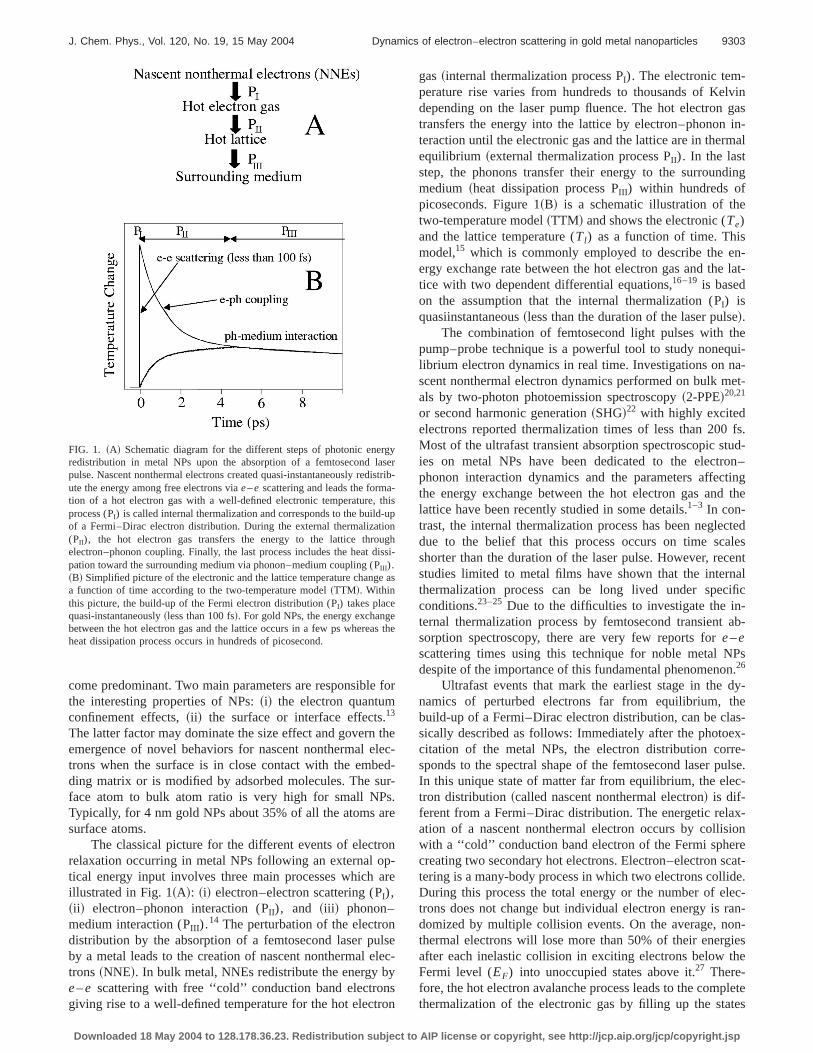
The classical picture for the different events of electronrelaxation occurring in metal NPs following an external op-tical energy input involves three main processes which areillustrated in Fig. 1~A!: ~i! electron–electron scattering (PI),~ii ! electron–phonon interaction (PII), and ~iii ! phonon–medium interaction (PIII ).
14 The perturbation of the electrondistribution by the absorption of a femtosecond laser pulseby a metal leads to the creation of nascent nonthermal elec-trons~NNE!. In bulk metal, NNEs redistribute the energy bye–e scattering with free ‘‘cold’’ conduction band electronsgiving rise to a well-defined temperature for the hot electron
gas~internal thermalization process PI). The electronic tem-perature rise varies from hundreds to thousands of Kelvindepending on the laser pump fluence. The hot electron gastransfers the energy into the lattice by electron–phonon in-teraction until the electronic gas and the lattice are in thermalequilibrium ~external thermalization process PII). In the laststep, the phonons transfer their energy to the surroundingmedium ~heat dissipation process PIII ) within hundreds ofpicoseconds. Figure 1~B! is a schematic illustration of thetwo-temperature model~TTM! and shows the electronic (Te)and the lattice temperature (Tl) as a function of time. Thismodel,15 which is commonly employed to describe the en-ergy exchange rate between the hot electron gas and the lat-tice with two dependent differential equations,16–19 is basedon the assumption that the internal thermalization (PI) isquasiinstantaneous~less than the duration of the laser pulse!.
The combination of femtosecond light pulses with thepump–probe technique is a powerful tool to study nonequi-librium electron dynamics in real time. Investigations on na-scent nonthermal electron dynamics performed on bulk met-als by two-photon photoemission spectroscopy~2-PPE!20,21
or second harmonic generation~SHG!22 with highly excitedelectrons reported thermalization times of less than 200 fs.Most of the ultrafast transient absorption spectroscopic stud-ies on metal NPs have been dedicated to the electron–phonon interaction dynamics and the parameters affectingthe energy exchange between the hot electron gas and thelattice have been recently studied in some details.1–3 In con-trast, the internal thermalization process has been neglecteddue to the belief that this process occurs on time scalesshorter than the duration of the laser pulse. However, recentstudies limited to metal films have shown that the internalthermalization process can be long lived under specificconditions.23–25 Due to the difficulties to investigate the in-ternal thermalization process by femtosecond transient ab-sorption spectroscopy, there are very few reports fore–escattering times using this technique for noble metal NPsdespite of the importance of this fundamental phenomenon.26
Ultrafast events that mark the earliest stage in the dy-namics of perturbed electrons far from equilibrium, thebuild-up of a Fermi–Dirac electron distribution, can be clas-sically described as follows: Immediately after the photoex-citation of the metal NPs, the electron distribution corre-sponds to the spectral shape of the femtosecond laser pulse.In this unique state of matter far from equilibrium, the elec-tron distribution~called nascent nonthermal electron! is dif-ferent from a Fermi–Dirac distribution. The energetic relax-ation of a nascent nonthermal electron occurs by collisionwith a ‘‘cold’’ conduction band electron of the Fermi spherecreating two secondary hot electrons. Electron–electron scat-tering is a many-body process in which two electrons collide.During this process the total energy or the number of elec-trons does not change but individual electron energy is ran-domized by multiple collision events. On the average, non-thermal electrons will lose more than 50% of their energiesafter each inelastic collision in exciting electrons below theFermi level (EF) into unoccupied states above it.27 There-fore, the hot electron avalanche process leads to the completethermalization of the electronic gas by filling up the states
FIG. 1. ~A! Schematic diagram for the different steps of photonic energyredistribution in metal NPs upon the absorption of a femtosecond laserpulse. Nascent nonthermal electrons created quasi-instantaneously redistrib-ute the energy among free electrons viae–e scattering and leads the forma-tion of a hot electron gas with a well-defined electronic temperature, thisprocess (PI) is called internal thermalization and corresponds to the build-upof a Fermi–Dirac electron distribution. During the external thermalization(PII), the hot electron gas transfers the energy to the lattice throughelectron–phonon coupling. Finally, the last process includes the heat dissi-pation toward the surrounding medium via phonon–medium coupling (PIII ).~B! Simplified picture of the electronic and the lattice temperature change asa function of time according to the two-temperature model~TTM!. Withinthis picture, the build-up of the Fermi electron distribution (PI) takes placequasi-instantaneously~less than 100 fs!. For gold NPs, the energy exchangebetween the hot electron gas and the lattice occurs in a few ps whereas theheat dissipation process occurs in hundreds of picosecond.
9303J. Chem. Phys., Vol. 120, No. 19, 15 May 2004 Dynamics of electron–electron scattering in gold metal nanoparticles
Downloaded 18 May 2004 to 128.178.36.23. Redistribution subject to AIP license or copyright, see http://jcp.aip.org/jcp/copyright.jsp
close the Fermi level. The whole process typically representsthe evolution from an individual to a collective behavior. Themain message of this paper is to propose, in addition to theclassical mechanism (e–e scattering!, which takes place inthe bulk, an alternative channel for the energy loss of NNEs.
The originality of the present work lies on five points:~i!the study has been focused on the initial stage of nonequilib-rium hot electron thermalization,~ii ! the femtosecond tran-sient absorption measurements have been performed withinthe weak perturbation regime,~iii ! the investigation has beenundertaken with gold NPs smaller than 5 nm in diameterembedded in a dielectric matrix,~iv! the spectroscopic ap-proach for the determination of the internal thermalizationtimes is different to other studies,~v! an additional mecha-nism for the energy loss of nonthermal electrons is proposed.The high stability and the sensitivity of the femtosecondsetup makes possible to perform measurements under re-stricted conditions~i.e., low pump fluence and small elec-tronic temperature rise!.
The paper is organized as follows: First, steady-statespectroscopy gives information about the influence of sur-face effects with respect to size effects on collective elec-trons behavior in gold NPs, an analysis of the differentialtransient absorption spectra obtained by broadband ultrafastspectroscopy allows to separate the fundamental processessuch as the internal and external thermalization~spectral re-sponses from nascent electrons and hot Fermi-Dirac electrondistribution have been identified!. As a next step, singlewavelength pump–probe spectroscopy is employed to deter-mine the rate of internal thermalization by interrogating ei-ther the decay of NNEs or the build-up of the hot Fermi–Dirac electron distribution. Then, the implication of theresults is briefly discussed based on the TTM and thee–escattering rates obtained here are compared to literature data.Finally, an additional channel~ultrafast chemical interfacescattering! for nonthermal electrons decay, which consists ofan inelastic resonant scattering process into empty electronicstates of adsorbates is proposed.
II. EXPERIMENTAL SECTION
Samples preparation: The three dimensions Au/TiO2nanoarchitectures composite were prepared by wet-graftingof initial Au NPs of 1.7 nm in diameter derivatized withmercapto succinic acid~MSA! to a TiO2 mesoporous thinfilm. The elementary TiO2 particle size is 15 nm and thethickness of the mesopourous films measured by profilom-etry is 5 mm. Before the insertion of gold NPs, the TiO2
nanocrystalline films exhibit a porosity of 60% with an av-erage size of 20 nm for the pores. Aqueous solution of 1.7nm gold NPs were synthesized by NaBH4 reduction ofAuCl4
2 in a mixture of water and methanol. The synthesisincluding five consecutive washing and centrifugation stepswith pure methanol. This sequence ensures the removal ofinorganic ions. The solvent excess was evaporated at tem-peratures below 40 °C and pressure under 531023 Torr for12 h. The core size of the resulting particles exhibited anaverage diameter of (1.760.4) nm. The final gold NPs usedto perform laser spectroscopy measurements was obtained by
heat treatment at 723 K for 30 minutes generating gold NPsof (4.260.5) nm in diameter. The size of gold NPs has beenrevealed by transmission electronic microscopy using a Phil-ips CM20. The gold loading in the TiO2 films is around20% wt. as revealed by x-ray photoelectron spectroscopy~XPS!. The film has a porosity of 60% which leads to anestimation of 231014 nanoparticles/cm2 for TiO2 . The cal-culations for Au NPs leads to a concentration of about 431014 nanoparticles/cm2 for gold.
Steady-state spectroscopy: UV/visible spectra were re-corded on an HP-8353~Hewlett-Packard! spectrophotometer.Fourier-transform–infrared~FT-IR! spectra were obtainedusing a Perkin-Elmer 16 PC spectrophotometer with 4 cm21
resolution and were taken with the ‘‘Golden Gate’’ diamondattenuated total reflection. FT–IR spectra were recorded overan average of 200 scans.
Femtosecond laser setup: Femtosecond transient absorp-tion setup features a compact CPA-2001 Ti:Sa-amplifiedfemtosecond laser~Clark-MXR! with a repetition rate of 1kHz, a fundamental wavelength at 775 nm, a pulse width of120 fs and an energy of 1 mJ per pulse. The output beam wassplit into three parts for pumping two double-stage noncol-linear optical parametric amplifiers~NOPA! and to produce awhite light continuum in a 2 mmthick sapphire plate. Theoutput pulses of the NOPAs were compressed in SF10-glassprism pair compressors to obtain pulses of 50 fs. Pump andprobe beams were directed parallel to each other toward a60° off-axis parabolic mirror that focused them into thesample. The resulting spot area for the pump pulse is 1.2531024 cm2. The pump–probe cross-correlation measuredby Kerr gating in a 0.3 mm thick PBH21 glass window~Ohara, Japan! at the sample position was typically 100–120fs.
For the monochromatic probing, a DET-110 silicon di-ode~Thorlabs! was placed directly after the samples to mea-sure the transmitted light intensity. The signal from the de-tector was connected to a SR-830 lock-in amplifier~StanfordResearch Instruments! tuned at 220 Hz by a chopper modu-lating the pump beam. Time delays between pump and probepulses were controlled with a linear translation stage~PhysicInstrument M511!.
Transient absorption spectra were obtained using a whitelight continuum produced in a 2 mm thick sapphire plate.The white beam was collimated using a 90° off-axis para-bolic mirror and steered to the sample using only reflectiveoptics. A smooth monotonic spectral distribution between470 and 680 nm was obtained by controlling the pump en-ergy with an iris and a variable density filter. A broadbandmembrane beam splitter was placed before the sample tosplit the white light beam into signal and reference arms.Both were collected by fiber bundles and sent into a Triax320 spectrograph~Jobin–Yvon!. Reference and signal beamswere separated vertically during their travel in the spec-trograph and detected individually by diode array detector~AST116 double Princeton Instrument!. Both 1024 elementsdetector arrays allowed for recording more than 200 nm widespectra averaging at a time. Chirped pulse duration was 210fs as measured by Kerr gating in PBH21 glass between 490~2.53 eV! and 700 nm~1.77 eV!. The group velocity disper-
9304 J. Chem. Phys., Vol. 120, No. 19, 15 May 2004 Bauer et al.
Downloaded 18 May 2004 to 128.178.36.23. Redistribution subject to AIP license or copyright, see http://jcp.aip.org/jcp/copyright.jsp
sion of the white light continuum was compensated in thetransient absorption spectra. The absorbance change was cal-culated using the ratio between data obtained with and with-out the pump pulses reaching the samples and corrected forfluctuations in the white light continuum intensity using thereference beam spectra. Estimation of the initial electronictemperature change (DTe) provides values in the range of25–200 K28 depending on the pump fluence, indicating thatthe measurements were performed in the weak perturbationregime.
III. RESULTS
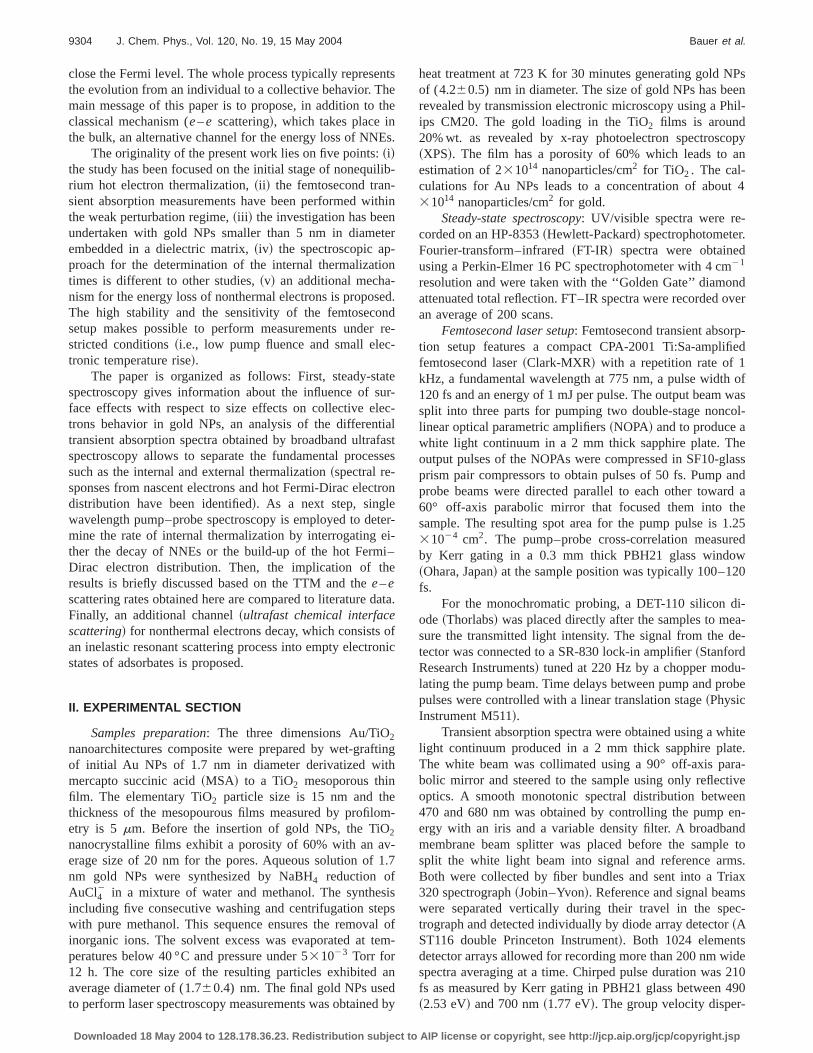
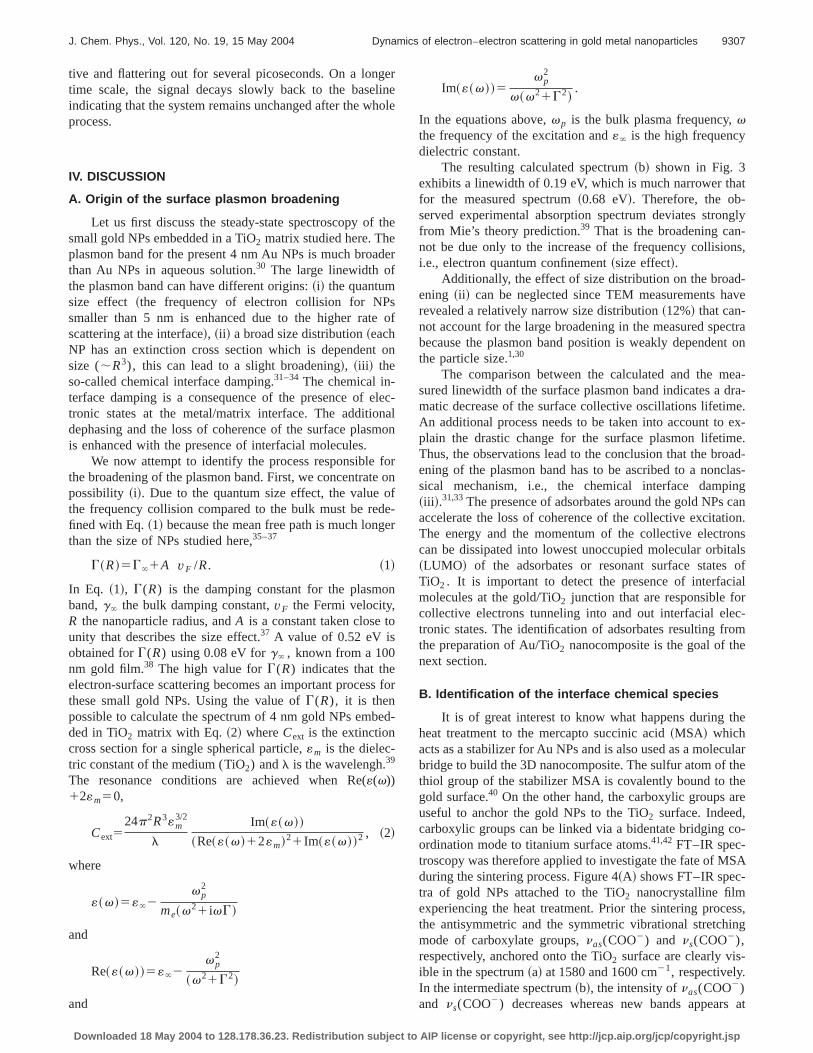
A TEM micrograph shows that gold NPs are randomlydistributed in the TiO2 matrix as illustrated in Fig. 2. Thegray shapes are TiO2 NPs whereas the darker disks are AuNPs. The average diameter is 4.2 nm with a standard devia-tion of 12%. Calculations suggest the existence of about twoAu NPs on the average for one TiO2 nanoparticle. The aver-age distance between neighboring Au NPs is estimated to bearound 10 nm. Figure 3 shows the electronic absorptionspectrum of gold NPs embedded in TiO2 nanocrystalline thinfilms. The measured absorption spectrum~a! contains ab-sorption arising mainly from the band gap of TiO2 ~3.1 eV!
and the electronic interband transitions in gold NPs~2.3 eV!below 390 and 540 nm, respectively. The absorption maxi-mum at 526 nm~2.36 eV! is called the plasmon band andcorresponds to the collective oscillations of conduction bandelectrons across the NPs. The resonance plasmon band issituated very close to the interband transition from the filledd-band to the unoccupied states in the conduction band(;2.3 eV), this proximity leads to a large absorption to thehigh energy side band. In the transient absorption experi-ments, the proximity of the Fermi level and the plasmonband is an advantage for the present study due to the en-hancement of the gold NPs response to a femtosecond laserpulse. The spectrum~b! is obtained from calculations andwill be compared to the measured absorption spectrum in theDiscussion section. In Fig. 4 are shown the FT–IR spectrarecording during the heat treatment leading to the final sizeof the gold NPs. These spectra highlight the chemical trans-formations in the Au/TiO2 nanocomposite during the sinter-ing process through the disappearance and the appearance ofFT–IR bands from spectra~a! to ~c!. Figure 5 shows thedifferential transient absorption spectra recorded at differenttime delays upon a femtosecond optical pulse excitation at480 nm~2.58 eV! between2250 fs and 6.5 ps after the laserpulse with steps of 500 fs. A strong bleach around 540 nm~2.30 eV! and a very weak positive absorption for wave-lengths longer than 630 nm~1.97 eV! is observed for alltransient spectra. The bleach is due to the perturbation of theelectron distribution leading to a broadening of the surfaceplasmon band with a flatter minimum for spectra recorded
FIG. 2. TEM micrograph of the gold NPs embedded in TiO2 matrix. Thescale bar represents 20 nm.
FIG. 3. ~a! Experimental and~b! calculated with Eq.~2! UV/visible absorp-tion spectra of the gold NPs embedded in TiO2 matrix.
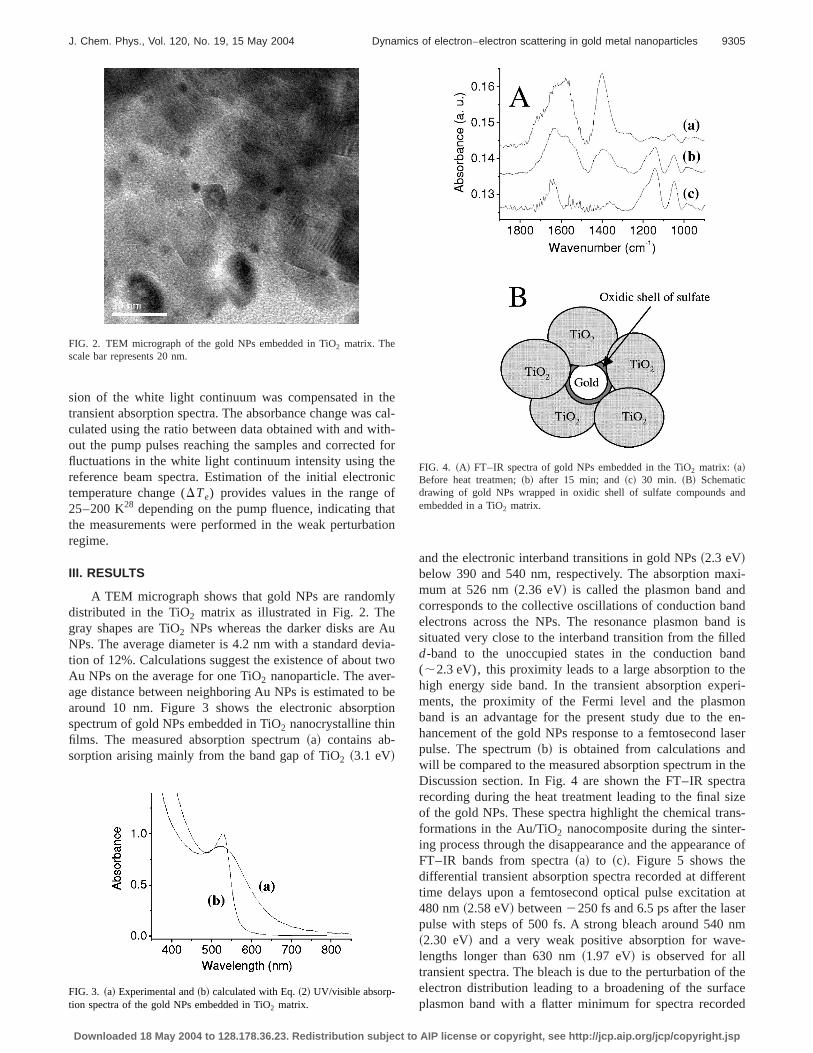
FIG. 4. ~A! FT–IR spectra of gold NPs embedded in the TiO2 matrix: ~a!Before heat treatmen;~b! after 15 min; and~c! 30 min. ~B! Schematicdrawing of gold NPs wrapped in oxidic shell of sulfate compounds andembedded in a TiO2 matrix.
9305J. Chem. Phys., Vol. 120, No. 19, 15 May 2004 Dynamics of electron–electron scattering in gold metal nanoparticles
Downloaded 18 May 2004 to 128.178.36.23. Redistribution subject to AIP license or copyright, see http://jcp.aip.org/jcp/copyright.jsp

during the early stage. Transient spectra exhibit a positivepart for wavelengths longer than 630 nm~1.97 eV! thatgrowths with longer time delays. An interesting feature is theevolution of the spectra profile with delay time, which leadsto the absence of an isobestic point before 3 ps. Indeed, atime dependent shift of the crosspoint of the signal with thebaseline is observed. The differential absorption spectra arefully developed only after hundreds of femtosecond after thelaser pulse. The arrows in Fig. 5 indicate the probe wave-lengths used in the two-color pump–probe experiments toseparate and extract the time constants for the internal andexternal thermalization processes. The evolution of the spec-tra profile with delay time of the transient absorption spectrapredict complex kinetics due to the presence of a highly non-equilibrium process. Figure 6 illustrates the transient absorp-tion changes after pumping at 500 nm~2.48 eV! and probingat 530 nm~2.30 eV! with high and low pump fluences. Thenormalized signals include two steps, a fast decay which isattributed to the external thermalization~electron–phononinteraction! and a slow decay corresponding to the heat dis-sipation process toward the surrounding medium~phonon–medium interaction!. The trace profiles are not similar for thedifferent pump fluences. The recovery of the bleach is de-layed with respect to the laser pulse for the trace recorded atlow pump fluence and the signal is almost flat for severalhundreds of femtosecond. Figure 7 shows the transient ab-sorption after pumping at 500 nm~2.48 eV! and probing at
625 nm ~1.98 eV!. In this spectral region, the empty elec-tronic states are effectively probed29 and the hot electron gasformation is interrogated in real time. As observed in thetransient spectra, NNEs give no response at 625 nm. At theopposite, the hot electron gas exhibits an absorption forwavelengths longer than 590 nm for the present system.Therefore, the rise of the signal reflects the formation of thehot electron gas~build-up of the Fermi–Dirac distribution!.An important time delay between the laser pulse and themaximum of the signal is observed in accordance with thedifferential absorption transient spectra. Indeed, as seen inFig. 5, the transient absorption for wavelengths longer than600 nm ~2.06 eV! does not appear within the instrumentresponse but takes some time to develop. On a longer timescale, the signal decays back to the baseline. The evolutionof the transient absorption data recorded at 600 nm~2.06 eV!after pumping at 525 nm~2.30 eV!, as displayed in Fig. 8,exhibits a rather different behavior with respect to the previ-ous probe wavelengths. By comparison with the data ob-tained at 530 nm with the low pump fluence~Fig. 6!, thebleach recovery starts immediately at the end of the laserpulse. Furthermore, in contrast to signal recorded at 625 nm~see Fig. 7!, the bleach occurs within the instrument responsetime. This behavior suggests that the signal is linked to elec-tron states that exist quasi-instantaneously upon the absorp-tion of the laser pulse. After 1.3 ps, the signal becomes posi-
FIG. 5. Femtosecond transient absorption spectra after pumping at 480 nmusing the broadband light continuum recorded with a delay time step of 500fs between the pump and the probe pulse from2250 fs to 6.5 ps.
FIG. 6. Normalized transient absorption data after pumping at 480 nm andprobing at 530 nm with a pump fluence of 400 nJ/pulse~s! and 70 nJ/pulse~d!.
FIG. 7. Transient absorption data after pumping at 500 nm and probing at625 nm for pump fluence of 500 nJ/pulse for gold NPs. The solid line is thefit of the experimental data according to Eq.~3!. The dashed line representsthe pump–probe cross correlation of the instrument.
FIG. 8. Transient absorption data after pumping at 525 nm and probing at600 nm for pump intensity at 675 nJ/pulse. The solid line is a fit of theexperimental data according to Eq.~4!. The inset shows the pump fluencedependence with the same time scale window for 250, 410, 675, and 940nJ/pulse.
9306 J. Chem. Phys., Vol. 120, No. 19, 15 May 2004 Bauer et al.
Downloaded 18 May 2004 to 128.178.36.23. Redistribution subject to AIP license or copyright, see http://jcp.aip.org/jcp/copyright.jsp
tive and flattering out for several picoseconds. On a longertime scale, the signal decays slowly back to the baselineindicating that the system remains unchanged after the wholeprocess.
IV. DISCUSSION
A. Origin of the surface plasmon broadening
Let us first discuss the steady-state spectroscopy of thesmall gold NPs embedded in a TiO2 matrix studied here. Theplasmon band for the present 4 nm Au NPs is much broaderthan Au NPs in aqueous solution.30 The large linewidth ofthe plasmon band can have different origins:~i! the quantumsize effect ~the frequency of electron collision for NPssmaller than 5 nm is enhanced due to the higher rate ofscattering at the interface!, ~ii ! a broad size distribution~eachNP has an extinction cross section which is dependent onsize (;R3), this can lead to a slight broadening!, ~iii ! theso-called chemical interface damping.31–34 The chemical in-terface damping is a consequence of the presence of elec-tronic states at the metal/matrix interface. The additionaldephasing and the loss of coherence of the surface plasmonis enhanced with the presence of interfacial molecules.
We now attempt to identify the process responsible forthe broadening of the plasmon band. First, we concentrate onpossibility ~i!. Due to the quantum size effect, the value ofthe frequency collision compared to the bulk must be rede-fined with Eq.~1! because the mean free path is much longerthan the size of NPs studied here,35–37
G~R!5G`1A vF /R. ~1!
In Eq. ~1!, G(R) is the damping constant for the plasmonband,g` the bulk damping constant,vF the Fermi velocity,R the nanoparticle radius, andA is a constant taken close tounity that describes the size effect.37 A value of 0.52 eV isobtained forG(R) using 0.08 eV forg` , known from a 100nm gold film.38 The high value forG(R) indicates that theelectron-surface scattering becomes an important process forthese small gold NPs. Using the value ofG(R), it is thenpossible to calculate the spectrum of 4 nm gold NPs embed-ded in TiO2 matrix with Eq.~2! whereCext is the extinctioncross section for a single spherical particle,«m is the dielec-tric constant of the medium (TiO2) andl is the wavelengh.39
The resonance conditions are achieved when Re(«(v))12«m50,
Cext524p2R3«m
3/2
l
Im~«~v!!
~Re~«~v!12«m!21Im~«~v!!2 , ~2!
where
«~v!5«`2vp
2
me~v21 ivG!
and
Re~«~v!!5«`2vp
2
~v21G2!
and
Im~«~v!!5vp
2
v~v21G2!.
In the equations above,vp is the bulk plasma frequency,vthe frequency of the excitation and«` is the high frequencydielectric constant.
The resulting calculated spectrum~b! shown in Fig. 3exhibits a linewidth of 0.19 eV, which is much narrower thatfor the measured spectrum~0.68 eV!. Therefore, the ob-served experimental absorption spectrum deviates stronglyfrom Mie’s theory prediction.39 That is the broadening can-not be due only to the increase of the frequency collisions,i.e., electron quantum confinement~size effect!.
Additionally, the effect of size distribution on the broad-ening ~ii ! can be neglected since TEM measurements haverevealed a relatively narrow size distribution~12%! that can-not account for the large broadening in the measured spectrabecause the plasmon band position is weakly dependent onthe particle size.1,30
The comparison between the calculated and the mea-sured linewidth of the surface plasmon band indicates a dra-matic decrease of the surface collective oscillations lifetime.An additional process needs to be taken into account to ex-plain the drastic change for the surface plasmon lifetime.Thus, the observations lead to the conclusion that the broad-ening of the plasmon band has to be ascribed to a nonclas-sical mechanism, i.e., the chemical interface damping~iii !.31,33The presence of adsorbates around the gold NPs canaccelerate the loss of coherence of the collective excitation.The energy and the momentum of the collective electronscan be dissipated into lowest unoccupied molecular orbitals~LUMO! of the adsorbates or resonant surface states ofTiO2 . It is important to detect the presence of interfacialmolecules at the gold/TiO2 junction that are responsible forcollective electrons tunneling into and out interfacial elec-tronic states. The identification of adsorbates resulting fromthe preparation of Au/TiO2 nanocomposite is the goal of thenext section.
B. Identification of the interface chemical species
It is of great interest to know what happens during theheat treatment to the mercapto succinic acid~MSA! whichacts as a stabilizer for Au NPs and is also used as a molecularbridge to build the 3D nanocomposite. The sulfur atom of thethiol group of the stabilizer MSA is covalently bound to thegold surface.40 On the other hand, the carboxylic groups areuseful to anchor the gold NPs to the TiO2 surface. Indeed,carboxylic groups can be linked via a bidentate bridging co-ordination mode to titanium surface atoms.41,42 FT–IR spec-troscopy was therefore applied to investigate the fate of MSAduring the sintering process. Figure 4~A! shows FT–IR spec-tra of gold NPs attached to the TiO2 nanocrystalline filmexperiencing the heat treatment. Prior the sintering process,the antisymmetric and the symmetric vibrational stretchingmode of carboxylate groups,nas(COO2) and ns(COO2),respectively, anchored onto the TiO2 surface are clearly vis-ible in the spectrum~a! at 1580 and 1600 cm21, respectively.In the intermediate spectrum~b!, the intensity ofnas(COO2)and ns(COO2) decreases whereas new bands appears at
9307J. Chem. Phys., Vol. 120, No. 19, 15 May 2004 Dynamics of electron–electron scattering in gold metal nanoparticles
Downloaded 18 May 2004 to 128.178.36.23. Redistribution subject to AIP license or copyright, see http://jcp.aip.org/jcp/copyright.jsp
1040 and 1180 cm21. The heat treatment leads to the vapor-ization of the gold NPs stabilizer43,44 that are not linked toTiO2 whereas the molecular bridge MSA will be oxidizedwith the subsequent creation of oxygenated compounds con-fined between the gold and the TiO2 NPs. In the final spec-trum, the bands attributed tonas(COO2) and ns(COO2)have completely disappeared whereas the intensity of thebands at 1040 and 1180 cm21 have increased with time. Theinterfacial chemical species confined between gold and TiO2
are identified to be oxygenated compounds, i.e., sulfate andcarbonates. Indeed, FT–IR bands at 1040 and 1180 cm21 arecharacteristic of sulfate species adsorbed on surfaces.45 Thebroadband at 1640 cm21 is due the vibrational bending modeof adsorbed molecular water whereas the weak band centeredat 1350 cm21 is likely linked to adsorbed carbonates.46–48
X-ray photoemission spectroscopy also revealed a large den-sity of oxygenated sulfur compounds. Thus, gold NPs arewrapped in an oxidic shell of sulfate~carbonates are alsopresent but in a less extent!. Figure 4~B! illustrates the struc-ture of the 3D Au/adsorbates/TiO2 nanocomposite. The de-tection of adsorbates on Au NPs surface gives further evi-dence for the nonclassical broadening of the plasmon band.The collective electrons can tunnel back and forth into elec-tronic states of interfacial molecules. The efficiency of thischarge transfer process is controlled by the overlap of themetal and adsorbates wave functions. The observation thatthese gold NPs exhibit a high density of adsorbates may leadto the emergence of novel channels for nonthermal electronrelaxation dynamics.
C. Identification and separation of the differentelectron dynamics processes
The femtosecond data obtained for the gold NPs embed-ded in a dielectric matrix strongly differs from other ultrafaststudies on metal NPs on several aspects:~i! the temporalevolution of the differential absorption spectra profile~induc-ing a change of sign for certain probe wavelengths!, ~ii ! thedelayed recovery when probing at the surface plasmon maxi-mum, ~iii ! the slow rise when probing the empty electronicstates. In the following section, we will show that the originof these observations are linked to the earliest stage of non-equilibrium nonthermal electrons upon the absorption of afemtosecond pulse, i.e., the build-up of the Fermi–Diracelectron distribution~internal thermalization,e–e scatter-ing!.
As seen in Fig. 5, the maximum spectral width is ob-tained at the earliest stage following the electron perturba-tion. At this point, a wide range of energies can be ex-changed between the electrons, indicating the presence of anuncorrelated state in a situation far from equilibrium due tothe broad occupancy changes in the non-Fermi–Dirac elec-tron distribution. In several hundreds of femtosecond, thebroad feature considerably narrows indicating the transitionfrom an individual to a collective behavior. As discussedbelow, this shift is attributed to the build-up of the hot elec-tron gas during the internal thermalization process. It is ofinterest to compare the measured differential absorptionspectra presented here and the numerical simulations
available in the literature that demonstrated the spectraldistinction between nonthermalized and thermalizedelectrons.24,49,50It appears from these calculations that non-thermal electrons exhibit spectra with a weak and broadbleach and no positive wings at the lower and higher energyside of the plasmon band. In contrast, the computed transientabsorption spectra for the internally thermalized hot electrongas show a narrower bleach with a much stronger amplitudecompared to the nonthermal electrons and a positive part onboth sides of the bleach~20% to 30% of the bleach ampli-tude!. Upon comparison of the spectra recorded at 250 fs andtime longer than 5 ps, a time dependent shift of the cross-point of the signal with the baseline from 630 to 585 nm isclearly observed between these spectra. The shape of mea-sured transient absorption spectra measured at 250 fs and 5ps corresponds very well to simulated spectra for nascentelectrons and the internally thermalized hot electron gas, re-spectively. The broadband white light continuum measure-ments allow to visualize in real time domain the spectralshape evolution of nonthermal electrons to the hot electrongas.
In the following, the separation ofe–e ande– ph inter-action processes is based on the fact that the spectral re-sponses of NNEs and the hot electron gas are clearly differ-ent as demonstrated in the paragraph above. The tracesshown in Fig. 6 obtained by probing very close toEF arevery sensitive to the internally thermalized electrons, there-fore the external thermalization is expected to be the domi-nant process for this probe wavelength. At high pump flu-ence, the recovery can be fitted with a single exponentialfunction and gives a time constant of 3.4660.04 ps for theexternal thermalization. However, at low pump fluence, afaster electron–phonon interaction is observed and the ex-perimental data can no longer be reproduced with a singleexponential function. The deviation from a single-exponential decay, especially at the early stage of the signal,is an indication of the presence of different processes takingplace on similar time scale. This phenomenon is attributed tothe noninstantaneous~longer than the laser pulse duration!establishment of the hot Fermi–Dirac electronic temperatureand has been previously observed with larger gold NPs insolution.49 The deviation is more accentuated with a lowpump fluence because thee–e scattering rate is independenton the pump fluence whereas electron–phonon interactionslows down by increasing the initial electronic temperature.Two possible explanations linked to the internal thermaliza-tion for the delayed recovery may be proposed:~i! simulatedspectra have shown that the cross section for thermalizedelectrons is higher compared to nonthermal electrons at themaximum of the plasmon bleach. These cross section differ-ences may well explain the origin of the very slow recoveryat the early stage due to a mutual compensation of the ab-sorbance changes by the simultaneous recovery of the bleachdue to the decay of nascent electrons and the increase of thebleach amplitude linked to the appearance of thermalizedelectrons.~ii ! Another possibility for the delayed bleach re-covery comes from the observation that the electron–phononinteraction is very slow when the internal thermalization pro-cess is incomplete.24,25,51These authors have shown that the
9308 J. Chem. Phys., Vol. 120, No. 19, 15 May 2004 Bauer et al.
Downloaded 18 May 2004 to 128.178.36.23. Redistribution subject to AIP license or copyright, see http://jcp.aip.org/jcp/copyright.jsp
rate of electron–phonon coupling increases as long as theinternal thermalization is in progress. Indeed, as observed atthe early stage of the recovery in Fig. 6, the electron–phononcoupling rate is very close to zero, increasing to reach aconstant value when the Fermi–Dirac electron distribution isestablished. In summary, these data give strong indication onthe existence of a finite time for the internal thermalizationtime but the difficulty is to extract a time constant because ofthe overlap of the two processes on similar time scale. Fromthis fact, it is proposed to directly interrogate the build-up ofthe Fermi–Dirac electron distribution. The wavelength at625 nm used in the experiment shown in Fig. 7 permits toprobe in real time the formation of the hot electron gas. Todetermine thee–e scattering time, Eq.~3! is used. The de-layed rise time is introduced by the first term (t1), whichdescribes the noninstantaneous build-up of the electronictemperature.
The second term corresponds to the energy exchangebetween the hot electron gas and the lattice and the constantB accounts for the slow decay linked to the heat dissipationfrom gold NPs into the matrix,
S~ t !5A exp@12exp~2t/t1!#exp@2t/t2#1B. ~3!
After deconvolution of the pump–probe cross correlation,the solid line obtained with Eq.~3! reproduces well the ex-perimental data~open circles! giving t15540 fs (630 fs)and t253.6 ps. This signal also contains information aboutthe electron–phonon interaction although they can be sepa-rated with a system response function.
In the next part, it will be shown that further evidencefor a slow internal thermalization can be taken by interrogat-ing the temporal shift and the narrowing of the transientspectra with the probe wavelength at 600 nm as illustrated inFig. 8. This spectral region is expected to give a direct andexclusive access to the internal thermalization time with aminimum contribution of the external thermalization. Thespectral response of NNEs gives a bleach at 600 nm whereashot electron gas shows a transient absorption. During thebleach recovery at 600 nm, the signal is modulated due to thesuperposition of oscillations. The mechanism of generationof these oscillations is beyond the scope of this study andwill be discussed in detail in a separate study. The experi-mental data can be very well fitted in Fig. 8 with the follow-ing expression:
S~ t !5C exp@2t/t1#1D cos@2pnt1w#exp@2t/t3#
1E, ~4!
wheret1 is the bleach decay time constant,n the frequencyof the oscillations,w is the phase andt3 the damping timeconstant,C andD the amplitudes for the exponential decayand the damped cosinus function, respectively and the con-stantE stands for the offset. The excellent fit after convolu-tion of the pump–probe cross correlation of the experimentaldata confirms the existence of a single recovery process re-sulting in following time constants:t15767611 fs, n51.02 THz,t35720655 fs. Therefore, the bleach recoveryrecorded at 600 nm is a direct signature of the depopulationof nonthermal electrons viae–e scattering in accordance
with transient absorption spectra. A great advantage with thisprobe wavelength is the minor contribution of the electron–phonon interaction by probing directly the profile temporalevolution of the differential transient spectra. Another argu-ment toward the observation ofe–e scattering process~in-stead of electron–phonon interaction! is associated to theobserved independence of the decay rate on the pump flu-ence in the range of 210 to 940 nJ/pulse as shown in the insetof Fig. 7. This behavior is a signature of thee–e scatteringprocess as observed for metal films in the weak perturbationregime.52
D. Consequence for the two-temperature model
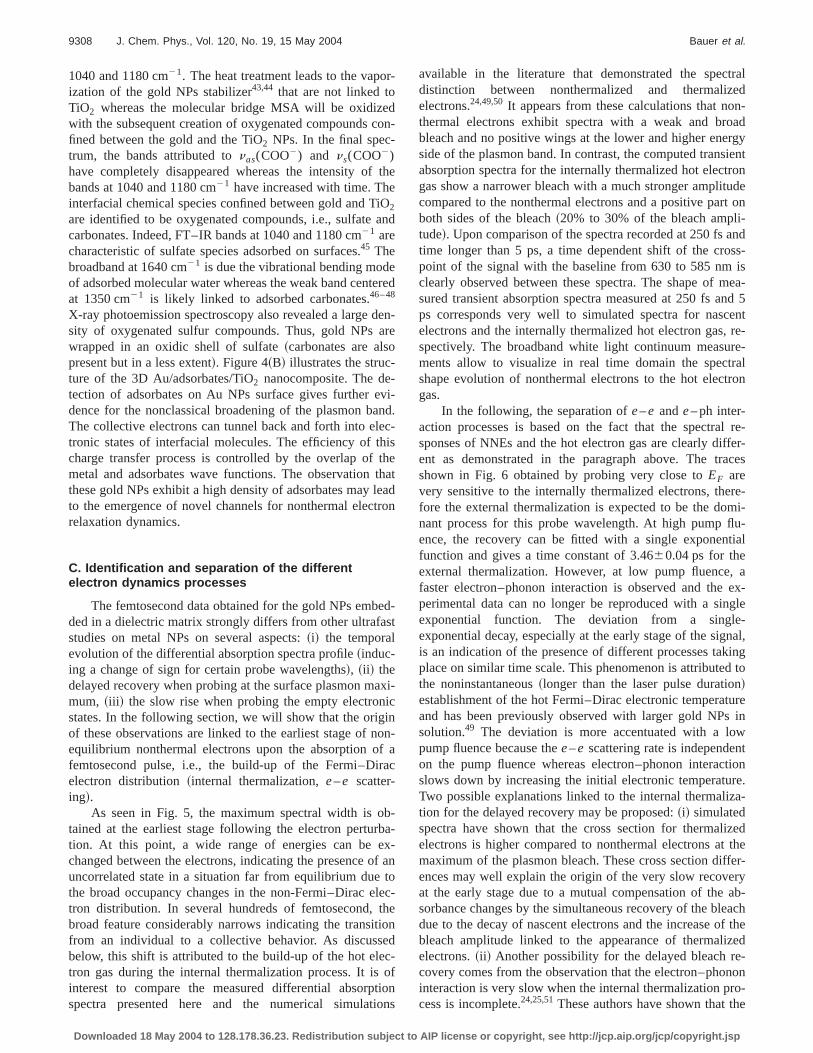
As stated in the Introduction, the TTM is the widelyaccepted model to describe the interaction of femtosecondlaser pulses with metals. The signal recorded at 625 nm givesan overview of the dynamics of energy redistribution uponthe absorption of a laser pulse. Indeed, as observed in thetransient absorption spectra, NNEs give no response at 625nm whereas the hot electron gas exhibits an aborption, asseen in the spectra recorded after 3 ps~when the internalthermalization process is over!. Figure 9 depicts the possibil-ity to follow the evolution of the different processes PI , PII ,PIII in real time with a single wavelength. The rise of thesignal reflects the formation of the hot electron gas, the de-cay illustrates the electron–phonon and the phonon–mediuminteractions. The establishment of the electronic temperature,the electronic energy transfer into the lattice as well as theheat dissipation toward the surrounding medium can be di-rectly visualized. By comparison with the schematic pictureof Fig. 1, it appears clearly that PI has a finite time of hun-dreds of femtosecond. For the system studied here, the two-temperature model illustrated in Fig. 1 appears to be nolonger valid. Indeed, this model is based on the assumptionthat the internal thermalization (e–e scattering, establish-ment of the Fermi electronic distribution! is quasi-instantaneous~within the laser pulse duration!. Internal ther-malization can be as long as 800 fs and therefore can takeplace on the same scale as the electron–phonon interaction.
FIG. 9. Transient absorption data after pumping at 500 nm and probing at625 nm for pump fluence of 500 nJ/pulse for gold NPs. The dashed linerepresents the pump–probe cross correlation of the instrument. The differentprocesses PI , PII , and PIII are depicted in the figure.
9309J. Chem. Phys., Vol. 120, No. 19, 15 May 2004 Dynamics of electron–electron scattering in gold metal nanoparticles
Downloaded 18 May 2004 to 128.178.36.23. Redistribution subject to AIP license or copyright, see http://jcp.aip.org/jcp/copyright.jsp
Thus, for the gold nanoparticles studied here, the TTMbreaks down within the low-perturbation regime (DTe,200 K) where thee–e and electron–phonon interactionshave comparable time constants.
E. Comparison with other studies
In the following, thee–e scattering rates obtained in thiswork will be compared with published data on noble metalfilms and nanoparticles. Investigations by two-photon photo-emission spectroscopy were conducted with highly energeticelectrons~usually between 0.5 to 2 eV aboveEF) and there-fore, very short lifetimes~in accordance with the Fermi liq-uid theory! for NNEs on the order of 200 to 10 fs werereported. At the opposite,e–e scattering rates obtained withfemtosecond transient absorption spectroscopy are extractedvery close to the Fermi level where lifetimes are expected tobe the longest. Nascent nonthermal electron lifetimes werealso obtained very close to the Fermi level. Thus, we willcompare our results with femtosecond data from transientabsorption spectroscopy. The measurements performed with4 nm gold NPs have shown an increase of the lifetime fornonthermal electrons closer to the Fermi surface and surfaceplasmon position. Surprisingly, the observed internal ther-malization times for small gold nanoparticles reported hereare significantly longer than those available in the literaturefor bulk gold. Indeed, previous studies have shown internalthermalization characteristic times of 500 and 350 fs for goldand silver films in the vicinity of the Fermi surface,respectively.24,52 Figure 7 has shown that the maximum ofthe signal is reached after a delay of 1 ps with respect to thepump–probe cross correlation at 0.4 eV aboveEF . Concern-ing works on gold NPs, Linket al. have recently reportede–e-scattering rates for gold particles in solution by extract-ing the time constants from a signal containing both thee–eand the electron–phonon interaction processes at the plas-mon band maximum (l5530 nm, similar to Fig. 6 of thisstudy!.49 A size independent internal thermalization time of500 fs was found from traces recorded at 530 nm for goldNPs between 9 and 48 nm. However, the deviation from asingle exponential is significantly larger for the gold NPsstudied here compared to gold NPs with sizes larger than 9nm ~Ref. 49! ~comparison with Fig. 6 of this work!. With theprobe wavelength at 530 nm, the overlap between thee–eand thee– ph interaction processes is maximum, as a result,it is very difficult to extract the time constants for the internaland external thermalization processes because rate constantsare too comparable. As developed above~see paragraph:Identification and separation! other probe wavelengths canavoid this complication. For similar NPs sizes, our resultscan only be compared with Ag and Cu NPs since no datawere found for gold NPs smaller than 9 nm in diameter inthe literature. For instance, internal thermalization time of200 fs has been measured at the Fermi level for silver withthe same NPs size26 whereas copper NPs of 10 nm of diam-eter showed an internal thermalization time of less than 200fs.29 Therefore, the rate ofe–e scattering observed for thesesmall gold NPs is at least four times slower than in silver forsimilar sizes.26 The fact thate–e scattering rates measured inthis work differ significantly from silver with similar par-
ticles size may be attributed to an additional mechanism fore–e scattering in the case of small gold NPs modified with ahigh density of adsorbates.
F. Alternative mechanisms for nonthermal electronenergy loss
Classically,e–e scattering process is mainly governedby two main factors:~i! the Pauli exclusion principle,~ii ! theCoulombic screening effects.53 The origin of the slowe–escattering rates observed here can be attributed to a decreaseof density of states aroundEF or to the presence of newchannels of electron scattering for these small gold NPs.
1. The appearance of nonmetallic state:Decrease of the available phase space aroundthe Fermi level
The availability of phase space is thought to be thedominant factor controlling thee–e scattering rate due to thePauli exclusion principle close toEF . The size regime of thegold NPs is just at the frontier of the appearance of quantumsize effects. The discretization of energetic levels can lead toextremely slowe–e scattering rates in Au clusters.54 Thesmall NPs size may lead to the creation of a gap aroundEF
lowering considerably the density of states and thus, theavailable phase space fore–e scattering. The probability ofinelastic scattering is significantly reduced. Recently, nonme-tallic properties have been identified by STM/STS for 3 nmgold NPs.55 Therefore, the change of the electronic structurecaused by electron confinement to a restricted volume couldbe responsible for the long internal thermalization time.However, the preliminary results from XPS measurementsdid not give indication of metal to insulator transitions forthe gold NPs studied here. The observed lowe–e scatteringrates should have another origin than the reduction of phasespace for electron scattering.
2. The Auger relaxation process
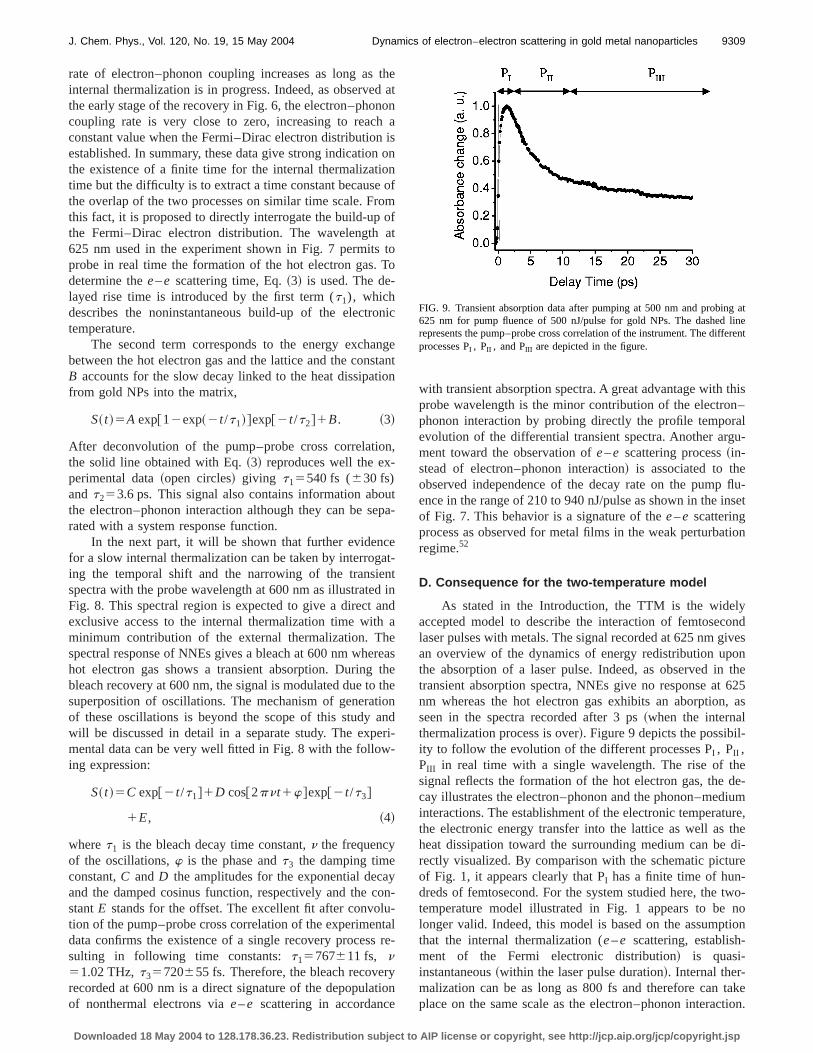
Electronic interband transitions can be excited with thephoton energy range used in these experiments. The absorp-tion process in gold NPs forhn.2 eV leads the excitation ofa d-band electron into an empty state of thesp band. There-fore, excitation ofd-band electrons withhn in the range of2.3–2.5 eV will create hot electron with a small energy ex-cess of 0.3 to 0.5 eV aboveEF . A possible relaxation mecha-nism can occur through the Auger process involving ad-band hole and twosp-band electrons.56–59The Auger pro-cess is illustrated in Fig. 10 and can be described as follows:The electronic interband transition leads to the generation ofa d-band hole and asp-band electron~a!. An electron fromthe sp band lying slightly belowEF can fill the photogener-atedd-band hole~b!, and transfer the excess energy to an-other electron which is excited far aboveEF to conserveenergy and momentum~c!. Finally, the Auger decay processcan generate highly energetic electrons (;2 eV aboveEF)and therefore the resulting energetic distribution of NNEs isin principle equivalent to an intraband transition. However,the Auger generation mechanism is a multistep process forthe generation of highly energetic nonthermal electrons com-
9310 J. Chem. Phys., Vol. 120, No. 19, 15 May 2004 Bauer et al.
Downloaded 18 May 2004 to 128.178.36.23. Redistribution subject to AIP license or copyright, see http://jcp.aip.org/jcp/copyright.jsp
pared to the intraband transition excitation. The generation ofNNEs throughd-band holes has been considered for 30 nmgold NPs.60 Thus, a reason for the slowe–e scattering ratecould be the excitation mechanism~Auger process!, whichleads to a delayed generation hot electrons. The observationof slower e–e scattering rates close to the plasmon bandposition can suggest that surface collective excitation playsan important role for nonequilibrium electron dynamics inNPs with diameter of several nanometers.61 Very recently, atheoretical model was proposed consisting of a dynamicalscreening induced by the confinement, which stronglymodify the classical e–e scattering process.61–63 Thismechanism involving the interaction of a nascent electronwith a d-band hole followed by the emission of a surfaceplasmon can be viewed as an Auger process. According tothis model, a pump energy around 2.3 eV considerably en-hances the possibility ofd-hole scattering into the conduc-tion band by emitting a surface plasmon. The photon energyused in the present experiment (hn;2.4 eV) is very close tothe onset of interband transition as well as the surface plas-mon band position. A main difference between silver andgold NPs is the proximity of interband transition with thesurface plasmon and this could be the origin of the differ-ences ine–e scattering dynamics between these noble met-als. The Auger process can hold for bulk metals to explainthe differences of behavior for NNEs for Au and Cu withrespect to Ag.64 Furthermore, an important point is the factthat thee–e scattering time of 200 fs were measured withAg NPs that exhibit a classical broadening of the surfaceplasmon.26 Indeed, no chemical interface damping was ob-served in this case since the absorption spectrum can be wellreproduced with Mie’s theory~Fig. 2, Ref. 3!. Therefore, inview of the very high surface to volume ratio, it is reasonableto privilege surface effects as pointed out by the observationson the surface plasmon damping mechanism at the beginningof the Discussion section.
3. Ultrafast chemical interface scattering (UCIS):inelastic electron resonant scattering process
We shall now discuss the crucial role of the metal/matrixinterface on the dynamics of NNEs. Surface effects play amajor role in the dynamics of surface plasmon. The compari-son between calculated and experimental linewidths of theplasmon band and the detection of a large density of adsor-bates have lead to the conclusion that the surface plasmonundergoes a strong chemical interface damping. As demon-strated above, the broadening of the plasmon band can beunderstood by an additional damping mechanism of the col-lective oscillations via the electron tunneling into and outadsorbates electronic states. The gold NPs are wrapped in ashell of oxidized molecular species~carbonate and sulfate!. Ithas been shown that the loss of phase coherence is acceler-ated by the presence of adsorbates that open an additionaldecay channel for the surface collective oscillations. Bothmomentum and energy of collective electrons are dissipatedvia an inelastic scattering.
A gold NP of 4.2 nm in diameter has about 2300 atomsand about 35% of all the gold atoms consist of surface at-oms. Because of the high surface atoms to bulk atoms ratiofor the gold NPs used here, most of NNEs created upon theabsorption of the laser pulse are close contact with adsor-bates. Surface effects could be at the origin of the differencesfor nascent nonthermal electron dynamics in NPs comparedto films.
The energetic range of NNEs created via the Augermechanism is in principle equivalent to an intraband transi-tion excitation as illustrated in Fig. 10. Therefore, the samefinal picture for the electron distribution changes is obtainedfor excitation of d-band electrons~interband transition! orsp-band electrons~intraband transition!.57 Figure 11 gives anoverall energetic diagram illustrating the change of electrondistribution in gold, the position of the adsorbates electronicstates and the TiO2 conduction band as a function of energy.The temporal evolution for the redistribution of the photonicenergy among the gold, the adsorbates and TiO2 is illustratedin ~A!, ~B!, and~C! of Fig. 11. The ultrafast chemical inter-face scattering can be described with the following scenario:Immediately after the absorption of the femtosecond pulse, anonequilibrium distribution of NNEs~as photoexcited! iscreated with energiesEini in the rangeEF<Eini,EF1hn.NNEs experience an inelastic resonance scattering into low-est unoccupied electronic states of adsorbed species closelypacked at the interface between Au and TiO2 . Upon collid-ing at the interface, the electron is temporary transferred intoempty electronic level with an energyEini with the subse-quent creation of an intermediate negative ion state. In smallNPs, ultrafast heating induces an enhancement of the prob-ability of electron scattering off the NPs.65 Theoretical stud-ies with alkali atoms on metal predict excited state lifetimesof less than 1 fs.66–68 Photoemission linewidths or real-timemeasurements indicate that the lifetime of the adsorbate reso-nant states can be as long as 50 fs.69–72 To the best of ourknowledge, the excited resonant state lifetimes of adsorbatesof few atoms is not known up to now. After a certain residenttime, the electron then scatters back with an energyEf in intothe gold metal conduction band. The resident time is long
FIG. 10. Schematic representation of the Auger decay: Upon absorption ofa femtosecond pulse (hn.2 eV), the interband transition will lead to thegeneration of a hole in thed band and an electron in thesp band aboveEF
~a!. A sp-band electron can fill the hole~b! with the subsequent excitation ofanothersp-band electron far aboveEF ~c!. This picture shows that, in prin-ciple, nascent nonthermal electrons generation via the Auger process(d-band electron excitation! is equivalent to an intraband transition~Ref.57!.
9311J. Chem. Phys., Vol. 120, No. 19, 15 May 2004 Dynamics of electron–electron scattering in gold metal nanoparticles
Downloaded 18 May 2004 to 128.178.36.23. Redistribution subject to AIP license or copyright, see http://jcp.aip.org/jcp/copyright.jsp
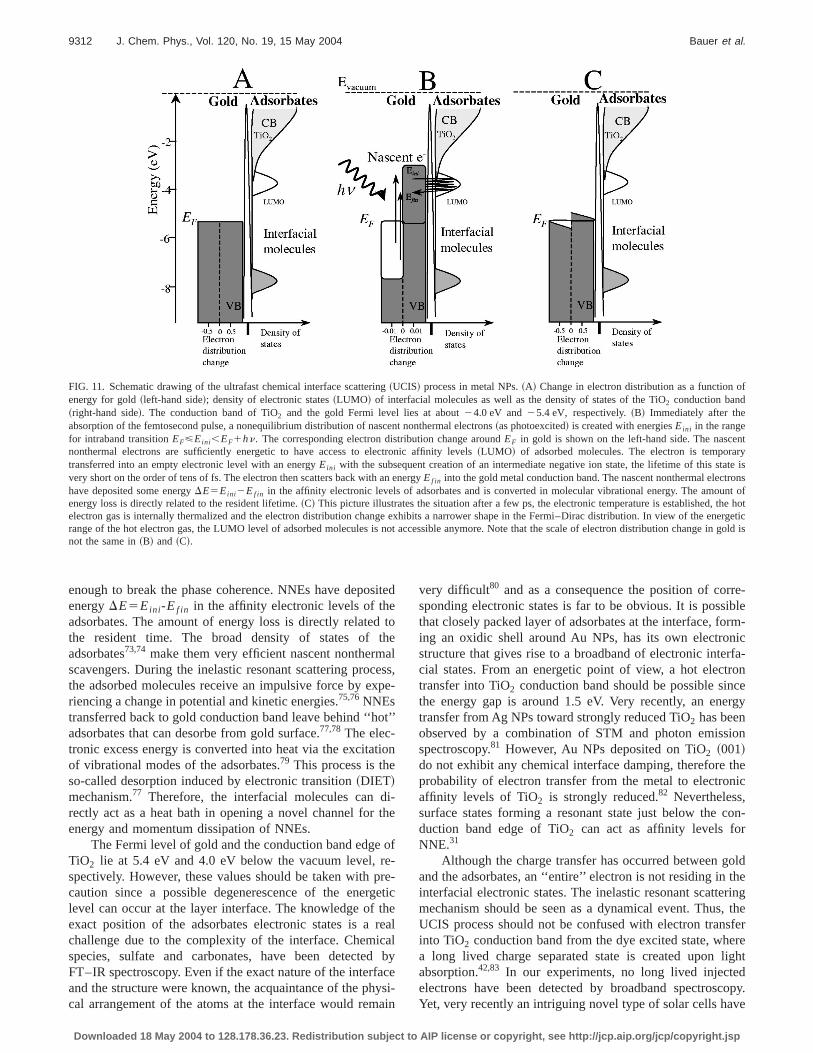
enough to break the phase coherence. NNEs have depositedenergyDE5Eini-Ef in in the affinity electronic levels of theadsorbates. The amount of energy loss is directly related tothe resident time. The broad density of states of theadsorbates73,74 make them very efficient nascent nonthermalscavengers. During the inelastic resonant scattering process,the adsorbed molecules receive an impulsive force by expe-riencing a change in potential and kinetic energies.75,76NNEstransferred back to gold conduction band leave behind ‘‘hot’’adsorbates that can desorbe from gold surface.77,78The elec-tronic excess energy is converted into heat via the excitationof vibrational modes of the adsorbates.79 This process is theso-called desorption induced by electronic transition~DIET!mechanism.77 Therefore, the interfacial molecules can di-rectly act as a heat bath in opening a novel channel for theenergy and momentum dissipation of NNEs.
The Fermi level of gold and the conduction band edge ofTiO2 lie at 5.4 eV and 4.0 eV below the vacuum level, re-spectively. However, these values should be taken with pre-caution since a possible degenerescence of the energeticlevel can occur at the layer interface. The knowledge of theexact position of the adsorbates electronic states is a realchallenge due to the complexity of the interface. Chemicalspecies, sulfate and carbonates, have been detected byFT–IR spectroscopy. Even if the exact nature of the interfaceand the structure were known, the acquaintance of the physi-cal arrangement of the atoms at the interface would remain
very difficult80 and as a consequence the position of corre-sponding electronic states is far to be obvious. It is possiblethat closely packed layer of adsorbates at the interface, form-ing an oxidic shell around Au NPs, has its own electronicstructure that gives rise to a broadband of electronic interfa-cial states. From an energetic point of view, a hot electrontransfer into TiO2 conduction band should be possible sincethe energy gap is around 1.5 eV. Very recently, an energytransfer from Ag NPs toward strongly reduced TiO2 has beenobserved by a combination of STM and photon emissionspectroscopy.81 However, Au NPs deposited on TiO2 ~001!do not exhibit any chemical interface damping, therefore theprobability of electron transfer from the metal to electronicaffinity levels of TiO2 is strongly reduced.82 Nevertheless,surface states forming a resonant state just below the con-duction band edge of TiO2 can act as affinity levels forNNE.31
Although the charge transfer has occurred between goldand the adsorbates, an ‘‘entire’’ electron is not residing in theinterfacial electronic states. The inelastic resonant scatteringmechanism should be seen as a dynamical event. Thus, theUCIS process should not be confused with electron transferinto TiO2 conduction band from the dye excited state, wherea long lived charge separated state is created upon lightabsorption.42,83 In our experiments, no long lived injectedelectrons have been detected by broadband spectroscopy.Yet, very recently an intriguing novel type of solar cells have
FIG. 11. Schematic drawing of the ultrafast chemical interface scattering~UCIS! process in metal NPs.~A! Change in electron distribution as a function ofenergy for gold~left-hand side!; density of electronic states~LUMO! of interfacial molecules as well as the density of states of the TiO2 conduction band~right-hand side!. The conduction band of TiO2 and the gold Fermi level lies at about24.0 eV and25.4 eV, respectively.~B! Immediately after theabsorption of the femtosecond pulse, a nonequilibrium distribution of nascent nonthermal electrons~as photoexcited! is created with energiesEini in the rangefor intraband transitionEF<Eini,EF1hn. The corresponding electron distribution change aroundEF in gold is shown on the left-hand side. The nascentnonthermal electrons are sufficiently energetic to have access to electronic affinity levels~LUMO! of adsorbed molecules. The electron is temporarytransferred into an empty electronic level with an energyEini with the subsequent creation of an intermediate negative ion state, the lifetime of this state isvery short on the order of tens of fs. The electron then scatters back with an energyEf in into the gold metal conduction band. The nascent nonthermal electronshave deposited some energyDE5Eini2Ef in in the affinity electronic levels of adsorbates and is converted in molecular vibrational energy. The amount ofenergy loss is directly related to the resident lifetime.~C! This picture illustrates the situation after a few ps, the electronic temperature is established, the hotelectron gas is internally thermalized and the electron distribution change exhibits a narrower shape in the Fermi–Dirac distribution. In view of the energeticrange of the hot electron gas, the LUMO level of adsorbed molecules is not accessible anymore. Note that the scale of electron distribution change in gold isnot the same in~B! and ~C!.
9312 J. Chem. Phys., Vol. 120, No. 19, 15 May 2004 Bauer et al.
Downloaded 18 May 2004 to 128.178.36.23. Redistribution subject to AIP license or copyright, see http://jcp.aip.org/jcp/copyright.jsp
been reported which consists of dye molecule anchored ontoa gold film coated on TiO2 . The authors report that ballisticelectrons can travel through the gold film over 20 to 50 nmto reach the TiO2 .84 In this system, the process is likelyassisted by an electrical field in close circuit.
Finally, the slowe–e scattering rates observed for thesegold NPs is attributed to the emergence of an additionalmechanism of electron scattering, i.e.,ultrafast chemical in-terface scattering~UCIS!. The large differences in internalthermalization times between Ag and Au NPs can be under-stood by the fact that gold NPs employed here exhibit astrong chemical interface damping at the opposite of Ag NPsemployed in Voisinet al.26 Indeed, the absorption spectrumfor the Ag NPs can be well reproduced using Eq.~2! for 6nm Ag NPs.3 For gold NPs employed in this work, the over-all internal thermalization process of the electronic gas iscontrolled by surface rather than by size effects. Our propo-sition for this alternative nonthermal energy loss mechanismis further supported by studies concerning the femtochemis-try on Pt~111! where, it was shown that nonthermal electronsare responsible for the triggering of surface chemistry.85,86
G. Relevance to surface femtochemistry
Usually, it is believed that only the hot electron gas drivefemtochemistry on metal surface, and based on this assump-tion, TTM is widely used to describe the surface photochem-istry initiated by a fs laser pulse. Here we show that NNEs~out of a Fermi–Dirac distribution! may be transferred to-ward adsorbates since UCIS is the decay channel to depositthe photonic energy into vibrational modes of adsorbates.Femtosecond spectroscopy showed that the establishment ofan electronic temperature can be as long as 800 fs for elec-trons at 0.4 eV above the Fermi level. NNEs can be longlived and can drive surface chemistry via the inelastic reso-nant scattering into molecular electronic states. The maindifference between NNEs and the hot electron gas is thewide range of energy covered by NNEs, thus a larger rangeof adsorbates electronic states are accessible to NNE for ini-tiating surface chemistry. Furthermore, the optical energy isnot lost via the collision among ‘‘cold’’ conduction bandelectrons. In other words, empty electronic states of the ad-sorbates are efficient nascent nonthermal scavengers. For ap-plications involving energy photon conversion, the limit onconversion efficiency can be doubled by harnessing hot elec-trons instead of thermalized electrons. Therefore, the energyof NNEs can be harnessed to move, to dissociate or to des-orbe molecules on surfaces.
V. CONCLUSION
Analysis of the surface plasmon broadening in combina-tion with ultrafast studies of the internal thermalization al-lowed to identify, in addition to the classicale–e scatteringmechanism, an alternative decay channel of nascent nonther-mal electrons~as photoexcited! in small gold NPs, i.e., theultrafast chemical interface scattering (UCIS)mechanism.
Analysis of the surface plasmon linewidths showed thatsurface effects dominates size effects for these 4 nm goldNPs. A pronounced chemical interface damping of the sur-
face plasmon is observed, which indicates the active role ofadsorbates allowing electrons tunneling into and out of inter-facial electronic states between gold and titanium oxide.These empty resonant electronic states are provided by ad-sorbates as revealed by FT–IR spectroscopy. The scatteringprocess breaks the phase coherence and dissipates the energyand the momentum of the surface plasmon.
Differential absorption spectra of nonthermal nascentelectrons and hot electron gas have been identified by meansof broadband white light continuum spectroscopy and are inaccordance with previously published simulations.9,16 Theinternal thermalization time has been determined by probingthe decay of nonthermal electrons and the build-up of theFermi–Dirac electron distribution. Even for small gold NPs~4.2 nm in diameter!, the internal thermalization is as long as800 fs at 0.4 eV aboveEF . A key issue of this work is theobservation of a ‘‘slow’’e–e scattering process. Indeed, in-ternal thermalization rates are more than four times slower ingold with respect to silver for comparable NPs sizes.26
The slow establishment of an electronic temperature~in-ternal thermalization! is attributed to an alternative mecha-nism for nonthermal energy loss decay:ultrafast chemicalinterface scattering~UCIS!. The nascent nonthermal elec-trons experience an inelastic resonant scattering process intounoccupied molecular orbitals of adsorbates. The proportionof the different channels still need to be determined, how-ever, we speculate that the ultrafast chemical interface scat-tering can be the dominant mechanism for nascent nonther-mal energy loss for small NPs with chemically modifiedsurfaces. The effect of UCIS process is to retard the build-upof a Fermi–Dirac distribution (e–e scattering!. The obser-vation of UCIS process is linked to the fact that these AuNPs exhibit a very high surface atoms to bulk atoms ratioand that they are wrapped in a shell of oxidized species.
The two-temperature model~TTM! is based on the as-sumptions that thee–e scattering ande– ph interactionsrates are well separated and that the whole absorbed photonicenergy is transferred into the lattice. Therefore, the two-temperature model is no longer valid for this system becauseof the temporal overlap between the internal thermalizationand the electron–phonon interaction processes. Furthermore,the proposed additional mechanism~UCIS! permits to di-rectly transfer the optical energy toward the surrounding me-dium without heating up the metal NPs. Thus, a part of theabsorbed energy is not transferred into the lattice and evennot redistributed among ‘‘cold’’ conduction band electrons.Due to dynamic and energetic reasons, the present systemdoes not fit anymore with the basic assumptions of the TTM.These results suggest that nascent nonthermal electrons~outof a Fermi–Dirac distribution! may play an important role indriving femtochemistry on metal surfaces. The range of ad-sorbates energetic states accessible to nonthermal electrons ismuch wider compared to the internally thermalized hot elec-tron gas. The ultrafast study of nascent nonthermal electronsbehavior in small NPs is in its infancy. Mathematical modelsare required to assess the decay proportion via the UCISprocess with respect to the classicale–e scattering channel.
9313J. Chem. Phys., Vol. 120, No. 19, 15 May 2004 Dynamics of electron–electron scattering in gold metal nanoparticles
Downloaded 18 May 2004 to 128.178.36.23. Redistribution subject to AIP license or copyright, see http://jcp.aip.org/jcp/copyright.jsp
ACKNOWLEDGMENTS
C.B. and J.P.A. gratefully acknowledge Pascal Comteand Gerrit Boschloo for the preparation of the titanium diox-ide colloids, Vale´rie Devaud for the technical assistance andJ.-E. Moser, J. Lerme´, and P.-F. Brevet for fruitful discus-sions. C.B. also thanks B. Wenger for the help with the fem-tosecond laser setup. The authors would like to acknowledgeN. Xanthopoulos for the XPS measurements and the CenterInterdepartemental de Microscopie~EPFL! for the TEM pic-tures. The present work is financed by the ‘‘Fonds NationalSuisse de la Recherche Scientifique’’ and the ‘‘Office Fe´d-erale de l’Education et de la Science~project C02.0010!.’’The Laboratoire d’Electrochimie Physique et Analytique ispart of the TMR network SUSANA~Supramolecular Self-Assembly of Interfacial Nanostructures!.
1S. Link and M. A. El-Sayed, J. Phys. Chem. B103, 8410~1999!.2J. H. Hodak, A. Henglein, and G. V. Hartland, J. Phys. Chem. B104, 9954~2000!.
3C. Voisin, N. Del Fatti, D. Christofilos, and F. Valle´e, J. Phys. Chem. B105, 2264~2001!.
4N. Del Fatti and F. Valle´e, C. R. Phys.3, 365 ~2002!.5K. L. Kelly, E. Coronado, L. L. Zhao, and G. C. Schatz, J. Phys. Chem. B107, 668 ~2003!.
6D. N. Denzler, C. Frischkorn, C. Hess, M. Wolf, and G. Ertl, Phys. Rev.Lett. 91, 226102~2003!.
7M. Bonn, S. Funk, C. Hess, D. N. Denzler, C. Stampf, M. Scheffler, M.Wolf, and G. Ertl, Science285, 1042~1999!.
8H. Petek, M. J. Weida, H. Nagano, and S. Ogawa, Science288, 1402~2000!.
9M. Wolf and G. Ertl, Science288, 1352~2000!.10A. Stella, M. Nisoli, S. De Silvestri, O. Svelto, G. Lanzani, P. Cheyssac,
and R. Kofman, Phys. Rev. B53, 15497~1996!.11N. Pontius, G. Luttgens, P. S. Bechthold, M. Neeb, and W. Eberhardt, J.
Chem. Phys.115, 10479~2001!.12N. Pontius, M. Neeb, W. Eberhardt, G. Luttgens, and P. S. Bechthold,
Phys. Rev. B67, 035425~2003!.13P. Zhang and T. K. Sham, Phys. Rev. Lett.90, 245502~2003!.14In order to avoid confusions about the vocabulary used in this paper, it
could be useful to point out that all the following processes are equivalentand describe the same phenomenon: internal thermalization, electron–electron collision, electron–electron scattering, build-up of Fermi–Diracelectron distribution, hot electron thermalization, formation of a hot elec-tronic gas, establishment of an electronic temperature. The external ther-malization describes the electronic energy transfer toward the lattice viaelectron–phonon interaction and is also called the cooling process.
15S. I. Animisov, B. L. Kapeliovich and T. L. Perel’man, Sov. Phys. JETP39, 375 ~1974!.
16G. L. Eesley, Phys. Rev. Lett.51, 2140~1983!.17J. G. Fujimoto, J. M. Liu, E. P. Ippen, and N. Bloembergen, Phys. Rev.
Lett. 53, 1837~1984!.18H. E. Elsayed-Ali, T. B. Norris, M. A. Pessot, and G. A. Mourou, Phys.
Rev. Lett.58, 1212~1987!.19T. Tokizaki, A. Nakamura, S. Kaneko, K. Uchida, S. Omi, H. Tanji, and Y.
Asahara, Appl. Phys. Lett.65, 941 ~1994!.20M. Aeschlimann, H. E. Elsayed-Ali, R. J. D. Miller, D. A. Mantell, J. Cao,
and Y. Gao, Phys. Rev. B50, 8957~1994!.21S. Ogawa, H. Nagano, and H. Petek, Phys. Rev. B55, 10869~1997!.22C. L. Guo, G. Rodriguez, and A. J. Taylor, Phys. Rev. Lett.86, 1638
~2001!.23W. S. Fann, R. Storz, H. W. K. Tom, and J. Bokor, Phys. Rev. Lett.68,
2834 ~1992!.24C. K. Sun, F. Valle´e, L. H. Acioli, E. P. Ippen, and J. G. Fujimoto, Phys.
Rev. B50, 15337~1994!.25R. H. M. Groeneveld, R. Sprik, and A. Lagendijk, Phys. Rev. B51, 11433
~1995!.26C. Voisin, D. Christofilos, N. D. Fatti, F. Vallee, B. Prevel, E. Cottancin, J.
Lerme, M. Pellarin, and M. Broyer, Phys. Rev. Lett.85, 2200~2000!.27J. J. Quinn, Phys. Rev.126, 1453~1962!.28The electronic temperature rise was estimated from the gold heat capacity,
the adsorbed optical energy~according to the laser pulse intensity, the spotsize and the sample absorbance! and the concentration of gold nanopar-ticles. However, these values should be taken with care since uncertaintieson the spot size are quite large (630%). Furthermore, as demonstrated inthis work, a significant part of the optical energy is directly dissipatedtoward adsorbates and is therefore not redistributed among other electronsto build-up the Fermi–Dirac distribution.
29J. Y. Bigot, J. C. Merle, O. Cregut, and A. Daunois, Phys. Rev. Lett.75,4702 ~1995!.
30J. H. Hodak, A. Henglein, and G. V. Hartland, J. Chem. Phys.112, 5942~2000!.
31B. N. J. Persson, Surf. Sci.283, 153 ~1993!.32U. Kreibig and M. Vollmer, Optical Properties of Metal Clusters
~Springer, Berlin, 1995!.33H. Hovel, S. Fritz, A. Hilger, and U. Kreibig, Phys. Rev. B48, 18178
~1993!.34J. Bosbach, C. Hendrich, F. Stietz, T. Vartanyan, and F. Trager, Phys. Rev.
Lett. 89, 257404~2002!.35R. H. Doremus, J. Chem. Phys.42, 414 ~1965!.36U. Kreibig, Z. Phys.234, 307 ~1970!.37W. A. Kraus and G. C. Schatz, J. Chem. Phys.79, 6130~1983!.38P. B. Johnson and R. W. Christy, Phys. Rev. B6, 4370~1972!.39G. Mie, Ann. Phys.~N.Y.! 25, 377 ~1908!.40J. Fink, C. J. Kiely, D. Bethell, and D. J. Schiffrin, Chem. Mater.10, 922
~1998!.41N. W. Duffy, K. D. Dobson, K. C. Gordon, B. H. Robinson, and A. J.
McQuillan, Chem. Phys. Lett.266, 451 ~1997!.42C. Bauer, G. Boschloo, E. Mukhtar, and A. Hagfeldt, J. Phys. Chem. B
106, 12693~2002!.43J. E. Martin, J. Odinek, J. P. Wilcoxon, R. A. Anderson, and P. Provencio,
J. Phys. Chem. B107, 430 ~2003!.44T. Shimizu, T. Teranishi, S. Hasegawa, and M. Myake, J. Phys. Chem. B
107, 2719~2003!.45K. Nakamoto, Infrared Spectra of Inorganic and Coordination Com-
pounds~Wiley, New York, 1978!.46M. Primet, P. Pichat, and M. V. Mathieu, J. Phys. Chem.75, 1210~1972!.47M. Primet, P. Pichat, and M. V. Mathieu, J. Phys. Chem.75, 1221~1972!.48K. Tanaka and J. M. White, J. Phys. Chem.86, 4708~1992!.49S. Link, C. Burda, Z. L. Wang, and M. A. El-Sayed, J. Chem. Phys.111,
1255 ~1999!.50N. Del Fatti and F. Valle´e, Appl. Phys. B: Lasers Opt.B73, 383 ~2001!.51N. Del Fatti, R. Bouffanais, F. Valle´e, and C. Flytzanis, Phys. Rev. Lett.
81, 922 ~1998!.52N. Del Fatti, C. Voisin, M. Achermann, S. Tzortakis, D. Christofilos, and
F. Vallee, Phys. Rev. B61, 16956~2000!.53C. Kittel, Introduction to Solid State Physics~Wiley, New York, 1996!.54M. Niemietz, P. Gerhardt, G. Gantefo¨r, and Y. D. Kim, Chem. Phys. Lett.
380, 99 ~2003!.55M. Valden, X. Lai, and D. W. Goodman, Science281, 1647~1998!.56J. W. Gadzuk and E. W. Plummer, Phys. Rev. Lett.26, 92 ~1971!.57H. Petek and S. Ogawa, Prog. Surf. Sci.56, 239 ~1998!.58M. Aeschlimann, M. Bauer, S. Pawlik, R. Knorren, G. Bouzerar, and K. H.
Bennemann, Appl. Phys. A: Mater. Sci. Process.A71, 485 ~2000!.59R. Knorren, K. H. Bennemann, R. Burgermeister, and M. Aeschlimann,
Phys. Rev. B61, 9427~2000!.60M. Perner, P. Bost, G. Lemmer, G. von Plessen, J. Feldmann, U. Becker,
M. Mennig, M. Schmitt, and H. Schmitt, Phys. Rev. Lett.78, 2192~1997!.61T. V. Shahbazyan and I. E. Perakis, Chem. Phys.251, 37 ~2000!.62T. V. Shahbazyan, I. E. Perakis, and J. Y. Bigot, Phys. Rev. Lett.81, 3120
~1998!.63T. V. Shahbazyan and I. E. Prakis, Phys. Rev. B60, 9090~1999!.64M. Aeschlimann, M. Bauer, and S. Pawlik, Chem. Phys.205, 127 ~1996!.65N. Del Fatti, C. Flytzanis, and F. Valle´e, Appl. Phys. B: Lasers Opt.B68,
433 ~1999!.66D. Lang and A. R. Williams, Phys. Rev. B18, 616 ~1978!.67P. Nordlander and J. C. Tully, Phys. Rev. B42, 5564~1990!.68G. Borisov, D. Teillet-Billy, J. P. Gauyacq, H. Winter, and G. Dierkes,
Phys. Rev. B54, 17166~1996!.69S. Ogawa, H. Nagano, and H. Petek, Phys. Rev. Lett.82, 1931~1999!.70A. G. Borisov, J. P. Gauyacq, E. V. Chulkov, V. M. Silkin, and P. M.
Echenique, Phys. Rev. B65, 235434~2002!.71M. Bauer and M. Aeschlimann, Phys. Rev. B55, 10040~1997!.72M. Bauer and M. Aeschlimann, Phys. Rev. B60, 5016~1999!.73R. W. Gurney, Phys. Rev.47, 479 ~1935!.
9314 J. Chem. Phys., Vol. 120, No. 19, 15 May 2004 Bauer et al.
Downloaded 18 May 2004 to 128.178.36.23. Redistribution subject to AIP license or copyright, see http://jcp.aip.org/jcp/copyright.jsp
74R. J. D. Miller, G. L. McLendon, A. J. Nozik, W. Schmickler, and F.Willig, Surface Electron-Transfer Processes~VCH, New York, 1995!.
75D. Menzel and R. Gomer, J. Chem. Phys.41, 3311~1964!.76P. A. Redhead, Can. J. Phys.42, 886 ~1964!.77J. W. Gadzuk, Phys. Rev. B44, 13466~1991!.78W. Ho, Surf. Sci.363, 166 ~1995!.79A. Herzenberg, J. Phys. B1, 548 ~1968!.80F. Cosandey and T. E. Madey, Surf. Rev. Lett.8, 73 ~2001!.81N. Nilius, N. Ernst, and H.-J. Freund, Chem. Phys. Lett.349, 351 ~2001!.
82N. Nilius, N. Ernst, and H.-J. Freund, Surf. Sci.478, 327 ~2001!.83P. Bonhote, J.-E. Moser, R. Humphry-Baker, N. Vlachopoulos, S. M.
Zakeeruddin, L. Walder, and M. Gratzel, J. Am. Chem. Soc.121, 1324~1999!.
84E. W. McFarland and J. Tang, Nature~London! 421, 616 ~2003!.85R. J. Deliwala, R. J. Finlay, T. H. Goldmann, T. H. Her, W. D. Mieher, and
E. Mazur, Chem. Phys. Lett.242, 617 ~1995!.86T.-H. Her, R. J. Finlay, C. Wu, and E. Mazur, J. Chem. Phys.108, 8595
~1998!.
9315J. Chem. Phys., Vol. 120, No. 19, 15 May 2004 Dynamics of electron–electron scattering in gold metal nanoparticles
Downloaded 18 May 2004 to 128.178.36.23. Redistribution subject to AIP license or copyright, see http://jcp.aip.org/jcp/copyright.jsp
Copyright © 2022 FDOKUMEN