Thermal and nonthermal melting of silicon under femtosecond x-ray irradiation
Upload
khangminh22Category
view
3download
0
PROCESSING CARROT JUICE BY SELECTED NONTHERMAL TECHNOLOGIES
AS HURDLES
By
PRASHANT RAJ POKHREL
A dissertation submitted in partial fulfillment of
the requirements for the degree of
DOCTOR OF PHILOSOPHY
WASHINGTON STATE UNIVERSITY
Department of Biological Systems Engineering
DECEMBER 2017
ii
To the Faculty of Washington State University:
The members of the Committee appointed to examine the dissertation of PRASHANT
RAJ POKHREL find it satisfactory and recommend that it be accepted.
Gustavo V. Barbosa-Cánovas, Ph.D., Chair
Juming Tang, Ph.D.
Shyam S. Sablani, Ph.D.

iii
ACKNOWLEDGMENT
Firstly, I would like to express my deepest gratitude to my advisor Dr. Gustavo V. Barbosa-
Cánovas who has always supported and encouraged me to grow professionally in the field of food
engineering. I must say I am standing here today because of his continuous support, help, advice,
and encouragement. I extent my sincere gratitude to my doctorate committee members, Dr. Juming
Tang and Dr. Shyam S. Sablani for their advice and support in this research and giving me a chance
to grow professionally in this field in a vivid way.
I would also like to give a huge thanks to USDA National Needs Fellowship Program for
providing funding for my Ph.D. studies. I would like to acknowledge Mr. Frank Younce, the pilot
plant manager, for providing me training and other technical assistance. My warm appreciation to
my mentors: Dr. Daniela Bermúdez-Aguirre, Dr. Ilce Gabriela Medina-Meza, and Dr. Kanishka
Bhunia. Great thank goes to the interns Camille Boulet and Camilla Garcia-Jange as well as
visiting scholar Taíse Toniazzo for helping me in many studies. I also would like to thank my
friends and members of Food Engineering Club at WSU for the warm friendship during my stay
at Pullman, WA. I would like to thank the staffs from Biological Systems Engineering department
at WSU specially Joanna Dreger, Dorota Wilk, and Jonathan Lomber.
My deep respect and gratitude to my parents Mr. Jiv Narayan and Mrs. Kamala Pokhrel,
my brothers Ravi and Sudarshan Pokhrel and my sisters Sharada and Bandana Pokhrel for their
continuous encouragement and inspiration. I am grateful to my loving family members and in-
laws for their support during my doctorate studies. Finally, I would like to give a deepest thanks
to my better half, Sita Acharya Pokhrel, for her unwavering love and support.

iv
PROCESSING CARROT JUICE BY SELECTED NONTHERMAL TECHNOLOGIES
AS HURDLES
Abstract
by Prashant Raj Pokhrel, Ph.D.
Washington State University
December 2017
Chair: Gustavo V. Barbosa-Cánovas
Nonthermal food processing technologies such as High Pressure Processing (HPP), Pulsed Electric
Fields (PEF), and Ultrasound (US) are novel juice pasteurization methods. The objective of this
study was to use these technologies in combination with other microbial stress factors (Mild heat,
Nisin, and pH) in the mild-pasteurization of carrot juice. Microbiological inactivation and quality
attributes retention were studied for selected combinations. Various processes were identified that
rendered equivalent microbial load reduction and those processes were compared for energy
consumption and quality retention.
The ultrasound (37.87 W/cm2) processing of carrot juice at 58°C, was found to be effective
in E. coli inactivation without impacting quality attributes. Mathematical modeling of the
inactivation’s curve shows that Weibull and a biphasic model to be good fits to predict survivors.
Further studies on ultrasound in combination with nisin (25 and 50 ppm) and mild temperatures
(35 and 50°C) show synergism between these three factors.
High pressure was combined with moderate heat and nisin to explore the inactivation of
gram-positive and negative bacteria. The addition of nisin at 25 and 50 ppm at 20°C did not impact

v
the lethal effect at mild-pressures (≤300 MPa). However, for the same level of pressures, a
synergistic effect between nisin and pressure was found at 35°C. The microbial inactivation by
combining HPP and nisin was further enhanced by increasing the temperature to 50°C. High
pressure treatment was also carried out for carrot juice mixed with orange juice in different
proportion. The developed interacting relations between pressure, pH, and processing time on
microbial inactivation could be useful in predicting the inactivation at different pHs.
The PEF processing of carrot-orange juice blend shows the application of High Electric
Field-Low Frequency was found to be more efficient than Low Electric Field-High Frequency in
microbial inactivation. The application of mild temperatures (35 and 50°C) and nisin (25 and 50
ppm) enhanced the inactivation by both processes without significantly impacting quality
attributes.
Findings from the present study will be useful in designing mild pasteurization processes
for fruit and vegetable juices using nonthermal technologies such as HPP, PEF, and Ultrasound
together with other selected hurdles.

vi
TABLE OF CONTENTS
Page
ACKNOWLEDGMENT................................................................................................................ iii
ABSTRACT ................................................................................................................................... iv
LIST OF TABLES ........................................................................................................................ xv
LIST OF FIGURES ................................................................................................................... xviii
INTRODUCTION .......................................................................................................................... 1
1. Background and Problem Statement ....................................................................................... 1
2. Hypothesis and Objectives ...................................................................................................... 3
3. Dissertation outline .................................................................................................................. 4
References ....................................................................................................................................... 5
CHAPTER ONE ............................................................................................................................. 7
A REVIEW ON NONTHERMAL PROCESSING OF FRUIT AND VEGETABLE JUICES ..... 7
1. Introduction ............................................................................................................................. 7
2. Microbial outbreaks in juices .................................................................................................. 8
3. Commercial juice processing................................................................................................... 9
4. Novel approaches for juice processing .................................................................................. 10
4.1 High pressure processing ............................................................................................... 10
4.1.1 HPP principles of operation .................................................................................... 11
4.1.2 Microbiological inactivation by HPP...................................................................... 11
4.1.3 Effect of HPP on physicochemical characteristics of juices ................................... 16
4.2 Pulsed electric fields....................................................................................................... 18

vii
4.2.1 How does PEF work?.............................................................................................. 19
4.2.2 Microbiological inactivation by PEF ...................................................................... 20
4.2.3 Effect of PEF on physicochemical characteristics of juices ................................... 23
4.3 Power ultrasound ............................................................................................................ 26
4.3.1 Power ultrasound and how it works ........................................................................ 26
4.3.2 Microbiological inactivation by ultrasound ............................................................ 27
4.3.3 Effect of ultrasound on physicochemical characteristics of juices ......................... 30
4.4 Combination of processes .............................................................................................. 33
4.4.1 Ultrasound and high pressure processing ............................................................... 33
4.4.2 Ultrasound and pulsed electric fields ...................................................................... 35
5. Final remarks ......................................................................................................................... 36
References ..................................................................................................................................... 38
CHAPTER TWO .......................................................................................................................... 54
ENGINEERING ASPECTS OF NOVEL TECHNOLOGIES FOR BEVERAGE PROCESSING
....................................................................................................................................................... 54
1. Introduction ........................................................................................................................... 54
2. High pressure processing ....................................................................................................... 55
2.1 HPP Equipment .............................................................................................................. 55
2.2 Compression heating and its effect ................................................................................ 58
2.3 Energy consumptions ..................................................................................................... 60
2.4 Packaging requirements ................................................................................................. 62
2.5 Factors affecting the process .......................................................................................... 63
2.6 Advantages and limitations of HPP ................................................................................ 68

viii
3. Pulsed electric fields .............................................................................................................. 69
3.1 PEF equipment ............................................................................................................... 70
3.2 Electric fields generation ................................................................................................ 74
3.3 Energy consumption ....................................................................................................... 75
3.4 Factors affecting the process .......................................................................................... 76
3.5 Advantages and limitations of PEF ................................................................................ 80
4. Ultrasound ............................................................................................................................. 81
4.1 Ultrasound equipment .................................................................................................... 83
4.2 Propagation and attenuation of ultrasonic waves ........................................................... 85
4.3 Energy consumption ....................................................................................................... 86
4.4 Factors affecting the process .......................................................................................... 87
4.5 Advantages and limitations of Ultrasound ..................................................................... 91
5. Final Remarks ........................................................................................................................... 92
References ..................................................................................................................................... 93
CHAPTER THREE .................................................................................................................... 101
COMBINED EFFECT OF ULTRASOUND AND MILD TEMPERATURES ON THE
INACTIVATION OF E. coli IN FRESH CARROT JUICE AND CHANGES ......................... 101
ON ITS PHYSICOCHEMICAL CHARACTERISTICS ........................................................... 101
Abstract ....................................................................................................................................... 101
1. Introduction ......................................................................................................................... 102
2. Materials and methods ......................................................................................................... 104
2.1 Preparation of carrot juice ................................................................................................. 104
2.2 Culture preparation ............................................................................................................ 105

ix
2.3 Ultrasound treatment ......................................................................................................... 105
2.4 Microbiological analysis ................................................................................................... 106
2.5 Microbial inactivation kinetics ..................................................................................... 107
2.5.1 First-order ................................................................................................................... 107
2.5.2 Weibull model ............................................................................................................ 107
2.5.3 Biphasic model ........................................................................................................... 108
2.6 Determination of color parameters .................................................................................... 108
2.7 Determination of pH, soluble solids content, and acidity ................................................. 109
2.8 Determination of phenolic compounds, ascorbic acid, and total carotenoid .................... 109
2.9 Statistical analysis ............................................................................................................. 110
3. Results and discussion ............................................................................................................ 111
3.1 E. coli Inactivation ............................................................................................................ 111
3.2 Mathematical modeling ..................................................................................................... 114
3.3 Effects of treatment on pH, soluble solids content, and acidity ........................................ 117
3.4 Effects of treatment on color parameters .......................................................................... 119
3.5 Effects of treatment on total carotenoid ............................................................................ 120
3.6 Effects of treatment on phenolic compounds .................................................................... 121
3.7 Effects of treatment on ascorbic acid ................................................................................ 122
4. Conclusions ......................................................................................................................... 123
References ................................................................................................................................... 124
CHAPTER FOUR ....................................................................................................................... 132
ON THE INACTIVATION OF Listeria innocua IN CARROT JUICE BY COMBINING
ULTRASOUND, HEAT, AND NISIN ...................................................................................... 132

x
Abstract ....................................................................................................................................... 132
1. Introduction ......................................................................................................................... 133
2. Materials and Methods ........................................................................................................ 135
2.2 Culture Preparation ........................................................................................................... 135
2.3 Ultrasound Treatment ........................................................................................................ 135
2.4 Survivor Analysis .............................................................................................................. 136
2.6 Optimum Processing Conditions and Quality Evaluation................................................. 138
3.1 Effect of Ultrasound on Listeria Inactivation ................................................................... 139
3.2 Combined Effect of Ultrasound and Temperature on Listeria Inactivation...................... 141
3.3 Combined Effect of Ultrasound, Temperature, and Nisin on Listeria Inactivation .......... 143
3.4 Energy Consumption during Processing ........................................................................... 146
3.5 Selection of Optimum Processing Conditions ...................................................................... 148
3.6 Effect of Processes on Total Aerobic Mesophiles ................................................................ 149
3.7 Evaluation of Effects on Quality Attributes.......................................................................... 150
3.7.1 pH, TSS, and Total Carotenoid Content ............................................................................ 150
3.7.2 Color Parameters ................................................................................................................ 152
4. Conclusions ......................................................................................................................... 153
References ................................................................................................................................... 155
CHAPTER FIVE ........................................................................................................................ 159
INACTIVATION OF Listeria innocua AND Escherichia coli IN CARROT JUICE BY
COMBINING HIGH PRESSURE PROCESSING, NISIN, AND MILD .................................. 159
THERMAL TREATMENTS ...................................................................................................... 159
1. Introduction ......................................................................................................................... 160

xi
2. Materials and Methods ........................................................................................................ 162
2.1 Culture preparation ........................................................................................................ 162
2.2 Sample preparation ........................................................................................................ 162
2.3 High Pressure Processing (HPP) ................................................................................... 164
2.4 Enumeration of viable E. coli and L. innocua ............................................................... 165
2.5 Quality evaluation and storage studies .......................................................................... 165
2.6 Energy calculation ......................................................................................................... 168
2.7 Statistical analysis.......................................................................................................... 168
3. Results and Discussion ........................................................................................................ 169
3.1 Effect of process on the inactivation of L. innocua and E. coli ..................................... 169
3.2 Effect of treatments on the quality of fresh carrot juice ................................................ 175
3.3 Effect on pH, total soluble solids (TSS), and turbidity ................................................. 176
3.4 Effect on color characteristics ....................................................................................... 177
3.5 Effect on bioactive compounds ..................................................................................... 178
3.6 Effect of process on energy consumption ...................................................................... 182
3.7 Storage studies ............................................................................................................... 182
4. Conclusions ............................................................................................................................. 189
References ................................................................................................................................... 191
CHAPTER SIX ........................................................................................................................... 197
INACTIVATION OF Listeria innocua IN CARROT-ORANGE JUICE BLENDS BY HIGH
HYDROSTATIC PRESSURE ................................................................................................... 197
Abstract ....................................................................................................................................... 197
1. Introduction ......................................................................................................................... 198
xii
2. Materials and Methods ........................................................................................................ 200
2.1 Sample Preparation ........................................................................................................... 200
2.2 Culture Preparation and Inoculation ................................................................................. 201
2.3 High Pressure Processing .................................................................................................. 201
2.4 Analysis of Survivors ........................................................................................................ 202
2.5 Determination of Color and Soluble Solid Contents ......................................................... 202
2.6 Ascorbic Acid .................................................................................................................... 202
2.7 Total Soluble Phenolic ...................................................................................................... 203
2.8 Total Carotenoid ................................................................................................................ 203
2.9 Quantification of Energy requirements ............................................................................. 203
2.10 Storage study ................................................................................................................... 205
2.11 Data Analysis .................................................................................................................. 205
3. Results and Discussion ........................................................................................................ 205
3.1 Inactivation of L. innocua ................................................................................................. 205
3.2 Multivariate Analysis ........................................................................................................ 208
3.3 Energy consumption during processing ............................................................................ 209
3.4 Quality evaluation ............................................................................................................. 210
3.4.1 Color characteristics ................................................................................................... 210
3.4.2 Total carotenoid content ............................................................................................. 211
3.4.3 Ascorbic acid .............................................................................................................. 212
3.5 Quality changes during storage ......................................................................................... 214
3.5.1 Microbial growth during storage ................................................................................ 214
3.5.2 Changes in pH and TSS during storage ...................................................................... 216

xiii
3.5.3 Changes in color of juice during storage .................................................................... 219
Conclusions ................................................................................................................................. 223
References ................................................................................................................................... 225
CHAPTER SEVEN .................................................................................................................... 229
PROCESSING OF CARROT-ORANGE JUICE BLEND BY PULSED ELECTRIC FIELDS
AND NISIN AT VARIOUS TEMPERATURES ....................................................................... 229
Abstract ....................................................................................................................................... 229
1. Introduction ......................................................................................................................... 230
2. Materials and Methods ........................................................................................................ 231
2.1 Sample preparation ............................................................................................................ 231
2.2 Culture preparation and inoculation .................................................................................. 232
2.3 PEF processing .................................................................................................................. 232
2.4 Analysis of survivors ......................................................................................................... 233
2.5 Quality evaluation ............................................................................................................. 234
2.5.1 Total aerobic mesophiles ............................................................................................ 234
2.5.2 pH, TSS, and color ..................................................................................................... 234
2.5.3 Total carotenoid content ............................................................................................. 234
2.5.4 Ascorbic acid .............................................................................................................. 235
2.6 Energy calculations ........................................................................................................... 235
2.7 Data analysis ..................................................................................................................... 235
3. Results and discussion ......................................................................................................... 236
3.1 Rise in temperature during processing .............................................................................. 236
3.2 Combined effect of PEF and heat ..................................................................................... 237

xiv
3.3 Combined effects of PEF and nisin ................................................................................... 239
3.4 Combined effect of PEF, heat, and nisin ........................................................................... 240
3.5 Quality evaluation ............................................................................................................. 242
3.5.1 Effect of processes on aerobic mesophiles ..................................................................... 242
3.5.2 Effect on pH, TSS, and Color ........................................................................................ 243
3.5.3 Effect on total carotenoid content and ascorbic acid...................................................... 246
4. Conclusions ......................................................................................................................... 246
References ................................................................................................................................... 248
FINAL REMARKS .................................................................................................................... 251
FUTURE STUDIES.................................................................................................................... 253

xv
LIST OF TABLES
Table 1. Microbial outbreaks in fruits and vegetables. ................................................................... 8
Table 2. Effect of HPP on Microbial Inactivation ........................................................................ 15
Table 3. Effect of HPP on physical and chemical characteristics of juices. ................................. 17
Table 4. Effect of PEF on microbial inactivation. ........................................................................ 22
Table 5. Effect of PEF on physicochemical characteristics of juice............................................. 24
Table 6. Microbial inactivation in juices by Ultrasound. .............................................................. 29
Table 7. Effect of ultrasound on juice physiochemical characteristics. ........................................ 32
Table 8. Adiabatic increments in temperature during HPP (de Heij et al., 2003). ....................... 65
Table 9. Statistical comparison of three different mathematical models: First-order, Weibull, and
Biphasic based on R-square, Root mean square error (RMSE), Bias factor (Bf), Accuracy factor
(Af), and F-test. ........................................................................................................................... 117
Table 10. Physicochemical parameters of carrot juice before and after processing ................... 118
Table 11. Final temperature of the juice after ultrasound processing for 5 min at different
amplitudes ................................................................................................................................... 136
Table 12. Effect of nisin concentration on the inactivation of L. innocua at room temperature
(20°C). ......................................................................................................................................... 144
Table 13. Acoustic energy density and ultrasonic intensity at different amplitude levels (Values
are the average of three replicates ± standard deviation). ........................................................... 147
Table 14. Processing conditions that results in at least a 5 log reduction of L. innocua ............ 148

xvi
Table 15. Change in pH, TSS, and carotenoid content of juice before and after processing under
different treatment conditions ..................................................................................................... 152
Table 16. Change in Lightness, Hue angle, Chroma, and ΔE of the juice before and after processing
with different treatment conditions ............................................................................................. 153
Table 17. Optimum processing conditions that led to at least 5 log reduction of L. innocua and E.
coli. Combination ‘a’ is control or fresh untreated juice. ........................................................... 176
Table 18. Effect of combination of HPP, temperature, and nisin on pH, soluble solids, and
turbidity. ...................................................................................................................................... 177
Table 19. Effect of combinations of HPP, temperature, and nisin on the color characteristics of
carrot juice .................................................................................................................................. 178
Table 20. Effect of selected combination of treatments on carotenoids, phenolic compounds and
ascorbic acid................................................................................................................................ 180
Table 21. Compression work and total energy consumption during processing ........................ 182
Table 22. Change in pH, Total soluble solids and Turbidity of carrot juice during storage at 4°C.
..................................................................................................................................................... 186
Table 25. Change in color characteristics of carrot juice during storage at 4°C. ....................... 188
Table 24. Main effect and interaction effect of each factor on L. innocua inactivation ............. 208
Table 25. Energy consumption in HPP at different pressure and processing time ..................... 209
Table 26. Color of juice before and after processing. ................................................................. 211

xvii
Table 27. Results obtained for the quantification of ascorbic acid, carotenoid and phenolic content.
..................................................................................................................................................... 213
Table 28. Processing parameters for PEF ................................................................................... 233
Table 29. Temperature rise during pulsed electric field processing of carrot-orange juice blends
..................................................................................................................................................... 236
Table 30. Combined effect of PEF, mild heat, and nisin on the inactivation of L. innocua in a
carrot-orange juice blend ............................................................................................................ 241
Table 31. Change in pH and TSS of juice before and after PEF processing .............................. 244
Table 32. Change in color characteristics of juice before and after PEF treatment .................... 245

xviii
LIST OF FIGURES
Figure 1. Structural and functional changes in microorganisms at different pressures (Source: Lado
and Yousef, 2002) ......................................................................................................................... 13
Figure 2. Electroporation of a microbial cell by PEF (Source: Vega-Mercado et al., 1996). ...... 21
Figure 3. Cavitation in ultrasound (a) Bubble formation; (b) Bubble growth; (c) Bubble collapse
(Source: Abdullah and Chin, 2014). ............................................................................................. 27
Figure 4. Combination of ultrasound and pressure (Source: Lee et al., 2009). ............................ 35
Figure 5. Operation of HPP (Source: http://www.hiperbaric.com/). ............................................ 57
Figure 6. Hiperbaric HPP system Hiperbaric-135 (Source: http://www.hiperbaric.com/). .......... 57
Figure 7. Avure’s AV-30 HPP unit (Source: http://www.avure-hpp-foods.com/). ...................... 58
Figure 8. Time–temperature and pressure profiles of water at an initial temperature of 24.2ºC and
set pressure of 300 MPa during HPP (Source: Patazca et al., 2007). ........................................... 65
Figure 9. Electroporation in microbial cell after PEF treatment. .................................................. 70
Figure 10. Schematic diagram of a pulsed electric fields system ................................................. 71
Figure 11. Pilot scale PEF systems: a. ELEA technologies (15 kW) and b. Diversified technologies
Inc. (DTI) (25 kW) (Source: http://elea-technology.de/ and http://www.divtecs.com/) .............. 71
Figure 12. Pulse forming network (PFN) in PEF system ............................................................. 72
Figure 13. PEF treatment chamber ............................................................................................... 74
Figure 14. Schematic diagram of ultrasound processing .............................................................. 81

xix
Figure 15. Creation of stable cavitation bubbles; and creation and the collapse of transient
cavitation bubbles. (a) displacement; (b) transient cavitation; (c) stable cavitation; (d) pressure
(Source: Santos et al., 2009). ........................................................................................................ 83
Figure 16. Ultrasound equipment: Lab scale (Left) and Industrial scale (Right) (Source:
www.hielscher.com) ..................................................................................................................... 84
Figure 17. Effect of frequency on the size of bubbles. (Source: http://www.ctgclean.com/). ...... 88
Figure 18. Inactivation kinetics of E. coli: (a) inactivation curve at different temperatures (50, 54,
and 58°C); Modeling the inactivation kinetics of E. coli by ultrasound at 50 (b), 54 (c), and 58°C
(d) using first-order, Weibull, and Biphasic model. ................................................................... 113
Figure 19. Carotenoid content of juice before and after processing, control indicates the fresh juice
without any treatment, US+50°C, US+54°C, US+58°C are three different ultrasound treatment at
50, 54 and 58°C respectively. There was non-significant (p>0.05) increment in total carotenoid
content after each treatment. ....................................................................................................... 121
Figure 20. Effect of ultrasound amplitude on inactivation of L. innocua in carrot juice at 20°C (left)
and 35°C (right). ......................................................................................................................... 140
Figure 21. Effect of temperature at different amplitude levels on the inactivation of L. innocua in
carrot juice (Data are mean of three replicates) .......................................................................... 143
Figure 22. Effect of different nisin concentration on inactivation of L. innocua at 35°C and 50°C
and at 80 and 100% amplitude level. Data are mean of three replicates .................................... 146
Figure 23. Temperature rise during processing at different amplitudes. Error bar represent the
standard deviation of three replicates ......................................................................................... 147

xx
Figure 24. Inactivation of mesophiles in carrot juice by selected combination of ultrasound
treatment. No significant difference (p>0.05) was found between selected equivalent processes on
the inactivation of mesophiles; Control indicates fresh juice without any treatments (a, b, c, d e as
shown in Table 14). Data are mean of three replicates ............................................................... 150
Figure 25. Process flow diagram for High Pressure Processing of nisin-incorporated carrot juice at
mild temperatures........................................................................................................................ 164
Figure 26. Effect of increased pressure at room temperature (20°C) on reduction of L. innocua and
E. coli. ......................................................................................................................................... 170
Figure 27. The combined effect of HPP, nisin, and heat on microbial inactivation. Data represent
the mean of three replicate .......................................................................................................... 173
Figure 28. Growth of aerobic mesophilic bacteria in carrot juice during storage at 4°C when
exposed to different treatments: b: 200 MPa, 50 ppm, 50°C, c: 300 MPa, 25 ppm, 35°C, d: 400
MPa, 0 ppm, 35°C, e: 500 MPa, 0 ppm, 20°C. ........................................................................... 184
Figure 29. Temperature and pressure profile during processing at 400 MPa for 1 min used to
determine δT/δt and δP/δt required for the energy calculation ................................................... 204
Figure 30. Inactivation of L. innocua in carrot-orange juice blends at 200 MPa, 300 MPa and 400
MPa over 5 minutes .................................................................................................................... 206
Figure 31. The growth of total aerobic mesophilic bacteria in the control (un-processed) and high
pressure treated juice blends during storage at 4°C .................................................................... 216
Figure 32. Change in pH and TSS of the juice blends (Control and Processed) during storage at
4°C for 28 days. .......................................................................................................................... 219

xxi
Figure 33. Change in color characteristic of the juice blends during storage at 4°C for 28 days.
..................................................................................................................................................... 223
Figure 34. Inactivation of L. innocua and naturally occurring mesophiles in carrot-orange juice
blends by pulsed electric fields. (ND: Not Detectable, below the detection limit) (PI: LEHF; PII:
HELF) ......................................................................................................................................... 239
Figure 35. Inactivation of naturally occurring mesophilic bacteria in carrot-orange juice by PEF
and mild heat. (PI: LEHF; PII: HELF) ....................................................................................... 243
Figure 36. Effect of selected process on carotenoid and ascorbic acid content of juice ............. 246
1
INTRODUCTION
Thermal pasteurization is the most commonly used technique for the treatment of fresh fruit and
vegetable juices. This process is successful in inactivating pathogenic and spoilage
microorganisms as well as enzymes. However, thermal processes can negatively affect the
nutritional quality and sensory attributes of juices (Wolbang et al., 2008). Low-acid and thermo-
sensitive juices such as carrot juice are affected by thermal processing; in carrot juice, it can lead
to losses of color, beta carotene, ascorbic acid, and phenolic compounds among other negative
effects (Patterson et al., 2012). Bioactive compounds present in this juice have high economic and
health significance. Many researchers have reported that thermal processing of fruits juices causes
major degradation of heat-sensitive bioactive compounds (Weemaes et al., 1998, Ferrari et al.,
2011). Thermal processing easily degrades anthocyanin content and antioxidant activity in juices.
Hager et al., (2008) observed that pasteurization of blackberry using thermal processing (90°C for
3 min) caused a 67% and 55% reduction in total monomeric anthocyanin content and antioxidant
activity respectively. To preserve the nutrient and sensory attributes of juice, there is a need for
new methods which can inactivate harmful microorganisms with minimum energy consumption
and without significantly affecting the quality of the juice. Novel nonthermal technologies such as
high pressure processing, pulsed electric fields and ultrasound in combination with temperature,
pH reduction, and antimicrobials addition can overcome the shortcomings of traditional processes.
1. Background and Problem Statement
Over the past few decades, several bacterial outbreaks have been associated with fruit and
vegetable juices. Most of these juice-related outbreaks have been associated with E. coli O157:H7,
Listeria monocytogenes, and Salmonella spp. (Jain et al., 2009; CDC 2015). Due to outbreaks

2
associated with juices, the United States Food and Drug Administration (USFDA) passed
legislation that requires all juice processors to follow a Hazard Analysis Critical Control Point
(HACCP) plan. According to the legislation, any commercial process should be able to achieve at
least 5 log reduction of most resistant pathogens associated with the particular juice (USFDA,
2001). Low acid juices (pH > 4.6), such as carrot juice, are considered risky and the FDA considers
such juices hazardous as they support the growth of pathogens of significant concern (Pilavtepe-
Çelik, 2013). As stated earlier, thermal processing can inactivate the pathogenic and spoilage
microorganisms efficiently but it has negative consequences such as loss of organoleptic quality
and loss of heat sensitive bioactive compounds.
Nonthermal food processing technologies such as high pressure processing (HPP), pulsed
electric fields (PEF) and ultrasound are novel methods to pasteurize fresh fruit and vegetable
juices. Among these three technologies, HPP has been already used at industrial setting to process
juice and other beverages but the level of pressure required and, in some cases, long treatment
times (>5 min) makes the process less efficient. Regarding PEF, this technology has been used at
industrial level for juice processing as well as for extraction of bioactive compounds and to create
pores in tissues in order to facilitate other processes such as dehydration. Microbial inactivation in
juice by PEF can be further enhanced by the incorporation of other stress factors making the overall
process quite efficient. Similarly, ultrasound technology has also been used at commercial level
for extraction of intracellular components. Ultrasound has the potential for the inactivation of
microorganisms due to its cavitation effect on the membrane cells, but the level of inactivation that
it renders is below the target level when it is used alone. There are many evidences ultrasound and
heat have strong synergism in microbial inactivation. All the above mentioned nonthermal
technologies could be combined with natural antimicrobial and thermal energy to increase the
3
efficacy of microbial inactivation and reduce energy consumption making those processes cost
effective.
2. Hypothesis and Objectives
By using selected nonthermal processing technologies in combination with other microbial stress
factors such as thermal energy, pH reduction, and nisin addition the required level of microbial
inactivation could be achieved in shorter time and with less energy input than with conventional
thermal treatments. A reduction in the energy input/consumption and processing time could
contribute to high retention of food quality attributes.
The main objectives of this research are:
Inactivate microorganisms of concerns in carrot juice by selected nonthermal processing
technologies using a multi hurdle approach
Study changes in physicochemical characteristics and retention of bioactive compounds in
carrot juice after selected individual and combined processes
Identify equivalent processes in terms of microbial inactivation to process carrot juice to
compare their effect on nutrient retention and energy consumption
Study changes in microbiological and physicochemical characteristics of processed juice
blends during storage
Reduce the energy consumption and processing time in selected nonthermal technologies
in the processing of carrot juice and carrot-orange blends
Find optimum processing conditions for mild-pasteurization of carrot juice for the studied
nonthermal technologies and their combinations with other hurdles

4
3. Dissertation outline
This dissertation consists of eight chapters:
Chapter I is a review on the safety and quality aspects of fruit and vegetable juices while
processed by high hydrostatic pressure, pulsed electric fields and ultrasound together with some
microbiological stress factors.
Chapter II is another literature review, but this time on the engineering aspects of beverage
processing by novel technologies. Main topics covered in this study include equipment design for
each technology, energy consumption during processing, factors affecting the efficacy of each
process and advantages/limitation of the processes.
Chapter III presents the combined effect of ultrasound and mild temperature on the inactivation
of E. coli in carrot juice and changes on its physicochemical characteristics.
Chapter IV deals with the physicochemical and microbiological quality changes in thermo-
sonicated carrot juice during storage at 4°C.
Chapter V explores the inactivation of Listeria innocua in carrot juice by combining ultrasound,
heat, and nisin.
Chapter VI analyses the effect of combining high pressure processing, nisin, and mild temperature
on the inactivation of Listeria innocua and Escherichia coli.
Chapter VII deals with the inactivation of Listeria innocua in carrot-orange juice blends by high
hydrostatic pressure.
Chapter VIII studies the effect of pulsed electric fields processing on the inactivation of Listeria
innocua in a carrot-orange juice blend.
Final remarks and recommendations for future work are included at the end of this dissertation.

5
References
Patterson, M. F., McKay, A. M., Connolly, M., & Linton, M. (2012). The effect of high hydrostatic
pressure on the microbiological quality and safety of carrot juice during refrigerated
storage. Food Microbiology, 30(1), 205-212.
Wolbang, C. M., Fitos, J. L., & Treeby, M. T. (2008). The effect of high pressure processing on
nutritional value and quality attributes of Cucumis melo L. Innovative Food Science and
Emerging Technologies, 9(2), 196-200.
Pilavtepe‐Çelik, M. (2013). High hydrostatic pressure (HHP) inactivation of foodborne pathogens
in low‐acid juices. International Journal of Food Science and Technology, 48(4), 673-677.
Jain, S., Bidol, S. A., Austin, J. L., Berl, E., Elson, F., Williams, M. L., ... & Yu, P. A. (2009).
Multistate outbreak of Salmonella Typhimurium and Saintpaul infections associated with
unpasteurized orange juice—United States, 2005. Clinical Infectious Diseases, 48(8),
1065-1071.
CDC. (2015). Foodborne Outbreak Online Database (FOOD).
http://wwwn.cdc.gov/foodborneoutbreaks/Default.aspx. Accessed February 4, 2016
Weemaes, C. A., Ludikhuyze, L. R., Van den Broeck, I., Hendrickx, M. E., & Tobback, P. P.
(1998). Activity, electrophoretic characteristics and heat inactivation of
polyphenoloxidases from apples, avocados, grapes, pears and plums. LWT-Food Science
and Technology, 31(1), 44-49.

6
Hager, T. J., Howard, L. R., & Prior, R. L. (2008). Processing and storage effects on monomeric
anthocyanins, percent polymeric color, and antioxidant capacity of processed blackberry
products. Journal of Agricultural and Food Chemistry, 56(3), 689-695.
Ferrari, G., Maresca, P., & Ciccarone, R. (2011). The effects of high hydrostatic pressure on the
polyphenols and anthocyanins in red fruit products. Procedia Food Science, 1, 847-853.

7
CHAPTER ONE
A REVIEW ON NONTHERMAL PROCESSING OF FRUIT AND VEGETABLE
JUICES
1. Introduction
In conventional thermal processing of fresh fruit and vegetable juices, high temperature (60-90°C)
is used and the process is called or high-temperature short-time (HTST) processing ultra-high
temperature (UHT) pasteurization. This process is successful in preserving juice by inactivating
pathogenic and spoilage microorganisms, but at the same time, it degrades nutrient and sensory
attributes due to high temperature and/or long processing time. Recently, consumers are showing
more interest in preservative-free juice which has more fresh-like attributes. To preserve the
nutrient and sensory attributes of juice, there is a need for new methods which will inactivate
pathogenic microorganisms, but not affect the quality of processed juice. The use of nonthermal
processing technologies such as ultrasound (US), high pressure processing (HPP), and pulsed
electric fields (PEF), in combination with moderate temperatures and/or antimicrobial agents, can
overcome shortcomings of conventional thermal processes. The above mentioned nonthermal
processing technologies have the capacity to inactivate food-borne pathogens, and in most cases
to preserve physicochemical and organoleptic properties of foods (Knorr et al., 2011a; Rawson et
al., 2011). Due to the synergistic or additive effects of these technologies, together with hurdles
such as the addition of antimicrobial agents or reduction of pH, the desired level of microbial
inactivation can be achieved in a very short time with or without application of moderate heat
(Nguyen and Mittal, 2007; McNamee et al., 2010; Chung and Yousef, 2010).

8
This chapter reviews the effects of HPP, PEF, and US, in combination with various hurdles,
on microbial inactivation in fresh juices. It also provides an overview of recent findings on how
this technology affects the quality of fresh juice including color, ascorbic acid, phenolic
compounds, carotenoids, antioxidant activity, vitamins, and other attributes.
2. Microbial outbreaks in juices
Over the past few decades, several bacterial outbreaks have been linked with fruit and vegetable
products (Table 1). Most of these juice-related outbreaks have been associated with, Listeria
monocytogenes and E. coli O157:H7 (Jain et al., 2009; CDC 2015). Due to various outbreaks with
juices, the United States Food and Drug Administration (USFDA) passed legislation that requires
all juice processors to follow a Hazard Analysis Critical Control Point (HACCP) plan. According
to the legislation, any commercial process should be able to achieve at least 5 log reductions of
most resistant pathogens in particular juice (USFDA, 2001). Low acid juices (pH > 4.6), such as
carrot juice, are considered risky, and the FDA considers such juices hazardous, as they support
the growth of pathogens (Pilavtepe-Çelik, 2013).
Table 1. Microbial outbreaks in fruits and vegetables (Source: CDC, 2015).
Year Pathogen Media Number of cases Area of outbreak
1993 Clostridium botulinum Carrot juice 1 Washington, USA
1993
Escherichia coli
(ETEC) Carrots 121 New Hampshire, USA
2000 Escherichia coli Watermelon >41 Milwaukee, USA

9
2006
Escherichia coli
O157:H7 Fresh Spinach 199 with 3 deaths 26 states of USA
2006
Salmonella
Typhimurium Tomato 183 21 states of USA
2011 Listeria monocytogenes Cantaloupe
146 with 30
deaths 28 states of USA
2011
Escherichia coli
O157:H7
Romaine
lettuce 56 9 states of USA
2012
Escherichia coli
O157:H7
Spinach and
Spring Mix
Blend
33 5 states of USA
2012 Salmonella Braenderup Mangoes 127 15 states of USA
2013 Salmonella Saintpaul Cucumbers 84 18 states of USA
2014 Salmonella Newport Cucumbers 275
29 states and District
of Columbia, USA
2015 Salmonella Poona Cucumbers 907 with 6 deaths 40 states of USA
3. Commercial juice processing
Thermal pasteurization is the most commonly used technique for the treatment of fresh fruit and
vegetable juices and this process is successful in inactivating pathogenic and spoilage
microorganisms. However, thermal processing can adversely impact the nutritional quality and
sensory attributes of juice (Wolbang et al., 2008). Low-acid and thermo-sensitive juices such as

10
carrot juice are affected by thermal processing; in carrot juice, it can lead to losses of color, beta
carotene, ascorbic acid, and phenolic compounds, among other negative effects (Patterson et al.,
2012). The bioactive compounds present in the juice have high economic and health significance.
Many researchers have reported that thermal processing of fruits juices causes major degradation
of heat-sensitive bioactive compounds (Weemaes et al., 1998, Ferrari et al., 2011). Thermal
processing can rapidly degrades heat sensitive anthocyanin content and antioxidant activity in juice
as well as other products (Hager et al., 2008). In order to retain those heat sensitive bioactive
compounds, novel technologies for juice processing has been proposed.
4. Novel approaches for juice processing
Due to the significant negative consequences of thermal processing, there was a need for novel
juice processing methods. High pressure processing, pulsed electric fields, and ultrasound are some
of the novel processing methods that have shown promising results in juice processing. These three
technologies are reviewed in this section.
4.1 High pressure processing
High pressure processing (HPP) is a mature nonthermal technology with origins in the chemical
processing industry. The FDA has approved this technology as a viable pasteurization method, and
it can be applied for preservation purposes as well as for extraction of essential bioactive
compounds from food. HPP has shown success in microbial and enzymatic inactivation at elevated
pressures up to 900 MPa. Liquid and solid foods, after packaging, are pressurized to between 50
and 900 MPa. In most cases, HPP inactivates spoilage and pathogenic microorganisms with
minimal changes in sensory attributes and nutrient loss compared to the same foods prepared with

11
conventional thermal processing (Timmermans et al., 2011). Juices, smoothies, guacamole,
sauces, ham, and seafood are some of the commercially available products processed by high
pressure.
4.1.1 HPP principles of operation
HPP can be largely described by the isostatic principle and Le Châtelier’s principle. The isostatic
principle explains the manner in which HPP transmits pressure uniformly and instantaneously
through all contents of the treatment chamber, regardless of whether the product being treated is
contained within packaging or is directly in contact with the pressure medium. Le Châtelier’s
principle states that a process that decreases the volume upon which it acts will be accelerated by
compression, i.e. application of high pressure. Combined, these principles explain why the
processing time of HPP does not depend on the volume, size, or packaging (or lack thereof) of the
product being treated, or on its location within the treatment chamber.
4.1.2 Microbiological inactivation by HPP
Several studies on the inactivation of pathogenic and spoilage microorganisms using high pressure
have been published in recent years and have demonstrated that HPP is a preservation method that
effectively inactivates microorganisms in fruit and vegetable juices (Table 2). Processing pressure,
pressure holding time, decompression time, and treatment temperature have important roles in the
treatment of fruit products by HPP.
It is widely agreed that HPP disrupts non-covalent bonds within cell membranes and leads
to their permeabilization (Winter & Jeworrek, 2009; Knorr et al., 2011b). The pressure sensitivity
of microorganisms depends upon the species, strain and type of microorganism as well as their

12
growth phase; those in the stationary and lag phases are typically more resistant to HPP than those
in the exponential growth phase.
Both linear and nonlinear inactivation kinetics of microorganisms can be observed in HPP.
In the majority of microorganisms, first-order kinetics have been observed, whereas two-phase
inactivation is also common: the first phase affects treatment-sensitive and the second phase
treatment-resistant populations (Lee et al., 2001). Exposure to high pressure causes filament
formation in microbial cells and rupture of cell membranes; the growth and reproduction of
microbial cells are inhibited at high pressure.
The inactivation of microbial cells depends on several parameters including stage of
growth, type of microorganisms, processing time, and processing temperature. Due to the presence
of a peptidoglycan layer within their cell membrane, gram-positive bacteria have higher resistant
to pressure than gram-negative bacteria. Vegetative cells have been observed to be less sensitive
to HPP while in the stationary phase than while in the growth or exponential phases (Alpas et al.,
1999). Yeasts and molds are quite resilient, but can be inactivated by HPP using pressures on the
order of 200–600 MPa. Pressure damage to the cell or cytoplasmic membrane is the main cause of
HPP-related microbial inactivation (Yuste et al., 2001). HPP mainly causes alterations in cell
membrane permeability, and crystallization of membrane phospholipids. Application of high
pressure also has inhibitory effects on microbial enzymes which alter biochemical reactions
leading to protein denaturation, decrease of intracellular pH, and ultimately, inactivation.
High pressure processing is effective at room temperature as well as at elevated
temperatures. At mild temperatures, HPP has a minimal effect on sensory qualities associated with
texture, color, flavor, and nutrient retention. During high pressure processing, there is an increase

13
in temperature through compression heating. This increase in temperature during processing, in
addition to applied heat, can eliminate spore-forming bacteria (Margosch, 2005). Addition of heat
during high pressure processing is referred as Pressure Assisted Thermal Processing.
Figure 1. Structural and functional changes in microorganisms at different pressures (Source: Lado and
Yousef, 2002)
HPP can also be combined with antimicrobials as one of the hurdles typically used in food
preservation. Antimicrobials can be incorporated in the food matrix before processing, some
antimicrobials commonly used in liquid food products include nisin, lysozymes, and Lactobacillus
casei. Use of antimicrobials may reduce processing time, which in turn reduces energy
consumption.

14
The combined effect of HPP and Lactobacillus casei cell extract (as antimicrobial) on the
inactivation of Listeria monocytogenes in a food model has been explored by Chung and Yousef
(2010). This study combined HPP (350 MPa, 1–20 min) and Lactobacillus casei cell extract (32
AU/mL); this combination decreased the load of L. monocytogenes by >5 log CFU/mL, which
they described as a synergistic effect. A study by Sokołowska et al. (2012) on the processing of
apple juice using HPP and a peptide hurdle showed that a combination of HPP (200 MPa, 45 min)
and nisin (250 IU/mL) was capable of complete inactivation of Alicyclobacillus acidoterrestris
spores (>6 log reduction). Similarly, Zhao et al. (2013) used a combination of HPP and nisin to
achieve complete inactivation of natural yeast and mold in cucumber juice, applying a pressure of
500 MPa with 100 IU/mL nisin over 2 min, a clear synergistic effect. Table 2 presents examples
of microbial inactivation in different media by HPP.
Syed et al. (2013) found that slower decompression periods and faster compression periods
were more efficient at inactivating Escherichia coli O157:H7 in orange juice. Syed et al. (2012),
in contrast, concluded that slower compression and decompression at elevated temperatures (60
and 70ºC) were more efficient to inactivate Bacillus subtilis in the same medium. Pressure
treatment (200–600 MPa, 5–10 min) was capable of yielding a 2.5 log reduction in E. coli O157:H7
in pineapple juice (Buzrul et al., 2008), and HPP treatment of apple and orange juices at elevated
temperature (57 and 60°C, respectively) caused a 6-log reduction (Muñoz et al., 2007). This shows
that incorporation of mild temperature in HPP significantly increase the inactivation of
microorganisms.

15
Table 2. Effect of HPP on Microbial Inactivation
Microorganisms Media HPP conditions
Log
Reduction
References
L. Monocytogenes
Carrot
juice
500 MPa, 5.5 min,
20ºC
6 Patterson et al., 2012
E. coli
(ATCC 11775)
Apple
juice
600 MPa, 7 min,
21ºC
7 Moody et al., 2014
E. coli (ATCC
29055)
Apple
juice
400 MPa, 5 min,
25ºC
8 Ramasawamy et al., 2003
E. coli O157:H7
Manjo
juice
400 MPa, 10 min 6
Hiremath and
Ramaswamy, 2012
E. coli
(ATCC 11775)
Kiwifruit
juice
350 MPa, 5 min 5 Buzurul et al., 2008
B. licheniformis
Carrot
juice
600 MPa for 3 min
at 60°C
4.9
Tola and Ramaswamy,
2014
A. acidoterrestris
Orange
juice
200 MPa, 10 min,
at 65°C
2 Silva et al., 2012
B. coagulans
Tomato
pulp
600 MPa for 15
min at 60°C
5.7 Zimmermann et al., 2013
Byssochlamys
nivea
Pineapple
juice
550 MPa for 15
min at 40°C
3.9
da Rocha Ferreira et al.,
2009

16
Talaromyces
avellaneus
Apple
juice
600 MPa for 5 min
at 17°C
6 Voldřich et al., 2004
4.1.3 Effect of HPP on physicochemical characteristics of juices
Fruit and vegetable juices are rich sources of bioactive compounds such as ascorbic acid, phenolic,
and anthocyanin. These compounds have numerous health benefits hence, during processing, food
industry tries to preserve them (Kaşikçi and Bağdatlioğlu, 2016). The treatment of such juices by
HPP is reported to result in minimal changes in quality.
Varela Santos et al. (2012) found retention of anthocyanin, phenolic compounds, and color
of pomegranate juice after the application of 350 and 550 MPa at room temperature. The
anthocyanin content of blueberry juice has been shown to increase following HPP (600 MPa,
42°C) (Barba et al., 2013). Another study on high-pressure treatment of pomegranate juice
concluded that HPP did not significantly affect its free anthocyanin content, whereas thermal
processing (85°C, 10 min) caused significant reductions (Alpas, 2013).
Phenolic compounds are another important class of bioactive compounds found in fruit and
vegetable juices. Many studies show retention of phenolic compounds after high pressure
treatment. Ferrari et al. (2010) found a 41% increase in the polyphenol content of pomegranate
juice after high pressure treatment at 400 MPa, 10 min, 50°C while thermal processing alone
(50ºC/10 min) showed no effect. This indicates that HPP not only retains base levels of phenolic
compounds, but also helps extract them from the tissue, thereby increasing the available total
phenols in juice Another study on pomegranate juice found significant increases in its total

17
phenolic content after the application of 350 and 500 MPa for 30 to 150 seconds (Andrés et al.
2015).
The release of phenol from the tissue depends on the level of pressure applied. A study
conducted on HPP of strawberry puree showed that there were no changes in total phenolic content
by the application of 400-500 MPa, 15 min at 10-30°C, but when pressure was raised to 600 MPa,
keeping other factors constant, there was a significant increase in phenolic content (Patras et al.,
2009). Xi et al. (2009) found phenol extraction was independent of treatment time, depending only
on pressure; application of 200, 300, and 400 MPa resulted in 23, 26, and 30% increases in
extraction yield while changing the treatment time from 1 to 10 min had no significant effect.
Hence it can be said that HPP cause little or no degradation in bioactive compounds of juices at
room and slightly above temperature. Table 3 presents few studies on the retention of bioactive
compounds by HPP.
Table 3. Effect of HPP on physical and chemical characteristics of juices.
Bioactive
compounds
Media HPP conditions
Retention
(%)
References
Total phenolic
compounds
Mango
nectar
600 MPa, 1 min, 25°C 100 Liu et al., 2014
Total phenolic
compounds
Pomegranate
juice
400 MPa, 5 min, 20°C 103 Chen et al., 2013
Ascorbic acid Kiwi puree 500 MPa, 3 min, 20°C 94
Fernández-Sestelo et al.,
2013

18
Ascorbic acid
Mango
nectar
600 MPa, 1 min, 25°C 100 Liu et al., 2014
Ascorbic acid Longan juice 300 MPa, 30 min 90
Chaikham and
Apichartsrangkoon 2012
Total
carotenoids
Orange juice 400 MPa, 1 min, 40°C >100
Sánchez -Moreno et al.,
2005
L-ascorbic acid Orange juice 400 MPa, 1 min, 40°C 92.11
Sánchez-Moreno et al.,
2005
Total
flavanones
Orange juice 400 MPa, 1 min, 40°C >100
Sánchez-Moreno et al.,
2005
Ascorbic acid
Blueberry
juice
600 MPa, 5 min 91.82 Barba et al., 2013
Total phenolics
Blueberry
juice
600 MPa, 5 min >100 Barba et al., 2013
Anthocyanin
(C3G)
Mulberry
juice
200 MPa, 1 pass
homogenization, 4°C
61.2 Yu et al., 2014
4.2 Pulsed electric fields
Pasteurization of fruit and vegetable juices with pulsed electric fields (PEF) is another promising
yet challenging approach. Pulsed electric fields processing is gaining popularity as a food
processing treatment, presenting a nonthermal alternative to conventional pasteurization
processes. PEF has been investigated for liquid food decontamination for nearly 20 years, with
great success for juices, sauces, dairy products, and even liquid eggs.

19
A PEF processing system consists of several components: a control unit, a high voltage
pulse generator, and one or more treatment chambers. It can be operated in a continuous manner
and can be set up for high throughputs. As the processing time is short, there is a greater likelihood
of nutrient retention than in traditional thermal processing. This technology achieves inactivation
of microbial cells present in food by subjecting them to critical electric fields for a short period of
time.
With PEF technology, reductions of >5 log in common pathogens, including E. coli,
Listeria monocytogenes, and Salmonella spp. have been repeatedly demonstrated in a ranges of
food products, including those with particulates. Apple juice, orange juice and milk are some liquid
foods whose processing by PEF has been thoroughly explored (Zhang et al., 1995). Other
microorganisms of interest, such as Saccharomyces cerevisiae, Staphylococcus aureus,
Lactobacillus spp, Bacillus subtilis, Zygosaccharomyces bailii, etc., have been successfully
inactivated by this technology. PEF could be a substitute for conventional thermal processing for
the pasteurization of liquid foods, offering advantages including low energy consumption and short
processing times (see; Table 4)
4.2.1 How does PEF work?
PEF processing involves generation of high-intensity electric fields (>10 kV/cm) of short duration
followed by rapid electron discharge. These discharges take place into pumpable food products,
which are passing through two electrodes; the discharge generates a voltage difference across the
microbial cell membrane promoting the formation of irreversible pores (electroporation). These
pores allow the passage of essential cell components associated with its metabolism (lysis) and
thus promote the irreversible inactivation of the microorganism. The electric pulses are also

20
responsible for modifying intracellular enzymes and detaching the cytoplasm from the membrane.
These two additional factors contribute significantly to microbial inactivation.
4.2.2 Microbiological inactivation by PEF
PEF causes microbial inactivation through pore formation (electroporation) within the cell
membrane. The electric field intensity, treatment duration, and treatment temperature all play roles
in determining whether the formation of these pores is reversible. Exposure to an electric field
generates free charges on the surface of the microbial cell membrane, causing opposite charges on
the inner and outer membranes to attract each other. This attraction compresses the membrane,
reducing its thickness (Shamsi 2008). Thus, PEF-treated cells have weak and thin membranes,
which allow small molecules to more easily pass through them, potentially resulting in cell
membrane rupture (Wu, 2014). When the electric field intensity is increased there will be a greater
accumulation of surface charges that results into irreversible breakdown of the cell membrane
(Zimmerman, 1986).
The inactivation of microorganisms can also be explained on the basis of the osmotic
imbalance theory. This theory entails that microbial cell are electroporated when they are exposed
to an electric field causing leakage of ions intracellular constituents. This cause the cell membrane
to be permeable to water which eventually led to rupture and death of the cell (Shamsi, 2008).

21
Figure 2. Electroporation of a microbial cell by PEF (Source: Vega-Mercado et al., 1996).
Many studies on juice pasteurization by PEF claim that 3-4 log reduction of vegetative
pathogens in fruits and vegetable juice can be achieved by PEF alone (Table 4). Incorporation of
some selected hurdles might result in additional inactivation.
In one study, PEF processing (35 kV/cm electric field, 3 μs pulse width, 45 Hz) of cactus
juice reduced the naturally occurring total colony and yeast/mold counts below detectable levels
(Moussa-Ayoub et al., 2017). Inactivation of natural flora can increase a product’s shelf life
relative to fresh/untreated products. Simpson et al. (1995) reported that PEF-treated (50 kV/cm,
10 pulses, 2 µs pulse width, 45°C) apple juice had an extra week of shelf-life compared to untreated
apple juice (28 vs. 21 days).
Previous studies show that the efficacy of the PEF processing can be enhanced by
incorporation of stress factors such as reduction of media pH, addition of antimicrobials, or an
increase in processing temperature. Studies have shown that the combination of PEF with a wide
range of antimicrobial hurdles, including antifungal peptides, bacteriocins, essential oils, organic
acids, and spices, can lead to improved microbial inactivation in fruit juices (Liang et al., 2002;
Nguyen and Mittal, 2007; Mosqueda-Melgar et al., 2008).

22
According to Liang et al. (2002) there was 5.9 log reduction of Salmonella typhimurium in
freshly squeezed orange juice (without pulp) when treated by PEF (90 kV/cm, 50 pulses, at 55ºC)
but when nisin (100 IU/mL of orange juice) or lysozyme (2,400 IU/mL) was added to the juice
before PEF treatment, there was additional 2.75 log cycles. Altunakar (2007) tested the use of a
variety of organic antimicrobials (e.g. cinnamic acid, hydrogen peroxide) as pretreatments before
applying PEF (40 kV/cm, 2.5 µs pulse width); these pretreatments were capable of increasing
treatment lethality by from 5 to up to 7 log cycles. In addition, Jin et al. (2014) found that
pomegranate juice processed by PEF (35kV/cm field strength, 281 µs total treatment time) and
stored in PET bottles had a shelf life of 21 days, whereas juice with the same treatment stored in
antimicrobial-incorporated PET bottles had a shelf life of 84 days.
Table 4. Effect of PEF on microbial inactivation.
Microorganisms Media PEF conditions
Log
Reduction
References
L. brevis
Orange
juice
35kv/cm, 4 µs, 32°C 5.8
Elez-Martínez
et al., 2005
S. cerevisiae
Apple
juice
20kv/cm, 10.4 pulses 4
Cserhalmi et
al., 2002
E. coli O157:H7
Apple
juice
34Kv/cm, 4µs, 38°C, 166 μs
treatment time
4.5
Evrendilek et
al., 2000
Z. bailli
Cranber
ry juice
36.5Kv/cm, 3.3 µs, 22°C 4.6
Raso et al.,
1998a
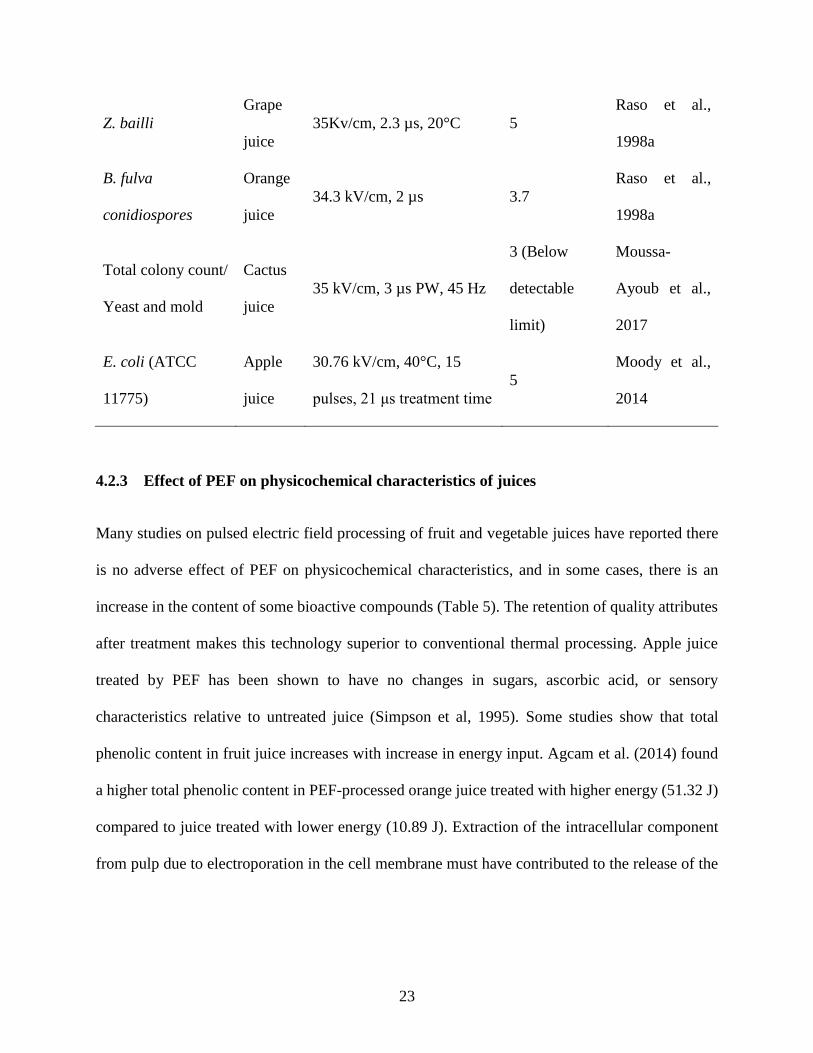
23
Z. bailli
Grape
juice
35Kv/cm, 2.3 µs, 20°C 5
Raso et al.,
1998a
B. fulva
conidiospores
Orange
juice
34.3 kV/cm, 2 µs 3.7
Raso et al.,
1998a
Total colony count/
Yeast and mold
Cactus
juice
35 kV/cm, 3 µs PW, 45 Hz
3 (Below
detectable
limit)
Moussa-
Ayoub et al.,
2017
E. coli (ATCC
11775)
Apple
juice
30.76 kV/cm, 40°C, 15
pulses, 21 μs treatment time
5
Moody et al.,
2014
4.2.3 Effect of PEF on physicochemical characteristics of juices
Many studies on pulsed electric field processing of fruit and vegetable juices have reported there
is no adverse effect of PEF on physicochemical characteristics, and in some cases, there is an
increase in the content of some bioactive compounds (Table 5). The retention of quality attributes
after treatment makes this technology superior to conventional thermal processing. Apple juice
treated by PEF has been shown to have no changes in sugars, ascorbic acid, or sensory
characteristics relative to untreated juice (Simpson et al, 1995). Some studies show that total
phenolic content in fruit juice increases with increase in energy input. Agcam et al. (2014) found
a higher total phenolic content in PEF-processed orange juice treated with higher energy (51.32 J)
compared to juice treated with lower energy (10.89 J). Extraction of the intracellular component
from pulp due to electroporation in the cell membrane must have contributed to the release of the

24
phenolic compound after PEF treatment; it is evident that higher energy input leads to a
correspondingly higher number of pores.
Leong et al. (2015) studied changes in the bioactive compounds of grape juice after PEF
treatment (1.5 kV/cm, 20 µs pulse width, 50 Hz, and 243/1033 pulses). The authors found that
PEF treatments increase the total vitamin C, anthocyanin content, phenolic compounds, and
antioxidant capacity in grape juice. The same authors also observed that higher pulse numbers can
enhance extraction of anthocyanin, phenolic compounds, and antioxidants better than low pulse
numbers, but observed the opposite result for vitamin C. Degradation of heat-sensitive vitamin C
might be due to the increased generation of heat over a higher number of pulses.
Table 5. Effect of PEF on physicochemical characteristics of juice.
Bioactive
compounds
Media PEF conditions
Retention
(%)
References
Total carotenoids
Orange
juice
35 kV/cm, 750 µs 90.67
Sánchez-
Moreno et al.,
2005
L-ascorbic acid
Orange
juice
35 kV/cm, 750 µs 93.01
Sánchez-
Moreno et al.,
2005
Total flavanones
Orange
juice
400 MPa, 1 min, 40°C >100
Sánchez-
Moreno et al.,
2005

25
Beta carotene
Fresh
orange-
carrot
blend
25-40 kV/cm, 60 µs >100
Torregrosa et
al., 2001
Total phenolic
compounds
Orange
juice
25.26 kV/cm, 1206 µs
treatment time
>100
Agcam et al.,
2014
Total anthocyanin
Blueberry
juice
5 kV/cm, 10 kJ/kg
>100 (60%
increase)
Bobinaitė et al.,
2015
Anthocyanin
(malvidin-3-O-
glucoside)
Grape
juice
1.5 kV/cm, 20 μs pulse
width, 50 Hz, 1033 pulses
>100
(146%
increase)
Leong et al.,
2016
Ascorbic acid
Orange-
Milk
beverage
15 kV/cm, 40 µs 34.5°C
97.6 %
retention
Zulueta et al.,
2010
Lycopene
Tomato
juice
35 kV/cm, 4 µs PW, 100
Hz
9.05
increase
Odriozola-
Serrano et al.,
2009
Beta carotene
Tomato
juice
35 kV/cm, 4 µs PW, 100
Hz
27.5
increase
Odriozola-
Serrano et al.,
2010
26
4.3 Power ultrasound
Ultrasound processing is a relatively new technique for pasteurizing liquid food. This technology
has been adopted for extraction of bioactive compounds from food, but it has also shown promising
results in microbial inactivation. The combination of ultrasound with other hurdles has proved to
be very effective in microbial inactivation; ultrasound can be effectively combined with pressure,
temperature, and antimicrobials. Thermo-sonication combines the effects of ultrasound and heat,
resulting in better inactivation than the use of heat alone. Low processing times, higher throughput,
and low energy consumption are some advantages of ultrasound over conventional thermal
processing (Zenker et al., 2003).
4.3.1 Power ultrasound and how it works
In ultrasound processing, transducers of an ultrasound device convert electrical energy to sound
energy; this sound energy is responsible for the production of ultrasonic waves. When these
ultrasonic waves propagate in a liquid medium, small bubbles form and collapse thousands of
times per second (Figure 3). This phenomenon is called cavitation, and is characterized by a series
of compression and rarefaction cycles (Sala et al., 1995; Feng, 2008; Soria and Villamiel, 2010).
Over time there will be an increase in the bubbles’ size characterized by regular shocks between
molecules, which are responsible for the rise of both temperature and pressure (Sala et al., 1995).
Cavitation generates microcurrents which can catalyze chemical reactions and disrupt microbial
cells, leading to the formation of wrinkles, ruptures, and perforation, ultimately causing cell death
(Barbosa-Cánovas and Rodríguez, 2002; Ugarte-Romero et al., 2006).

27
Figure 3. Cavitation in ultrasound (a) Bubble formation; (b) Bubble growth; (c) Bubble collapse (Source:
Abdullah and Chin, 2014).
4.3.2 Microbiological inactivation by ultrasound
Microbial inactivation by ultrasound depends on the types of microorganism present, the chosen
processing parameters, and the type of medium (Cheng et al., 2007). Inactivation is mainly
attributed to thinning of cell membranes, rise in temperature, generation of microcurrents, and
development of pressure gradient. The production of free radicals during cavitation is a minor
additional factor responsible for the lethal effect of US (Gould, 1995).
The efficacy of US treatment depends on the features of the targeted microbes. For
example, the cell membranes of gram-positive bacteria are more rigid than those of gram-negative
bacteria; this rigidity makes them more vulnerable to US. Aerobic microorganisms are more
susceptible than anaerobic species, and spores are the most resistant to this treatment (Gould, 1995;
Manas and Pagán, 2004). US has been shown to be less effective in spore reduction; ultrasound
treatment of 600 W, 20 kHz, 44°C, 95.2 µm for 30 min was unable to achieve any inactivation
28
of A. acidoterrestris spores in apple juice, while under the same conditions, there was a 2.8 log
reduction in S. cerevisiae (Ferrario et al., 2015).
As it is well-known, many parameters and their combinations affect the degree of
cavitation. Thus, according to Adekunte et al. (2010), when it comes to yeast, which has more rigid
cells compared to bacteria, inactivation rates are enhanced at higher ultrasound intensities. Based
on Moody et al. (2013), pulsed treatment is considered to be more efficient over short terms (15
min) than continuous treatment at 50ºC; however, after this period, both treatments reach the same
log reduction. An increase of 10ºC in the processing temperature could accomplish complete
inactivation in 5 min, regardless the treatment mode, either continuous or pulsed. Salleh-Mack and
Roberts (2007) state that pasteurization of juice that is higher in soluble solids requires a longer
treatment time to achieve 5 log reductions, as sugar and salt have some protective effects. To
minimize the effect of high solute concentrations, an increase in temperature during processing
should be considered.
The use of other preservation factors such as pH, antimicrobials, and temperature may act
synergistically with ultrasound to inactivate microorganisms (Table 6). When ultrasound is used
at mild temperature, efficient inactivation can be achieved by the combined effect of ultrasound
and heat; it shows a synergistic effect in microbial load reduction (Piyasena et al., 2003). Wordon
et al. (2012) found a significant decrease in the D-value of S. cerevisiae by ultrasound processing
at 60°C (D-value 0.73 min) compared to treatment with temperature alone (D-value 3.53 min) and
ultrasound alone (D-value 3.1 min). Ultrasound combined with mild temperature is effective
against foodborne pathogens including E. coli (Salleh-Mack and Roberts, 2007). Lee et al. (2009)
studied the inactivation of E. coli K12 using ultrasound combined with heat and/or pressurization,

29
and observed that combination of US with increased temperature and/or pressure significantly
reduced the time required to achieve a 5 log reduction.
Table 6. Microbial inactivation in juices by Ultrasound.
Microorganisms Media Ultrasound conditions
Log
Reduction
References
Saccharomyces
cerevisiae
Grape
juice
24 kHz, 120 μm, 60°C,
10 min
7
Bermúdez-Aguirre and
Barbosa-Cánovas,
2012
E. coli (ATCC
11775)
Apple
juice
24 kHz, 120 μm, 60°C,
5 min
7 (complete
inactivation)
Moody et al., 2014
E. coli 0157:H7
Blueberry
juice
700 W, 60 °C, 10 min 5.1 Zhu et al., 2017
Saccharomyces
cerevisiae
Apple
juice
600 W, 20 kHz, 44°C,
95.2 μm
2.8 Ferrario et al., 2015
Aerobic
mesophilic count
Orange
juice
20 kHz, 89.25 µm, 8
min
1.38
Gómez-López et al.,
2010
Total plate count
and
Enterobacteria
Cactus
pear juice
1500 W, 20 kHz, 80%
amplitude, 63.4C 15
min,
4 (Below the
detection
limit)
Zafra-Rojas et al.,
2013
E. coli K12
Apple
cider
20 kHz, 3 W/mL, 3.8
min, 59°C
5 Lee et al., 2013

30
L.
monocytogenes
0.85%
NaCl
22.3 kHz, 1.43 W/mL,
10 min, 37°C
5
Ugarte-Romero et al.,
2007
4.3.3 Effect of ultrasound on physicochemical characteristics of juices
Ultrasound treatment has shown to preserve the physicochemical qualities of treated juice (Table
7). These effects may be related to cavitation-promoted degassing removing oxygen from the
medium (Bermudez-Aguirre and Barbosa-Cánovas, 2012). Some controversy remains on this
point due to factors including food matrix diversity, and differences in processing conditions and
energy input.
Aadil et al. (2013) reported a significant increase in the ascorbic acid content of apple juice
after sonication for 60 or 90 min; treatment for shorter times had no significant effect on its
ascorbic acid content. In contrast, Santhirasegaram et al. (2013) found that mango juice processed
either by sonication or thermal treatment had a significantly decreased ascorbic acid content
compared to an untreated control. Thus, it is important to consider that the food matrix, as well as
the processing parameters, has a significant influence on the final product obtained. Studies
conducted by Cheng et al. (2007) has observed that samples of guava juice after carbonation and/or
sonication show the highest percentage of ascorbic acid. In that study, researchers incorporated
dry ice during carbonation, which leads to a decline in temperature, preventing ascorbic acid
degradation (a temperature-dependent reaction). Likewise, sonication can remove dissolved
oxygen, responsible for catalyzing another degradation pathway, from the medium.
Abid et al. (2013) also observed a significant increase in total phenolic content in sonicated
apple juice treated for 60 and 90 min. Similarly, Santhirasegaram et al. (2013) and Bhat et al.
31
(2011) respectively, in their studies of sonicated mango juice and kasturi lime juice found
enhancement in the content of phenolic compounds when sonication was applied. The increase in
the percentage of the phenolic compound during sonication might be related to disruption of
biological cell walls, promoting the release of cell contents due to cavitational collapse around
colloidal particles. This outcome could also be caused by reactions between hydroxyl radicals
generated during sonication and the aromatic ring of polyphenols (Ashokkumar et al., 2008; Zafra-
Rojas et al., 2013). A slump in the phenolic content could take place once cavitational bubbles
filled with water vapor or gases (such as oxygen) dissolve in the fluid; their inclusion might
contribute to the oxidative degradation of phenolic compounds. Therefore, these results emphasize
that food matrix and processing conditions are important for sonication performance (Fonteles et
al., 2012).
Retention of phenolic compounds also depends on the processing time. Rawson et al.
(2011) found that processing times <6 min did not have much effect on phenol degradation, but
over longer processing times higher degradation was observed. For example, in the US processing
of watermelon juice a treatment time of 2 min yielded 83% retention of phenolic compounds, and
after a processing time of 10 min only 42% retention was observed.
Previous studies have shown an increase (P<0.05) in the carotenoid content of apple juice
after sonication treatments of 30 and 60 min, possibly due to mechanical disruption of cell walls,
but in at least one study, sonication did not reveal significant (P>0.05) differences as compared to
untreated juice samples (Abid et al., 2014).
Many studies on the effect of ultrasound on anthocyanin show that there is either 100%
retention or an increase in the content of free anthocyanin. A study conducted by Golmohamadi et

32
al. (2013) indicates that the total monomeric anthocyanin content of red raspberry puree rose by
12.6% after ultrasound treatment (400 W, 20 kHz, 10 min); this increment in ultrasound decreases
with increase in frequency. The same authors found a 6.7% increase in total monomeric
anthocyanin content when the frequency was increased from 20 kHz to 490 kHz.
Table 7. Effect of ultrasound on juice physiochemical characteristics.
Bioactive
compounds
Media Ultrasound conditions
Retention
(%)
References
Ascorbic acid
Carrot
juice
20 kHz, 100 W, 15 min,
<30°C
94
Khandpur et al.,
2015
Ascorbic acid
Tomato
juice
20 kHz, 61 µm, 10 min,
32-45°C, 10 min
67
Adekunte et al.,
2010
Total phenolic Pear juice
20 kHz, 750 W, 65°C,
10 min
94
Saeeduddin et al.,
2015
Antioxidant
capacity
Pear juice
21 kHz, 750 W, 65°C,
10 min
86
Saeeduddin et al.,
2015
Chelating activity
Cactus
pear juice
20 kHz, 1500 W, 80%
amplitude, 25 min
67
Zafra-Rojas et al.,
2013
Ascorbic acid
Orange
juice
1500 W, 20 kHz, 25°C,
10 min
95 Tiwari et al., 2009
Total monomeric
anthocyanin
Red
raspberry
puree
20 kHz, 10 min
>100 (12.6%
increase)
Golmohamadi et
al., 2013

33
Total phenolic
content
Water
melon
juice
1500 W, 20 kHz, 61 μm,
2 min
83.23
Rawson et al.,
2011
Total flavonoids
Apple
juice
25 kHz, 20ºC, 70%
Amplitude, 30 min
>100 (4.22
% increase)
Abid et al., 2013
4.4 Combination of processes
Several of these treatments can stand alone, but their use in various combinations has been
investigated, and is often more effective. As has been alluded in earlier sections, synergy has been
shown between a variety of factors, including pressure, temperature, ultrasound, and addition of
antimicrobial agents such as nisin. A discussion of some combinations of those technologies
follows.
4.4.1 Ultrasound and high pressure processing
The combination of ultrasound and high pressure processing has shown promising results for
microbial inactivation in fresh liquid products (Feng, 2011). The schematic diagram of this type
of combination is shown in Figure 4. This combination, mano-sonication (MS), uses ultrasound at
moderate pressures, lower than those commonly used in high pressure processing (<600 kPa).
When these treatments are combined, processing can occur at room temperature. When ultrasound
is used without pressure, processing at room temperature is not very effective (Raso et al., 1998b).
Pagán et al. (1999a) observed a significant increase in the inactivation rate of L.
monocytogenes when ultrasound was combined with a pressure of 200 kPa as compared to ambient

34
pressure. As the cavitation phenomenon is intensified at higher pressure the effectiveness of
ultrasound processing increases with an increase in pressure. There are very few studies of the
synergistic effect of combining ultrasound and pressure. Feng et al. (2011) found no synergistic
effect of these two parameters, but did find an additive effect (Pagán et al., 1999b). Although no
synergism was observed in the combination of ultrasound and high pressure, synergisms was
observed in the case of combining ultrasound, pressure, and temperature (Feng et al., 2011,
Demirci and Ngadi, 2012).
Application of pressure with ultrasound significantly reduces the processing time required
to inactive microorganisms. Ultrasound alone is not very effective, and pressure alone is a
comparatively expensive process due the equipment and operating costs to maintain high pressure
(>400 MPa). Their combination, however, can be industrialized for lower-cost pasteurization of
fresh juice, with the added advantage of increased extraction of intracellular components. The
combination can also prevent the separation of binary juice blends in the bottles after processing,
as ultrasound homogenizes and HPP pasteurizes.

35
Figure 4. Combination of ultrasound and pressure (Source: Lee et al., 2009).
4.4.2 Ultrasound and pulsed electric fields
Ultrasound is a very flexible technology; it can be used for different purposes. Ultrasound can be
used in milk homogenization, and the homogenized milk can be pasteurized by pulsed electric
field. The microbial load will be reduced by ultrasound as well, and the remaining load will be
inactivated by PEF. Ultrasound injures microbial cells during cavitation, making them vulnerable
to inactivation by PEF. Furthermore, US-homogenized milk is easier to process by PEF as the size
of the fat globules is reduced allowing smooth flow in the PEF chamber with less chance of sparks
due to dielectric breakdown.
Combining PEF and mano-thermo-sonication for inactivation of Listeria innocua caused
only an additive effect, as the sum of individual effects was not significantly (p>0.05) different
than the combined effect (Palgan et al., 2012). Although no synergism was observed in the

36
microbial inactivation by combining PEF and ultrasound, this combination could result in
synergism in the extraction of bioactive compounds from plant cells, as ultrasound and PEF break
down cells by different mechanisms, which could result in higher extraction. Synergism in the
combination of these technologies could potentially be achieved by the incorporation of other
stress factors, and the combination of these technologies has industrial potentials in
homogenization of milk as well as in the extraction of bioactive compounds.
5. Final remarks
Nonthermal technologies such as HPP, PEF, and US have proven to be effective methods for
microbial load reduction in fruit and vegetable juices with minimal or no impact on bioactive
compounds. Of the three technologies discussed, HPP is already commercialized in the food and
beverage processing industries. PEF has been used at the industrial level for juice processing as
well as for extraction of bioactive compounds and to create pores in tissues in order to facilitate
other processes such as dehydration. Microbial inactivation in juice by PEF can be further
enhanced by the incorporation of other stress factors making the overall process quite efficient.
Ultrasound technology has not yet been commercialized for juice pasteurization purposes,
although it has been used in applications including extraction of intracellular components and pre-
treatment.
Even though HPP and PEF are commercialized in the food industry, there is still much to
do to make them more efficient, i.e. to reduce processing costs and increase throughput. PEF and
ultrasound applied alone often may not lead to the desired levels of inactivation in some juices.
For this reason, in some cases, these technologies need to be combined with other hurdles such as
mild temperature or addition of natural antimicrobials. Synergistic inactivation of microorganisms
37
can be achieved when these technologies are combined with other hurdles. For example,
incorporation of mild temperature with PEF could result in desired reductions of target
microorganisms at sub-lethal temperatures in fractions of a second, whereas temperature alone or
PEF alone could not render these results. More studies need to be carried out on the combination
of HPP, PEF, or US on the processing of juices. The effect of antimicrobials at different
temperatures is another area where it needs in-depth study for the processing of juices.
Validation studies need to be carried out to determine the feasibility of combining these
nonthermal technologies with other hurdles on an industrial scale. There is great potential in the
beverage processing industry to develop premium products with enhanced nutritional benefits by
applying these nonthermal processing methods.

38
References
Aadil, R. M., Zeng, X., Han, Z., & Sun, D. (2013). Effects of ultrasound treatments on quality of
grapefruit juice. Food Chemistry, 141(3), 3201-3206.
Abdullah, N., & Chin, N. L. (2014). Application of thermosonication treatment in processing and
production of high quality and safe-to-drink fruit juices. Agriculture and Agricultural
Science Procedia, 2, 320-327.
Abid, M., Jabbar, S., Wu, T., Hashim, M. M., Hu, B., Lei, S. & Zeng, X (2014). Sonication
enhances polyphenolic compounds, sugars, carotenoids and mineral elements of apple
juice. Ultrasonics Sonochemistry, 21, 93-97.
Abid, M., Jabbar, S., Wu, T., Hashim, M. M., Hu, B., Lei, S., ... & Zeng, X. (2013). Effect of
ultrasound on different quality parameters of apple juice. Ultrasonics
Sonochemistry, 20(5), 1182-1187.
Adekunte, A. O., Tiwari, B. K., Cullen, P. J., Scannell, A. G. M., & O’Donnell, C. P. (2010). Effect
of sonication on colour, ascorbic acid and yeast inactivation in tomato juice. Food
Chemistry, 122(3), 500-507.
Agcam, E., Akyıldız, A., & Evrendilek, G. A. (2014). Comparison of phenolic compounds of
orange juice processed by pulsed electric fields (PEF) and conventional thermal
pasteurisation. Food Chemistry, 143, 354-361.
Alpas, H. (2013). Effect of high hydrostatic pressure processing (HHP) on quality properties,
squeezing pressure effect and shelf life of pomegranate juice. Current Opinion in
Biotechnology, (24), S111.

39
Altunakar, B. (2007). Food Preservation by Pulsed Electric Fields and Selected Antimicrobials.
(Doctoral dissertation, Washington State University, USA).
Andrés, V., Villanueva, M. J., & Tenorio, M. D. (2016). The effect of high-pressure processing on
colour, bioactive compounds, and antioxidant activity in smoothies during refrigerated
storage. Food Chemistry, 192, 328-335.
Ashokkumar, M., Sunartio, D., Kentish, S., Mawson, R., Simons, L., Vilkhu, K., & Versteeg, C.
K. (2008). Modification of food ingredients by ultrasound to improve functionality: a
preliminary study on a model system. Innovative Food Science and Emerging
Technologies, 9(2), 155-160.
Barba, F. J., Esteve, M. J., & Frigola, A. (2013). Physicochemical and nutritional characteristics
of blueberry juice after high pressure processing. Food Research International, 50(2), 545-
549.
Barbosa-Cánovas, G. V., & Rodríguez, J. J. (2002). Update on nonthermal food processing
technologies: Pulsed electric field, high hydrostatic pressure, irradiation and ultrasound.
Food Australia, 54(11), 513-520.
Bermúdez-Aguirre, D., & Barbosa-Cánovas, G. V. (2012). Inactivation of Saccharomyces
cerevisiae in pineapple, grape and cranberry juices under pulsed and continuous thermo-
sonication treatments. Journal of Food Engineering, 108(3), 383-392.
Bhat, R., Kamaruddin, N. S. B. C., Min-Tze, L., & Karim, A. A. (2011). Sonication improves
kasturi lime (Citrus microcarpa) juice quality. Ultrasonics Sonochemistry, 18(6), 1295-
1300.

40
Bobinaitė, R., Pataro, G., Lamanauskas, N., Šatkauskas, S., Viškelis, P., & Ferrari, G. (2015).
Application of pulsed electric field in the production of juice and extraction of bioactive
compounds from blueberry fruits and their by-products. Journal of Food Science and
Technology, 52(9), 5898-5905.
Buzrul, S., Alpas, H., Largeteau, A., & Demazeau, G. (2008). Inactivation of Escherichia coli and
Listeria innocua in kiwifruit and pineapple juices by high hydrostatic
pressure. International Journal of Food Microbiology, 124(3), 275-278.
CDC. (2015). Foodborne Outbreak Online Database (FOOD).
http://wwwn.cdc.gov/foodborneoutbreaks/Default.aspx. Accessed February 4, 2016
Chaikham, P., & Apichartsrangkoon, A. (2012). Comparison of dynamic viscoelastic and
physicochemical properties of pressurised and pasteurised longan juices with xanthan
addition. Food Chemistry, 134(4), 2194-2200.
Chen, D., Xi, H., Guo, X., Qin, Z., Pang, X., Hu, X., ... & Wu, J. (2013). Comparative study of
quality of cloudy pomegranate juice treated by high hydrostatic pressure and high
temperature short time. Innovative Food Science and Emerging Technologies, 19, 85-94.
Cheng, L. H., Soh, C. Y., Liew, S. C., & Teh, F. F. (2007). Effects of sonication and carbonation
on guava juice quality. Food Chemistry, 104(4), 1396-1401.
Cheng, L., Soh, C., Liew, S., & Teh, F. (2007). Effects of sonication and carbonation on guava
juice quality. Food Chemistry, 104(4), 1396-1401.

41
Chung, H. J., & Yousef, A. E. (2010). Synergistic effect of high pressure processing and
Lactobacillus casei antimicrobial activity against pressure resistant Listeria
monocytogenes. New Biotechnology, 27(4), 403-408.
Cserhalmi, Z., Vidács, I., Beczner, J., & Czukor, B. (2002). Inactivation of Saccharomyces
cerevisiae and Bacillus cereus by pulsed electric fields technology. Innovative Food
Science and Emerging Technologies, 3(1), 41-45.
D’Amico, D. J., Silk, T. M., Wu, J. and Guo, M. (2006). Inactivation of microorganisms in milk
and apple cider treated with ultrasound. Journal of Food Protection, 69, 556–563.
da Rocha Ferreira, E. H., Rosenthal, A., Calado, V., Saraiva, J., & Mendo, S. (2009).
Byssochlamys nivea inactivation in pineapple juice and nectar using high pressure
cycles. Journal of Food Engineering, 95(4), 664-669.
Demirci, A., & Ngadi, M. O. (Eds.). (2012). Microbial decontamination in the food industry:
Novel methods and applications. Elsevier.
Elez-Martinez, P., Escolà-Hernández, J., Soliva-Fortuny, R. C., & Martín-Belloso, O. (2005).
Inactivation of Lactobacillus brevis in orange juice by high-intensity pulsed electric fields.
Food Microbiology, 22(4), 311-319.
Evrendilek, G. A., Jin, Z. T., Ruhlman, K. T., Qiu, X., Zhang, Q. H., & Richter, E. R. (2000).
Microbial safety and shelf-life of apple juice and cider processed by bench and pilot scale
PEF systems. Innovative Food Science and Emerging Technologies, 1(1), 77-86.
Feng H, Yang W, Hielscher T. (2008). Power ultrasound. Food Science and Technology
International, 14, 433-436.

42
Feng, H., Barbosa-Cánovas, G. V., & Weiss, J. (2011). Ultrasound technologies for food and
bioprocessing (Vol. 1, p. 599). New York: Springer.
Fernández-Sestelo, A., de Saá, R. S., Pérez-Lamela, C., Torrado-Agrasar, A., Rúa, M. L., &
Pastrana-Castro, L. (2013). Overall quality properties in pressurized kiwi purée: Microbial,
physicochemical, nutritive and sensory tests during refrigerated storage. Innovative Food
Science and Emerging Technologies, 20, 64-72.
Ferrari, G., Maresca, P., & Ciccarone, R. (2011). The effects of high hydrostatic pressure on the
polyphenols and anthocyanins in red fruit products. Procedia Food Science, 1, 847-853.
Ferrario, M., Alzamora, S. M., & Guerrero, S. (2015). Study of the inactivation of spoilage
microorganisms in apple juice by pulsed light and ultrasound. Food Microbiology, 46, 635-
642.
Fonteles, T. V., Costa, M. G., Jesus, A. L., Miranda, M. R., Fernandes, F. A., & Rodrigues, S.
(2012). Power ultrasound processing of cantaloupe melon juice: Effects on quality
parameters. Food Research International, 48(1), 41-48.
Golmohamadi, A., Möller, G., Powers, J., & Nindo, C. (2013). Effect of ultrasound frequency on
antioxidant activity, total phenolic and anthocyanin content of red raspberry
puree. Ultrasonics Sonochemistry, 20(5), 1316-1323.
Gómez-López, V. M., Orsolani, L., Martínez-Yépez, A., & Tapia, M. S. (2010). Microbiological
and sensory quality of sonicated calcium-added orange juice. LWT-Food Science and
Technology, 43(5), 808-813.

43
Gould, G. W (1995). New Methods of Food Preservation. Unilever Research Laboratory, 176-
190.
Hager, T. J., Howard, L. R., & Prior, R. L. (2008). Processing and storage effects on monomeric
anthocyanins, percent polymeric color, and antioxidant capacity of processed blackberry
products. Journal of Agricultural and Food Chemistry, 56(3), 689-695.
Hiremath, N. D., & Ramaswamy, H. S. (2012). High‐pressure destruction kinetics of spoilage and
pathogenic microorganisms in mango juice. Journal of Food Processing and
Preservation, 36(2), 113-125.
Jain, S., Bidol, S. A., Austin, J. L., Berl, E., Elson, F., Williams, M. L., ... & Yu, P. A. (2009).
Multistate outbreak of Salmonella Typhimurium and Saintpaul infections associated with
unpasteurized orange juice—United States, 2005. Clinical Infectious Diseases, 48(8),
1065-1071.
Jin, T.Z., Guo, M., and Yang, R. (2014). Combination of pulsed electric field processing and
antimicrobial bottle for extending microbiological shelf-life of pomegranate juice.
Innovative Food Science and Emerging Technologies, 26, 153-158.
Kaşikçi, M. B., & Bağdatlioğlu, N. (2016). High hydrostatic pressure treatment of fruit, fruit
products and fruit juices: a review on phenolic compounds. Journal of Food and Health
Science, 2(1), 27-39.
Khandpur, P., & Gogate, P. R. (2015). Effect of novel ultrasound based processing on the nutrition
quality of different fruit and vegetable juices. Ultrasonics Sonochemistry, 27, 125-136.

44
Knorr, D., Froehling, A., Jaeger, H., Reineke, K., Schlueter, O., & Schoessler, K. (2011a).
Emerging technologies in food processing. Annual Review of Food Science and
Technology, 2, 203-235.
Knorr, D., Reineke, K., Mathys, A., Heinz, V., and Buckow, R. (2011b). High-pressure-induced
effects on bacterial spores, vegetative microorganisms, and enzymes. In Food Engineering
Interfaces (pp. 325-340). Springer New York.
Lado, B. H., & Yousef, A. E. (2002). Alternative food-preservation technologies: efficacy and
mechanisms. Microbes and Infection, 4(4), 433-440.
Lee, H., Kim, H., Cadwallader, K. R., Feng, H., & Martin, S. E. (2013). Sonication in combination
with heat and low pressure as an alternative pasteurization treatment–Effect on Escherichia
coli K12 inactivation and quality of apple cider. Ultrasonics Sonochemistry, 20(4), 1131-
1138.
Lee, H., Zhou, B., Feng, H., & Martin, S. E. (2009). Effect of pH on inactivation of Escherichia
coli K12 by sonication, manosonication, thermosonication, and manothermosonication.
Journal of Food Science, 74(4), 191-198.
Lee, H., Zhou, B., Liang, W., Feng, H., & Martin, S. E. (2009). Inactivation of Escherichia coli
cells with sonication, manosonication, thermosonication, and manothermosonication:
microbial responses and kinetics modeling. Journal of Food Engineering, 93(3), 354-364.
Leong, S. Y., Burritt, D. J., & Oey, I. (2016). Evaluation of the anthocyanin release and health-
promoting properties of Pinot Noir grape juices after pulsed electric fields. Food
Chemistry, 196, 833-841.

45
Liang, Z., Mittal, G.S., and Griffiths, M. W. (2002). Inactivation of Salmonella Typhimurium in
orange juice containing antimicrobial agents by pulsed electric field. Journal of Food
Protection, 65(7), 1081-1087.
Liu, F., Wang, Y., Li, R., Bi, X., & Liao, X. (2014). Effects of high hydrostatic pressure and high
temperature short time on antioxidant activity, antioxidant compounds and color of mango
nectars. Innovative Food Science and Emerging Technologies, 21, 35-43.
Manas, P., & Pagán, R. (2005). Microbial inactivation by new technologies of food
preservation. Journal of Applied Microbiology, 98(6), 1387-1399.
Margosch, D. (2005). Behavior of bacterial endospores and toxins as safety determinants in low
acid pressurized food. (Doctoral dissertation, Technical University Berlin, Germany).
McNamee, C., Noci, F., Cronin, D. A., Lyng, J. G., Morgan, D. J., & Scannell, A. G. M. (2010).
PEF based hurdle strategy to control Pichia fermentans, Listeria innocua and Escherichia
coli K12 in orange juice. International Journal of Food Microbiology, 138(1), 13-18.
Moody, A., Marx, G., Swanson, B. G., & Bermúdez-Aguirre, D. (2014). A comprehensive study
on the inactivation of Escherichia coli under nonthermal technologies: High hydrostatic
pressure, pulsed electric fields and ultrasound. Food Control, 37, 305-314.
Mosqueda-Melgar, J., Raybaudi-Massilia, R. M., & Martin-Belloso, O. (2008). Combination of
high-intensity pulsed electric fields with natural antimicrobials to inactivate pathogenic
microorganisms and extend the shelf-life of melon and watermelon juices. Food
Microbiology, 25(3), 479-491.

46
Moussa-Ayoub, T. E., Jäger, H., Knorr, D., El-Samahy, S. K., Kroh, L. W., & Rohn, S. (2017).
Impact of pulsed electric fields, high hydrostatic pressure, and thermal pasteurization on
selected characteristics of Opuntia dillenii cactus juice. LWT-Food Science and
Technology, 79, 534-542.
Munoz, M., de Ancos, Begoña., & Cano, M. P. (2007). Effects of high pressure and mild heat on
endogenous microflora and on the inactivation and sublethal injury of Escherichia coli
inoculated into fruit juices and vegetable soup. Journal of Food Protection, 70(7), 1587-
1593.
Nguyen, P., and Mittal, G.S. (2007). Inactivation of naturally occurring microorganisms in tomato
juice using pulsed electric field (PEF) with and without antimicrobials. Chemical
Engineering and Processing: Process Intensification, 46(4), 360-365.
Odriozola-Serrano, I., Soliva-Fortuny, R., Hernández-Jover, T., & Martín-Belloso, O. (2009).
Carotenoid and phenolic profile of tomato juices processed by high intensity pulsed electric
fields compared with conventional thermal treatments. Food Chemistry, 112(1), 258-266.
Pagán, R., Manas, P., Alvarez, I., & Condón, S. (1999a). Resistance of Listeria monocytogenes to
ultrasonic waves under pressure at sublethal (manosonication) and lethal
(manothermosonication). Food Microbiology, 16(2), 139-148.
Pagán, R., Manas, P., Raso, J., & Condón, S. (1999b). Bacterial resistance to ultrasonic waves
under pressure at nonlethal (manosonication) and lethal (manothermosonication)
temperatures. Applied and Environmental Microbiology, 65(1), 297-300.
Patras, A., Brunton, N. P., Da Pieve, S., & Butler, F. (2009). Impact of high pressure processing
on total antioxidant activity, phenolic, ascorbic acid, anthocyanin content and colour of

47
strawberry and blackberry purées. Innovative Food Science and Emerging
Technologies, 10(3), 308-313.
Patterson, M. F., McKay, A. M., Connolly, M., & Linton, M. (2012). The effect of high hydrostatic
pressure on the microbiological quality and safety of carrot juice during refrigerated
storage. Food Microbiology, 30(1), 205-212.
Pilavtepe‐Çelik, M. (2013). High hydrostatic pressure (HHP) inactivation of foodborne pathogens
in low‐acid juices. International Journal of Food Science & Technology, 48(4), 673-677.
Piyasena, P., Mohareb, E., & McKellar, R. C. (2003). Inactivation of microbes using ultrasound:
a review. International Journal of Food Microbiology, 87(3), 207-216.
Raso, J., Calderón, M. L., Góngora, M., Barbosa‐Cánovas, G. V., & Swanson, B. G. (1998a).
Inactivation of Zygosaccharomyces bailii in fruit juices by heat, high hydrostatic pressure
and pulsed electric fields. Journal of Food Science, 63(6), 1042-1044.
Raso, J., Pagan, R., Condon, S., & Sala, F. J. (1998b). Influence of temperature and pressure on
the lethality of ultrasound. Applied and Environmental Microbiology, 64(2), 465-471.
Rawson, A., Patras, A., Tiwari, B. K., Noci, F., Koutchma, T., & Brunton, N. (2011). Effect of
thermal and nonthermal processing technologies on the bioactive content of exotic fruits
and their products: Review of recent advances. Food Research International, 44(7), 1875-
1887.
Rawson, A., Tiwari, B. K., Patras, A., Brunton, N., Brennan, C., Cullen, P. J., & O'Donnell, C.
(2011). Effect of thermosonication on bioactive compounds in watermelon juice. Food
Research International, 44(5), 1168-1173.

48
Saeeduddin, M., Abid, M., Jabbar, S., Wu, T., Hashim, M. M., Awad, F. N., ... & Zeng, X. (2015).
Quality assessment of pear juice under ultrasound and commercial pasteurization
processing conditions. LWT-Food Science and Technology, 64(1), 452-458.
Sala, F. J., Burgos, J., Condon, S., Lopez, P., & Raso, J. (1995). Effect of heat and ultrasound on
microorganisms and enzymes. In New Methods of Food Preservation (pp. 176-204).
Springer US.
Sánchez-Moreno, C., Plaza, L., Elez-Martínez, P., De Ancos, B., Martín-Belloso, O., & Cano, M.
P. (2005). Impact of high pressure and pulsed electric fields on bioactive compounds and
antioxidant activity of orange juice in comparison with traditional thermal
processing. Journal of Agricultural and Food Chemistry, 53(11), 4403-4409.
Santhirasegaram, V., Razali, Z., & Somasundram, C. (2013). Effects of thermal treatment and
sonication on quality attributes of Chokanan mango (Mangifera indica L.)
juice. Ultrasonics Sonochemistry, 20(5), 1276-1282.
Shamsi, K. (2008). Effects of pulsed electric field processing on microbial, enzymatic and physical
attributes of milk and the rennet-induced milk gels. RMIT University, Melbourne, Australia
(December 2008, PhD thesis).
Simpson, M. V., Barbosa-Cánovas, G. V. and Swanson, B. G. (1995). The Combined inhibitory
effect of lysozyme and high voltage pulsed electric fields on the growth of Bacillus subtilis
spores. IFT Annual Meeting: Book of Abstracts. 267.
Sokołowska, B., Skąpska, S., Fonberg-Broczek, M., Niezgoda, J., Chotkiewicz, M., Dekowska,
A., and Rzoska, S. (2012). The combined effect of high pressure and nisin or lysozyme on

49
the inactivation of Alicyclobacillus acidoterrestris spores in apple juice. High Pressure
Research, 32(1), 119-127.
Soria, A. C., & Villamiel, M. (2010). Effect of ultrasound on the technological properties and
bioactivity of food: A review. Trends in Food Science and Technology, 21(7), 323-331.
Syed, Q. A., Buffa, M., Guamis, B., & Saldo, J. (2013). Lethality and injuring the effect of
compression and decompression rates of high hydrostatic pressure on Escherichia coli
O157:H7 in different matrices. High Pressure Research, 33(1), 64-72.
Syed, Q. A., Reineke, K., Saldo, J., Buffa, M., Guamis, B., & Knorr, D. (2012). Effect of
compression and decompression rates during high hydrostatic pressure processing on
inactivation kinetics of bacterial spores at different temperatures. Food Control, 25(1),
361-367.
Timmermans, R. A. H., Mastwijk, H. C., Knol, J. J., Quataert, M. C. J., Vervoort, L., Van der
Plancken, I., ... & Matser, A. M. (2011). Comparing equivalent thermal, high pressure and
pulsed electric field processes for mild pasteurization of orange juice. Part I: Impact on
overall quality attributes. Innovative Food Science & Emerging Technologies, 12(3), 235-
243.
Tiwari, B. K., O'Donnell, C. P., Muthukumarappan, K., & Cullen, P. J. (2009). Ascorbic acid
degradation kinetics of sonicated orange juice during storage and comparison with
thermally pasteurised juice. LWT-Food Science and Technology, 42(3), 700-704.
Tola, Y. B., & Ramaswamy, H. S. (2014). Combined effects of high pressure, moderate heat and
pH on the inactivation kinetics of Bacillus licheniformis spores in carrot juice. Food
Research International, 62, 50-58.

50
Torregrosa, F., Cortés, C., Esteve, M. J., & Frígola, A. (2005). Effect of high-intensity pulsed
electric fields processing and conventional heat treatment on orange− carrot juice
carotenoids. Journal of Agricultural and Food Chemistry, 53(24), 9519-9525.
Ugarte‐Romero, E., Feng, H., & Martin, S. E. (2007). Inactivation of Shigella boydii 18 IDPH and
Listeria monocytogenes Scott A with power ultrasound at different acoustic energy
densities and temperatures. Journal of Food Science, 72(4).
Ugarte‐Romero, E., Feng, H., Martin, S. E., Cadwallader, K. R., & Robinson, S. J. (2006).
Inactivation of Escherichia coli with power ultrasound in apple cider. Journal of Food
Science, 71(2).
Varela-Santos, E., Ochoa-Martinez, A., Tabilo-Munizaga, G., Reyes, J. E., Pérez-Won, M.,
Briones-Labarca, V., & Morales-Castro, J. (2012). Effect of high hydrostatic pressure
(HHP) processing on physicochemical properties, bioactive compounds and shelf-life of
pomegranate juice. Innovative Food Science and Emerging Technologies, 13, 13-22.
Voldřich, M., Dobiáš, J., Tichá, L., Čeřovský, M., & Krátká, J. (2004). Resistance of vegetative
cells and ascospores of heat resistant mould Talaromyces avellaneus to the high pressure
treatment in apple juice. Journal of Food Engineering, 61(4), 541-543.
Vega-Mercado, H., Pothakamury, U. R., Chang, F. J., Barbosa-Cánovas, G. V., & Swanson, B. G.
(1996). Inactivation of Escherichia coli by combining pH, ionic strength and pulsed electric
fields hurdles. Food Research International, 29(2), 117-121.
Weemaes, C. A., Ludikhuyze, L. R., Van den Broeck, I., Hendrickx, M. E., & Tobback, P. P.
(1998). Activity, electrophoretic characteristics and heat inactivation of

51
polyphenoloxidases from apples, avocados, grapes, pears and plums. LWT-Food Science
and Technology, 31(1), 44-49.
Winter, R., and Jeworrek, C. (2009). Effect of pressure on membranes. Soft Matter, 5(17), 3157-
3173.
Wolbang, C. M., Fitos, J. L., & Treeby, M. T. (2008). The effect of high pressure processing on
nutritional value and quality attributes of Cucumis melo L. Innovative Food Science and
Emerging Technologies, 9(2), 196-200.
Wordon, B. A., Mortimer, B., & McMaster, L. D. (2012). Comparative real-time analysis of
Saccharomyces cerevisiae cell viability, injury and death induced by ultrasound (20 kHz)
and heat for the application of hurdle technology. Food Research International, 47(2), 134-
139.
Wu, J. (2014). Eggs and egg products processing. Food Processing: Principles and Applications,
Second Edition, 437-455.
Xi, J., Shen, D., Zhao, S., Lu, B., Li, Y., & Zhang, R. (2009). Characterization of polyphenols
from green tea leaves using a high hydrostatic pressure extraction. International Journal
of Pharmaceutics, 382(1), 139-143.
Yu, Y., Xu, Y., Wu, J., Xiao, G., Fu, M., & Zhang, Y. (2014). Effect of ultra-high pressure
homogenisation processing on phenolic compounds, antioxidant capacity and anti-
glucosidase of mulberry juice. Food Chemistry, 153, 114-120.

52
Yuste, J., Capellas, M., Pla, R., Fung, D. Y., & Mor‐Mur, M. (2001). High pressure processing for
food safety and preservation: a review. Journal of Rapid Methods and Automation in
Microbiology, 9(1), 1-10.
Zafra-Rojas, Q. Y., Cruz-Cansino, N., Ramírez-Moreno, E., Delgado-Olivares, L., Villanueva-
Sánchez, J., & Alanís-García, E. (2013). Effects of ultrasound treatment in purple cactus
pear (Opuntia ficus-indica) juice. Ultrasonics Sonochemistry, 20(5), 1283-1288.
Zenker, M., Heinz, V., & Knorr, D. (2003). Application of ultrasound-assisted thermal processing
for preservation and quality retention of liquid foods. Journal of Food Protection, 66(9),
1642-1649.
Zhang, Q. H., Barbosa-Cánovas, G. V., & Swanson, B. G. (1995). Engineering aspects of pulsed
electric field pasteurization. Journal of Food Engineering, 25, 261-281.
Zhu, J., Wang, Y., Li, X., Li, B., Liu, S., Chang, N., ... & Meng, X. (2017). Combined effect of
ultrasound, heat, and pressure on Escherichia coli O157:H7, polyphenol oxidase activity,
and anthocyanins in blueberry (Vaccinium corymbosum) juice. Ultrasonics
Sonochemistry, 37, 251-259.
Zimmermann, M., Schaffner, D. W., & Aragão, G. M. (2013). Modeling the inactivation kinetics
of Bacillus coagulans spores in tomato pulp from the combined effect of high pressure and
moderate temperature. LWT-Food Science and Technology, 53(1), 107-112.
Zimmermann, U. (1986) Electrical breakdown, electropermeabilization and electrofusion. Reviews
of Physiology, Biochemistry and Pharmacology 105, 175-256.

53
Zulueta, A., Esteve, M. J., & Frígola, A. (2010). Ascorbic acid in orange juice–milk beverage
treated by high intensity pulsed electric fields and its stability during storage. Innovative
Food Science and Emerging Technologies, 11(1), 84-90.

54
CHAPTER TWO
ENGINEERING ASPECTS OF NOVEL TECHNOLOGIES FOR BEVERAGE
PROCESSING
1. Introduction
Lately, consumers have shown increased demand for preservative-free food of high quality with
fresh-like attributes. Consumer lifestyles have shifted towards increased consumption of raw and
unprocessed foods, while at the same time, the consumption of raw food has been linked to
outbreaks of food-borne illnesses. The shift in consumer demand toward more natural foods is
likely linked to the negative attributes which result from thermal processing, including the loss of
heat-sensitive nutrients and fresh-like sensory attributes.
Preservation of food extends its shelf life, largely through inactivation of the
microorganisms which contribute to spoilage. This end has been traditionally achieved by
processing foods at high temperatures or by adding chemical preservatives, but these methods have
many limitations. Food scientists and engineers have begun focusing on the use of alternative
processing technologies, where their main goals are the inactivation of pathogens and
microorganisms which contribute to spoilage while preserving fresh-like qualities. High pressure
processing, pulsed electric fields, and ultrasound are some promising alternatives to traditional
processing methods, and this chapter reviews the engineering aspect of these novel technologies.
It focuses on examining their advantages and limitations, discussing equipment design, energy
requirements during processing, and the challenges involved in adopting these processes on an
industrial scale.

55
2. High pressure processing
High pressure processing (HPP), also known as high hydrostatic pressure (HHP) processing, is a
mature nonthermal technology that has been recently commercialized in food processing
industries, mainly for the pasteurization of fruit and vegetable juices, guacamole, smoothies, meat,
etc. In this process, pre-packaged food is subjected to very high pressures, commonly in the ranges
of 50 to 900 MPa, in the presence of liquid media as a pressure transmitting fluid. The use of high
pressure in food preservation is not new; its efficacy was discovered more than a century ago (Hite,
1899), but due to the complexity involved in the manufacture and operation of HPP equipment it
has not been widely adopted in the food processing industry. In 1990, the first HP processed food
product (fruit jam) was launched in the Japanese market (Thakur and Nelson, 1998).
The primary objectives of any food preservation technique are to inactivate pathogenic and
spoilage-causing microorganisms and extend shelf life of the food under consideration. The
conventional thermal process fulfilled these goals, but due to the development of cooked flavor
and loss of nutritional quality, alternative methods to process food have been explored. In high
pressure processing, only the secondary and tertiary structure of a protein is altered, which causes
the destruction of microorganisms with minimal or no impact on the quality attributes of the
processed food (Hayashi, 1989). This feature of HPP makes it as a sound alternative to traditional
processing methods.
2.1 HPP Equipment
The HPP system typically consists of a pressure vessel, a pump, two end closures, devices for
restraining the end closures (yoke, thread, and pin), and a control unit. Pressure vessels are
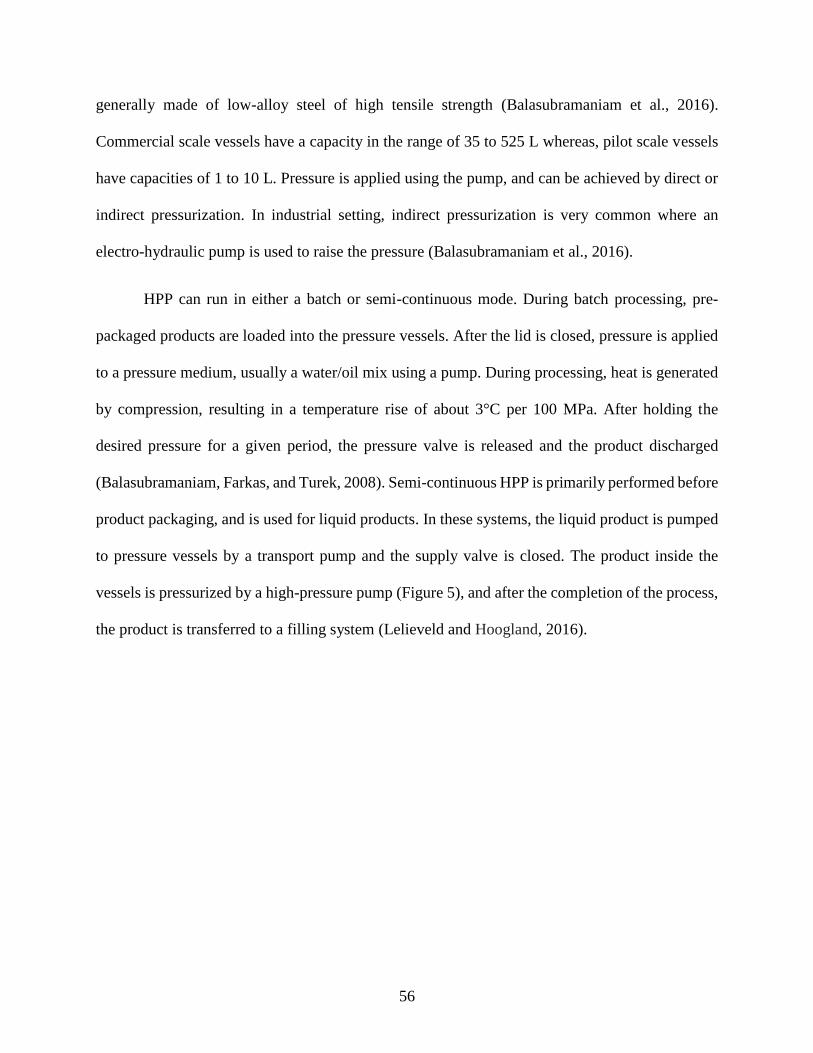
56
generally made of low-alloy steel of high tensile strength (Balasubramaniam et al., 2016).
Commercial scale vessels have a capacity in the range of 35 to 525 L whereas, pilot scale vessels
have capacities of 1 to 10 L. Pressure is applied using the pump, and can be achieved by direct or
indirect pressurization. In industrial setting, indirect pressurization is very common where an
electro-hydraulic pump is used to raise the pressure (Balasubramaniam et al., 2016).
HPP can run in either a batch or semi-continuous mode. During batch processing, pre-
packaged products are loaded into the pressure vessels. After the lid is closed, pressure is applied
to a pressure medium, usually a water/oil mix using a pump. During processing, heat is generated
by compression, resulting in a temperature rise of about 3°C per 100 MPa. After holding the
desired pressure for a given period, the pressure valve is released and the product discharged
(Balasubramaniam, Farkas, and Turek, 2008). Semi-continuous HPP is primarily performed before
product packaging, and is used for liquid products. In these systems, the liquid product is pumped
to pressure vessels by a transport pump and the supply valve is closed. The product inside the
vessels is pressurized by a high-pressure pump (Figure 5), and after the completion of the process,
the product is transferred to a filling system (Lelieveld and Hoogland, 2016).

57
Figure 5. Operation of HPP (Source: http://www.hiperbaric.com/).
The design of HPP to process food is based on the same parameters used in non-food
industries such as ceramics and chemicals (Balda, Aparicio, and Samson, 2012). There are two
types of design: vertical loading and horizontal loading. Horizontal product-loading systems are a
modified form of the vertical system that was originally adapted from non-food industries. GEL
ALSTOM ACB manufactured the first commercial horizontal-loading HPP system in 1998 (Jung,
Samson, and de Lamballerie, 2010).
Figure 6. Hiperbaric HPP system Hiperbaric-135 (Source: http://www.hiperbaric.com/).

58
Figure 7. Avure’s AV-30 HPP unit (Source: http://www.avure-hpp-foods.com/).
2.2 Compression heating and its effect
HPP is an adiabatic process which means the system is thermally isolated, and heat is generated
within the vessel by compression. During compression, the molecules are compressed and the
intermolecular forces between molecules release energy in the form of heat (Khurana, 2008).
The compression of any compressible substance results in generation of heat. Under
adiabatic conditions, fats and oils possess some of the highest compression heating values,
typically in the range of 6 – 8.7°C for a pressure change of 100 MPa (Rastogi et al., 2007), while
water has the lowest, increasing by only 3°C per 100 MPa (Koutchma, 2012). The fluid is used as
the medium for transmitting pressure, and the temperature of this pressure-transmitting fluid also
changes during adiabatic compression, causing changes in product temperature.

59
Assuming the process is truly adiabatic (i.e. the system possesses perfect thermal isolation),
the change in temperature resulting from pressurization can be derived:
Considering the change in entropy of the system (ds) that varies as a function of both temperature
(T) and pressure (P) of the system, i.e. S= f (T, P), then
𝑑𝑠 = (𝑑𝑠
𝑑𝑇) 𝑑𝑇 + (
𝑑𝑠
𝑑𝑃) 𝑑𝑃, (1)
If the process is assumed to be completely reversible, then the total change in entropy is
zero. By rearranging, the rate of heating due to compression (dT/dp) can be expressed as
𝑑𝑇
𝑑𝑝= −
𝛿𝑠
𝛿𝑃𝛿𝑠
𝛿𝑇
, (2)
𝑑𝑇
𝑑𝑝= −
𝑉(𝛿𝑠
𝑉𝛿𝑃)
1
𝑇(𝑇𝛿𝑠𝛿𝑇
)
, (3)
This can be expressed more simply (Eq. 4), as the rate of compression heating is directly
proportional to -T∙α, where α is an expansion coefficient (1/K), and is inversely proportional to the
specific heat capacity of the medium (Cp, J/kg∙K):
𝑑𝑇
𝑑𝑝= −
𝑇𝛼
𝜌𝐶𝑝, (4)
This simplified equation describes the phenomenon, and can be correlated with activation
energy and z-value.
Furthermore, pressure alone has also a significant effect on reaction rate. Consider the ideal
gas law,

60
𝑝𝑉 = 𝑛𝑅𝑇, (5)
where p is pressure, V is volume, n is number of moles, R is the gas constant, and T is temperature
Rearranging Equation 5 yields
𝑝 =𝑛𝑅𝑇
𝑣, (6)
Since R and n are constant, the pressure applied is directly proportional to the temperature
and volume; compression reduces the volume, and thus it follows that an increase in pressure
increases the temperature and concentration (n/v) of the reactant. Changes in temperature and
concentration directly affect reaction rates.
Microbial inactivation by the combination of high pressure and antimicrobials can be
considered in light of these relationships. The application of antimicrobials alone is less effective
than a combined application of high pressure and antimicrobials. This makes sense; the application
of high pressure brings microbial cells and antimicrobials together, increasing the effective
concentration of antimicrobials. Hence, the “reaction rate” increases as described by Equation 6,
and the population of microorganisms is reduced more rapidly.
2.3 Energy consumptions
Energy consumed during high pressure processing can be divided into two forms: energy utilized
in the initial pressurization, and second, energy present in the form of heat (compression heating)
leading to the increase in system temperature (Eq. 7):
𝐸𝑡𝑜𝑡𝑎𝑙 = 𝐸𝑝 + 𝐸𝑙, (7)

61
where 𝐸𝑡𝑜𝑡𝑎𝑙 is the total energy of the system, 𝐸𝑝 the energy used to raise the pressure, and 𝐸𝑡 is
the thermal energy.
Energy to raise the pressure
According to the first law of thermodynamics,
𝑑𝑈 = 𝛿𝑊 + 𝛿𝑄, (8)
where dU is the internal energy, and δW is the energy due to work (expressed as Ep in the case of
HPP), and δQ is heat transfer between the system and its environment. In the case of HPP, the
vessel can be considered hermetic, so the system is under adiabatic conditions (no heat transfer
between the system and its environment). Hence, (2) becomes
𝑑𝑈 = 𝛿𝑊, (9)
Following the definition of work due to the application of pressure, (the pressure
transmitting fluid in the vessel), we can write the following equation:
𝛿𝑊 = −𝑃𝑑𝑉, (10)
where P is pressure in the vessel and dV is the change in volume. We need to know the
compressibility of the pressure transmitting fluid used. Volume is a function of pressure and
temperature; thus, we can define dV as in equation (5):
𝑑𝑉 = (𝛿𝑉
𝛿𝑃)𝑇𝑑𝑃 + (
𝛿𝑉
𝛿𝑇)𝑝𝑑𝑇, (11)
We can introduce the compressibility, β (Pa-1), at constant temperature:

62
𝛽 = −1
𝑉∗ (
𝛿𝑉
𝛿𝑃)
𝑇 , (12)
From Eq. (10), (11), and (12) we get,
𝑊 =1
2∗ 𝑉 ∗ 𝛽 ∗ (𝑃𝑓𝑖𝑛𝑎𝑙
2 − 𝑃𝑖𝑛𝑖𝑡𝑖𝑎𝑙2), (13)
Thermal energy due to compression
As previously discussed (Section 2.2), the system undergoes adiabatic heating due to
pressurization. Barbosa-Cánovas and Rodriguez (2005) estimated that thermal energy, Et, during
an adiabatic and reversible change, is equivalent to the compression energy applied during this
process at constant temperature:
𝜌 ∗ 𝐶𝑝 ∗𝛿𝑇
𝛿𝑡= 𝑇 ∗ 𝛼𝑝 ∗
𝛿𝑃
𝛿𝑡 , (14)
As a result, the total energy in the system can be calculated during the come-up time
(compression), the holding time, and the decompression.
2.4 Packaging requirements
Flexible polymeric packages are eminently suitable for high pressure processing. The packaging
of products to be subjected to HPP should possess the strength and flexibility necessary to survive
the large pressure changes involved with no loss of original size, shape, or function. Tolerance of
a ~15% change in volume is typically considered the threshold for suitable packaging. For this
reason, rigid containers such as glass bottles or metal tins are incompatible with HPP.
63
Commonly used packaging materials include polypropylene, polyethylene, and nylon-
polypropylene pouches; flexible polymeric packages work well with HPP. As the package must
withstand very high pressures, and sometimes elevated temperatures, packages used for HPP
should have excellent mechanical properties as well as gas barrier properties. Aluminum-based
multiplayer polymeric packages tend to have a high degree of mechanical strength, but aluminum
has issues with blistering at high pressure (Han et al., 2006). Nylon-based polypropylene is another
suitable package compatible with HPP. Beverages are often packaged in PET bottles, which are
also compatible with HPP.
2.5 Factors affecting the process
2.5.1 Processing factors
a. Temperature
Temperature plays a very important role in high pressure processing as microbial inactivation
depends on the temperature. The initial temperature of the products to be treated and temperature
of the treatment chamber are two critical factors. Both of these temperatures have a strong
influence on microbial inactivation, as well any deterioration in food quality. Microbial
inactivation has shown to be enhanced by either increasing the initial temperature of food above
room temperature or by decreasing it (Kalchayanand et al., 1998). Temperatures above 70°C are
generally required to achieve commercial sterilization. HPP can also be used at refrigeration
temperature; this could be done to inactivate non-psychotropic cells (Patterson et al., 1995).
Temperature below -20°C have also shown good results for microbial reduction. At lower
temperatures, ice crystal formation can also play a role in microbial inactivation.

64
b. Pressure holding time
The pressure holding time is a period after come up time and before decompression; during this
period the pressure is held constant (Nguyen and Balasubramaniam, 2011). This time is crucial in
processing as it has a significant effect both on microbial inactivation as well as quality
deterioration; the shortest time capable of achieving microbial inactivation is desirable, as a
reduction in pressure holding time will increase throughput.
c. Compression heating
As discussed earlier, the physical compression experienced due to HPP leads to higher
temperatures of both the pressure-transmitting medium and the product being treated. The extent
of this increase in temperature depends on the type of the products, the initial temperature of the
product, and the pressure applied. It is also affected by pressure-transmitting medium,
pressurization type, vessel design, and rate of pressurization (Patazca et al., 2007).
Adiabatic heating in HPP may increase the temperature of food from 3 to 9°C/100 MPa
(Table 8). As soon as the pressure returns to its original level, the system returns to its original
temperature almost instantly. Foods with high fat content tend to experience a higher rise in
temperature compared to foods with high water content; Rasanayagam et al. (2003) observed that
the oil has little or no effect on its initial temperature during adiabatic heating.

65
Table 8. Adiabatic increments in temperature during HPP (de Heij et al., 2003).
Food products Initial temperature (°C) Temperature change (°C/100 MPa)
Water
20 2.8
60 3.8
80 4.4
Chicken 20 2.9
Milk fat 20 8.5
Figure 8. Time–temperature and pressure profiles of water at an initial temperature of 24.2ºC and set
pressure of 300 MPa during HPP (Source: Patazca et al., 2007).

66
2.5.2 Product factors
a. pH
Acidic food is ideal for processing by HPP; at lower pH, most microorganisms become more
sensitive to pressure treatment. During pressure treatment, there is a chance of ionization leading
to a decrease in pH (Hoover et al., 1989); for example, a decrease of 0.2 units in the pH of apple
juice with an increase in pressure by 100 MPa has been reported (Hermans, 1995). An increase in
acidity alone is typically not enough to reduce microbial loads to desired levels, but combining
HPP with a decrease in pH can massively increase its efficacy, exhibiting a synergistic rather than
an additive improvement. Ritz et al. (2008) observed no significant effect on the reduction (<1 log)
of L. monocytogenes in buffer at pH 7 processing at 4°C, but when pH was changed to 4.5, there
was a significant reduction (8.9 log) in the microbial population.
b. Water activity (aw)
Water activity plays a critical role in the inactivation of microorganisms by high pressure. A low
water activity level in food protects microorganisms from inactivation by HPP. Hayman et al.
(2008) stated that low water activity results in protein stabilization, protecting the microorganisms
from being inactivated by HPP. Pressure-injured microorganisms are more sensitive to low water
activity than regular or un-injured microorganisms.
There are many constituents in food that can change the water activity and prevent
inactivation by HPP; in general carbohydrates are found to be more protective than salts. However,
Patterson et al. (1995) found that the addition of 2% salt significantly reduced the recovery of some
pressure-treated microbes. Reducing the concentration of peptone water below 60% (aw = 0.8) has
67
been shown to significantly increase the susceptibility of L. monocytogenes to HPP (Hayman et
al., 2008). Oxen and Knorr (1993) reported 7 log reductions of Rhodotorula rubra after HPP
treatment (400 MPa, 25°C, 15 min) when water activity was greater than 0.96, but when it was
reduced below 0.91, no inactivation was observed. Similarly, Zygosaccharomyces bailii was
observed to completely inactivate by HPP at aw values greater than 0.8, but HPP treatment at lower
aw resulted in a greater population of survivors (Palou et al. 1997). The same authors concluded
that added sugar acted as a baroprotective agent, preventing inactivation of target microorganisms
by HPP.
The baroprotective effect depends on the type of solute added. Setikaite et al. (2009)
compared the effects of some additives, including sugars and salt, on HPP treatment to eradicate
E. coli K12. In their study, salt was the best choice for increasing the effects of HPP, glycerol and
fructose were somewhat less effective, and sorbitol was the most baroprotective additive.
c. Food composition
The composition of food also plays a vital role in the effectiveness of high pressure processing.
Many food constituents can protect microorganisms from inactivation by HPP (Hoover et al.,
1989). Large amounts of sugar, fat, and protein can act as baroprotectants, contributing to
microorganism resistance towards HPP.

68
2.6 Advantages and limitations of HPP
Advantages
An environmentally friendly process, requires only electricity and water (which is
recycled).
Preserves the freshness, sensory properties and nutritional quality of products.
Can easily destroy pathogens like Listeria, Salmonella, Vibrio, and Norovirus.
Can help develop clean label products.
Can also be used in product modification such as starch gelatinization, gel formation, and
meat tenderization.
Commercial sterilization of food is possible using HPP (>600 MPa) at 70-90°C.
Limitations
Can only be used with cut, blended, and clean fruits or vegetables; it does not work well
with whole and raw products.
Can change the texture of food products due to cell wall rupture.
Does not work with dry products due to their low water content; requires the presence of
water to inactivate microorganisms.
Some food enzymes are resistant to pressure.

69
Degradation of food can occur even after processing due to residual oxygen and enzyme
activity.
3. Pulsed electric fields
Processing juices and other beverages with pulsed electric fields (PEF) involves the application of
short pulses of high electric fields intensity (10-50 kV/cm) to products as they move between two
electrodes for a duration of microseconds to milliseconds (Pataro et al., 2011). PEF has shown
very promising results on the inactivation of vegetative microorganisms and spores when
combined with microbiological stress factors such as temperature changes, pH reduction, and
antimicrobial agents.
The inactivation of microorganisms by PEF is mainly due to electroporation of cell
membranes. PEF causes the breakdown of microorganism cell membranes by creating new pores
or by expanding existing ones (Ramaswamy et al., 2005). This results in leakage of their
cytoplasmic content, causing microbial death. The size and number of pores formed due to
electroporation depends on various factors such as electric field intensity, number of pulses, pulsed
width, processing temperature, and treatment time. Inactivation of microorganisms by PEF also
depends on product factors such as ionic strength or electrical conductivity of the food.
In PEF processing, electric field generates a surface charge on cell membranes; because of
the difference in charge state between a cell’s inner and outer layers, the cell membrane is
compressed, destabilizing the lipid layers and proteins of which it is composed. This compression
results in a thinner, more permeable membrane, which allows small molecules to enter the cell,

70
and eventually results in cell lysis due to membrane rupture. Higher field intensity increases the
amount of accumulated surface charge, and by extension, increases the rate of cell lysis.
Figure 9. Electroporation in microbial cell after PEF treatment.
3.1 PEF equipment
PEF treatment systems require a high voltage power supply. During processing, the liquid food
passes through a temperature-regulated treatment chamber centered between electrodes (high
voltage and ground), and insulated from the rest of the system. The electrodes, typically made of
stainless steel, but sometimes of other metals, pass current through food in the treatment chamber.
The temperature of the food product (which may increase upon exposure to electric fields) is
monitored by thermocouples, and a cooling or heating bath regulates its temperature, chilling or
heating to a set temperature, or maintaining room temperature, as required. After passing through
the treatment chamber, the processed food is pumped to an aseptic packaging unit.

71
Figure 10. Schematic diagram of a pulsed electric fields system
a
b
Figure 11. Pilot scale PEF systems: a. ELEA technologies (15 kW) and b. Diversified technologies Inc.
(DTI) (25 kW) (Source: http://elea-technology.de/ and http://www.divtecs.com/)

72
3.1.1 Electronic components of PEF systems
The electrical components of PEF systems consist of a pulse generator, capacitor, and a discharge
switch. The design of the discharge switch and circuit determine the pulse shape. The pulse
generator controls the length and voltage of the pulses applied to the system via a pulse forming
network (PFN): first, a capacitor is charged to a target voltage by the DC power supply. This
converts AC power of 50-60 Hz to high voltage AC, then finally converts it to the higher voltage
DC power required for PEF (Zhang et al., 1995). Then, the capacitors rapidly pulse the stored
energy though the food, a process controlled by an electric discharge switch. The energy input is
regulated by charging resistors; the amount of energy necessary to build the initial charge varies
based on the capacity and number of capacitors; more capacitors will increase the energy storage
capacity of the system. The amount of energy (E) stored in the capacitor can be determined using
Eq. 16.
𝐸 =1
2. 𝐶. 𝑉2, (16)
where C is the capacitance and V is the voltage.
Figure 12. Pulse forming network (PFN) in PEF system

73
3.1.2 Treatment chamber
The treatment chamber is a particularly important component for PEF treatment, as it is the site at
which the electric field is applied to the food to be treated. It consists of electrodes and insulators;
where multiple electrodes could be connected in series. Since the electrodes in the chamber come
into direct contact with the food being processed, food-grade materials must be used. Stainless
steel is the widely used to construct electrodes (Zhang et al., 1995; Angersbach et al., 2000). Other
materials such as gold, platinum or carbon can also be used to make electrodes (Bushnell, 1993).
Insulator can be made up of any non-conductive and heat resistant materials such as nylon,
polysulfone, polythene (Sale and Hamilton, 1967; Dunn and Pearlman, 1987; Zhang et al., 1995).
Food may be held in a static chamber or pumped through a continuous chamber. While a
static chamber is useful in small-scale applications, such as initial studies, a continuous chamber
is more appropriate for operation on an industrial scale. In either case, an oscilloscope hooked up
to the treatment chamber monitors the voltage and current passing through the chamber, and the
total electric field strength applied. As liquid food is passed through treatment chamber, it is
subjected to a pulse of electricity of set duration. The flow of fluid is adjusted by the pump, and
choice of the appropriate rate depends upon the conductivity of the liquid, its viscosity, and
diameter of the pipe.

74
Figure 13. PEF treatment chamber
3.2 Electric fields generation
According to Faraday’s law, a positive charge (q) at a given point within the treatment area
generates an electric field (Ef) with force (F). The strength of the electric field per unit charge can
thus be expressed as in Eq 17:
𝐸𝑓 =𝐹
𝑞 (17)
Different pulse shapes (e.g. square, bipolar, oscillatory, exponential decay) can be
generated depending on the system parameters. Regardless of pulse shape, generation of a pulsed
field requires rapid energy discharge to create extremely short pulse widths. Charging, on the other
hand, can be slow, as the recovery time is long relative to the pulse width. The desired electric

75
field intensity (Ef) is directly proportional to the charging voltage (V), and inversely proportional
to the distance (d) between the electrodes and it can be calculated for two parallel plate electrodes:
𝐸𝑓 =𝑉
𝑑 (18)
Pulse width (pulse duration) is the distance between two peaks of the waves, and is
controlled by the frequency applied. PEF treatment time can be calculated from the pulse width
and the number of pulses.
An increase in the voltage applied will increase the intensity of the applied electric field,
so, in general, higher voltage, leads to a faster reaction rate. The power input during pulsed electric
field processing can be calculated according to the following relationship,
𝑃 (𝑘𝑊) = 𝑉. 𝐼. 𝑥. 𝑓, (19)
where V is the voltage in kW, I is applied current, x is the pulse width in μs, and f is the frequency
in MHz. Thus, increases in any of the terms, voltage, pulse width or frequency, will increase the
power input, which in turn will generate heat and increase the temperature of the liquid in the
treatment chamber. The electrical conductivity of the fluid increases as the temperature rises; over
time, this may cause excess current flow, leading to system shutdown.
3.3 Energy consumption
The specific energy input (W) for each pulse can be expressed in kJ/kg, calculated according to
Eq. 20:
𝑊 =1
𝑚. 𝑉. 𝐼. 𝑡, (20)

76
where m is the mass of food contained within the treatment chamber in kg, V is the input voltage
in kV, I is the current intensity in amp, and t is the treatment duration in μs. Total specific energy
can be calculated by multiplying W by the number of pulses.
3.4 Factors affecting the process
3.4.1 Processing factors
a. Electric field intensity
The applied electric field intensity plays a largest role on the inactivation of microorganisms by
PEF (Hülsheger & Niemann, 1980). The effects of PEF on microbial inactivation have been shown
to depend mainly on electric field intensity and the duration of exposure to the electric field; other
factors do not play significant roles (Sale and Hamilton, 1967). A critical electric field intensity
(Ec) threshold must be reached for PEF to be effective (Hülsheger et al., 1981). The Ec needed for
the inactivation of microorganisms depends on the cell size, its orientation, and transmembrane
potential of cells (Jeyamkondan et al., 1999; Heinz et al., 2002). It is worth mentioning that
transmembrane potentials is larger for larger cells. Hence, smaller cells require higher field
intensity then larger cells. Toepfl et al. (2005), found that inactivation of Listeria innocua (small
cell) requires a minimum of 15 kV/cm whereas, S. cerevisiae (large cell) can be inactivated with
the field intensity of around 2-4 kV/cm.
b. Treatment time
Total treatment time is calculated by multiplying pulse width and the number of pulses. Choice of
appropriate pulse width is vital for effective treatment. While intuitively, longer pulses may sound

77
desirable, they can lead to electrodeposition on the surface of the electrodes and shorter pulses
should be used (Zhang et al., 1994). Neumann et al. (1992) found that pulses with a duration of 1-
5 µs caused the highest levels of microbial inactivation; they hypothesized that a period of only 10
ns is required to establish the required difference in potential across the cell membrane to initiate
electroporation. The consensus is that the electric field must be maintained above the critical
threshold for an additional 1-5 µs beyond the start of electroporation in order to damage the cell
membrane beyond the ability of microbes to repair (Schoenbach et al., 2000).
The length of treatment required for microbial deactivation (critical treatment time)
depends not only on pulse width, but also on the intensity of the electric field. As long as the field
intensity is greater than Ec, the critical treatment time decreases with increase in electric field
intensity up to a threshold of 1.5 x Ec, after which it remains constant (Barbosa-Cánovas et al.,
1999).
c. Pulse shape
While a wide variety of wave shapes are possible, only exponential decay and square-shaped
pulses are widely used in PEF. Among two types, square-shaped has shown to have more lethal
on microbial inactivation. Barbosa-Cánovas et al. (1999), reported that in square pulse, peak
voltage is maintained for longer period of time hence they are energy efficient and has better lethal
effect as compared to exponentially decaying pulses. In addition to lethal effect, square pulse is
also found to cause less electrolysis of food which cause less deposit on the electrode surface
(Zhang et al., 1995; Barbosa-Cánovas et al., 1999). There are two modes by which PEF can
generate pulses: monopolar and bipolar. Bipolar pulses have been found to be to be more effective
than monopolar pulses in microbial inactivation regardless of pulse shape (Qin et al., 1994). On

78
the other hand, few studies show no difference between two types of pulse on the inactivation of
both gram-positive and gram-negative bacteria (Beveridge et al., 2002, Evrendilek and Zhang,
2005).
3.4.2 Product factors
Properties of a food product like water activity, pH, temperature, conductivity, and the presence
of air bubbles can all influence PEF microbial inactivation.
a. Conductivity/ Dielectric strength of food:
Conductivity is one of the important parameters that needs to be considered when planning to use
PEF. Foods with a higher ion content blocks transmission of the electric field across the chamber,
preventing supercritical field strength from building. In other words, when electrical conductivity
is high, generated electric fields have small peaks which has less killing effect (Barbosa-Cánovas
et al., 1999). Hence it can be said that juice and beverages with low electrical conductivities allows
the use of higher electric field which can results in higher inactivation (Alkhafaji and Farid, 2007).
This problem could be overcome by selecting the proper configuration of electrodes to achieve
higher resistivity.
b. Presence of air bubbles:
The presence of air bubbles changes the dielectric properties of the product resulting into dielectric
breakdown during PEF processing. It may also result into non-uniform treatment as well as arcing.
For this reason, sparkling beverages and foam forming products are not very suitable for PEF, in

79
case of sparkling beverages, PEF treatment prior to carbonation can be done. Vacuum degassing
or pressurizing is required for some product to remove trapped air.
c. Product temperature
As in other technologies, rise of temperature during processing is associated with PEF. The rise of
temperature has some positive impacts as moderate heat and PEF has shown synergism on the
inactivation of microorganisms. But some time while processing milk based beverages products,
the rise of temperature might cause coagulation of protein and deposit formation on the electrodes.
Hence it is necessary to control the temperature during processing; control can be done by placing
the chiller in between treatment chambers connected in series.
The inlet product temperature is raised using an external source of heat by using a heat
exchanger. Then there is addition of certain amount of heat during processing, and finally the
treated product is cooled down immediately to prevent from thermal damage of nutrients. PEF act
either additively or synergistically with mild-heat in microbial inactivation. Additive effect of PEF
and mild-temperature (50-60°C) has been observed in many studies (Rowan et al., 2001; Craven
et al., 2008). Synergist effect between PEF and temperature (35-65°C) was observed by Heinz et
al. (2003), who also found the reduction of energy consumption from 100 kJ/kg to 40 kJ/kg to
achieve 6 log reduction of E. coli in apple juice when PEF was combined with heat. Synergistic
effect of PEF and heat is due to change in fluidity of the cell membrane at higher temperature
which cause the cell more susceptible to electroporation by PEF (Jayaram et al., 1992).

80
3.5 Advantages and limitations of PEF
Advantages
Takes only a short time to inactivate vegetative microorganisms including yeasts, spoilage
and pathogenic bacteria.
Capable of pasteurizing liquid foods and juices without addition of chemical preservatives.
Can be used for conventional thermal pasteurization of acidic or acidified food;
pasteurization of low-acid foods requires incorporation of other hurdles.
Pore formation in fruit and vegetable cells can increase extraction of juice and desirable
bioactive compounds from the tissues.
Can serve as an alternative to enzymatic maceration and mechanical disintegration.
Limitation
Runs in a continuous mode and must done before packaging, requiring the use of costly
aseptic filling techniques.
Initial investment is high; an entry-level industrial-scale pulser may cost in the
neighborhood of $250,000, while others may cost $450,000 to $2,000,000.
Only proven to be useful to inactivate vegetative microorganisms. Some spores and
enzymes have shown a high degree of resistant towards PEF, though incorporation of other
hurdles can solve these issues.

81
A product must be pumpable, possess low electrical conductivity and no air bubbles. The
presence of particles is also a limiting factor; particle size should be smaller than the
internal diameter of the electrode.
4. Ultrasound
Ultrasound (US) is a novel technology that has shown promising results in the preservation of fruit
and vegetable juices. It has been widely used in the food and bioprocess industry for many
purposes including extraction, homogenization, degassing, and antifoaming. Recent studies shows
that this technology can meet the US FDA’s requirement for a 5 log reduction of most resistant
and pathogenic microorganisms present in food products (Salleh-Mack and Roberts, 2007).
Figure 14. Schematic diagram of ultrasound processing
Ultrasound operation can be divided into two categories: low-intensity and high-intensity.
Low-intensity ultrasound uses low amplitude at high frequency (>1 MHz), and is commonly used

82
in structural analysis. This kind of ultrasound does not affect the physical structure. On the other
hand, high-intensity ultrasound, also called power ultrasound, uses high amplitude (typically >100
µm) at low frequency (20-100 kHz) (Kentish, 2014).
When an ultrasound wave produced by the transducer is propagated into the liquid medium
through the sonotrode, there is a mechanical generation of pressure, which in turns releases heat.
When this ultrasound wave passes into liquid with a different pressure gradient, the formation of
bubbles takes place. These bubbles form and collapse thousands of times per second; this rapid
formation and collapse of bubbles is called cavitation, and is a key factor in ultrasound processing.
Two types of bubbles can be formed during processing: stable and transient bubbles. Stable
bubbles are very small, retain their size, and don’t collapse, whereas transient bubble increase in
size during processing and break when it reaches its critical value. During the breaking of those
transient bubbles, a large amount of heat is generated (~5000 K) at high pressure (>1000 atm)
(Feng et al., 2011). These bubbles act as microreactors where cell membranes can rupture.

83
Figure 15. Creation of stable cavitation bubbles; and creation and the collapse of transient cavitation
bubbles. (a) displacement; (b) transient cavitation; (c) stable cavitation; (d) pressure (Source: Santos et al.,
2009).
Bubble size depends upon the frequency, amplitude, pressure, and temperature of the liquid
medium. Leighton (1994) developed an empirical relation to estimate the size of bubbles; this
relation can be given by:
𝑓. 𝑟 = 3, (21)
where f is the frequency in MHz, and r is the bubble radius in μm.
4.1 Ultrasound equipment
Ultrasound equipment consists of a wave generator, transducer, and treatment chamber. The
transducer is responsible for the production of electrical or mechanical energy and its conversion
into sound energy in the ultrasonic frequency range (Ercan and Sousal, 2013).

84
Figure 16. Ultrasound equipment: Lab scale (Left) and Industrial scale (Right) (Source:
www.hielscher.com)
High frequency ultrasonic waves are produced via the piezoelectric effect. The most
common method is pulsed excitation of a ceramic crystal contained within a transducer. There are
two main transducer types in common use.
Magnetostrictive transducers produce ultrasonic waves via application of electric pulses to
a nickel core, with coils wrapped around opposing sides. They are capable of producing ultrasonic
frequences below 100 kHz with about 60% efficiency. Piezoelectric transducers are far more
energy efficient (~95%), and thus are the type commonly used in ultrasonic cleaners. They consist
of a transducer sandwiched between metal blocks, where it is more protected than the crystal in a
magnetostrictive transducer.

85
4.2 Propagation and attenuation of ultrasonic waves
The propagation of ultrasonic wave in liquid medium depends on applied acoustic pressure and
this can be represented on the basis of sinusoidal wave’s theory (Patist and Bates, 2008). In a
sinusoidal wave, acoustic pressure depends on frequency, time, and maximum pressure amplitude
of the wave (Ashokkumar, 2006). This relation can be given by,
𝑃𝑎 = 𝑃𝑎,𝑚𝑎𝑥 sin(2𝜋𝑓𝑡), (25)
where f is the frequency of the applied ultrasound wave, t is the time, and 𝑃𝑎,𝑚𝑎𝑥 is the maximum
pressure amplitude of the wave. Equation 25 can be explained on the basis of the intensity of the
wave, i.e., applied amplitude. When low amplitude is used, the pressure wave creates a motion
which mixes within the fluid, a phenomenon called acoustic streaming (Patist and Bates, 2010).
At high amplitude, the formation of small bubbles at existing nuclei in the fluid take places (Patist
and Bates, 2011). The negative transient pressure in the liquid support the growth of bubbles and
produces new cavities due to cushioning effects. The bubble grows over a number of cycles and
finally collapse (Mason, 1998).
Wave intensities decay due to adsorption of ultrasound waves by particles, wave scattering,
and mode conversion. The attenuation of ultrasound waves corresponds to decay in wave
amplitude. The amplitude decay can be calculated theoretically using Arrhenius equations (Jensen
et al., 2011):
𝐴(𝑧) = 𝐴0𝑒−𝜇𝐴𝑧 , (27)
where 𝜇𝐴is the amplitude attenuation factor.

86
The attenuation coefficient (𝛼) can be defined as:
𝛼 = 20 log(𝑒). 𝜇𝐴 =≅ 8.7𝜇𝐴 , (28)
[20 log Az/A0 is the amplitude drop in decibels]
The adsorption coefficient of the particles depends on the applied frequency. It is given by:
𝑎 = 𝛼/𝑓𝑏 (b ~ 1), (29)
Putting the value of 𝜇𝐴 in equation (8), we get:
𝐴(𝑧, 𝑓) = 𝐴0𝑒−𝑎𝑓𝑧/8.7, (30)
The decay wave intensity in ultrasound can be quantified using Eq. 30.
4.3 Energy consumption
During processing, the transducer converts electrical energy into sound energy, which vibrates at
a specific frequency. The amount of energy released from the ultrasound depends on the applied
frequency and amplitude, as given by (Kentish and Feng, 2014):
𝐸𝑛𝑒𝑟𝑔𝑦 (𝐸) = 𝑘𝑓2𝐴2, (31)
where k is the dissipation constant, f is the frequency, and A is the amplitude.
Energy consumption during processing can be calculated using time and temperature data,
specifically the temperature increase during processing. The calorimetric method can be used to
quantify the work done (Eq. 32),

87
𝑊𝑜𝑟𝑘 𝑑𝑜𝑛𝑒 (𝑄) = 𝑚. 𝐶𝑝. 𝑑𝑇/𝑑𝑡 , (32)
where m is the mass of juice (kg), Cp is the specific heat of product, and dT/dt is the change in
temperature with respect to time.
Acoustic energy density (AED) can be calculated by dividing the total work done (Q) by
the volume of product (V, mL) (Eq. 33) (Tiwari and Mason, 2012).
𝐴𝐸𝐷 =𝑄
𝑉 , (33)
Ultrasonic intensity can be calculated by dividing the work done by area of the sonotrode
(A, cm2) (Eq. 34).
𝑈𝐼 =𝑄
𝐴 , (34)
4.4 Factors affecting the process
4.4.1 Processing factors
Microbial inactivation by ultrasound depends on applied amplitude and frequency. Frequencies of
20 to 60 kHz and amplitudes of 60 to 120 µm are used in food processing. High amplitude is more
efficient in the inactivation of microorganisms than to low amplitude (Wordon et al., 2011).
a. Frequency of sound waves
Application of high frequency generates smaller cavitation bubbles (Feng et al., 2011). At higher
frequency, wavelength is shorter, so bubbles have less time to travel before they collapse hence
the bubbles are smaller. On the other hand, at a low frequency, the wavelength is longer, the

88
bubbles get more time to travel along the wave before collapsing, so the size of the bubbles is
bigger. Bubble formation does not occur at frequencies above 2.5 MHz (Alliger, 1975).
Figure 17. Effect of frequency on the size of bubbles. (Source: http://www.ctgclean.com/).
b. External pressure
Large amounts of energy are released when bubbles collapse in the presence of pressure, as the
bubble collapses more rapidly and violently (Lorimer and Mason, 1987).
c. Intensity
The intensity in the ultrasound treatment is directly related to the amplitude of the waves. A certain
threshold intensity is required to start the cavitation. High amplitude is always not desired in
extraction of intracellular components from tissues, but is desirable for microbial inactivation. The
use of high amplitudes in ultrasound processing may have many disadvantages including
deterioration of the transducer, in addition it may results in agitation of liquid instead of cavitation
(Santos et al., 2009).

89
4.4.2 Product factors
a. pH
pH of the liquid medium is a crucial factor in microbial inactivation. In general, lower medium pH
increases the rate of inactivation. Salleh-Mack and Roberts (2007) studied the effects of ultrasound
at two different pH values, 2.5 and 4.0, and found significant differences in the inactivation rate of
E. coli (ATCC 25922TM).
b. Temperature of product
Ultrasound treatment is an exothermic process i.e., there is release of heat. The propagation of
sound waves in the liquid medium depends on the temperature of the medium. The speed of sound
waves in water is 1482 m/s at 20 °C. At 37°C, the speed increases by 2.5 m/s (Bilaniuk and Wong,
1993). If the temperature of the liquid is increased during ultrasound processing, ultrasonic waves
can propagate more quickly. However, increasing temperature also reduces the cavitation effect:
at high temperatures cavitation bubbles collapse less violently, as the vapor pressure is higher, so
a balance must be made.
Regarding microbial inactivation, when ultrasound is used at mild temperature, efficient
inactivation can be achieved by the combined effects of ultrasound and heat; a synergistic effect
in microbial load reduction is observed (Piyasena et al., 2003; Feng et al., 2008). Wordon et al.
(2012) found a significant decrease in D-value of S. cerevisiae with ultrasound processing at 60°C
(D-value 0.73 min) as compared to temperature alone (D-value 3.53 min) and ultrasound alone
(D-value 3.1 min). Lee et al. (2009) studied the inactivation of E. coli K12 using ultrasound
combined with heat and/or pressurization. They observed that the addition of other lethal

90
parameters (temperature and/or pressure) to ultrasound treatment significantly reduced the time
required to achieve 5 log reduction.
c. Viscosity
Media with high viscosity impedes the passage of ultrasonic waves; thus, the propagation of
ultrasonic waves will be low, resulting in less cavitation effects and lower rates of microbial
inactivation. Liquid with high viscosity requires higher amplitudes, as viscous liquids resist the
flow of ultrasonic waves.
d. Density/ Particles
Inactivation is efficient in liquids without particulates, but when dense concentrations of particles
are present, ultrasonic waves cannot pass easily through the medium, and there is less cavitation.
The density of the liquid medium reflects the mass content of the particles in the medium. Clear
liquid (such as water) has a density of approximately 1000 kg/m3, while orange juice has a density
of 1048 kg/m3 due to the particles present in it. The propagation of ultrasound wave involves the
movement of the particles present in the medium. When particles are present in significant
amounts, more force is required to move the particles. This indicates that the higher the density,
the slower wave propagation will be. This can also be proved mathematically by using the Newton-
Laplace equation:
𝑐 = √𝐾
𝜌 , (31)
where c is the speed of the wave, K is the modulus of bulk elasticity, and 𝜌 is the density. Since K
is constant, wave speed is inversely proportional to the density of the medium.

91
Compressibility is the term that describes the compactness of the medium, similar to
density in the liquid medium. When the liquid has fewer particles, they are loosely compressed,
and ultrasonic waves can more easily pass through it.
4.5 Advantages and limitations of Ultrasound
Advantages
Very low energy consumption compared to thermal processes as well as other nonthermal
technologies.
Have multiple application in food processing: pasteurization, de-carbonation, emulsion
creation, homogenization, extraction of intracellular components.
No major degradation of flavor and bioactive compounds during processing.
Capital and operating costs are comparatively low.
Limitations
Heat can be released during processing, a process that is sometimes challenging to control.
The release of heat in the medium reduces the cavitation effect.
The volume of the product directly affects treatment efficacy, as acoustic energy density
depends on volume.

92
If the sonication probe is in direct contact with the food there is a chance of metal release
from sonotrode into the food. Appropriate food-safe materials should be selected for the
sonotrode.
Effects of ultrasound strongly depend on the position of the probe and size of treatment
vessels, so scale-up and reproducibility is challenging.
Most lab-scale ultrasound processing has been done in batch mode, although continuous
processing is possible. Extensive studies need to be done of the continuous mode to find
optimal conditions of amplitude and flow rate. When the liquid is in motion, ultrasonic
energy behaves differently than in batch mode, where the liquid is still. Residence time
also affects the results of ultrasound processing.
5. Final Remarks
This literature review presents a clear picture of what is known and the knowledge gap that need
to be filled in order to design a system for nonthermal processing of beverages. The basic
knowledge on design of equipment and the working mechanism is vital in preliminary stages of
process planning. By understanding the factors that affect the process, one can identify what kind
of products is suitable for a particular process and what precautions should be taken in choosing
the operating conditions. Every processing technologies has their own advantages and limitation;
optimization from cost and technical aspects is required in selecting the appropriate technology to
process a particular fruit and vegetable based juices and beverages.

93
References
Alkhafaji, S. R., & Farid, M. (2007). An investigation on pulsed electric fields technology using
new treatment chamber design. Innovative Food Science and Emerging
Technologies, 8(2), 205-212.
Alliger, H. (1975). Ultrasonic disruption. American Laboratory, 10(10), 75-85.
Angersbach, A., Heinz, V., & Knorr, D. (2000). Effects of pulsed electric fields on cell membranes
in real food systems. Innovative Food Science and Emerging Technologies, 1(2), 135-149.
Ashokkumar, M., Sunartio, D., Kentish, S., Mawson, R., Simons, L., Vilkhu, K., & Versteeg, C.
K. (2008). Modification of food ingredients by ultrasound to improve functionality: a
preliminary study on a model system. Innovative Food Science and Emerging
Technologies, 9(2), 155-160.
Balasubramaniam, V. M., Barbosa-Cánovas, G. V., & Lelieveld, H. L. (2016). High-Pressure
Processing Equipment for the Food Industry. In High Pressure Processing of Food (pp.
39-65). Springer New York.
Balasubramaniam, V. M., Farkas D., Turek, E. J. (2008). Preserving Foods through High-Pressure
Processing. Food Technology 11, 32-38.
Balasubramaniam, V. M., Ting, E. Y., Stewart, C. M., and Robbins, J. A. (2004). Recommended
laboratory practices for conducting high-pressure microbial inactivation experiments.
Innovative Food Science and Emerging Technologies, 5: 299-306.
94
Balda, F. P., Aparicio, B. V., & Samson, C. T. (2012). Industrial high pressure processing of foods:
review of evolution and emerging trends. Journal of Food Science and Engineering, 2(10),
543.
Barbosa-Cánovas, G. V., & Rodríguez, J. J. (2005). Thermodynamic aspects of high hydrostatic
pressure food processing. Novel Food Processing Technologies, 183-205.
Barbosa-Canovas, G. V., Pothakamury, U. R., Gongora-Nieto, M. M., & Swanson, B. G.
(1999). Preservation of Foods with Pulsed Electric Fields. Academic Press.
Bates, D., & Patist, A. (2010). Industrial applications of high power ultrasonics in the food,
beverage and wine industry. Case Studies in Novel Food Processing Technologies:
Innovations in Processing, Packaging, and Predictive Modelling, 119-138.
Bilaniuk, N., & Wong, G. S. (1993). Speed of sound in pure water as a function of temperature. The
Journal of the Acoustical Society of America, 93(3), 1609-1612.
Bushnell, A. H., Dunn, J. E., Clark, R. W., & Pearlman, J. S. (1993). U.S. Patent No. 5,235,905.
Washington, DC: U.S. Patent and Trademark Office.
de Heij, W. B., Van Schepdael, L. J. M. M., Moezelaar, R., Hoogland, H., Matser, A. M., & van
den Berg, R. W. (2003). High-pressure sterilization: Maximizing the benefits of adiabatic
heating. Food Technology, 57(3), 37-41.
Dunn, J. E., & Pearlman, J. S. (1987). U.S. Patent No. 4,695,472. Washington, DC: U.S. Patent
and Trademark Office.
Ercan, S. Ş., & Soysal, Ç. (2011). Effect of ultrasound and temperature on tomato
peroxidase. Ultrasonics Sonochemistry, 18(2), 689-695.
95
Feng H, Yang W, Hielscher T. (2008). Power ultrasound. Food Science and Technology
International, 14, 433-436.
Feng, H., Barbosa-Cánovas, G. V., & Weiss, J. (2011). Ultrasound Technologies for Food and
Bioprocessing. New York: Springer.
Han, J., & Yuan, J. (2007). Advances in Packaging for Nonthermal Processes.
Hayman, M. M., Kouassi, G. K., Anantheswaran, R. C., Floros, J. D., & Knabel, S. J. (2008).
Effect of water activity on inactivation of Listeria monocytogenes and lactate
dehydrogenase during high pressure processing. International Journal of Food
Microbiology, 124(1), 21-26.
Hayman, M. M., Kouassi, G. K., Anantheswaran, R. C., Floros, J. D., & Knabel, S. J. (2008).
Effect of water activity on inactivation of Listeria monocytogenes and lactate
dehydrogenase during high pressure processing. International Journal of Food
Microbiology, 124(1), 21-26.
Heinz, V., Alvarez, I., Angersbach, A., & Knorr, D. (2001). Preservation of liquid foods by high
intensity pulsed electric fields—basic concepts for process design. Trends in Food Science
and Technology, 12(3), 103-111.
Hoover, D. G., Metrick, C., Papineau, A. M., Farkas, D. F., & Knorr, D. (1989). Biological effects
of high hydrostatic pressure on food microorganisms. Food Technology (USA).
Hülsheger, H., & Niemann, E. G. (1980). Lethal effects of high-voltage pulses on E. coli
K12. Radiation and Environmental Biophysics, 18(4), 281-288.

96
Hülsheger, H., Potel, J., & Niemann, E. G. (1981). Killing of bacteria with electric pulses of high
field strength. Radiation and Environmental Biophysics, 20(1), 53-65.
Jayaram, S., Castle, G. S. P., & Margaritis, A. (1992). Kinetics of sterilization of Lactobacillus
brevis cells by the application of high voltage pulses. Biotechnology and
Bioengineering, 40(11), 1412-1420.
Jensen, F. B., Kuperman, W. A., Porter, M. B., & Schmidt, H. (2011). Wave propagation theory,
In Computational Ocean Acoustics. Springer Science & Business Media.
Jeyamkondan, S., Jayas, D. S., & Holley, R. A. (1999). Pulsed electric field processing of foods:
a review. Journal of Food Protection, 62(9), 1088-1096.
Jung, S., Samson, C. T., & de Lamballerie, M. (2010). High hydrostatic pressure food processing.
In Alternatives to Conventional Food Processing, 254-306.
Kalchayanand, N., Sikes, A., Dunne, C. P., & Ray, B. (1998). Factors influencing death and injury
of foodborne pathogens by hydrostatic pressure-pasteurization. Food Microbiology, 15(2),
207-214.
Kentish, S., & Feng, H. (2014). Applications of power ultrasound in food processing. Annual
Review of Food Science and Technology, 5, 263-284.
Koutchma, T. (2012). Design for High‐Pressure Processing. In Rahman, S., & Ahmed, J. (Eds.).
Handbook of Food Process Design, John Wiley & Sons.
Lee, H., Zhou, B., Feng, H., & Martin, S. E. (2009). Effect of pH on inactivation of Escherichia
coli K12 by sonication, manosonication, thermosonication, and
manothermosonication. Journal of Food Science, 74(4), 191-198.

97
Leighton, T. (2012). The acoustic bubble. Academic press.
Lelieveld, H. L., & Hoogland, H. (2016). Continuous High-Pressure Processing to Extend Product
Shelf Life. In High Pressure Processing of Food (pp. 67-72). Springer New York.
Lorimer, J. P., & Mason, T. J. (1987). Sonochemistry. Part 1—the physical aspects. Chemical
Society Reviews, 16, 239-274.
Mason, T. (1998). Power ultrasound in food processing—the way forward. In Povey M. J. W.,
Mason T. J. (Eds) Ultrasound in Food Processing, Glasgow: Blackie Academic &
professional, 104-124.
Nguyen, L.T., & Balasubramaniam, V. M. (2011). Fundamentals of food processing using high
pressure. Zhang, H. Q., Barbosa-Canovas, G.V., Balasubramaniam, V.M., Patrick Dunne,
C., Farkas, D.F., and Yuan, J.T.C. eds. Nonthermal Processing Technologies for Food. IFT
Press, Wiley-Blackwell, Chichester, West Sussex, UK, 3-19.
Oxen, P., & Knorr, D. (1993). Baroprotective effects of high solute concentrations against
inactivation of Rhodotorula rubra. Lebensmittel Wissenschaft Technologie, 26, 220–223.
Palou, E., Lopez-Malo, A., Barbosa-Canovas, G. V., Welti-Chanes, J., & Swanson, B. G. (1997).
Kinetic Analysis of Zygosaccharomyces bailii Inactivation by High Hydrostatic
Pressure. LWT-Food Science and Technology, 30(7), 703-708.
Pataro, G., Senatore, B., Donsì, G., & Ferrari, G. (2011). Effect of electric and flow parameters on
PEF treatment efficiency. Journal of Food Engineering, 105(1), 79-88.

98
Patazca, E., Koutchma, T., & Balasubramaniam, V. M. (2007). Quasi-adiabatic temperature
increase during high pressure processing of selected foods. Journal of Food
Engineering, 80(1), 199-205.
Patist, A., & Bates, D. (2008). Ultrasonic innovations in the food industry: From the laboratory to
commercial production. Innovative Food Science and Emerging Technologies, 9(2), 147-
154.
Patist, A., & Bates, D. (2011). Industrial applications of high power ultrasonics. In Feng, H.,
Barbosa-Cánovas, G. V., & Weiss, J. (Eds) Ultrasound Technologies for Food and
Bioprocessing (pp. 599-616). Springer New York.
Patterson, M. F., Quinn, M., Simpson, R., & Gilmour, A. (1995). Sensitivity of vegetative
pathogens to high hydrostatic pressure treatment in phosphate-buffered saline and
foods. Journal of Food Protection, 58(5), 524-529.
Piyasena, P., Mohareb, E., & McKellar, R. C. (2003). Inactivation of microbes using ultrasound:
a review. International Journal of Food Microbiology, 87(3), 207-216.
Qin, B. L., Zhang, Q., Barbosa-Canovas, G. V., Swanson, B. G., & Pedrow, P. D. (1994).
Inactivation of microorganisms by pulsed electric fields of different voltage
waveforms. IEEE Transactions on Dielectrics and Electrical Insulation, 1(6), 1047-1057.
Ramaswamy, R., Jin, T., Balasubramaniam, V. M., & Zhang, H. (2005). Pulsed electric field
processing: fact sheet for food processors. Ohio State University Extension Factsheet, 22.

99
Rasanayagam, V., Balasubramaniam, V. M., Ting, E., Sizer, C. E., Bush, C., & Anderson, C.
(2003). Compression heating of selected fatty food materials during high‐pressure
processing. Journal of Food Science, 68(1), 254-259.
Ritz, M., Jugiau, F., Federighi, M., Chapleau, N., & De Lamballerie, M. (2008). Effects of high
pressure, subzero temperature, and pH on survival of Listeria monocytogenes in buffer and
smoked salmon. Journal of food protection, 71(8), 1612-1618.
Sale, A. J. H., & Hamilton, W. A. (1967). Effects of high electric fields on microorganisms: I.
Killing of bacteria and yeasts. Biochimica et Biophysica Acta (BBA)-General
Subjects, 148(3), 781-788.
Salleh-Mack, S. Z., & Roberts, J. S. (2007). Ultrasound pasteurization: the effects of temperature,
soluble solids, organic acids and pH on the inactivation of Escherichia coli ATCC
25922. Ultrasonics Sonochemistry, 14(3), 323-329.
Santos, H. M., Lodeiro, C., and Capelo- Martínez, J. L 2009. The power of ultrasound. In Capelo-
Martínez, J. L. (Ed.). Ultrasound in Chemistry: Analytical Applications. John Wiley &
Sons.
Setikaite, I., Koutchma, T., Patazca, E., & Parisi, B. (2009). Effects of water activity in model
systems on high-pressure inactivation of Escherichia coli. Food and Bioprocess
Technology, 2(2), 213-221.
Thakur, B. R., & Nelson, P. E. (1998). High‐pressure processing and preservation of food. Food
Reviews International, 14(4), 427-447.
100
Tiwari, B. K., & Mason, T. J. (2012). Ultrasound processing of fluid foods. In Novel Thermal and
Non-Thermal Technologies for Fluid Foods (pp. 135-165).
Toepfl, S., Heinz, V. and Knorr, D. (2005) Overview of Pulsed Electric Field Processing for Food.
In Emerging Technologies for Food Processing. Ed. Da-Wen Sun. pp. 69-99. Elsevier
Academic Press, London.
Ugarte‐Romero, E., Feng, H., Martin, S. E., Cadwallader, K. R., & Robinson, S. J. (2006).
Inactivation of Escherichia coli with power ultrasound in apple cider. Journal of Food
Science, 71(2), E102-E108.
Wordon, B. A., Mortimer, B., & McMaster, L. D. (2012). Comparative real-time analysis of
Saccharomyces cerevisiae cell viability, injury and death induced by ultrasound (20 kHz)
and heat for the application of hurdle technology. Food Research International, 47(2),
134-139.
Zhang, Q., Barbosa-Cánovas, G. V., & Swanson, B. G. (1995). Engineering aspects of pulsed
electric field pasteurization. Journal of Food Engineering, 25(2), 261-281.

101
CHAPTER THREE
COMBINED EFFECT OF ULTRASOUND AND MILD TEMPERATURES ON THE
INACTIVATION OF E. coli IN FRESH CARROT JUICE AND CHANGES
ON ITS PHYSICOCHEMICAL CHARACTERISTICS
Abstract
The combination of ultrasound and mild temperatures to process fruits and vegetables juices is a
novel approach that is showing promising results for microbial inactivation and preservation of
bioactive compounds and sensory attributes. This study centers on investigating the inactivation
of E. coli (ATCC 11755TM) in carrot juice as a result of the combined effect of ultrasound (24 kHz
frequency, 120 µm, and 400 W) with temperature (50, 54, and 58ºC) and processing time (0-10
min). In addition, the possible changes in physicochemical properties and the retention of bioactive
compounds after processing were analyzed. Microbial inactivation with ultrasound treatment at
50°C resulted in 3.5 log reduction after 10 min, whereas at 54°C almost 5 log reduction was
attained in the same period of time; meanwhile, for treatment at 58°C, no viable cells were detected
(>5 log reduction) after 2 min. There was no significant difference (p>0.05) on pH (6.80-6.82),
ºBrix (8.0-8.5), titratable acidity (0.29-0.30%), total carotenoid (1774-1835 µg/100 ml), phenolic
compounds (20.19-20.63 µg/ml), ascorbic acid (4.8 mg/100 ml), and color parameters between
fresh and ultrasound treated samples at the studied temperatures. To predict the inactivation
patterns, observed values were tested using three different general models: first-order, Weibull
distribution, and biphasic. The Weibull and biphasic models show good correlation for inactivation
under all processing conditions. Results show ultrasound in combination with mild temperature

102
could be effectively used to process fresh carrot juice providing a safe product without affecting
physicochemical characteristics.
1. Introduction
Thermal processing is the most common method of juice pasteurization. This process is effective
on the inactivation of pathogens, including E. coli present in the juices, but the high temperature
may cause losses of bioactive compounds and sensory attributes (Alighourchi and others 2014).
Novel food processing technologies have been focusing on offering microbiologically safe
products while retaining bioactive compounds and sensory attributes (Lee and Feng 2011). For
this purpose, emerging nonthermal technologies are under exploration, including ultrasound, high
pressure processing, pulsed electric fields, irradiation, and cold plasma for the preservation of fresh
fruits and vegetable products (Knorr and others 2011). Fresh fruit and vegetable products have
been associated with various foodborne outbreaks over the past several decades. E. coli serotypes
O157:H7 is one of the major causes of the epidemic in fruits and vegetable products, including the
juices (Besser and others 1993; CDC 1996; Cody and others 1999; Gillespie 2016). Although there
is no recent outbreak associated with E. coli in carrot juice, there is a chance for growth of this
pathogen in carrot juice and other low-acid juices. The HACCP regulation requires that the
processing conditions for juice pasteurization should reduce the most resistant microorganisms of
concerns by at least 5 log (US FDA, 2001).
Ultrasound processing has shown promising results in microbial inactivation in fruit and
vegetable juices (Knorr and others 2004) where the cavitation phenomenon generated by
ultrasound is responsible for microbial inactivation. During cavitation, there is a generation of
bubbles and micro-currents which can catalyze chemical reactions and disrupt microbial cells, lead

103
to the formation of wrinkles, ruptures, and perforation, which ultimately cause the death of the
microbial cells (Barbosa-Cánovas and Rodríguez 2002; Ugarte‐Romero and others 2006).
The effects of ultrasound on the inactivation of microorganisms and physicochemical
properties have been studied on many acidic fruit juices such as apple, orange, and strawberry
(Tiwari and others 2009; Patil and others 2009). Previous studies suggest that ultrasound is
successful in pasteurizing high acid juices. Processing of low-acid juices is challenging as a
number of pathogenic and spoilage microorganisms are resistant at high pH. Ultrasound processing
alone (sonication) is not very efficient on the inactivation of microorganisms in low-acid products;
therefore, it is generally combined with temperature (thermosonication) (Piyasena and others
2003). Ultrasound processing at sub-lethal temperatures (<50°C) requires either high acoustic
energy density (AED) or very long treatment times to get 5 log reduction of vegetative
microorganisms (Lee and others 2009). Many studies show that the combination of ultrasound and
temperature below 50°C is not very effective on micorbial inactivation (Raso and others 1998;
López-Malo and others 1999; Villamiel and de Jong, 2000) whereas the combination of ultrasound
and lethal temperatures has shown to have a strong synergistic effect in microbial load reduction
(Piyasena and others 2003; Feng and others 2008). Wordon and others (2012) found a significant
decrease in D-value of S. cerevisiae by ultrasound processing at 60°C (D-value 0.73 min) as
compared to temperature alone (D-value 3.53 min) and ultrasound alone (D-value 3.1 min). Lee
and others (2009) studied the inactivation of E. coli K12 using ultrasound combined with thermal
energy. They observed that the combination of lethal parameters (temperature and/or pressure)
significantly reduced the time required to obtain 5 log reduction. There is a temperature upper limit
that can be used in combination with ultrasound; when ultrasound is carried out at high
temperatures there is a cushioning effect, and the vapor filled bubbles break less violently, and the

104
effect of ultrasound in the combined process will be less significant (Ugarte-Romero and others
2007). Raso and others (1998) found that in the combination of ultrasound and high temperature
(>58°C), the level of reduction in microorganisms by temperature alone is similar to the one
achieved by the combined effect of ultrasound and temperature.
The objective of this work was to investigate the synergistic effect of ultrasound when
combined with mild temperatures on the inactivation of E. coli in fresh carrot juice and to
investigate possible changes in some of its physicochemical characteristics. In this study, carrot
juice was selected as a model food based on its pH (low-acidic; pH: 6.82) which could act as an
excellent medium for the growth of foodborne pathogens. Since the present study is focused on
the mild-pasteurization of fresh carrot juice; a surrogate for pathogenic E. coli was selected to
study the inactivation kinetics, unlike severe-pasteurization where the process is focused on the
inactivation of non-proteolytic Clostridium botulinum type E spores (Vervoort and others 2012).
This study identifies processing conditions to effectively pasteurize low-acid juices in short
periods of time making the process energy efficient and cost effective by combining ultrasound
and mild temperatures.
2. Materials and methods
2.1 Preparation of carrot juice
Fresh carrots (Dacus carota) were purchased in bulk from a local market in Pullman, Washington,
USA. Carrots were screened, washed, cut into pieces, and extracted by using a domestic juice
extractor (Hamilton Beach JE2200B, Black & Decker, MD, USA). The juice was then filtered
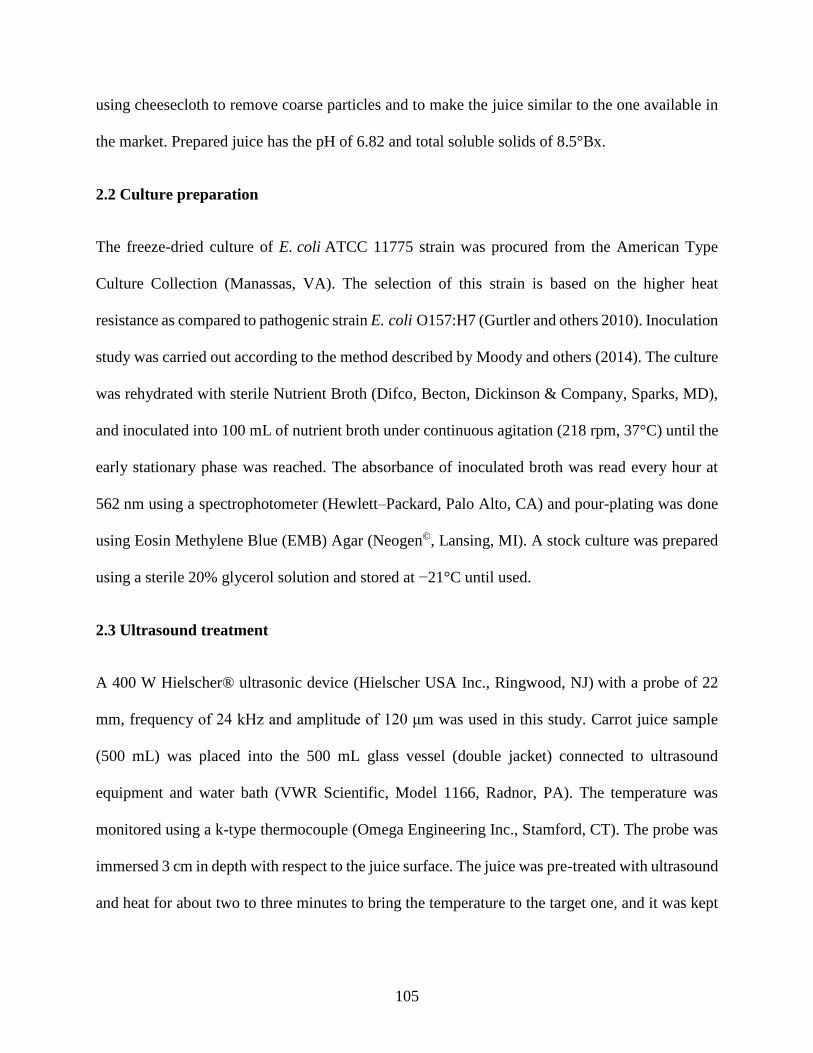
105
using cheesecloth to remove coarse particles and to make the juice similar to the one available in
the market. Prepared juice has the pH of 6.82 and total soluble solids of 8.5°Bx.
2.2 Culture preparation
The freeze-dried culture of E. coli ATCC 11775 strain was procured from the American Type
Culture Collection (Manassas, VA). The selection of this strain is based on the higher heat
resistance as compared to pathogenic strain E. coli O157:H7 (Gurtler and others 2010). Inoculation
study was carried out according to the method described by Moody and others (2014). The culture
was rehydrated with sterile Nutrient Broth (Difco, Becton, Dickinson & Company, Sparks, MD),
and inoculated into 100 mL of nutrient broth under continuous agitation (218 rpm, 37°C) until the
early stationary phase was reached. The absorbance of inoculated broth was read every hour at
562 nm using a spectrophotometer (Hewlett–Packard, Palo Alto, CA) and pour-plating was done
using Eosin Methylene Blue (EMB) Agar (Neogen©, Lansing, MI). A stock culture was prepared
using a sterile 20% glycerol solution and stored at −21°C until used.
2.3 Ultrasound treatment
A 400 W Hielscher® ultrasonic device (Hielscher USA Inc., Ringwood, NJ) with a probe of 22
mm, frequency of 24 kHz and amplitude of 120 μm was used in this study. Carrot juice sample
(500 mL) was placed into the 500 mL glass vessel (double jacket) connected to ultrasound
equipment and water bath (VWR Scientific, Model 1166, Radnor, PA). The temperature was
monitored using a k-type thermocouple (Omega Engineering Inc., Stamford, CT). The probe was
immersed 3 cm in depth with respect to the juice surface. The juice was pre-treated with ultrasound
and heat for about two to three minutes to bring the temperature to the target one, and it was kept

106
constant. After reaching the target temperature, E. coli culture was inoculated to get the final
concentration of >5 log CFU/mL. Sample at time zero was taken out immediately after the
inoculation. Inoculated juice was treated by ultrasound in combination with three different
temperatures (50, 54, and 58°C) to study the combined effect of ultrasound and heat. The selection
of different temperatures was based on the effectiveness of the combined processes. Ultrasound
treatments at a temperature below 50°C had shown the lesser effect on microbial inactivation
whereas the effect of ultrasound in the combined process is less significant when the processing
temperature is more than 58°C (Raso and others 1998; Ugarte-Romero and others 2007; Lee and
others 2009). The ultrasonic intensity (UI) for each treatment was 37.87 W/cm2. A wide range of
processing times (0 to 10 min) was selected to study the kinetics of inactivation. Samples were
collected every minute and kept in sterile test tubes with 0.1% peptone water. The fresh, untreated
carrot juice was considered as a control sample, and the treatments were conducted in triplicates.
2.4 Microbiological analysis
Microbiological analysis was conducted as per the methods described by Moody and others
(2014). Serial dilutions of the samples were made with 0.1% (w/v) peptone water (Becton,
Dickinson, and Company, Sparks, MD). One milliliter of decimal dilutions of processed juice was
pipetted into Petri dishes followed by addition of about 20 mL of molten eosin methylene blue
(EMB) agar (45°C) to each plate and was allowed to solidify for 30 min at room temperature. The
plates were turned upside down and incubated at 37ºC for 48 hours. Survivor counts were carried
out manually and expressed as CFU/mL.

107
2.5 Microbial inactivation kinetics
Three different general equations: first-order, Weibull distribution, and biphasic were selected to
model the observed inactivation data of E. coli. The models performance were evaluated based on
the statistical indices: correlation coefficient (R2 and pseudo-R2), root mean square error (RMSE),
F-value (compared to F critical), Bias factor (Bf), and Accuracy factor (Af) (Baranyi and other
1999). The value of R2 close to 1 and a low value of RMSE indicates the goodness of fit of the
model. The predicted values of the mathematical models and statistical indices were calculated
using Microsoft Excel 2016 and GInaFiT (Geeraerd and others 2005).
2.5.1 First-order
A first-order decay reaction usually describes the microbial inactivation kinetics in conventional
thermal pasteurization. This model is based on the assumption that all cells have equal resistance
to the treatment. Bigelow (1921) represents this model in the form of thermal death time and
decimal reduction time:
Log (Nt
N0) = −
t
D , (1)
where Nt is the survivor at time t (minutes), N0 is the initial microbial load, and D is the decimal
reduction time in minutes.
2.5.2 Weibull model
The Weibull model has two parameters with the assumption that microbial cells have different
resistance to the applied treatment. This model was initially proposed by Peleg and Cole (1998) in

108
the form a Weibull distribution function which was later modified by Mafart and others (2002)
and again reparametrized by van Boekel (2002) (Equation 2).
Log (Nt
N0) = − (
t
δ)
p
, (2)
where δ is the time for 1 log reduction and p describes the shape of survival curve (linear: p=1;
nonlinear: p≠1; upward concavity: p<1; downward concavity: p>1 (van Boekel 2002).
2.5.3 Biphasic model
A biphasic model that was proposed by Cerf (1977) can describe nonlinear microbial death curves.
According to this model, the microbial population is categorized into two different populations:
treatment-sensitive and treatment-resistant. Geeraerd and others (2005) expressed this model in
the following form:
𝑁(𝑡) = 𝑁0(𝑓𝑒−𝑘1 𝑡 + (1 − 𝑓)𝑒−𝑘2 𝑡), (3)
where f and (1-f) are the fractions of treatment-resistant and treatment-sensitive cells, respectively.
The parameters k1 and k2 are death rate constant for the two phases.
2.6 Determination of color parameters
Color was measured using the CIE (Commission Internationale d'Eclairage) color scale to
measure the parameters L* (lightness to darkness), a* (redness to greenness) and b* (yellowness
to blueness). Juice sample (40 mL) was placed into high-density polyethylene bags, and the color
parameters were determined using a Minolta CM-2002 colorimeter (Minolta Camera Co., Osaka,
Japan).

109
2.7 Determination of pH, soluble solids content, and acidity
The pH of fresh and processed samples immediately after treatment were measured by using a pH
meter (Thermo Electron Corporation, Orion 4 Star). Five milliliters of the sample were poured into
a beaker, stirred, and the electrode was immersed directly into the sample at 20ºC. The soluble
solids content was assessed in the fresh and processed juice using a refractometer (Atago No. 3840,
Atago Co., Ltd, Japan). A sample of the juice was placed on the prism of the refractometer and
read directly. The measurements were done in triplicate, and the obtained values were reported as
ºBrix.
For the determination of acidity, juice sample (5 mL) was titrated against a standardized
NaOH solution. Titratable acidity (TA) was expressed in terms of citric acid.
2.8 Determination of phenolic compounds, ascorbic acid, and total carotenoid
Total phenolic compounds were determined using a colorimetric method described by Singleton
and others (1999) with some modification. This technique is based on the reduction of the Folin-
Ciocalteau reagent by phenolic compounds with a formation of a blue complex. The phenolic
compounds were extracted from 1 mL of carrot juice with 10 mL of methanol for 24 h in darkness
under agitation and separated by centrifugation at 4500 rpm for 10 min using an MSE Centaur 2
centrifuge (MSE (UK) Ltd. London, UK). A 40 μL aliqot of extracted solution, 130 μL of Folin-
Ciocaltaeau reagent, and 625 μL of deionized water were mixed using a vortex (Daigger Vortex
Genie 2 Model G-560, Daigger Scientific, Inc, Vermon Hills, IL) and left at room temperature
(22°C ± 1°C) for 5 min. After that, 1.25 μL of saturated sodium carbonate (Na2CO3) solution
(20%) was added, and the mixture was left for 90 min in darkness. The absorbance was measured

110
at 760 nm using a spectrophotometer (Spectronic 20 Genesys, Spectronic Instruments Inc.,
Rochester, NY). The total phenolic compounds were measured from the calibration curve obtained
from standard gallic acid solution. Total phenolic compounds were expressed as μg of gallic acid
equivalents (GAE) per mL of carrot juice.
The ascorbic acid content of the juice before and after treatment was determined using the
method described by Helrich (1990), which is based on the 2, 6-dichlorophenol-indophenol
titration. Carrot juice sample (5 mL) was placed in a centrifuge tube and 10 mL of metaphosphoric
acid-acetic acid solution was added. The mixture was centrifuged at 4000 rpm for 5 min and 10
mL of supernatant was titrated with indophenol solution to get faint pink color end point.
The total carotenoid content was measured in fresh and processed carrot juice with the
methodology described by Zhou and others (2009) with some modifications. Carrot juice samples
(2 mL) was mixed with 10 mL chloroform/methanol (2:1). After mixing, the organic phase was
separated from the aqueous phase. Repeated extraction of the aqueous phase was done until it was
colorless. The separated organic phase was collected and diluted to 50 mL using
chloroform/methanol. Absorbance was measured at 450 nm, and results were expressed as μg β-
carotene equivalent/100 mL of carrot juice.
2.9 Statistical analysis
Data obtained was represented as mean value ± standard deviation (SD). One-way ANOVA was
conducted at a significance level of 0.05. Significant differences between mean values were
determined by LSD (least significant differences) pairwise comparison test. Statistical analysis
was performed using SAS 9.2 (SAS Institute Inc. NC, USA).

111
3. Results and discussion
3.1 E. coli Inactivation
Applied processing temperatures (50, 54, and 58°C) and treatment times (0 to 10 min) both had a
significant effect (p<0.05) on E. coli inactivation (Figure 18). More than 5 log reduction of E. coli
was achieved in 2 min by the application of ultrasound (24 kHz, 120 µm, 400 W) at 58°C. In the
treatment at 54°C, 10 min was required to achieve the same level of reduction. However, at 50°C,
only 3.5 log reduction was achieved after 10 min of treatment.
The cavitation effect due to application ultrasound might have caused the dispersion of the
microbial clumps and disruption of cell membranes, which is responsible for lysis of
microorganisms (Hayer 2010; Cruz-Cansino and others 2016). The application of mild heat (50,
54, and 58°C) helped to weaken the cell membrane which further supported the cavitation
phenomenon for the disruption of the cell membrane causing the death of microbial cells more
efficiently (Villamiel and de Jong 2000). In addition to applied heat, during ultrasound processing,
there is also the formation of hydrogen peroxide and free radicals which also enhances the
inactivation of microorganisms (Ciccolini and others 1997; Cruz-Cansino and others 2016).
At the beginning of the treatment, there was a shoulder in the inactivation curve for the
treatments at 50 and 54°C. The shoulder might be due to the formation of clumps by E. coli, where
the treatment conditions were too weak to break them (Hayer 2010; Cruz-Cansino and others
2016). For the ultrasound treatment at 58°C, there was no shoulder, as at this temperature level
treatment dose might be strong enough to break the microbial clumps and in this case, there was
fast inactivation of E. coli, which was followed by tailing which it was also observed in the

112
treatments at 50 and 54 °C. The presence of treatment-resistant subpopulations as well as the
presence of any ‘artifact’ that interfere the inactivation of microorganisms can cause tailing of the
survivor curve (Bermúdez-Aguirre and others 2009).
In a recent study, Lee and others (2013) found 5 log reduction of E. coli K12 in apple cider
using an ultrasound treatment (3 W/mL, 59°C) for 3.8 min; the time required for 5 log reduction
in their studies was slightly higher than the present work. Cruz-Cansino and others (2016) studied
the effect of amplitude (60-90%) and treatment time during ultrasound treatments (1500 W,
20 kHz) on the inactivation of E. coli in cactus pear juice. They observed that the treatment time
of 5 min at 90% level of amplitude resulted in inactivation below the detectable limit (7 log
reduction). In another study, 5.07 log reduction of E. coli O157:H7 was obtained in apple cider by
combined application of ultrasound (20 kHz, 118 W/cm2) and temperature (57±1°C) for 18 min,
whereas temperature alone rendered only 3.79 log reduction (D'amico and others 2006). These
results show a strong synergistic effect between ultrasound and temperature on the inactivation of
microorganisms. Jabbar and others (2014) found only 1.5 and 1.8 log reduction of the total plate
count, and yeast and molds respectively in carrot juice by sonication (20 kHz, 70% amplitude,
15°C) in 5 minutes. The lower level of inactivation in their work might be due to the application
of ultrasound at low temperature and low amplitude as compared to the present one. Other
researchers (Ugarte-Romeo and others 2006; Lee and others 2009) have used a different strain of
E. coli; this might be one of the reasons for different results. Including the strain of
microorganisms, there are also other factors that influence the inactivation such as the size of the
treatment vessels, the position of the sonotrode, acoustic energy density, and the amplitude of the
applied frequency.

113
Hence, the results show increasing the treatment temperature enhances the rate of
inactivation proving synergistic effect between ultrasound and temperature. However, increasing
the processing temperature beyond certain limits, the role of cavitation becomes less relevant. The
maximum temperature that can be used in ultrasound processing depends on the media as it is
known that increasing the temperature will increase the vapor pressure and decrease surface
tension. This phenomenon will lead to the collapse of the cavitation bubbles less violently which
will have less impact on microbial inactivation (Ugarte-Romero and others 2007).
Figure 18. Inactivation kinetics of E. coli: (a) inactivation curve at different temperatures (50, 54, and
58°C); Modeling the inactivation kinetics of E. coli by ultrasound at 50 (b), 54 (c), and 58°C (d) using first-
order, Weibull, and Biphasic model.
-6
-5
-4
-3
-2
-1
0
0 2 4 6 8 1 0
Log
(Nt/
N0)
Time (min)a
US+50C US+54C US+58C
-4
-3
-2
-1
0
0 2 4 6 8 10
Log
(Nt/
N0)
Time (min)b
Observed First-Order
Weibull Biphasic
-5
-4
-3
-2
-1
0
0 2 4 6 8 10
Log
(Nt/
N0)
Time (min)c
Observed First-Order
Weibull Biphasic
-6
-4
-2
00 0.4 0.8 1.2 1.6 2
Log
(Nt/
N0)
Time (min)d
Observed First-Order
Weibull Biphasic

114
3.2 Mathematical modeling
Survival curves of E. coli obtained by plotting log (Nt/N0) vs. treatment time (min) at different
temperature were fitted to first-order, Weibull, and biphasic models. The first-order model has
been widely used to study the inactivation curves in many thermal and nonthermal processes. In
the present study, the observed data on E. coli inactivation did not fit well with the first-order
model as it can be observed in Figure 18, as well as from statistical indices (Table 1) at various
temperature levels as compared to the other models. Regarding statistical indices, for the first-
order model, the value of R2 was low as compared to the other two models. The lower value of R2
indicates comparatively lower goodness of fit. Furthermore, the value of RMSE was high as
compared to the other two models; this also supports that first-order model did not have good
correlation with the inactivation kinetics data. F-test shows the calculated value of F was lower
than the critical value in all the models and at all processing conditions; but when three models
were compared the value of F was higher in the first-order model. This kind of deviation of the
inactivation curve from the conventional first-order model was well described in ultrasound as
well as in other nonthermal processing of fruits and vegetable juices as shown by Peleg and Cole
1998; Peleg and Cole 2000; Lee and others 2009; Adekunte and others 2010b. The results of the
present study are in line with the finding of Lee and others (2013) who observed similar deviation
of the inactivation curve. This kind of deviation from the linear first-order model in ultrasound can
be explained by the vitalistic approach (Cerf 1977; Cole and others 1993). According to the
vitalistic concept, in a microbial population, individual cells have different resistance to the lethal
treatment, which results into nonlinear inactivation curves with shoulders and tails (Cole and
others 1993). In the present study, treatment-sensitive cells of E. coli most likely inactivated first,
and the remaining cells with higher resistant to combined treatment were slowly inactivated

115
resulting in a tailing effect. The D-value (time required for one log reduction of the microbial
population) for the ultrasound treatment at 50, 54, and 58°C was found to be 2.95, 2.42, and 0.44
min respectively. In a study conducted by Lee and others 2009, there was a negligible reduction
of E. coli K12 cell at 54°C, 4 min; but when ultrasound was introduced at same temperature and
time, there was about 4 log reduction. This shows that application of ultrasound significantly
reduces the time required for 5 log reduction. Regarding the treatment at 58°C in the present study,
2.2 min was required to achieve 5 log reduction of E. coli in carrot juice. It can be considered as a
considerable reduction in the processing time as compared to a conventional thermal treatment,
especially for the low-acid juices, which require a higher temperature and a longer treatment time
if heat is used alone.
The Weibull model was successful in fitting E. coli inactivation data obtained after
combined treatments, as can be seen from the kinetic curves (Figure 18) and statistical indices
values (Table 9). The value of shape factor (p = 0.33 to 0.58) shows that the inactivation curves
have upward concavity or tailing. The formation of this concavity is mainly due to fast inactivation
of sensitive cells of the microbial population and slow inactivation of resistant cells. (Peleg 2006,
Feng and others 2008). Ugarte-Romero and others (2006) observed tailing (upward concavity)
with p-values from 0.547 to 0.720 during E. coli K12 inactivation by the combined application of
ultrasound (20 kHz) and heat (40-60°C) in apple cider, which is very similar to the current results.
On the other hand, Adekunte and others 2010b observed downward concavity during yeast
inactivation in tomato juice by ultrasound (1500 W, 61 µm amplitude, 20 Hz and 25-39.9°C). The
time for one log reduction using Weibull model in the present study was found to be 2.79, 2.10,
0.27 min for the ultrasound treatment at 50, 54, and 58°C respectively. Considering the treatment

116
at 58°C, according to the Weibull model, the time required for 5 log reduction of E. coli in carrot
juice is 1.35 min at the selected processing conditions.
For some treatments, there was fast inactivation at the beginning followed by slow
inactivation, forming two phases in the curve. To fit the inactivation curve with two phases, the
biphasic model was further taken into consideration. Nonlinear inactivation curve with two phases
were fitted well with the biphasic model as demonstrated by slightly high values of pseudo-R2 and
relatively low RMSE value (Table 9) as compared to Weibull. Regarding the F-test, there was no
significant difference between the Weibull and biphasic models. Results show that with the
increase in ultrasound processing temperature, faster inactivation of E. coli was observed at the
beginning of the treatment. For example, in an ultrasound treatment at 58°C, there was no shoulder
(Figure 18d). The biphasic model fitted slightly better the processing condition at 58°C than the
ones at 50°C and 54°C as it is observed by pseudo-R2 and RMSE-values. The time for 5 log
reduction using the biphasic model in the present study was found to be 14.15, 10.6, 1.35 min for
the ultrasound treatment at 50, 54, and 58°C respectively. Some other studies also show similar
trends in inactivation by ultrasound (Ugarte-Romero and others 2006; D’Amico and others 2006).
The bias factor values for all the treatment were close to one (0.998-1.094) except for the
first-order model (treatment at 58°C, Bf 0.745, see Table 9). Bf values close to one indicates good
agreement between observed and predicted values, whereas the value of Bf smaller than one
indicates under prediction and the value greater than one indicates over prediction. At all treatment
conditions, the biphasic model and the Weibull model had lower accuracy factors (Af 1.028-1.869)
as compared to first-order model (Af 1.789-1.979). The lower the value of accuracy factor the
better is the model. Hence, biphasic and Weibull model could accurately predict the survivors

117
during ultrasound treatment at mild temperatures. Ultrasound treatment at a temperature below
54°C has shown to have a shoulder in the inactivation curve; in this case, Weibull model would be
an excellent tool to predict the survivors. For ultrasound treatments at 58°C, there was no shoulder
formation. Instead, there are two stages in the inactivation curve, therefore the biphasic model
would adequately predict the survivors.
Table 9. Statistical comparison of three different mathematical models: First-order, Weibull, and Biphasic
based on R-square, Root mean square error (RMSE), Bias factor (Bf), Accuracy factor (Af), and F-test.
Processing
Conditions Statistical Index
Models
First-order Weibull Biphasic
US+50°C
R-Square 0.915 0.973 0.989
RMSE 0.415 0.255 0.179
Bias factor (Bf) 1.014 1.094 1.046
Accuracy factor (Af) 1.832 1.572 1.272
F 1.092 1.027 1.006
F table 3.787 3.787 3.787
US+54°C
R-Square 0.900 0.943 0.964
RMSE 0.554 0.459 0.409
Bias factor (Bf) 1.019 1.093 1.047
Accuracy factor (Af) 1.979 1.869 1.433
F 1.110 1.06 1.032
F table 3.787 3.787 3.787
US+58°C
R-Square 0.837 0.995 0.999
RMSE 1.191 0.259 0.095
Bias factor (Bf) 0.745 0.998 0.999
Accuracy factor (Af) 1.789 1.080 1.028
F 1.194 1.003 1.000
F table 6.388 6.388 6.388
US: Ultrasound
3.3 Effects of treatment on pH, soluble solids content, and acidity
The pH, soluble solids, and acidity of the juice are associated with the sensory quality, therefore
changes in these three attributes might negatively affect sensory. In this study, there were no
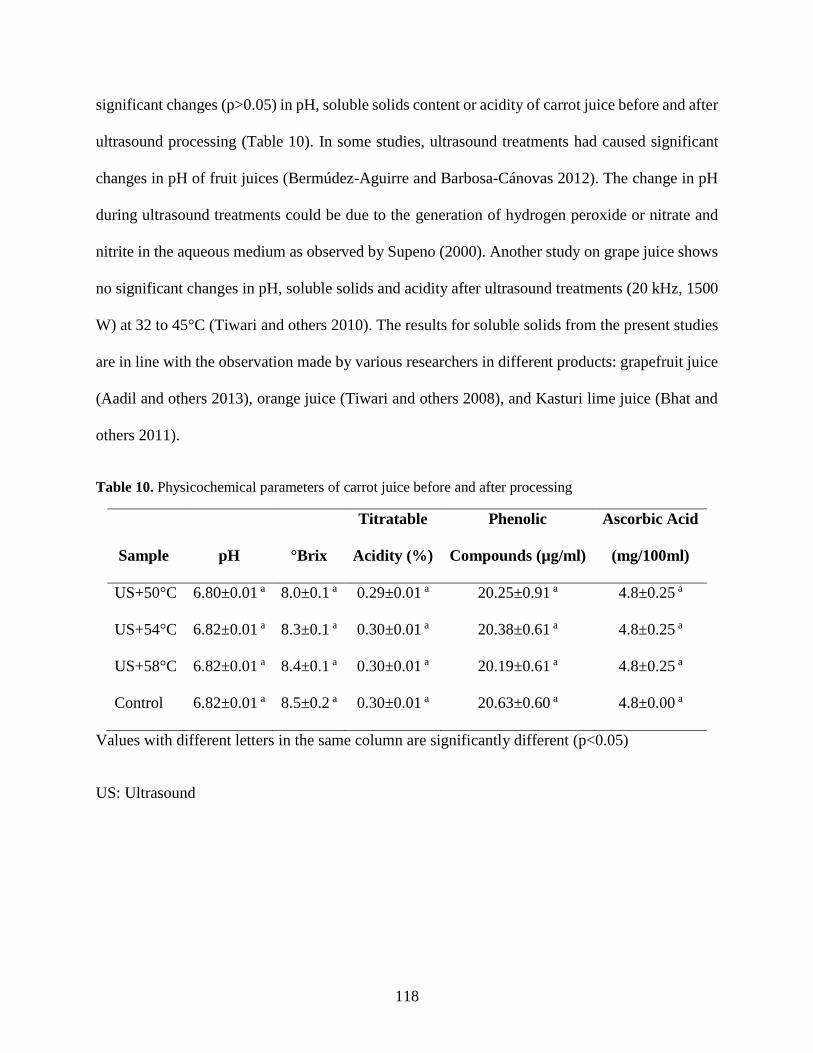
118
significant changes (p>0.05) in pH, soluble solids content or acidity of carrot juice before and after
ultrasound processing (Table 10). In some studies, ultrasound treatments had caused significant
changes in pH of fruit juices (Bermúdez-Aguirre and Barbosa-Cánovas 2012). The change in pH
during ultrasound treatments could be due to the generation of hydrogen peroxide or nitrate and
nitrite in the aqueous medium as observed by Supeno (2000). Another study on grape juice shows
no significant changes in pH, soluble solids and acidity after ultrasound treatments (20 kHz, 1500
W) at 32 to 45°C (Tiwari and others 2010). The results for soluble solids from the present studies
are in line with the observation made by various researchers in different products: grapefruit juice
(Aadil and others 2013), orange juice (Tiwari and others 2008), and Kasturi lime juice (Bhat and
others 2011).
Table 10. Physicochemical parameters of carrot juice before and after processing
Sample pH °Brix
Titratable
Acidity (%)
Phenolic
Compounds (µg/ml)
Ascorbic Acid
(mg/100ml)
US+50°C 6.80±0.01 a 8.0±0.1 a 0.29±0.01 a 20.25±0.91 a 4.8±0.25 a
US+54°C 6.82±0.01 a 8.3±0.1 a 0.30±0.01 a 20.38±0.61 a 4.8±0.25 a
US+58°C 6.82±0.01 a 8.4±0.1 a 0.30±0.01 a 20.19±0.61 a 4.8±0.25 a
Control 6.82±0.01 a 8.5±0.2 a 0.30±0.01 a 20.63±0.60 a 4.8±0.00 a
Values with different letters in the same column are significantly different (p<0.05)
US: Ultrasound

119
3.4 Effects of treatment on color parameters
There was no significant difference (p>0.05) in color parameters (L*, a* and b*) between fresh
and ultrasound processed carrot juice (Table 11). Carotenoids are responsible for the characteristic
color of carrot juice. It clearly indicates that there was no degradation of carotenoids, and therefore,
there were no changes in a* (redness) and b* (yellowness) parameters. Maillard reaction can occur
in the juice resulting in darker color thereby reducing the lightness (L* value), but in the present
study, it was not observed. Valero and others (2007) found similar results in orange juice, where
there were no changes in color after sonication at 23-500 kHz and 120-600 W for 0 to 180 minutes.
However, Tiwari and others (2008) found a significant (p<0.05) decrease in a* value and increase
in L* and b* value when orange juice was treated by ultrasound (22.79 W/cm2) for 10 min. Cheng
and others (2007) observed the color change in sonicated and carbonated guava juice, i.e., the
authors found significant differences in all the color properties, although the naked eye did not
distinguish those differences. Fonteles and others (2012) concluded that during sonication,
disruption of cell membranes causes the formation of carotenoid-protein complexes which results
in color change. In the present study, the heat treatment (≤58°C) was moderate, so there were no
significant (p>0.05) effects on the carrot juice color.
Table 11. Color parameters of carrot juice before and after processing
Sample L* a* b*
US+50°C 50.94±1.73 a 18.83±1.10 a 33.10±0.81 a
US+54°C 50.10±0.68 a 19.51±0.07 a 32.96±0.20 a
US+58°C 50.81±1.73 a 20.66±2.59 a 31.75±1.76 a
Control 50.05±0.68 a 19.33±1.12 a 32.71±0.90 a

120
Values with different letters in the same column are significantly different (p<0.05)
US: Ultrasound
3.5 Effects of treatment on total carotenoid
There was non-significant (p>0.05) increase in total carotenoid content in carrot juice after
processing (Figure 19). Ultrasound processing at 50, 54, and 58ºC resulted in an increase in total
carotenoid content, about 2.71%, 3.27%, and 3.44%, respectively as compared to fresh juice. The
mechanical disruption of cell walls during cavitation might have released free carotenoid in juice,
resulting into its slight increment. Within the applied three different temperatures, the total
carotenoid contents increased with the increase in processing temperature (Figure 2). This increase
might be attributed to the release of bound form of carotenoid due to the combined effect of
ultrasound and heat. The incorporation of heat during the process might cause the softening of the
vegetable tissues thereby supporting the release of carotenoid during cavitation. Abid and others
(2014) observed a significant increase in total carotenoid content in apple juice treated with
ultrasound for 30 and 60 min as compared to the untreated sample. In the present study, the
treatment times were much shorter than in other studies which resulted in a minor increase in total
carotenoid content (1777.5 µg/100 ml in fresh juice to 1841.5 µg/ 100 ml in the juice sonicated at
58°C).

121
Figure 19. Carotenoid content of juice before and after processing, control indicates the fresh juice
without any treatment, US+50°C, US+54°C, US+58°C are three different ultrasound treatment at 50, 54
and 58°C respectively. There was non-significant (p>0.05) increment in total carotenoid content after
each treatment.
3.6 Effects of treatment on phenolic compounds
Total phenolic compounds did not change significantly (p>0.05) when ultrasound was applied at
50, 54 and 58°C for 10 min. The fresh juice had 20.63 g/mL of phenolic compounds and juice
processed at 50, 54, and 58ºC presented values of 20.25, 20.38 and 20.19 g/mL, respectively.
Abid and others (2014) observed a significant increase in phenolic compounds in apple juice after
being treated by ultrasound for 30 and 60 minutes.
The increase in phenolic compounds during ultrasound might be due to disruption of cell
walls, promoting the release of intracellular components. Furthermore, this increase in phenolic
compounds could also be justified by the reaction between hydroxyl radicals generated during
sonication, and the aromatic ring of polyphenols (Ashokkumar and others 2008; Zafra-Rojas and
others 2013). It seems that processing for a longer time (20 and 30 minutes) causes these changes,
1710
1760
1810
1860
Control US+50°C US+54°C US+58°C
Car
ote
no
ids
Co
nte
nt
(µg/
10
0 m
l)
a
a a a

122
and therefore the phenolic compounds are released. In this study, the processing time was only 10
minutes, so there were no structural modifications that would quantify a higher content of phenolic
compounds.
3.7 Effects of treatment on ascorbic acid
There was no significant change (p<0.05) in ascorbic acid content in carrot juice before and after
ultrasound processing at the selected conditions (Table 10). All samples had a content of ascorbic
acid of 4.80 mg/100 mL of carrot juice. Several reports show an increase in the content of ascorbic
acid after ultrasound processing. However, in those studies, ultrasound was applied at room
temperature with longer processing time as compared to the present study. For example, Zou and
Jiang (2016) processed carrot juice by ultrasound (40 kHz, 0.5 W/cm2) for 20 or 40 min. These
authors found 3.61% and 8.17% increase in ascorbic acid content as compared to fresh juice when
processed for 20 minutes and 40 minutes, respectively. Another study conducted by Aadil and
others (2013) reported significant (p<0.05) increase in ascorbic acid content for sonicated apple
juice treated at 60 and 90 min, while there was no change in its content for the same juice in 30
min of treatment. Abid and others (2014) showed a significant increase (p<0.05) in ascorbic acid
content in the samples processed for 60 and 90 min in comparison to samples treated for 30 min.
However, there are studies in which the authors found a decrease in the content of ascorbic acid
after ultrasound treatment. Khandpur and Gogate (2015) treated carrot juice with ultrasound (20
kHz, 100 W) for 15 min; the authors found a reduction of 39.5% in its ascorbic acid content as
compared to the fresh juice. Saeeduddin and others (2015) found 100% retention in ascorbic acid
content of pear juice after ultrasound processing (750 W, 20 kHz, 70% amplitude) at 25°C, 10
min. However, with increasing processing temperature to 45 and 65°C at the same treatment time,

123
the ascorbic acid content decreased by 6.25 and 8.75%, respectively. This indicates that ascorbic
acid can be retained more when the ultrasound is performed at low temperatures. Ascorbic acid is
very sensitive to heat, and it degrades as the processing temperature and time is increased.
Santhirasegaram and others (2013) found a significant (p<0.05) decrease in the ascorbic acid
content of mango juice treated by either ultrasound or thermal treatment as compared to fresh juice.
Adekunte and others (2010a) suggest that ascorbic acid degrades in fruits and vegetable juice after
ultrasound treatments. However, the changes in ascorbic acid depend on the intensity of the
ultrasound and the processing time. Thus, it is important to take into account the temperature and
time to preserve ascorbic acid during ultrasound processing.
4. Conclusions
This study shows the positive effects of using ultrasound in combination with mild temperatures
to process carrot juice fulfilling the FDA standards for juice pasteurization. The best processing
condition for carrot juice is 58°C for 2 min (24 KHz/120 µm, 37.87 W/cm2), which renders 5-log
reduction of E. coli at the shortest time without affecting the physicochemical quality and bioactive
compounds. Mathematical modeling of the survivor’s curve shows both Weibull and biphasic
model to be a good fit to predict the inactivation kinetics. All selected processing conditions had
no significant effect on the quality attributes of the juice. This study suggests that the effective
combination of ultrasound and mild temperature could be used to pasteurize low-acid juices at a
shorter time as compared to thermal processing and without significantly affecting the
physicochemical characteristics.

124
References
Aadil RM, Zeng X-A, Han Z, Sun D-W. 2013. Effects of ultrasound treatments on quality of
grapefruit juice. Food Chem 141(3):3201-6.
Abid M, Jabbar S, Hu B, Hashim MM, Wu T, Lei S, Khan MA, Zeng X. 2014. Thermosonication
as a potential quality enhancement technique of apple juice. Ultrason Sonochem 21(3):984-
90.
Adekunte A, Tiwari B, Cullen P, Scannell A, O’Donnell C. 2010a. Effect of sonication on colour,
ascorbic acid and yeast inactivation in tomato juice. Food Chem 122(3):500-7.
Adekunte A, Tiwari B, Scannell A, Cullen P, O'Donnell C. 2010b. Modelling of yeast inactivation
in sonicated tomato juice. Int J Food Microbiol 137(1):116-20.
Alighourchi H, Barzegar M, Sahari MA, Abbasi S. 2014. The effects of sonication and gamma
irradiation on the inactivation of Escherichia coli and Saccharomyces cerevisiae in
pomegranate juice. Iran J Microbiol 6(1):51.
Ashokkumar M, Sunartio D, Kentish S, Mawson R, Simons L, Vilkhu K, Versteeg CK. 2008.
Modification of food ingredients by ultrasound to improve functionality: a preliminary
study on a model system. Innovative Food Sci Emerging Technol 9(2):155-60.
Baranyi J, Pin C, Ross T. 1999. Validating and comparing predictive models. Int J Food
Microbiol 48(3):159-66.
Barbosa-Cánovas G, Rodríguez J. 2002. Update on nonthermal food processing technologies:
Pulsed electric field, high hydrostatic pressure, irradiation and ultrasound. Food Aust
54(11):513-20.
125
Bermúdez-Aguirre, D, Corradini, M. G, Mawson, R, & Barbosa-Cánovas, GV. (2009). Modeling
the inactivation of Listeria innocua in raw whole milk treated under thermo-
sonication. Innovative Food Sci Emerging Technol 10(2):172-78.
Bermúdez-Aguirre, D., & Barbosa-Cánovas, GV. (2012). Inactivation of Saccharomyces
cerevisiae in pineapple, grape and cranberry juices under pulsed and continuous thermo-
sonication treatments. J Food Eng, 108(3): 383-392.
Besser RE, Lett SM, Weber JT, Doyle MP, Barrett TJ, Wells JG, Griffin PM. 1993. An outbreak
of diarrhea and hemolytic uremic syndrome from Escherichia coli O157:H7 in fresh-
pressed apple cider. Jama-J Am Med Assoc 269 (17):2217-20.
Bhat R, Kamaruddin NSBC, Min-Tze L, Karim A. 2011. Sonication improves kasturi lime (Citrus
microcarpa) juice quality. Ultrason Sonochem 18(6):1295-300.
Bigelow, WD. 1921. The logarithmic nature of thermal death time curves. J Infect Dis 528-36.
CDC 1996. Outbreak of Escherichia coli O157:H7 infections associated with drinking
unpasteurized commercial apple juice. British Columbia, California, Colorado, and
Washington Morbid Mortal Wkly Rep 45 (44):975.
Cerf O. 1977. A review. Tailing of survival curves of bacterial spores. J Appl Bacteriol 42(1):1-
19.
Cheng L, Soh C, Liew S, Teh F. 2007. Effects of sonication and carbonation on guava juice quality.
Food Chem 104(4):1396-401.

126
Ciccolini L, Taillandier P, Wilhem A, Delmas H, Strehaiano P. 1997. Low frequency thermo-
ultrasonication of Saccharomyces cerevisiae suspensions: effect of temperature and of
ultrasonic power. Chem Eng J 65(2):145-9.
Cody SH, Glynn MK, Farrar JA, Cairns KL, Griffin PM, Kobayashi J, Fyfe M, Hoffman R, King
AS, Lewis JH. 1999. An outbreak of Escherichia coli O157:H7 infection from
unpasteurized commercial apple juice. Ann Intern Med 130(3):202-9.
Cole MB, Davies KW, Munro G, Holyoak CD, & Kilsby, DC. 1993. A vitalistic model to describe
the thermal inactivation of Listeria monocytogenes. J Ind Microbiol, 12(3-5):232-39.
Cruz-Cansino NDS, Reyes-Hernández I, Delgado-Olivares L, Jaramillo-Bustos DP, Ariza-Ortega,
JA, Ramírez-Moreno E. 2016. Effect of ultrasound on survival and growth of Escherichia
coli in cactus pear juice during storage. Braz J Microbiol, 47(2):431-437.
D'amico DJ, Silk TM, Wu J, Guo M. 2006. Inactivation of microorganisms in milk and apple cider
treated with ultrasound. J Food Prot 69(3):556-63.
Feng H, Yang W, Hielscher T. 2008. Power ultrasound. Food Sci Technol Int 14(5):433-6.
Fonteles TV, Costa MGM, de Jesus ALT, de Miranda MRA, Fernandes FAN, Rodrigues S. 2012.
Power ultrasound processing of cantaloupe melon juice: effects on quality parameters.
Food Res Int 48(1):41-8.
Geeraerd A, Valdramidis V, Van Impe J. 2005. GInaFiT, a freeware tool to assess non-log-linear
microbial survivor curves. Int J Food Microbiol 102(1):95-105.
Gillespie C. 2016. 15 E. coli Outbreaks of 2015. Food poisoning bulletin. Retrieved June 2, 2016,
from https://foodpoisoningbulletin.com/2016/15-e-coli-outbreaks-of-2015/

127
Gurtler JB, Rivera RB, Zhang HQ, Geveke DJ. 2010. Selection of surrogate bacteria in place of E.
coli O157:H7 and Salmonella Typhimurium for pulsed electric field treatment of orange
juice. Int J Food Microbiol 139(1):1-8.
Hayer K. 2010. The effect of ultrasound exposure on the transformation efficiency of Escherichia
coli HB101. Biosci Horiz 3(2):141-7.
Helrich, K. 1990. Official Methods of the Association of Official Analytical Chemists (AOAC).
Virginia USA: Association of Official Analytical Chemists.
Jabbar S, Abid M, Hu B, Muhammad Hashim M, Saeeduddin M, Lei S, Wu T, Zeng X. 2014.
Influence of sonication and high hydrostatic pressure on the quality of carrot juice. Int J
Food Sci Tech 49(11):2449-57.
Khandpur P, Gogate PR. 2015. Effect of novel ultrasound based processing on the nutrition quality
of different fruit and vegetable juices. Ultrason Sonochem 27:125-36.
Knorr D, Froehling A, Jaeger H, Reineke K, Schlüter O, Schoessler K. 2011. Emerging
technologies in food processing. Annual Rev Food Sci Technol 2:203-35.
Knorr D, Zenker M, Heinz V, Lee D-U. 2004. Applications and potential of ultrasonics in food
processing. Trends Food Sci Technol 15(5):261-6.
Lee H, Feng H. 2011. Effect of power ultrasound on food quality. In Feng H., Barbosa-Cánovas
GV., Weiss J. Editors. Ultrasound technologies for food and bioprocessing. New York:
Springer. p 559-82.

128
Lee H, Kim H, Cadwallader KR, Feng H, Martin SE. 2013. Sonication in combination with heat
and low pressure as an alternative pasteurization treatment-effect on Escherichia coli K12
inactivation and quality of apple cider. Ultrason Sonochem 20(4):1131-8.
Lee H, Zhou B, Liang W, Feng H, Martin SE. 2009. Inactivation of Escherichia coli cells with
sonication, manosonication, thermosonication, and manothermosonication: microbial
responses and kinetics modeling. J Food Eng 93(3):354-64.
López-Malo A, Guerrero S, Alzamora SM. 1999. Saccharomyces cerevisiae thermal inactivation
kinetics combined with ultrasound. J Food Prot 62(10): 1215-17.
Mafart P, Couvert O, Gaillard S, Leguérinel I. 2002. On calculating sterility in thermal
preservation methods: application of the Weibull frequency distribution model. Int J Food
Microbiol 72(1):107-13.
Moody A, Marx G, Swanson BG, Bermúdez-Aguirre D. 2014. A comprehensive study on the
inactivation of Escherichia coli under nonthermal technologies: High hydrostatic pressure,
pulsed electric fields and ultrasound. Food Control 37:305-14.
Patil S, Bourke P, Kelly B, Frías JM, Cullen PJ. 2009. The effects of acid adaptation on
Escherichia coli inactivation using power ultrasound. Innovative Food Sci Emerging
Technol 10(4):486-90.
Peleg M, Cole MB. 1998. Reinterpretation of microbial survival curves. Cr Rev Food Sci
38(5):353-80.
Peleg M, Cole MB. 2000. Estimating the survival of Clostridium botulinum spores during heat
treatments. J Food Prot 63(2):190-5.

129
Peleg M. 2006. Advanced quantitative microbiology for foods and biosystems: models for
predicting growth and inactivation. CRC Press.
Piyasena P, Mohareb E, McKellar R. 2003. Inactivation of microbes using ultrasound: a review.
Int J Food Microbiol 87(3):207-16.
Raso, J., Pagan, R., Condon, S., & Sala, F. J. (1998). Influence of temperature and pressure on the
lethality of ultrasound. Appl Environ Microbiol 64(2): 465-71.
Saeeduddin M, Abid M, Jabbar S, Wu T, Hashim MM, Awad FN, Hu B, Lei S, Zeng X. 2015.
Quality assessment of pear juice under ultrasound and commercial pasteurization
processing conditions. LWT-Food Sci Technol 64(1):452-8.
Santhirasegaram V, Razali Z, Somasundram C. 2013. Effects of thermal treatment and sonication
on quality attributes of Chokanan mango (Mangifera indica L.) juice. Ultrason Sonochem
20(5):1276-82.
Singleton VL, Orthofer R, Lamuela-Raventos RM. 1999. Analysis of total phenols and other
oxidation substrates and antioxidants by means of Folin-Ciocalteu reagent. Method
Enzymol 299:152-78.
Supeno, PK. 2000. Sonochemical formation of nitrate and nitrite in water. Ultrason
Sonochem, 7(3):109-113.
Tiwari BK, Muthukumarappan K, O’Donnell C, Cullen P. 2008. Effects of sonication on the
kinetics of orange juice quality parameters. J Agr Food Chem 56(7):2423-8.
Tiwari BK, O’Donnell C, Cullen P. 2009. Effect of nonthermal processing technologies on the
anthocyanin content of fruit juices. Trends Food Sci Technol 20(3):137-45.

130
Tiwari, BK., Patras, A., Brunton, N., Cullen, PJ., & O’Donnell, CP. 2010. Effect of ultrasound
processing on anthocyanins and color of red grape juice. Ultrason Sonochem, 17(3):598-
604.
Ugarte‐Romero E, Feng H, Martin SE, Cadwallader KR, Robinson SJ. 2006. Inactivation of
Escherichia coli with power ultrasound in apple cider. J Food Sci 71(2): E102-E8.
Ugarte‐Romero E, Feng H, Martin SE. 2007. Inactivation of Shigella boydii 18 IDPH and Listeria
monocytogenes Scott A with power ultrasound at different acoustic energy densities and
temperatures. J Food Sci 72(4):M103-M107.
US FDA. 2001. United States Food and Drug Administration. Hazard analysis and critical control
point (HACCP); procedures for the safe and sanitary processing and importing of juices;
final rule, Fed Regist 66:6138-202.
Valero M, Recrosio N, Saura D, Muñoz N, Martí N, Lizama V. 2007. Effects of ultrasonic
treatments in orange juice processing. J Food Eng 80(2):509-16.
van Boekel MA. 2002. On the use of the Weibull model to describe thermal inactivation of
microbial vegetative cells. Int J Food Microbiol 74(1):139-59.
Vervoort L, Van der Plancken I, Grauwet T, Verlinde P, Matser A, Hendrickx, M, Van Loey A.
2012. Thermal versus high pressure processing of carrots: a comparative pilot-scale study
on equivalent basis. Innovative Food Sci Emerging Technol 15: 1-13.
Villamiel M, de Jong P. 2000. Inactivation of Pseudomonas fluorescens and Streptococcus
thermophilus in Trypticase® Soy Broth and total bacteria in milk by continuous-flow
ultrasonic treatment and conventional heating. J Food Eng 45(3): 171-79.

131
Wordon B, Mortimer B, McMaster L. 2012. Comparative real-time analysis of Saccharomyces
cerevisiae cell viability, injury and death induced by ultrasound (20 kHz) and heat for the
application of hurdle technology. Food Res Int 47(2):134-9.
Zafra-Rojas QY, Cruz-Cansino N, Ramírez-Moreno E, Delgado-Olivares L, Villanueva-Sánchez
J, Alanís-García E. 2013. Effects of ultrasound treatment in purple cactus pear (Opuntia
ficus-indica) juice. Ultrason Sonochem 20(5):1283-8.
Zhou L, Wang Y, Hu X, Wu J, Liao X. 2009. Effect of high pressure carbon dioxide on the quality
of carrot juice. Innovative Food Sci Emerging Technol 10(3): 321-7.
Zou Y, Jiang A. 2016. Effect of ultrasound treatment on quality and microbial load of carrot juice.
Food Sci Technol (Campinas) 36(1):111-5.

132
CHAPTER FOUR
ON THE INACTIVATION OF Listeria innocua IN CARROT JUICE BY COMBINING
ULTRASOUND, HEAT, AND NISIN
Abstract
This study investigated the effectiveness of ultrasound combined with thermal treatments and with
or without nisin (a natural antimicrobial peptide) in inactivating L. innocua as surrogate for L.
monocytogenes at non-isothermal conditions. Carrot juice (pre-pasteurized) was inoculated with
L. innocua and treated with ultrasound. Ultrasound amplitude, nisin level, and processing
temperature had a significant synergistic effect on the inactivation of L. innocua. When ultrasound
is combined with mild temperature and nisin, the microbial load can be effectively reduced in a
shorter time than with thermal or ultrasound processes used alone. For instance, we observed that
the application of nisin (25 ppm) at 20°C and processing for 5 min at 100% amplitude (400 W)
resulted in a 2.7 log reduction, while the same ultrasound and temperature conditions with 50 ppm
of nisin resulted in a 3.5 log reduction. This study reveals 5 conditions to achieve at least a 5 log
reduction, and further analyses performed after treatment with these conditions reveal no change
in pH, and in all but one condition, no significant change in TSS. There was increase in the
carotenoid content as well as significant differences in darkness, color, hue angle, and chroma for
all processed samples. This combination of low heat, a natural antimicrobial agent and ultrasound,
can contribute to reducing the energy required for processing, while increasing throughput. The
quality of the juice is retained as treatment is performed at milder temperatures and over a shorter
time compared to conventional thermal processing.

133
1. Introduction
Recent consumer demands for minimally processed and clean label food products has led to the
development of various alternative approaches to food processing. Ultrasound, pulsed electric
fields, high pressure processing, and microwave heating are some of the novel technologies that
have been widely studied over the last few decades, and have received special attention to process
nutritious beverages such as carrot juice.
Ultrasound is a clean, nonthermal technology recognized as a promising technology for the
pasteurization of fruit juices without affecting quality or nutritional attributes (Valero et al., 2007;
Bhat et al., 2011). Ultrasound technology has seen growing interest in the fruit and vegetable juice
processing industry due to many benefits, including low energy consumption, retention of nutrients
during processing, and fast processing time (Chemat and Khan 2011). The basic principle of
ultrasound in microbial inactivation is cavitation. When ultrasound is passed to the liquid medium,
bubbles are generated; these bubbles grow with time and finally collapse, resulting in localized
high pressure, which ultimately inactivates the microorganisms. Thermal effects and shock waves
due to bubble implosion, free radical formation, and mechanical stresses due to microstreaming
all contribute to microbial inactivation via ultrasound (Valdramidis et al., 2010).
Ultrasound alone has not been found to meet the FDA’s requirement for juice
pasteurization, i.e., a 5 log reduction in the viable microbial population (Piyasena et al., 2003). But
when ultrasound is used in combination with a mild temperature increase, synergy has been
observed (Wordon et al., 2012; Sango et al., 2014)). The process can be rendered energy-efficient,
and cost-effective by combining ultrasound and mild heating with natural antimicrobials such as
nisin. For example, when ultrasound is combined with nisin, a lower processing temperature can

134
be used to achieve the same value of lethality observed in conventional thermal processes
(Abdullah and Chin, 2014). Furthermore, the quality of the product can be retained as the
processing time is shorter and the temperature required is much lower than conventional thermal
processes. Many studies have shown that incorporation of natural and synthetic antimicrobial
agents can improve results in combination with ultrasound processing. Rodgers and Ryser (2004)
observed 5 log reduction of E. coli O157:H7 and L. monocytogenes in apple cider by combining
ultrasound treatment (44 to 48 Hz) with sodium hypochlorite (100 ppm) and copper ion water (1
ppm). Not many studies have been reported on the combination of ultrasound, heat, and nisin.
Carrot juice is a nutritious beverage rich in beta carotene and polyphenols (Sharma et al.,
2012). This product has low acid (pH>4.5) and is susceptible to microbial spoilage. The application
of high temperatures to preserve this juice negatively affects its nutritional and sensory attributes
of the juice. Ultrasound processing is one potential technology to process this juice without loss
of its desirable attributes.
Listeria monocytogenes is a heat-resistant food-borne pathogen, which can grows rapidly
under a wide range of pH and temperature conditions (Bermúdez-Aguirre et al., 2011; Gastélum
et al., 2012; Abdullah and Chin, 2014). This microorganism can contaminate a wide variety of
food products. L. innocua is one of the commonly used non-pathogenic surrogates for the pathogen
L. monocytogenes (Francis and O’Beirne, 1998; Buzrul and Alpas, 2004). It is generally
considered a target microorganism for pasteurization as it is highly heat resistant and can also grow
at refrigeration temperatures and at wide range of pHs.
The objective of this study was to investigate the potential of incorporating nisin during
ultrasound processing of carrot juice at different temperatures, and to study the synergism between

135
ultrasound, moderate temperature increases, and nisin during processing. The impact of these
processes on pH, color, TSS and carotenoid content of processed juice were also part of this study.
2. Materials and Methods
2.1 Juice preparation
Pre-pasteurized commercially available carrot juice (Bolthouse Farms, Bakersfield, CA) was
purchased from the local supermarket for initial testing. The pre-pasteurized juice was used for
microbiological tests to avoid interactions between inoculated microorganisms and natural
microflora. The juice had a pH of 6.4 and TSS of 8˚Brix. For subsequent testing (quality
evaluation), fresh carrot juice was prepared in the lab using a domestic juice extractor using carrots
purchased from the local supermarket; fresh juice was used to better evaluate the effect of selected
process on the base attributes. The fresh juice had a pH of 6.8 and TSS of 8.4°Brix.
2.2 Culture Preparation
A freeze-dried culture of Listeria innocua (ATCC 8456TM) was purchased; the dry culture was
activated in tryptic soy broth with 0.6% yeast extract, agitating at 215 rpm at 37˚C for 7 h. Cells
in the early stationary phase were harvested, mixed with 20% glycerol in water, and stored at -
18˚C. During the experiment, frozen stock culture was thawed and activated in tryptic soy broth
with 0.6% yeast extract.
2.3 Ultrasound Treatment
A carrot juice sample (250 mL) was placed in a 500-mL double layer jacketed glass beaker
connected to a water bath (VWR Scientific, Model 1166, Miles, IL) to control the temperature.

136
The ultrasonic probe was immersed in the juice 2 cm below the surface. Ultrasound treatment was
performed using an ultrasonic generator of 400 W at a constant frequency of 24 kHz using
amplitude levels of 60, 80, and 100% (72, 96, 120 µm) for a duration of 0 to 5 minutes. Acoustic
energy densities (AED) for each amplitude were 0.28, 0.37, and 0.48 W/mL respectively. The
sample was first heated with ultrasound and water bath to bring it to the target temperature. The
come-up time was about 2 minutes. After that, the juice sample was inoculated with previously
activated L. innocua (6 log), the water bath was turned off, and ultrasound was left on. The
temperature was monitored during processing using a k-type thermocouple (Omega Engineering,
Inc., Stamford, CT). A 1 mL aliquot was taken every minute for microbiological analysis.
Table 11. Final temperature of the juice after ultrasound processing for 5 min at different amplitudes
Amplitude
Initial Temperature
(°C)
Final Temperature (°C)
after 5 min
72 µm
20 38.6±0.9
35 39.4±0.7
50 60.6±1.5
96 µm
20 44.0±0.4
35 53.0±2.8
50 64.3±0.8
120 µm
20 50.7±1.4
35 59.6±1.0
50 68.8±1.0
2.4 Survivor Analysis
Two serial dilutions of the juice were performed in 0.1% sterile peptone water. One milliliter of
decimal dilutions of processed juice was pipetted into Petri dishes followed by addition of about

137
20 mL of tryptic soy agar with 0.6% yeast extract agar (45°C). The plates were incubated for 24
hours at 37°C, after which colonies were counted manually and expressed as CFU/mL.
2.5 Energy Consumption
Energy consumption during the treatment was calculated using the time, temperature, data
(temperature rise during processing). The calorimetric method was used to quantify the work done
(Watt) (Eq. 1). The specific heat of the carrot juice was taken as 3.77 kJ/kg°C as described by Raso
et al. 1999,
𝑄 = 𝑚 ∙ 𝐶𝑝 ∙𝑑𝑇
𝑑𝑡, (1)
where Q is the work done in watts, m is the mass of juice (kg), Cp is the specific heat of juice
(kJ/KgºC), and dT/dt is the change in temperature with respect to time (min).
Acoustic energy density (AED) was calculated by dividing the work done (Q) by the
volume of sample (Eq. 2),
𝐴𝐸𝐷 =𝑄
𝑉, (2)
where V is the volume of juice in mL.
Ultrasonic intensity was calculated by dividing the work done by area of the sonotrode (Eq.
3).
𝑈𝐼 =𝑄
𝐴, (3)
where A is area of the sonotrode (m2)

138
2.6 Optimum Processing Conditions and Quality Evaluation
Selection of the optimum processing conditions was based on target microbial load reduction (5
log), the lowest level of nisin, lowest amplitude, and shortest processing time. Selected processing
conditions were evaluated based on their effects on quality attributes of carrot juice. Processed and
fresh (control) juice were analyzed for pH, total soluble solids, color, and carotenoid content. Total
aerobic mesophilic bacteria were also quantified in fresh and processed juice.
2.6.1 Total Aerobic Mesophilic Bacteria
To quantify the total number of aerobic mesophilic bacteria in fresh and processed juice samples,
serial dilutions of the juice were made with 0.1% peptone water. Samples were pour-plated in Plate
Count Agar (Difco, Becton, Dickinson and Co., Sparks, MD) and incubated at 37°C for 48 h;
mesophiles were counted manually and expressed as log (CFU/mL).
2.6.2 pH, TSS, and color
The pH of the juices was determined using a pH meter (Orio 4-star, Thermo Fisher Scientific,
Waltham, MA, USA) at 21 ºC. Color parameters (Lightness, L*; redness, a*; and yellowness, b*)
of the juices were measured using a colorimeter (Konica Minolta, CM-5, New Jersey, USA). Total
soluble solid (TSS) of the juice was determined using a hand-held refractometer (Atago No. 480,
Atago Inc. Tokyo, Japan) at 21°C.
2.6.3 Total carotenoid content
Total carotenoid content of juices was analyzed using the method described by Liao et al. (2007).
In brief, 25 mL of juice was mixed with 80 mL hexane/acetone mixture (1:1, v/v) in a separating

139
funnel. After standing for a few minutes, the organic phase was separated from the aqueous phase
and collected. Absorbance was measured at 450 nm using a spectrophotometer (Spectronic 20
Genesys, Spectronic Instruments Inc., Rochester, NY, USA). The total carotenoid content was
determined using the standard curve of β-carotene and the results were expressed as mg β-carotene
per liter of sample.
3. Results and Discussion
3.1 Effect of Ultrasound on Listeria Inactivation
Treatment at room temperature (20°C) with no nisin resulted in a less than 1 log reduction in 5
min at all amplitude levels, well below the 5 log reduction required by the FDA for juice
pasteurization (Figure 20). When the initial product temperature was raised to 35°C there was still
less than a 1 log reduction at the 60% amplitude level, but at 80% and 100% amplitude levels,
there was a ~2 log reduction after 5 min of treatment. In the present study, the processing time was
short (<5 min); a higher level of inactivation could be achieved when processing time is increased.
Bauman et al. (2005) studied the effect of temperature on L. monocytogenes inactivation by
ultrasound in apple cider; the authors found a 1.6 log reduction from processing at a constant
temperature of 20°C for 20 min. Even though the processing time was 20 min, relatively long
compared to the 5 min of the present study, the reduction was still low. However in Bauman’s
work, the temperature was held constant whereas, in the present study, processing was conducted
under non-isothermal conditions. The 20°C treatment resulted in a final product temperature of
~51°C at 100% amplitude, leading to a 2 log reduction in only 5 min. Inactivation of
microorganisms by ultrasound depends on many factors; amplitude of the ultrasonic wave,
processing temperature, acoustic energy density, and ultrasonic intensity are some of the most

140
critical. In addition, the type of food product and type of microorganism targeted are also
determining factors in ultrasound processing.
Figure 20. Effect of ultrasound amplitude on inactivation of L. innocua in carrot juice at 20°C (left) and
35°C (right).
In the present study, different amplitude level had a significant difference (p>0.05) effect
on microbial inactivation. At high amplitudes, there was a significant rise in temperature, as well
as high acoustic energy density (AED) and ultrasonic intensity. The AED, ultrasonic intensity, and
rise in temperature all played a significant role in the higher level of inactivation with the increase
in amplitude. Comparing the effect of amplitude at room temperature (20°C) and a mild
temperature (35°C) after 4 minutes of processing, the difference between amplitude levels were
clearly visible (Figure 23, right). At room temperature, 60% amplitude and 80% amplitude there
were not significantly (p>0.05) different; similarly, no significant difference was observed
between these two amplitude at 35°C until three min. For both temperatures, there appear to be
shoulders in the inactivation curve for all the measured amplitudes: a shoulder was observed at 4
min for the treatment at 20°C, and at three min for the treatment at 35°C. No shoulders were
-1
-0.8
-0.6
-0.4
-0.2
0
0 2 4 6
Log
(N
t/N
0)
Time (min)
60% Amplitude
80% Amplitude
100% Amplitude
-2.5
-2
-1.5
-1
-0.5
0
0 2 4 6
Log
(N
t/N
0)
Time (min)
60% Amplitude
80% Amplitude
100% Amplitude

141
observed in the case of treatment at 50°C (Figure 24). The presence of the shoulder indicates that
bacteria were not affected by the treatment prior to that point. As already demonstrated and stated
by Bermúdez-Aguirre et al. (2011), the main phenomena happening during ultrasound treatment
responsible for microbial death are the cavitation formation and the cavitation explosion.
Ultrasound generates local cavitation characterized by a higher temperature and pressure than the
surrounding environment mainly after bubble collapse; in addition, cavitation increase the
turbulence of the solution. All these changes in physical environment can affect bacteria; however,
the impact depends on different factors including treatment time, the amplitude of ultrasound, and
the type of microorganism. Hence, the weak effectiveness of the previous treatments may be due
to the bacterial strain. In fact, L. innocua, as a gram-positive bacterium, is less sensitive to pressure
increases than gram-negative bacteria (Shiu et al., 2001); the elevated pressure in the cavitations
may not be high enough to cause irreversible damage to the bacterial cell wall. Bacteria can recover
from injuries by synthesizing new components; this may explain the bacterial growth observed
regardless the ultrasound amplitude after treatment was performed at 20 or 35°C without nisin.
This lag phase also may exist if the microbe repairs itself, as death occurs only when the rate of
destruction exceeds the rate of re-synthesis (Mossel et al., 1995).
3.2 Combined Effect of Ultrasound and Temperature on Listeria Inactivation
A synergistic interaction was observed between ultrasound and mild temperatures (35 and 50°C)
on Listeria inactivation. An increase in inactivation level was observed with increasing amplitude
levels, and or increasing temperature (Figure 21). After 35°C and 5 min of treatment, there was
around a 1 log reduction when using 80% amplitude, and around a 2 log reduction for 100%
amplitude. When the temperature was increased to 50°C, a 3.5 log reduction was achieved in 5

142
min at 60% amplitude; at 80% and 100% amplitude, microbial counts were below the detectable
limit (>6 log reduction) in 4 min and 3 min, respectively. Experiments performed by Ordoñez et
al. 1987, revealed a synergistic effect between ultrasound and heat on the inactivation of
Staphylococcus aureus after treatment performed between 50.3°C and 56.7°C at 20 kHz, 150 W
for 3 to 7 minutes. In the present study, at a 60% amplitude level, there was less than a 1 log
reduction at 20 and 35°C, and no major change was observed upon raising the temperature to 50°C;
a sigmoidal inactivation curve was observed with low amplitude/high temperature combinations.
This may be due to the homeostasis of bacteria: during the first 2 min of treatment at 60%
amplitude and 50°C, bacteria were affected by the environmental change; after that time, they may
adapt their behavior to survive, and since the treatment is not intense enough to cause irreversible
damage, they recover. These processes may explain why there was same level of inactivation after
3 or 4 min of treatment; nevertheless, with treatment times over 4 min, greater inactivation was
observed, potentially because the bacteria are injured beyond their capacity for repair.
When combining ultrasound and heat, there is an upper limit of temperature that is effective
during processing. Temperature above this critical limit has no additional antimicrobial effect
beyond that of thermal treatment used alone. This is due to a cushioning effect, and the reduction
in cavitation effects at high temperature (Ugarte-Romero et al., 2007). The upper limit of
temperature for a given process depends upon the type of food product, and is mainly influenced
by rheological characteristics, density, and surface tension.

143
Figure 21. Effect of temperature at different amplitude levels on the inactivation of L. innocua in carrot
juice (Data are mean of three replicates)
3.3 Combined Effect of Ultrasound, Temperature, and Nisin on Listeria Inactivation
At room temperature, interaction between ultrasound and nisin was effective only at high
amplitude (Figure 22). Even at 100% amplitude, ultrasound treatment at room temperature for 5
min did not meet the FDA requirements for juice pasteurization (>5 log reduction). Addition of
-5
-4
-3
-2
-1
0
0 2 4 6L
og
(N
t/N
0)
Time (min)
60% Amp
20°C 35°C 50°C
-8
-6
-4
-2
0
0 2 4 6
Log
(N
t/N
0)
Time (min)
80% Amp
20°C 35°C 50°C
-8
-7
-6
-5
-4
-3
-2
-1
0
0 1 2 3 4 5 6
Log
(N
t/N
0)
Time (min)
100% Amp
20°C 35°C 50°C

144
nisin increases the effectiveness of ultrasound treatment, but the inactivation was still low (<4 log)
for the selected treatment time (Table 12). These results are in line with those described by Muñoz
et al. (2012), who found that nisin (2.5 mg/L) combined with ultrasound led to a 2.8 log (CFU/mL)
reduction, whereas ultrasound alone led to only a 1.1 log (CFU/mL) reduction in Listeria.
Table 12. Effect of nisin concentration on the inactivation of L. innocua at room temperature (20°C).
Nisin concentration L. innocua Log Reduction
60% Amp 80% Amp 100% Amp
0 ppm 0.23 ±0.29 0.29 ±0.75 0.89 ±0.47
25 ppm 1.08 ±0.91 1.81 ±0.62 2.69 ±0.97
50 ppm 1.40 ±0.24 2.54 ±0.40 3.58 ±0.15
(Data are mean of three replicates ± standard deviation)
Incorporation of nisin with mild temperature elevation during ultrasound treatment
significantly enhanced the inactivation efficiency of ultrasound (Figure 25). At 80% amplitude and
35°C there was around a 2 log reduction in 5 min. But when 25 ppm nisin was added, the
inactivation was >4 log. A further increase in temperature to 50°C led to a 5.5 log reduction in L.
innocua. At 100% amplitude and 50°C, complete inactivation was achieved in 3 min without nisin,
and in 1 min with 25 ppm nisin. Similarly, for 80% amplitude at 50°C, complete inactivation was
achieved at 4 min without nisin, 2 min with 25 ppm nisin, and 1 min with 50 ppm nisin. Ultrasound,
temperature, and nisin act synergistically to affect bacteria. All of these treatments affect the
bacteria cell wall or membrane; in fact, according to Lubelski et al. (2008), nisin acts by creating
pores in the membrane of cells and inhibiting cell wall synthesis. Nisin can easily affect the
membrane of gram-positive L. innocua. Many biological reactions are affected by temperature,

145
including membrane fluidity, which may help nisin reach the cytoplasm. In addition, the impact
of ultrasound on the cell membrane may enhance the action of nisin.
In the present study, a combination of ultrasound with mild temperature and nisin reduced
the treatment time and amplitude by 20 min and more than 66%, respectively; these reductions aid
in retaining the quality attributes of juice. These reductions also render the process economically
desirable; amplitude reduction results in a reduction in energy consumption during processing
(Table 16).
-7
-6
-5
-4
-3
-2
-1
0
0 1 2 3 4 5
Log
(N
t/N
0)
Time (min)
80% Amplitude, 35°C
0 ppm 25 ppm 50 ppm
-8
-7
-6
-5
-4
-3
-2
-1
0
0 1 2 3 4 5
Log
(N
t/N
0)
Time (min)
80% Amplitude, 50°C
0 ppm 25 ppm 50 ppm

146
Figure 22. Effect of different nisin concentration on inactivation of L. innocua at 35°C and 50°C
and at 80 and 100% amplitude level. Data are mean of three replicates
3.4 Energy Consumption during Processing
Temperature rise during processing was taken into account for energy use calculations. The
increase in temperature was dependent on the amplitude: at 60% amplitude, there was an increase
of about 15°C, and at 80 and 100% amplitude there was a rise of approximately 20 and 25°C,
respectively (Figure 23).
-8
-7
-6
-5
-4
-3
-2
-1
0
0 2 4 6L
og
(N
t/N
0)
Time (min)
100% Amplitude, 35°C
0 ppm 25 ppm 50 ppm
-8
-7
-6
-5
-4
-3
-2
-1
0
0 1 2 3 4
Log
(N
t/N
0)
Time (min)
100% Amplitude, 50°C
0 ppm 25 ppm 50 ppm

147
Figure 23. Temperature rise during processing at different amplitudes. Error bar represent the standard
deviation of three replicates
Acoustic energy density (AED) and ultrasonic intensity (UI) for each amplitude are
presented in Table 13. AED and UI were independent on the initial processing temperature, but
directly depend on the amplitude applied.
Table 13. Acoustic energy density and ultrasonic intensity at different amplitude levels (Values are the
average of three replicates ± standard deviation).
Amplitude
Power
Consumed (W)
Acoustic Energy Density (AED)
W/mL
Ultrasonic Intensity (UI)
W/cm2
60% 70.37±7.45 0.28±0.029 18.51±0.87
80% 93.10±5.65 0.37±0.022 24.49±1.48
100% 121.74±9.42 0.48±0.037 32.03±2.48
0
10
20
30
40
50
60
0 1 2 3 4 5 6
Tem
per
atu
re (°C
)
Time (min)
60% 80% 100%

148
As expected, there was increase in power with the increase in amplitude, and as a result the
AED and the UI also increase. There was a 73% power increase between the experiment performed
at 60% and that performed at 100%. Mantas et al. (2000) found a 128% increase in delivered power
at 100 kPa after processing at the amplitude level of 62 μm and 117 μm, where the delivered power
was 17.9 W and 40.9 W, respectively.
3.5 Selection of Optimum Processing Conditions
Five different processing conditions were selected with equivalent levels (5 log) of L. innocua
inactivation. No conditions at room temperature (20°C) were chosen, as none granted a 5 log
reduction. Addition of 25 ppm nisin, keeping amplitude and temperature constant, caused a ~66%
reduction in processing time. Similarly, keeping temperature and nisin level constant, even
treatments with a 20% reduction in amplitude could achieve the same level of microbial
inactivation. An 80% reduction in processing time was possible when the temperature was raised
from 35 to 50°C, keeping all other factors constant. Again, a 20% reduction in amplitude was
possible at 35°C with treatment time of 5 min when nisin concentration was increased from 25 to
50 ppm. These results demonstrate that a significant degree of reduction in both processing time
and amplitude level is possible with the incorporation of mild heating and nisin during ultrasound
processing.
Table 14. Processing conditions that results in at least a 5 log reduction of L. innocua
Condition Amplitude Temperature (°C) Nisin (ppm) Time (min)
a 80% Ti: 35, ΔT: 18 50 5
b 100% Ti: 35, ΔT: 24 25 5
c 60% Ti: 50, ΔT: 5 25 2

149
d 80% Ti: 50, ΔT: 12 0 4
e 100% Ti: 50, ΔT: 14 0 3
Ti is the initial temperature of the product before ultrasound treatment starts and ΔT is the
temperature difference between final temperature of the processed product and the initial
temperature.
3.6 Effect of Processes on Total Aerobic Mesophiles
The initial load of aerobic mesophilic bacteria in carrot juice was between 4 to 5 log. All the
selected treatments reduced the load of such bacteria to below 2 log. There was no significant
difference (p>0.05) between selected different equivalent processing conditions on the inactivation
of mesophiles (Figure 24). In a study conducted by Gómez-López et al. (2010) on the inactivation
of aerobic mesophilic bacteria in orange juice, authors observed 1.38 log reduction by using
ultrasound treatment (20 kHz, 500 W, 8 min, 89.25 µm, and 10°C). Although direct comparison
on the inactivation is not possible as there are many factors that affects the inactivation of
microorganisms, it can be said that the result from present study are in line with the findings of
Gómez-López. This study was focused on mild-pasteurization, hence it is expected to have some
level of natural flora in the treated juice. Complete inactivation of naturally occurring aerobic
mesophiles could be achieved when the intensity of the treatment is increased, for example the
processing at longer than 2 min.

150
Figure 24. Inactivation of mesophiles in carrot juice by selected combination of ultrasound treatment. No
significant difference (p>0.05) was found between selected equivalent processes on the inactivation of
mesophiles; Control indicates fresh juice without any treatments (a, b, c, d, e as shown in Table 14). Data
are mean of three replicates
3.7 Evaluation of Effects on Quality Attributes
3.7.1 pH, TSS, and Total Carotenoid Content
The selected processing conditions were also evaluated for their effects on the quality attributes of
treated fresh carrot juice. Changes in pH, TSS, and carotenoid content before and after treatment
are reported in Table 15. Slight changes in pH were observed after processing, but no significant
difference (p>0.05) in pH was noted between control and processed samples. There were changes
in the total soluble solids (TSS) content of the juice after treatment; the changes were not
significant for treatment conditions a, d, and e, while a significant increase in TSS was found for
conditions b and c. Nevertheless, results for samples treated with condition b are not significantly
different from the results for treatments a and d. The results found after treatment ‘c’ is also
significantly higher to the other processed sample; this particular treatment (60% amplitude, 50°C,
0
1
2
3
4
5
6
Control a b c d e
Log
(C
FU
)/m
L

151
25 ppm of nisin, 2 min) may affect TSS content. This may be due to the fact this treatment was
performed only for 2 minutes, while other treatments, in this and other studies, were performed
over longer periods. In the case of treatment e, which involved no nisin and the highest temperature
and amplitude, a slight decrease in °Brix was observed relative to control, although the change
was non-significant (p>0.05).
An increase in total carotenoid content relative to the control was observed in all the
processed samples. Significant increases were found only in processing conditions a and d; this
could be due to higher extraction of carotenoids after US treatment. Regardless, 100% retention of
carotenoid content of the juice was observed for all selected processing conditions.
Santhirasegaram et al. (2013), also found a significant increase in the carotenoid content of
Chokanan mango juice after ultrasound treatment performed at powers ranging from 68-75 W over
15 minutes. The same authors stated that this increase may be due to the ultrasound inactivating
enzymes which normally degrade carotenoids. Another explanation may be cell damage and an
increase in mass transport rate due to cavitation generated by ultrasound. These factors may allow
carotenoids to more readily spread from cells to the environment. This extraction may be favored
around 96 µm because cells must sustain enough damage to allow a high rate of extraction and
convection. In any case, the amount of carotenoids present in juice should not be affected by these
treatment conditions. Higher amplitudes in the range of 120 µm may affect carotenoids because of
the shear stress generated by cavitation collapse. This result demonstrates that combination of
ultrasound, temperature, and nisin not only inactivates microorganisms, rendering the product safe,
but also retains the nutrients present in the untreated juice.

152
Table 15. Change in pH, TSS, and carotenoid content of juice before and after processing under different
treatment conditions
Condition pH TSS (°Bx) Carotenoid (mg/L)
Control 6.20±0.04ab 9.27±0.06c 512.75±0.52c
a 6.34±0.12a 9.37±0.06bc 518.21±2.28ab
b 6.17±0.06b 9.73±0.15b 513.96±1.38c
c 6.31±0.01ab 10.20±0.20a 515.48±0.52bc
d 6.28±0.04ab 9.37±0.25bc 519.12±1.04a
e 6.31±0.02ab 9.20±0.10c 514.57±0.52c
(Values are the average of three replicates ± standard deviation. Different letter in the same column
represent that data are significantly different (p<0.05))
3.7.2 Color Parameters
There was a significant (p<0.05) reduction in the lightness of juice after treatment under all tested
conditions. This may be related to the increase in free carotenoid content discussed earlier, as β-
carotenoid is the main component responsible for the color of carrot juice. It follows logically that
an increase in the amount of free carotenoid would lead to an increase in the darkness of the
solution due to light absorption by free carotenoids. Similarly, there were significant reductions in
hue angle and chroma under all processing conditions. According to the description of chroma and
the hue angle given by McGuire (1992), a reduction in chroma means that color appears more
faded, less saturated. Since hue angle is defined as the angle between the hypotenuse and the a*
axis, a reduction in hue angle means here that the color is shifting towards blue, confirmed by the
corresponding observed decrease in the b* value. These changes may also be due to the rise in free
carotenoid.

153
In the measurements of color difference (ΔE), it was observed that all values ranged from
3.81 to 7.02. Thus, according to the rank established by Cserhalmi et al. (2006), the color difference
can be “noticeable” (3.0 to 6.0) or significant (6.0 to 12.0). The maximum change in color after
treatment was observed after treatment d, i.e., processing for 4 min at 80% amplitude, 50°C initial
temperature, and 50 ppm nisin. The combination of high temperature, mild amplitude, and longer
processing time may have caused this change in ΔE; samples subjected to condition d also showed
the highest levels of carotenoid after treatment, which may explain its greatest difference in color
relative to control.
Table 16. Change in Lightness, Hue angle, Chroma, and ΔE of the juice before and after processing with
different treatment conditions
Condition Lightness (L*) Hue angle (h*) Chroma (C*) ΔE
Control 9.75 ±0.20a 0.49±0.01a 35.58±0.31a -
a 7.81±0.16b 0.42±0.01b 32.53±0.18b 4.27±0.21c
b 7.11±0.07c 0.39±0.00c 31.26±0.16c 5.90±0.54b
c 7.67±0.07b 0.41±0.00b 32.38±0.11b 4.55±0.36c
d 6.51+0.05d 0.38±0.00d 29.81+0.08e 7.49±0.34a
e 6.99±0.05c 0.39±0.00c 30.86±0.12d 6.28±0.53b
(Values are the average of three replicates ± standard deviation. Different letter in the same column
represent that data are significantly different (p<0.05))
4. Conclusions
The simultaneous application of ultrasound, mild temperature and nisin for the processing of carrot
juice was found to be effective. Synergism was observed in these combinations for the inactivation
of L. innocua; in fact, 5 treatment conditions (a: 80% amplitude, 35°C, 50 ppm for 5 min; b: 100%,

154
35°C, 25 ppm for 5 min; c: 60%, 50°C, 25 ppm for 2 min; d: 80%, 50°C, 0 ppm for 4 min; and e:
100%, 50°C, 0 ppm for 3 min) were found to achieve at least 5 log reductions of Listeria innocua
using moderate temperature and amplitude. These combinations have great potential in the
production of minimally processed fresh fruit and vegetable juices. For all these conditions, we
find an increase in the carotenoid content, especially for the sample treated under condition c (80%
amplitude, 50°C, and 0 ppm nisin for 4 minutes). Since this treatment was performed only at 96
μm, it did not deliver the most energy, with an acoustic energy density of only 0.37 W/mL and an
ultrasonic intensity of 24.49 W/cm2. There was an increase in darkness for all treated samples, as
well as significant change in color, hue angle, and chroma, but no change in pH after processing.
The processing approach developed in this study will be beneficial for the industrial processing of
carrot juice and other vegetable juices without using very high temperature or chemical
preservatives. The proposed protocols will also help in the development of clean label products.

155
References
Abdullah, N., & Chin, N. L. (2014). Application of thermosonication treatment in processing and
production of high quality and safe-to-drink fruit juices. Agriculture and Agricultural
Science Procedia, 2, 320-327.
Bermúdez-Aguirre, D., Mobbs, T., & Barbosa-Cánovas, G. V. (2011). Ultrasound applications in
food processing. In Ultrasound Technologies for Food and Bioprocessing (pp. 65-105).
Springer New York.
Bhat, R., Kamaruddin, N. S. B. C., Min-Tze, L., & Karim, A. A. (2011). Sonication improves
kasturi lime (Citrus microcarpa) juice quality. Ultrasonics Sonochemistry, 18(6), 1295-
1300.
Buzrul, S., & Alpas, H. (2004). Modeling the synergistic effect of high pressure and heat on
inactivation kinetics of Listeria innocua: a preliminary study. FEMS Microbiology
Letters, 238(1), 29-36.
Chemat, F., & Khan, M. K. (2011). Applications of ultrasound in food technology: processing,
preservation and extraction. Ultrasonics Sonochemistry, 18(4), 813-835.
Cserhalmi, Z., Sass-Kiss, A., Tóth-Markus, M., & Lechner, N. (2006). Study of pulsed electric
field treated citrus juices. Innovative Food Science and Emerging Technologies, 7(1), 49-
54.
Francis, G. A., & O'Beirne, D. (1998). Effects of the indigenous microflora of minimally processed
lettuce on the survival and growth of Listeria innocua. International Journal of Food
Science and Technology, 33(5), 477-488.

156
Gastélum, G. G., Avila-Sosa, R., López-Malo, A., & Palou, E. (2012). Listeria innocua multi-
target inactivation by thermo-sonication and vanillin. Food and Bioprocess
Technology, 5(2), 665-671.
Gómez-López, V. M., Orsolani, L., Martínez-Yépez, A., & Tapia, M. S. (2010). Microbiological
and sensory quality of sonicated calcium-added orange juice. LWT-Food Science and
Technology, 43(5), 808-813.
Liao, H., Sun, Y., Ni, Y., Liao, X., Hu, X., Wu, J., & Chen, F. (2007). The effect of enzymatic
mash treatment, pressing, centrifugation, homogenization, deaeration, sterilization and
storage on carrot juice. Journal of Food Process Engineering, 30(4), 421-435.
Lubelski, J., Rink, R., Khusainov, R., Moll, G. N., & Kuipers, O. P. (2008). Biosynthesis,
immunity, regulation, mode of action and engineering of the model antibiotic
nisin. Cellular and Molecular Life Sciences, 65(3), 455-476.
Mantas, P., Pagán, R., & Raso, J. (2000). Predicting lethal effect of ultrasonic waves under pressure
treatments on Listeria monocytogenes ATCC 15313 by power measurements. Journal of
Food Science, 65(4), 663-667.
McGuire, R. G. (1992). Reporting of objective color measurements. HortScience, 27(12), 1254-
1255.
Mossel, D. A. A., Corry, J. E., Struijk, C. B., & Baird, R. M. (1995). Essentials of the microbiology
of foods: a textbook for advanced studies. John Wiley & Sons.

157
Muñoz, A., Palgan, I., Noci, F., Cronin, D. A., Morgan, D. J., Whyte, P., & Lyng, J. G. (2012).
Combinations of selected non-thermal technologies and antimicrobials for microbial
inactivation in a buffer system. Food Research International, 47(1), 100-105.
Ordoñez, J. A., Aguilera, M. A., Garcia, M. L., & Sanz, B. (1987). Effect of combined ultrasonic
and heat treatment (thermoultrasonication) on the survival of a strain of Staphylococcus
aureus. Journal of Dairy Research, 54(1), 61-67.
Piyasena, P., Mohareb, E., & McKellar, R. C. (2003). Inactivation of microbes using ultrasound:
a review. International Journal of Food Microbiology, 87(3), 207-216.
Raso, J., Manas, P., Pagan, R., & Sala, F. J. (1999). Influence of different factors on the output
power transferred into medium by ultrasound. Ultrasonics Sonochemistry, 5(4), 157-162.
Rodgers, S. L., & Ryser, E. T. (2004). Reduction of microbial pathogens during apple cider
production using sodium hypochlorite, copper ion, and sonication. Journal of Food
Protection, 67(4), 766-771.
Sango, D. M, Abela, D., McElhatton, A., & Valdramidis, V. P. (2014). Assisted ultrasound
applications for the production of safe foods. Journal of Applied Microbiology, 116(5),
1067-1083.
Santhirasegaram, V., Razali, Z., & Somasundram, C. (2013). Effects of thermal treatment and
sonication on quality attributes of Chokanan mango (Mangifera indica L.)
juice. Ultrasonics Sonochemistry, 20(5), 1276-1282.

158
Sharma, K. D., Karki, S., Thakur, N. S., & Attri, S. (2012). Chemical composition, functional
properties and processing of carrot—a review. Journal of Food Science and
Technology, 49(1), 22-32.
Shiu, C., Zhang, Z., & Thomas, C. R. (2001). A comparison of the mechanical properties of
different bacterial species. In Applied Microbiology (pp. 155-162). Springer Netherlands.
Valdramidis, V. P., Cullen, P. J., Tiwari, B. K., & O’Donnell, C. P. (2010). Quantitative modelling
approaches for ascorbic acid degradation and non-enzymatic browning of orange juice
during ultrasound processing. Journal of Food Engineering, 96(3), 449-454.
Valero, M., Recrosio, N., Saura, D., Muñoz, N., Martí, N., & Lizama, V. (2007). Effects of
ultrasonic treatments in orange juice processing. Journal of Food Engineering, 80(2), 509-
516.
Wordon, B. A., Mortimer, B., & McMaster, L. D. (2012). Comparative real-time analysis of
Saccharomyces cerevisiae cell viability, injury and death induced by ultrasound (20 kHz)
and heat for the application of hurdle technology. Food Research International, 47(2),
134-139.

159
CHAPTER FIVE
INACTIVATION OF Listeria innocua AND Escherichia coli IN CARROT JUICE BY
COMBINING HIGH PRESSURE PROCESSING, NISIN, AND MILD
THERMAL TREATMENTS
Abstract
This study explores the effectiveness of High Pressure Processing (HPP) together with mild
thermal treatments and nisin on the inactivation of L. innocua and E. coli in carrot juice. Carrot
juice samples, with or without nisin (0-25-50 ppm), were inoculated with L. innocua or E. coli
(one at a time), and subjected to pressures of 200, 300, 400 or 500 MPa for 2 min at three different
temperatures, 20, 35, and 50°C.
Processing at 500 MPa at 20°C without nisin resulted in a 4 log reduction of L. innocua
and a 5 log reduction of E. coli, while the incorporation of 25 ppm of nisin at the same pressure
and temperature rendered 7 log reductions in both microorganisms. For the processing at 35°C,
300 MPa, 25 ppm nisin, there was more than 5 log reduction. Processing conditions that resulted
in at least 5 log reduction for both microorganisms had no significant (p>0.05) impact on the juice
physicochemical characteristics.
There were synergisms among HPP, nisin, and mild temperature in the inactivation of L.
innocua and E. coli. Incorporation of nisin and processing at mild temperatures allow the use of
less intense HPP treatments, to pasteurize carrot juice making the process energy efficient and cost
effective. The combination of nisin, HPP, and mild temperatures could be useful in the commercial
pasteurization of carrot juice and other low-acid juices to attain safe, clean label, and high quality
products.
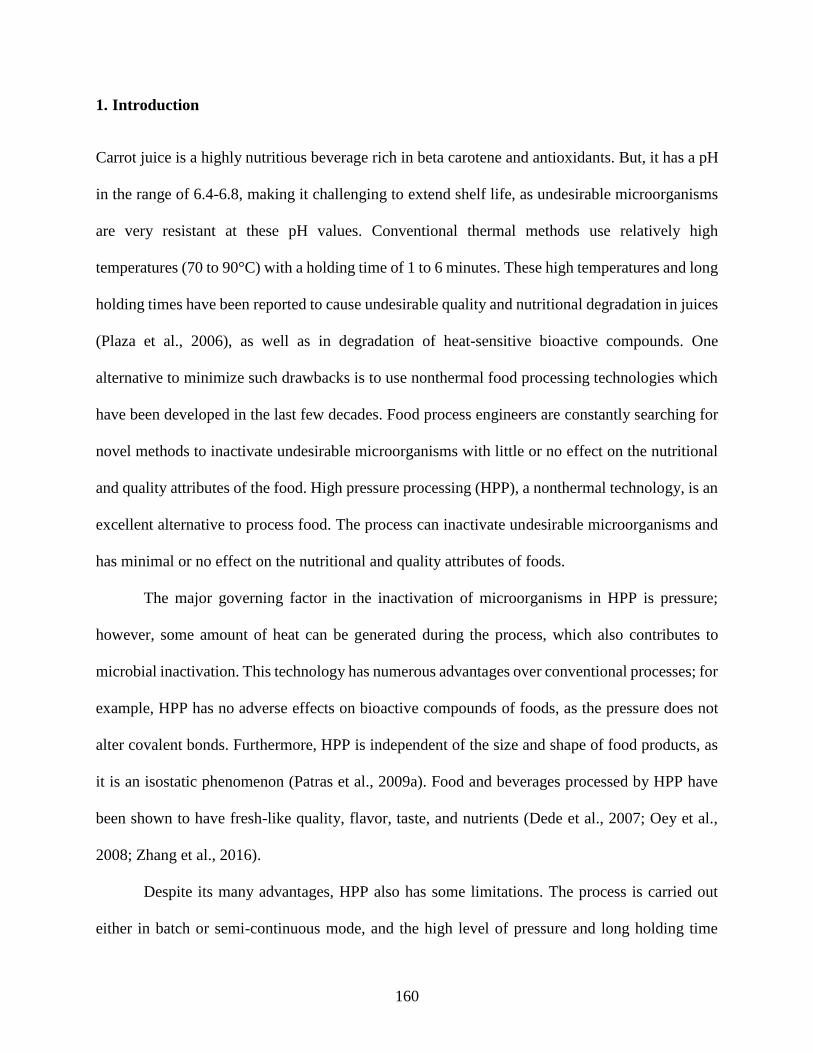
160
1. Introduction
Carrot juice is a highly nutritious beverage rich in beta carotene and antioxidants. But, it has a pH
in the range of 6.4-6.8, making it challenging to extend shelf life, as undesirable microorganisms
are very resistant at these pH values. Conventional thermal methods use relatively high
temperatures (70 to 90°C) with a holding time of 1 to 6 minutes. These high temperatures and long
holding times have been reported to cause undesirable quality and nutritional degradation in juices
(Plaza et al., 2006), as well as in degradation of heat-sensitive bioactive compounds. One
alternative to minimize such drawbacks is to use nonthermal food processing technologies which
have been developed in the last few decades. Food process engineers are constantly searching for
novel methods to inactivate undesirable microorganisms with little or no effect on the nutritional
and quality attributes of the food. High pressure processing (HPP), a nonthermal technology, is an
excellent alternative to process food. The process can inactivate undesirable microorganisms and
has minimal or no effect on the nutritional and quality attributes of foods.
The major governing factor in the inactivation of microorganisms in HPP is pressure;
however, some amount of heat can be generated during the process, which also contributes to
microbial inactivation. This technology has numerous advantages over conventional processes; for
example, HPP has no adverse effects on bioactive compounds of foods, as the pressure does not
alter covalent bonds. Furthermore, HPP is independent of the size and shape of food products, as
it is an isostatic phenomenon (Patras et al., 2009a). Food and beverages processed by HPP have
been shown to have fresh-like quality, flavor, taste, and nutrients (Dede et al., 2007; Oey et al.,
2008; Zhang et al., 2016).
Despite its many advantages, HPP also has some limitations. The process is carried out
either in batch or semi-continuous mode, and the high level of pressure and long holding time

161
result in lower throughput and higher cost of operation. To lower the cost of processing and
increase throughput, the processing pressure and holding time need to be reduced. One way to
efficiently reduce both factors is to combine high pressure with other hurdles such as moderate
temperature increases (<50°C) and natural antimicrobials (Bermúdez-Aguirre et al., 2016).
Nisin is a heat-stable bacteriocin produced from Lactococcus lactis and has been classified
in the Generally Recognized as Safe (GRAS) categories by US FDA and can be used in canned
food, dairy products and meat (de Arauz et al., 2009; Tong et al., 2014). Gram-positive bacteria
are sensitive to nisin (Brewer et al., 2002). But, studies have shown that nisin is less effective
toward gram-negative bacteria as compared to gram-positive (Helander & Mattila-Sandholm,
2000). The main mechanism of inactivation by nisin is its ability to form ion-permeable pores in
the cytoplasmic membranes of microbial cells (de Arauz et al., 2009; Smith et al., 2002). Nisin on
its own is less effective for inactivation of gram-negative microbes as compared to gram-positive
ones. In combination with HPP, though, it could be effective for gram-negative bacteria, as HPP
can cause pores in the outer cell membrane allowing nisin to reach and act on the cytoplasm
membrane, leading to lysis.
The objective of this work was to study the combined effect of HPP, nisin, and moderate
temperature increases on the inactivation of a representative gram-positive bacteria, L. innocua,
and a gram-negative bacteria, E. coli in carrot juice, selected to represent low acid foods (pH >
4.6). Such combinations have not been previously reported for carrot juice. The other objective of
this work was to investigate the effect of such combinations on the quality and stability of treated
carrot juice.

162
2. Materials and Methods
2.1 Culture preparation
E. coli (ATCC 11755TM) and L. innocua (ATCC 8456TM) were obtained from American Type
Culture Collection. The strains of L. innocua and E. coli were grown in 100 mL of sterile tryptic
soy broth (TSB) + 0.6% yeast extract (YE) and nutrient broth (NB) (Becton Dickinson, Sparks,
MD, USA), respectively, at 37°C under agitation at 225 rpm in a shaking water bath (Lab-Line,
model 3545, Melrose Park, IL, USA). The cells were harvested at the early stationary phase, and
the cultures frozen at -18°C in 20 % sterile glycerol until use. To activate the frozen culture, vials
with E. coli and L. innocua were defrosted and added to nutrient broth or TSB at room temperature
and shaken for 10 min.
2.2 Sample preparation
In the first part of the study, thermally pasteurized refrigerated carrot juice (Bolthouse Farms,
Bakersfield, CA, USA) (pH 6.4; soluble solids 11.7°Bx) without any preservatives were purchased
at a local grocery store (Pullman, WA, USA). A 100 mL aliquot of juice was aseptically dispensed
into a sterile Erlenmeyer flask (250 mL). Pure nisin-A (Handary S.A, Brussels, Belgium) was
added to the juice to achieve concentrations of 25 and 50 ppm. Juice without nisin was also used
for comparison to examine the effects of nisin addition. Twenty milliliters of the juice with- or
without nisin was placed in sterile Nylon/PE pouches (50 mL) for processing. Cultures of E. coli
and L. innocua (one at a time) were inoculated in the juice pouch to reach a final concentration of
7 log CFU/mL. Juice pouches with the microbial culture were sealed using a lab-scale sealer

163
(Impulse Heat Sealer 3T06, Midwest Pacific, Taiwan). HPP treatment was performed immediately
after sealing.
In the second part of this study, fresh carrot juice was prepared in the lab using a domestic
juicer (Hamilton Beach JE2200B, Black & Decker, MD, USA). Fresh juice was used to monitor
quality changes after high pressure treatment and during storage. Figure 25 shows the process flow
diagram for High Pressure Processing of nisin-incorporated carrot juice at mild temperatures.

164
Figure 25. Process flow diagram for High Pressure Processing of nisin-incorporated carrot juice at mild
temperatures
2.3 High Pressure Processing (HPP)
The juice pouches were processed using a HPP unit (Engineering Pressure Systems, Inc., Andover
MA, USA) located in the Washington State University Food Processing Pilot plant. A 5% Mobil
Hydrasol 78 water solution was used as the pressure-transmitting medium. Pressures of 200, 300,
400, and 500 MPa with a holding time of 2 min were used for treatment of the juices. The initial
Carrot Juice (Pasteurized, Bothhouse
farms)
Addition of nisin (0, 25, 50 ppm) at 20ºC
Innoculation of L. innocua or E. coli (7 log)
at 20ºC
Packaging of juice (Nylon/PE pouches) and
Sealing
High Pressure Processing (200-500 MPa, 20-50°C,
2 min)Microbiological analysis
Selection of processing conditions that render at least 5 log reduction of both microorganisms
Calculation of energy consumption during
processing
Application of selected processing conditions to
fresh carrot juice
Analyse the inactivation of naturally occuring
total aerobic mesophilic bacteria in fresh carrot
juice
Study changes in physicochemical
characterstics of the juice
Storage studies for 4 weeks at 4°C
(Quality evaluation)

165
temperature of the pressurizing medium was set to 20, 35 and 50°C. The compression heating
resulted in temperature rise of the processing fluid and juice (by up to 7, 10, 13, and 14°C at 200,
300, 400, and 500 MPa, respectively). Control samples (fresh juice) were held at atmospheric
pressure and room temperature (20°C) while processing the other samples.
2.4 Enumeration of viable E. coli and L. innocua
Microbiological analysis was conducted to study the inactivation of both microorganisms in carrot
juice after high pressure processing. Serial dilutions were prepared in triplicate with 0.1% (w/v)
peptone water (Becton, Dickinson and Company, Sparks, MD). One mL of decimal dilution of
sample was pipetted into Petri dishes, and 20 mL of tryptic soy agar plus yeast extract (for L.
innocua) or MacConkey agar (for E. coli) was poured to each plate. Plates were incubated at 37ºC
for 48 hours after being turned upside down. All tests were performed in triplicate; survivors were
counted manually and represented as colony forming unit (CFU)/mL.
2.5 Quality evaluation and storage studies
Physicochemical characteristics of fresh and processed carrot juice were evaluated for changes in
quality after incorporation of nisin, and by the application of high pressure at different
temperatures. Operating conditions that were successful in achieving 5 log reductions of selected
microorganisms were chosen for this purpose. Processed samples, along with an unprocessed
control samples were stored at 4°C for 4 weeks to monitor the growth of aerobic mesophilic
bacteria and changes in pH, color, soluble solids, and turbidity. All the samples were stored in the
same pouches that were used to process, pouches had a water vapor transmission rate of 6-7.5
g/m2.24 hr. and oxygen transmission rate of 50-70 cc/m2.24 hr.

166
2.5.1 Physicochemical Analysis
In this study, physicochemical quality attributes such as pH, color, turbidity, total soluble solids,
ascorbic acid, total carotenoid content, and total phenolic compounds were determined to evaluate
the juice sample before and after processing as well as during the storage period.
a. pH, Color, Turbidity, and Total Soluble Solids
The pH of the juices was evaluated using a digital pH meter (Orio 4-star, Thermo Fisher Scientific,
Waltham, MA, USA) at 20ºC. Hunter color parameters (Lightness, redness, and yellowness) of
the juice samples were measured using a colorimeter (Konica Minolta, CM-5, New Jersey, USA).
To measure turbidity, a sample was centrifuged (1500 RPM, 10 min) (MSE Centaur 2 centrifuge
(MSE UK Ltd., London, UK), the supernatant taken, and the absorbance at 660 nm measured using
a spectrophotometer (Spectronic 20 Genesys, Spectronic Instruments Inc., Rochester, NY) (Krop,
1974). The total soluble solids content of the juice was quantified using a hand-held refractometer
(Atago No. 480, Atago Inc. Tokyo, Japan) at 20°C.
b. Ascorbic Acid
The ascorbic acid level in fresh and processed juices was determined by redox titration method
using iodine and starch indicator, according to the method described by Ciancaglini et al. (2001),
with some modifications. A juice sample (20 mL) was pipetted into a 250-mL Erlenmeyer flask,
and 150 mL of distilled water and 1 mL of starch indicator were added. The sample solution was
titrated with a 5 mM iodine solution until a permanent green-black color was first observed.

167
c. Total Carotenoid Content
The juice before and after processing was analyzed spectrophotometrically according to the
method described by Liao et al. (2007) to determine total carotenoid content. Twenty milliliters of
juice was mixed with 20 mL of a hexane/acetone mixture (1:1, v/v) in a separating funnel and
shaken. After one minute, the organic phase separated from the aqueous phase was collected, and
the absorbance was measured at 450 nm using a spectrophotometer (Spectronic 20 Genesys.
Spectronic Instruments Inc., Rochester, NY, USA). The total carotenoid content was calculated
using a standard curve of beta-carotene with concentrations ranging from 2 to 10 mg/L. Results
were expressed as milligrams of β-carotene per liter of sample. All the analyses were conducted
in triplicates.
d. Total Soluble Phenolic Content
The method described by Derradji-Benmeziane et al. (2014) was used to determine total soluble
phenolic content. Juice sample (50 µL) was placed into a volumetric flask, and 2.5 mL of Folin-
Ciocalteu reagent (diluted 1/10) was added. Each sample was left to stand for 10 minutes at room
temperature, after which 2 mL of an aqueous solution of Na2CO3 (7.5%) was added, and the sample
kept for 30 min in the dark. Absorbance was determined at 760 nm, and phenolic compounds were
quantified using a standard prepared using Gallic acid. The results were expressed in milligrams
equivalent Gallic acid per liter of juice. All the analyses were conducted in triplicates.

168
2.6 Energy calculation
Since each process results in a combination of pressure and temperature increase, energy
consumed to raise the pressure and the temperature were calculated separately according to
equations (1) and (2) respectively (Silva et al., 2016):
𝐸 =1
2𝑉 × 𝛽 × (𝑃𝑓𝑖𝑛𝑎𝑙
2 − 𝑃𝑖𝑛𝑖𝑡𝑖𝑎𝑙2) − 𝑃𝑓𝑖𝑛𝑎𝑙 × 𝑉𝛼(𝑇𝑓𝑖𝑛𝑎𝑙 − 𝑇𝑖𝑛𝑖𝑡𝑖𝑎𝑙) + 𝜌 × 𝑉 × 𝐶𝑝 ×
𝑑𝑇
𝑑𝑡, (1)
𝑄 = 𝑉 × 𝜌 × 𝐶𝑝 × 𝑑𝑇, (2)
where ρ (kg/m3) is the density of the fluid, Cp (kJ/kg°C) the mass heat capacity of the fluid, dT the
temperature difference (in °C or K), V the volume of cylinder (m3), P (MPa) and T (ºC) the pressure
and the temperature in the vessel, respectively, α the expansivity (6.07E-4 K-1 or °C-1), β the
compressibility (4.6E-10 Pa-1) of water used as pressure transmitting fluid, and dT/dt the increase
in experimental temperature of the chamber during the HPP come-up time. Results for E were
expressed in kJ/L, obtained by dividing the total energy required by 2 L, the high-pressure vessel
capacity.
2.7 Statistical analysis
Data analysis was performed using Microsoft Excel 2016. The analysis of variance (ANOVA)
between different processing conditions was analyzed using Minitab 16 (Minitab, State College,
PA, USA). A p-value of 0.05 was chosen as the limit for significance.

169
3. Results and Discussion
This section highlights the significant findings on the inactivation of gram positive and gram-
negative microorganisms by HPP, nisin and mild thermal treatments. To that end, treatment impact
on microbial inactivation was investigated for HPP alone, HPP combined with nisin, HPP
combined with heat, and for all three parameters combined. Additionally, it presents the effects of
each selected combination on the physical and chemical properties of treated carrot juice, as well
as the energy consumption and the stability of the treated juice over time.
3.1 Effect of process on the inactivation of L. innocua and E. coli
Several tests were conducted with a different level of pressure, nisin, and temperature to assess the
effect of each process or of a combined process on bacterial inactivation. The results obtained was
used to determine the optimum combination of pressure, temperature, and nisin concentration to
obtain at least 5 log reduction of L. innocua and E. coli.
3.1.1 Effect of HPP
A steady reduction of both L. innocua and E. coli were found with an increase in processing
pressure, as shown in Figure 2, which clearly indicates that the application of HPP alone has a
significant impact on the inactivation of both microorganisms. This effect is more profound at
pressures higher than 400 MPa. Application of 200 MPa at 20°C reduced the L. innocua and E.
coli count by less than 1 log. Increasing the pressure to 300 MPa resulted in a 1 log reduction of

170
E. coli, but under the same conditions, L. innocua reduction was still less than 1 log. By increasing
the pressure level to 400 MPa, a 3 log reduction was achieved for both microorganisms.
Figure 26. Effect of increased pressure at room temperature (20°C) on reduction of L. innocua and E.
coli.
A further increase in pressure to 500 MPa rendered about 4 and 5 log reductions of L.
innocua and E. coli, respectively. These results show that L. innocua was more resistant to pressure
than E. coli, which is consistent with previous findings that gram-negative bacteria are more
susceptible to physical stress than gram-positive bacteria (Shiu et al., 2001). This difference in
sensitivity has been attributed to the complexity of the gram-negative cell membrane compared to
the gram-positive cell membrane (Murchie et al., 2005). In fact, these two categories of bacteria
have major differences in the structure of the cell membrane. Gram-negative bacterial cells have
an outer membrane composed of purines, lipopolysaccharides, and phospholipids. All of these
components may be kept together by weak forces such as hydrophobic and Van der Waals
0
1
2
3
4
5
6
200 300 400 500
Log
Red
uct
ion
Pressure (MPa)
L. innocua E. coli

171
interactions, which are affected by HPP. The outer membrane of gram negative cells also contains
proteins in an antiparallel β-strands conformation (Bos et al., 2007). Since HPP affects weak
bonds, therefore, it affects protein conformation like antiparallel β-strands, which may be another
reason for the higher sensitivity of gram-negative bacteria to high pressure. On the other hand,
gram-positive bacteria walls have peptidoglycan layers, held together by covalent bonds. HPP has
no significant effects on covalent bonds; hence, the stronger gram-positive bacteria are preserved
while gram-negative bacteria are damaged. Similar results were observed by Wuytack et al. (2002)
on the inactivation of gram positive and negative bacteria by high pressure.
Application of 500 MPa for 2 min alone did not reach the carrot juice pasteurization criteria
of this study (>5 log reduction). An increase in pressure beyond 500 MPa could be challenging to
implement in a food plant, as the increase involves higher costs for equipment and processing. An
increase in processing time is associated with lower productivity or throughput. Generally, a
processing time of 2 minutes or less is desired by fast-paced industry. Therefore, to make HPP
efficient in terms of equipment cost and productivity, a combination of HPP with certain hurdles
is a sound approach, especially for processing low-acid juices.
3.1.1 Study of combined effect
The results obtained from test that combines nisin with HPP and heat are summarized in Figure
27.

172
-8
-7
-6
-5
-4
-3
-2
-1
0
0 100 200 300 400 500L
og
(N
p/N
0)
Pressure (MPa)
L. innocua Inactivation at 20 °C
0 ppm 25 ppm 50 ppm
-8
-7
-6
-5
-4
-3
-2
-1
0
0 100 200 300 400 500
Log
(N
p/N
0)
Pressure (MPa)
L. innocua Inactivation at 35 °C
0 ppm 25 ppm 50 ppm
-9
-8
-7
-6
-5
-4
-3
-2
-1
0
0 100 200 300 400 500
Log
(N
p/N
0)
Pressure (MPa)
E. coli Inactivation at 20°C
0 ppm 25 ppm 50 ppm
-8
-7
-6
-5
-4
-3
-2
-1
0
0 100 200 300 400 500
Log
(N
p/N
0)
Pressure (MPa)
E. coli Inactivation at 35°C
0 ppm 25 ppm 50 ppm

173
Figure 27. The combined effect of HPP, nisin, and heat on microbial inactivation. Data represent the
mean of three replicate
a. Combined effect of HPP and nisin
The application of nisin without HPP treatments had a minimal impact on both L. innocua and E.
coli. In gram-negative bacteria, the permeation of nisin to the cytoplasmic membrane is protected
by a lipid layer on the outer membrane (Jack et al., 1995). Previous studies show that nisin was
effective only against gram-positive bacteria since it can quickly reach the cytoplasmic membrane
and has the capacity to permeabilize it and inhibit cell wall synthesis (Lubelski et al., 2008).
Results suggest a higher resistance of E. coli towards nisin over L. innocua, an observation in line
with those of McNamee et al. (2010). Nisin can easily reach the cell membrane of L. innocua but
cannot pass through the complex outer membrane of E. coli. Several studies have shown that nisin
alone has little or no effect on gram-negative bacteria like E. coli (Boziaris & Adams, 1999;
Helander & Matitila-Sandholm, 2000). In the present study, when nisin was combined with
pressure, there was synergism. This enhancement in the effect of nisin, when combined with
-8
-7
-6
-5
-4
-3
-2
-1
0
0 100 200 300 400 500 600
Lo
g (
Np
/N0)
Pressure (MPa)
L. innocua Inactivation
20°C 35°C 50°C
-8
-7
-6
-5
-4
-3
-2
-1
0
0 100 200 300 400 500 600
Lo
g (
Np
/N0)
Pressure (MPa)
E. coli Inactivation
20°C 35°C 50°C

174
pressure, may be due to partial rupture of the outer cell membrane by HPP, allowing nisin to pass
through that wall and reach the cytoplasmic membrane causing pores and lysis and inactivating
the microorganisms.
It has been reported that the binding of nisin to the cell membrane of gram-positive
microorganisms increases the susceptibility of microorganisms to high pressure treatments and
results in synergism (ter Steeg et al., 1999; Lee et al., 2003). The synergy between HPP and nisin
on the inactivation of microorganisms depends on factors such as treatment medium and
microorganisms type (Sokołowska et al., 2012).
Addition of nisin at 25 and 50 ppm did not impact the lethal effect at pressures of 200 or
300 MPa and at room temperature (20°C). The applied pressure levels might not be strong enough
to cause change in bacterial cell membrane thereby preventing the nisin to easily penetrate into the
cytoplasm. Increasing the pressure from 300 to 400 MPa with the same concentrations of nisin and
at the same temperature had a significant impact on the inactivation of both microorganisms. There
was a synergistic interaction between nisin and pressure to inactivate both tested microorganisms.
These results illustrate that the combination of HPP and nisin is an alternative which has potential
for the food and beverage processing industry.
b. Combined effect of HPP and heat
Combination of different pressures and mild temperatures significantly (p<0.05) reduced
microbial population, as can be seen in Figure 27. Microbial inactivation increased with increases
in pressure and/or temperature. At low pressure levels (200 and 300 MPa) the effect of raising the
temperature from 20°C to 35°C had less impact than the same increase at pressure above 400 MPa.
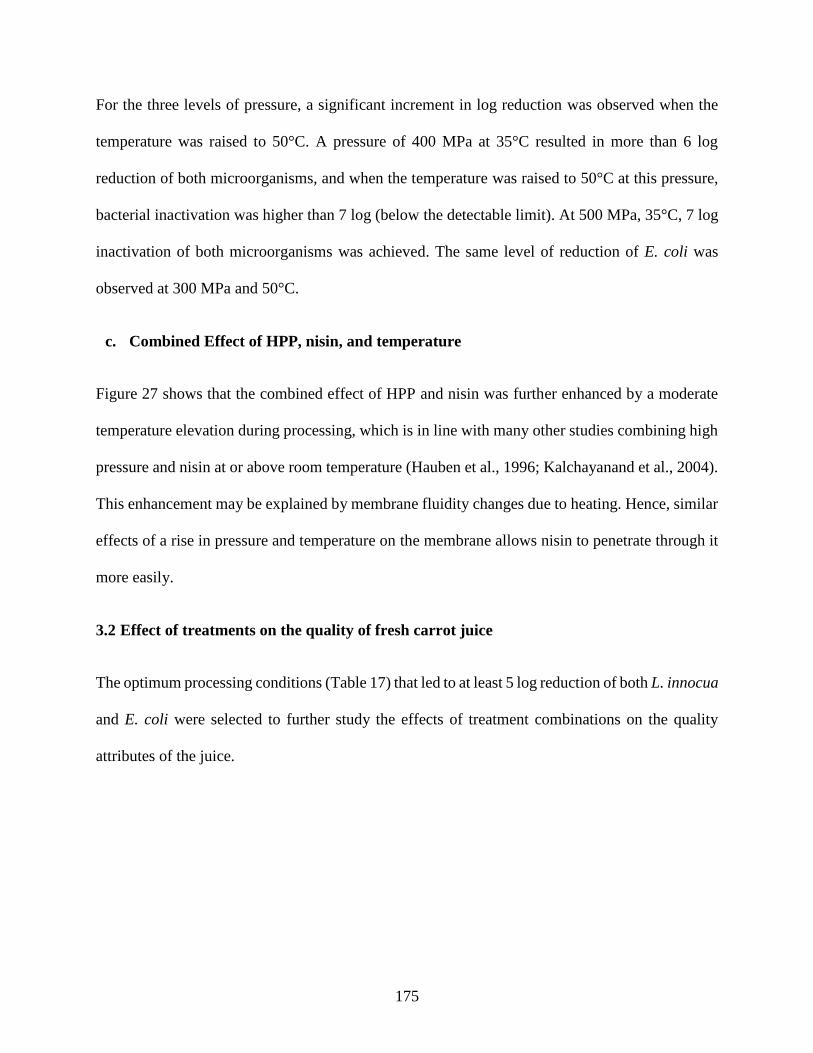
175
For the three levels of pressure, a significant increment in log reduction was observed when the
temperature was raised to 50°C. A pressure of 400 MPa at 35°C resulted in more than 6 log
reduction of both microorganisms, and when the temperature was raised to 50°C at this pressure,
bacterial inactivation was higher than 7 log (below the detectable limit). At 500 MPa, 35°C, 7 log
inactivation of both microorganisms was achieved. The same level of reduction of E. coli was
observed at 300 MPa and 50°C.
c. Combined Effect of HPP, nisin, and temperature
Figure 27 shows that the combined effect of HPP and nisin was further enhanced by a moderate
temperature elevation during processing, which is in line with many other studies combining high
pressure and nisin at or above room temperature (Hauben et al., 1996; Kalchayanand et al., 2004).
This enhancement may be explained by membrane fluidity changes due to heating. Hence, similar
effects of a rise in pressure and temperature on the membrane allows nisin to penetrate through it
more easily.
3.2 Effect of treatments on the quality of fresh carrot juice
The optimum processing conditions (Table 17) that led to at least 5 log reduction of both L. innocua
and E. coli were selected to further study the effects of treatment combinations on the quality
attributes of the juice.

176
Table 17. Optimum processing conditions that led to at least 5 log reduction of L. innocua and E. coli.
Combination ‘a’ is control or fresh untreated juice.
Combinations Pressure (MPa) Temperature (°C) Nisin (ppm)
a (Control) 0.1 (Atmospheric pressure) 20 0
b 200 50 50
c 300 35 25
d 400 35 0
e 500 20 0
3.3 Effect on pH, total soluble solids (TSS), and turbidity
There was a significant reduction (p<0.05) in pH after processing by all selected combinations of
pressure, nisin, and heat as compared to control (Table 18). Bonds between hydrogen and acidic
molecules are reversible and may be affected by HPP. Hence, an increase in pressure might lead
to release hydrogen ions from acids to the environment, leading to a decrease in pH.
Soluble solids are responsible for sensory properties of the juice; retention of them helps
preserve the sensory quality of fresh juices after processing. Significant decreases in total soluble
solids (TSS) were observed for samples b, c, and d, treated at temperatures above ambient. Sample
e, treated at 500 MPa, is the only sample that did not exhibit any significant decrease in TSS
relative to the control sample, and the only sample treated at room temperature. As discussed
earlier, a pressure of 500 MPa is high enough to cause membrane cell disruption. All these
observations may suggest that only the increase in temperature (and perhaps not the increase in
pressure) undergone by samples b, c and d may damage sugars present in the juice, leading to the
significant decrease in total soluble solids.

177
Slight decreases in turbidity values were observed in all of the treated samples compared
to the control. The turbidity value indicates the light-scattering properties of a solution; and
therefore depends on several factors like the particles’ size. Hence, the decrease in turbidity might
be explained by a reduction in the size of particles dispersed in the juice since pressure causes
rupture or breakage of fruit cells.
Table 18. Effect of combination of HPP, temperature, and nisin on pH, soluble solids, and turbidity.
Sample pH TSS (°Bx) Turbidity (Abs. at 660 nm)
a 6.60±0.01a 9.35±0.14a 2.32±0.02a
b 6.40±0.01c 8.25±0.05c 2.09±0.01b
c 6.42±0.01bc 8.20±0.10c 2.02±0.01b
d 6.44±0.01b 8.50±0.10bc 2.01±0.04b
e 6.41±0.01bc 9.05±0.05ab 2.04±0.03b
The values are mean ± standard deviation. The same letter (superscript) after standard deviation in
the column indicate no significant difference (p>0.05) between the samples.
3.4 Effect on color characteristics
There was no significant difference (p>0.05) in lightness (L*), Chroma (C*), and Hue angle (h*)
values between the control and samples processed by different combination of pressure, nisin and
temperature (Table 19).

178
Table 19. Effect of combinations of HPP, temperature, and nisin on the color characteristics of carrot
juice
Samples Lightness (L*) Chroma (C*) Hue Angle (h*)
a. Control 12.09±0.41a 38.63±0.95a 0.56±0.01a
b. 200 MPa, 50 ppm nisin, 50°C 10.86±0.62a 36.78±1.40a 0.53±0.02a
c. 300 MPa, 25 ppm nisin, 35°C 11.03±0.15a 36.68±0.34a 0.54±0.00a
d. 400 MPa, 0 ppm nisin, 35°C 10.66±0.67a 35.79±1.72a 0.53±0.02a
e. 500 MPa, 0 ppm nisin, 20°C 8.98±1.22a 33.30±2.52a 0.48±0.06a
The values are a mean ± standard deviation. The same letter (superscript) after standard deviation in
the column indicates no significant difference between the samples.
3.5 Effect on Bioactive compounds
Since carrot juice has several essential bioactive compounds, it is of interest to study the effect of
each selected treatment on those compounds. Hereby, changes on the total carotenoids, phenolic
compounds and ascorbic acid content were determined.
3.5.1 Total carotenoids
There was a slight but non-significant (p>0.05) increase in total carotenoid concentration in
samples treated by HPP at 300 MPa, 400 MPa, and 500 MPa, and a slight but also non-significant
(p>0.05) decrease for the sample treated at 200 MPa at 50°C (Table 20). The application of 200
MPa may not be high enough to allow full extraction of carotenoid. The increase in total carotenoid

179
observed in all other samples after high pressure treatment may be due to mechanical disruption
of the cell wall resulting in releasing free carotenoids into the juice. In fact, high pressure along
with nisin and a slight increase in temperature affects membrane integrity, creating pores in the
cell membrane through which carotenoid molecules may be released. Many studies show an
increase in carotenoid content after high pressure treatments. Hsu (2008) observed an increase up
to 62% in carotenoid content for tomato purée treated with a minimum pressure of 300 MPa;
Sánchez‐Moreno et al. (2006) observed an increase in carotenoid of tomato purée treated by HPP
at 400 MPa and 25°C for 15 min.
The short treatment duration (2 minutes), the moderate temperature, pressure, and nisin
levels used here may explain why the processing conditions did not affect the carotenoid content,
whereas other studies reported changes with statistical significance. For example, Patras et al.
(2009a) reported a significant increase in carotenoid content in carrot purée after HPP treatment at
400, 500, and 600 MPa for 15 minutes (58% of increase at 600 MPa).
3.5.2 Effect on total phenolic compounds
The results presented in Table 20 show an increase in the concentration of phenolic compounds in
all treated samples relative to the untreated carrot juice. Nevertheless, this increase was not
significant, which may be due to the mild conditions used in this study. As with carotenoids, this
may be explained by the membrane damages caused by the combination of HPP, nisin, and
temperature (see 3.5.1). Our observations follow the same trend described by Patras et al. (2009b),
who reported a 9.8% increase in the phenolic content of strawberry purée treated at 600 MPa.
Barba et al. (2013) reported similar results: a 13 to 27% increase in blueberry juice samples treated

180
by HPP at 200 MPa for 5 to 15 minutes, and a 24% increase when they were treated at 400 MPa
for 15 min.
Table 20. Effect of selected combination of treatments on carotenoids, phenolic compounds and ascorbic
acid
Samples
Carotenoids
(mg/L)
Phenolics
(mg/L)
Ascorbic Acid
(mg/100g juice)
a. Control 435.18±0.00a 26.13±0.91a 23.12±2.86a
b. 200 MPa, 50ppm nisin, 50°C 394.73±15.00a 28.28±0.87a 16.73±1.76a
c. 300 MPa, 25ppm nisin, 35°C 465.18±0.00a 27.26±0.34a 19.15±3.30a
d. 400 MPa, 0ppm nisin, 35°C 450.09±50.00a 28.64±1.19a 18.49±0.00a
e. 500 MPa, 0ppm nisin, 20°C 515.63±48.6a 27.77±1.16a 18.49±0.00a
The values are a mean ± standard deviation. The same letter (superscript) after standard deviation in the
column indicate no significant difference (p>0.05) between the samples/processing conditions.
3.5.3 Effect on ascorbic acid
The study of the retention of ascorbic acid in carrot juice after processing reveals a non-significant
decrease in this vitamin in each treated sample compared to the unprocessed control (Table 20).
Although the mechanism of ascorbic acid degradation is not completely elucidated, researchers
have observed two different paths in ascorbic acid degradation. One follows an aerobic path, and
the other a non-anaerobic path, described by Burdurlu et al. (2006).
In the aerobic mechanism, the ascorbic acid reacts with O2 at the interface between the air
and the juice. In addition, according to Henry’s Law:

181
𝑃𝑂2 = 𝐻 × 𝑥𝑂2 ,
where PO2 is the pressure due to O2 in the air in Pa, χO2 the mole-proportion of O2 in the solution,
and H the Henry’s constant of 769.2 L.atm/mol. It can be seen that an increase in pressure leads to
an increase in the proportion of dissolved O2 in the solution. In the case of HPP, the increase in
pressure may lead to an increase in the O2 solubility; according to Robertson and Samaniego
(1986), the rate of oxidative ascorbic acid degradation depends on O2 dissolution. Therefore, the
more O2 is in the solution; the more ascorbic acid is oxidized.
This study also reveals that high-pressure treatment of carrot juice at 50°C can lead to a
higher reduction of ascorbic acid compared to the treatment at 20 or 35°C. This may be due to the
fact ascorbic acid is a precursor of non-enzymatic degradation, and this reaction is accelerated at
high temperature. The treatment only lasted two minutes, which may not be long enough to allow
the reaction to be completed. These results are consistent with the ones obtained by Patras et al.
(2009b), who demonstrated that thermally processed strawberry purée contains less ascorbic acid
than a sample treated with HPP. The same authors observed that thermal processing (70°C, 2 min)
led to a decrease of 22.6% in ascorbic acid in strawberry purée, while a 600 MPa treatment led to
only a 6% reduction in ascorbic acid levels. In any case, in the present study, the decrease in
ascorbic acid at 50°C is not significant, potentially explained by the relatively small increase in
temperature and short duration of this experiment compared to the more intense conditions
described by Patras et al. (2009b). The results of the present work are in line with the findings of
Fernández-García et al. (2001) who observed a non-significant decrease in ascorbic acid in orange-
lemon-carrot juice treated by HPP at 500 MPa and 800 MPa for 5 minutes.
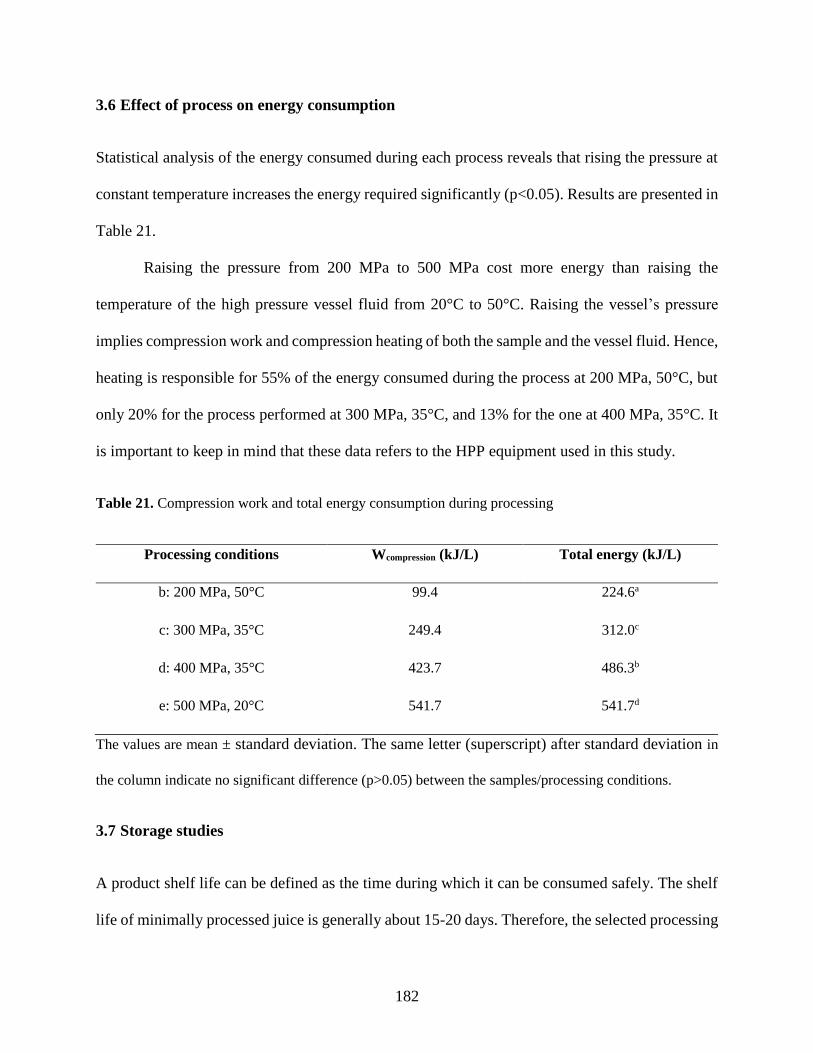
182
3.6 Effect of process on energy consumption
Statistical analysis of the energy consumed during each process reveals that rising the pressure at
constant temperature increases the energy required significantly (p<0.05). Results are presented in
Table 21.
Raising the pressure from 200 MPa to 500 MPa cost more energy than raising the
temperature of the high pressure vessel fluid from 20°C to 50°C. Raising the vessel’s pressure
implies compression work and compression heating of both the sample and the vessel fluid. Hence,
heating is responsible for 55% of the energy consumed during the process at 200 MPa, 50°C, but
only 20% for the process performed at 300 MPa, 35°C, and 13% for the one at 400 MPa, 35°C. It
is important to keep in mind that these data refers to the HPP equipment used in this study.
Table 21. Compression work and total energy consumption during processing
Processing conditions Wcompression (kJ/L) Total energy (kJ/L)
b: 200 MPa, 50°C 99.4 224.6a
c: 300 MPa, 35°C 249.4 312.0c
d: 400 MPa, 35°C 423.7 486.3b
e: 500 MPa, 20°C 541.7 541.7d
The values are mean ± standard deviation. The same letter (superscript) after standard deviation in
the column indicate no significant difference (p>0.05) between the samples/processing conditions.
3.7 Storage studies
A product shelf life can be defined as the time during which it can be consumed safely. The shelf
life of minimally processed juice is generally about 15-20 days. Therefore, the selected processing

183
conditions have to maintain a low level of microbial load during storage period as well as quality
attributes. Hence, microbial load, pH, TSS, turbidity, and color were analyzed for 28 days at 4°C
3.7.1 Microbiological aspects
The steady growth of total aerobic mesophilic bacteria was observed in all samples during storage
at 4°C for 4 weeks (Figure 4). The control sample was spoiled with total mesophilic count over 5
log when the juice was analyzed after one week. Sample c (300 MPa, 35°C, 25 ppm nisin) had the
lowest microbial count at week zero (just after processing) and has only less than 2 log CFU/mL
of mesophilic bacteria after 28 days of storage. The sample b (200 MPa, 50°C, and 50 ppm nisin)
was also microbiologically stable for 4 weeks. Samples d and e are those without nisin the bacterial
load was around 1 log just after processing whereas on day 28, the microbial load was around 3-
log. The comparison between carrot juice with and without nisin shows that both types of juice
had almost equivalent load of aerobic bacteria just after processing, but during storage, juice with
nisin inhibited growth, making the juice more stable than the juice without it.
Sample c which contains 2 log of bacteria at day 28, was considered as microbiologically
stable for four weeks, a good shelf life for this type of low-acid minimally processed product. The
incorporation of 25 ppm nisin and processing at 35°C made the juice microbiologically safe for 4
weeks at 4°C without using significant high pressures (≥500 MPa) or high temperature treatment
(>70°C), or using chemical preservatives.

184
Figure 28. Growth of aerobic mesophilic bacteria in carrot juice during storage at 4°C when exposed to
different treatments: b: 200 MPa, 50 ppm, 50°C, c: 300 MPa, 25 ppm, 35°C, d: 400 MPa, 0 ppm, 35°C, e:
500 MPa, 0 ppm, 20°C.
In the study on the combined effect of HPP and nisin on cucumber juice conducted by Zhao
et al. (2013), the authors found that in juice treated by 500 MPa for 2 min with nisin (100 IU/mL),
the total aerobic bacteria count grew more slowly than in juice treated without nisin during storage
at 4°C for 50 days. The total aerobic bacteria in juice treated with 500 MPa, 2 min and 100 IU/mL
nisin was just 1.5 log cycles at the end of the storage period. The authors claimed that the cucumber
juice treated with nisin was microbiologically safe for 50 days at 4°C. In the present study, it can
be claimed that application of 300 MPa of pressure with 25 ppm nisin, and processing at 35°C for
2 min was able to make carrot juice microbiologically stable for 4 weeks at 4°C. Level of pressure
in the present study was much lower than Zhao’s work (2013), hence, the shelf life is shorter.
Application of higher pressure keeping nisin concentration and processing temperature constant
would definitely render a longer shelf life for carrot juice than the one reported here.
0
0.5
1
1.5
2
2.5
3
3.5
4
0 1 2 3 4
Log
(CFU
/mL)
Weeks
b
c
d
e

185
3.7.2 Change in pH, total soluble solids and turbidity during storage
There was a steady and significant (p<0.05) reduction of pH, soluble solids, and turbidity in fresh
carrot juice (control sample) during storage. Initially, the pH value of fresh carrot juice was 6.60.
After storage at 4°C for 4 weeks, its pH had dropped to 4.82. In the carrot juice treated with 50
ppm nisin and 200 MPa at 50°C (sample a), there was also a significant reduction of pH in week
4, but the reduction of pH was not significant until week 3. For sample c (25 ppm nisin, 300 MPa
pressure, 35°C), there was a slight reduction of the pH across the whole storage period. The same
trend was observed in sample d which was treated by 400 MPa, 35°C (without nisin) as well as in
the sample ‘e’ treated by 500 MPa, 20°C. The reduction of pH in control sample during storage
might be due to the production of acids by microorganisms (Palma-Harris et al., 2002). In samples
with nisin, the change in pH during storage is less significant (Table 22), likely due to the presence
of fewer aerobic mesophilic bacteria generating acid by-products.
Slight decreases in total soluble solids were observed in the control sample during storage,
but in all of the processed samples, there was non-significant (p>0.05) reduction. This observation
may suggest that the sensory quality may stay unchanged after 4 weeks of storage at 4°C.
Regarding turbidity, there was a gradual reduction in the control sample which might be associated
with microbial growth. In all the processed samples, the reduction is not steady, and the change is
non-significant (p>0.05).

186
Table 22. Change in pH, Total soluble solids and Turbidity of carrot juice during storage at 4°C.
Weeks pH TSS (°Bx) Turbidity (Abs. at 660 nm)
a: Control
Sample
(Untreated
fresh carrot
juice)
0 6.60±0.00a 9.35±0.15a 2.32±0.03a
1 5.62±0.03ab 8.40±0.00ab 2.14±0.02a
2 5.55±0.41ab 7.85±0.05b 1.94±0.31a
3 5.89±0.03a 7.85±0.05b 1.04±0.13b
4 4.82±0.02b 7.70±0.40b 0.66±0.04b
b: 200 MPa,
50 ppm
nisin, 50°C
0 6.40±0.01a 8.30±0.00a 2.09±0.01a
1 6.08±0.10a 8.60±0.10a 2.06±0.00ab
2 6.35±0.02a 8.05±0.25a 1.75±0.22ab
3 6.38±0.01a 7.85±0.45a 1.67±0.02b
4 5.53±0.12b 8.30±0.00a 2.14±0.01a
c: 300 MPa,
25 ppm,
35°C
0 6.43±0.00a 8.10±0.00a 2.02±0.02a
1 6.22±0.01b 8.25±0.05a 1.53±0.27ab
2 6.06±0.01c 8.15±0.05a 1.52±0.00ab
3 6.04±0.01c 8.20±0.00a 1.34±0.06b
4 6.03±0.01d 8.15±0.05a 1.46±0.13ab
0 6.44±0.00ab 8.50±0.10a 2.01±0.05ab

187
d: 400 MPa,
0 ppm
nisin, 35°C
1 6.26±0.00ab 8.60±0.10a 1.79±0.06bc
2 6.04±0.03b 8.45±0.05a 1.77±0.09bc
3 6.64±0.01a 8.80±0.10a 1.69±0.04c
4 6.09±0.22ab 8.65±0.15a 2.14±0.02a
e: 500 MPa,
0 ppm,
20°C
0 6.41±0.00ab 9.05±0.05a 2.04±0.05a
1 6.16±0.01cd 9.15±0.15a 1.93±0.17a
2 6.02±0.02d 8.90±0.10a 1.76±0.10a
3 6.51±0.05a 9.00±0.10a 1.74±0.05a
4 6.27±0.01bc 8.90±0.00a 2.10±0.00a
The values are mean ± standard deviation. The same letter (superscript) after standard deviation in
the column indicate no significant difference (p>0.05) between the samples/processing conditions.
3.7.3 Change in color characteristics
There was no significant difference (p>0.05) in color of carrot juice between control and treated
sample immediately after processing. A gradual reduction in lightness (L*) value was observed in
all the samples including the control. López-Malo et al. (1998) found no significant changes in the
L* values of high-pressure processed (345 MPa and 689 MPa) avocado purée during storage at
5°C.
In terms of color difference (ΔE*), no significant changes were observed in any high
pressure processed samples until three weeks of storage at 4°C, but in control samples, the ΔE
value changed very rapidly from the second week. Non-significant changes in the ΔE* value in

188
processed samples indicates that color of the carrot juice was well-preserved by HPP. The Chroma
value (C*) did not change significantly in sample c, d, and e for three weeks. In the case of sample
b, it was stable for two weeks, but in the control sample Chroma value was stable for only one
week. There was a gradual reduction in hue angle (h*) in all samples during the storage period.
There was no difference in hue angle between different processing conditions.
Table 23. Change in color characteristics of carrot juice during storage at 4°C.
Weeks Lightness (L*) ΔE* Chroma (C*) Hue Angle (h*)
a: Control
Sample
(Untreated
fresh carrot
juice)
0 12.09±0.41a 38.63±0.95a 0.56±0.01a
1 9.88±0.68a 4.47±2.08a 37.33±0.86a 0.47±0.04ab
2 5.38±0.44b 11.91±0.01b 30.90±0.96b 0.39±0.01bc
3 6.88±0.36b 14.86±0.37b 26.54±1.72c 0.35±0.01c
4 5.67±0.01b 15.71±1.26b 25.84±0.32c 0.36±0.02c
b: 200 MPa,
50 ppm nisin,
50°C
0 10.86±0.62a 36.78±1.40a 0.53±0.02a
1 7.59±0.13b 6.83±1.71a 32.53±0.56ab 0.41±0.00a
2 6.06±0.40bc 6.81±2.81a 33.97±1.21a 0.43±0.07a
3 3.64±0.58c 18.9±3.92a 26.00±3.73b 0.63±0.44a
4 5.96±0.85bc 13.1±2.29a 25.25±0.50b 0.42±0.07a
c: 300 MPa,
25 ppm, 35°C
0 11.03±0.15a 36.68±0.34a 0.54±0.00a
1 7.69±0.84ab 7.22±0.88a 35.50±3.79a 0.38±0.02bc

189
2 7.24±0.13ab 7.89±0.21a 31.74±1.55ab 0.40±0.01bc
3 5.50±1.78b 8.36±0.73a 31.62±0.46ab 0.42±0.02b
4 5.18±0.09b 13.6±0.68b 25.95±0.55b 0.35±0.00c
d: 400 MPa,
0 ppm nisin,
35°C
0 10.66±0.67a 35.79±1.72a 0.53±0.02a
1 8.61±0.22ab 6.53±3.36a 31.91±1.57a 0.39±0.08a
2 7.41±0.31ab 6.90±2.20a 31.20±0.74a 0.41±0.01a
3 6.39±0.93b 9.04±3.72a 30.19±3.07a 0.37±0.04a
4 6.28±0.87b 10.06±0.67a 28.00±2.66a 0.39±0.04a
e: 500 MPa, 0
ppm, 20°C
0 8.98±1.22a 33.30±2.52a 0.48±0.06a
1 7.37±0.03ab 3.66±2.22a 30.90±0.65ab 0.41±0.00a
2 6.42±0.54ab 5.57±1.33a 29.43±1.36ab 0.38±0.02a
3 6.26±0.24ab 5.70±3.20a 29.67±0.88ab 0.38±0.01a
4 4.37±0.99b 10.12±1.24a 26.92±1.28b 0.28±0.10a
The values are mean ± standard deviation. The same letter (superscript) after standard deviation in
the column indicate no significant difference (p>0.05) between the samples/processing conditions.
4. Conclusions
The use of HPP in conjunction with nisin and moderate thermal treatments is an effective way of
reducing microbial load in carrot juice, and potentially in other low-acid juices. The addition of
nisin and processing at mild temperatures (35 or 50°C) enhanced the destruction of both gram-

190
positive and gram-negative bacteria. The combined effect of nisin, mild temperatures and HPP
was better to inactivate bacteria than using one hurdle at a time due to their complementarity
actions on membrane cell. These results demonstrated that the proposed combination would
effectively reduce the microbial loads in low-acid juices using moderate pressure and temperature,
which could significantly reduce processing cost and increase throughput. For instance, treatment
performed at 300 MPa, 25 ppm of nisin at 35°C could be an effective combination of hurdles. This
leads to at least 5 log reductions of both E. coli and Listeria innocua, and was stable for 4 weeks
in terms of aerobic mesophilic bacterial growth, color, TSS, turbidity, and did not have any
significant effect on the degradation of ascorbic acid, phenolic compounds, and carotenoid content.
High pressure treatment in combination with nisin and mild temperatures seems to be effective
and offer cost savings by increasing energy efficiency and throughput. These types of combined
treatments can greatly reduce energy requirements with no loss of efficacy compared to
conventional thermal processes or HPP when used alone.

191
References
Barba, F. J., Esteve, M. J., & Frigola, A. (2013). Physicochemical and nutritional characteristics
of blueberry juice after high pressure processing. Food Research International, 50(2), 545-
549.
Bermúdez-Aguirre, D., Corradini, M. G., Candoğan, K., & Barbosa-Cánovas, G. V. (2016). High
Pressure Processing in Combination with High Temperature and Other Preservation
Factors. In High Pressure Processing of Food (pp. 193-215). Springer New York.
Bos, M. P., Robert, V., & Tommassen, J. (2007). Biogenesis of the gram-negative bacterial outer
membrane. Annual Review of Microbiology, 61, 191-214.
Boziaris, I. S., & Adams, M. R. (1999). Effect of chelators and nisin produced in situ on inhibition
and inactivation of Gram negatives. International Journal of Food Microbiology, 53(2),
105-113.
Brewer, R., Adams, M. R., & Park, S. F. (2002). Enhanced inactivation of Listeria monocytogenes
by nisin in the presence of ethanol. Letters in Applied microbiology, 34(1), 18-21.
Burdurlu, H. S., Koca, N., & Karadeniz, F. (2006). Degradation of vitamin C in citrus juice
concentrates during storage. Journal of Food Engineering, 74(2), 211-216.
Ciancaglinia, P., Santos, H. L., Daghastanli, K.R.P., Thedei , Gerald Jr. (2001). Using a classical
method of vitamin C quantification as a tool for discussion of its role in the body.
Biochemistry and Molecular Biology Education. 29(3), 110-114

192
de Arauz, L. J., Jozala, A. F., Mazzola, P. G., & Penna, T. C. V. (2009). Nisin biotechnological
production and application: a review. Trends in Food Science & Technology, 20(3), 146-
154.
Dede, S., Alpas, H., & Bayındırlı, A. (2007). High hydrostatic pressure treatment and storage of
carrot and tomato juices: Antioxidant activity and microbial safety. Journal of the Science
of Food and Agriculture, 87(5), 773-782.
Derradji-Benmeziane, F., Djamai, R., & Cadot, Y. (2014). Antioxidant capacity, total phenolic,
carotenoid, and vitamin C contents of five table grape varieties from Algeria and their
correlations. OENO One, 48(2), 153-162.
Fernández García, A., Butz, P., Bognàr, A., & Tauscher, B. (2001). Antioxidative capacity,
nutrient content and sensory quality of orange juice and an orange-lemon-carrot juice
product after high pressure treatment and storage in different packaging. European Food
Research and Technology, 213(4), 290-296.
Hauben, K. J., Wuytack, E. Y., Soontjens, C. C., & Michiels, C. W. (1996). High-pressure transient
sensitization of Escherichia coli to lysozyme and nisin by disruption of outer-membrane
permeability. Journal of Food Protection®, 59(4), 350-355.
Helander, I. M., & Mattila-Sandholm, T. (2000). Permeability barrier of the Gram-negative
bacterial outer membrane with special reference to nisin. International Journal of Food
Microbiology, 60(2), 153-161.
Hsu, K. C. (2008). Evaluation of processing qualities of tomato juice induced by thermal and
pressure processing. LWT-Food Science and Technology, 41(3), 450-459.

193
Jack, R. W., Tagg, J. R., & Ray, B. (1995). Bacteriocins of gram-positive bacteria. Microbiological
Reviews, 59(2), 171-200.
Kalchayanand, N., Dunne, P., Sikes, A., & Ray, B. (2004). Viability loss and morphology change
of foodborne pathogens following exposure to hydrostatic pressures in the presence and
absence of bacteriocins. International Journal of Food Microbiology, 91(1), 91-98.
Lee, D. U., Heinz, V., & Knorr, D. (2003). Effects of combination treatments of nisin and high-
intensity ultrasound with high pressure on the microbial inactivation in liquid whole
egg. Innovative Food Science and Emerging Technologies, 4(4), 387-393.
Liao, H., Sun, Y., Ni, Y., Liao, X., Hu, X., Wu, J., & Chen, F. (2007). The effect of enzymatic
mash treatment, pressing, centrifugation, homogenization, deaeration, sterilization and
storage on carrot juice. Journal of Food Process Engineering, 30(4), 421-435.
López-Malo, A., Palou, E., Barbosa-Cánovas, G. V., Welti-Chanes, J., & Swanson, B. G. (1998).
Polyphenoloxidase activity and color changes during storage of high hydrostatic pressure
treated avocado puree. Food Research International, 31(8), 549–556.
Lubelski, J., Rink, R., Khusainov, R., Moll, G. N., & Kuipers, O. P. (2008). Biosynthesis,
immunity, regulation, mode of action and engineering of the model lantibiotic
nisin. Cellular and Molecular Life Sciences, 65(3), 455-476.
McNamee, C., Noci, F., Cronin, D. A., Lyng, J. G., Morgan, D. J., & Scannell, A. G. M. (2010).
PEF based hurdle strategy to control Pichia fermentans, Listeria innocua and Escherichia
coli k12 in orange juice. International Journal of Food Microbiology, 138(1), 13-18.
194
Murchie, L. W., Cruz-Romero, M., Kerry, J. P., Linton, M., Patterson, M. F., Smiddy, M., & Kelly,
A. L. (2005). High pressure processing of shellfish: a review of microbiological and other
quality aspects. Innovative Food Science and Emerging Technologies, 6(3), 257-270.
Oey, I., Van der Plancken, I., Van Loey, A., & Hendrickx, M. (2008). Does high pressure
processing influence nutritional aspects of plant based food systems?. Trends in Food
Science and Technology, 19(6), 300-308.
Palma-Harris, C., McFeeters, R. F., & Fleming, H. P. (2002). Fresh cucumber flavor in refrigerated
pickles: Comparison of sensory and instrumental analysis. Journal of Agricultural and
Food Chemistry, 50, 4875–4877.
Patras, A., Brunton, N. P., Da Pieve, S., & Butler, F. (2009b). Impact of high pressure processing
on total antioxidant activity, phenolic, ascorbic acid, anthocyanin content and colour of
strawberry and blackberry purées. Innovative Food Science and Emerging
Technologies, 10(3), 308-313.
Patras, A., Brunton, N., Da Pieve, S., Butler, F., & Downey, G. (2009a). Effect of thermal and high
pressure processing on antioxidant activity and instrumental colour of tomato and carrot
purées. Innovative Food Science and Emerging Technologies, 10(1), 16-22.
Plaza, L., Sánchez-Moreno, C., Elez-Martínez, P., de Ancos, B., Martín-Belloso, O., & Cano, M.
P. (2006). Effect of refrigerated storage on vitamin C and antioxidant activity of orange
juice processed by high-pressure or pulsed electric fields with regard to low
pasteurization. European Food Research and Technology, 223(4), 487-493.

195
Robertson, G. L., & Samaniego, C. M. L. (1986). Effect of initial dissolved oxygen levels on the
degradation of ascorbic acid and the browning of lemon juice during storage. Journal of
Food Science, 51(1), 184-187.
Sánchez‐Moreno, C., Plaza, L., De Ancos, B., & Cano, M. P. (2006). Impact of high‐pressure and
traditional thermal processing of tomato purée on carotenoids, vitamin C and antioxidant
activity. Journal of the Science of Food and Agriculture, 86(2), 171-179.
Shiu, C., Zhang, Z., & Thomas, C. R. (2001). A comparison of the mechanical properties of
different bacterial species. In Applied Microbiology (pp. 155-162). Springer Netherlands.
Silva, F. V. (2016). Modeling the inactivation of psychrotrophic Bacillus cereus spores in beef
slurry by 600MPa HPP combined with 38–70° C: Comparing with thermal processing and
estimating the energy requirements. Food and Bioproducts Processing, 99, 179-187.
Smith, K., Mittal, G. S., & Griffiths, M. W. (2002). Pasteurization of milk using pulsed electrical
field and antimicrobials. Journal of Food Science, 67(6), 2304-2308.
Sokołowska, B., Skąpska, S., Fonberg-Broczek, M., Niezgoda, J., Chotkiewicz, M., Dekowska,
A., & Rzoska, S. (2012). The combined effect of high pressure and nisin or lysozyme on
the inactivation of Alicyclobacillus acidoterrestris spores in apple juice. High Pressure
Research, 32(1), 119-127.
ter Steeg, P. F., Hellemons, J. C., & Kok, A. E. (1999). Synergistic actions of nisin, sublethal
ultrahigh pressure, and reduced temperature on bacteria and yeast. Applied and
Environmental Microbiology, 65(9), 4148-4154.

196
Tong, Z., Ni, L., & Ling, J. (2014). Antibacterial peptide nisin: A potential role in the inhibition
of oral pathogenic bacteria. Peptides, 60, 32-40.
Wuytack, E. Y., Diels, A. M., & Michiels, C. W. (2002). Bacterial inactivation by high-pressure
homogenisation and high hydrostatic pressure. International Journal of Food
Microbiology, 77(3), 205-212.
Zhang, Y., Liu, X., Wang, Y., Zhao, F., Sun, Z., & Liao, X. (2016). Quality comparison of carrot
juices processed by high-pressure processing and high-temperature short-time
processing. Innovative Food Science and Emerging Technologies, 33, 135-144.
Zhao, L., Wang, S., Liu, F., Dong, P., Huang, W., Xiong, L., & Liao, X. (2013). Comparing the
effects of high hydrostatic pressure and thermal pasteurization combined with nisin on the
quality of cucumber juice drinks. Innovative Food Science and Emerging
Technologies, 17, 27-36.

197
CHAPTER SIX
INACTIVATION OF Listeria innocua IN CARROT-ORANGE JUICE BLENDS BY
HIGH HYDROSTATIC PRESSURE
Abstract
High Pressure Processing (HPP) is a nonthermal technology that has shown promising results as
an alternative to thermal pasteurization of fruit and vegetable juices. The objective of this study
was to develop a processing method to effectively pasteurize carrot-orange juice blends of different
pH using mild HPP treatment and short processing time. The effect of three different pH levels on
the inactivation of L. innocua (ATCC 8456TM) was studied at three levels of pressure and five
different treatment times at room temperature (20°C).
For the juice blend with pH 4, 300 MPa of pressure and 2 min of treatment time was
required to achieve more than 6 log reduction of L. innocua. For the same level of inactivation,
400 MPa, 1 min was required for the 1:1 blend (pH 5), and for pH 6, 400 MPa, 3 min was required.
In case of treatments with 400 MPa, there was complete inactivation (7 log reduction) in the blends
with pH 4 and 5 in one minute; but in the case of pH 6, three min was required to achieve the same
level of inactivation.
Storage studies show that the selected HPP conditions were able to maintain the aerobic
mesophilic bacteria count below 2 log for 28 days. There were no significant changes in PH, color,
and TSS during storage for the juice with pH 4 and 5. For juice with pH 6, slight change on those
characteristics were observed during storage.

198
These results show that HPP can be used to safely process selected carrot-orange juice
blends without sacrificing quality attributes. Addition of orange juice to carrot juice is a natural
way to add hurdles that can play a significant role in the reduction of pressure and treatment time
which finally reduces the energy input and processing cost.
1. Introduction
Fresh fruit and vegetable juices are excellent sources of essential bioactive compounds. In the
current market, the mixture of fruit and vegetable juices is very popular as it can balance the
nutrients and enhance the taste. Carrot-orange juice blend is rich in beta carotene (from carrot) and
ascorbic acid (from orange) and therefore, it is a very popular beverage in the United States
because of its high nutritive value. The addition of orange juice in carrot juice not only balance the
nutrient but also increases the acidity making the product suitable for processing. Mixing orange
juice with carrot juice is therefore a good way to lower the pH and still comply with clean label
requirements. During thermal processing and storage of such juice, significant losses in valuable
nutrients as well as changes in microbial quality and physicochemical characteristics can take place
(Arena et al., 2001; Polydera et al., 2003). Thermal processing is typically conducted at the
temperature higher than 60°C for a few seconds to minutes based on the pH of juice. High
temperature and longer holding time during processing have shown to have detrimental effects on
the quality of juice and blends (Chen et al., 2013). Food scientists and engineers are now
developing novel methods to process nutritious beverages to preserve their valuable nutrients and
making the product microbiologically safe. To better optimize each process, researchers are also
working to improve process efficiency and reduce operation cost.

199
High pressure processing is one of the novel methods that is currently expanding in the
field of beverage processing. During processing by HP there is generation of small amount of heat
due to compression, which positively impacts the inactivation of microorganisms. Since
temperature is not the governing factors in HPP, there is greater chances of retention of nutrients
during processing (Oey et al., 2008). Additionally, HPP does not affect covalent bonds, hence,
nutrients are not much affected. Moreover, the process is independent of the shape and the size of
the products, but its effect on microorganisms depends on the pH and water activity of the product.
Treating product with high pH (>6.5) using only HPP, requires a very high pressure (>600 MPa)
and a long holding time (>5 min). These two requirements make the process less efficient and less
cost effective. Hence, some modifications of the product or the process are necessary to enhance
the HPP treatment. Since pressure and pH can synergistically inactivate microorganisms present
in the product, lowering the pH could decrease the pressure and/or the treatment time.
The main objective of this study was to investigate the effect of different pH of juice on
the inactivation of microorganisms by HPP. The approach was to combine fruit and vegetable
juices to have a blend with different pH and to process it by HPP using mild-pressures, and short
holding times with the aim of reducing energy input. Another objective of this study was to explore
the effect of HPP on the physicochemical characteristics of blended juice immediately after
processing and during storage at 4°C for 28 days. The overall aim of this study was to develop a
processing methodology based on the pH of juice blends, level of pressure, and treatment time to
predict the microbial inactivation, energy consumption and shelf life of the products.

200
2. Materials and Methods
This section discusses the method of preparation of juice, inoculation of Listeria culture, and the
protocol used for the processing. Additionally, the methods used for microbiological and
physicochemical analysis are highlighted.
2.1 Sample Preparation
In the first part of the study, three juices with pH 4, 5, and 6 were prepared using pre-pasteurized
carrot juice (Boalthouse Farms, Bakersfield, CA) and orange juice (Simply Orange Juice
Company, Apopka, FL). Three different formulations were created using Pearson’s square method
in which carrot juice with pH 6.4 was mixed with orange juice with pH 3.5 to get blends with
various pH. The proportion of carrot and orange in the blends were 1:6, 1:1, and 6:1 for pH 4, 5,
and 6 respectively. Since there was no competitive microflora present in both pasteurized juices,
the samples were used to select the level of pressure and time for each pH that can result in at least
five log reduction of L. innocua.
After the completion of microbial inactivation studies, fresh carrot juice and fresh orange
juice were prepared in the lab using a domestic juice extractor (Hamilton Beach model 67608Z,
Hamilton Beach Brands, Inc., Glen Allen, VA). The juices were mixed using the same method to
get the blends with pH 4, 5, and 6. Fresh juice was used in this phase to study the effect of high
pressure on the selected quality characteristics immediately after processing and during storage.

201
2.2 Culture Preparation and Inoculation
A freeze-dried culture of L. innocua cells (ATCC 51742TM) was grown using 100 ml sterilized
tryptic soy broth (Becton, Dickinson and Co., Sparks, MD) with 0.6% yeast extract (Becton,
Dickinson and Co., Sparks, MD). Cells of Listeria were kept in a water bath shaker at 37°C and
218 rpm until the early stationary phase was reached. The growth curve was plotted by measuring
the absorbance at 540 nm every 30 minutes using a spectrophotometer (Spectronic 20 Genesys,
Spectronic Instruments Inc., Rochester, NY). Cells were harvested at the early stationary phase
and vials with 2 ml of 20% glycerol and 2 ml of culture were stored at -21 °C until use. Frozen
culture was thawed during the experiment and activated using 100 ml sterilized tryptic soy broth
plus 0.6% yeast extract. Juice samples were inoculated with L. innocua to get the final
concentration of 7 log CFU/ml.
2.3 High Pressure Processing
The juice samples (20 mL) with culture were packaged into Nylon/PE pouches (3 Mil, Ultra
Source, Kansas City, MO) and sealed using the impulse sealer (Impulse Heat Sealer 3T06,
Midwest Pacific, Taiwan). Pouches were immediately pressurized using an Engineering Pressure
System Inc’s (EPSI) HPP unit. The desired pressure level was achieved using an electrohydraulic
intensifier pump (Hochdruck-Systeme GmbH, AP 10-0670-1116, Sigless, Austria) that
pressurized the vessel to operating pressure in a few seconds (5-10 seconds). Water with 5% Mobil
Hydrasol 78 was used as the pressure transmitting medium. Processing conditions were 200, 300,
and 400 MPa with a holding time of 1 to 5 min and the temperature before processing was 20°C.
After treatment, samples were placed in ice and further analysis was conducted immediately.

202
2.4 Analysis of Survivors
Microbiological analysis of samples was conducted immediately after processing. Juice samples
were serially diluted in sterile peptone water (0.1% Bacto™ Peptone, Difco Laboratories) and
pour-plating was conducted with Tryptic Soy Agar with 0.6% yeast extract (TSBYE). Plates were
incubated for 48 hours at 37°C and colony forming units (CFU)/ml were counted manually.
2.5 Determination of Color and Soluble Solid Contents
Color parameters of the blended juice samples were measured before and after processing. A
sample of juice blend (10 mL) was poured into the transparent cuvette and color parameters (L*,
a*, and b*) were determined using a Minolta CM-2002 colorimeter (Minolta Camera Co., Osaka,
Japan). Soluble solids content was assessed using a hand refractometer (Atago No. 3840, Atago,
Tokyo, Japan).
2.6 Ascorbic Acid
The ascorbic acid content of the juice blends was determined using the methods described by
Ciancaglini et al. (2001). This procedure uses iodine solution (0.005 mol/L) which reacts with
ascorbic acid to produce dehydroascorbic acid and iodide ions as follows:
𝑎𝑠𝑐𝑜𝑟𝑏𝑖𝑐 𝑎𝑐𝑖𝑑 + 𝐼2 ⇾ 2𝐼− + 𝑑𝑒ℎ𝑦𝑑𝑟𝑜𝑎𝑠𝑐𝑜𝑟𝑏𝑖𝑐 𝑎𝑐𝑖𝑑
In brief, 20 mL of juice blends was added to 150 mL of water and 1 mL of starch solution (0.5%,
w/v). This solution was kept under agitation and iodine was added until the end point (the
formation of dark green color). The volume of iodine required to reach the end point was used to

203
determine the ascorbic acid concentration and was expressed in mg ascorbic acid equivalent per
100 g of juice.
2.7 Total Soluble Phenolic
Phenolic content in the juice before and after treatment was determined using the protocol
described by Derradji-Benmeziane et al., (2014). The carrot-orange juice blend (50 μL) was poured
into a volumetric flask; afterwards, 2.5 mL of Folin-Ciocalteu reagent (diluted 1/10) was added.
After leaving for 10 min at room temperature, 2 mL of Na2CO3 (7.5%) was added and the sample
was kept for 30 min in the dark. Absorbance was determined at 760 nm. The standard curve was
prepared using Gallic acid and the results were expressed in mg equivalent Gallic acid per L.
2.8 Total Carotenoid
Carotenoid content of the juice was determined using the method described by Liao et al., (2007)
with some modification. In brief, 25 mL of juice was poured into a separating funnel. Then 80 mL
of a hexane-acetone mix (1:1, v/v) were added directly in the separation funnel. The organic phase
was collected and anhydrous sodium sulfate was added to absorb the moisture. The absorbance
was measured at 450 nm at room temperature. A standard curve was prepared using β-carotene (2-
10 μg/mL) dissolved in hexane solution.
2.9 Quantification of Energy requirements
The total energy (W) in the system can be defined as the sum of energy required to increase the
pressure and the thermal energy which increases the temperature of the vessel (Silva et al., 2016),
𝑊 =1
2𝑉. 𝛽(𝑃𝑓𝑖𝑛𝑎𝑙
2 − 𝑃𝑖𝑛𝑖𝑡𝑖𝑎𝑙2) − 𝑃𝑓𝑖𝑛𝑎𝑙. 𝑉. 𝛼(𝑇𝑓𝑖𝑛𝑎𝑙 − 𝑇𝑖𝑛𝑖𝑡𝑖𝑎𝑙), (1)

204
𝜌. 𝐶𝑝.𝛿𝑇
𝛿𝑡= 𝑇. 𝛼𝑝.
𝛿𝑃
𝛿𝑡, (2)
where 𝛿𝑇
𝛿𝑡 and
𝛿𝑃
𝛿𝑡 are the variation of temperature and pressure over time respectively, V is the
volume of the cylinder in m3, P and T the pressure and the temperature in the vessel respectively,
β the compressibility (4.6E-10 Pa-1), α the volume expansivity (2.14E-4 K-1 or C-1) of the water
since the pressure transmitting fluid contains 95% of water.
The increases in pressure and temperature in the vessel are graphically shown in Figure 29.
The total energy used during the process corresponds to the energy involved during the come-up
time and can be therefore calculated by adding (1) and (2) after having collected the temperature
profile during each treatment. Results on energy consumption were expressed in kJ/L.
Figure 29. Temperature and pressure profile during processing at 400 MPa for 1 min used to determine
δT/δt and δP/δt required for the energy calculation
0
50
100
150
200
250
300
350
400
450
0
5
10
15
20
25
30
35
0 20 40 60 80 100 120 140
Pre
ssu
re (
MP
a)
Tem
per
atu
re (
°C)
Time (s)
Temperature (°C) Pressure (MPa)

205
2.10 Storage study
The shelf life study was performed only on selected mild conditions leading to at least 5 log
reduction of L. innocua. The main aim was to assess changes on physical characteristics and
mesophilic aerobic bacteria load in each sample during storage at 4°C for 28 days. After processing
juice blends with selected pressure and treatment time, they were stored for further analysis. Every
week juices were analyzed for pH, color, TSS, and mesophiles. Control samples (Unprocessed
juice) were also stored at 4°C and were analyzed every other day for 10 days. All the samples
were stored in the same pouches that were used to process, pouches had a water vapor transmission
rate of 6-7.5 g/m2.24 hr. and oxygen transmission rate of 50-70 cc/m2.24 hr.
2.11 Data Analysis
Data was processed using Microsoft excel 2016. Analysis of variance (ANOVA) between means
was carried out using SAS V. 9.2 (SAS Institute, Cary, NC, USA, 1999) at 5% level of
significance. Multivariate regression analysis was done using Minitab 16 (Minitab Inc. State
College, PA).
3. Results and Discussion
3.1 Inactivation of L. innocua
There was a significant impact of the pressure level, the pH of the product, and the processing time
on the inactivation of L. innocua. For the pH 4 blend, 300 MPa of pressure and 2 min of treatment
time were required to achieve more than 6 log reduction of L. innocua. For the same level of
inactivation, for pH 5, 400 MPa, 1 min was required and for pH 6, 400 MPa, 3 min was required.

206
Even after 5 minutes, the application of 200 MPa for the juices with pH 5 and 6 led to less than 2
log reduction and for the juice with pH 4 there was about 3 log reduction. In the case of treatment
at 400 MPa, Listeria count was below the detectable limit (7 log reduction) in the juice with pH 4
and 5 in one minute; but in the case of pH 6, three minutes were required to achieve the same level
of inactivation.
Figure 30. Inactivation of L. innocua in carrot-orange juice blends at 200 MPa, 300 MPa and 400 MPa
over 5 minutes
-4
-3
-2
-1
0
0 1 2 3 4 5
Log
(Nt/
N0)
Time (min)
200 MPa
pH4 pH 5 pH 6
-8
-6
-4
-2
0
0 1 2 3 4 5
Log
(Nt/
N0)
Time (min)
300 MPa
pH4 pH 5 pH 6
-8
-6
-4
-2
0
0 0.5 1 1.5 2 2.5 3
Log
(Nt/
N0)
Time (min)
400 MPa
pH4 pH 5 pH 6

207
According to the pressure-time combination applied to each blend to achieve at least 5 log
reduction, there was a synergistic interaction (p<0.05) between pressure and pH, pressure and time,
and pH and time. The results show that decreasing the pH reduces the pressure and/or the time of
treatment. Therefore, it minimizes energy consumption, as the energy required directly depends
on the level of pressure used.
The application of high pressure significantly inactivates L. innocua, as shown by this study
and a study performed by Evrendilek et al. (2011), who found that HPP performed at 600 MPa for
5 min leads to a reduction in L. innocua from 6 log CFU/mL to 1 log CFU/mL on ayran yogurt
(pH 4.2). HPP inactivates microorganisms by affecting protein structure, by changing internal pH
equilibrium (Balasubramaniam et al., 2015) and by creating pores in their membranes. Even
though HPP doesn’t affect covalent bonds, it affects weak bonds which can change the protein
conformation and may irreversibly damage the protein. Also, this change in conformation may
lead to decrease the rate of physiological reactions such as metabolism or replication reactions
(Sahu, 2014). According to Le Chatelier’s principle, the rise in pressure lead to a decrease in
volume. Bacterial cells contain vacuoles; when they are subjected to high pressure, lengthening of
the cell take place causing membrane’s deformation and formation of pores. Therefore, the longer
the treatment time is, the more bacterial cells are damaged and therefore the better the microbial
inactivation is.
A study performed by Conner et al. (1986) on cabbage juice shows that even if L.
monocytogenes can grow in a limited proportion and for a short time at low pH (pH<4.8), they
can’t survive for long period in such pH conditions and they can’t adapt to low pH. Therefore, low

208
pH could act as a hurdle in high pressure processing. According to the present study, combining
HPP and low pH results in a higher inactivation of L. innocua; even if the pH was reduced by 1
unit. High level of inactivation at low pH might be due to the formation of pores in the cell
membrane allowing the diffusion of protons and other acids from the environment to the
cytoplasm, which decreases the internal pH of the cell significantly. If the treatment time is long
enough, bacteria can’t recover from all these damages which lead to their death.
3.2 Multivariate Analysis
The effect of various factors on L. innocua inactivation was analyzed using multiple regression
method. The major factors involve are pressure, treatment time, and product pH. There was
significant effect of each factor on microbial inactivation. The main effect of pressure was highest
among three factors, the second was time and third pH (Table 24). There was interaction between
pressure-time, pH-pressure, and pH-time on the inactivation of this microorganism. The
interaction between pressure and pH had highest weight followed by pressure and time interaction.
Three-way interaction was also observed between all three factors.
Table 24. Main effect and interaction effect of each factor on L. innocua inactivation
Factors Total
Sensitivity
Main
Effect
pH
Interaction
Pressure
Interaction
Time
Interaction
pH 0.075 0.034 . 0.038 0.003
Pressure 0.882 0.814 0.038 . 0.031
Time 0.105 0.071 0.003 0.031 .
Multivariate regression relation was developed between all three factors to predict the inactivation
of L. innocua in the juice blend (Eq. 3):

209
𝐿𝑜𝑔 (𝑁0
𝑁𝑡) = −0.6 + 0.04 𝑝𝐻 + 0.03 𝑃 + 2.14 𝑡 − 0.003 𝑝𝐻. 𝑃 − 0.63 𝑝𝐻. 𝑡 − 0.006 𝑃. 𝑡 + 0.002 𝑝𝐻. 𝑃. 𝑡, (3)
where P is pressure in MPa and t is time in min.
Using this relation, processing parameters for HPP can also be approximately predicted
based on target level of Listeria inactivation in a juice with certain pH.
3.3 Energy consumption during processing
Total energy consumed during each process is presented in Table 25. The results include the
contribution in energy consumption during come up time. It was observed that the thermal energy
generated by the adiabatic compression during the come-up time contributes about 10% or more
on the total energy consumed by the system. Hence, some of the energy is converted into heat as
a result of pressure increase. As expected, the energy consumed in the process run at 300 MPa is
about 1.8 times lower than the others run at 400 MPa. Moreover, the energy consumed during
experiments set at 400 MPa for 1 min is fairly similar to the one consumed at 400 MPa for 3 min.
Table 25. Energy consumption in HPP at different pressure and processing time
Juice blends Pressure (MPa)
Holding
time (min)
Energy due to
Compression (kJ/L)
Total Energy
(kJ/L)
Carrot: Orange (1:6) 300 2 20.2 252.5
Carrot: Orange (1:1) 400 1 35.9 444.2
Carrot: Orange (6:1) 400 3 35.9 408.1

210
3.4 Quality evaluation
3.4.1 Color characteristics
All the CIELAB coordinates L*, a* and b* were measured before and after processing and then
analyzed to determine the Chroma and the Hue angle. Results are presented in Table 26. The
statistical analyses performed on the collected data show that the process doesn’t have any impact
on the lightness (L*), the chroma or the hue angle. The same trend was observed by Ferrari et al.
(2010), who studied the effect of HPP on pomegranate juice. They found no effect of HPP
performed at 400 MPa, 500 MPa and 600 MPa at 25°C for 5 min on the lightness furthermore, the
color difference obtained after each treatment was very low. This first indicates that HPP doesn’t
affect the overall color of each juice and secondly consumer could barely see a difference in the
color of an untreated sample and a treated one. The same observation was made by Bull et al.
(2010) who found no significant effect of HPP treatment carried out at 600 MPa for 1 min on the
color difference of Navel or Valencia orange. The main pigment responsible for the color of these
juices is carotenoid, this also entails that retention of color means retention of carotenoid.

211
Table 26. Color of juice before and after processing.
pH Sample L* Chroma Hue angle
(radius) ΔE
4 Control 38.98±1.11a 75.95±1.18a 1.05±0.02a
0.96±0.52 P1 38.91±0.55a 75.74±0.35a 1.05±0.02a
5 Control 25.16±1.52b 59.78±2.43b 0.81±0.02b
1.82±0.73 P2 24.28±1.23b 58.33±2.03b 0.80±0.02b
6 Control 10.81±0.65c 37.32±1.79c 0.52±0.01c
4.43±0.74 P3 12.99±0.34c 40.64±1.12c 0.57±0.00c
(Note : P1 = 300 MPa, 2 min ; P2 = 400 MPa, 1 min ; P3 = 400 MPa, 3 min)
3.4.2 Total carotenoid content
There was no significant difference (p>0.05) in ascorbic acid content between the untreated and
the processed sample (Table 27). These results are in line with the study conducted by Mclnerney
et al. (2007) who observed no significant impact of HPP either at 400 MPa or at 600 MPa for 2
min on carotenoids in carrots. Also, Butz et al. (2002), found no change in total carotenoid in
tomato after processing at 600 MPa at 25°C treatment for 60 min. This may be explained by the
fact that high pressure processing affects only weak bonds and not covalent bonds. As a small
molecule having a low molecular weight, carotenoids only feature covalent bonds, which may
explain why they are not affected by HPP. In addition, there is no statistical interaction between
the high pressure process and the pH in carotenoid degradation, which suggests that HPP has the
same impact on the carotenoid content regardless the pH of the product. The difference in
proportion of orange and carrot juice used to make up different juice blends with different pH was
significantly (p<0.05) different in the total carotenoid content. In fact, this study shows that an
orange-carrot blend at pH 6 contains two-fold more than the amount of carotenoids than in an

212
orange-carrot mix at pH 4 which appears consistent since carrot juice contains more carotenoids
than orange juice.
3.4.3 Ascorbic acid
Results obtained on ascorbic acid content are shown in the Table 27. As expected, these results
highlight a significant difference (p<0.05) in ascorbic acid content between samples at pH 4, 5 and
6. Since the juice blends were obtained by mixing orange and carrot juice in different proportion
to have blends with pH 4, 5 or 6, therefore sample at pH 4 contains more orange juice than sample
at pH 6. Orange juice contains more ascorbic acid than carrot juice; in the present study, higher
ascorbic acid content was found in the blend with pH 4 than in pH 6. These results show that for
each pH, there is no significant difference (p>0.05) between the control and the treated sample
which suggest that HPP doesn’t impact the ascorbic acid content of the sample. HPP has proven
to damage only weak bonds and not covalent bonds. Ascorbic acid as a small component featuring
only covalent bonds, hence it is not affected by HPP. In addition, samples were treated using mild
conditions (mild pressure for a short time, 1 to 3 minutes) which limits ascorbic acid oxidation.
These results are in line with those suggested by Bull et al. (2004). Their study on Navel and
Valencia orange juice treated by HPP at 600 MPa, 20°C for 1 min shows no significant difference
in both orange juice type between the control and the processed sample. The results below show
95%, 100% and 88% retention on ascorbic acid content at pH 4, 5 and 6 respectively. In line with
the previous results, Garcia et al. (2001), reported 99.6% of Vitamin C retention in orange (40
parts)-lemon (5 parts)-carrot (20 parts) and water (35 parts) mix after treatment at 500 MPa for 5
minutes. The difference in ascorbic acid retention in different blends might be due to the stability
of ascorbic acid at low pH than at high pH. Nevertheless, it can be noticed a slight but not
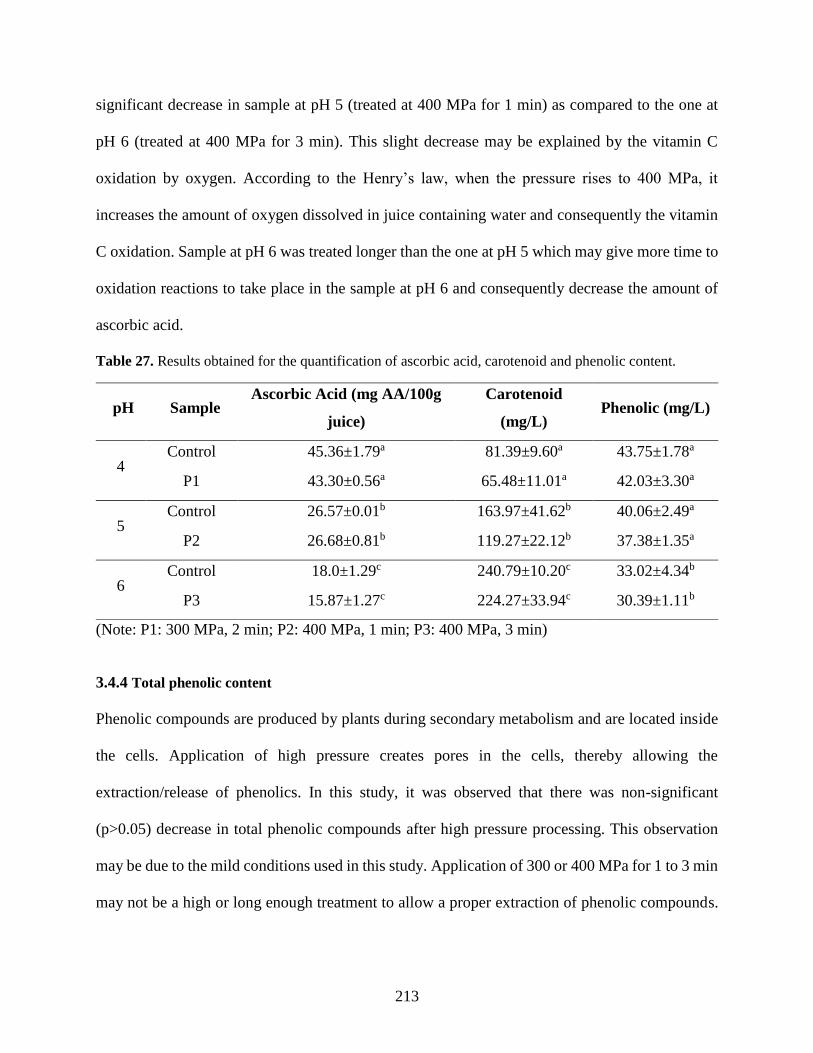
213
significant decrease in sample at pH 5 (treated at 400 MPa for 1 min) as compared to the one at
pH 6 (treated at 400 MPa for 3 min). This slight decrease may be explained by the vitamin C
oxidation by oxygen. According to the Henry’s law, when the pressure rises to 400 MPa, it
increases the amount of oxygen dissolved in juice containing water and consequently the vitamin
C oxidation. Sample at pH 6 was treated longer than the one at pH 5 which may give more time to
oxidation reactions to take place in the sample at pH 6 and consequently decrease the amount of
ascorbic acid.
Table 27. Results obtained for the quantification of ascorbic acid, carotenoid and phenolic content.
(Note: P1: 300 MPa, 2 min; P2: 400 MPa, 1 min; P3: 400 MPa, 3 min)
3.4.4 Total phenolic content
Phenolic compounds are produced by plants during secondary metabolism and are located inside
the cells. Application of high pressure creates pores in the cells, thereby allowing the
extraction/release of phenolics. In this study, it was observed that there was non-significant
(p>0.05) decrease in total phenolic compounds after high pressure processing. This observation
may be due to the mild conditions used in this study. Application of 300 or 400 MPa for 1 to 3 min
may not be a high or long enough treatment to allow a proper extraction of phenolic compounds.
pH Sample Ascorbic Acid (mg AA/100g
juice)
Carotenoid
(mg/L) Phenolic (mg/L)
4 Control 45.36±1.79a 81.39±9.60a 43.75±1.78a
P1 43.30±0.56a 65.48±11.01a 42.03±3.30a
5 Control 26.57±0.01b 163.97±41.62b 40.06±2.49a
P2 26.68±0.81b 119.27±22.12b 37.38±1.35a
6 Control 18.0±1.29c 240.79±10.20c 33.02±4.34b
P3 15.87±1.27c 224.27±33.94c 30.39±1.11b

214
The number or the size of the pores generated by HPP treatments may be too small to allow
phenolic compound to pass through the pores. These results are in line with the ones described by
Patras et al. (2009) who observed a non-significant increase in the total phenolic compound in both
strawberry and blackberry purée after HP treatment at 400 MPa for 15 min. Also, a study
performed by Landl et al. (2010) observed non-significant losses of phenolic compound in Granny
Smith apple purée at 400 MPa for 5 min at 20°C.
Besides, there was no statistical interaction between pH and the process which suggests
that there is no interference between these two parameters on the phenolic content of each sample.
This study also reveals a significant change in phenolic content between samples at pH 4-5 and
pH 6. The former ones containing more phenolic component than the later one. This may be
explained by the fact that orange juice may contain more phenolic compounds than carrot juice.
3.5 Quality changes during storage
3.5.1 Microbial growth during storage
As shown in Figure 31, initial aerobic bacterial load of unprocessed samples is about 4 log, and at
least 2 log higher than the corresponding processed sample. A statistical analysis on control sample
shows that there is a significant effect (p<0.05) of the pH on the inactivation of aerobic mesophiles
by HPP. The count obtained as initial aerobic bacteria content for the sample at pH 6 is in line with
the values quoted by Park et al. (2002); the authors stated a value of 105 to 106 CFU/mL of initial
total aerobes in raw carrot. As expected and shown by the results, the higher the pH, the higher the
aerobic bacteria load. Hence, among control sample, the one at pH 4 has the least aerobic bacteria
content. Most of aerobic bacteria have their optimum pH between 6.5 and 7.5. Therefore, high acid

215
food (pH<4.6) doesn’t favor bacteria growth compare to low acid food (pH>4.6). Besides, it can
be observed for the control samples that the aerobic bacteria load increases significantly over time.
For instance, the microbial load in blend with pH 4 (control) had one log rise in 8 days. In addition,
control samples at pH 5 and 6 were found to be spoiled after 10 days of storage at 4°C and were
discarded.
However, results obtained on processed sample are completely different. Processing
condition for blend with pH 4 was 300 MPa, 2 min and for pH 5 was 400 MPa, 1 min and lastly
for pH 6 was 400 MPa, 3 min. Total aerobic mesophiles count in all the blends after processing
was around 1 log. A statistical analysis carried out on processed sample shows that there is no
significant effect of the pH on the microbial load after processing (p>0.05) which may mean that
each selected process suits well to each product category based on their pH value. There was no
significant increase in mesophiles during the first 14 days of shelf-life, but the microbial load
increases significantly (p<0.05) in 28 days from about 10 CFU/mL to less than 100 CFU/mL, but
this is still under the maximum tolerable limit (2 log) of aerobic mesophiles in juice. Hence, high
pressure treatment allowed each blend to stay acceptable in terms of microbial load during 28
days’ storage period.

216
Figure 31. The growth of total aerobic mesophilic bacteria in the control (un-processed) and high
pressure treated juice blends during storage at 4°C
3.5.2 Changes in pH and TSS during storage
In the present study, it was observed that HPP doesn’t significantly affect pH of the product.
However, some studies show that HPP causes a decrease in pH. Since this process affects weak
bonds, it can cause dissociation of water molecules. It may also affect bonds between acids and
their associated protons leading to release protons in the solution and therefore reducing the pH.
Heremans (1995) found 0.2 units of pH drop per increase of 100 MPa in apple juice. However, in
the present study, the decrease was not significant. These results are in line with the ones found by
Bull et al. (2004), on Valencia and Navel Orange juice who didn’t find any significant decrease in
pH after treatment at 600 MPa for 1 min (initial pH of 4.28 in fresh Valencia orange juice and 4.23
after high pressure treatment). Likewise, no significant effect of high pressure treatment performed
at 600 MPa for 10 min on pH was found by Park et al. (2002) in their study on carrot juice.
0
1
2
3
4
5
6
7
0 5 10 15 20 25 30
Log
(CFU
/mL)
Days
Carrot+Orange (1:6) (Control) Carrot+Orange (1:1) (Control) Carrot:Orange (6:1) (Control)
Carrot:Orange (1:6) (HPP) Carrot:Orange (1:1) (HPP) Carrot:Orange (6:1) (HPP)

217
During storage, the pH of control sample decreases by approximately 1 unit for the blend
with pH 5 and 6 and about 0.70 unit for the blend with pH 4. Blend with pH 5 and 6 followed the
same trend: there was no significant difference in pH during the first 2 days and then there was a
significant decrease in pH between day 2 and day 4 (Figure 32). This decrease in pH could be due
to microbial growth according to Rivas et al. (2005). But there was no significant growth of
bacteria between day 2 and day 4. Therefore, acidification due to microbial growth might not be
the only cause of decrease in pH. This decrease in pH may be mostly due to chemical reactions
happening in the juice like enzymatic reactions leading to a decrease in pH. For instance, due to
enzymatic reactions in aqueous phase, the carboxylic acid function of galacturonic acid present in
the pectin can release protons to water molecules leading to the formation of H3O+ and therefore
reducing the pH. Such enzymatic reactions producing acids may explain the significant reduction
of pH in juice blends during storage.
For the processed sample, first, the pH for the sample at pH 6 remains constant during the
first week of storage whereas it remains approximately stable for 2 weeks of storage for the other
two blends (pH 4 and 5). After that, there was a significant decrease in pH until 28 days of storage.
For the sample at pH 4 there was a decrease of 13%, for pH 5 there was decrease of 18% and for
pH 6, there was 12%. The pH reduction observed may be due to activities of remaining enzymes
leading to the production of acids. The microbial growth, which starts slightly increasing more
during the third week of storage than during the first 2 weeks may also be responsible in a fair
measure of the decrease in pH.
TSS is an important parameter to take into account when processing fruit and vegetable
juice. Total soluble solid, expressed in °Bx, measures the total amount of sugar, organic acids and

218
other soluble molecules of a product. Therefore, TSS is one of the parameter which allows us to
assess the juice quality and stability when performing a shelf-life study. First of all, each process
doesn’t seem to impact the TSS which remains almost the same for the control and the processed
sample. For all control samples, it was observed that a slight but not significant (p>0.05) increase
in their total soluble solid content in 10 days. For all processed samples, it was observed that the
TSS stays constant during the 28 days of shelf-life. Therefore, the content of sugar, organic acids
and other molecules included in the TSS measurement has been quite stable in these products for
28 days. These results are in line with the ones described by Varela-Santos et al. (2011), who
reported a stable TSS value on pomegranate juice during 15 days of storage at 4°C after having
been processed at 350, 450 and 650 MPa for 30, 90 and 150 sec.
Each juice blend (pH 4, 5, and 6) had a different °Brix value and they were significantly
different (p<0.05), the higher one being for the blend with pH 4. This may be explained by the
high amount of organic acid in orange juice, besides that orange juice is comparatively sweeter
than carrot juice, hence had higher TSS.

219
Figure 32. Change in pH and TSS of the juice blends (Control and Processed) during storage at 4°C for
28 days.
3.5.3 Changes in color of juice during storage
As to the lightness, a statistical analysis shows a significant decrease only for the control sample
at pH 4 and for the treated sample at pH 6. Nevertheless, the decrease in the lightness value for the
control sample at pH 4 is very slight. Otherwise, other samples can feature a slight but not
significant decrease in their lightness. These results show that the lightness is “naturally” stable
for 10 days, although the lightness tends to decrease more in the sample at pH 4 than for the others.
The treatments performed on the sample at pH 4 and 5 seem to preserve the lightness over 28 days.
2
3
4
5
6
7
0 5 10 15 20 25 30
pH
Days
pH 4 pH 5 pH 6 pH 4 (Control) pH 5 (Control) pH 6 (Control)
6
8
10
12
14
16
0 5 10 15 20 25 30
TSS
(°B
x)
Days
pH 4 pH 5 pH 6 pH 4 (Control) pH 5 (Control) pH 6 (Control)

220
Nevertheless, the treatment carried out on the sample at pH 6 may not allow maintaining the
lightness constant because of the significant decrease that appears during the first 14 days of
treatment.
The a* value indicates the degree of red/green color in our sample. The control samples at
pH 4 and 5 features a constant a* value over the 10 days of storage at 4°C. For the sample at pH
6, the a* value increases significantly during the storage. This sample was completely spoiled after
10 days of storage at 4°C and featured a phase separation. The aggregation of some components
such as carotenoids may have occurred in this sample leading to a higher a* value despite having
been manually homogenized before the analysis. Also, for all the treated samples, the statistical
analysis shows a significant decrease during the storage period, the samples became less and less
red. The treated sample at pH 4 undergoes a significant decrease in its a* value during the first
week of storage and then remain constant. The treated sample at pH 5 remains stable for 3 weeks
before decreasing significantly. The a* value of the sample at pH 6 decreases gradually over the
28 days of shelf-life. The decrease in the red intensity may be due to the oxidation of carotenoids
since they are the main components responsible for the red color in carrot juice. Chen et al. (1996)
reported a decrease in α- and β- carotene after 3 months of storage at 4°C in the dark. They acidified
carrot juice to pH 4 and treated them at 105°C for 30 sec. Vitamin C as an antioxidant may prevent
carotenoids from being oxidized and so, help to maintain the fruit juice color over time. The
difference in the period of storage: 10 days for the control samples and 28 days for the treated
sample may have explained why there was not any difference in the a* value of the control sample
at pH 4 and 5. Besides, carotenoid oxidation depends on many factors such as the time of storage
and the antioxidant component amount in the sample. The b* value remains constant for almost

221
all samples which meant that there was no change in the yellow/blue color of the product. Only
the treated sample at pH 6 features a decrease in b* value.
The color difference ΔE for control samples remain approximately constant over 10 days.
With respect to the treated samples, pH 4 and pH 5 samples have a constant ΔE over 28 days of
storage, which means that the color difference remains constant during this period. Bull et al.
(2004) also observed a similar increase in the color difference on Navel and Valencia orange after
treatment at 600 MPa for 1 min, and during storage at 4°C for 4 weeks. Nevertheless, treated
sample at pH 6 features a significant change in the color after 21 days of storage, which may be
explained by the significant change in its L*, a* value and b* value which might be due to the
oxidation of carotenoids which has a direct impact on the color. In fact, according to Baranska et
al. (2016), the number of conjugated bonds presents in carotenoids determines its color. The more
the molecule features double bonds, the more intense and the reddish the color. According to
Rodriguez-Amaya et al. (2015), oxidation is the main degradation process occurring during
storage. Since oxidation reduces the number of conjugated bond in carotenoids, it leads to a
decrease in color intensity. Besides, oxidation of carotenoids depends on the amount of antioxidant
compound presents in the food matrix. This may be one of the reasons why there was not any
significant difference in the ΔE of samples at pH 4 and pH 5. In fact, as a powerful antioxidant,
the ascorbic acid presents in orange juice may protect carotenoids from degradation. Also,
carotenoid is a fairly stable component which may explain why there was no any difference in
terms of color in any of the control samples. Actually, the 10 days of storage may not be long
enough to access a significant difference in their color.

222
0
5
10
15
20
25
30
35
40
45
0 5 10 15 20 25 30
L*
Days
pH 4 pH 5 pH 6 pH 4 (Control) pH 5 (Control) pH 6 (Control)
20
25
30
35
40
45
0 5 10 15 20 25 30
a*
Days
pH 4 ph 5 pH 6 pH 4 (Control) pH 5 (Control) pH 6 (Control)

223
Figure 33. Change in color characteristic of the juice blends during storage at 4°C for 28 days.
Conclusions
The results of this study show that HPP can be used to safely process selected carrot-orange juice
blends without sacrificing quality attributes. The findings could be used as a baseline for the
commercial pasteurization of juice blends with different pH by HPP. Lower pH favors the
inactivation of microorganisms by HPP; it was found that there was less energy required to achieve
same level of inactivation for a blend with pH 4 as compared to the blend with pH 5, and 6. For
instance, 300 MPa, 2 min was enough to achieve a 5 log reduction for the blend at pH 4, whereas,
400 MPa, 1 min was required for the sample at pH 5 and 400 MPa, 3 min for the one at pH 6.
Therefore, the sample at pH 4 consumed less energy (252.5 kJ/L) than the other two samples.
Besides that, each treatment was able to retain the ascorbic acid and carotenoid content as well as
the physical characteristics (color, pH, and TSS). The storage study performed for 28 days at 4°C
after processing following the previous conditions, reveals the effectiveness of each treatment to
maintain a low level of aerobic mesophilic bacteria in each sample (less than 100 CFU/mL).
0
10
20
30
40
50
60
70
80
0 5 10 15 20 25 30
b*
Days
pH 4 pH 5 pH 6 pH 4 (Control) pH 5 (Control) pH 6 (Control)

224
Furthermore, during storage period, no color difference was observed for the samples at pH 4 and
5 but there was a slight change in the color for the sample at pH 6 after 21 days of storage. Hence
it can be concluded that HPP is a promising alternative technology to process juice blends with
different pH. Based on the pH of the juice, mild processing conditions for HPP can be determined;
in addition to that, energy required during processing and shelf life of the HP processed juice can
also be estimated.

225
References
Arena, E., Fallico, B., & Maccarone, E. (2001). Thermal damage in blood orange juice: kinetics
of 5‐hydroxymethyl‐2‐furancarboxaldehyde formation. International Journal of Food
Science and Technology, 36(2), 145-151.
Balasubramaniam, V. M., Martínez-Monteagudo, S. I., & Gupta, R. (2015). Principles and
application of high pressure–based technologies in the food industry. Annual Review of
Food Science and Technology, 6, 435-462.
Baranska, M., & Kaczor, A. (2016). Carotenoids: nutrition, analysis and technology. John Wiley
& Sons.
Bull, M. K., Zerdin, K., Howe, E., Goicoechea, D., Paramanandhan, P., Stockman, R., ... &
Stewart, C. M. (2004). The effect of high pressure processing on the microbial, physical
and chemical properties of Valencia and Navel orange juice. Innovative Food Science and
Emerging Technologies, 5(2), 135-149.
Butz, P., Edenharder, R., Garcı́a, A. F., Fister, H., Merkel, C., & Tauscher, B. (2002). Changes in
functional properties of vegetables induced by high pressure treatment. Food Research
International, 35(2), 295-300.
Chen, H. E., Peng, H. Y., & Chen, B. H. (1996). Stability of carotenoids and vitamin A during
storage of carrot juice. Food Chemistry, 57(4), 497-503.
Chen, Y., Yu, L. J., & Rupasinghe, H. P. (2013). Effect of thermal and non‐thermal pasteurisation
on the microbial inactivation and phenolic degradation in fruit juice: a mini‐
review. Journal of the Science of Food and Agriculture, 93(5), 981-986.

226
Ciancaglinia, P., Santos, H. L., Daghastanli, K.R.P., Thedei, Gerald Jr. (2001). Using a classical
method of vitamin C quantification as a tool for discussion of its role in the body.
Biochemistry and Molecular Biology Education. 29(3), 110-114
Conner, D. E., Brackett, R. E., & Beuchat, L. R. (1986). Effect of temperature, sodium chloride,
and pH on growth of Listeria monocytogenes in cabbage juice. Applied and Environmental
Microbiology, 52(1), 59-63.
Derradji-Benmeziane, F., Djamai, R., & Cadot, Y. (2014). Antioxidant capacity, total phenolic,
carotenoid, and vitamin C contents of five table grape varieties from Algeria and their
correlations. OENO One, 48(2), 153-162.
Evrendilek, G. A., & Balasubramaniam, V. M. (2011). Inactivation of Listeria monocytogenes and
Listeria innocua in yogurt drink applying combination of high pressure processing and mint
essential oils. Food Control, 22(8), 1435-1441.
Fernández García, A., Butz, P., Bognàr, A., & Tauscher, B. (2001). Antioxidative capacity,
nutrient content and sensory quality of orange juice and an orange-lemon-carrot juice
product after high pressure treatment and storage in different packaging. European Food
Research and Technology, 213(4), 290-296.
Ferrari, G., Maresca, P., & Ciccarone, R. (2010). The application of high hydrostatic pressure for
the stabilization of functional foods: Pomegranate juice. Journal of Food
Engineering, 100(2), 245-253.
Heremans, K. (1995) High pressure effects on biomolecules. In High Pressure Processing of Foods
ed. Ledward, D. A., Johnston, D. E., Earnshaw, R. G. and Hasting, A. P. M. pp. 81-97.
Nottingham: Nottingham University Press

227
Kabasakalis, V., Siopidou, D., & Moshatou, E. (2000). Ascorbic acid content of commercial fruit
juices and its rate of loss upon storage. Food Chemistry, 70(3), 325-328.
Landl, A., Abadias, M., Sárraga, C., Viñas, I., & Picouet, P. A. (2010). Effect of high pressure
processing on the quality of acidified Granny Smith apple purée product. Innovative Food
Science and Emerging Technologies, 11(4), 557-564.
Liao, H., Sun, Y., Ni, Y., Liao, X., Hu, X., Wu, J., & Chen, F. (2007). The effect of enzymatic
mash treatment, pressing, centrifugation, homogenization, deaeration, sterilization and
storage on carrot juice. Journal of Food Process Engineering, 30(4), 421-435.
McInerney, J. K., Seccafien, C. A., Stewart, C. M., & Bird, A. R. (2007). Effects of high pressure
processing on antioxidant activity, and total carotenoid content and availability, in
vegetables. Innovative Food Science and Emerging Technologies, 8(4), 543-548.
Oey, I., Van der Plancken, I., Van Loey, A., & Hendrickx, M. (2008). Does high pressure
processing influence nutritional aspects of plant based food systems?. Trends in Food
Science and Technology, 19(6), 300-308.
Park, S. J., Lee, J. I., & Park, J. (2002). Effects of a Combined Process of High‐Pressure Carbon
Dioxide and High Hydrostatic Pressure on the Quality of Carrot Juice. Journal of Food
Science, 67(5), 1827-1834.
Patras, A., Brunton, N. P., Da Pieve, S., & Butler, F. (2009). Impact of high pressure processing
on total antioxidant activity, phenolic, ascorbic acid, anthocyanin content and colour of
strawberry and blackberry purées. Innovative Food Science and Emerging
Technologies, 10(3), 308-313.

228
Polydera, A. C., Stoforos, N. G., & Taoukis, P. S. (2003). Comparative shelf life study and vitamin
C loss kinetics in pasteurised and high pressure processed reconstituted orange
juice. Journal of Food Engineering, 60(1), 21-29.
Rodriguez-Amaya, D. (2015). Food carotenoids: chemistry, biology and technology. John Wiley
& Sons.
Sahu, J. K. (2014). Introduction to advanced food process engineering. CRC Press.
Silva, F. V. (2016). Modeling the inactivation of psychrotrophic Bacillus cereus spores in beef
slurry by 600MPa HPP combined with 38–70° C: Comparing with thermal processing and
estimating the energy requirements. Food and Bioproducts Processing, 99, 179-187.
Varela-Santos, E., Ochoa-Martinez, A., Tabilo-Munizaga, G., Reyes, J. E., Pérez-Won, M.,
Briones-Labarca, V., & Morales-Castro, J. (2012). Effect of high hydrostatic pressure
(HHP) processing on physicochemical properties, bioactive compounds and shelf-life of
pomegranate juice. Innovative Food Science and Emerging Technologies, 13, 13-22.

229
CHAPTER SEVEN
PROCESSING OF CARROT-ORANGE JUICE BLEND BY PULSED ELECTRIC
FIELDS AND NISIN AT VARIOUS TEMPERATURES
Abstract
In this study, a carrot-orange juice blend (one-part carrot and six-part orange, pH 4) was processed
with pulsed electric fields under two different conditions: low electric field intensity-high
frequency (LEHF: 15 kV/cm, 979 Hz) and high electric field intensity-low frequency (HELF: 30
kV/cm, 235 Hz). The treatments combined PEF with mild heat (20, 35, and 50°C) and nisin (0,
25, and 50 ppm) to study the inactivation of L. innocua. The overall goal of this study was to
investigate and compare two different processing approaches for the inactivation of L. innocua
and total aerobic mesophilic bacteria in a carrot-orange juice blend, and to explore the resulting
changes in physicochemical characteristics of the juice after processing.
The high field-low frequency combination was found to be more efficient on the
inactivation of L. innocua. There was about a 4 log reduction of L. innocua by HELF, while LEHF
rendered less than a 3 log reduction at room temperature. When the temperature was raised to
35°C, there was about a 5 log reduction, and at 50°C there was complete inactivation (>7 log). The
combination of 50 ppm nisin and HELF at 20°C resulted in a 5 log reduction of L. innocua, while
a temperature of 35°C was required to achieve the same level of inactivation using the same
concentration of nisin and LEHF.
A non-significant increase in total carotenoids of juice was observed for both processing
approaches at all selected temperatures. There was a significant decrease (p<0.05) in ascorbic acid

230
in treated samples relative to untreated control, but no difference was observed between the
processing conditions.
The study shows that a high electric field-low frequency combination is more effective for
microbial inactivation than a low frequency-high electric field combination at the same level of
energy input. Synergism in microbial inactivation was observed when PEF treatment was
combined with nisin, heat, or both.
1. Introduction
Pulsed electric fields (PEF) is a nonthermal technology that has shown promising results in the
processing of liquid and semi-liquid food. In many cases, PEF is able to inactivate microorganisms
without significantly affecting heat-sensitive bioactive compounds. PEF processing systems are
composed of a high-power pulse generator, a treatment chamber with electrodes, a pump, and an
oscilloscope. PEF systems apply short pulses of electricity, with a discharge of electrons over only
a few microseconds. These short pulses inactivate microorganisms with only minor effects on food
quality attributes. The electric fields generate a voltage difference across the microbial cell
membrane, creating a very intense force promoting the formation of pores due to electrical
breakdown. These pores allow the passage of essential cell components associated with its
metabolism, and thus promotes the inactivation of the microorganisms. The electric pulses are also
responsible for modifying intracellular enzymes and detaching the cytoplasm from the membrane,
two additional factors which also significantly contribute to microbial inactivation.
PEF systems involve multiple variables such as electric field intensity, frequency, flow
rate, pulse width; these factors all have effects on microbial inactivation. Two commonly used

231
types of thermal process protocol are high temperature short time (HTST) and low temperature
long time (LTLT) processing. Studies have shown that although both processes are efficient in
microbial inactivation, HTST allows greater nutrient retention. Along the same lines as HTST and
LTHT, this study compares two different PEF approaches: high electric field-low frequency
(HELF, 30 kV/cm, 235 Hz) and low electric field-high frequency (LEHF, 15 kV/cm, 979 Hz).
Electric field intensity (low or high) is the strength of the field generated due to an applied voltage
between two electrodes. Pulse frequency directly correlates with the total number of pulses and
treatment time.
The objective of this study was to compare two different PEF processing approaches
(HELF and LEHF) in combination with mild temperatures (20, 35, and 50°C), and nisin at two
concentrations (25 and 50 ppm). The comparisons were made on the basis of Listeria innocua
inactivation, as well as retention of physicochemical characteristics and bioactive compounds.
2. Materials and Methods
2.1 Sample preparation
Commercially available pre-pasteurized carrot juice (Bolthouse Farms, Bakersfield, CA) and
orange juice (Simply Orange Juice Company, Apopka, FL) were purchased from a local
supermarket. The pre-pasteurized juice was used for microbiological testing primarily to avoid
interactions between inoculated microorganisms and natural microflora. Nisin-A (Handary S.A,
Brussels, Belgium) was added to the juice in the concentrations of 0, 25, and 50 ppm to study
possible synergism between PEF and nisin, as well as between PEF, nisin, and temperature. For
subsequent testing to evaluate quality, fresh carrot-orange juice was prepared in the lab using a

232
domestic juice extractor where the ingredients were purchased from a local supermarket. Fresh
juice was used in this phase to evaluate the effect of the selected process on the quality attributes
where the fresh juice blend had a pH of 4.02 and TSS of 11.10°Brix.
2.2 Culture preparation and inoculation
A freeze-dried culture of Listeria innocua (ATCC 8456TM) was purchased from American Type
Culture Collection. The dried culture was grown in tryptic soy broth with 0.6% yeast extract
(TSBYE) (Becton Dickinson, Sparks, MD, USA) at 37°C, agitating at 225 rpm in a water bath
shaker. Absorbance was measured every hour at 560 nm. Cells were harvested in the early
stationary phase, mixed with sterile 20% glycerol, and stored at -18°C. During experiments, frozen
culture was activated in TSBYE and inoculated in the juice so as to have an initial load of around
7 log.
2.3 PEF processing
A PEF system designed by Diversified Technologies Inc. (DTI, Bedford, MA, USA) was used in
this study. Two different processing conditions were selected to investigate and compare the effect
of LEHF and HELF on the inactivation of microorganisms, analogous to two conventional thermal
pasteurization methods, HTST and LTHT. The selection of processing conditions (Table 28) was
based on the electrical conductivity of the product (4.2 mS/cm) and arcing by the system during
processing. Both conditions had a power input of 1 kW, and the product inlet temperature during
processing was set to 20, 35, and 50°C. For LEHF, the electric field intensity was 15 kV/cm, and
the frequency was 979 Hz, corresponding to 75 pulses; for HELF, the electric field intensity was
30 kV/cm, and the frequency was 235 Hz, corresponding to 18 pulses. The flow rate was 400

233
mL/min, with a pulse width of 2 µs in both processes. All treatments were conducted at three
different product inlet temperatures: 20, 35, and 50°C, and the inlet temperature of the juice was
adjusted using a heat exchanger (Microtherm temperature control system Chromalox CMX-250
12C, Chromalox, Inc., Edinboro, PA, USA) There was around a 10 and 11°C rise in temperature
after LEHF and HELF, respectively.
Table 28. Processing parameters for PEF
Processing parameters
Flow rate (mL/min) 400
Electric Field Intensity (kV/cm) 15 and 30
Voltage (kV) 9.8 and 19.5
Treatment time (μs) 36 and 150
Frequency (Hz) 235 and 979
Pulse width (μs) 2
Temperatures (°C) 20, 35, and 50
Nisin concentration (ppm) 0, 25, and 50
2.4 Analysis of survivors
After processing, treated juice was collected in sterile sealable pouches. One mL of the sample
was serially diluted in 0.1% sterile peptone water. Pour plating was done in tryptic soy agar with

234
0.6% yeast extract (Difco, Becton, Dickinson and Co., Sparks, MD). The plates were incubated
for 24 hours at 37 °C, and the colonies were counted manually and expressed as CFU/mL.
2.5 Quality evaluation
2.5.1 Total aerobic mesophiles
To quantify total aerobic mesophilic bacteria in fresh and processed juice, serial dilutions of the
juice were made with 0.1% peptone water. Samples were pour-plated using Plate Count Agar
(Difco, Becton, Dickinson and Co., Sparks, MD) and incubated at 37°C for 48 hours; mesophiles
were counted manually and expressed as log (CFU/mL).
2.5.2 pH, TSS, and color
The pH of the juices was measured directly using a pH meter (Orion 4-star, Thermo Fisher
Scientific, Waltham, MA, USA) at 21ºC. Color parameters (Lightness, L*; redness, a*; and
yellowness, b*) of the juices were measured in a cuvette using a colorimeter (Konica Minolta,
CM-5, New Jersey, USA). The total soluble solid (TSS) content of the juice was determined using
a hand-held refractometer (Atago No. 480, Atago Inc. Tokyo, Japan) at 21°C.
2.5.3 Total carotenoid content
The total carotenoid content of juices was analyzed using the method described by Liao et al.
(2007). In brief, 25 mL of juice was mixed with 80 mL of a hexane/acetone mixture (1:1, v/v) in
a separating funnel. The organic phase was separated from the aqueous phase and collected and
its absorbance was measured at 450 nm using a spectrophotometer (Spectronic 20 Genesys,
Spectronic Instruments Inc., Rochester, NY, USA). The total carotenoid content was determined

235
using the standard curve of β-carotene, and the results were expressed as mg β-carotene per liter
of sample.
2.5.4 Ascorbic acid
The amount of ascorbic acid in fresh and processed juices was determined by a redox titration
method using iodine and starch indicator according to the method described by Ciancaglini et al.
(2001) with some modifications. A juice sample (20 mL) was pipetted into a 250-mL conical flask
and 150 mL of distilled water and 1 mL of starch indicator were added to the flask. The sample
solution was titrated with a 0.005 mol/L iodine solution until formation of the first permanent
green-black color was observed.
2.6 Energy calculations
The energy input for each process was determined using the fundamental relation between power,
voltage, and current (Eq. 1)
𝑃 = 𝑉. 𝐼. 𝑥
𝑡 (1)
Where P is energy input (kW), V is the input voltage (kV), I is the current intensity (amp), x is the
pulse width (μs), and t is the treatment time (μs).
2.7 Data analysis
All data were recorded and analyzed using Microsoft Excel 2016. Analysis of variance (ANOVA)
between different processes was studied using Minitab (Minitab Inc. State College, PA). A p-value
of 0.05 was chosen as the limit for significance.

236
3. Results and discussion
3.1 Rise in temperature during processing
There was a rise of about 10°C in LEHF, and about 11°C increase for HELF (Table 29). The
increase in temperature of the product during PEF processing is mainly due to the Joule effect
(Buckow et al., 2013). This increase in temperature can have advantages, as it can act together
with PEF to facilitate inactivation of microorganisms, but sometimes it is undesirable, as in the
case of heat-sensitive products. For processing heat-sensitive products, the temperature can be
controlled using a heat exchanger between two sets of electrodes, with immediate cooling of the
product after processing. The rise in temperature in PEF processing depends on the electrical
conductivity of the product being processed; in general, higher electrical conductivity leads to a
greater rise in temperature. As the electrical conductivity of the product also depends on
temperature, its electrical conductivity increases during processing as the temperature rises, and in
turn the current increases. This is not always desirable, as the system does not work when electric
current exceeds a limit. Hence, the proper balance between temperature rise and other treatment
factors needs to be considered.
Table 29. Temperature rise during pulsed electric field processing of carrot-orange juice blends
Process Initial temperature (°C) Final temperature (°C) ΔT (°C)
PI+20°C 20.4±1.7 30.7±3.5 10.2
PII+20°C 20.8±1.4 32.1±1.3 11.3
PI+35°C 35.2±0.4 45.5±0.5 10.3

237
PII+35°C 35.0±0.1 46.4±0.4 11.3
PI+50°C 50.2±0.6 61.1±1.1 10.9
PII+50°C 50.6±1.1 62.2±0.7 11.6
(PI: LEHF; PII: HELF)
3.2 Combined effect of PEF and heat
The application of LEHF or HELF significantly reduced (p<0.05) the count of L. innocua in the
carrot-orange juice blend. At room temperature (20°C), there was around 3 log reduction after
treatment with LEHF and approximately 4 log reduction after treatment with HELF combinations
(Figure 34). The high field-low frequency combination was found to be slightly more efficient for
inactivation of L. innocua. Results from the present study are in line with previous findings;
Mosqueda-Melgar et al. (2007) observed 3 log reductions of L. innocua at neutral pH using electric
field intensities between 30 and 50 kV/cm and 100 pulses. The present study was carried out with
a lower number of pulses than that study, but due to the acidity of carrot-orange juice (pH 4), the
level of inactivation was equivalent.
From the present study, it can be understood that electric field intensity plays a greater role
than pulse frequency in microbial inactivation. Iu et al. (2001) observed that when electric field
intensity was increased from 60 to 80 kV/cm, there was an improvement in microbial reduction
from 0.1 to 1 log, but changing the number of pulses had no significant effect on microbial
reduction. In contrast, Aronsson et al. (2001) found that not only EFI but also pulse duration and
the number of pulses had significant effects on the level of inactivation of gram-positive and gram-
negative bacteria. It is worth noting that the number of pulses is directly correlated with frequency,

238
i.e. as frequency increases, more pulses will be applied; hence, in PEF processing more weight has
to be given to electric field intensity (EFI) than to any other variable. In other words, EFI must be
used at the maximum possible level that the system allows, while keeping frequency, treatment
time, and number of pulses at an optimum level.
Temperature has been shown to have a critical effect on PEF processing with and without
additional hurdles such as antimicrobials (Heinz et al., 2003; Sepulveda et al., 2005; Siemer et al.,
2014). There was a significant difference (p<0.05) in the survivor fraction between the three
temperatures, and between the two different processing approaches. A greater reduction in counts
was observed when the temperature of juice was increased from 20 to 35°C. HELF provided a
3.96 log reduction at 20°C; when the temperature was raised to 35°C there was a 4.69 log
reduction, and at 50°C complete inactivation was observed (>7 log, below the limit of detection).
In the case of LEHF (15 kV/cm and 979 Hz), there was a 2.96 log reduction at ambient
temperature, and a 4.15 log reduction at 35ºC. From these results, it can be concluded that
incorporation of mild heat in PEF processing greatly enhance the efficacy of PEF in microbial
inactivation.
The application of heat can cause significant changes in the membrane properties of
microbial cells. Heat may cause phase transitions of phospholipids present in the membrane,
changing normally rigid cells to a liquid-crystalline phase (Stanley, 1991; Koga, 2012). This
change in phase, combined with reductions in the thickness of cell membrane due to charge
attraction across the membrane, can work together to cause permeabilization of the cell at lower
electric field intensities when PEF is conducted at elevated temperatures (Jayaram et al., 1993).
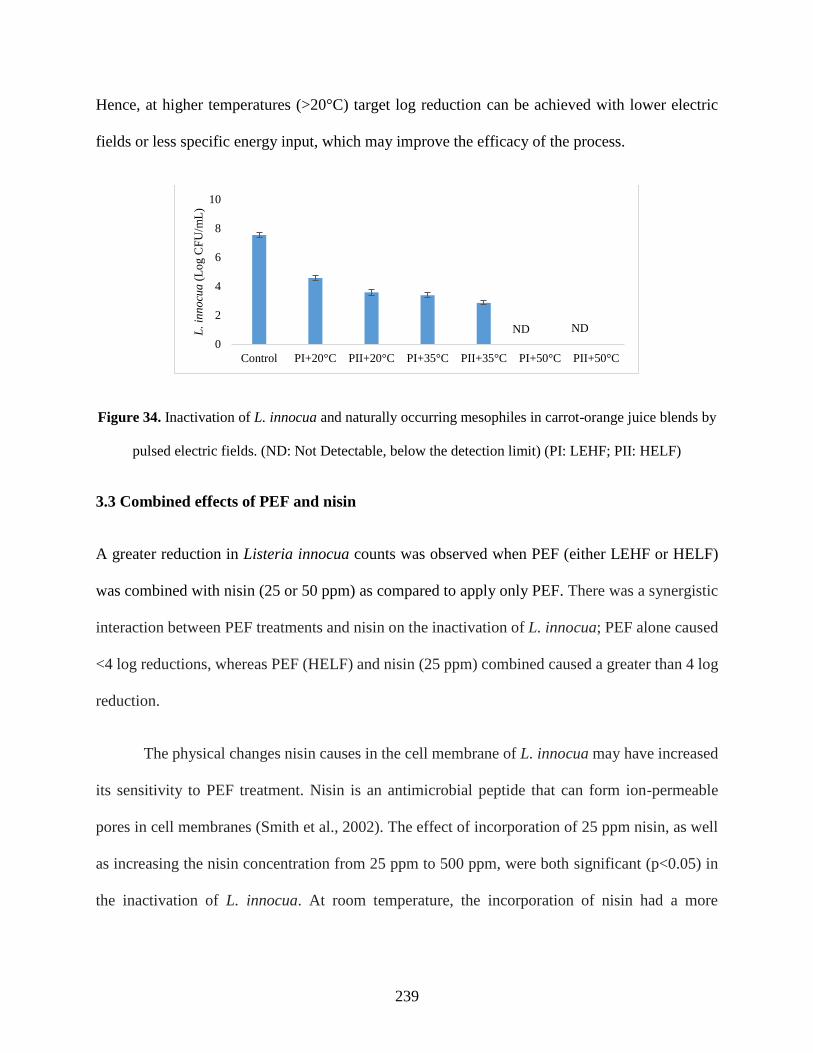
239
Hence, at higher temperatures (>20°C) target log reduction can be achieved with lower electric
fields or less specific energy input, which may improve the efficacy of the process.
Figure 34. Inactivation of L. innocua and naturally occurring mesophiles in carrot-orange juice blends by
pulsed electric fields. (ND: Not Detectable, below the detection limit) (PI: LEHF; PII: HELF)
3.3 Combined effects of PEF and nisin
A greater reduction in Listeria innocua counts was observed when PEF (either LEHF or HELF)
was combined with nisin (25 or 50 ppm) as compared to apply only PEF. There was a synergistic
interaction between PEF treatments and nisin on the inactivation of L. innocua; PEF alone caused
<4 log reductions, whereas PEF (HELF) and nisin (25 ppm) combined caused a greater than 4 log
reduction.
The physical changes nisin causes in the cell membrane of L. innocua may have increased
its sensitivity to PEF treatment. Nisin is an antimicrobial peptide that can form ion-permeable
pores in cell membranes (Smith et al., 2002). The effect of incorporation of 25 ppm nisin, as well
as increasing the nisin concentration from 25 ppm to 500 ppm, were both significant (p<0.05) in
the inactivation of L. innocua. At room temperature, the incorporation of nisin had a more
0
2
4
6
8
10
Control PI+20°C PII+20°C PI+35°C PII+35°C PI+50°C PII+50°C
L. in
no
cua
(Lo
g C
FU
/mL
)
ND ND

240
pronounced effect on microbial inactivation when combined with a HELF process. The target 5
log reduction was achieved by using 50 ppm nisin at 20°C under HELF conditions. Results from
present study in line with the finding of Hodgins et al. (2002) and Liang et al. (2002). Those authors
found synergy in combining PEF and nisin for microbial inactivation in orange juice. In a study
on milk processing by PEF, synergism on the inactivation of L. monocytogenes was found between
PEF and nisin at a concentration of 25 or 50 IU/mL (Maisnier-Patin et al., 1995). Synergy between
PEF and nisin was also observed by Iu et al. (2001), who found a significantly greater reduction
of E. coli in apple juice when nisin was added before PEF treatment as compared to apply only
PEF. This synergy between PEF and nisin might be due to sub-lethal injury caused by PEF and
thus increasing the sensitivity of microbial cells to nisin, and enhancing the inactivation (Hauben
et al., 1996).
3.4 Combined effect of PEF, heat, and nisin
In the present study, the temperature required to achieve a 5 log reduction of L. innocua was
decreased from 50 to 35°C by the addition of 50 ppm nisin under LEHF conditions (Table 30). In
the case of the HELF process, a 5 log reduction was achieved at room temperature (20°C) by the
incorporation of 50 ppm nisin; for the same process at 35°C, 25 ppm of nisin was sufficient to
achieve the same level of inactivation. This clearly indicates that the efficiency of PEF is enhanced
when nisin and mild heat are incorporated. The phase transition of the microbial cell membrane
due to applied heat might have facilitated PEF in creating pores. This phase transition might have
helped nisin to reach its site of action, where it can form more pores in the cytoplasmic membrane
hastening cell death.
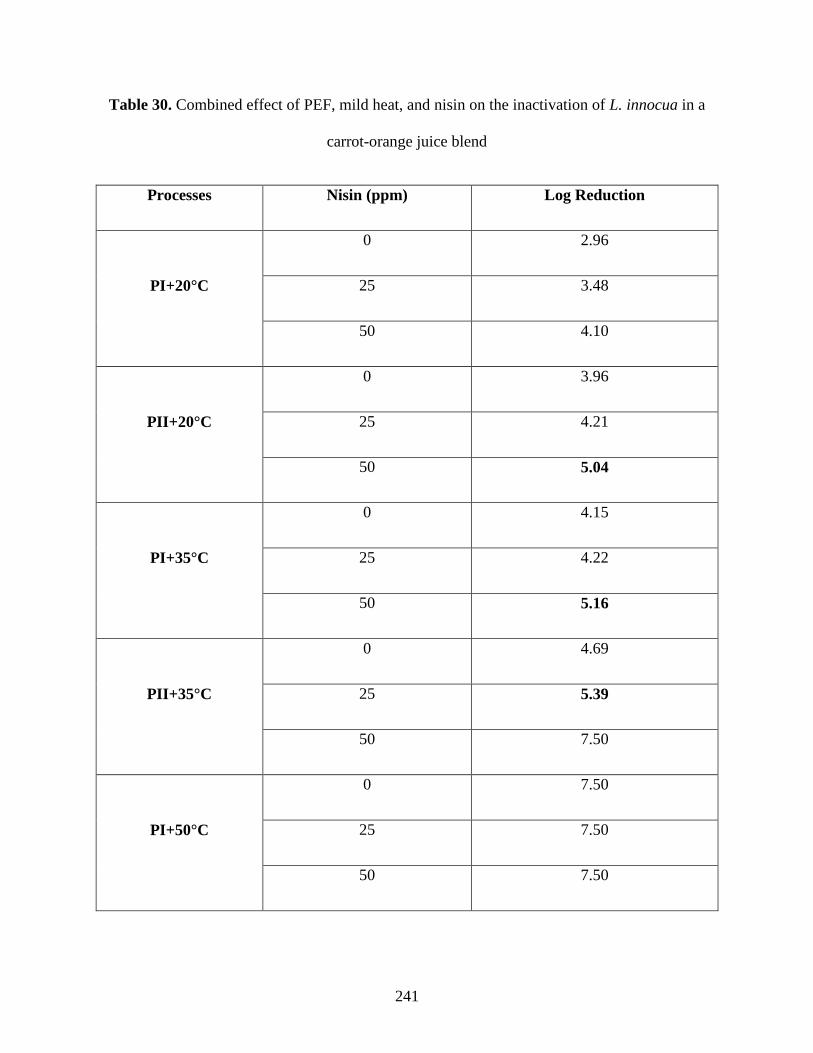
241
Table 30. Combined effect of PEF, mild heat, and nisin on the inactivation of L. innocua in a
carrot-orange juice blend
Processes Nisin (ppm) Log Reduction
PI+20°C
0 2.96
25 3.48
50 4.10
PII+20°C
0 3.96
25 4.21
50 5.04
PI+35°C
0 4.15
25 4.22
50 5.16
PII+35°C
0 4.69
25 5.39
50 7.50
PI+50°C
0 7.50
25 7.50
50 7.50

242
PII+50°C
0 7.50
25 7.50
50 7.50
(Note: PI: LEHF; PII: HELF)
3.5 Quality evaluation
Two different processing approaches at different temperatures were compared to demonstrate their
effects on the inactivation of naturally occurring mesophilic bacteria and some selected
physicochemical quality attributes.
3.5.1 Effect of processes on aerobic mesophiles
Before processing, there was about a 4 log of mesophiles in fresh carrot-orange juice blend. At
room temperature, HELF was slightly better than LEHF for their inactivation. There was a
significant difference between the three temperatures in mesophilic inactivation. Application of
HELF at 35°C was enough to reduce the mesophilic load to a safe level (<2 log).

243
Figure 35. Inactivation of naturally occurring mesophilic bacteria in carrot-orange juice by PEF
and mild heat. (PI: LEHF; PII: HELF)
3.5.2 Effect on pH, TSS, and Color
There was a slight decrease in the pH value of juice after PEF processing, but a significant
reduction (p<0.05) was only observed after treatment with HELF at 50°C. The reduction in pH
must be due to the electroporation of the plant tissues by PEF (Knorr et al., 2001), resulting in the
extraction of intracellular constituents, for example, organic acids. Significant (p<0.05) reductions
in TSS were observed in all treated samples relative to control. Reduction of TSS is also likely due
to tissue electroporation.
There was an increase in lightness value during PEF processing under all treatment
conditions. A significant increase (p<0.05) in L* was only observed in the case of HELF treatment
combined with heat (35°C or 50°C); with other combinations, the changes were non-significant
(p>0.05). Chroma values also increased after treatment, and a significant increase (p<0.05) was
observed at 50°C for both processes. At 35°C, a significant increase (p<0.05) was found only under
0
1
2
3
4
5
Control PI+20°C PII+20°C PI+35°C PII+35°C PI+50°C PII+50°C
Mes
op
hil
es (
Lo
g C
FU
/mL
)

244
HELF conditions. There was also an increase in hue angle under all treatment conditions, but a
significant increase was only observed for HELF at 35 and 50°C.
Table 31. Change in pH and TSS of juice before and after PEF processing
Sample pH TSS (°Bx)
Control 4.02±0.01a 11.10±0.44a
PI+20°C 3.98±0.06ab 9.80±0.50b
PII+20°C 3.95±0.07ab 9.88±0.29b
PI+35°C 3.97±0.04ab 9.58±0.39b
PII+35°C 3.94±0.02ab 9.00±0.35b
PI+50°C 3.94±0.04ab 9.85±0.30b
PII+50°C 3.89±0.04b 9.35±0.64b
PI: Low Electric Field High Frequency, LEHF; PII: High Electric Field-Low Frequency, HELF;
different superscript letters after standard deviation in the same column indicates data are
significantly different (p<0.05)
The increase in Lightness, Chroma, and hue value indicates extraction of intracellular
constituents of juice during processing. When both processing approaches are compared for each
temperature, it can be observed that HELF caused greater total color changes than LEHF. Hence,
it can be said that HELF has created greater degree of change in color as compared to LEHF at all

245
processing temperatures. When treatment at three different temperatures is compared, the change
in color value can be seen to increase with increased temperature. The change in color can have
different meanings: degradation of heat sensitive compounds, browning, enzymatic reaction, or
extraction of intracellular constituents from the minute cells of carrot present in the juice. As the
change in color may indicate degradation of nutrients, further analysis is required to identify if the
process has caused any changes in the major bioactive compounds; those results are discussed in
the following section.
Table 32. Change in color characteristics of juice before and after PEF treatment
Sample Lightness (L*) Chroma (C*) Hue (h*) ΔE
Control 30.69±0.94c 64.71±1.22b 0.95±0.02c -
PI+20°C 31.88±0.70bc 66.25±0.85ab 0.97±0.01bc 2.46±2.55b
PII+20°C 32.29±0.58abc 66.66±0.69ab 0.98±0.01abc 3.22±1.04ab
PI+35°C 32.46±0.87abc 66.94±1.03ab 0.98±0.01abc 3.51±1.16ab
PII+35°C 34.24±1.53a 68.55±1.55a 1.01±0.02a 6.71±2.71a
PI+50°C 32.74±0.96abc 67.32±1.03a 0.98±0.02abc 4.02±1.14ab
PII+50°C 33.82±1.01ab 68.35±0.97a 1.00±0.02ab 5.98±1.49ab
(Different superscript letters after standard deviation in the same column indicates data are
significantly different (p<0.05))

246
3.5.3 Effect on total carotenoid content and ascorbic acid
There was a slight increase in the carotenoid content of juice after PEF treatments. The HELF
process extracted more carotenoids than LEHF; nevertheless, both treatments did not degrade
significant amounts of carotenoid compounds regardless of processing temperature. There was a
significant reduction (p<0.05) in the ascorbic acid contents of all processed samples compared to
the control, but no significant difference (p>0.05) was observed between two different methods
and three different temperatures. The retention of ascorbic acid was about 92%. Hodgins et al.
(2002), found similar retention of ascorbic acid (97.5%) in orange juice when using PEF at 80
kV/cm, 20 pulses. Sharma et al. (1998), also found 96% retention of ascorbic acid in orange juice
treated by PEF (28 kV/cm, treatment time 100 µs). It can be concluded that combination of PEF
with heat treatment could preserve the quality attributes of the juice.
Figure 36. Effect of selected process on carotenoid and ascorbic acid content of juice
4. Conclusions
The study shows a high field-low frequency combination is superior to low frequency-high field
combination for microbial inactivation by PEF, although the energy input was equivalent. When
0
100
200
300
400
500
Car
ote
no
id (
mg/L
)
0
10
20
30
40
Asc
orb
ic A
cid
(m
g/1
00
g)

247
developing processing approaches for any juice, the focus should be on identifying the proper
electric field intensity while keeping frequency/number of pulses at an optimal level. Although
combinations of PEF and heat were able to reduce the microbial load by 5 log, the addition of nisin
reduced the required processing temperature, improving the efficiency of the process. For example,
using nisin, the required level of inactivation was achieved at ambient temperatures, while without
nisin, the target inactivation level was achieved at 50°C. Results from present study shows that the
suitable combinations of PEF, nisin, and heat can meet the FDA’s requirement of a 5 log reduction.
A combination of PEF, nisin, and heat could be used on an industrial scale for pasteurization of
other juices with similar pH and electrical conductivity; this will not only preserve juice quality,
but also make the process more energy efficient and capable of higher throughput.

248
References
Aronsson, K., Lindgren, M., Johansson, B. R., & Rönner, U. (2001) Inactivation of
Microorganisms Using Pulsed Electric Fields: The Influence of Process Parameters on
Escherichia Coli, Listeria Innocua, Leuconostoc Mesenteroides and Saccharomyces
Cerevisiae. Innovative Food Science and Emerging Technologies 2 (March): 41–54
Buckow, R., Ng, S., & Toepfl, S. (2013). Pulsed electric field processing of orange juice: a review
on microbial, enzymatic, nutritional, and sensory quality and stability. Comprehensive
Reviews in Food Science and Food Safety, 12(5), 455-467.
Hauben, K. J., Wuytack, E. Y., Soontjens, C. C., & Michiels, C. W. (1996). High-pressure transient
sensitization of Escherichia coli to lysozyme and nisin by disruption of outer-membrane
permeability. Journal of Food Protection, 59(4), 350-355.
Heinz, V, Toepfl, S. & Knorr, D. (2003) Impact of Temperature on Lethality and Energy
Efficiency of Apple Juice Pasteurization by Pulsed Electric Fields Treatment. Innovative
Food Science and Emerging Technologies 4 (June): 167–75.
Hodgins, A. M., Mittal, G. S., & Griffiths, M. W. (2002). Pasteurization of Fresh Orange Juice
Using Low‐Energy Pulsed Electrical Field. Journal of Food Science, 67(6), 2294-2299.
Iu, J., Mittal, G. S., & Griffiths, M. W. (2001). Reduction in levels of Escherichia coli O157: H7
in apple cider by pulsed electric fields. Journal of Food Protection, 64(7), 964-969.
Jayaram, S., Castle, G. S. P., & Margaritis, A. (1993). The effects of high field DC pulse and liquid
medium conductivity on survivability of Lactobacillus brevis. Applied Microbiology and
Biotechnology, 40(1), 117-122.

249
Knorr, D., Angersbach, A., Eshtiaghi, M. N., Heinz, V., & Lee, D. U. (2001) Processing Concepts
Based on High Intensity Electric Field Pulses. Trends in Food Science and Technology 12
(3): 129–35.
Koga, Y. (2012). Thermal adaptation of the archaeal and bacterial lipid
membranes. Archaea, 2012.
Liang, Z., Mittal, G. S., & Griffiths, M. W. (2002). Inactivation of Salmonella typhimurium in
orange juice containing antimicrobial agents by pulsed electric field. Journal of Food
Protection, 65(7), 1081-1087.
Maisnier-Patin, S., Tatini, S. R., & Richard, J. (1995). Combined effect of nisin and moderate heat
on destruction of Listeria monocytogenes in milk. Le Lait, 75(1), 81-91.
Mosqueda-Melgar, J., Raybaudi-Massilia, R. M., & Martín-Belloso, O. (2007). Influence of
treatment time and pulse frequency on Salmonella enteritidis, Escherichia coli and Listeria
monocytogenes populations inoculated in melon and watermelon juices treated by pulsed
electric fields. International Journal of Food Microbiology, 117(2), 192-200.
Sepulveda, D. R., Góngora-Nieto, M. M., San-Martin, M. F. & Barbosa-Cánovas, G. V. (2005)
Influence of Treatment Temperature on the Inactivation of Listeria Innocua by Pulsed
Electric Fields. LWT - Food Science and Technology 38 (2): 167–72.
Sharma, S. K., Zhang, Q. H., & Chism, G. W. (1998). Development of a protein fortified fruit
beverage and its quality when processed with pulsed electric field treatment. Journal of
Food Quality, 21(6), 459-473.

250
Siemer, Claudia, Stefan Toepfl, & Volker Heinz. (2014) Inactivation of Bacillus Subtilis Spores
by Pulsed Electric Fields (PEF) in Combination with Thermal Energy II. Modeling
Thermal Inactivation of B. Subtilis Spores during PEF Processing in Combination with
Thermal Energy. Food Control 39 (Supplement C): 244–50.
Smith, K., Mittal, G. S., & Griffiths, M. W. (2002). Pasteurization of milk using pulsed electrical
field and antimicrobials. Journal of Food Science, 67(6), 2304-2308.
Stanley, D. W., & Parkin, K. L. (1991). Biological membrane deterioration and associated quality
losses in food tissues. Critical Reviews in Food Science and Nutrition, 30(5), 487-553.
251
FINAL REMARKS
The effective combination of ultrasound and mild temperature could be used to pasteurize
low-acid juices in a shorter time as compared to thermal processing and without
significantly affecting the physicochemical characteristics
Mathematical modeling of the survivor’s curve shows both Weibull and a biphasic model
to be good fits to predict the inactivation of E. coli by ultrasound and thermal energy
The simultaneous application of ultrasound, mild temperatures, and nisin for the processing
of L. innocua inoculated carrot juice was found to be very effective as compared to apply
only ultrasound
The use of HPP in conjunction with nisin and mild temperature elevation is an effective
way of reducing microbial load in carrot juice, and potentially in other low-acid juices
The combined effect of high pressure, nisin, and mild temperature was better in microbial
inactivation than to apply only high pressure. This type of combined treatment can greatly
reduce energy consumption during processing.
HPP could be industrially used to safely process selected carrot-orange juice blends
without sacrificing quality attributes. Addition of orange juice to carrot juice results on less
processing time, reduced processing pressure and thus, lowering processing costs and
energy input. This study could also act as a baseline for the commercial pasteurization of
juice blends by high pressure at different pHs.
Pulsed electric fields processing of carrot-orange juice blends shows that high electric
field-low frequency combinations were superior to the low frequency-high field ones in

252
microbial inactivation although the power input was the same. Results also show higher
extraction of intracellular components by the application of HELF than LEHF
combinations.
For the same power input, pulsed electric fields intensity shows higher efficacy than pulse
frequency where the latter is related to treatment time and number of pulses. At the time of
developing a method for the treatment for any juice, the focus should be in identifying the
proper electric field intensity while keeping frequency/number of pulses at an optimum
level.
253
FUTURE STUDIES
The following area need further research to successfully use the combined technologies at the
commercial level:
In depth study on the application of HPP, PEF, and US together with natural antimicrobials
to inactivate pathogens.
Evaluation of sensory properties of carrot juice and blends treated with HPP, PEF, and US
and comparison with the thermally processed one.
Conduct in-depth studies on the shelf life prediction of carrot juice treated by those
technologies together with other hurdles.
Study on the effect of pulp and particulates on the inactivation of microorganisms by
selected nonthermal technologies together with hurdles.
Copyright © 2022 FDOKUMEN