extending shelf life of juice products by pulsed electric fields
215
EXTENDING SHELF LIFE OF JUICE PRODUCTS BY PULSED ELECTRIC FIELDS DISSERTATION Presented in Partial Fulfillment of the Requirements for the Degree Doctor of Philosophy in the Graduate School of The Ohio State University By Seacheol Min, M.S. * * * * * The Ohio State University 2003 Dissertation Committee: Approved By Dr. Q. Howard Zhang, Adviser Dr. David B. Min Adviser Dr. Sudhir K. Sastry Food Science and Nutrition
-
Upload
khangminh22 -
Category
Documents
-
view
0 -
download
0
Transcript of extending shelf life of juice products by pulsed electric fields
EXTENDING SHELF LIFE OF JUICE PRODUCTS BY PULSED ELECTRIC FIELDS
DISSERTATION
Presented in Partial Fulfillment of the Requirements for
the Degree Doctor of Philosophy in the Graduate
School of The Ohio State University
By
Seacheol Min, M.S.
* * * * *
The Ohio State University 2003
Dissertation Committee: Approved By
Dr. Q. Howard Zhang, Adviser
Dr. David B. Min Adviser
Dr. Sudhir K. Sastry Food Science and Nutrition

ii
ABSTRACT
Effects of commercial scale pulsed electric field (PEF) processing on the qualities
of tomato juice and orange juice were studied and compared with those of thermal
processing. The inactivation of tomato juice lipoxygenase (LOX) by PEF was studied
using kinetic models.
Tomato juice was prepared by hot break at 88 °C for 2 min or cold break at 68 °C
for 2 min and then thermally processed at 92 °C for 90 s or PEF processed at 40 kV/cm
for 57 µs. Freshly squeezed orange juice was thermally processed at 90 °C for 90 s or
processed by PEF at 40 kV/cm for 97 µs.
Tomato juice was treated by a laboratory scale PEF system with the combinations
of electric field strength (0, 10, 15, 20, 30, 35 kV/cm), PEF treatment time (20, 30, 50,
60, 70 µs), and PEF treatment temperature (10, 20, 30, 40, 50 °C) to study inactivation
kinetics of tomato juice LOX by PEF.
Both thermally and PEF processed tomato juices maintained microbial shelf life
at 4 °C for 112 d. PEF processed tomato juice retained more flavor compounds than
thermally processed or unprocessed control juice (p < 0.05). The lipoxygenase activities
of thermally and PEF processed tomato juices were 0 and 47%, respectively. PEF
processed tomato juice retained more ascorbic acid than thermally processed juice at 4 °C
for 42 d (p < 0.05). PEF processed tomato juice had significantly lower nonenzymatic

iii
browning than thermally processed or control juice (p < 0.05). Sensory evaluations
indicated that PEF processed tomato juice had more preferred flavor and higher overall
acceptability than thermally processed juice (p < 0.01).
Thermally and PEF processed orange juices maintained microbial shelf life at 4
°C for 196 d. PEF processed orange juice retained more ascorbic acid, flavor, and color
than thermally processed juice (p < 0.05). Sensory evaluation of texture, flavor, and
overall acceptability were ranked highest for control orange juice, followed by PEF
processed juice and then by thermally processed juice (p < 0.01).
Laboratory scale PEF treatment at 30 kV/cm for 60 µs at 50 °C inactivated 88.1%
of LOX. The first-order kinetic models, the Hulsheger’s model, and the Fermi’s model
adequately described the LOX inactivation by PEF. Applied electric field strength was
the primary variable for the inactivation of LOX by PEF.

iv
Dedicated to my parents and wife, Kijung

v
ACKNOWLEDGMENTS
I would like to express my sincere appreciation to Dr. Howard Q. Zhang for his
constant support and encouragement during my gradate studies. His keen insight and
systematic guidance have made my Ph. D. studies successful. His advices are always in
my mind and make me wise and strong. I would also like to express gratitude to Dr.
David B. Min and Dr. Sudhir K. Sastry for their valuable input and assistance in my
studies. I have been honored being their one of disciples.
I am very grateful to my colleagues in Ohio State PEF Research Team, specially,
Dr. Tony Jin, Si-Quan Li, Stephen Min, and Rod Caldwell, for their help in my research
and warm friendship. I also wish to thank my friends in the department of Food Science
and Technology at the Ohio State University for their friendship. Special my
appreciation is extended to my family and friends for their love.
Project funding from the U.S. DoD Dual Use Science & Technology program, the
PEF consortium, and the Ohio Agricultural Research and Development Center (OARDC)
are gratefully acknowledged.

vi
VITA
June 3, 1972 ……………………………………. Born – Cheongju, Korea 1992 - 1997………………………………………B.S. Food Science and Technology Chungnam National University Taejon, Korea 1998 - 1998…………………………….………...Graduate Research Associate Chungnam National University Taejon, Korea 1998 - 2000………………………………………M.S. Food Science and Technology
The Ohio State University Columbus, Ohio, U.S.A
1998 - present…………………………………….Graduate Research Associate
The Ohio State University Columbus, Ohio, U.S.A
PUBLICATIONS
Research Publications 1. Min S, Laura R, Zhang QH. 2002. Effects of Water Activity on the Inactivation of Enterobacter cloacae Inoculated in Chocolate Liquor and a Model System. J Food Process Preserv 26:323-337.

vii
FIELDS OF STUDY
Major Field: Food Science and Nutrition

viii
TABLE OF CONTENTS
Page
Abstract ..………………………………………………………………………………… ii
Dedication ……………………………………………………………………………….. v
Acknowledgments ………………………………………………………………...……. vi
Vita ………………………………………………………..…………………………… vii
List of Tables ………………………………..………………………………………… xiii
List of Figures …………………………………………………………………...……... xv
Chapters:
1. Literature Review …………………...…………………………………………… 1
Introduction …………………………………………..……....……………...…... 1
Inactivation of microorganisms by PEF……………………....…………………. 2
Mechanism …..………………………………..…………………...…... 2
Critical factors …………………………………..……….………...…... 3
Microbial stability of PEF treated foods…..……………..….………..... 8
Kinetic models …………………………………………..…...….….... 17
ix
Inactivation of enzymes by PEF ……..………………………..................….…..20
Mechanism …..………………………………………..………….…... 20
Critical factors ….……………………………………………..….…... 21
Inactivation of enzymes by PEF ……..………………………..……... 23
Sensory and nutritional properties of PEF treated juices ………………...…..… 27
Packaging issues ……………....………..………...………….…………..…….. 31
Conclusions ……………..…………………………………………….…….…. 34
References …………………………………………………………………..….. 34
2. Effects of Commercial Scale Pulsed Electric Field Processing on the Quality of
Tomato juice………………………………...………………………………………….. 48
Abstract ………………………………..…….………..………….…...………... 48
Introduction ………………………..……………….……..………………..…... 50
Materials and Methods …………..……………….………………...………..…. 51
Results and Discussion …………..…..………………...…………….…...……. 62
References ……………………………………………………..………….……. 79
Acknowledgments ……………………………………………..……………..… 85
3. Effects of Commercial Scale Pulsed Electric Field Processing on Flavor and
Color of Tomato Juice ……………………...……………………………………..…… 86
Abstract ………………………………..……………..……..................……...... 86
Introduction ………………………..……………………………...………..…... 87
Materials and Methods …………..……………….………………...………..…. 88
Results and Discussion …………..…..………………………...……….....…… 97
Conclusions ………………………………………………...……..….……..… 111
References …………………………………………….…………….………….. 111
Acknowledgments ……………………………………………………………… 115

x
4. Effects of Commercial Scale Pulsed Electric Field Processing on the Quality of
Orange Juice ……………………...…………………………………………………… 116
Abstract ………………………………..…………………...…..…....………... 116
Introduction ……………………………...…..………………………………... 117
Materials and Methods …………..…………………...…….…………………. 118
Results and Discussion …………..…..……………………...………….....….. 127
Conclusions …………………………………………………...………...…..… 141
References ………………………………………………..………………….... 141
Acknowledgments ………………………………………..…………………… 144
5. Inactivation Kinetics of Tomato Juice Lipoxygenase by Pulsed Electric Fields.145
Abstract ………………………………..………….………..…..…....………... 145
Introduction ………………………..……………….………..………………... 146
Materials and Methods …………..……………….…………...………………. 148
Results and Discussion ……………...…………………………...……...……. 156
Conclusions ………………………………………...…………………….....… 173
References ………………………………………………..………………….... 173
Acknowledgments ………………………………………..…………………… 176
6. Recommendations for Further Studies …………………………………………177
List of References …………………………………………………………………….. 179

xi
LIST OF TABLES
Table Page
1.1 Overview of the inactivation of microorganisms in foods by PEF treatment ... 13 1.2 Overview of the inactivation of enzymes by PEF treatment …...……………. 25 2.1 Processing conditions for thermally processed, PEF processed, and control tomato juices …...……………………………………………………….…..… 55 2.2 Effects of thermal processing and PEF processing on the concentration of lycopene of tomato juice during the storage at 4 °C for 112 days ……...……. 69 2.3 Effects of thermal processing and PEF processing on the particle size distribution of tomato juice………………………………………………….... 74 2.4 Effects of thermal processing and PEF processing on the viscosity of tomato juice during the storage at 4 °C for 112 days …………………….………..…. 76 2.5 Effects of thermal processing and PEF processing on the sensory properties of tomato juice …………………………………………………………………... 78 3.1 Parameters and temperature of processing …………………………………... 92 3.2 Effects of thermal processing and PEF processing on the retention of flavor compounds (%) of tomato juice during storage at 4 °C for 112 d …………… 99 4.1 Processing conditions for thermally processed, PEF processed, and control orange juices ………………………………………………..………………. 122 4.2 Effects of thermal processing and PEF processing on the total aerobic plate
counts and the yeast & mold counts of orange juice during storage at 4 °C for 196 days ………………………………………………………………..….…129
4.3 Effects of thermal processing and PEF processing on the retention of flavor
compounds (%) of orange juice during storage at 4 °C for 196 days ………. 134

xii
4.4 Effects of thermal processing and PEF processing on the hue angle (θ) of orange juice during storage at 4 °C for 196 days …………………………….138
4.5 Effects of thermal processing and PEF processing on the sensory evaluation of
color, appearance, texture, flavor, and overall acceptability of orange juice ..140 5.1 PEF treatment conditions for (a) the inactivation kinetics of tomato juice LOX
by PEF and for (b) the study determining the primary variable in tomato juice LOX inactivation by PEF ………………………………………………….…152
5.2 Kinetic constants (KE) of the first-order kinetic model, correlation coefficients (R2), p-values of lack-of-fit, and decimal reduction times (D) of the PEF treatment at 15, 20, 30, or 35 kV/cm at 30 °C on tomato juice LOX ………..158 5.3 Kinetic constants (KN) of the first-order kinetic model, correlation coefficients (R2), and p-values of lack-of-fit of the PEF treatment at 10, 20, 30, 40, or 50 °C at 60 µs on tomato juice LOX ………………………..……..165 5.4 Fermi’s equation parameter values and correlation coefficients (R2) for the inactivation of tomato juice LOX by PEF treatment at 30 °C for 20, 30, 50, 60, or 70 µs …………………………………..……………………………… 172

xiii
LIST OF FIGURES
Figure Page
2.1 Flowchart of OSU-6 commercial scale PEF processing system ..…………….. 53 2.2 Effects of thermal processing and PEF processing on the total aerobic plate
counts of tomato juice during the storage at 4 °C for 112 days …………….... 64 2.3 Effects of thermal processing and PEF processing on the yeast & mold counts of tomato juice during the storage at 4 °C for 112 days …………………….…... 65 2.4 Effects of thermal processing and PEF processing on the lipoxygenase activity of tomato juice during the storage at 4 °C for 112 days ……….………………67 2.5 Effects of thermal processing and PEF processing on the retention of ascorbic
acid of tomato juice during storage at 4 °C for 70 days ……………………… 71 3.1 Flowchart of OSU-6 commercial scale PEF processing system ..…………….. 90 3.2 Effects of thermal processing and PEF processing on the retention of trans-2- hexenal of tomato juice during storage at 4 °C for 112 days .……………….... 98 3.3 Effects of thermal processing and PEF processing on the brown color of tomato juice during storage at 4 °C for 112 days …………...……….……….. 102 3.4 Effects of thermal processing and PEF processing on the concentration of 5- hydroxymethyl-2-furfural of tomato juice storage at 4 °C for 112 days ……... 103 3.5 Linear regression plots of the brown color versus the concentration of 5-
hydroxymethyl-2-furfural (a) and the concentration of 5-hydroxymethyl-2- furfural versus the loss of ascorbic acid (b) in PEF processed tomato juice sampled at 0, 7, 14, 28, 35, 42, 49, 56, and 70 days………………………..…106
3.6 Effects of thermal processing and PEF processing on the red-yellow ratio
(Hunter a / b) of tomato juice during storage at 4 °C for 112 days ……….… 108

xiv
4.1 Flowchart of OSU-6 commercial scale PEF processing system ..………...…. 120 4.2 Effects of thermal processing and PEF processing on the retention of flavor compounds (%) of orange juice during storage at 4 °C for 196 days …..…… 131 4.3 Effects of thermal processing and PEF processing on the retention of myrcene of orange juice during storage at 4 °C for 196 days ……………………………. 133 4.4 Effects of thermal processing and PEF processing on the brown color of orange juice during storage at 4 °C for 196 days …………………..……..…………. 135 4.5 Effects of thermal processing and PEF processing on the lightness (L) of orange juice during storage at 4 °C for 196 days ………………………………...….. 137 5.1 A bipolar square wave pulse pair. A peak voltage and a peak current are
indicated. …………………………………………………………………….. 149 5.2 Flow arrangement of four PEF treatment chambers connected to stainless coils
which tomato juice passed through. T1, T2, T3, and T4 are inlet or outlet temperatures. ……………………………………………………………….... 150
5.3 Effects of PEF treatment time on the residual activity of LOX after PEF treatment at 15, 20, 30, or 35 kV/cm at 30 °C. Points are the average of a duplicate with four measurements. Plotted lines correspond to the adjustment of all points at each electric field strength to a first-order kinetic model. …...…. 157 5.4 Figure 4-The effect of electric field strength (E) on the first-order kinetic constant (kE) (a) and the regression line of experimental residual activity of LOX versus predicted residual LOX activity from Equation 10 (b) ....……..………161 5.5 Effects of electric field strength on the residual activity of LOX after PEF treatment at 10, 20, 30, 40, or 50 °C for 60 µs ………..…………………...…163 5.6 The effect of PEF treatment temperature on the first-order kinetic constant (kN)
(a) and the regression line of experimental residual activity of LOX versus predicted residual LOX activity from Equation 11 (b).………………...……. 167
5.7 The regression lines of experimental residual LOX activity versus predicted residual LOX activity from the Hulsheger’s kinetic model (a) and the Fermi’s kinetic model (b) …………………………………………………………….. 170

1
CHAPTER 1
Literature Review
INTRODUCTION
Pulsed electric field (PEF) has been studied as a nonthermal food preservation
method to inactivate microorganisms in foods without significant loss of flavor, color,
taste, and nutrient of the foods (Mertens and Knorr 1992; Dunn 2001). PEF treatment
uses high intensity electric field generated between two electrodes. A large flux of
electrical current flows through foods when a high intensity electric field is generated.
Nonthermal treatment is attained by use of a very short pulse width of treatment time (i.e.
microseconds). The potential of commercialization of PEF technology has drawn
attention from people in food industry, who wishes to satisfy the consumer demands for
fresh food products. A commercial scale PEF system with flow rate of 500-2000 L/h was
constructed and processed orange juice and tomato juice successfully (Min and others
2002a, 2002b; Min and Zhang 2002b).
PEF technology rapidly develops and thus a lot of reports regarding PEF
treatment of foods are being published. There is need to review current publications
reporting effects of PEF treatment on the inactivation of microorganisms and enzymes by
2
PEF and the sensory and nutritional qualities of foods. The benefit of PEF treatment of
foods will be realized when PEF treated foods maintain their initial high quality attributes
including flavor profiles for extended storage time. A packaging issue needs to be raised
to find appropriate packaging materials and methods for PEF treated foods.
INACTIVATION OF MICROORGANISMS BY PEF
Mechanism
Structural damages of cell membrane, which lead to ion leakage, metabolite
losses, protein releases, and increased uptakes of drugs, molecular probes, and DNA,
have been used to explain the microbial inactivation by PEF (Kinosita and Tsong 1977;
Benz and Zimmermann 1980). Chang and Reese (1990) introduced effects of PEF on
microbial cells. Primary effects include structural fatigue due to induced membrane
potential and mechanical stress. Secondary effects include material flow after the loss of
integrity of cellular membrane by the electric field, local heating, and membrane stress.
Tertiary effects include cell swelling or shrinking and disruption due to the unbalanced
osmotic pressure between the cytosol and the external medium.
The electric potential causes an electostatic charge separation in the membrane of
microbial cells due to the dipole nature of the molecules of the membrane (Bryant and
Wolfe 1987). The cell membrane is regarded as an insulator shell to the cytoplasm due to
its electrical conductivity, which is six to eight times weaker than the cytoplasm
(Barbosa-Canovas and others 1999). Electrical charges are accumulated in cell
membranes when microbial cells are exposed to electric fields. The accumulation of

3
negative and positive charges in cell membranes forms transmembrane potential. The
charges attract each other and generate compression pressure, which causes the
membrane thickness to decrease. A further increase in the electric field strength beyond
a critical membrane potential leads to pore formation (electroporation). Sale and
Hamilton (1968) reported that cell lysis with the loss of membrane integrity occurred
when transmembrane potential was approximately 1 volt. This critical electrical potential
varies depending on the pulse duration time, number of pulses, and PEF treatment
temperature (Barbosa-Canovas and others 1999).
Harrison and others (1997) reported that transmission electron microscopy (TEM)
micrographs of PEF treated Saccharomyces cerevisiae in apple juice exhibited disruption
of organelles and lack of ribosomes They proposed that the damaged organelles and
lack of ribosomes after PEF treatment as an alternative inactivation mechanism to the
electroporation theory.
Critical factors
The factors determining the efficiency of the microbial inactivation by PEF can be
classified with treatment parameters, product parameters, and microbial characteristics.
Treatment parameters. The main treatment parameters that affect microbial
inactivation by PEF are electric field strength, PEF treatment time, pulse width, pulse
shape, and treatment temperature. (Knorr and others 1994; Hulsheger and Niemann
1980). Generally, as the intensity of each of theses parameters increase, the microbial
inactivation by PEF also increases (Wouters and others 2001a). A linear relationship
between electric field strength and the inactivation of Escherichia coli was reported by

4
Hulsheger and Niemann (1980). Peleg (1995) showed that the rate of microbial
inactivation by PEF at a constant electric field strength increases as PEF treatment time
increases.
High efficiency of PEF treatment on the inactivation of microorganisms can be
obtained with a large pulse width. PEF treatment time is calculated by multiplying the
number of pulses by the pulse width. As the pulse width increases, the PEF treatment
time also increases, which results in increased inactivation. However, if the pulse width
is too long, a food temperature rise undesirable for PEF treatment can occur (Barbosa-
Canovas and others 1999).
Electric field pulses can be applied in the form of exponentially decay, square
wave, and oscillatory pulses. The pulse shapes commonly used in PEF treatment are
exponential or square wave pulses (Barbosa-Canovas and others 1999). The square wave
pulse minimizes energy absorption in foods (Knorr and others 1994) and is more
effective for inactivating microorganisms than exponential decay pulses (Zhang and
others 1994c). The pulse width for a square pulse is the time that the voltage is kept at
the maximum value. The pulse width of exponential decay pulses is the time needed to
decrease the voltage to 37% of its peak value (Zhang and others 1995a). Bipolar waves
have been used with square wave or exponential pulses. A shielding layer can be formed
on electrodes in PEF treatment chamber when charged molecules such as proteins
migrate to the surface of electrodes. The shielding layer reduces the efficiency of PEF
treatment by altering uniform electric fields. Bipolar pulses can prevent the formation of
the shielding layer (Zhang and others 1995a). Bipolar pulses are also more lethal than
monopolar pulses because a reversal in the orientation or polarity of the electric field

5
changes the direction of charged molecules in the cell membrane, which causes a stress in
the cell membrane of microorganisms and electric breakdown (Barbosa-Canovas and
others 1999).
Synergistic effects between PEF treatment and moderate temperature (45-60 °C)
on the inactivation of microorganisms has been reported. Zhang and others (1995b)
demonstrated that the increase of PEF treatment temperature from 7 to 20 °C
significantly increased the inactivation of E. coli in simulated milk ultrafiltrate. Sensoy
and others (1997) found that increasing the PEF treatment temperature from 10 to 50 °C
increased the sensitivity of Salmonella dublin to PEF treatment. The increased lethal
effects of PEF at the higher PEF treatment temperature might be due to the temperature-
related phase transition of cell membrane from a gel to a liquid-crystalline and the
associated reduction in the bilayer thickness of cell membrane (Stanley 1991). The phase
transition reduces the transmembrane potential needed for the breakage of cell membrane
(Pothakamury and others 1996). Mertens and Knorr (1992) recommended PEF treatment
combined with a moderate thermal treatment for the efficient inactivation of
microorganisms in foods.
Product parameters. Information on the physical properties of foods over a wide range
of temperatures is needed to find optimum PEF treatment condition and to design PEF
processing units (Ruhlman and others 2001). The most critical product parameters
include electric conductivity, density, viscosity, pH, and water activity.
PEF treatment is more effective for the microbial inactivation with the food of
low electrical conductivity. An increase in the electrical conductivity of treatment
medium causes a decrease in inactivation of microorganisms at constant energy input

6
(Vega-Mercado and others 1996). The low electrical conductivity increases the
difference in the electrical conductivity between a medium and a microbial cytoplasm.
This increased difference in the electrical conductivity weakens the membrane structure
of microorganisms due to an increased flow of ionic substances across the membrane
during PEF treatment (Barbosa-Canovas and others 1999). Raso and others (1998a)
showed the dependency of electric field strength on the electrical conductivity of fruit
juices. They reported that the lowest electrical conductivity caused the highest electric
field strength and thus the highest microbial inactivation.
The temperature change during PEF treatment can be expressed as:
pCtET
ρσ2
=∆ (1)
where ∆T is the temperature change in food during PEF treatment (°C), E is the electric
field strength (V/m), t is the PEF treatment time (s), σ is the electrical conductivity of the
food to be processed (S/m), ρ is the density of the food (kg/m3), and Cp is the specific
heat of the food (J/(kg°C)) (Lindgren and others 2002).
Temperature inside PEF treatment chambers increases during PEF treatment. A
low electrical conductivity of foods results in a small temperature change during PEF
treatment (Equation 1). The temperature change during PEF treatment can also be
reduced with high density foods (Equation 1). A high temperature increase during PEF

7
treatment can decrease the solubility of air in foods (Zhang and others 1995a). Air
bubbles can cause dielectric breakdown under electric field (arching). The temperature
increase should be minimized for efficient PEF treatments.
The viscosity of a food determines flow characteristics. A uniform flow profile of
food products in the PEF treatment chamber can provide a uniform PEF treatment
(Ruhlman and others 2001).
The effect of the pH on the inactivation of microorganisms by PEF is not clear
(Wouters and others 2001a). Vega-Mercado and others (1996) and Raso and others
(1998a) found an enhanced efficiency in the inactivation of microorganisms by PEF at
low pH. The inactivation of E. coli by PEF was more effective at pH 5.7 than at pH 6.8
(Vega-Mercado and others 1996). An enhanced lethal effect of PEF on mold spores in
fruit juices at low pH (Raso and others 1998a). However, Hulsherger and others (1981)
and Sale and Hamilton (1967) reported no significant effect of pH on the inactivation of
microorganisms by PEF. The effect of pH on the inactivation of microorganisms by PEF
might depend on the characteristics of microorganisms to be investigated.
Microbial resistance to inactivation treatments including thermal treatment is high
at low water activity (aw) environment (Ababouch and others 1995). Min and others
(2002c) found that the PEF inactivation of Enterobacter cloacae inoculated in chocolate
liquor or a model system increased as aw increased. They reported that E. cloacae
survived from low aw environment had high resistance to PEF. The resistance of
microorganisms to a low aw environment may need to be considered when the
inactivation of microorganisms by PEF is evaluated.

8
Microbial characteristics. Bacteria are generally more resistant to PEF than yeasts
(Barbosa-Canovas and others 1999). Among bacteria, gram positive bacteria are more
resistant to PEF than gram negative bacteria (Hulsheger and others 1983). The higher
resistance to PEF of gram positive bacteria may be related to the rigidity of the teichoic
acids in the peptidoglycan layer of the gram-positive cell wall (Lado and Yousef 2002).
Bacterial spores and mold ascospores are more resistant to PEF treatment than vegetative
cells (Grahl and Markl 1996; Raso and others 1998a).
Microbial cell size or shape may influence the efficiency of PEF inactivation.
Wouters and others (2001b) showed that Lactobacillus species in different sizes or shapes
had different membrane permeabilization by PEF. Larger cells were more easily
permeabilized than smaller cells.
Growth stage of microorganisms is also related to the effectiveness of microbial
inactivation by PEF. Bacteria and yeasts at their logarithmic stage are more sensitive to
PEF than those at the stationary or lag growth stage (Pothakamury and others 1996). The
growth stage of microorganisms needs to be considered when developing mathematical
kinetic models that describe the inactivation kinetics of microorganisms by PEF.
Microorganisms at various growth stages would not have identical sensitivity to PEF so
that the distribution of sensitivity to PEF is an issue. A wide range of distribution needs
to be avoided to develop reliable inactivation kinetic models.
Microbial stability of PEF treated foods
An overview of the inactivation of microorganisms in foods by PEF treatment is
shown in Table 1.1. PEF treatment is advantageous for the pasteurization of juice

9
products due to their high acidity and low protein concentration. The high acidity of
juice products retards the growth of bacteria and the germination of bacterial spores
(Raso and others 1998a). Protein and electrolytes may migrate to the surface of
electrodes during PEF treatment. This can form a shielding layer, which reduces
efficiency of PEF treatment. The low protein content of juice products may not cause the
formation of the shielding layer.
Apple juice. Qin and others (1994) reported that a PEF treatment at 12 kV/cm with 20
exponential decay pulses inactivated 4 log cycles of S. cerevisiae in apple juice.
Harrison and others (1997) observed that a PEF treatment at 40 kV/cm reduced
the number of S. cerevisiae inoculated in apple juice from 8 × 10⁷ CFU/mL to 4 × 10⁴
CFU/mL. They showed transmission electron microscopy (TEM) micrographs of PEF
treated S. cerevisiae in apple juice. The PEF treatment disrupted yeast cells and resulted
in the almost total absence of ribosome bodies.
Evrendilek and others (2000) reported that a laboratory scale PEF treatment at 34
kV/cm for 166 µs reduced the number of E. coli O157:H7 in apple juice by 4.5 log cycles.
They also reported that a pilot plant scale PEF processing at 35 kV/cm for 94 µs
increased the microbial shelf life of apple juice and apple cider. Shelf life of an apple
cider treated by a combination of PEF at 35 kV/cm for 94 µs and a thermal treatment at
60 °C for 30 s was more than 67 d at 4 °C and 22 °C.
Cranberry juice. The effects of a pilot plant scale PEF treatment at 35 kV/cm for 195
µs on the inactivation of microorganisms in reconstituted cranberry juice were
investigated by Jin and others (1998). The PEF treatment decreased the numbers of total

Source Food Microorganism PEF system PEF treatment condition Log reduction
Qin and others (1994) Apple juice S. cerevisiae, E. coli Batch parallel plate 12 kV/cm, 20 pulses, exponential decay, < 30 °C S. cerevisiae: 3-4,
E. coli: 3
Zhang and others (1994b) Apple juice S. cerevisiae Batch parallel plate 25 kV/cm, 558 J, exponential decay, < 25 °C 3-4
Qin and others (1995a) Apple juice S. cerevisiae Continuous flow
coaxial 50 kV/cm, square wave, 29.6 °C 6.3
Harrison and others (1997) Apple juice S. cerevisiae
Continuous recirculating parallel
plate 40 kV/cm, 64 pulses, exponential decay, 15 °C 3.3
Evrendilek and others (1999) Apple juice E. coli O157:H7 Co-field flow
tubular 29 kV/cm, square wave 5
Evrendilek and others (2000) Apple juice
Lab scale: E. coli O157:H7, Pilot plant
scale: aerobic microorganisms, yeasts & molds
Co-field flow tubular
Lab scale: 34 kV/cm, 166 µs of treatment time, 1.5 mL/s, 800 ppsa
Pilot plant scale: 35 kV/cm, 94 µs of treatment time,
85 L/h, 952 Hz
Lab scale: 4.5 Pilot plant scale:
aerobic microorganisms –
2.1, yeasts & molds – 1.5
Cserhalmi and others (2002) Apple juice S. cerevisiae Co-field flow
tubular 20 kV/cm, 10.4 pulses, square wave 4
Raso and others (1998a)
Cranberry juice
Byssochlamys fulva canidiospores Coaxial 36.5 kV/cm, 22 °C 5.9
a pps: Pulses Per Second continued Table 1.1: Overview of the inactivation of microorganisms in foods by PEF treatment
10

11
Table 1.1 continued Raso and others
(1998a) Cranberry
juice Neosartorya fischeri Coaxial 51.0 kV/cm, 34 °C Not inactivated
Jin and Zhang (1999)
Cranberry juice
Aerobic microorganisms, yeasts & molds
Co-field flow tubular 40 kV/cm, 150 µs of treatment time, square wave
Aerobic microorganisms:
4.8, Yeasts & molds: 4.9
Qiu and others (1998) Orange juice Aerobic
microorganisms Co-field flow
tubular 29.5 kV/cm, 60 µs of treatment time, square wave 4.2
Sharma and others (1998)
Whey protein fortified
orange juice
Aerobic microorganisms, yeasts & molds
Pilot plant scale system, co-field
flow tubular
32 kV/cm, 92 µs of treatment time, 3.3 µs of pulse width, 800 Hz, 79 L/h
Aerobic microorganisms:
0.5 Yeasts & molds:
3.5 Jia and others
(1999) Orange juice
Aerobic microorganisms, yeasts & molds
Pilot plant scale system, co-field
flow tubular
30 kV/cm, 240 µs of treatment time, 2 µs of pulse width, 1000 Hz, 2 mL/s
Aerobic microorganisms:
2.5 Yeasts & molds:
2.5
McDonald and others (2000) Orange juice
L. mesenteroides, E. coli, L. innocua, S.
cerevisiae ascospore
CPS1 system, cathode (PurePulse
Tech)
30 kV/cm or 50 kV/cm (S. cerevisiae ascospores),
100 L/h
L. mesenteroides, E. coli, L. innocua:
5, S. cerevisiae ascospore: 2
Yeom and others (2000) Orange juice
Aerobic microorganisms, yeasts & molds
Pilot plant scale system, co-field
flow tubular
35 kV/cm, 59 µs of treatment time, 1.4 µs of pulse width, 600 pps, 98 L/h
Aerobic microorganisms: 7 Yeasts & molds: 7
Min and others (2002a) Orange juice
Aerobic microorganisms, yeasts & molds
Commercial scale system, co-field
flow tubular
40 kV/cm, 97 µs of treatment time, 2.6 µs of pulse width, 1000 pps, 500 L/h
Aerobic microorganisms: 6 Yeasts & molds: 6
Min and others (2002b) Tomato juice
Aerobic microorganisms, yeasts & molds
Commercial scale system, co-field
flow tubular
40 kV/cm, 57 µs of treatment time, 2 µs of pulse width, 1000 pps, 500 L/h
Aerobic microorganisms: 6 Yeasts & molds: 6
continued
11

12
Table 1.1 continued
Raso and others (1998b)
Apple juice (AJ),
orange juice (OJ),
grape juie (GJ),
pineapple juice (PJ), cranberry juice (CJ)
Zygosaccharomyces balii ascospores
Vegetative cells (V), ascospores (A)
Coaxial
• AJ: 32.3 kV/cm, 19 °C • OJ: 34.3 kV/cm, 20 °C • GJ: 35.0 kV/cm, 20 °C • PJ: 33.0 kV/cm, 20 °C • CJ: 36.5 kV/cm, 22 °C
• AJ (V): 4.8 AJ (A): 3.6 • OJ (V): 4.7 OJ (A): 3.8 • GJ (V): 5.0 GJ (A): 3.5 • PJ (V): 4.3 PJ (A): 3.4 • CJ (V): 4.6 CJ (A): 4.2
Dunn and others (1987) Milk E. coli
Circular parallel stainless steel
electrode 33 kV/cm, 35 pulses, 43 °C 3
Dunn and others (1987) Milk S. dublin
Circular parallel stainless steel
electrode
36.7 kV/cm, 36 µs of treatment time, 40 pulses, 63 °C 4
Zhang and others (1994b)
Simulated milk
ultrafiltrate (SMUF)
E. coli Batch parallel plate 25 kV/cm, 20 pulses, exponential decay, < 25 °C 3
Qin and others (1994) SMUF E. coli Batch parallel plate 40 kV/cm, oscillatory decay, < 30 °C 3
Qin and others (1994) SMUF B. subtilis Batch parallel plate 16 kV/cm, 180 µs of treatment time, bipolar 5.5
Pothakamury and others
(1995a) SMUF L. delbrueckii
ATCC 11842 Batch parallel plate 16 kV/cm, 300 µs of treatment time, 40 pulses, exponential decay, < 30 °C 4-5
continued
12
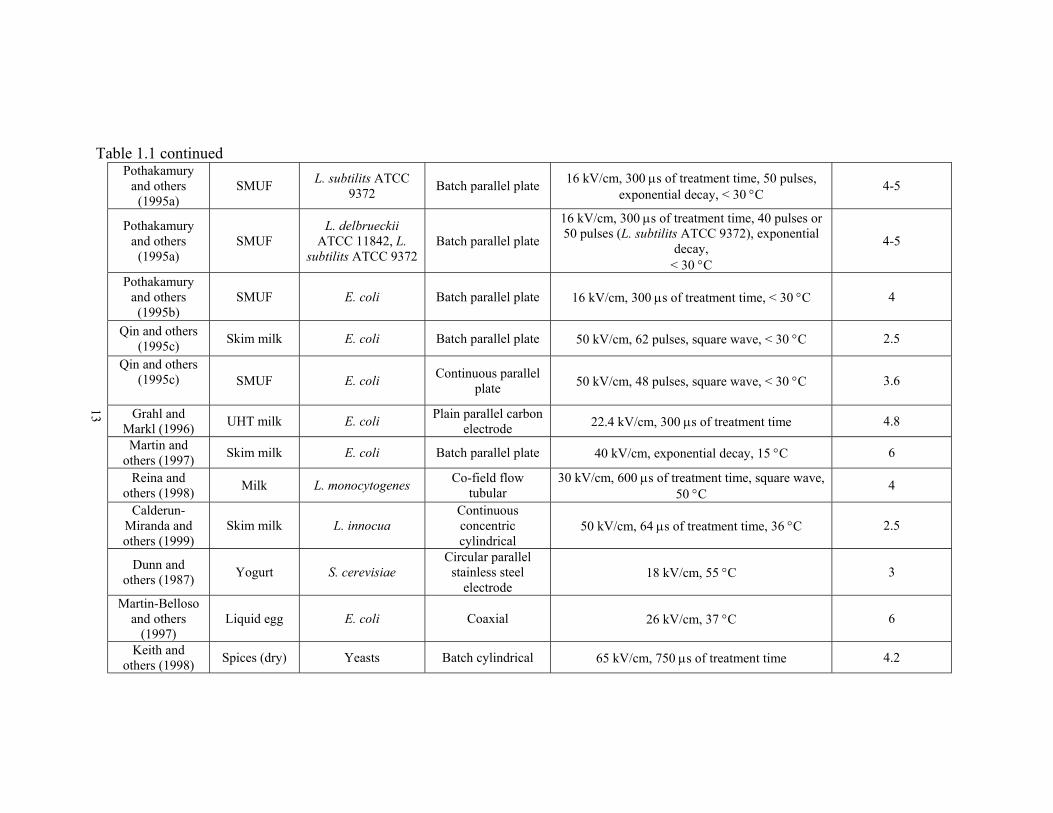
13
Table 1.1 continued Pothakamury
and others (1995a)
SMUF L. subtilits ATCC 9372 Batch parallel plate 16 kV/cm, 300 µs of treatment time, 50 pulses,
exponential decay, < 30 °C 4-5
Pothakamury and others
(1995a) SMUF
L. delbrueckii ATCC 11842, L.
subtilits ATCC 9372 Batch parallel plate
16 kV/cm, 300 µs of treatment time, 40 pulses or 50 pulses (L. subtilits ATCC 9372), exponential
decay, < 30 °C
4-5
Pothakamury and others (1995b)
SMUF E. coli Batch parallel plate 16 kV/cm, 300 µs of treatment time, < 30 °C 4
Qin and others (1995c) Skim milk E. coli Batch parallel plate 50 kV/cm, 62 pulses, square wave, < 30 °C 2.5
Qin and others (1995c) SMUF E. coli Continuous parallel
plate 50 kV/cm, 48 pulses, square wave, < 30 °C 3.6
Grahl and Markl (1996) UHT milk E. coli Plain parallel carbon
electrode 22.4 kV/cm, 300 µs of treatment time 4.8
Martin and others (1997) Skim milk E. coli Batch parallel plate 40 kV/cm, exponential decay, 15 °C 6
Reina and others (1998) Milk L. monocytogenes Co-field flow
tubular 30 kV/cm, 600 µs of treatment time, square wave,
50 °C 4
Calderun-Miranda and others (1999)
Skim milk L. innocua Continuous concentric cylindrical
50 kV/cm, 64 µs of treatment time, 36 °C 2.5
Dunn and others (1987) Yogurt S. cerevisiae
Circular parallel stainless steel
electrode 18 kV/cm, 55 °C 3
Martin-Belloso and others
(1997) Liquid egg E. coli Coaxial 26 kV/cm, 37 °C 6
Keith and others (1998) Spices (dry) Yeasts Batch cylindrical 65 kV/cm, 750 µs of treatment time 4.2
13

14
aerobic plate count and yeast & mold count of cranberry juice by more than 4 log cycles.
The PEF treated cranberry juice had the shelf life of 8 months, 37 d, and 30 d at 4, 22,
and 37 °C, respectively.
Raso and others (1998a) reported that 6 log cycles of Byssochlamys fulva
conidiospores in cranberry juice were inactivated by a PEF treatment at 36.5 kV/cm.
Jin and Zhang (1999) reported that a PEF treatment at 40 kV/cm for 150 µs
reduced about 5 log cycles in the total aerobic plate count and the yeast & mold count in
cranberry juice. The PEF treatment prevented the growth of yeasts and molds in the
cranberry juice during 14 d of storage at 4 °C.
Orange juice. Qiu and others (1998) reported that a pilot plant scale PEF treatment at
29.5 kV/cm for 60 µs inactivated aerobic microorganisms in reconstituted orange juice by
4.2 log cycles. The PEF treated orange juice had a seven-month shelf life at 4 °C in
aseptic packages.
Sharma and others (1998) reported that a pilot plant scale PEF treatment at 32
kV/cm for 92 µs reduced yeast & mold counts of whey protein fortified orange juice from
1.4 × 10⁵ CFU/mL to less than 40 CFU/mL. The PEF treated protein fortified orange
juice was microbiologically stable for 5 months at 4 °C.
Jia and others (1999) reported that the numbers of the total aerobic plate count
and the yeast & mold count in freshly squeezed orange juice were reduced by a PEF
treatment at 30 kV/cm for 240 µs. They found that the PEF treatment was as effective as

15
the thermal treatment at 90 °C for 1 min in reducing the total aerobic plate count and the
yeast & mold count in single strength orange juice. The total aerobic plate count and the
yeast & mold count of the PEF treated orange juice were < 1 est. CFU/mL at 4 °C for 6
wk.
McDonald and others (2000) inoculated Leuconostoc mesenteroides, E. coli, and
Listeria innocua into orange juice and treated the inoculated orange juice with PEF at 30
kV/cm. They achieved more than 5 log reductions of L. mesenteroides, E. coli, and L.
innocua inoculated in orange juice. They also obtained a maximum 2.5 log reductions of
S. cerevisiae ascospores in orange juice by a PEF treatment at 50 kV/cm.
Yeom and others (2000a) observed 7 log reductions in the total aerobic plate
count and the yeast & mold count in orange juice after a PEF treatment at 35 kV/cm for
59 µ. Yeom and others (2000b) compared effects of PEF treatment by a pilot plant scale
PEF system at 35 kV/cm for 59 µs on the microbial stability of orange juice to those of
thermal treatment at 94.6 °C for 30 s. The PEF treatment maintained the number of
endogenous microorganisms in orange juice at about 1 log cycle at 4, 22, and 37 °C for
112 d, which was as effective as the thermal treatment.
Min and others (2002a) studied effects of a commercial scale PEF treatment at 40
kV/cm for 97 µs on the inactivation of endogenous microorganisms in orange juice.
Commercial scale PEF treatment reduced 6 log cycles in the total aerobic plate count and
the yeast & mold count of orange juice. They reported that fresh orange juice treated by
a commercial scale PEF system showed microbial shelf life (< 4 log cycles of both total
aerobic plate count and yeast & mold count) at 4 °C for 196 d.

16
Tomato juice. Min and others (2002b) reported that a PEF treatment at 40 kV/cm for 57
µs by a commercial scale PEF system inactivated 6 log cycles of endogenous
microorganisms in tomato juice. The PEF treated juices showed microbial shelf life at 4
°C for 112 d (< 4 log cycles of both total aerobic plate count and yeast & mold count).
They observed a higher rate of microbial growth in the PEF treated tomato juice than the
tomato juice thermally treated at 92 °C fro 90 s during storage at 4 °C for 112 d. This
might be due to a relatively lower inactivation of the spores by PEF than the thermal
treatment and the germination of the survived spores during the storage.
Milk. Qin and others (1995b) treated skim milk with PEF at 40 kV/cm for 40 µs and
found that the PEF treated milk had the microbial shelf life of 2 wk at 6 °C.
Grahl and Markl (1996) inoculated UHT milk with E. coli, L. brevis,
Pseudomonas fluorescens or S. cerevisiae and treated the inoculated UHT milk with PEF
at 10-30 kV/cm with 1-22 Hz. They found that 10 kV/cm was the threshold electric field
strength, below which no inactivation of microorganisms occurs, for all the tested
pathogenic microorganisms and high fat content of milk reduced the lethal effect of PEF.
They also treated UHT milk containing different types of spores with PEF at 22 kV/cm.
They reported the PEF treatment did not significantly inactivate the endospores of
Clostridium tyrobutyricum and Bacillus cereus and ascospores of B. nivea.
Reina and others (1998) studied effects of PEF on the inactivation of L.
monocytogenes in milk. Pasteurized whole, 2%, and skim milk were inoculated with L.
monocytogenes Scott A and treated with PEF at 30 kV/cm for 600 µs at 50 °C. A 4 log
reduction of the L. monocytogenes was obtained. The results indicate that the potential
use of PEF for the inactivation of pathogens in milk.
17
Yogurt-based product. Yeom and others (2001b) studied the shelf life of a PEF treated
yogurt-based product. A yogurt-based product similar to a dairy pudding dessert was
formulated with commercial plain low fat yogurt, fruit jelly, and syrup. The yogurt-based
product was processed by a combination of a PEF treatment by a pilot plant scale PEF
system at 30 kV/cm for 32 µs and a thermal treatment at 60 °C for 30 s. The PEF
treatment combined with mild thermal treatment significantly increased the microbial
stability of the yogurt-based products during storage at 4 °C. The yeast & mold count of
the PEF treated product was less 1 log cycle while that of the untreated product was
around 4 log cycles after 90 d storage at 4 °C. The results imply feasibility to process
high viscosity foods by PEF.
Kinetic models
The study of mathematical kinetic models that describe the inactivation of
spoilage and pathogenic microorganisms by PEF is required to find PEF treatment
conditions for desired levels of microbial inactivation. To develop inactivation kinetic
models, microbial inactivation data should be obtained from reliable experiments where
artifacts of the experimental procedures are avoided (Wouters and others 2001a).
18
Microbial inactivation by PEF has been described by first-order kinetic models as
Equation 2 and 3. The natural logarithm of a survivor fraction (S), microbial count after
PEF treatment / microbial count before PEF treatment, is expressed as the function of
PEF treatment time (Equation 2) or electric field strength (Equation 3).
ln(S) = -kEt (2)
where t is the PEF treatment time (µs) and kE is the first-order kinetic constant with t.
ln(S) = -kNE (3)
where E is the electric field strength (kV/cm) and kN is the first-order kinetic constant
with E.
Zhang and others (1994a) showed that the inactivation of E. coli, Staphylococcus
aureus, and S. cerevisae by 5 to 6 log cycles yielded log-linear kinetic data and the data
were fit to the first-order kinetic models of inactivation with respect to PEF treatment
time and electric field strength.
A study on the inactivation kinetics of S. dublin in skim milk by Sensoy and
others (1997) revealed that S. dublin followed first-order kinetics with respect to electric
field strength (R2 = 0.97–0.98) over 4 log cycles of survivor fractions.
Hulsheger and others (1981) proposed a kinetic model for the microbial
inactivation by PEF. The Hulsheger’s kinetic model shown in Equation 4 describes the
kinetics of survival curves that is obtained assuming a linear relationship between the

19
natural logarithm of the survivor fraction and the electric field strength as well as a linear
relationship between the natural logarithm of the survivor fraction and the natural
logarithm of the PEF treatment time.
( ) kEE
c
c
ttS
/−−
= (4)
where t is the PEF treatment time (µs), tc is the critical treatment time below which no
inactivation of microorganism occurs (µs), E is the electric field strength (kV/cm), Ec is
the critical electric field strength below which no inactivation of microorganisms occurs
(kV/cm), and k is the specific rate constant.
The Hulsheger kinetic model accurately predicted the PEF inactivation of E. coli,
L. brevis, and P. fluorescens in sodium-alginate and UHT milk of up to 4 log cycles (R2 =
0.97–1.00) (Grahl and Markl 1996).
Martin and others (1997) showed that the inactivation of E. coli in skim milk by
PEF was successfully described by the Hulsheger’s kinetic model.
In a study by Aronsson and others (2001), the Hulsheger model was applied to the
inactivation data of E. coli, L. innocua, L. mesenteroides, and S. cerevisae. Their results
showed that the kinetic model parameters (Ec, K, tc) were dependent on microbial species.
The Hulsheger’s kinetic model is well established and fits lots of experimental data.

20
Peleg (1995) proposed a kinetic model for the microbial inactivation by PEF
based on Fermi’s equation. The Fermi’s kinetic model shown in Equation 5 represents
the survivor fraction as a function of electric field strength and number of pulses. The
Fermi’s kinetic model provides a sigmoid shaped curve.
aEE heS /)(1
1−+
= (5)
where E is the electric field strength (kV/cm), Eh is the electric field strength (kV/cm)
where RA is 0.5, and a is the parameter indicating the slope of the curve around Eh.
The Fermi’s kinetic model can explain low inactivation rates of microorganisms
after very short PEF treatment times and the tailing effect at long PEF treatment times
due to its sigmoid shaped curve (Peleg 1995). This model is also useful with microbial
inactivation data that spans several log cycles of inactivation (Peleg 1995). Peleg (1995)
tested the Fermi’s kinetic model using published data of the inactivation of L. brevis, S.
cerevisiae, S. aureus, Candida albicans, L monocytogenes I, and P. aeruginosa by PEF.
The testing the model with published data showed very good fits (R2 = 0.973 – 0.999).
Sensory and others (1997) shows that the inactivation of S. dublin in skim milk by
PEF followed the Fermi’s kinetic model (R2 = 0.97-0.98).
The log-logistic kinetic model was proposed by Cole and others (1993). This
model has been applied to lethal agents other than PEF, such as heat and chemicals. The
log-logistic kinetic model is currently studied with PEF inactivation kinetics. Survival

21
curves of S. senftenberg that covered 6-7 log cycles were modeled by the log-logistic
kinetic model (Raso and others 2000). Raso and others (2000) reported that the
experimentally measured inactivation and the estimated inactivation from the kinetic
model showed a very good agreement (R2 = 0.99).
INACTIVATION OF ENZYMES BY PEF
Mechanism
The effects of electric fields on proteins include the association or dissociation of
functional groups, movements of charged chains, and changes in alignment of helices
(Tsong and Astunian 1986).
The conformational changes of enzymes have been suggested as the mechanism
of enzyme inactivation by PEF. Castro and others (2001b) observed that alkaline
phosphatase molecules treated with PEF at 22.3 kV/cm with a pulse width of 0.78 ms
tended to associate and aggregate. The aggregates might be formed by the polarization
created by electrical charges of dipoles on the enzyme. They proposed the polarization
leading to aggregation of the enzyme as the mechanism of enzyme inactivation by PEF.
Castro and others (2001b) also suggested another possible mechanism of the
inactivation of alkaline phosphatase by PEF. They found that PEF preferentially
increased accessibility of aliphatic hydrophobic regions of alkaline phosphatase. The
aliphatic amino acids of alkaline phosphatase are originally buried inside the alkaline
phosphatase, which makes an important contribution to the maintenance of the native
globular structure. When alkaline phosphatase was exposed to PEF, some aliphatic

22
amino acids of alkaline phosphatase moved from the hydrophobic interior to the
hydrophilic surface of the alkaline phosphatase, which resulted in alkaline phosphatase
unfolding.
Yeom and others (1999) worked on the inactivation of papain by PEF. They
reported that oxidation of papain active site is not the major cause of papain inactivation
by PEF. They demonstrated the differences in secondary structures of PEF treated papain
and untreated papain using circular dichroism (CD) analysis. The inactivation of PEF
treated papain was related to the loss of α-helical structure.
Critical factors
The factors that mainly influence PEF enzymatic inactivation are (1) electric
parameters, (2) enzymatic structure, (3) PEF treatment temperature, and (4) suspension
medium (Yeom 2001).
Vega-Mercado and others (1995a) reported that the reduction of enzyme activity
was related to both electric field strength and number of pulses. Ho and others (1997)
suggested that pulse width and pulse waveform might be more important than the electric
field strength in the reduction of enzyme activity.
Min and Zhang (2002a) studied the effect of electric field strength on the
inactivation of tomato juice lipoxygenase (LOX) by PEF treatment with 22 J of energy
input. Three treatment conditions were selected to provide an identical level of energy
input (22 J) to tomato juice, but with different levels of electric field strength. The
temperature change was controlled to 25 °C for the all three PEF treatments. They found
that the LOX inactivation (%) values were 4.7, 46.3, and 60.0% when the values of

23
electric field strength of PEF treatments were 9.0, 17.8, and 30.1 kV/cm, respectively.
The inactivation of tomato juice LOX by PEF increased as the electric field strength
increased with the same level of energy input. Electric field strength was a primary
variable for the inactivation of tomato juice lipoxygenase by PEF (Min and Zhang 2002a).
The enzymatic structure was suggested as a critical factor determining the
efficiency of PEF treatment on the inactivation of enzymes. Ho and others (1997)
proposed that the differences in the secondary or tertiary structure among enzymes result
in the diverse sensitivity of enzymes to PEF. Yeom and others (1999) described that α-
helical structure is susceptible to conformational change by high elelctric fields due to its
dipole moment.
The effects of PEF treatment temperature on the inactivation of enzyme were
reported. Yeom and others (2002) reported a synergistic effect between PEF treatment
and moderate treatment temperature (50 °C) on the inactivation of orange PME. Min and
Zhang (2002a) measured residual activity values of tomato juice LOX after PEF
treatments, which had the same treatment condition other than PEF treatment temperature.
The PEF treatment at 50 °C achieved the 47% higher inactivation of tomato juice LOX
than the PEF treatment at 10 °C.
The effects of suspension medium on the inactivation of enzyme were reported by
Vega-Mercado and others (2001). They reported that casein protected protease against
PEF. They proposed that protease is protected from PEF-induced unfolding by the
presence of casein.

24
Inactivation of enzymes by PEF
An overview of the inactivation of enzymes by PEF treatment is shown in
Table 1.2. Vega-Mercado and others (1995a) reported a 90% reduction of plasmin (milk
alkaline protease) activity in a simulated milk ultrafiltrate after a PEF treatment at 45
kV/cm with 50 pulses. The authors suggested synergistic effects among the electric field
strength, the number of pulses, and the PEF treatment temperature on the inactivation of
plasmin by PEF. The activity of PEF treated plasmin was not restored after 24 h of
storage at 4 °C.
Grahl and Markl (1996) studied the effect of PEF on the inactivation of lipase,
lactoperoxidase, and alkaline phosphatase in raw milk. The inactivation of lipase,
peroxidase, and alkaline phosphatase were 65%, 25%, and < 5%, respectively, after a
PEF treatment at 21.5 kV/cm with 400 kJ/L. They found that a higher fat content of the
milk provide a higher protection effect against PEF to alkaline phosphatase.
Castro and others (2001a) reported that the activity of alkaline phosphate was
reduced by 65% in modified simulated milk ultrafiltrate (MSMUF) and by 59% in raw
milk and pasteurized and homogenized 2% milk after a PEF treatment at 18.8-22.3
kV/cm.
Ho and others (1997) treated lipase, glucose oxidase, α-amylase, peroxidase,
polyphenol oxidase, and phosphatase with PEF. Lipase, glucose oxidase, and heat stable
α-amylase exhibited a large reduction in activity from 75% to 85%. Peroxidase and
polyphenol oxidase were inactivated by 30-40%. Alkaline phosphatase was reduced by
5%. PEF treatment at 21.5 kV/cm with 400 kJ/L. They found that a higher fat content of
the milk provide a higher protection effect against PEF to alkaline phosphatase.

25
Source Enzyme Medium PEF system PEF treatment condition Reduction (%)
Hamilton and Sale (1967)
NADH dehydrogenase, succinic dehydrogenase,
hexokinase, acetylcholinesterase,
lipase, α-amylase
• NADH dehydrogenase, succinic dehydrogenase, hexokinase: extract of
pulse treated E. coli 8196 • Acetylcholinesterase:
bovine erythrocytes
Carbon electrode, polyethylene spacer with air contact
Pulse length: 20 µs, 1 Hz • NADH dehydrogenase, succinic
dehydrogenase, hexokinase: 20 – 25 kV/cm
• lipase, α-amylase: up to 30 kV/cm
No inactivation
Castro (1994) Alkaline phosphatase Simulated milk
ultrafiltrate (SMUF), raw milk, 2% milk
Gene electoporator (Kodak), disposable cuvette with air
contact, electrode gap: 0.1 cm
Exponential decay wave, 1/15 Hz, • Alkaline phosphatase in SMUF: 22.3
kV/cm, 0.74 ms of pulse width, 70 pulses • Alkaline phosphatase in raw milk or 2% milk: 18.8 kV/cm, 0.4 ms of pulse width,
70 pulses
• Alkaline phosphatase in modified SMUF: 65% • Alkaline phosphatase in raw milk or 2% milk: 59%
Vega-Mercado and
others (1995a) Plasmin SMUF A continuous flow chamber, two parallel stainless steel
electrodes
30 or 45 kV/cm, 2 µs of pulse width, 50 pulses, 0.1 Hz 90%
Vega-Mercado and others (1995b)
Proteases from Pseudomonas
fluorescens
Tryptic Soy Broth/Yeast Extract (0.6%) media
Pilot plant scale pulse generator 20 or 35 kV/cm, 10 or 20 pulses
20 kV/cm, 10 pulses: 25% 20 kV/cm, 20 pulses: 50% 35 kV/cm, 10 pulses: 60% 35 kV/cm, 20 pulses: 70%
Grahl and Markl (1996)
Lipase, peroxidase, alkaline phosphatase,
lactoperoxidase Raw milk
High voltage pulse generator with 5-15 kV d.c., Two plain
parallel carbon electrodes, electrode gap: 0.5 cm
21.5 kV/cm, 1 – 22 Hz, Energy input (Q) = 400 (kJ/L)
Lipase: 65% Peroxidase: 25%
Alkaline phosphatase: < 5% Lactoperoxidase: 0%
continued
Table 1.2: Overview of the inactivation of enzymes by PEF treatment
25

26
Table 1.2 continued
Ho and others (1997)
Peroxidase, Alkaline phosphatase, α-amylase,
lipase, lysozyme, glucose oxidase,
polyphenol oxidase, pepsin
Buffer solution or deionized water
High voltage pulse generator with ≤ 30 kV d.c., batch circular shape treatment
chamber, Two circular and parallel stainless steel
electrodes, electrode gap: 0.3 cm
2 µs of pulse width, 30 of number of pulses, 0.5 Hz
• Peroxidase: 73.3 kV/cm • Alkaline phosphatase: 83.3 kV/cm • α-amylase: 80 kV/cm • Lipase: 88 kV/cm • Lysozyme: 13.3, 50 kV/cm • Glucose oxidase: 50 kV/cm • Polyphenol oxidase: 50 kV/cm • Pepsin: 40 kV/cm
• Peroxidase: 30% • Alkaline phosphatase: 5% • α-amylase: 85% • Lipase: 85% • Lysozyme: 13.3kV/cm: 60%, 50 kV/cm: 10% • Glucose oxidase: 75% • Polyphenol oxidase: 40% • Pepsin: 150% increase
Yeom and others (1999) Papain 1 mM EDTA solution
Co-field flow tubular PEF treatment chamber, stainless
steel electrode, electrode gap: 0.2 cm
50 kV/cm, 4 µs of pulse width, 1500 Hz, 10 °C
• With activators (L-Cys and DTT): 50%
• Without activators: 90%
Barsotti and others (2002) Lactate dehydrogenase 100 mM potassium
phosphate buffer, pH 7
Batch, stainless steel electrodes, electrode gap: 0.5 cm, volume 5.7 mL
31.6 kV/cm, 0.96 µs of pulse width, 1.1 Hz, 200 of number of pulse, 30 °C,
exponential decay No inactivation
Giner and others (2000)
Pectin methyl esterase (PME) Tomato Gene electroporator
(Bio-Rad Laboratories) 24 kV/cm, 800 µs of treatment time,
exponential decay 93.8%
a pps: Pulses Per Second continued
26

27
Table 1.2 continued
Yeom and others (2000) PME Orange juice
Pilot plant scale system, co-field flow tubular PEF
treatment chamber, stainless steel tubular electrode, electrode gap: 1.0 cm
35 kV/cm, 59 µs of treatment time, 1.4 µs of pulse width, 600 ppsa, 98 L/h 88%
Yeom and others (2002b) PME Orange juice
Co-field flow tubular PEF treatment chamber, stainless
steel electrode, electrode gap: 0.2 cm
20-35 kV/cm, 2.0 or 2.2 of pulse width, 700 pps, 0.42, 0.31 mL/s 90%
Min and others (2002b) Lipoxygenase Tomato juice
Commercial scale system, co-field flow tubular PEF
treatment chamber, boron carbite tubular electrodes,
electrode gap: 1.27 cm
40 kV/cm, 57 µs of treatment time, 2 µs of pulse width, 1000 pps, 500 L/h 54%
Min and Zhang (2002a)
Lipoxygenase Tomato juice Co-field flow tubular PEF
treatment chamber, electrode gap: 0.292 cm
30 kV/cm, 60 µs of treatment time, 3 µs of pulse width, 1 mL/s, 50 °C 88.1%
27

28
Castro and others (2001a) reported that the activity of alkaline phosphate was reduced by
65% in modified simulated milk ultrafiltrate (MSMUF) and by 59% in raw milk and
pasteurized and homogenized 2% milk after a PEF treatment at 18.8-22.3 kV/cm.
Ho and others (1997) treated lipase, glucose oxidase, α-amylase, peroxidase,
polyphenol oxidase, and phosphatase with PEF. Lipase, glucose oxidase, and heat stable
α-amylase exhibited a large reduction in activity from 75% to 85%. Peroxidase and
polyphenol oxidase were inactivated by 30-40%. Alkaline phosphatase was reduced by
5%.
Yeom and others (1999) inactivated papain in a 1mM EDTA solution by a PEF
treatment at 50 kV/cm at 10 °C. A linear relationship between residual activity and
electric field strength was observed.
Vega-Mercado and others (2001) reported a 70% inactivation of the extracellular
protease from P. fluorescens by PEF at 35 kV/cm with 20 pulses. Giner and others
(2000) achieved 94% reduction of PME activity by a PEF treatment at 24 kV/cm for 8 ms.
Yeom and others (2000) observed that a pilot plant scale PEF treatment at 35 kV/cm for
59 µs inactivated 88% PME activity in orange juice. Yeom and others (2002) reported
that a PEF treatment at 25 kV/cm at 50 °C reduced 90% activity of pectin methyl esterase
(PME) in orange juice.
Min and Zhang (2002a) observed that a PEF treatment at 30 kV/cm for 60 µs at
50 °C inactivated 88.1% of tomato juice lipoxygenase. They found that the first-order
kinetic models, the Hulsheger’s model, and the Fermi’s model adequately described the
LOX inactivation by PEF. Calculated D-values for tomato LOX were 161.0, 112.9,

29
101.0, and 74.8 µs at 15, 20, 30, and 35 kV/cm at 30 °C, respectively. Min and others
(2002b) reported that a commercial scale PEF treatment at 40 kV/cm for 57 µs reduced
53 % activity of lipoxygenase in a cold break tomato juice.
The issue of the inactivation of enzymes by PEF is controversial (Yeom and
Zhang 2001a). The diversity of employed PEF systems, such as PEF treatment chamber
design, limits the comparability among inactivation data. The comparison of data from
enzyme inactivation research needs careful consideration on different PEF systems that
may influence enzyme activity differently. While conventional thermal processing
reduces the activity of many enzymes to a large extent, PEF processing is unlikely to
have a similar effect to the thermal treatment (Lelieveld and others 2001).
SENSORY AND NUTRITIONAL PROPERTIES OF PEF TREATED JUICES
Thermal treatment has been widely used to inactivate spoilage & pathogenic
microorganisms and enzymes to extend shelf life of juice products. However, thermal
treatment can lower the sensory and nutritional qualities of juices (Chen and others 1993).
PEF has been intensively studied as a nonthermal agent to inactivate microorganisms in
foods while reducing the loss of flavor, color, and nutrients of juices from heat (Mertens
and Knorr 1992; Dunn 2001).
Orange juice. Conventional orange juice pasteurization either by high temperature short
time (HTST) or ultra high temperatures (UHT) causes significant loss of fresh flavor,
vitamin C, and color (Braddock 1999). Qiu and others (1998) reported that a PEF
treatment at 29.5 kV/cm for 60 µs retained more volatile flavors and vitamin C of orange

30
juice than a thermal treatment at 90 °C for 15 s while providing microbial stability for > 1
year at 4 °C. The PEF treatment reduced 5-9% volatile flavor compounds while the
thermal treatment reduced 25% volatile compounds compared to 100% of freshly
squeezed orange juice. After 90 d of storage at 4 °C, vitamin C content of the PEF
treated orange juice was 68% while that of the thermally treated orange juice was 46%
compared to 100% of freshly squeezed orange juice.
Sharma and others (1998) reported a PEF treatment at 32 kV/cm for 92 µs
reduced the yeast & mold count of a whey protein fortified orange juice by 3.5 log cycles.
The whey protein fortified orange juice treated by the PEF treatment contained more its
natural color than the orange juice thermally treated at 71 °C for 25 s. They also reported
that the PEF treatment caused less protein denaturation and higher retention of vitamin C
in the orange juice than the thermal treatment. The PEF treatment denatured 6-7% whey
protein in the protein fortified orange juice while the thermal treatment denatured 55% of
the whey protein.
Jia and others (1999) reported that a PEF treatment at 30 kV/cm for 240 µs was as
effective as a thermal treatment at 90 °C for 1 min in reducing the total aerobic plate
count and the yeast & mold count. The % reductions of total flavor compounds after the
PEF treatment and after the thermal treatment were 3% and 22%, respectively. The
concentration of ethyl butyrate in orange juice was decreased by 9.7% and 22.4% after
the PEF treatment and the thermal treatment, respectively. Decanal was not reduced by
the PEF treatment while 41% of decanal was reduced by the thermal treatment.

31
Yeom and others (2000b) compared the microbial stability, sensory properties,
and vitamin C contents of orange juice treated by a pilot plant scale PEF system at 35
kV/cm for 59 µs with those of thermally treated orange juice at 94.6 °C for 30 s. Both
PEF and thermal treatments provided microbial stability at 4, 22, and 37 °C for 112 d.
The PEF treated orange juice contained significantly higher concentrations of vitamin C
and flavor compounds than the thermally treated orange juice during storage at 4 °C. The
PEF treated orange juice had lower browning index, higher whiteness (L), and higher hue
angle values than the thermally treated orange juice during storage at 4 °C.
Min and others (2002a) compared the concentrations of vitamin C and volatile
flavor compounds of tomato juice processed PEF at 40 kV/cm for 97 µs with those of
tomato juice thermally processed at 90 °C for 90 s. Both PEF treatment and thermal
treatment inactivated 6 log cycles of aerobic microorganisms and yeasts & molds. The
PEF treatment did not change the concentration of vitamin C significantly while the
thermal treatment reduced 19% of vitamin C. Orange juice processed by the commercial
scale PEF system retained more vitamin C than thermally treated orange juices at 4 °C
for 84 d. Squires and Hanna (1979) reported that orange juice should contain at least 25
mg of vitamin C per 100 mL at the time of expiration date to provide 100% of the U.S.
Recommended Daily Allowances (USRDA) requirement. The concentration of vitamin
C in the PEF treated orange juice decreased to 25 mg/100 mL at 4 °C after 56 d, which is
longer than the 42 d of thermally treated orange juice. The PEF treated orange juice
retained more fresh flavor compounds of α-pinene, octanal, d-limonene, and decanal than

32
the thermally treated orange juice. The PEF treatment decreased 12% myrcene while the
thermal treatment reduced 37% myrcene compared to 100% of freshly squeezed orange
juice.
Apple juice. Qin and others (1995b) reported that a PEF treated apple juice had sensory
characteristics similar to those of freshly squeezed apple juice. Panels could not find
significant differences in sensory properties between the PEF treated apple juice and
freshly squeezed apple juice.
Vega-Mercado and others (1997) reported that PEF treated apple juice showed no
significant changes in physicochemical and sensory properties during the storage at room
temperature for 8 wk.
Evrendilek and others (2000) studied effects of a PEF treatment at 35 kV/cm for
94 µs on the shelf life extensions of apple juice and apple cider. The PEF treatment
reduced 4.5 log cycles of E. coli O157:H7 in the apple juice. They reported that the PEF
treatment did not change the concentration of vitamin C. They conducted a paired
preference test to determine if there is any difference in the sensory properties between
the PEF treated and untreated apple cider samples. The results of the test indicated that
the acceptability of fresh apple juice is not affected by the PEF treatment.
Cranberry juice. Jin and Zhang (1999) studied effects of a PEF treatment on the shelf
life of cranberry juice. They used a PEF treatment at 40 kV/cm for 150 µs, which
reduced the total aerobic plate count and the yeast & mold count of cranberry juice by
about 5 log cycles. They reported that cranberry juice collected immediately after the
PEF treatment showed similar flavor profiles as the untreated cranberry juice. No
significant differences were observed in the content of anthocyanin and L values between

33
PEF treated cranberry juice and untreated cranberry juice. A thermal treatment at 90 °C
for 90 s significantly altered overall flavor profiles and reduced the anthocyanin pigment
content of cranberry juice.
Tomato juice. Min and others (2002b) studied effects of a PEF treatment by a
commercial scale PEF system on the quality of tomato juice. Tomato juice was prepared
by hot break at 88 °C for 2 min and then treated by PEF at 40 kV/cm for 57 µs or treated
thermally at 92 °C for 90 s. The PEF treated tomato juice retained more vitamin C than
thermally treated juice at 4 °C for 42 d. The flavor compounds of trans-2-hexenal, 2-
isobutylthiazole, cis-3-hexanol were retained more in the PEF treated tomato juice than in
the thermally treated or untreated tomato juice during storage at 4 °C for 112 d. The
browning index and the concentration of 5-hydroxymethyl-2-furfural of the PEF treated
juice were significantly lower than those of the thermally treated or untreated tomato
juice during storage at 4 °C for 112 d. No significant differences were observed in the
concentration of lycopene, Brix, pH, and viscosity between the PEF treated and the
thermally treated tomato juices during storage at 4 °C for 112 d. Sensory evaluations
indicated that the PEF treated tomato juice had higher flavor intensity and overall
acceptability than the thermally treated tomato juice.

34
PACKAGING ISSUES
Success in extending shelf life of an initially high quality food would depend on
food packaging. Aseptic food packaging is effective for producing shelf stable food
products that have quality advantages over their conventionally processed products
(Barbosa-Canovas and others). Qin and others (1995b) mentioned the effectiveness of
aseptic food packaging to extend shelf life of PEF treated foods.
Plastics and paper-laminated materials are widely used as packaging materials for
aseptic food packaging. A proper packaging material needs to be selected to extend the
initial high quality of flavor, color, and nutrients of PEF treated foods. Ayhan and others
(2001) investigated the effects of packaging materials on the quality of orange juice
treated by a pilot plant scale PEF system at 35 kV/cm for 59 µs. The PEF treated orange
juice was filled into four different packaging materials, sanitized glass, polyethylene
terephthalate (PET), high-density polyethylene (HDPE), and low density polyethylene
(LDPE) bottles inside a sanitized glove box. They reported that glass bottles and PET
bottles were effective to keep flavor compounds, vitamin C, and color of PEF treated
orange juice during storage at 4 °C for 112 d. The concentrations of vitamin C in glass
bottles and PET bottles were higher than the concentrations of vitamin C in HDPE bottles
or LDPE bottles during storage at 4 °C for 112 d. Polyethylene (PE) has a low barrier
property to oxygen (Baner 1999). Vitamins and the flavor compounds were labile in
polyethylene (HDPE, LDPE) bottles, which might be due to the low barrier property of
polyethylene to oxygen. Packaging materials with low transmission rate of oxygen may
need to be used for the packaging of PEF treated foods to extend shelf life.

35
The presence of oxygen in the package headspace reduces the shelf life of juice
products (Shaw 1992). Marshall and others (1986) reported greater reduction in vitamin
C levels with higher concentration of oxygen in the headspace. To control oxygen in
headspace, modified atmosphere packaging (MAP) can be applied. The shelf life
extension of foods using modified atmosphere packaging has been reported by many
researchers (Jeon and Lee 1999; Bagorogoza and others 2001; Salvador and others 2002).
The modification of atmosphere can be achieved by removing air or replacing air with a
controlled mixture of gases (Robertson 1993). Nitrogen is frequently used as a filler gas
in modified atmosphere packaging to reduce the concentration of other gases in the
packaging material or headspace (Robertson 1993). Modified atmosphere packaging can
be used to extend shelf life of PEF treated foods by limiting oxygen in headspace.
The degradation of flavor compounds can occur not only by oxidation but also by
the permeation of flavor compounds through packaging materials and the absorption of
flavor compounds into packaging materials. A greater absorption rate is found if the
flavor compound has the similar chemical structure or similar polarity to the functional
group of the packaging material (Landois-Garza and Hotchkiss 1987). As an example,
more d-limonene and α-pinene (volatile flavor compounds of orange juice) are absorbed
more easily in low density polyethylene (LDPE) than polyethylene terephthalate (PET),
polyvinylidene chloride (PVDC), or ethyl vinyl alcohol copolymer (EVOH). LDPE
absorbs more d-limonene and α-pinene than the other materials because the non-polar
hydrocarbon of LDPE has a strong affinity to non-polar terpene hydrocarbons of the
flavor (Sheung 1995). Many researchers have investigated absorption and diffusion
phenomena of flavor compounds of foods with various food packaging materials (Baner

36
and others 1991; Ikegami and others 1991; Nielsen and others 1992; Van Willige and
others 2000). To reduce the absorption of the fresh flavor compounds of a PEF treated
food, a packaging material with low diffusivity and solubility for the fresh flavor
compounds would be used.
CONCLUSION
PEF treatment has been studied as a nonthermal food preservation method. Many
publications report that PEF treatment significantly increased shelf life of foods while
reducing the loss of flavor, color, and nutrients of foods. PEF treatment system was
scaled up to commercial processing scale. Commercial scale PEF processing extended
the shelf life of juice products successfully. The initial high fresh qualities of PEF treated
juice products may be extended over time by selecting proper juice packaging materials
and methods.
REFERENCES
Ababouch LH, Grimit L, Eddafry R, Busta FF. 1995. Thermal inactivation kinetics of
Bacillus subtilis spores suspended in buffer and oils. J Appl Bacteriol 78:669-676.
Aronsson K, Lindgren M, Johansson B, Ronner U. 2001. Inactivation of microorganisms
using pulsed electric fields: the influence of process parameters on Escherichia coli,
Listeria innocua, Leuconostoc mesenteroides and Saccharomyces cerevisae. Innov
Food Sci Emerg Technol 2:41-54.

37
Ayhan Z, Yeom HW, Zhang QH, Min DB. 2001. Flavor, color, and vitamin C retention
of pulsed electric field processed orange juice in different packaging materials. J Agric
Food Chem 49:669-674.
Bagorogoza K, Bowers J, Okot-Kotber M. 2001. The effect of irradiation and modified
atmosphere packaging on the quality of intact chill-stored turkey breast. J Food Sci
66(2):367-372.
Baner AL, Kalyankar V, Shoun LH. 1991. Aroma sorption evaluation of aseptic
packaging. J Food Sci 56(4):1051-1054.
Baner AL. 1999. Partition coefficients. In: Piringer OG, Baner AL, editors. Plastic
packaging materials for food. Weinheim, Germany: Wiley-VCH. P 79-95.
Barbosa-Canovas GV, Gongora-Nieto MM, Pothakamury UR, Swanson BG. 1999.
Preservation of foods with pulsed electric fields. San Diego, CA: Academic Press. p 1-
19, 20-46, 47-75, 76-107, 108-155, 156-171.
Barsotti L, Dumay E, Mu TH, Diaz MDF, Cheftel JC. 2002. Effects of high voltage
electric pulses on protein-based food constituents and structures. Trends Food Sci
Technol 12:136-144.
Benz R, Zimmermann U. 1980. Pulse-length dependence of the electrical breakdown in
lipid bilayer membranes. Biochimica et Biophysica Acta 597:637-642.
Braddock RJ. 1999. Single strength orange juices and concentrate. In: Handbook of citrus
by-products and processing technology. New York: Wiley. P 53-83.
Bryant G, Wolfe J. 1987. Electomechanical stress produced in the plasma membranes of
suspended cells by applied electrical fields. J Membrane Biol 96:129-139.

38
Calderun-Miranda ML, Barbosa-Canovas GV, Swanson BG. 1999. Inactivation of
Listeria innocua in skim milk by pulsed electric fields and nisin. Int J Food Microbiol
51:19-30.
Castro AJ. 1994. Pulsed electric field modification of activity and denaturation of
alkaline phosphatase. Ph.D dissertation. Washington State University.
Castro AJ, Swanson BG, Barbosa-Canovas, Zhang QH. 2001a. Pulsed electric field
modification of milk alkaline phosphatase activity. In: Barbosa-Canovas GV, Zhang
QH, editors. Pulsed electric fields in food processing: Fundamental aspects and
applications. Lancaster, PA: Technomic Publishing Company, Inc. P 65-82.
Castro AJ, Swanson BG, Barbosa-Canovas, Dunker AK. 2001b. Pulsed electric field
modification of milk alkaline phosphatase activity. In: Barbosa-Canovas GV, Zhang
QH, editors. Pulsed electric fields in food processing: Fundamental aspects and
applications. Lancaster, PA: Technomic Publishing Company, Inc. P 83-103.
Chang DC, Reese TS. 1990. Changes in membrane structure induced by
electroporation as revealed by rapid-freezing electron microscopy. Biophys J 58: 1-12.
Chen CS, Shaw PE, Parish ME. 1993. Orange and tangerine juices. In: Nagy S, Chen CS,
Shaw PE, editors. Fruit Juice Processing Technology. Auburndale, FL: Agscience. P
110-165.
Cole MB, Davies KW, Munro G, Holyoak CD, Kilsby DC. 1993. A vitalistic model to
describe the thermal inactivation of Listeria monocytogenes. J Industrial Microbiol
12:232-239.

39
Cserhalmi Z, Vidacs I, Beczner J, Czukor B. 2002. Inactivation of Saccharomyces
cerevisiae and Bacillus cereus by pulsed electric fields technology. Innov Food Sci &
Emerg Technol 3:41-45.
Dunn JE. 1995. Pulsed light and pulsed electric field for foods and eggs. Poultry Sci
75:1133-1136.
Dunn JE. 2001. Pulsed electric field processing: An overview. In: Barbosa-Canovas GV,
Zhang QH, editors. Pulsed electric fields in food processing: Fundamental aspects and
applications. Lancaster, PA: Technomic Publishing Company, Inc. P 1-30.
Dunn JE, LaCosta R, Pearlman JS, inventors; Maxwell Laboratories, Inc., assignee. 1987
Sep. 22. Methods and apparatus for extending the shelf life of fluid food products. U.S.
Patent 4,695,472.
Ekasari I, Jongen WMF, Vermunt AEM, Pilnik W. 1998. Measurement of heat load in
orange juices: Use of microbiological methods. Food Technol 42(5):124-128.
Evrendilek GA, Zhang QH, Richter ER. 1999. Inactivation of Escherichia coli O157:H7
and Escherichia coli 8739 in apple juice by pulsed electric fields. J Food Prot 62:793-
796.
Evrendilek GA, Jin ZT, Ruhlman KT, Qiu X, Zhang QH, Richter ER. 2000. Microbial
safety and shelf-life of apple juice and cider processed by bench and pilot scale PEF
systems. Innov Food Sci Emerg Technol 1:77-86.
Fiala A, Wouters PC, van den Bosch E, Creyghton YLM. 2001. Coupled electrical-fluid
model of pulsed electric field treatment in a model food system. Innov Food Sci Emerg
Technol 2(4):229-238.

40
Giner J, Gimeno V, Espachs A, Elez P, Barbosa-Canovas GV, Martin O. 2000. Inhibition
of tomato (Licopersicon esculentum Mill.) pectin methylesterase by pulsed electric
fields. Innov Food Sci & Emerg Technol 1:57-67.
Grahl T, Markl H. 1996. Killing of microorganisms by pulsed electric fields. Appl
Microbiol Biotechnol 45:148-157.
Gupta RP, Murray W. 1988. Pulsed high electric field sterilization. IEEE Pulsed Power
Conf Rec 58-64.
Hamilton WA, Sale AJ. 1967. Effects of high electric fields on microorganisms.
Biochimica et Biophysica Acta 148:789-800.
Harrison SL, Barbosa-Canovas GV, Swanson BG. 1997. Saccharomyces cerevisiae
structural changes induced by pulsed electric field treatment. Lebensm-Wiss u-Technol
30:236-240.
Ho SY, Mittal GS, Cross JD. 1997. Effects of high field electric pulses on the activity of
selected enzymes. J Food Eng 31:69-84.
Hulsheger H, Niemann EG 1980. Lethal effects of high voltage pulses on E. coli K12.
Radiat Environ Biophys 18:281-288.
Hulsheger H, Potel J, Niemann EG. 1981. Killing of bacteria with electric pulses of high
field strength. Radia Environ Biphys 20:53-65.
Hulsheger H, Potel J, Niemann EG. 1983. Electric field effects on bacteria and yeast cells.
Radiat Environ Biophys 22:149-162.
Ikegami T, Nagashima K, Shimoda M, Tanaka Y, Osajima Y. 1991. Sorption of volatile
compounds in aqueous solution by ethylene-vinyl alcohol copolymer films. J Food Sci
56(2):500-509.

41
Jayaram S, Castle GSP, Margaritis A. 1992. Kinetics of sterilization of Lactobacillus
brevis cells by the application of high voltage pulses. Biotechnol Bioengin 40:1412-
1420.
Jeon BS, Lee CY. 1999. Shelf-life extension of American fresh ginseng by controlled
atmosphere storage and modified atmosphere packaging. J Food Sci 64(2):328-331.
Jia M, Zhang QH, Min DB. 1999. Pulsed electric field processing effects on flavor
compounds and microorganisms of orange juice. Food Chem 65:445-451.
Jin ZT, Ruhlman KT, Qiu X, Jia M, Zhang S, Zhang QH. 1998. Shelf-life evaluation of
pulsed electric fields treated aseptically packaging materiald cranberry juice. IFT 1998
Annual Meeting Book of Abstracts, paper no. 34B-10. 70 p.
Jin ZT, Zhang QH. 1999. Pulsed electric field inactivation of microorganisms and
preservation of quality of cranberry juice. J Food Proc Eng 23:481-497.
Kaanane A, Kane D, Labuza TP. 1988. Time and temperature effect on stability of
Moroccan processed orange juice during storage. J Food Sci 53:1470-1473.
Keith WD, Harris LJ, Hudson L, Griffiths MW. 1997. Pulsed electric fields as a
processing alternative for microbial reduction in spice. Food Res Int 30:185-191.
Kinosita K, Tsong TY. 1977. Formation and resealing of pores of controlled sizes in
human erythrocyte membrane. Nature 268(4):438-440.
Kilm M, Nagy S. 1988. An improved method to determine nonenzymatic browning in
citrus juices. J Agric Food Chem 36:1271-1274.
Knorr D, Geulen M, Grahl T, Sitzman W. 1994. Food application of high electric field
pulses. Trends Food Sci Technol 5:71-75.

42
Lado BH, Yousef AE. 2002. Alternative food-preservation technologies: efficacy and
mechanisms. Microbes and Infection 4:433-440.
Landois-Garza J, Hotchkiss JH. 1987. Plastic packaging can cause aroma sorption. Food
Eng 4:39-42.
Lelieveld HLM, Wouters PC, Leon AE. 2001. Pulsed electric field treatment of food and
product safety assurance. In: Barbosa-Canovas, GV, Zhang QH, Tabilo-Munizaga G,
editors. Pulsed electric fields in food processing. Lancaster, PA: Technomic Publishing
Company, Inc. P 259-264.
Lindgren M, Aronsson K, Galt S, Ohlsson T. 2002. Simulation of the temperature
increase in pulsed electric field (PEF) continuous flow treatment chambers. Innov Food
Sci Emerg Technol 3:233-245.
Liu X, Yousef AE, Chism GW. 1997. Inactivation of Escherichia coli O157:H7 by the
combination of organic acids and pulsed electric fields. J Food Safety 16:287-299.
Lubicki P, Cross JD, Jayaram S, Mazurek B, Staroniewicz Z. 1995. Inactivation of
Yersinia enterocolitica gram-negative bacteria using high-voltage pulse technique.
IAS ’95, Conference Record of the 1995 IEEE Industry Applications Conference, 13th
IAS Annual Meeting, 2:1388-1343. IEEE, New York.
Martin-Belloso O, Zhang Q, Castro AJ, Barbosa-Canovas GV, Swanson BG. 1994.
Pulsed electric fields of high voltage to preserve foods: Microbiological and
engineering aspects of the process. Spanish J Food Sci Technol 34:1-34.
Martin O, Qin BL, Chang FJ, Barbosa-Canovas GV, Swanson BG. 1997. Inactivation of
Escherichia coli in skim milk by high intensity pulsed electric fields. J Food Proc Eng
20:317-336.

43
Marshall M, Nagy S, Rouseff RL. 1986. Factors impacting on the quality of stored citrus
fruit beverages. In: Charalambous G, editors. The shelf life of foods and beverages.
Yew York: Elsevier. P 237-254.
McDonald CJ, Lloyd SW, Vitale MA, Petersson K, Innings F. 2000. Effects of pulsed
electric field on microorganisms in orange juice using electric field strengths of 30 and
50 kV/cm. J Food Sci 65(6):984-989.
Mertens B, Knorr D. 1992. Developments of nonthermal processes for food preservation.
Food Technol 46(5):124-133.
Min S, Jin ZT, Yeom HW, Min SK, Zhang QH. 2002a. Effects of commercial scale
pulsed electric field processing on the quality of orange juice. J Food Sci Submitted.
Min S, Jin ZT, Zhang QH. 2002b. Effects of Commercial scale pulsed electric field
processing on the quality of tomato juice. J Agric Food Chem Submitted.
Min S, Laura R, Zhang QH. 2002c. Effects of water activity on the inactivation of
Enterobacter cloacae inoculated in chocolate liquor and a model system. J Food
Process Preserv 26:323-337.
Min S, Zhang QH. 2002a. Inactivation kinetics of tomato juice lipoxygenase by pulsed
electric fields. J Food Sci
Min S, Zhang QH. 2002b. Effects of commercial scale pulsed electric field processing on
flavor and color of tomato juice. J Food Sci
Nielsen TJ, Jagerstad IM, Oste RE, Wesslen BO. 1992. Comparative absorption of low
molecular aroma compounds into commonly used food packaging polymer films. J
Food Sci 57(2):490-492.

44
Peleg M. 1995. A model of microbial survival after exposure to pulsed electric fields. J
Sci Food Agric 67:93-99.
Palaniappan S, Sastry SK. 1991. Electrical conductivity of selected juices: influences of
temperature, solids content, applied voltage, and particle size. J Food Process Eng
14(4):247-260.
Piringer OG. 1999. Partition coefficients. In: Piringer OG, Baner AL, editors. Plastic
packaging materials for food. Weinheim, Germany: Wiley-VCH. P 239-285.
Pothakamury UR, Monsalve-Gonzalez A, Barbosa-Canovas GV, Swanson BG. 1995a.
Inactivation of Escherichia coli and Staphylococcus aureus in model food systems by
pulsed electric field technology. Food Res Int 28(2):167-171.
Pothakamury UR, Vega H, Zhang Q, Barbosa-Canovas GV, Swanson BG. 1996. Effect
of growth stage and processing temperature on the inactivation of E. coli by pulsed
electric fields. J Food Prot 59:1167-1171.
Qin BL, Zhang Q, Barbosa-Canovas GV, Swanson BG, Pedrow PD. 1994. Inactivation of
microorganisms by pulsed electric fields with different voltage wave-forms. IEEE
Trans Dielec Electric Insul 1(6):1047-1057.
Qin BL, Chang FJ, Barbosa-Canovas GV, Swanson BG. 1995a. Nonthermal inactivation
of Saccharomyces cerevisiae in apple juice using pulsed electric fields. Lebensm Wiss
u Technol 28:564-568.
Qin BL, Pothakamury UR, Vega H, Martin O, Barbosa-Canovas GV, Swanson BG.
1995b. Food pasteurization using high intensity pulsed electric fields. Food Technol
49(12):55-60.

45
Qin BL, Zhang Q, Barbosa-Canovas GV, Swanson BG, Peedrow PD. 1995c. Pulsed
electric field treatment chamber design for liquid food pasteurization using the finite
element method. Trans ASAE 38:557-565.
Qiu X, Sharma S, Tuhela L, Jia M, Zhang QH. 1998. An integrated PEF pilot plant for
continuous nontheraml pasteurization of fresh orange juice. Trans ASAE. 41:1069-
1074.
Raso J, Calderon ML, Gongora M, Barbosa-Canovas GV, Swanson BG. 1998a.
Inactivation of mold ascospores and conidiospores suspended in fruit juices by pulsed
electric fields. Lebensm Wiss u Technol 668-672.
Raso J, Calderon ML, Gongora M, Barbosa-Canovas GV, Swanson BG. 1998b.
Inactivation of Zygosaccharomyces bailii in fruit juices by heat, high hydrostatic
pressure and pulsed electric fields. J Food Sci 63:1042-1044.
Raso J, Alvarez I, Condon S, Trepat FJS. 2000. Predicting inactivation of Salmonella
senftenberg by pulsed electric fields. Innov Food Sci Emerg Technol 1:21-29.
Reina LD, Jin T, Zhang QH, Yousef AE. 1998. Inactivation of Listeria monocytogenes in
milk by pulsed electric field. J Food Prot 61:1203-1206.
Robertson GL. 1993. Food Packaging: principles and practice. New York: Marcel Dekker.
P 9-62, 318-321.
Rodriguez-Amaya DB. 1993. Stability of carotenoids during the storage of foods. In
Developments in food science 33. New York: Elsevier. P 591-628.
Ruan S. 2000. Particle engineering of polyimide composites. Master Thesis. The Ohio
State University, Columbus, OH.

46
Ruhlman KT, Jin ZT, Zhang QH. 2001. Physical properties of liquid foods for pulsed
electric field treatment. In: Barbosa-Canovas GV, Zhang QH, editors. Pulsed electric
fields in food processing: Fundamental aspects and applications. Lancaster, PA:
Technomic Publishing Company, Inc. P 45-56.
Sale AJH, Hamilton WA. 1967. Effects of high electric fields on microorganisms. I.
Killing of bacteria and yeasts. Biochim Biophys Acta 148:781-788.
Sale AJH, Hamilton WA. 1968. Effects of high electric fields in microorganisms. III.
Lysis of erythrocytes and protoplasts. Biochim Biophys Acta 163:37-43.
Salvador ML, Jaime P, Oria R. 2002. Modeling of O2 and CO2 exchange dynamics in
modified atmosphere packaging of Burlat cherries. J Food Sci 67(1):231-235.
Sensoy I, Zhang QH, Sastry SK. 1997. Inactivation kinetics of Salmonella Dublin by
pulsed electric field. J Food Process Eng 20:367-381.
Sharma SK, Zhang QH, Chism GW. 1998. Development of a protein fortified fruit
beverage and its quality when processed with pulsed electric field treatment. J Food
Qual 21:459-473.
Shaw PE. 1986. The flavour of nonalcoholic fruit beverages. In Morton ED, Macleod AJ,
editors. Food flavours. Part B. The flavour of beverages. Amsterdam, The Netherlands:
Elsevier. P 337-368.
Shaw PE. 1992. Shelf life and aging of citrus juices, juice drinks and related soft drinks.
In: Redd JB, Shaw PE, Hendrix Jr. CM, Hendrix DL, editors. Quality control manual
for citrus processing plants. Auburndale, FL: Agscience. P 173-199.
Sheung SK. 1995. Sorption of orange juice flavor compounds into polymeric packaging
materials. Master Thesis. The Ohio State University, Columbus, OH.

47
Squires SR, Hanna JG. 1979. Concentration and stability of vitamin C in marketed
reconstituted orange juice. J Agric Food Chem 27:639-641.
Stanley DW. 1991. Biological membrane deterioration and associated quality losses in
food tissues. In: Clydesdale FM, editor. Critical reviews in food science and nutrition.
vol 30. New York: CRC Press. P 487-553.
Thakur BR; Singh RK; Nelson PE. 1996. Quality attributes of processed tomato products:
A rev. Food Rev Int 12:375-401.
Tsong TY. 1991. Electroporation of cell membranes. Biophys J 60:297-306.
Tsong TY, Astunian RD. 1986. Absorption and conversion of electric field energy by
membrane bound ATPases. Bioelectrochem Bioenerg 15:457-476.
Van Willige RWG, Linssen JPH, Voragen AGJ. 2000. Influence of food matrix on
absorption of flavor compounds by linear low-density polyethylene: proteins and
carbohydrates. J Sci Food Agric 80:1779-1789.
Vega-Mercado H, Powers JR, Barbosa-Canovas GV, Swanson BG. 1995a. Plasmin
inactivation with pulsed electric fields. J Food Sci 60(5):1143-1146
Vega-Mercado H, Powers JR, Barbosa-Canovas GV, Swanson BG, Luedecke L. 1995b.
Inactivation of a protease from Pseudomonas fluorescens M3/6 using high voltage
pulsed electric fields. IFT 1995 Annual Meeting. Book of Abstracts, paper no. 89-3.
267 p.
Vega-Mercado H, Pothakamury UR, Chang FJ, Barbosa-Canovas GV, Swanson BG.
1996. Inactivation of Escherichia coli by combining pH, ionic strength and pulsed
electric fields hurdles. Food Research International 29:117-121.

48
Vega-Mercado H, Qin BI, Belloso OM, Chang FJ, Ma I, Barbosa-Canovas GV, Swanson
BG. 1997. Nonthermal food preservation by pulsed electric fields. In Jowitt R, editor.
Proceedings of ICEF 7. UK: Academic Press. P C81-C84.
Vega-Mercado H, Powers JR, Martin-Belloso O, Luedecke L, Barbosa-Canovas,
Swanson BG. 2001. Change in susceptibility of proteins to proteolysis and the
inactivation of an extracellular protease from Pseudomonas fluorescens M3/6 when
exposed to pulsed electric fields. In: Barbosa-Canovas GV, Zhang QH, editors. Pulsed
electric fields in food processing: Fundamental aspects and applications. Lancaster, PA:
Technomic Publishing Company, Inc. P 105-120.
Wouters PC, Alvarez I, Raso J. 2001a. Critical factors determining inactivation kinetics
by pulsed electric field food processing. Trends Food Sci Technol 12:112-121.
Wouters PC, Bos AP, Ueckert J. 2001b. Membrane permeabilization in relation to
inactivation kinetics of Lactobacillus species due to pulsed electric fields. Appl Environ
Microbiol 67:3092-3101.
Yeom HW, Zhang QH, Dunne CP. 1999. Inactivation of papain by pulsed electric fields
in a continuous system. Food Chem 67:53-59.
Yeom HW, Streaker CB, Zhang QH, Min DB. 2000a. Effects of pulsed electric fields in
the activity of microorganisms and pectin methyl esterase in orange juice. J Food Sci
65(8):1359-1363.
Yeom HW, Streaker CB, Zhang QH, Min DB. 2000b. Effects of pulsed electric fields on
the quality of orange juice and comparison with heat pasteurization. J Agric Food
Chem 48:4597-4605.

49
Yeom HW, Zhang QH. 2001a. Enzymatic inactivation by pulsed electric fields: A review.
In: Barbosa-Canovas GV, Zhang QH, editors. Pulsed electric fields in food processing:
Fundamental aspects and applications. Lancaster, PA: Technomic Publishing Company,
Inc. p 57-63.
Yeom HW, Evrendilek GA, Jin ZT, Zhang QH. 2001b. Processing of yogurt-based
product with pulsed electric fields. IFT 2001 Annual Meeting Book of Abstracts, paper
no. 28-7. 47 p.
Yeom HW, Zhang QH, Chism GW. 2002. Inactivation of pectin methyl esterase in
orange juice by pulsed electric fields. J Food Sci 67(6):2154-2159.
Yin Y, Zhang QH, Sudhir KS, inventors; The Ohio State University, assignee. 1997 Nov.
25. High voltage pulsed electric field treatment chambers for the preservation of liquid
food products. U.S Patent 5,690,978.
Zhang Q, Monsalve-Gonzalez A, Barbosa-Canovas GV, Swanson BG. 1994a.
Inactivation of E. coli and S. cerevisiae by pulsed electric fields under controlled
temperature conditions. Trans ASAE 37(2):581-587.
Zhang Q, Chang FJ, Barbosa-Canovas GV, Swanson BG. 1994b. Inactivation of
microorganisms in semisolid foods using high voltage pulsed electric fields. Lebensm
Wiss u Technol 27(6):538-543.
Zhang Q, Monsalve-Gonzalez A, Qin BL, Barbosa-Canovas GV, Swanson BG. 1994c.
Inactivation of Saccharomyces cerevisiae in apple juice by square-wave and
exponential decay pulsed electric fields. J Food Process Eng 17:469-478.
Zhang Q, Barbosa-Canovas GV, Swanson BG. 1995a. Engineering aspects of pulsed
electric field pasteurization. J Food Eng 25:261-281.

50
Zhang Q, Qin BL, Barbosa-Canovas GV, Swanson BG. 1995b. Inactivation of E. coli for
food pasteurization by high-strength pulsed electric fields. J Food Process Preserv
19:103-118.
51
CHAPTER 2
Effects of Commercial Scale Pulsed Electric Field Processing on the Quality of
Tomato Juice
ABSTRACT
Effects of commercial scale pulsed electric field (PEF) processing on the quality of
tomato juice were studied and compared with those of thermal processing. Tomato juice
was prepared by hot break at 88 °C for 2 min or cold break at 68 °C for 2 min and then
thermally processed at 92 °C for 90 s or PEF processed at 40 kV/cm for 57 µs. Thermally
processed, PEF processed, and unprocessed control tomato juices were packed into 50
mL sterilized polypropylene tubes in a sanitary glove box and stored at 4 °C for 112 d.
Both thermally and PEF processed juices showed microbial shelf life at 4 °C for 112 d.
The lipoxygenase activities of thermally and PEF processed juices were 0 and 47%,
respectively. PEF processed juice retained more ascorbic acid than thermally processed
juice at 4 °C for 42 d (p<0.05). No significant differences were observed in the
concentration of lycopene, Brix, pH, and viscosity between thermally and PEF processed

52
juices during the storage (p>0.05). Sensory evaluations indicated that PEF processed
juice had higher flavor intensity and overall acceptability than thermally processed juice
(p<0.01).
Key words: Pulsed electric field, thermal processing, tomato juice, shelf life, ascorbic
acid.

53
INTRODUCTION
Tomato is the second-most consumed vegetable around the world (Hayes and
others 1998). Most tomatoes are consumed as processed products such as tomato juice,
paste, puree, ketchup, sauce, and canned tomatoes (Gould 1992). Processed tomato
products are important sources of minerals and vitamins in diets (Thakur and others
1996). Thermal processing is the most common method to extend the shelf life of tomato
juice by inactivating microorganisms and enzymes. Flavor, color, taste, and nutritive
value are considered as the major quality attributes of foods and influence the consumer’s
choice. Thermal processing can lower the sensory and nutritional qualities of foods
(Braddock 1999; Rouseff and Leahy 1995). Therefore, alternative juice processing
methods have been sought for tomato industries to produce higher quality tomato juice.
PEF processing has been extensively studied as a nonthermal food preservation
method (Mertens and Knorr 1992; Dunn 2001). PEF processing is very effective for the
pasteurization of juices due to their high acidity and low protein concentration. The high
acidity of juices retards the growth of bacteria and the germination of bacterial spores
(Raso and others 1998a). A shielding layer of PEF may be formed on the surface of
electrodes when charged molecules including proteins migrate to the surface of
electrodes and monopolar pulses are successively applied (Zhang and others 1995). The
low protein content and use of bipolar pulses may not cause the formation of shielding
layer.

54
Laboratory or pilot plant scale PEF processing has been successfully conducted
and have increased shelf life of juice products, minimizing the loss of flavor, color, and
nutrients of juice products (Evrendilek and others 2000; Jin and Zhang 1999; Qiu and
others 1998; Yeom and others 2000). However, no research has been done with
commercial scale PEF processing. Besides, no information is available about the effects
of PEF on lipoxygenase activity, lycopene, ascorbic acid, physical properties, and
sensory properties of tomato juice. The objectives of this research were (1) to investigate
the effects of commercial scale PEF processing on the inactivation of endogenous
microorganisms in tomato juice and (2) to study and compare the effects of thermal
processing and commercial scale PEF processing on the quality of tomato juice including
the microbial stability, lipoxygenase activity, lycopene content, ascorbic acid content,
particle size distribution, pH, Brix, and viscosity during storage at 4 °C for 112 d and on
the sensory properties of appearance, color, texture, flavor, and overall acceptability.
MATERIALS AND METHODS
Tomatoes
Roma-type Midwest tomatoes were supplied by Hirzel Canning Co. & Farms
(Toledo, OH) throughout the year 2001 tomato season. Tomatoes were processed on the
same day of harvesting.

55
Preparation of tomato juice
The 1,100 kg fresh tomatoes were used to prepare tomato juice. Fresh raw
tomatoes were washed in a soak tank with air agitation and then washed again with 150
psi sprayed water while being conveyed on a roller conveyor. Tomatoes were sorted and
chopped by a mill (Model D, The W. J. Fitzpatrick Co., Chicago, IL) equipped with a
1.91 cm screen. The chopped tomatoes were heated in a tubular heat exchanger (H2187C
type, Specialty Brass Co., Kenosha, WI) for 2 min at 88 °C for hot break and at 68 °C for
cold break. Cold break tomato juice was used only for the study of lipoxygenase activity
during the storage at 4 °C for 112 d. Tomato juice was prepared by a screw type
extractor (CJE-360-D28, Chisholm-Ryder Co., Niagara Falls, NY) with a screen of 1.27
cm diameter.
PEF processing system
The OSU-6 commercial scale PEF processing system is illustrated in Figure 2.1.
The OSU-6 commercial scale PEF processing system consists of an aseptic drink
processor (TetraPak, General-Guisan, Switzerland), a high voltage pulse generator
(Diversified Technology, Inc., Bedford, MA), and co-field tubular PEF chambers (The
Ohio State University, Columbus, OH). The aseptic drink processor monitors and
controls production rates, temperatures, and pressures during PEF processing. The
production rates can be controlled in the range of 400-2000 L/h. The high voltage pulse
generator provides bi-polar squared waveform pulses with a peak voltage of 60 kV and
600 A into multiple PEF chambers. The 60 kV power supplies charge storage
capacitances and these capacitors are partially discharged by a series of solid-state
switches to form the square wave bipolar pulses. The pulse generator operates at a
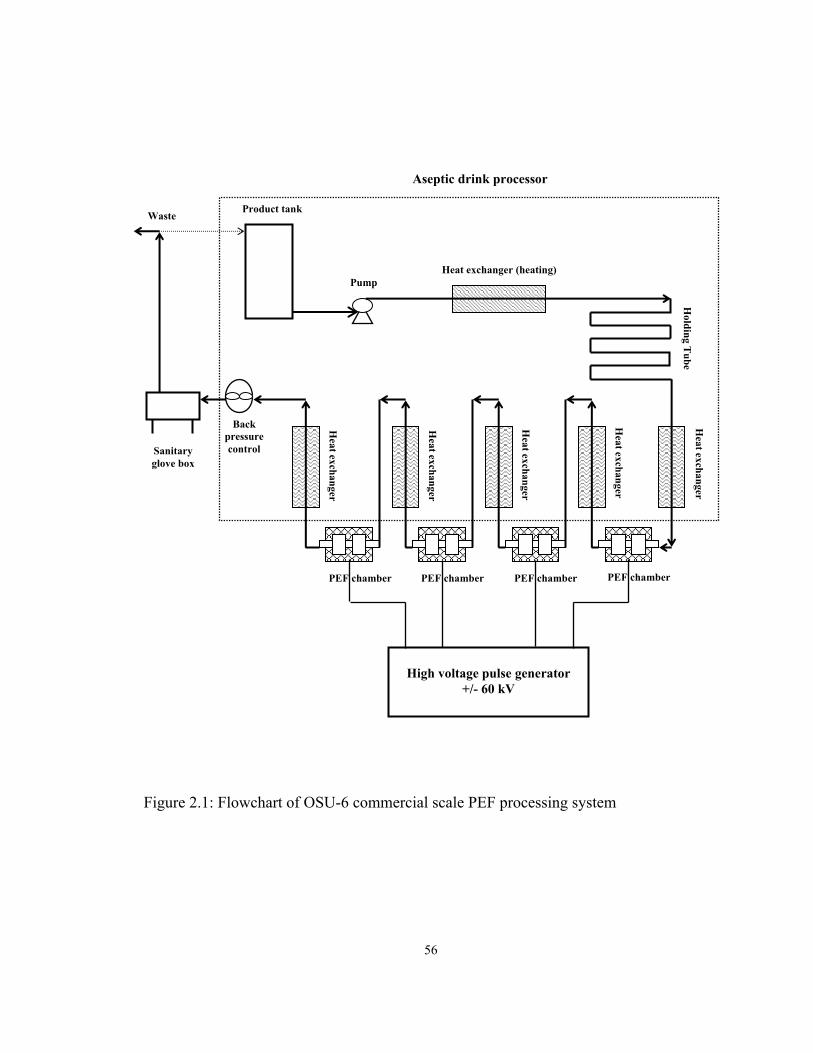
56
Figure 2.1: Flowchart of OSU-6 commercial scale PEF processing system
Heat exchanger (heating)
Product tank
Pump
Back pressure control
PEF chamber
Sanitary glove box
Waste
Heat exchanger
Holding T
ube
High voltage pulse generator
+/- 60 kV
Heat exchanger
Heat exchanger
Heat exchanger
Heat exchanger
PEF chamber PEF chamber PEF chamber
Aseptic drink processor

57
maximum repetition rate of 2000 pulses per second. Pulses were monitored with a high
voltage probe (attenuation factor 10,000:1, VD-60, Northstar, Albuquerque, NM), current
monitors (attenuation factor 100:1, Model 110, Pearson, Palo Alto, CA), and
oscilloscopes (TDS-210, Tektronix, Beaverton, OR). Each co-field tubular PEF chamber
consists of two boron carbite tubular electrodes and a tubular insulator body made of
ceramic (Yin and others 1997). The inner diameter of the cylindrical processing zone is
0.808 cm and the distance between the electrodes is 1.270 cm. The PEF chambers can be
connected up to 8 in parallel for electrical flow and in series for fluid flow. The peak
current through each PEF chamber was 75 A.
Thermally processed, PEF processed, and control tomato juices. Processing
conditions for thermally processed, PEF processed, and control tomato juices are listed in
Table 2.1. The production rate was 500 L/h for all thermally processed, PEF processed,
and control tomato juices. Tomato juice processing was performed in the following
order: Sterilization-in-place (SIP), thermal processing, PEF processing, control
collection, and clean-in-place (CIP).
The entire fluid handling system was sterilized by SIP at 121 °C for 30 min. The
fluid handling system was cooled to 25 °C after SIP.
For thermal processing, tomato juice was held at 92 °C for 90 s in a holding tube
and then cooled to 25 °C by the heat exchanger following the holding tube (Figure 2.1).
PEF remained off throughout thermal processing. The cooled tomato juice was packaged
inside a sanitary glove box (Figure 2.1). The processing mode was switched from
thermal to PEF after 10 min of filling thermally processed tomato juice.

58
Processing parameter
Thermally
processed
tomato juice
PEF
processed
tomato juice
Control
tomato juice
Production rate (L/h) 500 500 500
Electric field strength (kV/cm) 0 40 0
Pulse duration time (µs) 0 2 0
Total PEF treatment time (µs) 0 57 0
Number of PEF chamber 6 6 6
Holding temperature (°C) 92 45 45
Holding time (s) 90 90 90
Temperature change per a pair of PEF
chamber (°C)
0
8
0
Temperature before filling (°C) 25 25 25
Table 2.1: Processing conditions for thermally processed, PEF processed, and control tomato juices

59
PEF processing conditions were the electric field strength of 40 kV/cm, pulse duration
time of 2 µs, and total PEF treatment time of 57 µs. Tomato juice was pumped to the
PEF chambers without thermal processing. Temperature of tomato juice was controlled
at 45 °C before entering each set of PEF chambers. This temperature control was done
by the heat exchangers at the upstream of each set of two chambers (Figure 2.1). PEF
processed tomato juice was cooled to 25 °C prior to packaging inside the sanitary glove
box. After 10 min of filling PEF processed tomato juice, PEF was turned off in
preparation for control collection.
For control tomato juice, tomato juice was passed through the system without
thermal or PEF processing and packaged inside the sanitary glove box.
CIP was conducted after collecting control tomato juice. The entire fluid
handling system was cleaned by circulating an alkaline detergent (0.5%, Super Alkali
850, Chaska Chemical, Savage, MN, U.S.A) at 70 °C for 20 min. The system was cooled
to 40 °C and rinsed with water. The system was cleaned again by circulating an acidic
detergent (0.5%, AC-30-E, Ecolab, Saint Paul, MN, U.S.A) at 70 °C for 20 min. The
system was cooled to 40 °C and rinsed with water. The flow rates for detergents and
water were 2500 L/h.
Packaging and storage
Thermally processed, PEF processed, and control tomato juices were packaged
into the 50 mL sterilized polypropylene tubes (Corning, Acton, MA) inside a sanitary
glove box filling unit (The Ohio State University, Columbus, OH). The glove box was
prepared by following the method of Ayhan and others (2001a). The glove box consisted

60
of a gas-tight stainless steel box with a glass window, a pair of gloves, a double-door
transfer tunnel, a germicidal UV lamp (Cole Parmer, Vernon Hills, IL), and a HEPA air
filter (Fisher Scientific, Pittsburgh, PA). The glove box was sanitized by spraying and
swabbing 35% hydrogen peroxide and lighting germicidal UV at 254 nm with an
intensity of 76 µW/cm2. The HEPA air filter with 0.3 µm pore size and a 1600 cm2
filtration area was installed to supply positive pressure with bacteria-free air inside the
glove box. Each sample tube was covered with aluminum foil to prevent the exposure of
tomato juice to light. Packaged tomato juices were stored at 4 ºC.
Microbial inactivation study
The hot break tomato juice was incubated at 22 ºC for 3 d to let endogenous
microorganisms proliferate. The microbial counts of total aerobic microorganisms and
yeasts & molds were 6.0 log10 CFU/mL and 5.9 log10 CFU/mL, respectively, after the
incubation.
Plate count agar (PCA) and acidified potato dextrose agar (PDA) were used to
enumerate total aerobic plates and yeasts & molds, respectively, in thermally processed,
PEF processed, and control tomato juices. PCA, PDA, and Peptone water were
purchased from Difco (Detroit, MI). PDA was acidified with 10% tartaric acid (Sigma-
Aldrich, St. Louis, MO). Tomato juice was diluted with 0.1% sterile peptone water up to
10-4 dilution and plated by a spiral autoplater (model 3000, Spiral Biotech Inc., Bethesda,
MD). PCA plates were incubated at 30 °C for 48 h. PDA plates were incubated at 22 °C
for 5 d.

61
Shelf life study
Hot break or cold break tomato juice was cooled to 45 °C and thermally
processed or PEF processed without incubation. Cold break tomato juice was used only
for the study of lipoxygenase activity. Thermally processed, PEF processed, and control
tomato juices were packaged and stored at 4 °C. The shelf life study was conducted for
112 d.
Microbial stability. The microbial stability was determined by the same method
as described for the microbial inactivation study. The initial microbial counts of total
microorganisms and yeasts & molds of control were 1.3 log10 CFU/mL and 1.0 log10
CFU/mL, respectively.
Lipoxygenase activity. Lipoxygenase activity was measured by the methods of
Ben-Aziz and others (1970), Smith and others (1997), and Tangwongchai and others
(2000). The 50 g tomato juice was homogenized with 100 mL 0.1 M phosphate buffer
(pH 6.5), containing 1 mM EDTA and 0.1% (w/v) Triton X-100. The homogenate was
filtered through a double layer of cheese cloth and centrifuged at 20000 × g for 40 min at
5 °C. The enzyme solution was prepared by diluting 0.5 mL supernatant with 1.0 mL 0.1
M phosphate buffer (pH 6.5). A substrate solution containing linoleic acid (2.5 × 10⁻³ M)
and Tween 20 (0.2%) was prepared according to Ben-Aziz et al. (1970). The substrate
solution was diluted to 2.5 × 10⁻⁵ M with 0.2 M phosphate buffer (pH 6.5). The 0.1 mL
enzyme solution was pipetted into the cuvette containing 2.4 mL of the substrate solution
at zero time. The absorbance was measured at 234 nm for 3 min at a 15 s interval using a
Spectronic Genesys 5 spectrometer (Milton Roy, Rochester, NY) at 22 °C. The rate of

62
the reaction was automatically computed from the linear portion of the curve. The 1 unit
of lipoxygenase activity was defined as a change of 0.001 units of absorbance per minute
and milliliter of enzyme extract.
Lycopene analysis. A hexane extract was obtained by using the method of
Chandler and Schwartz (1987) with some modifications. The 5.0 g tomato juice was
homogenized in 50 mL methanol (Fisher Scientific, Pittsburgh, PA) with 1.0 g calcium
bicarbonate (Sigma-Aldrich, St. Louis, MO) and 3.0 g Celite (Sigma-Aldrich, St. Louis,
MO). The homogenate was successively extracted with a 50 mL mixture of 1:1
acetone/hexane (v/v, Fisher Scientific, Pittsburgh, PA) and vacuum-filtered through
Whatman paper No. 1 and No. 42 (Whatman International Ltd., UK). The filtrant was
combined in a separatory funnel. Distilled water was added into the separatory funnel to
induce the separation of the hexane layer.
The lycopene in the hexane extract was analyzed by a high-performance liquid
chromatography (HPLC, Series 1100, Hewlett-Packard, Palo Alto, CA). A reversed
phase C18 column (201TP54, Vydac, Holland, MI), a guard column packed with C18
stationary phase (Vydac, Holland, MI), a diode-array detector (HP 1100 DAD,
Wilmington, DE), and an autosampler were used for all separations. The separation was
performed at 1.0 mL/min using a linear gradient of 32 to 53% methyl-tert butyl ether
(Fisher Scientific, Pittsburgh, PA) in methanol for 60 min. HPLC solvents were certified
HPLC grades. The lycopene in tomato juice was quantified from HPLC profile by using
the lycopene standard from tomato (Sigma-Aldrich, St. Louis, MO).

63
Ascorbic acid analysis. The concentration of ascorbic acid in the tomato juice
was measured by the method of Howard and others (1987) using a high-performance
liquid chromatography (HPLC) system (Hewlett Packard, 1050 series, Wilmington, DE).
The HPLC was equipped with an autosampler and a UV-VIS detector set at 254 nm. The
HPLC chromatograph peak area was calculated using a Hewlett-Packard integrator
(HP3396 series II). A reverse phase C18 column (5 µm particle size, 4.6 mm diameter,
250 mm length, Alltech, Deerfield, IL) along with a Hewlett-Packard C18 guard column
was used to separate ascorbic acid. A mixture of methanol and acidified water (10:90,
v/v) was used as a mobile phase. The acidified water was prepared by adding phosphoric
acid (0.01%, v/v, Sigma-Aldrich, St. Louis, MO) to distilled water. The mobile phase
was filtered through a 0.45 µm membrane filter (Micron Separations Inc., Westboro,
MA) and degassed by helium gas before being passed though the column. The flow rate
of mobile phase was 1.0 mL/min. The L-ascorbic acid from Sigma Chemical Co (St.
Louis, MO) in concentrations ranging from 2 to 100 mg/100 mL was used to obtain a
standard calibration curve. Tomato juice was centrifuged at 12535g for 10 min at 22 °C
in a Beckman Microfuge E (Beckman Instruments Inc., Palo Alto, CA) to remove pulp
and coarse particles. The 10 µL supernatant was injected into the column by the HPLC
autosampler.
Particle size distributions. The particle size of tomato juice was analyzed by a
Mastersizer (Malvern Instruments, Inc., Worcs, U.K.). A 10 mL of tomato juice was
diluted with 500 mL distilled water and circulated in the Mastersizer at 2,000 rpm. A
computer equipped with Mastersizer Micropulus 2.15 (Malvern Instruments, Inc., Worcs,
U.K.) recorded distributions of the particle size of tomato juice.
64
The D[4, 3], D[3, 2], D(v, 0.1), D(v, 0.5), and D(v, 0.9) were reported. The
D[4, 3], D[3, 2], and D(v, 0.5) were used for the comparison of particles sizes of
thermally processed, PEF processed, and control tomato juices. The D[4, 3] is the
volume moment mean of particles and defined as the following equation where d is the
diameter of one unit.
D[4, 3] = ∑∑
3
4
dd
The D[3, 2] is the surface area moment mean of particles and determined as:
D[3, 2] = ∑∑
2
3
dd
The D[4, 3] and D[3, 2] are used to measure particles on the basis of volume and surface
area, respectively. The D(v, 0.1) is the size of particle for which 10% of the sample is
below this size. The D(v, 0.5) is the median of the particle size distribution on the basis
of volume. D(v, 0.9) gives a size of particle for which 90% of the sample is below this
size (Malvern Instruments 1995).
Brix and pH. The Brix of tomato juice was measured using a hand-held
refractometer (Fisher, Pittsburgh, PA). The pH of tomato juice was measured using a pH
meter (Orion, 370, Beverly, MA) at 22 °C.
Viscosity. The viscosity of tomato juice was measured by using a Brookfield
viscometer (LVDVII+, Brookfield Engineering Laboratories, Inc., Stoughton, MA) with
a UL adapter. Viscosity was determined at 22 °C and 4 rpm with 16 mL of tomato juice
placed in the UL adapter.

65
Sensory evaluation
Thermally processed and PEF processed tomato juices, stored at 4 °C for 1 week,
were used for the sensory evaluation. The 1 week was needed for Silliker Laboratories
(Columbus, OH) to confirm the absence of pathogen microorganisms, Salmonella spp.,
Listeria monocytogenes, and Escherichia coli O157:H7 in both thermally processed and
PEF processed tomato juices. A 30-member panel participated in the sensory tests. The
panelists consisted of graduate students in the department of Food Science and
Technology at the Ohio State University and members of the food industry. The
panelists were asked to rate the intensity of appearance, color, texture, flavor, and overall
acceptability by marking on a horizontal line corresponding to the amount of the
perceived stimulus. A hedonic scale of 1 to 9 was used for each attribute. The higher
number represents stronger intensity of attributes. Thermally processed and PEF
processed tomato juices were served in randomly numbered plastic cups on a tray with a
cup of water and a piece of non-salted cracker at the beginning of the evaluation.
Statistical analysis
Analysis of variance and Tukey’s multiple comparisons method at the 1% and 5%
significance levels were performed for the determination of significant differences among
thermally processed, PEF processed, and control tomato juices. The entire analyses were
duplicated with 4 measurements. Minitab 13.31 (Minitab, Inc., State College, PA) was
used for all statistical analyses.

66
RESULTS AND DISCUSSION
Effects of thermal processing and PEF processing on the microbial inactivation
Microbial counts of total aerobic microorganisms and yeasts & molds in tomato
juice incubated at 22°C for 3 d were 6.0 and 5.9 log10 CFU/mL, respectively. Both total
aerobic plate count and the yeast & mold count were reduced to < 10 CFU/mL est. after
either thermal or PEF processing. Thermal processing and commercial scale PEF
processing reduced endogenous microorganisms of tomato juice by 6 logs.
Successful inactivation of yeasts including Saccharomyces cerevisiae and
Zygosaccharomyces Bailii by PEF has been reported (Cserhalmi and others 2002; Qin
and others 1995; Raso and others 1998b; Zhang and others 1994). Microscopic
examination indicated that the major microorganism in control tomato juice was yeast.
Yeasts & molds are the major spoilage microorganisms in juice products due to their
survival and growth at low pH environments and use of sugars and vitamins in juices
(Deak and Beuchat 1996). Yeasts are known to be more tolerant to high temperature than
bacteria (Kimball 1991; Murdock and others 1953). The temperature of tomato juice
increased from 45 °C to 53 °C and maintained at 53 °C for 5 s during the PEF processing.
In order to investigate the effect of thermal treatment at 53 °C for 5 s on the yeast & mold
counts of the tomato juice incubated at 22 °C for 3 d, the incubated tomato juice was only
thermally processed at 53 °C for 5 s and plated on PDA. The numbers of yeasts & molds
on PDA before and after the thermal processing at 53 °C for 5 s were 5.9 log10 CFU/mL
and 5.8 log10 CFU/mL, respectively, and were not significantly different each other

67
(p > 0.05). The temperature increase from 45 °C to 53 °C and the holding at 53 °C for 5
s would not cause the 5.9 log reduction of yeasts & molds. Therefore, the inactivation of
yeasts & molds would be mainly due to PEF. Commercial scale PEF processing was
effective for the inactivation of endogenous microorganisms in tomato juice.
Effects of thermal processing and PEF processing on the microbial stability during
storage
Effects of thermal processing and PEF processing on the total aerobic plate counts
and the yeast & mold counts of tomato juice during the storage at 4 ˚C for 112 d are
shown in Figures 2.2 and 2.3, respectively. The initial total aerobic plate count of the
control hot break tomato juice at 0 d was 1.0 log10 CFU/mL. Both PEF and thermally
processed tomato juices had initially < 10 CFU/mL est. aerobic microorganisms at 0 d.
The number of total aerobes of thermally processed tomato juice was less than 2 log10
CFU/mL during the storage. The number of total aerobic microorganisms of PEF
processed tomato juice was less than 4 log10 CFU/mL during the storage at 4 °C for 112
d while that of control tomato juice reached 5 log10 CFU/mL at 4 °C after 49 d. Control
tomato juice was not sampled after 49 d due to the gas formation by multiplied
microorganisms. The initial yeast & mold count of control hot break tomato juice at 0 d
was 1.3 log10 CFU/mL. The yeast & mold counts of thermally processed tomato juice
was less than 1 log10 CFU/mL and those of PEF processed tomato juice was less than 4
log10 CFU/mL during the storage at 4 °C for 112 d.

68
0
1
2
3
4
5
6
0 20 40 60 80 100 120
Storage time (days)
Log
cfu/
mL
Heat PEF Control
Figure 2.2: Effects of thermal processing and PEF processing on the total aerobic plate counts of tomato juice during the storage at 4 °C for 112 d

69
0
1
2
3
4
5
6
0 20 40 60 80 100 120Storage time (days)
Log
cfu/
mL
Heat
PEF
Control
Figure 2.3: Effects of thermal processing and PEF processing on the yeast & mold counts of tomato juice during the storage at 4 °C for 112 d

70
The higher rate of microbial growth of PEF processed tomato juice than thermally
processed tomato juice during the storage may be due to the relatively lower
inactivationof the spores by PEF and the germination of the survived spores during the
storage. Spores of Bacillus and ascospores of molds and yeasts were detected from the
PEF processed tomato juice by a microscopic examination. Most studies reported that
PEF could not efficiently inactivate bacterial spores (Cserhalmi and others 2002; Grahl
and Markl 1996; Pol and others 2001). Little or no effect of PEF on the inactivation of
mold ascospores, including Byssoclamys nivea ascospores and Neosartorya fischeri
ascospores in tomato juice was also reported (Grahl and Markl 1996; Raso and others
1998a). The higher number of spores of Bacillus and ascospores of molds & yeasts
probably survived in PEF processed tomato juice than thermally processed tomato juice.
PEF processing can be effective for microbial inactivation extending the shelf life of
foods, but not for complete disintegration of microorganisms including spores (Grahl and
Markl 1996).
Effects of thermal processing and PEF processing on the lipoxygenase activity
Effects of thermal processing and PEF processing on the lipoxygenase activity of
tomato juice during the storage at 4 °C for 112 d are illustrated in Figure 2.4.
Lipoxygenase activity was not detected in thermally processed tomato juice throughout
the storage at 4 °C for 112 d. Commercial scale PEF processing inactivated 54% of the
lipoxygenase in the cold break tomato juice. The reduced lipoxygenase activity in PEF
processed tomato juice decreased further for 14 d at 4 °C.

71
Figure 2.4: Effects of thermal processing and PEF processing on the lipoxygenase activity of tomato juice during the storage at 4 °C for 112 days
0102030405060708090
100110
0 20 40 60 80 100 120
Storage time (days)
Rel
ativ
e lip
oxyg
enas
e ac
tivity
(%)
HeatPEFControl

72
Conformational changes of enzymes have been suggested as the mechanism of
enzyme inactivation by PEF (Ho and others 1997; Yeom and others 1999; Castro and
others 2001). Castro and others (2001) found that PEF caused unfolding of alkaline
phosphatase. When alkaline phosphatase was exposed to PEF, some aliphatic amino
acids of alkaline phosphatase moved from the hydrophobic interior to the hydrophilic
surface of the alkaline phosphatase, resulting in alkaline phosphatase unfolding (Castro
and others 2001). The further decrease in the lipoxygenase activity in the PEF processed
tomato juice for 14 d might be related to the gradual denaturation of lipoxygenase which
was unfolded by PEF. Further study is needed for confirmation.
Most desirable fresh flavor compounds in tomato including hexanal, cis-3-hexenal,
trans-2-hexenal, hexanol, trans-2-hexenol, and cis-3-hexenol are generated from the
unsaturated fatty acids such as linoleic and linolenic acid (Galliard and others 1977).
Lipoxygenase plays an important role in the formation of the flavor compounds through
the oxidation of unsaturated fatty acids (Eskin and others 1977). PEF processed tomato
juice may contain fresher flavor than thermally processed tomato juice due to the activity
of the residual lipoxygenase.
Effects of thermal processing and PEF processing on the concentration of lycopene
Effects of thermal processing and PEF processing on the concentration of
lycopene in the tomato juice during the storage at 4 °C for 112 d are shown in Table 2.2.
The concentrations of lycopene in thermally processed and PEF processed tomato juices

73
Concentration of lycopene (mg/100 g) Storage time
(days) Thermally processed
tomato juice
PEF processed
tomato juice
Control tomato
juice
0 11.91 ± 0.29 a 11.92 ± 0.35 a 12.14 ± 0.28 a
7 8.42 ± 0.47 a 9.55 ± 0.48 b 9.75 ± 0.50 b
14 8.41 ± 0.51 a 8.85 ± 0.49 a 9.44 ± 0.52 a
28 6.86 ± 0.28 a 7.60 ± 0.30 b 8.09 ± 0.38 b
35 5.86 ± 0.55 a 6.60 ± 0.47 a 6.95 ± 0.56 a
42 5.78 ± 0.31 a 6.21 ± 0.25 a 6.21 ± 0.28 a
49 5.58 ± 0.50 a 6.03 ± 0.41 a ND
56 5.50 ± 0.24 a 5.80 ± 0.42 a ND
70 5.15 ± 0.37 a 5.61 ± 0.31 a ND
84 4.65 ± 0.52 a 5.66 ± 0.51 a ND
112 4.08 ± 0.25 a 5.73 ± 0.27 b ND
ND: not determined Values are mean ±SD from duplicates of 4 measurements; Different letters in the same row indicate
significant differences (p < 0.05).
Table 2.2: Effects of thermal processing and PEF processing on the concentration of lycopene of tomato juice during the storage at 4 °C for 112 days

74
decreased from 11.9 to 4.08 mg/100 g and from 11.9 to 5.7 mg/100 g, respectively, after
112 d at 4 °C. The concentration of control decreased from 12.8 to 6.2 mg/100g after 42
d. There was no significant difference in the concentration of lycopene among thermally
processed, PEF processed, and control tomato juices during the storage (p > 0.05). The
concentration of lycopene decreased as storage time increased regardless of processing
methods.
The concentration of lycopene did not change significantly after thermal or PEF
processing (p > 0.05). Lycopene is chemically more stable than other pigments of plant
or animal origin such as chlorophyll, anthocyanin, hemoglobin, and myoglobin (Gould
1992). Lycopene in tomato products is resistant to degradation including thermally
induced trans-cis isomerization reactions (Nguyen and Schwartz 1998). It was proposed
that tocopherols, ascorbic acid, and phenolic antioxidants help stabilize lycopene during
processing (Abushita and others 2000; Takeoka and others 2001).
The main cause of carotenoids degradation in foods is oxidation (Thakur and
others 1996). Oxygen in the headspace of the sampling tube would cause the oxidation
of lycopene in tomato juice. The losses of lycopene of thermally processed, PEF
processed, and control tomato juices for 7 d were most significant throughout the storage
(p < 0.05). This may be due to the high oxygen availability in the headspace of the
sampling tubes during the early storage period. Rodriguez-Amaya (1993) found that the
stability of carotenoids of foods depends on oxygen availability and packaging conditions.

75
Effects of thermal processing and PEF processing on the retention of ascorbic acid
The effects of thermal processing and PEF processing on the concentration of
ascorbic acid during the storage at 4 °C for 112 d are illustrated in Figure 2.5. Ascorbic
acid decreased 10% after thermal processing (p < 0.05) but did not decrease significantly
after PEF processing (p > 0.05). The concentration of ascorbic acid in tomato juice
decreased as the storage time increased regardless of processing methods. However,
higher retention of ascorbic acid in PEF processed tomato juice than thermally processed
tomato juice was observed during the storage (p < 0.05).
Thermal processing in the manufacture of vegetable juices caused noticeable loss
of ascorbic acid (Podgorska and others 1983). Heat generated during thermal processing
initiates and accelerates chemical reactions in foods (Ekasari and others 1988). Ascorbic
acid is a heat sensitive nutrient (Saguy and others 1978). The higher retention of ascorbic
acid of PEF processed tomato juice than thermally processed tomato juice might be due
to the low processing temperature of PEF processing.
The difference between the concentrations of ascorbic acid of thermally processed
tomato juice and PEF processed tomato juice decreased as storage time increased and no
difference was observed after 70 d (p > 0.05). The oxygen in the headspace of package
and the oxygen permeated through package are considered to limit shelf life of food
products (Braddock 1999; Marshall and others 1986). The minimization of oxygen in the
headspace of package and oxygen permeation through package is essential to obtain
minimal oxidative degradations of ascorbic acid, flavor, and color (Sizer and others 1988).
The initially high concentration of ascorbic acid of PEF processed tomato juice can be

76
Figure 2.5: Effects of thermal processing and PEF processing on the retention of ascorbic acid of tomato juice during storage at 4 °C for 70 days
0
20
40
60
80
100
120
0 20 40 60 80
Ret
entio
n of
asc
orbi
c ac
id (%
)
Control
Heat
PEF
Storage time (days)

77
extended over time by selecting proper juice packaging materials such as polyethylene
terephthalate (PET) (Ayhan and others 2001b) and methods such as nitrogen flushing into
packages (Gunes and Lee 1997).
Effects of thermal processing and PEF processing on the particle size distribution,
Brix, pH, and viscosity
Effects of thermal processing and PEF processing on the particle size distribution
of tomato juice are shown in Table 2.3. A particle size distribution is a particle parameter
as a function of the particle size such as volume and surface area (Murphy 1984). The
D[4, 3] and D[3, 2] are means of particles on the basis of volume and surface area,
respectively (Malvern Instruments 1995). The D[4, 3] and D[3, 2] of PEF processed
tomato juice were significantly smaller than those of thermally processed and control
tomato juices (p < 0.05). Yeom and others (2000) found that orange juice processed by a
pilot plant scale PEF system at 35 kV/cm for 59 µs contained significantly smaller
particle size than orange juice thermally processed at 94.6 °C for 30 s. Miki and Akatsu
(1971) reported that the preparation methods of tomato products such as homogenization
and ultrasonication markedly influenced the particle size distributions of the products.
They found that tomato products showed uniform dispersion of lycopene when their
particle sizes are small.
The D(v, 0.5) is the median of the particle size distribution on the basis of volume
(Malvern Instruments 1995). The D(v, 0.5) values of thermally processed, PEF
processed, and control tomato juices were higher than those of D[4, 3] values (Table 2.3).
his indicates that the particle size distributions on the basis of volume were left-skewed.
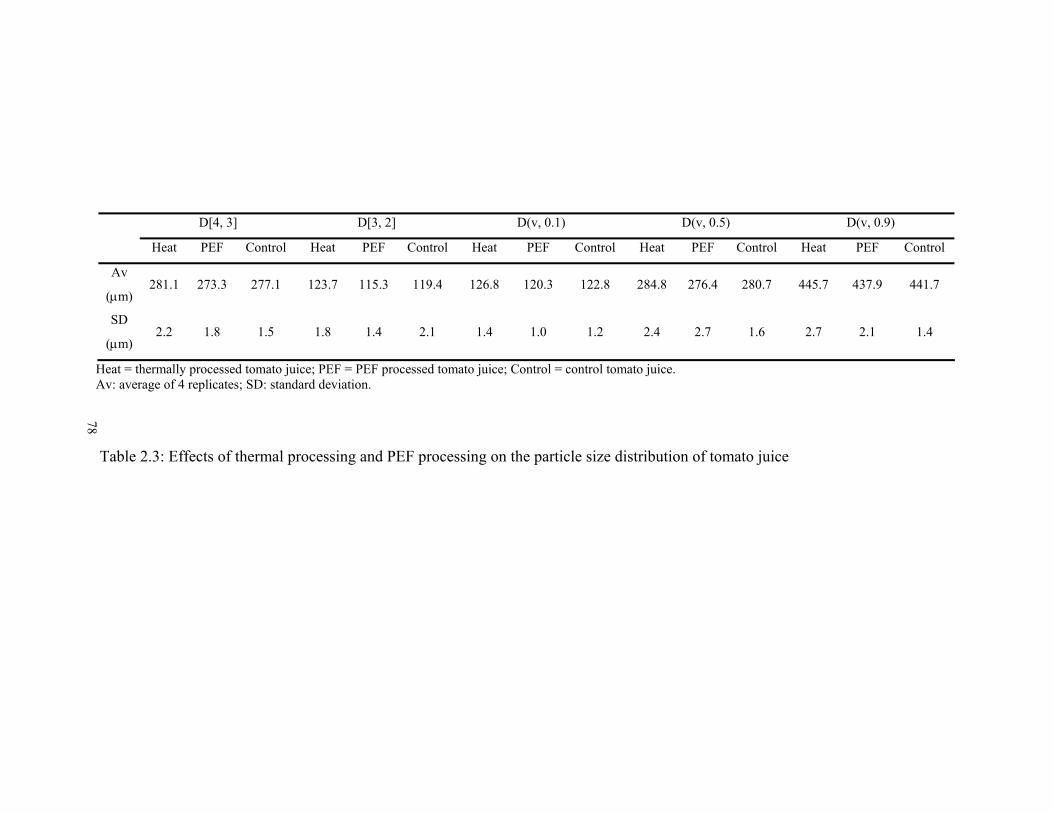
78
D[4, 3] D[3, 2] D(v, 0.1) D(v, 0.5) D(v, 0.9)
Heat PEF Control Heat PEF Control Heat PEF Control Heat PEF Control Heat PEF Control
Av
(µm) 281.1 273.3 277.1 123.7 115.3 119.4 126.8 120.3 122.8 284.8 276.4 280.7 445.7 437.9 441.7
SD
(µm) 2.2 1.8 1.5 1.8 1.4 2.1 1.4 1.0 1.2 2.4 2.7 1.6 2.7 2.1 1.4
Heat = thermally processed tomato juice; PEF = PEF processed tomato juice; Control = control tomato juice. Av: average of 4 replicates; SD: standard deviation.
Table 2.3: Effects of thermal processing and PEF processing on the particle size distribution of tomato juice
78

79
The D(v, 0.5) values of PEF processed and control juices were not significantly
different (p > 0.05) whereas the D[4, 3] value of PEF processed juice was significantly
smaller than that of control juice. The actual particle size of tomato juice might be not
changed by PEF processing. It is likely there was change in the volume of particles.
Coagulated substances in pulp might be separated by PEF processing, resulting in
significant change in the volume, but insignificant change in the actual particle size.
Thermally processed tomato juice had the largest particle size distribution in all
measurements (p < 0.05). The colloidal materials in juice products are usually
coagulated by heating and settle out readily (Joslyn 1961). The larger particle size of
thermally processed tomato juice than PEF processed and control tomato juices may be
due to the coagulation of colloidal materials in tomato juice. The Brix values for
thermally processed tomato juice and PEF processed tomato juices were 5.20 ± 0.10 and
5.14 ± 0.13, respectively, during the storage at 4 °C for 112 d. There was no significant
difference in the Brix between thermally processed and PEF processed tomato juices (p >
0.05). However, the Brix of control tomato juice decreased from 5.20 to 4.64 during the
storage for 49 d. This significant decrease (p < 0.01) in the Brix of control tomato juice
during the storage may be due to the high growth of microorganisms and their
consumption of soluble solids.
The pH values of thermally processed, PEF processed, and control tomato juices
were 4.27 ± 0.06, 4.30 ± 0.05, and 4.33 ± 0.07, respectively, during the storage at 4 °C
for 112 d. There was no significant change in pH in thermally processed, PEF processed,
and control tomato juices during the storage (p > 0.05). No significant change (p > 0.05)

80
in the Brix and pH of thermally processed and PEF processed tomato juices during the
storage for 112 d may be related to the effective inactivation of spoilage microorganisms
by thermal processing and PEF processing.
Effects of thermal processing and PEF processing on the viscosity of tomato juice
during the storage at 4 °C for 112 d are shown in Table 2.4. There were no significant
differences in the viscosity among thermally processed, PEF processed, and control
tomato juices (p > 0.05). It may be due to the effective inactivation of pectic enzymes
such as pectingalacturonase (PG) and pectin methylesterase (PME) by the hot break. The
hot break might sufficiently inactivate pectic enzymes. Pectic enzymes depolymerize
pectin molecules in tomato pulp or serum and cause decrease in the viscosity of tomato
products (Shomer and others 1984; Thakur and others 1996). There might be no
additional inactivation of residual pectic enzymes by either thermal processing or PEF
processing or there might be no residual activities of pectic enzymes after the hot break
since no significant differences in viscosities of thermally processed, PEF processed, and
control tomato juices were observed during the storage. The interaction between pectins
and proteins, which forms a reversible electrostatic complex, is also an important
contributor to the viscosity of tomato juice (Thakur and others 1996). The maximum
pectin-protein interaction occurs at pH 4.0-4.5 in which all thermally processed, PEF
processed, and control tomato juices ranged during the storage.

81
Viscosity (mPa × s) Storage time
(days) Thermally processed
tomato juice
PEF processed
tomato juice
Control tomato
juice
0 412 ± 45 a 350 ± 52 a 381 ± 42 a
7 400 ± 25 a 373 ± 23 b 416 ± 20 b
14 412 ± 21 a 388 ± 23 a 420 ± 28 a
28 420 ± 18 a 393 ± 22 b 430 ± 25 b
35 444 ± 30 a 391 ± 33 a 449 ± 29 a
42 435 ± 18 a 401 ± 21 a 450 ± 30 a
49 461 ± 25 a 415 ± 30 a ND
56 488 ± 25 a 440 ± 18 b ND
70 480 ± 60 a 460 ± 55 a ND
84 490 ± 28 a 482 ± 39 a ND
98 525 ± 17 a 517 ± 20 a ND
112 536 ± 15 a 518 ± 16 b ND
ND: not determined Values are mean ±SD from duplicates of 4 measurements; Different letters in the same row indicate significant differences (p < 0.05).
Table 2.4: Effects of thermal processing and PEF processing on the viscosity of tomato juice during the storage at 4 °C for 112 days

82
Effects thermal processing and PEF processing on the sensory quality
The results of the sensory evaluation are shown in Table 2.5. The results indicate
that the PEF processed tomato juice had higher flavor intensity and overall acceptability
than thermally processed tomato juice (p < 0.01).
Thermal processing strongly changes the sensory property of tomato products
including fresh tomato flavors (Buttery and others 1990; Rouseff and Leahy 1995). The
higher flavor intensity of PEF processed tomato juice than thermally processed tomato
juice may be related to the higher activity of lipoxygenase of PEF processed tomato juice
(Figure 2.4). The lipoxygenase forms hexanal, cis-3-hexenal, trans-2-hexenal, hexanol,
trans-2-hexenol, and cis-3-hexenol, which are responsible for fresh flavor of tomato juice
(Galliard and others 1977). Freshness is likely to be determined by consumers with their
perceptions (IFT 2001) and flavor is an important element in consumers’ perceptions of
the freshness of juice products. The overall acceptability of foods may be mainly
determined by freshness. Higher ranks of PEF processed tomato juice in the flavor
intensity and overall acceptability than thermally processed tomato juice may be
associated with higher freshness of PEF processed tomato juice than thermally processed
tomato juice.
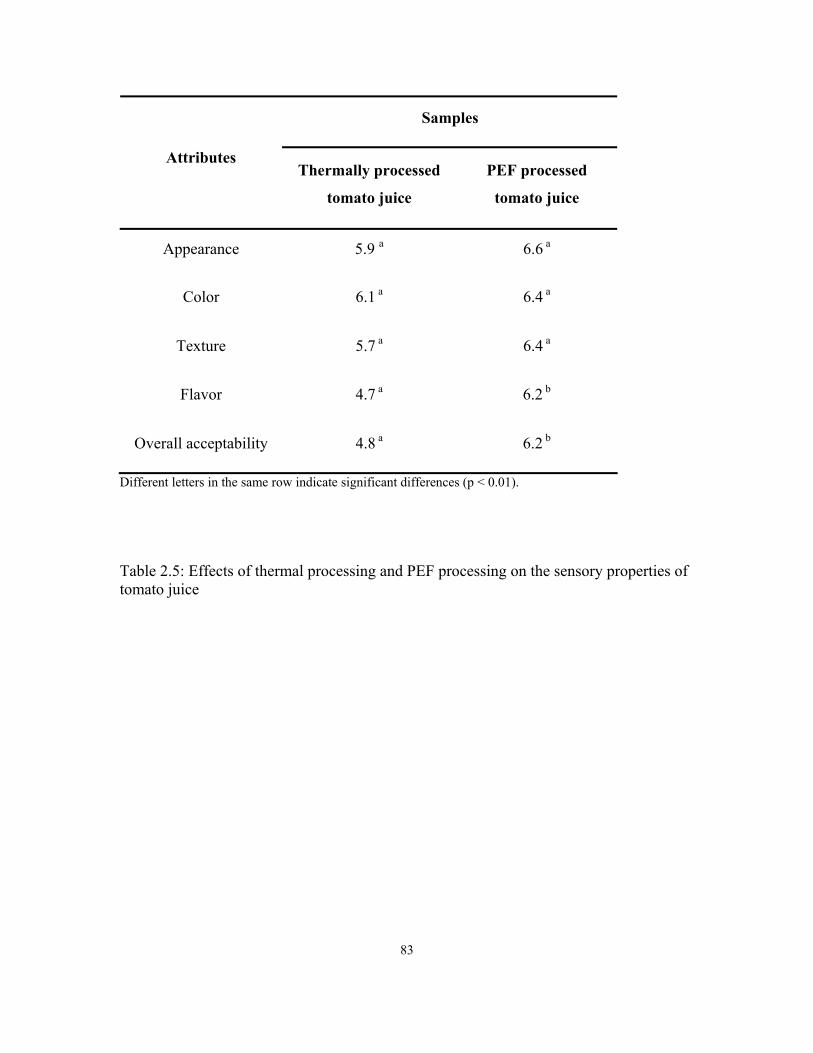
83
Samples
Attributes Thermally processed
tomato juice
PEF processed
tomato juice
Appearance 5.9 a 6.6 a
Color 6.1 a 6.4 a
Texture 5.7 a 6.4 a
Flavor 4.7 a 6.2 b
Overall acceptability 4.8 a 6.2 b
Different letters in the same row indicate significant differences (p < 0.01).
Table 2.5: Effects of thermal processing and PEF processing on the sensory properties of tomato juice

84
REFERENCES
Abushita AA, Daood HG, Biacs PA. 2000. Change in carotenoids and antioxidant
viatamins in tomato as a function of varietal and technological factors. J Agric Food
Chem 48:2075-2081.
Ayhan Z, Streaker CB, Zhang QH. 2001a. Design, construction and validation of a
sanitary glove box packaging system for product shelf-life studies. J Food Process
Preserv 25(1):183-196.
Ayhan Z, Yeom HW, Zhang QH, Min DB. 2001b. Flavor, color, and vitamin C retention
of pulsed electric field processed orange juice in different packaging materials. J Agric
Food Chem 49(2):669-674.
Ben-aziz A, Grossman S, Ascarelli I, Budowski P. 1970. Linoleate oxidation by
lipoxygenase and heme proteins: A direct spectrophotometric assay. Analytical
biochem 34:88-100.
Braddock RJ. 1999. Single strength orange juices and concentrate. In: Handbook of citrus
by-products and processing technology. New York: Wiley. p 53-83.
Buttery RG, Teranishi R, Ling LC, Turnbaugh JG. 1990. Quantitative and sensory studies
on tomato paste volatiles. J Agric Food Chem 38:336-340.
Castro AJ, Swanson BG, Barbosa-Canovas, Dunker AK. 2001. Pulsed electric field
modification of milk alkaline phosphatase activity. In: Barbosa-Canovas GV, Zhang
QH, editors. Pulsed electric fields in food processing: Fundamental aspects and
applications. Lancaster, PA: Technomic Publishing Company, Inc. P 83-103.

85
Chandler LA, Schwartz SJ. 1987. HPLC separation of cis-trans carotene isomers in fresh
and processed fruits and vegetables. J Food Sci 52(3):669-672.
Cserhalmi ZS, Vidacs I, Beczner J, Czukor B. 2002. Inactivation of Saccharomyces
cerevisiae and Bacillus cereus by pulsed electric fields technology. Innovative Food Sci
Emerging Technol 3(1):41-45.
Deak T, Beuchat LR. 1996. Yeasts in specific types of foods. In: Deak T, Beuchat LR,
editors. Handbook of food spoilage yeasts. New York: CRC Press. p 61-96.
Dunn J. 2001. Pulsed electric field processing: An overview. In: Barbosa-Canovas GV,
Zhang QH, editors. Pulsed electric fields in food processing: Fundamental aspects and
applications. Lancaster, PA: Technomic Publishing Company, Inc. p 1-30.
Ekasari I, Jongen WMF, Vermunt AEM, Pilnik W. 1988. Measurement of heat load in
orange juices: Use of microbiological methods. Food Technol 42(5) 124-128.
Eskin NAM, Grossman S, Pinsky A. 1977. Biochemistry of lipoxygenase in relation to
food quality. Crit Rev Food Sci. Nutr 9(11):1-40.
Evrendilek GA, Jin ZT, Ruhlman KT, Qiu X, Zhang QH, Richter ER. 2000. Microbial
safety and shelf-life of apple juice and cider processed by bench and pilot scale PEF
systems. Innovative Food Sci Emerging Technol 1(1):77-86.
Galliard T, Matthew JA, Wright AJ, Fishwick MJ. 1977. The enzymatic breakdown of
lipids to volatile and non-volatile carbonyl fragments in disrupted tomato fruits. J Sci
Food Agric 28:863-868.
Gould WA. 1992. Tomato production, processing, & technology. 3rd ed. Baltimore: CTI
Publishing. p 202-203, 254, 297-344, 359-367, 436.

86
Grahl T, Markl H. 1996. Killing of microorganisms by pulsed electric fields. Appl
Microbiol Biotechnol 45:148-157.
Gunes G, Lee CY. 1997. Color of minimally processed potatoes as affected by modified
atmosphere packaging and antibrowning agents. J Food Sci 62(3):572-575,582.
Dunn J. 2001. Pulsed electric field processing: An overview. In: Barbosa-Canovas GV,
Zhang QH, editors. Pulsed electric fields in food processing: Fundamental aspects and
applications. Lancaster, PA: Technomic Publishing Company, Inc. p 1-30.
Hayes WA, Smith PG, Morris AEJ. 1998. The production and quality of tomato
concentrates. Critical Reviews in Food Science and Nutrition 38(7):537-564.
Ho SY, Mittal GS, Cross JD. 1997. Effects of high field electric pulses on the activity of
selected enzymes. J Food Eng 31:69-84.
Howard RC, Peterson T, Kastl PR. 1987. High performance liquid chromatographic
determination of ascorbic acid in human tears. J Chromatogr 414:434-439.
IFT. Institute of Food Technologists. 2001. IFT’s comments to FDA regarding “Fresh”
labeling. Food Technol 55(2):66
Jin ZT, Zhang QH. 1999. Pulsed electric field inactivation of microorganisms and
preservation of quality of cranberry juice. J Food Process Preserv 23(6):481-497.
Joslyn MA. 1961. Physiological and enzymological aspects of juice production. In:
Tressler DK, Joslyn MA, editor. Fruit and Vegetable Juice. Westport, CT: AVI
Publishing. p 64-115.
Kimball DA. 1991. Juice cloud, color of citrus juices and citrus microbiology. In: Citrus
Processing-Quality Control and Technology. New York: Van Nostrand Reinhold. p
117-243.

87
Malvern Instruments. 1995. Particle size analyzers – Theory. Mannuals. U.K. Malvern.
Marshall M, Nagy S, Rouseff RL. 1986. Factors impacting on the quality of stored citrus
fruit beverages. In: Charalambous G, editor. The shelf life of foods and beverages. New
York: Elsevier. p 237-254.
Mertens B, Knorr D. 1992. Developments of nonthermal processes for food preservation.
Food Technol 46(5):124-133.
Miki N, Akatsu K. 1971. Effect of the size distribution of tomato pulp on the color of
tomato products. Nippon Shokuhin Kogyo Gakkai-Shi 18(7):303-308.
Murdock DI, Troy VS, Folinazzo JF. 1953. Thermal resistance of lactic acid bacteria and
yeast in orange juice and concentrate. Food Res 18:85-89.
Murphy RB. 1984. Handbook of particle sampling and analysis methods. New Jersey:
Verlag Chemie International, Inc. p 245-270.
Nguyen ML, Schwartz SJ. 1998. Lycopene stability during food processing. Proc Soc
Exp Biol Med 218:101-104.
Podgorska E, Bujak S, Krzyszczk M. 1983. Change in the vitamin C content of fruit and
vegetable juices during production and storage. Pol Przem Ferment Owocowo-
Warzywny. 27(4):25-29.
Pol IE, Arendonk WG, Mastwijk HC, Krommer J, Smid EJ, Moezelaar R. 2001.
Sensitivities of germinating spores and carvacrol-adapted vegetative cells and spores of
Bacillus cereus to nisin and pulsed electric field treatment. Appl Environ Microbiol
67(4):1693-1699.

88
Qin BL, Chang FJ, Barbosa-Canovas GV, Swanson BG. 1995. Nonthermal inactivation
of Saccharomyces cerevisiae in apple juice using pulsed electric fields. Lebensmittel-
Wissenschaft und Technologie, 28, 564-568.
Qiu X, Sharma S, Tuhela L, Jia M, Zhang QH. 1998. An integrated PEF pilot plant for
continuous nonthermal pasteurization of fresh orange juice. Transactions of the ASAE
41(4):1069-1074.
Raso J, Calderon ML, Gongora M, Barbosa-Canovas G, Swanson BG. 1998a.
Inactivation of mold ascospores and conidiospores suspended in fruit juices by pulsed
electric fields. Lebensm.-Wiss u.-Technol 31:668-672.
Raso J, Calderon ML, Gongora M, Barbosa-Canovas G, Swanson BG. 1998b.
Inactivation of Zygosaccharomyces Bailii in fruit juices by heat, high hydrostatic
pressure and pulsed electric fields. J Food Sci 63(1):1042-1044.
Rodriguez-Amaya DB. 1993. Stability of carotenoids during the storage of foods. In:
Developments in food science 33. New York: Elsevier. P 591-628.
Rouseff RL, Leahy MM. 1995. Fruit flavors. In: Biogenesis, characterization, and
authentication. Washington DC: American Chemical Society. p 164-181.
Saguy I, Kopelman IJ, Mizrahi S. 1978. Simulation of ascorbic acid stability during heat
processing and concentration of grapefruit juices. J Food Process Eng 2:213-225.
Sizer CE, Waugh PL, Edstam S, Ackerman P. 1988. Maintaining flavor and nutrient
quality of aseptic orange juice. Food Technol. 42:152-159.
Smith JJ, Linforth R, Tucker GA. 1997. Soluble lipoxygenase isoforms from tomato fruit.
Phytochemistry 45(3):453-458.

89
Shomer I, Lindner P, Vasiliver R. 1984. Mechanism which enables the cell wall to retain
homogenous appearance of tomato juice. J Food Sci 49: 628-633.
Takeoka GR, Dao L, Flessa S, Gillespie DM, Jewell WT, Huebner B, Bertow D, Ebeler
SE. 2001. Processing effects on lycopene content and antioxidant activity of tomatoes. J
Agric Food Chem 49:3713-3717.
Tangwongchai R, Ledward DA, Ames JM. 2000. Effect of high-pressure treatment on
lipoxygenase activity. J Agric Food Chem 48:2896-2902.
Thakur BR, Singh RK, Nelson PE. 1996. Quality attributes of processed tomato products:
A review. Food Rev Int 12(3):375-401.
Yeom HW, Streaker CB, Zhang QH, Min DB. 2000. Effects of pulsed electric fields on
the quality of orange juice and comparison with heat pasteurization. J Agric Food
Chem 48(10):4597-4605.
Yeom HW, Zhang QH, Dunne CP. 1999. Inactivation of papain by pulsed electric fields
in a continuous system. Food Chem 67:53-59.
Yin Y., Zhang QH, Sudhir SK, inventors; The Ohio State University, assignee. 1997 Nov.
25. High voltage pulsed electric field treatment chambers for the preservation of liquid food
products. U.S Patent 5,690,978.
Zhang Q, Barbosa-Canovas GV, Swanson BG. 1995. Engineering aspects of pulsed
electric field pasteurization. J Food Eng 25:261-281
Zhang Q, Monsalve-Gonzalez A, Qin B, Barbosa-Canovas GV, Swanson BG. 1994.
Inactivation of Saccharomyces cerevisiae by square wave and exponential-decay pulsed
electric field. J Food Proc Eng 17: 469-478.

90
ACKNOWLEDGMENTS
We acknowledge the DoD Dual Use Science and Technology Program for
funding this research. We thank Dr. F. Ozadali (Hirzel Canning Co. & Farms) for
supplying fresh tomatoes. We thank Dr. S. Schwartz, Ms. B. Keller, and Mr. J. Lee for
their technical support. We acknowledge Dr. H. Wang, Mr. S. K. Min, Ms. S. N. Rao,
and Mr. R. Caldwell for the preparation of tomato juice and the operation of the PEF
system.

91
CHAPTER 3
Effects of Commercial Scale Pulsed Electric Field Processing on Flavor and Color of
Tomato Juice
ABSTRACT
Effects of commercial scale pulsed electric field (PEF) processing on the flavor and color
of tomato juice during storage at 4 ºC for 112 d were studied. Tomato juice was prepared
by hot break at 88 °C for 2 min and then thermally processed at 92 °C for 90 s or PEF
processed at 40 kV/cm for 57 µs. PEF processed tomato juice retained more flavor
compounds of trans-2-hexenal, 2-isobutylthiazole, cis-3-hexanol than thermally
processed or unprocessed control tomato juice (p<0.05). PEF processed juice had
significantly lower nonenzymatic browning than thermally processed or control juice
(p<0.05). PEF processed juice had higher redness (p<0.05). Sensory evaluations
indicated that flavor of PEF processed juice was preferred to that of thermally processed
juice (p<0.01).
Key words: Pulsed electric field, tomato juice, tomato juice flavor, tomato juice color,
nonenzymatic browning

92
INTRODUCTION
Flavor and color are considered as the major quality attributes of foods and
influence the consumer’s choice. Many researchers have studied on the flavor and color
of tomato products and emphasized their importance as quality indexes (Kazeniac and
Hall 1970; Miki 1974; Gould 1978; Chung and others 1983; Buttery and others 1990a).
Volatile compounds of fresh tomato flavor are derived from the metabolisms of
fatty & amino acids and breakdown of carotenoids (Buttery and others 1971, 1988).
Approximately 400 volatile compounds were identified from fresh tomatoes (Buttery and
others 1990a). Volatile compounds of fresh tomato flavor need to be carefully studied
for the control of fresh and processed tomato products (Buttery and others 1971). Flavor
and color of tomato products are highly influenced by the nonenzymatic browning
reaction (Servili and others 2000). The nonenzymatic browning results in the
discoloration, off-flavor formation, and nutrient losses of foods and is considered as the
major cause of the quality degradation of foods (Saguy and others 1978; Labuza and
Baisier 1992). The nonenzymatic browning takes place in juice products during
harvesting, transporting, processing, and storage. Juice industries use the nonenzymatic
browning for the quality control (Garza and others 1999). The 5-hydroxymethyl-2-
furfural (HMF) is an intermediate product during the nonenzymatic browning reaction in
an acidic medium including tomato juice (Miki 1974). The HMF has been used as an
indicator of the nonenzymatic browning reaction (Lee and Nagy 1988; Porretta 1991).
The HMF forms during the juice production especially as a result of thermal processing

93
and increases during storage (Elkins and others 1988; Theobald and others 1998). The
level of HMF in processed foods is widely used to evaluate over-processing of juice
products (Elkins and others 1988; Porretta 1991; Hidalgo and others 1998).
Thermal processing is conventionally used to inactivate microorganisms and
enzymes and extend the shelf life of juice products. However, thermal processing can
adversely affect the sensory and nutritive qualities of foods (Rouseff and Leahy 1995;
Braddock 1999). The consumer likes fresh foods (Langlois and others 1996). Pulsed
electric field (PEF), a nonthermal food preservation method, has been extensively studied
to produce high quality juices with freshness (Mertens and Knorr 1992; Dunn 2001).
Laboratory or pilot plant scale PEF processing increased the shelf life of juice products
while reducing the loss of flavor, color, and nutrients (Qiu and others 1998; Evrendilek
and others 2000; Yeom and others 2000). However, there is no publication reporting
commercial scale PEF processing of foods or the effects of PEF on the flavor and color of
tomato juice during storage. The objectives of this research were (1) to study the effects
of commercial scale PEF processing on the flavor and color of tomato juice and (2) to
compare the flavor and color of PEF processed tomato juice with those of thermally
processed tomato juice during storage at 4 °C for 112 d.
MATERIALS AND METHODS
Preparation of tomato juice
Fresh Roma-type Midwest tomatoes were supplied by Hirzel Canning Co. &
Farms (Toledo, OH, U.S.A.) throughout the year of 2001 tomato season. Tomatoes were

94
processed on the same day of harvesting. Tomatoes were washed in a soak tank with air
agitation and then washed again with sprayed water supplied at 1.13 MPa (150 psig)
while being conveyed on a roller conveyor. Tomatoes were sorted manually and chopped
by a mill (Model D, The W. J. Fitzpatrick Co., Chicago, IL, U.S.A.) equipped with a 1.91
cm screen. The chopped tomatoes were heated in a tubular heat exchanger (H2187C
type, Specialty Brass Co., Kenosha, WI, U.S.A.) at 88 °C for 2 min for hot break.
Tomato juice was prepared by a screw type extractor (CJE-360-D28, Chisholm-Ryder
Co., Niagara Falls, NY, U.S.A.) with a screen of 1.27 cm diameter. A total of 1,100 kg
fresh tomatoes were used to prepare 800 L tomato juice.
Thermal processing and commercial scale PEF processing system
The OSU-6 commercial scale PEF processing system is illustrated in Figure 3.1.
The OSU-6 commercial scale PEF processing system was used for both thermal
processing and PEF processing. The system consists of an aseptic drink processor (Tetra
Pak Dairy & Beverage Systems AB, Lund, Sweden), a high voltage pulse generator
(Diversified Technology, Inc., Bedford, MA, U.S.A.), and co-field flow tubular PEF
chambers (The Ohio State University, Columbus, OH, U.S.A.). The aseptic drink
processor monitors and controls production rate, temperatures, and pressure during
thermal processing and PEF processing. The production rates can be controlled from 400
to 2000 L/h. The maximum pulse repetition rate of the high voltage pulse generator is
2000 pulses per second (pps). The high voltage pulse generator provides bi-polar squared
waveform pulses with a maximum peak voltage of ± 60 kV and maximum peak current

95
Figure 3.1: Flowchart of OSU-6 commercial scale PEF processing system
Recirculation
Heat exchanger 1 (Heating)
Product tank
Pump
Back pressure control
PEF chamber
Sanitary glove b
Waste
Heat exchanger 6
Holding T
ube
High voltage pulse
generator +/- 60 kV
Heat exchanger 5
Heat exchanger 4
Heat exchanger 3
Heat exchanger 2
PEF chamber PEF chamber PEF chamber
Aseptic drink
Thermal processing
PEF processing
High voltage pulse generator +/- 60 kV
Sanitary glove box
PEF processing section
Thermal processing section

96
of 600 A into multiple PEF chambers. Pulses were monitored with a high voltage probe
(VD-60, Northstar, Albuquerque, NM, U.S.A.), current monitors (Model 110, Pearson,
Palo Alto, CA, U.S.A.), and oscilloscopes (TDS-210, Tektronix, Beaverton, OR, U.S.A.).
Each co-field flow tubular PEF chamber consists of two boron carbite tubular electrodes
and a tubular insulator body made of ceramic (Yin and others 1997). The gap distance
between the electrodes is 1.270 cm and the inner diameter of the cylindrical processing
zone is 0.808 cm. A maximum of eight PEF chambers can be connected electrically
parallel and fluid flow wise in series. A sanitary glove box (The Ohio State University,
Columbus, OH, U.S.A.) was used as a filling unit for this research. The glove box was
sanitized by spraying and swabbing 35% hydrogen peroxide and lighting germicidal UV
at 254 nm for 12 h.
Thermally processed, PEF processed, and control tomato juices
Processing conditions for thermally processed, PEF processed, and control tomato
juices are listed in Table 3.1. The production rate was 500 L/h for thermally processed,
PEF processed, and control tomato juices.
For thermal processing, tomato juice was held at 92 °C for 90 s in a holding tube
and then cooled to 25 °C by Heat Exchanger 2 (Figure 3.1). The high voltage pulse
generator and heat exchangers in PEF Processing Section (Figure 3.1) were not activated
during the thermal processing. The cooled tomato juice was packaged inside the sanitary
glove box (Figure 3.1).
PEF processing conditions were electric field strength of 40 kV/cm, pulse
duration time of 2 µs, pulse repetition rate of 1000 pps, and total PEF treatment time of

97
Processing parameter Heat PEF Control
Production rate (L/h) 500 500 500
Holding temperature (°C) 92 45 45
Holding time (s) 90 90 90
Electric field strength (kV/cm) 0 40 0
PEF treatment time (µs) 0 57 0
Pulse repetition rate (pps a) 0 1000 0
Number of PEF chambers 6 6 6
Temperature change per a pair of PEF
chamber (°C)
0
8
0
Heat, PEF, and Control are the thermally processed tomato juice, PEF processed tomato juice, control tomato juice, respectively. a pps: pulse per second
Table 3.1: Parameters and temperature of processing

98
57 µs. Tomato juice was PEF processed while thermal processing was turned off.
Tomato juice was maintained at 45 °C before entering each set of two PEF chambers by
Heat exchangers 3, 4, and 5 (Figure 3.1). PEF processed tomato juice was cooled to 25
°C by Heat exchanger 6 prior to packaging inside the sanitary glove box (Figure 3.1).
For the control tomato juice, tomato juice was passed through the OSU-6
commercial scale PEF processing system without any thermal or PEF processing and
packaged inside the sanitary glove box.
Packaging and storage
Thermally processed, PEF processed, and control tomato juices were packaged
into the 50-mL sterilized polypropylene tubes (Corning, Acton, MA, U.S.A.) inside the
sanitary glove box. Each tube was covered with aluminum foil to protect tomato juice
from light. Packaged thermally processed, PEF processed, control tomato juices were
stored at 4 ºC in the dark.
Analysis of flavor compound
Volatile flavor compounds of tomato juice were analyzed by the method of
Goodman and others (2002) using a headspace solid-phase microextraction gas
chromatography (SPME-GC) system. Standard flavor compounds of trans-2-hexenal, 2-
isobutylthiazole, and cis-3-hexanol were purchased from Aldrich Chemical Co.
(Milwaukee, WI, U.S.A.). Carboxen/polydimethylsiloxane (Carboxen/PDMS) SPME
fibers, serum bottles, Teflon-coated rubber septa, and aluminum caps were purchased
from Supelco, Inc. (Bellefonte, PA, U.S.A.). The gas chromatography (GC) (5890,

99
Hewlett-Packard, Wilmington, DE, U.S.A.) was baked in an oven at 150 °C for 3 h. A
1.0 mL aliquot of tomato juice was transferred into a sealed 10-mL serum bottles
containing a micromagnetic bar (10 × 3 mm). The SPME fiber was inserted into the
headspace of the 10-mL vial containing tomato juice. The tomato juice in the vial was
incubated at 35 °C for 30 min in a water bath (Isotemp 228, Fisher Scientific, Pittsburgh,
PA, U.S.A.). The tomato juice in the vial was magnetically stirred by an immersed stirrer
(LTE Scientific Ltd., Greenfield, Oldham, U.K.) during the incubation. The SPME fiber
was moved from the vial and immediately injected into the GC with the injector
temperature at 265 °C and kept for 3 min to allow for desorption of flavor compounds.
The desorbed flavor compounds were separated by the GC equipped with a capillary
column (30 m × 0.53 mm i.d.) coated with a 2.65 µm film of 5% phenyl-substituted
methylpolysiloxane and a flame ionization detector. The temperature program held at 35
°C for 4 min, ramped 3 °C/min to 83 °C, then increased 20 °C/min to 150 °C and held for
2 min. The retention percent of selected flavor compound of tomato juice during storage
was calculated as follows:
Retention of flavor compound of tomato juice (%) =
(Concentration of a flavor compound of thermally or PEF processed tomato juice /
Concentration of the flavor compound of control tomato juice at 0 d) × 100
Identification of volatile compounds
The volatile flavor compounds was identified by a combination the GC retention
time of standard flavor compounds and a Hewlett-Packard 5970 Series mass selective
detector (MS) (Wilmington, DE, U.S.A.). The MS was equipped with a Hewlett-Packard

100
59822 B ionization gauge controller. Mass spectra were obtained at 70 eV and 220 °C
ion source temperature. The GC conditions for GC-MS were the identical to the GC
conditions for the analysis of flavor compounds described earlier. Information of the
computer software of NIST Mass Spectral Library (NIST’02. Version 2.0, Gaithersburg,
MD, U.S.A.) was used for the identification.
Determination of the nonenzymatic browning
The nonenzymatic browning was determined by a combination of brown color
and 5-hydroxymethyl-2-furfural (HMF) measurements.
The brown color was measured by the method of Birk and others (1998). The 5 g
ethyl alcohol was added to 5 mL of tomato juice. This mixture was centrifuged at 7800 ×
g for 10 min. Supernatant was clarified using 0.45 µm filter (Gelman Sciences, Ann
Arbor, MI, U.S.A.). The absorbance of the filtrate was measured at 420 nm by a
Spectronic Genesys 5 spectrometer (Milton Roy, Rochester, NY, U.S.A.) at 22 °C.
HMF was determined by the method of Birk and others (1998). The 2 mL of the
supernatant from the browning test, 2 mL (120 g/kg) 3-chloroacetic acid (TCA), and 2
mL (0.025 mol/L) thiobarbituric acid (TBA) were mixed in a 50-mL screw-cap test tube
(Corning, Acton, MA, U.S.A.). The test tubes were placed in a water bath at 40 °C for 50
min and then cooled immediately with tap water to 25 °C. The absorbance measured at
443 nm by a Spectronic Genesys 5 spectrometer (Milton Roy, Rochester, NY, U.S.A.)
was defined as the index to quantify HMF. The concentration of HMF of tomato juice
sample was read from a calibration curve of HMF (Sigma, St. Louis, MO, U.S.A.)
ranging from 0 to 20 mg/kg.

101
Analysis of ascorbic acid
The concentration of ascorbic acid in the tomato juice was measured by the
method of Yeom and others (2000) using a high-performance liquid chromatography
(HPLC) system (Hewlett Packard, 1050 series, Wilmington, DE, U.S.A.).
Measurement of color
Hunter L, a, and b of tomato juice were measured by a HunterLab colorimeter
(Hunter Associates Laboratory Inc., Reston, VA, U.S.A.). The red-yellow ratio (a / b)
was reported to indicate the redness of tomato juice.
Sensory evaluation
Thermally processed and PEF processed tomato juices, stored at 4 °C for 7 d,
were used for the sensory evaluation. The 7 d was needed for Silliker Laboratories
(Columbus, OH, U.S.A.) to confirm the absence of pathogen microorganisms, Salmonella
spp., Listeria monocytogenes, and Escherichia coli O157:H7 in thermally processed or
PEF processed tomato juice. A 30-member panel participated in the sensory tests. The
panelists consisted of people in the department of Food Science and Technology at the
Ohio State University and food industry. The panelists were asked to rate the preference
of flavor and color. A hedonic scale of 1 to 9 was used for each attribute. Higher
number represents higher preference of attributes. Thermally processed and PEF
processed tomato juices were served in randomly numbered plastic cups on a tray with a
cup of water and a piece of non-salted cracker.

102
A triangle test was conducted with thermally processed, PEF processed, and
control tomato juices to examine which tomato juice had different color from the others.
Data were analyzed with the Triangle Test for Difference Table (Meilgaard and others
1991).
Statistical analysis
Analysis of variance and Tukey’s multiple comparisons method at the 1% and 5%
significance levels were conducted to determine significant differences among thermally
processed, PEF processed, and control tomato juices. The entire analyses were
duplicated with 4 measurements. Minitab 13.31 (Minitab, Inc., State College, PA,
U.S.A.) was used for all statistical analyses.
RESULTS AND DISCUSSION
Effects of thermal processing and PEF processing on the flavor compounds
Effects of thermal processing and PEF processing on the retention of trans-2-
hexenal of tomato juice are shown in Figure 3.2 and on the retention of 2-isobutylthiazole
and cis-3-hexanol of tomato juice are shown in Table 3.2.
The retentions of trans-2-hexenal were 98% after thermal processing and 110%
after PEF processing at 0 d (Figure 3.2). The retentions of 2-isobutylthiazole were 99%
after thermal processing and 108% after PEF processing at 0 d (Table 3.2). The
concentrations of trans-2-hexenal and 2-isobutylthiazole of PEF processed tomato juice
were higher than those of control tomato juice at 0 d (p < 0.05). Yeom and others (2000)

103
Figure 3.2: Effects of thermal processing and PEF processing on the retention of trans-2-hexenal of tomato juice during storage at 4 °C for 112 days
0
20
40
60
80
100
120
0 20 40 60 80 100 120
Incubation time (days)
Ret
entio
n of
tran
s-2-
hexe
nal Control
Heat PEF
(days)

104
2-isobutylthiazole cis-3-hexanol Storage
time
(days) Heat PEF Control Heat PEF Control
0 99 a1 108 b1 100 a1 81 a 93 b 100 b
7 96 a 107 b 89 c 61 a 79 b 68 a
14 71 a 96 b 80 c 65 a 70 b 51 c
28 68 a 86 b 75 c 48 a 44 a 9 b
35 68 a 87 b 78 c 45 a 45 a 9 b
42 55 a 87 b 63 c 43 a 38 a 7 b
49 45 a 67 b ND2 42 a 35 a ND
56 41 a 55 b ND 42 a 40 a ND
70 40 a 52 b ND 29 a 29 a ND
84 40 a 49 b ND 22 a 25 a ND
112 30 a 38 b ND 18 a 13 a ND
Heat, PEF, and Control are the thermally processed tomato juice, PEF processed tomato juice, control 1Different letters in the same row of each flavor compound indicate significant differences (p < 0.05). 2ND: not determined because tomato juice was not sampled due to gas formation by multiplied microorganisms. The concentrations of 100 % 2-isobutylthiazole and cis-3-hexanol were 0.051 and 2.078 ppm, respectively. Values are mean of duplicates of 4 measurements.
Table 3.2: Effects of thermal processing and PEF processing on the retention of flavor compounds (%) of tomato juice during storage at 4 °C for 112 d
104

105
also observed that the concentrations of α-pinene, myrcene, limonene, and decanal of
orange juice processed by a pilot plant scale PEF system at 35 kV/cm for 59 µs were
higher than those of unprocessed orange juice at the 0 d of storage at 4 °C. The higher
concentration of the flavor compounds of PEF processed tomato juice at 0 d might be due
to the smaller particle size of PEF processed tomato juice than control tomato juice. A
preliminary study indicated that tomato juice processed by a commercial scale PEF
system at 40 kV/cm for 57 µs contained significantly smaller particles than thermally
processed tomato juice at 92 °C for 90 s and control tomato juice (p < 0.05). The
thermally processed tomato juice had the largest particle size (data not shown). Yeom
and others (2000) also found that orange juice processed by a pilot plant scale PEF
system at 35 kV/cm for 59 µs contained significantly smaller particle size than thermally
processed orange juice at 94.6 °C for 30 s and unprocessed orange juice. The higher
concentration of the flavor compounds of PEF processed tomato juice than control
tomato juice might be due to the decreased particle size of tomato juice during PEF
processing and the consequently increased release of the flavor compounds.
The concentrations of trans-2-hexenal, 2-isobutylthiazole, and cis-3-hexanol in
thermally processed, PEF processed, and control tomato juices decreased as the storage
time increased (Figure 3.2 and Table 3.2). PEF processed tomato juice retained more
trans-2-hexenal and 2-isobutylthiazole than thermally processed tomato juice during
storage at 4 °C for 112 d (p < 0.05). PEF processing did not change the concentration of
cis-3-hexanol significantly (p > 0.05) (Table 3.2). Thermal processing reduced 19% cis-
3-hexanol (p < 0.05). The concentration of cis-3-hexanol of PEF processed tomato juice

106
was significantly higher than that of thermally processed tomato juice at 0, 7, and
14 d (p < 0.05). PEF processed tomato juice retained trans-2-hexenal, 2-isobutylthiazole,
and cis-3-hexanol more than thermally processed and control tomato juices.
Thermal processing easily changes the flavor profile of juice products (Buttery
and others 1990b; Rouseff and Leahy 1995). The heat of thermal processing causes and
accelerates chemical reactions in foods (Ekasari and others 1988). PEF processed tomato
juice was exposed to 53.5 °C for 5 s whereas thermally processed tomato juice was
heated at 90 °C for 90 s. More retention of the flavor compounds in PEF processed
tomato juice than thermally processed tomato juice during the storage might be due to the
lower energy input of PEF processing than thermal processing.
Effects of thermal processing and PEF processing on the nonenzymatic browning
The nonenzymatic browning was determined by a combination of brown color
and 5-hydroxymethyl-2-furfural (HMF) measurements. Effects of thermal processing
and PEF processing on the brown color of tomato juice during storage at 4 °C for 112 d
are shown in Figure 3.3. The values of brown color of thermally processed tomato juice
and PEF processed tomato juice at 0 d were 0.34 and 0.29, respectively. PEF processed
tomato juice showed significantly less browning than thermally processed or control
tomato juice during storage at 4 °C (p < 0.05).
Effects of thermal processing and PEF processing on the concentration of 5-
hydroxymethyl-2-furfural (HMF) in tomato juice during storage at 4 °C for 112 d are
shown in Figure 3.4. The concentrations of HMF of thermally processed tomato juice

107
0
0.1
0.2
0.3
0.4
0.5
0.6
0.7
0 20 40 60 80 100 120
Incubation time (days)
Abso
rban
ce a
t 420
nm
Control HeatPEF
Figure 3.3: Effects of thermal processing and PEF processing on the brown color of tomato juice during storage at 4 °C for 112 days
(days)
Bro
wn
colo
r (A
420)

108
0
2
4
6
8
10
12
0 20 40 60 80 100 120
Incubation time (days)
Con
cent
ratio
n of
HM
F (m
g/kg
)
Control Heat PEF
Figure 3.4: Effects of thermal processing and PEF processing on the concentration of 5-hydroxymethyl-2-furfural of tomato juice storage at 4 °C for 112 days
(days)
HM
F co
ncen
trat
ion
(mg/
kg)

109
and PEF processed tomato juice at 0 d were 4.50 and 4.02, respectively. PEF processed
tomato juice showed significantly lower concentration of HMF than thermally processed
or control tomato juice during storage at 4 °C (p < 0.05).
A linear regression plot of the brown color versus the HMF concentration in PEF
processed tomato juice sampled at 0, 7, 14, 28, 35, 42, 49, 56, and 70 d is shown in
Figure 3.5 (a). A good relationship between the brown color and the HMF concentration
was observed (R2 = 0.88). The HMF is an intermediate compound during the
nonenzymatic browning reaction. The HMF has been used as an indicator of the
nonenzymatic browning reaction in juice products (Lee and Nagy 1988; Porretta 1991).
The good relationship between the brown color and the HMF concentration indicates that
the HMF can be used to evaluate the browning reaction in tomato juice.
The nonenzymatic browning and the formation of HMF depend on thermal
processing temperature and time and thus are used to evaluate over-processing (Meydav
and others 1977; Elkins and others 1988; Lee and Nagy 1988). The results from the
studies of the brown color and the HMF concentration show that PEF processed tomato
juice had less nonenzymatic browning than thermally processed or control tomato juice
during storage at 4 °C.
A linear regression plot of the concentration of HMF versus the loss of ascorbic
acid in PEF processed tomato juice sampled at 0, 7, 14, 28, 35, 42, 49, 56, and 70 d is
shown in Figure 3.5 (b). The concentration of HMF and the loss of ascorbic acid were
highly correlated (R2 = 0.96). A strong relationship between the formation of furfural
and the loss of ascorbic acid of orange juice was reported by Nagy and Dinsmore (1974).

110
(a)
continued
Figure 3.5: Linear regression plots of the brown color versus the concentration of 5-hydroxymethyl-2-furfural (a) and the concentration of 5-hydroxymethyl-2-furfural versus the loss of ascorbic acid (b) in PEF processed tomato juice sampled at 0, 7, 14, 28, 35, 42, 49, 56, and 70 days

111
Figure 3.5 continued
(b)

112
Ascorbic acid degradation is known as a cause of nonenzymatic browning in foods
(Marcy and others 1984). Destruction of ascorbic acid provides reactive carbonyl groups.
These carbonyl groups undergo the Amadori rearrangement with amino acids such as
lysine and glutamic acid (Kacem and others 1987). Furfurals can be formed from
dehydroreductones from the Amadori rearrangement. Pathways for ascorbic acid
destruction in both aerobic and anaerobic conditions yield furfurals as end products
(Kaanane and others 1988). The nonenzymatic browning in acidic media such as juice
products is primarily due to the ascorbic acid degradation rather than the reaction
between the reducing sugars and amino acids (Kaanane and others 1988). PEF processed
tomato juice retained more ascorbic acid than thermally processed tomato juice for 42 d
at 4 °C (p < 0.05) (data not shown). The slower browning reaction of PEF processed
tomato juice than thermally processed tomato juice (Figure 3.3) would be related to the
more retention of ascorbic acid of PEF processed tomato juice than thermally processed
tomato juice.
Effects of thermal processing and PEF processing on the Hunter L, a, and b
Effects of thermal processing and PEF processing on the red-yellow ratio (Hunter
a / b), indicating the redness of tomato juice during storage at 4 °C for 112 d, are
illustrated in Figure 3.6. The red-yellow ratios of thermally processed, PEF processed,
control tomato juices were above 3 during storage at 4 °C, which is acceptable for
commercial tomato juice (Bontovits 1981). The red-yellow ratios of thermally processed

113
3.0
3.2
3.4
3.6
3.8
4.0
0 20 40 60 80 100 120
Incubation time (days)
a / b
Heat PEF Control
Figure 3.6: Effects of thermal processing and PEF processing on the red-yellow ratio (Hunter a / b) of tomato juice during storage at 4 °C for 112 days
Red
-yel
low
ratio
(a /
b)
(days)

114
and PEF processed tomato juice at 0 d were 3.60 and 3.75, respectively. PEF processed
tomato juice showed significantly higher red-yellow ratios than thermally processed
tomato juice during storage at 4 °C for 112 d (p < 0.05).
Heat is the most important cause in loss of color during processing (Kattan and
others 1956; Yeom and others 2000). The heat of the thermal processing might
accelerate the color change in tomato juice. Lycopene makes up the 83% of the total
pigment present in tomatoes (Hayes and others 1998). The lycopene is responsible for
red color in tomato and the lycopene degradation results in the decrease in redness and
the loss of color in tomato (Noble 1975). A preliminary study indicated that there was no
significant difference in the concentrations of lycopene between tomato juice processed
by a commercial scale PEF system at 40 kV/cm for 57 µs and tomato juice thermally
processed at 92 °C for 90 s during storage at 4 °C for 112 d (data not shown). Thermally
processed tomato juice had smaller red-yellow ratio than PEF processed tomato juice
during storage at 4 °C for 112 d. This may be due to the higher rate of the nonenzymatic
browning reaction of thermally processed tomato juice than PEF processed tomato juice
during the storage if the concentrations of lycopene of thermally processed and PEF
processed tomato juices were not significantly different during the storage.
Color and clarity are the most important in describing the appearance of tomato
juice (Meilgaard and others 1991). Consumers notice color of tomato juice first and their
observation on its color often provides preconceived ideas about the quality of tomato
juice (Thakur and others 1996). The more color retention of PEF processed tomato juice
than thermally processed tomato juice can be the benefit of PEF processed tomato juice.

115
Effects of thermal processing and PEF processing on the sensory properties of
flavor and color
The panel score for flavor was 4.7 for thermally processed tomato juice and 6.2
for PEF processed tomato juice. The panel score for color was 6.1 for thermally
processed tomato juice and 6.4 for PEF processed tomato juice. The result shows that the
flavor of PEF processed tomato juice was preferred by the panels (p < 0.01). Thermal
processing strongly changes the flavor of tomato (Buttery and others 1990b; Rouseff and
Leahy 1995). The changed flavor of tomato by thermal processing is mainly due to the
formation of reaction products such as volatile carbonyls and sulfur compounds from the
nonenzymatic browning reaction (Buttery and others 1990b). Less retention of the flavor
compounds (Figure 3.2, Table 3.2) and more nonenzymatic browning (Figures 3.3, 3.4)
of thermally processed tomato juice than PEF processed tomato juice may be responsible
for the less preferred flavor of thermally processed tomato juice than PEF processed
tomato juice.
No significant difference was observed in the panel scores for color between
thermally processed and PEF processed tomato juices (p > 0.05). The result from the
triangle test also indicated that the colors of thermally processed, PEF processed, and
control tomato juices are not distinguishable. The sensory evaluation was conducted
after 7 d of storage at 4 °C. The colors of thermally processed and PEF processed tomato
juices might be expected to be different after a longer storage time since the differences
in the nonenzymatic browning (Figures 3.3, 3.4) and in the red-yellow ratio (Figure 3.6)
between thermally processed tomato juice and PEF processed tomato juice increased as
storage time increased.

116
CONCLUSIONS
Commercial scale PEF processing produced tomato juice with more retention of
the flavor compounds, less nonenzymatic browning, and higher redness than thermally
processed tomato juice. Flavor and color of tomato juice are important elements in the
consumer’s perception of the freshness of tomato juice. PEF processed tomato juice
possessed higher fresh quality than the thermally processed tomato juice.
REFERNECES
Birk EC, Mannheim CH, Saguy IS. 1998. A rapid method to monitor quality of apple
juice during thermal processing. Lebensm-Wiss u-Technol 31:612-616.
Bontovits L. 1981. The effect of processing technologies on colour changes in tomato.
Acta Alimentaria 10(3): 215-228.
Braddock RJ. 1999. Single strength orange juices and concentrate. In: Handbook of citrus
by-products and processing technology. New York: Wiley. p 53-83.
Buttery RG, Seifert RM, Guadagni DG, Ling LC. 1971. Characterization of additional
volatile components of tomato. J Agric Food Chem 19:524-529.
Buttery RG, Teranishi R, Flath RA, Ling LC. 1990a. Identification of additional tomato
paste volatiles. J Agric Food Chem 38:792-795.
Buttery RG, Teranishi R, Ling LC, Flath RA, Stern DJ. 1988. Quantitative studies on
origins of fresh tomato aroma volatiles. J Agric Food Chem 36:1247-1250.

117
Buttery RG, Teranishi R, Ling LC, Turnbaugh JG. 1990b. Quantitative and sensory
studies on tomato paste volatiles. J Agric Food Chem 38:336-340.
Chung TY, Hayase F, Kato H. 1983. Volatile components of ripe tomatoes and their
juices, purees, and pastes. Agric Biol Chem 47(2):343-351.
Dunn J. 2001. Pulsed electric field processing: An overview. In: Barbosa-Canovas GV,
Zhang QH, editors. Pulsed electric fields in food processing: Fundamental aspects and
applications. Lancaster, PA: Technomic Publishing Company, Inc. p 1-30.
Ekasari I, Jongen WMF, Vermunt AEM, Pilnik W. 1988. Measurement of heat load in
orange juices: Use of microbiological methods. Food Technol 42(5) 124-128.
Elkins ER, Heuser JR, Chin H. 1988. Detection of adulteration in selected fruit juices.
Food Sci Technol 30:317-341.
Evrendilek GA, Jin ZT, Ruhlman KT, Qiu X, Zhang QH, Richter ER. 2000. Microbial
safety and shelf life of apple juice and cider processed by bench and pilot scale PEF
systems. Innovative Food Science & Emerging Technologies 1(1):77-86.
Garza S, Ibarz A, Pagan J, Giner J. 1999. Non-enzymatic browning in peach puree during
heating. Food Res Int 32:335-343.
Goodman CL, Fawcett S, and Barringer SA. 2002. Flavor, viscosity, and color analyses
of hot and cold break tomato juices. J Food Sci 67(1):404-408.
Gould WA. 1978. Quality evaluation of processed tomato juice. J Agric Food Chem
26(5):1006-1011.
Hayes WA, Smith PG, Morris AEJ. 1998. The production and quality of tomato
concentrates. Critical Reviews in Food Science and Nutrition 38(7):537-564.

118
Hidalgo A, Pompei C, Zambuto R. 1998. Heat damage evaluation during tomato products
processing. J Agric Food Chem 46:4387-4390.
Kaanane A, Kane D, Labuza TP. 1988. Time and temperature effect on stability of
Moroccan processed orange juice during storage. J Food Sci 53:1470-1473.
Kacem B, Cornell JA, Marshall MR, Shireman RB, Mattews RF. 1987. Nonenzymatic
browning in aseptically packaged orange drinks: Effect of ascorbic acid, amino acids
and oxygen. J Food Sci 52:1668-1672.
Kattan AA, Ogle WL, Kramer A. 1956. Effect of process variables on quality of canned
tomato juice. Proc Am Soc Hort Sci 68:470-481.
Kazeniac SJ, Hall RM. 1970. Flavor chemistry of tomato volatiles. J Food Sci 35:519-
530.
Labuza TP, Baisier WM. 1992. The kinetics of non-enzymatic browning. In:
Schwartzberg HG, Hartel RW, editors. Physical chemistry of foods. NY: Marcel
Dekker Inc. p 595-649.
Langlois D, Etievant PX, Pierron P, Jorrot A. 1996. Sensory and instrumental
characterization of commercial tomato varieties. Zeitshrift fur
Lebensmitteluntersuchung und Forschung 203:535-540.
Lee HS, Nagy S. 1988. Relationship of sugar degradation to detrimental changes in citrus
juice quality. Food Technol 42:91-97.
Marcy JE, Graumlich TR, Crandall PG, Marshall MR. 1984. Factors affecting storage of
orange concentrated. J Food Sci 49:1628-1629.
Meilgaard M, Civille GV, Carr BT. 1991. Sensory evaluation techniques. 2nd ed. Boca
Raton, Florida: CRC Press, Inc. p 2-10, 54-55, 60-67, 237-268. 354 p.
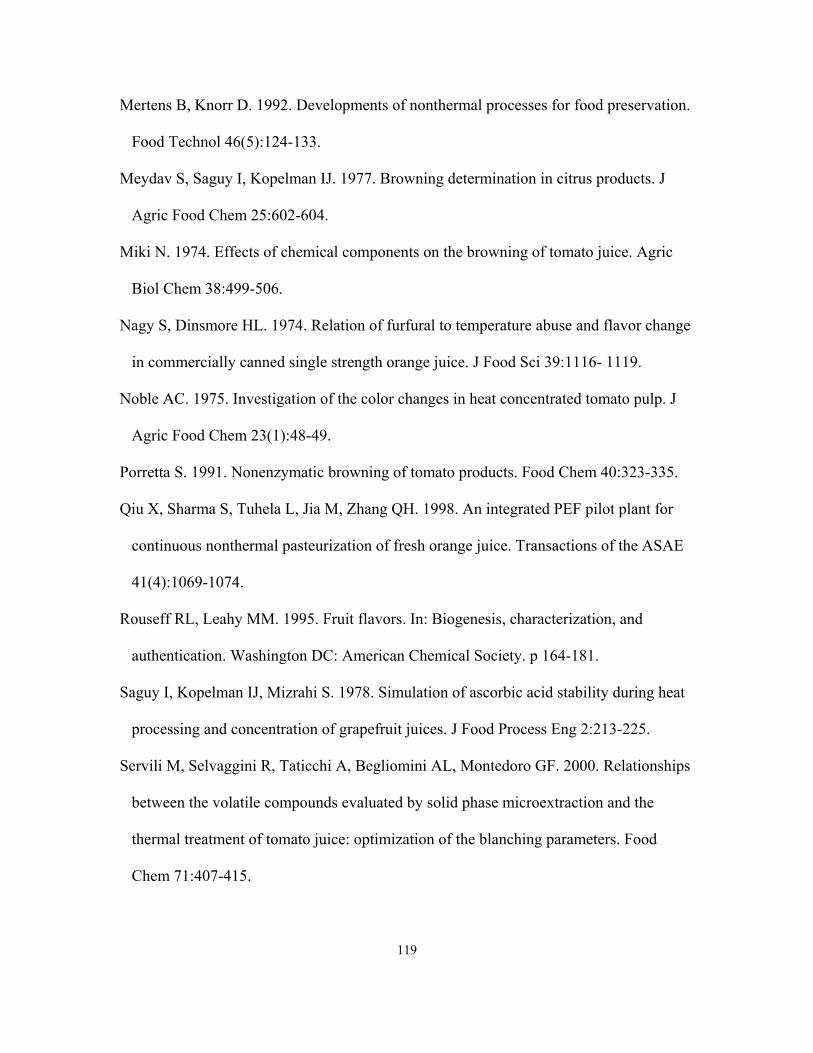
119
Mertens B, Knorr D. 1992. Developments of nonthermal processes for food preservation.
Food Technol 46(5):124-133.
Meydav S, Saguy I, Kopelman IJ. 1977. Browning determination in citrus products. J
Agric Food Chem 25:602-604.
Miki N. 1974. Effects of chemical components on the browning of tomato juice. Agric
Biol Chem 38:499-506.
Nagy S, Dinsmore HL. 1974. Relation of furfural to temperature abuse and flavor change
in commercially canned single strength orange juice. J Food Sci 39:1116- 1119.
Noble AC. 1975. Investigation of the color changes in heat concentrated tomato pulp. J
Agric Food Chem 23(1):48-49.
Porretta S. 1991. Nonenzymatic browning of tomato products. Food Chem 40:323-335.
Qiu X, Sharma S, Tuhela L, Jia M, Zhang QH. 1998. An integrated PEF pilot plant for
continuous nonthermal pasteurization of fresh orange juice. Transactions of the ASAE
41(4):1069-1074.
Rouseff RL, Leahy MM. 1995. Fruit flavors. In: Biogenesis, characterization, and
authentication. Washington DC: American Chemical Society. p 164-181.
Saguy I, Kopelman IJ, Mizrahi S. 1978. Simulation of ascorbic acid stability during heat
processing and concentration of grapefruit juices. J Food Process Eng 2:213-225.
Servili M, Selvaggini R, Taticchi A, Begliomini AL, Montedoro GF. 2000. Relationships
between the volatile compounds evaluated by solid phase microextraction and the
thermal treatment of tomato juice: optimization of the blanching parameters. Food
Chem 71:407-415.

120
Thakur BR, Singh RK, Nelson PE. 1996. Quality attributes of processed tomato products:
A review. Food Rev Int 12(3):375-401.
Theobald A, Muller A, Anklam E. 1998. Determination of 5-hydroxymethylfurfural in
vinegar samples by HPLC. J Agric Food Chem 46:1850-1854.
Yeom HW, Streaker CB, Zhang QH, Min DB. 2000. Effects of pulsed electric fields on
the quality of orange juice and comparison with heat pasteurization. J Agric Food
Chem 48(10):4597-4605.
Yin Y, Zhang QH, Sudhir SK, inventors; The Ohio State University, assignee. 1997 Nov.
25. High voltage pulsed electric field treatment chambers for the preservation of liquid
food products. U.S Patent 5,690,978.
ACKNOWLEDGMENTS
We acknowledge the DoD Dual Use Science and Technology Program for
funding this research. We sincerely thank Dr. F. Ozadali (Hirzel Canning Co. & Farms)
for supplying fresh tomatoes. We thank Dr. S. Schwartz, Ms. B. Keller, and Mr. J. Lee
for their technical support. We acknowledge Dr. R. Man, Mr. S. K. Min, Ms. S. N. Rao,
and Mr. R. Caldwell for the preparation of tomato juice and the operation of the PEF
system.

121
CHAPTER 4
Effects of Commercial Scale Pulsed Electric Field Processing on the Quality of Orange
Juice
ABSTRACT
Effects of commercial scale pulsed electric field (PEF) processing on the microbial
stability, ascorbic acid, flavor compound, color, Brix, pH, and sensory properties of
orange juice were studied and compared with those of thermal processing. Freshly
squeezed orange juice was thermally processed at 90 °C for 90 s or processed by PEF at
40 kV/cm for 97 µs. Both thermally and PEF processed juices showed microbial shelf life
at 4 °C for 196 d. PEF processed juice retained more ascorbic acid, flavor, and color than
thermally processed juice (p<0.05). No significant differences were observed in Brix and
pH between thermally and PEF processed juices at 4 °C for 196 d (p>0.05). Sensory
evaluation of texture, flavor, and overall acceptability were ranked highest for control
juice, followed by PEF processed juice and then by thermally processed juice (p<0.01).
Key words: Pulsed electric field, nonthermal processing, orange juice, ascorbic acid,
nonenzymatic browning

122
INTRODUCTION
Orange juice is the most popular juice in the United States (Marcy and others
1989). The quality of fresh orange juice is decreased by microorganisms, enzymes, and
chemical reactions (Chen and others 1993). Unpasteurized orange juice can transmit
some pathogens including Salmonella Enteritidis (FDA 2001). Thermal processing has
been widely used to inactivate spoilage & pathogenic microorganisms and enzymes of
orange juice. However, thermal processing can lower the sensory and nutritional
qualities of orange juice (Chen and others 1993; Braddock 1999). Nonthermal
processing including pulsed electric field (PEF) processing and high pressure processing
(HPP) has been intensively studied to minimize the loss of flavor, color, and nutrients of
foods from heat (Mertens and Knorr 1992; Dunn 2001; Nienaber and Shellhammer 2001).
Laboratory scale and pilot plant scale PEF processing increased the shelf life of
juice products by inactivating spoilage and pathogenic microorganisms and by reducing
the loss of flavor, color, and nutrients (Qiu and others 1998; Reina and others 1998;
Evrendilek and others 2000; Yeom and others 2000). Evrendilek and others (2000)
reported that the laboratory scale PEF processing at 34 kV/cm for 166 µs inactivated
Escherichia coli O157:H7 in apple juice by 4.5 logs and the pilot plant scale PEF
processing at 35 kV/cm for 94 µs increased the shelf life of apple juice while maintaining
the natural color and ascorbic acid content. Yeom and others (2000) reported that the
pilot plant scale PEF processing at 35 kV/cm for 59 µs inactivated 88% of pectin methyl
esterase activity and prevented microbial growth in orange juice. They also reported that
PEF processed orange juice had more retention of ascorbic acid for 112 d than thermally

123
processed orange juice. However, there is no publication reporting commercial scale
PEF processing for orange juice pasteurization. Development of a large scale PEF
processing system and the quality evaluation of foods processed by the large scale PEF
processing system are required for the industrial application of PEF processing
(Jeyamkondan and other 1999). The objectives of this research were (1) to study the
effects of commercial scale PEF processing on the inactivation of endogenous
microorganisms in orange juice, (2) to investigate the effects of commercial scale PEF
processing on the quality of orange juice, (3) and to compare the quality of PEF
processed orange juice with that of thermally processed orange juice during storage at 4
°C for 196 d.
MATERIALS AND METHODS
Preparation of Orange Juice
Fresh Rohde Valance oranges were purchased from Haines City Citrus Growers
Association (Haines City, FL, U.S.A.). Oranges were washed, waxed, graded, bulked,
and shipped to the Ohio State University (Columbus, OH, U.S.A.). Oranges were stored
at 4 °C until processing. Orange juice was prepared by squeezing fresh oranges using a
FMC Multi-Fruit Juicer (Lakeland, FL, U.S.A.) prior to thermal processing and PEF
processing.
124
Thermal processing and commercial scale PEF processing system
The OSU-6 commercial scale PEF processing system was used for both thermal
processing and PEF processing. The OSU-6 commercial scale PEF processing system is
illustrated in Figure 4.1. The system consists of an aseptic drink processor (Tetra Pak
Dairy & Beverage Systems AB, Lund, Sweden), a high voltage pulse generator
(Diversified Technology, Inc., Bedford, MA, U.S.A.), and co-field flow tubular PEF
chambers (The Ohio State University, Columbus, OH, U.S.A.). The aseptic drink
processor monitors and controls production rate, temperatures, and pressure during
thermal processing and PEF processing. The production rates are from 400 to 2000 L/h.
The high voltage pulse generator provides bi-polar squared waveform pulses with a
maximum peak voltage of ± 60 kV and maximum peak current of 600 A into multiple
PEF chambers during PEF processing. The 60 kV power supplies charge storage
capacitances. The storage capacitances are partially discharged by a series of solid-state
switches to form the square wave bipolar pulses. The high voltage pulse generator
operates at a maximum repetition rate of 2000 pulses per second (pps). Pulses were
monitored with a high voltage probe (VD-60, Northstar, Albuquerque, NM, U.S.A.),
current monitors (Model 110, Pearson, Palo Alto, CA, U.S.A.), and oscilloscopes (TDS-
210, Tektronix, Beaverton, OR, U.S.A.). The co-field flow tubular PEF chamber consists
of two boron carbite tubular electrodes and a ceramic tubular insulator body (Yin and
others 1997). The inner diameter of the cylindrical processing zone is 0.808 cm and the
gap distance between the electrodes is 1.270 cm. A maximum of eight PEF chambers

125
Figure 4.1: Flowchart of OSU-6 commercial scale PEF processing system
Recirculation
Heat exchanger 1 (Heating)
Product tank
Pump
Back pressure control
PEF chamber
Sanitary glove b
Waste
Heat exchanger 6
Holding T
ube
High voltage pulse
generator +/- 60 kV
Heat exchanger 5
Heat exchanger 4
Heat exchanger 3
Heat exchanger 2
PEF chamber PEF chamber PEF chamber
Aseptic drink
Thermal processing
PEF processing
High voltage pulse generator +/- 60 kV
Sanitary glove box
PEF processing section
Thermal processing section

126
can be connected electrically parallel and fluid flow wise in series. A sanitary glove box
(The Ohio State University, Columbus, OH, U.S.A.) was used as a filling unit for this
research. The glove box was sanitized by spraying and swabbing 35% hydrogen
peroxide and lighting germicidal UV at 254 nm for 12 h.
Thermally processed, PEF processed, and control orange juices
Processing conditions for thermally processed, PEF processed, and control orange
juices are listed in Table 4.1. The processing conditions were used for microbial
inactivation, shelf life, and sensory studies. The production rate was 500 L/h for
thermally processed, PEF processed, and control orange juices.
For thermal processing, orange juice was held at 90 °C for 90 s in a holding tube
and then cooled to 25 °C by Heat Exchanger 2 (Figure 4.1). The high voltage pulse
generator and the heat exchangers in PEF Processing Section (Figure 4.1) were not
activated during the thermal processing. The cooled orange juice was packaged inside
the sanitary glove box (Figure 4.1).
PEF processing conditions were defined by electric field strength of 40 kV/cm,
pulse duration time of 2.6 µs, and total PEF treatment time of 97 µs. Orange juice was
PEF processed while thermal processing was turned off. Orange juice was maintained at
45 °C before entering each set of two PEF chambers by Heat Exchangers 3, 4, and 5
(Figure 4.1). PEF processed orange juice was cooled to 25 °C by Heat Exchanger 6 prior
to packaging inside the sanitary glove box (Figure 4.1).

127
Processing parameter Thermally processed
orange juice
PEF processed
orange juice
Control orange
juice
Production rate (L/h) 500 500 500
Electric field strength (kV/cm) 0 40 0
Pulse duration time (µs) 0 2.6 0
Pulse treatment time (µs) 0 97 0
Number of PEF chamber 8 8 8
Holding temperature (°C) 90 45 45
Holding time (s) 90 90 90
Temperature change per a pair
of PEF chamber (°C)
0
13
0
Temperature before filling
(°C) 25 25 25
Table 4.1: Processing conditions for thermally processed, PEF processed, and control
orange juices

128
For the control orange juice, orange juice was passed through the OSU-6
commercial scale PEF processing system without thermal or PEF processing and
packaged inside the sanitary glove box.
Packaging and storage
Thermally processed, PEF processed, or control orange juice was packaged into
the 50-mL sterilized polypropylene tubes (Corning, Acton, MA, U.S.A.) inside the
sanitary glove box. Packaged thermally processed, PEF processed, control orange juices
were stored at 4 ºC in a walk-in refrigerator (Thermolinear, Cincinnati, OH, U.S.A.).
Microbial inactivation study
The freshly squeezed orange juice was incubated at 22 ºC for 3 d to grow
endogenous microorganisms. The microbial counts of total aerobic microorganisms and
yeasts & molds were 6.2 log CFU/mL and 5.8 log CFU/mL, respectively, after the
incubation. The incubated orange juice was thermally processed or processed by PEF.
Plate count agar (PCA) and acidified potato dextrose agar (PDA) were used to
enumerate total aerobic microorganisms and yeasts & molds, respectively. PCA, PDA,
and Peptone water were purchased from Difco (Detroit, MI, U.S.A.). PDA was acidified
with 10% tartaric acid (Sigma-Aldrich, St. Louis, MO, U.S.A.). Orange juice was diluted
with 0.1% sterile peptone water up to 10-4 dilution and plated by a spiral autoplater
(model 3000, Spiral Biotech Inc., Bethesda, MD, U.S.A.). PCA plates were incubated at
30 °C for 48 h. PDA plates were incubated at 22 °C for 5 d.

129
Shelf life study
Freshly squeezed orange juice was thermally processed or PEF processed for
shelf life study. Thermally processed, PEF processed, and control orange juices were
packaged and stored at 4 °C. Thermally processed and PEF processed orange juices were
sampled for 196 d. Control orange juice was sampled for 21 d for the microbial stability
study and for 14 d for the other shelf life studies due to gas formation by multiplied
microorganisms.
Microbial stability. The microbial stability was determined by the same method
as used for the microbial inactivation study. The initial microbial counts of total aerobic
microorganisms and yeasts & molds of control orange juice were 3.5 log CFU/mL and
3.3 log CFU/mL, respectively.
Ascorbic acid. The concentration of ascorbic acid in the orange juice was
measured by the method of Yeom and others (2000) using a high-performance liquid
chromatography (HPLC) system (Hewlett Packard, 1050 series, Wilmington, DE,
U.S.A.).
Flavor compounds. Volatile flavor compounds of orange juice were analyzed by
the method of Jia and others (1998) using a headspace solid-phase microextraction gas
chromatography (SPME-GC) system. Standard flavor compounds of α-pinene, myrcene,
octanal, d-limonene, and decanal were purchased from Aldrich Chemical Co.
(Milwaukee, WI, U.S.A.). Polydimethylsiloxane (PDMS) SPME fibers, 10-mL vials,

130
Teflon-coated rubber septa, and aluminum caps were purchased from Supelco, Inc.
(Bellefonte, PA, U.S.A.). The gas chromatography (GC) (5890, Hewlett-Packard,
Wilmington, DC, U.S.A.) was baked in an oven at 150 °C for 3 h. A 1.0 mL orange juice
was transferred into a sealed 10-mL vial containing a micromagnetic bar (10 × 3 mm).
The SPME fiber was inserted into the headspace of the 10-mL vial containing orange
juice. The orange juice in the vial was incubated at 60 °C for 20 min in a water bath
(Isotemp 228, Fisher Scientific, Pittsburgh, PA, U.S.A.). The orange juice in the vial was
magnetically stirred by an immersed stirrer (LTE Scientific Ltd., Greenfield, Oldham,
U.K.) during the incubation. The SPME fiber was moved from the vial and immediately
injected into the GC injection port at 220 °C and kept for 2 min to allow for desorption of
flavor compounds. The desorbed flavor compounds were separated by the GC equipped
with a capillary column (30 m × 0.53 mm i.d.) coated with a 2.65 µm film of 5% phenyl-
substituted methylpolysiloxane and a flame ionization detector. The temperature of the
GC was programmed from 60 to 120 °C at a rate of 10 °C/min, increased to 140 °C at a
rate of 4 °C/min, and then increased to 200 °C at a rate of 20 °C/min and held for 5 min.
The GC chromatograph peak area was calculated using a Hewlett Packard integrator (HP
3396A, Wilmington, DE, U.S.A.).
Identification of volatile compounds. The volatile flavor compounds was
identified by a combination of the GC retention time of standard flavor compounds and a
Hewlett-Packard 5970 Series mass selective detector (MS, Wilmington, DE, U.S.A.).
The MS was equipped with a Hewlett-Packard 59822 B ionization gauge controller.
Mass spectra were obtained at 70 eV and 220 °C ion source temperature. The GC

131
conditions for GC-MS were the identical to the GC conditions for the analysis of flavor
compounds described earlier. Information of the computer software of NIST Mass
Spectral Library (NIST’02. Version 2.0, Gaithersburg, MD, U.S.A.) was used for the
identification.
Brown color. The brown color was measured by the method of Yeom and others
(2000). Orange juice was centrifuged at 12500 g for 10 min at 22 °C by a Beckman
Microfuge E (Beckman Instruments Inc., Palo Alto, CA). Supernatant was clarified
using 0.45 µm filter (Gelman Sciences, Ann Arbor, MI, U.S.A.). The absorbance of the
filtrate was measured at 420 nm by a Spectronic Genesys 5 spectrometer (Milton Roy,
Rochester, NY, U.S.A.) at 22°C to determine brown color.
Hunter L, a, and b. Hunter L, a, and b were determined by a HunterLab
colorimeter (Hunter Associates Laboratory Inc., Reston, VA, U.S.A.). The lightness (L)
and hue angle (arctangent of b / a × 57.3) were reported.
Brix and pH. The Brix of orange juice was measured using a hand-held
refractometer (Fisher Scientific, Pittsburgh, PA, U.S.A.). The pH of orange juice was
measured using a pH meter (370, Orion, Beverly, MA, U.S.A.) at 22 °C.
Sensory analysis
The sensory evaluation was performed immediately after processing. A 30-
member panel participated in the sensory tests. The panelists were from the department

132
of Food Science and Technology at the Ohio State University and food industry. The
panelists were asked to rate the preference of color, appearance, texture, flavor, and
overall acceptability. A hedonic scale of 1 to 9 was used for each attribute. The higher
number represents higher preference of attributes. Thermally processed, PEF processed,
and control orange juices were served in randomly numbered plastic cups on a tray with a
cup of water and a piece of non-salted cracker.
Statistical analysis
Analysis of variance and Tukey’s multiple comparisons method at the 1% and 5%
significance levels were conducted to determine significant differences among thermally
processed, PEF processed, and control orange juices. The entire analyses were
duplicated with 4 measurements. Minitab 13.31 (Minitab, Inc., State College, PA,
U.S.A.) was used for all statistical analyses.
RESULTS AND DISCUSSION
Effects of thermal processing and PEF processing on the microbial inactivation
The total aerobic plate count and the yeast & mold plate count for the incubated
orange juice at 22 °C for 3 d were 6.2 logs and 5.8 logs, respectively. After either
thermal or PEF processing, the total aerobic plate count and the yeast & mold count were
all < 10 CFU/mL est. Both thermal processing and commercial scale PEF processing
inactivated about 6 logs of endogenous microorganisms in the orange juice.

133
Yeasts are known to be more tolerant to high temperature than bacteria (Kimball
1991). Sadler and others (1992) reported that pasteurization at 66 °C for 10 s inactivated
yeasts in orange juice from 3.6 to 3.1 log CFU/mL and could not prevent the growth of
yeasts at 4 °C. The temperature of orange juice increased from 45 °C to 58 °C and
maintained at 58 °C for 5 s during the PEF processing. The heat generated at 58 °C for 5
s is not considered as a major cause of yeast inactivation in our study. Dunn (2001)
mentioned that the microbial reductions of Escherichia coli in a model nutritive medium
by below 80 J/mL energy during PEF treatment would be resulted from the effect of PEF
alone. The energy of the PEF processing, which was calculated using the equation of
Wouters and others (2001), was 6.9 J/mL. The 6 log reduction of microorganisms by the
PEF processing in this study would be mainly due to PEF.
Effects of thermal processing and PEF processing on the microbial stability during
storage
Effects of thermal processing and PEF processing on the total aerobic plate counts
and the yeast & mold counts of orange juice during storage at 4 ˚C for 196 d are shown in
Table 4.2. The initial total aerobic plate counts and yeast & mold counts of control
orange juice were 3.5 log CFU/mL and 3.3 log CFU/mL, respectively. After either
thermal or PEF processing, the total aerobic plate count and the yeast & mold count were
all < 10 CFU/mL est. Both thermally processed and PEF processed orange juice
maintained the microbial stability of microorganisms at less than 1 log at 4 °C for 112 d.
Both total aerobic plate count and yeast & mold count of control reached 5.2 logs after

134
Total aerobic plate counts
(log CFU/mL)
Yeast & mold counts
(log CFU/mL)
Storage
time
(days) Heat PEF Control Heat PEF Control
0 < 10a < 10 3.5 < 10 < 10 3.3
7 < 10 < 10 3.7 < 10 < 10 3.3
14 < 10 < 10 3.9 < 10 < 10 3.7
21 < 10 < 10 5.2 < 10 < 10 5.2
28 < 10 < 10 NDb < 10 < 10 ND
56 < 10 < 10 ND < 10 < 10 ND
112 < 10 < 10 ND < 10 < 10 ND
133 < 10 1.0 ND < 10 1.2 ND
154 < 10 3.2 ND < 10 3.1 ND
196 < 10 3.8 ND < 10 3.7 ND
Heat = thermally processed orange juice; PEF = PEF processed orange juice; Control = control orange juice. a< 10 log CFU/mL est. bND: not determined because tomato juice was not sampled due to gas formation by multiplied microorganisms. Values are mean of duplicates of 4 measurements.
Table 4.2: Effects of thermal processing and PEF processing on the total aerobic plate counts and the yeast & mold counts of orange juice during storage at 4 °C for 196 days

135
21 d. The numbers of total aerobic microorganism and yeast & mold of thermally
processed and PEF processed orange juice were less than 1 log and 4 logs, respectively,
during storage at 4 °C for 196 d.
A microscopic examination showed that orange juice sampled immediately after
PEF processing had ascospores of molds and yeasts. Little effect of PEF on the
inactivation of mold and yeast ascospores, including Byssoclamys nivea ascospores,
Neosartorya fischeri ascospores, and Zygosaccharomyces Bailii ascospores in orange,
apple, pineapple, cranberry, and grape juices was reported (Grahl and Markl 1996; Raso
and others 1998a; Raso and others 1998b). The increase in the microbial counts of PEF
processed orange juice after 112 d might be due to the growth of yeasts and molds from
the ascospores initially present in the PEF processed orange juice.
Effects of thermal processing and PEF processing on the ascorbic acid
The effects of thermal processing and PEF processing on the concentration of
ascorbic acid in orange juice during storage at 4 °C for 196 d are shown in Figure 4.2.
PEF processing did not change the concentration of ascorbic acid significantly (p > 0.05).
Thermal processing reduced 19% of ascorbic acid (p < 0.05). The concentrations of
ascorbic acid in thermally processed, PEF processed, and control orange juices decreased
as storage time increased. However, PEF processed orange juice retained more ascorbic
acid than thermally processed orange juices for 84 d at 4 °C (p < 0.05).
Ascorbic acid retention has been used as an indicator of orange juice shelf life
(Shaw 1992). Squires and Hanna (1979) reported that orange juice should contain at
least 25 mg of vitamin C per 100 mL at the time of expiration date to provide 100% of

136
0
10
20
30
40
50
60
0 20 40 60 80 100 120 140 160 180 200
Storage time (days)
Con
cent
ratio
n of
Asc
orbi
c Ac
id
(mg/
100m
L)HeatPEFControl
Figure 4.2: Effects of thermal processing and PEF processing on the retention of ascorbic acid of orange juice during storage at 4 °C for 196 days
(days)
Asc
orbi
c ac
id c
once
ntra
tion
(mg/
100m
L)

137
the U.S. Recommended Daily Allowances (USRDA) requirement. The concentration of
ascorbic acid in PEF processed orange juice decreased to 25 mg/100 mL at 4 °C after 84
d, which is longer than the 56 d of thermally processed orange juice.
Effects of thermal processing and PEF processing on the flavor compounds
Effects of thermal processing and PEF processing on the retention of myrcene of
orange juice during storage at 4 °C for 196 d are shown in Figure 4.3 and on the retention
of α-pinene, octanal, d-limonene and decanal of orange juice are shown in Table 4.3.
Thermal processing and PEF processing decreased myrcene by 37% and 12%,
respectively. PEF processed orange juice retained more myrcene than thermally
processed orange juice during storage at 4 °C for 154 d (p < 0.05). PEF processed orange
juice also retained more α-pinene, octanal, d-limonene, and decanal than thermally
processed orange juice, especially during the early storage (Table 4.3) (p < 0.05).
Thermal processing degrades the flavor compounds of orange juice (Shaw 1992;
Braddock 1999) including myrcene, α-pinene, octanal, d-limonene, decanal, citral,
acetaldehyde, and ethyl butanoate (Ahmed and others 1978; Chen and others 1993). The
heat of thermal processing initiates and accelerates chemical reactions (Ekasari and
others 1988). PEF processed orange juice was exposed to 58 °C for 5 s whereas
thermally processed orange juice was heated at 90 °C for 90 s (Table 4.1). The more
retention of flavor compounds in PEF processed orange juice than thermally processed
orange juice may be due to the low processing temperature and heat load during PEF
processing.

138
0102030405060708090
100110
0 20 40 60 80 100 120 140 160 180 200
Storage time (days)
Rete
ntio
n of
myr
cene
(%)
HeatPEFControl
Figure 4.3: Effects of thermal processing and PEF processing on the retention of myrcene
of orange juice during storage at 4 °C for 196 days
(days)

139
Heat = thermally processed orange juice; PEF = PEF processed orange juice. 1Different letters in the same row of each flavor compound indicate significant differences (p < 0.05). The concentrations of 100 % α-pinene, octanal, limonene, and decanal were 0.041, 1.602, 680.7, and 0.707 ppm, respectively. Values are mean of duplicates of 4 measurements.
Table 4.3: Effects of thermal processing and PEF processing on the retention of flavor compounds (%) of orange juice during storage at 4 °C for 196 days
α-pinene Octanal d-limonene Decanal Storage
time (days) Heat PEF Heat PEF Heat PEF Heat PEF
0 80 a1 98 b1 69 a 81 b 71 a 87 b 77 a 93 b
7 73 a 83 b 65 a 78 b 65 a 75 b 72 a 80 b
14 69 a 78 b 63 a 71 b 62 a 74 b 64 a 74 b
21 67 a 78 b 59 a 67 b 58 a 73 b 61 a 70 b
28 66 a 72 a 55 a 60 a 58 a 63 a 59 a 63 a
35 61 a 67 a 50 a 58 b 55 a 60 a 56 a 56 a
42 60 a 66 a 42 a 52 b 51 a 55 a 53 a 48 a
56 53 a 62 b 39 a 44 a 43 a 50 a 40 a 43 a
70 50 a 61 b 38 a 42 a 38 a 44 a 37 a 38 a
112 46 a 55 a 35 a 39 a 36 a 44 b 35 a 37 a
133 43 a 53 a 32 a 35 a 35 a 43 a 33 a 33 a
154 42 a 50 a 27 a 33 a 35 a 41 a 32 a 31 a
196 42 a 49 b 15 a 21 a 32 a 35 a 29 a 30 a
139
140
Effects of thermal processing and PEF processing on the brown color
Effects of thermal processing and PEF processing on the brown color of orange
juice during storage at 4 °C for 196 d are shown in Figure 4.4. The brown color of
thermally processed orange juice increased from 0.20 to 0.34 and that of PEF processed
orange juice increased from 0.18 to 0.31 during storage at 4 °C for 196 d. PEF processed
orange juice showed significantly less browning than thermally processed orange juice
during storage at 4 °C for 196 d (P < 0.05).
The browning reaction in orange juice depends on thermal processing temperature
and time and is considered a useful indicator of over-processing (Elkins and others 1988;
Lee and Nagy 1988). The less browning of PEF processed orange juice than thermally
processed orange juice may be due to less heating during PEF processing than thermal
processing.
Effects of thermal processing and PEF processing on the lightness and the hue angle
Effects of thermal processing and PEF processing on the lightness (L) and the hue
angle (θ) of orange juice during storage at 4 °C for 196 d are shown in Figure 4.5 and
Table 4.4, respectively. The L values at 0 d were 48.6, 49.2, and 50.7 and the hue angles
were 35.4, 54.0, and 54.5 for thermally processed, PEF processed, and control orange
juices, respectively. PEF processed orange juice showed significantly higher L values
and hue angles than thermally processed orange juice during the storage time including 0
d (p < 0.05).

141
0.00
0.05
0.10
0.15
0.20
0.25
0.30
0.35
0.40
0 20 40 60 80 100 120 140 160 180 200
Storage time (days)
Abso
rban
ce a
t 420
nm
HeatPEFControl
Figure 4.4: Effects of thermal processing and PEF processing on the brown color of orange juice during storage at 4 °C for 196 days
(days)
Bro
wn
colo
r (A
420)

142
40
42
44
46
48
50
52
0 20 40 60 80 100 120 140 160 180 200
Storage time (days)
L
Heat
PEF
Control
Figure 4.5: Effects of thermal processing and PEF processing on the lightness (L) of orange juice during storage at 4 °C for 196 days
(days)
Ligh
tnes
s (L
)

143
Hue angle (θ) Storage time
(days) Heat PEF Control
0 53.4a1 54.0b1 54.5c1
7 53.5a 54.1a 54.3a
14 53.6a 54.2a 54.0a
21 53.2a 53.8a ND2
28 54.2a 54.7a ND
56 54.0a 54.8a ND
84 55.0a 55.6a ND
112 52.9a 54.5a ND
133 52.4a 55.1a ND
154 52.0a 54.0a ND
196 51.7a 53.8a ND Heat = thermally processed orange juice; PEF = PEF processed orange juice; Control = control orange juice. 1Different letters in the same row of each flavor compound indicate significant differences (p < 0.05). 2ND: not determined because tomato juice was not sampled due to gas formation by multiplied microorganisms. Values are mean of duplicates of 4 measurements.
Table 4.4: Effects of thermal processing and PEF processing on the hue angle (θ)
of orange juice during storage at 4 °C for 196 days

144
Color study indicates that PEF processed orange juice had brighter color than
thermally processed orange juice during the storage, which also can be drawn from the
result of the brown color study (Figure 4.4). Detrimental changes in the color of orange
juice are primarily caused by the nonenzymatic browning reaction (Klim and Nagy 1988).
Effects of thermal processing and PEF processing on the Brix and pH
The Brix values of thermally processed and PEF processed orange juices were
about 12 during storage at 4 °C for 196 d. The Brix of control orange juice decreased
significantly from 12.1 to 10.9 during storage for 14 d (p < 0.05). The pH values of
thermally processed and PEF processed orange juices were about 4 at 4 °C for 196 d.
The pH values of control orange juice were about 4 at 4 °C for 14 d.
The significant decrease in the Brix of control orange juice may be due to the
multiplication of microorganisms and their consumption of soluble solids such as
carbohydrates. No significant differences in Brix and pH between thermally processed
and PEF processed orange juice during storage at 4 °C for 112 d were observed (p >
0.05). The Brix and pH of thermally processed and PEF processed orange juices did not
change significantly during the storage (p > 0.05). This no significant change in the Brix
and pH of thermally processed and PEF processed orange juices during the storage may
be due to the effective inactivation of spoilage microorganisms by thermal processing and
commercial scale PEF processing.

145
Samples
Attributes
Heat PEF Control
Color 6.1 a1 6.8 a1 7.0 a1
Appearance 5.8 a 6.2 a 6.8 a
Texture 4.8 a 6.0 b 7.3 c
Flavor 3.7 a 5.9 b 7.8 c
Overall acceptability 4.2 a 6.1 b 7.4 c
Heat = thermally processed orange juice; PEF = PEF processed orange juice; Control = control orange juice. 1Different letters in the same row indicate significant differences (p < 0.01).
Table 4.5: Effects of thermal processing and PEF processing on the sensory evaluation of color, appearance, texture, flavor, and overall acceptability of orange juice

146
Effects of thermal processing and PEF processing on sensory quality
The sensory evaluation results are shown in Table 4.5. The control orange juice
had the highest preference on texture, flavor, and overall acceptability (p < 0.01). PEF
processed orange juice had a higher preference on texture, flavor, and overall
acceptability than thermally processed orange juice (p < 0.01). Thermal processing can
strongly change the sensory properties of orange juice including fresh juice flavor (Chen
and others 1993; Braddock 1999). Texture and flavor are important elements in
consumers’ perception of the freshness of orange juice. Also, the overall acceptability of
orange juice may be mainly determined by freshness. The results from the sensory
evaluation may imply that PEF processed orange juice was fresher than thermally
processed orange juice.
CONCLUSIONS
Commercial scale PEF processing was effective in inactivating endogenous
microorganisms in orange juice and extended the shelf life of orange juice while reducing
the degradation of the major qualities of orange juice including ascorbic acid, flavor, and
color. Commercial scale PEF processing also provided better sensory properties of
orange juice than thermal processing. PEF processed orange juice possessed higher fresh
quality than the thermally processed tomato juice. It is commercially feasible to
pasteurize orange juice by PEF technology.

147
REFERENCES
Ahmed EM, Dennison RA, Shaw PE. 1978. Effect of selected oil and essence volatile
components on flavor quality of pumpout orange juice. J Agri Food Chem 26:368-372.
Braddock RJ. 1999. Single strength orange juices and concentrate. In: Handbook of citrus
by-products and processing technology. New York: Wiley. p 53-83.
Chen CS, Shaw PE, Parish ME. 1993. Orange and tangerine juices. In: Nagy S, Chen CS,
Shaw PE, editors. Fruit Juice Processing Technology. Auburndale, FL: Agscience. p
110-165.
Dunn J. 2001. Pulsed electric field processing: An overview. In: Barbosa-Canovas GV,
Zhang QH, editors. Pulsed electric fields in food processing: Fundamental aspects and
applications. Lancaster, PA: Technomic Publishing Company, Inc. p 1-30.
Ekasari I, Jongen WMF, Vermunt AEM, Pilnik W. 1988. Measurement of heat load in
orange juices: Use of microbiological methods. Food Technol 42(5) 124-128.
Elkins ER, Heuser JR, Chin H. 1988. Detection of adulteration in selected fruit juices.
Food Sci Technol 30:317-341.
Evrendilek GA, Jin ZT, Ruhlman KT, Qiu X, Zhang QH, Richter ER. 2000. Microbial
safety and shelf life of apple juice and cider processed by bench and pilot scale PEF
systems. Innovative Food Science & Emerging Technologies 1(1):77-86.
FDA. Food and Drug Administration: U.S. Dept. of Health and Human Services. 2001.
FDA publishes final rule to increase safety of fruit and vegetable juices. Available
from: http://www.cfsan.fda.gov/~Ird/hhsjuic4.htm. Accessed Feb 6, 2001.

148
Grahl T, Markl H. 1996. Killing of microorganisms by pulsed electric fields. Applied
microbiology and biotechnology 45:148-157.
Jeyamkondan S, Jayas DS, Holley RA. 1999. Pulsed electric field processing of foods: a
review. J Food Prot 62:1088-1096.
Jia M, Zhang QH, Min DB. 1998. Optimization of solid-phase microextraction analysis
for headspace flavor compounds of orange juice. J Agric Food Chem 46:2744-2747.
Kimball DA. 1991. Juice cloud, color of citrus juices and citrus microbiology. In: Citrus
Processing-Quality Control and Technology. New York: Van Nostrand Reinhold. p 73-
101, 117-243.
Klim M, Nagy S. 1988. An improved method to determine nonenzymatic browning in
citrus juices. J Agric Food Chem 36:1271-1274.
Lee HS, Nagy S. 1988. Relationship of sugar degradation to detrimental changes in citrus
juice quality. Food Technol 42:91-97.
Marcy J, Hansen A, Graumlich T. 1989. Effect of storage temperature on the stability of
aseptically packaged concentrated orange juice and concentrated orange drink. J Food
Sci 54:227-230.
Mertens B, Knorr D. 1992. Developments of nonthermal processes for food preservation.
Food Technol. May:124-133.
Nienaber U, Shellhammer TH. 2001. High-pressure processing of orange juice: Kinetics
of pectinmethylesterase inactivation. J Food Sci 66(2):328-331.
Qiu X, Sharma S, Tuhela L, Jia M, Zhang QH. 1998. An integrated PEF pilot plant for
continuous nonthermal pasteurization of fresh orange juice. Transactions of the ASAE
41(4):1069-1074.

149
Raso J, Calderon ML, Gongora M, Barbosa-Canovas G, Swanson BG. 1998a.
Inactivation of mold ascospores and conidiospores suspended in fruit juices by pulsed
electric fields. Lebensm.-Wiss u.-Technol 31:668-672.
Raso J, Calderon ML, Gongora M, Barbosa-Canovas G, Swanson BG. 1998b.
Inactivation of Zygosaccharomyces Bailii in fruit juices by heat, high hydrostatic
pressure and pulsed electric fields. J Food Sci 63(1):1042-1044.
Reina LD, Jin ZT, Zhang QH, Yousef AE. 1998. Inactivation of Listeria monocytogenes
in milk by pulsed electric field. J Food Prot 61(9):1203-1206
Sadler GD, Parish ME, Wicker L. 1992. Microbial, enzymatic, and chemical changes
during storage of fresh and processed orange juice. J Food Sci 57(5):1187-1191.
Shaw PE. 1992. Shelf life and aging of citrus juices, juice drinks and related soft drinks.
In: Redd JB, Shaw PE, Hendrix Jr. CM, Hendrix DL, editors. Quality control manual
for citrus processing plants. Auburndale, FL: Agscience. p 173-199.
Squires SR, Hanna JG. 1979. Concentration and stability of ascorbic acid in marketed
reconstituted orange juice. J Agric Food Chem 27:639-641.
Wouters PC, Alvarez I, Raso J. 2001. Critical factors determining inactivation kinetics by
pulsed electric field food processing. Trends in Food Sci Technol 12(2001):112-121.
Yeom HW, Streaker CB, Zhang QH, Min DB. 2000. Effects of pulsed electric fields on
the quality of orange juice and comparison with heat pasteurization. J Agric Food
Chem 48(10):4597-4605.
Yin Y, Zhang QH, Sudhir SK, inventors; The Ohio State University, assignee. 1997 Nov.
25. High voltage pulsed electric field treatment chambers for the preservation of liquid
food products. U.S Patent 5,690,978.

150
ACKNOWLEDGMENTS
We acknowledge the DoD Dual Use Science and Technology Program for
funding this research. We thank Dr. R. Man and Mr. R. Caldwell for the preparation of
orange juice and the operation of the PEF system.

151
CHAPTER 5
Inactivation Kinetics of Tomato Juice Lipoxygenase by Pulsed Electric Fields
ABSTRACT
Pulsed electric field (PEF) inactivation kinetics for tomato juice lipoxygenase (LOX)
were studied and the primary variable for the inactivation of LOX by PEF was found.
Tomato juice was treated by PEF with the combinations of electric field strength (0, 10,
15, 20, 30, 35 kV/cm), PEF treatment time (20, 30, 50, 60, 70 µs), and PEF treatment
temperature (10, 20, 30, 40, 50 °C). The PEF treatment at 30 kV/cm for 60 µs at 50 °C
inactivated 88.1% of LOX. The first-order kinetic models, the Hulsheger’s model, and
the Fermi’s model adequately described the LOX inactivation by PEF. Calculated D-
values were 161.0, 112.9, 101.0, and 74.8 µs at 15, 20, 30, and 35 kV/cm at 30 °C,
respectively. The activation energy for the inactivation of LOX by PEF was 35.7 kJ/mole.
Applied electric field strength was the primary variable for the inactivation of LOX by
PEF.
Key words: Pulsed electric field, lipoxygenase, tomato juice, kinetics, temperature

152
INTRODUCTION
Lipoxygenase (LOX), a nonheme iron-containing dioxygenase, is widely present
in plant tissues (Wong 1995). LOX catalyzes the oxidation of polyunsaturated fatty acids
containing a cis, cis-1,4-pentadiene system, which produces 9- or 13- cis, trans-
hydroperoxides. The hydroperoxides generally decompose into acids, ketones, and
aldehydes (Leoni and others 1985). Tomato juice LOX initiates the formation of the
fresh flavor compounds of tomato. Most desirable fresh flavor compounds of tomato
including hexanal, cis-3-hexenal, trans-2-hexenal, hexanol, trans-2-hexenol, and cis-3-
hexenol are generated by LOX from the unsaturated fatty acids such as linoleic acid and
linolenic acid (Galliard and others 1977). However, tomato juice LOX can destruct
essential fatty acids and develop off-flavor in tomato juice during storage. Also, the
hydroperoxides and free radicals produced from the fatty acid by LOX can degrade
vitamins and proteins in tomato juice during storage. The desired amount of LOX
activity in the final tomato juice may depend on the use of the juice. If a tomato juice
needs to be shelf stable, a minimum LOX activity in the tomato juice may be desirable.
If a tomato juice needs to have fresh flavor and will be stored for a short time at
refrigerated temperature, the LOX activity in the tomato juice may remain higher than
that of the shelf stable tomato juice.
Thermal treatment is the most common method to extend the shelf life of tomato
juice by inactivating microorganisms and enzymes. However, thermal treatment can
degrade the sensory and nutritional qualities of foods (Rouseff and Leahy 1995;
Braddock 1999). PEF treatment has been extensively studied as a nonthermal food

153
preservation method (Mertens and Knorr 1992; Dunn 2001). PEF treatment increases the
shelf life of juice products while reducing the loss of their flavor, color, and nutrients
(Qiu and others 1998; Jin and others 1999; Evrendilek and others 2000; Yeom and others
2000).
Investigation on the effects of PEF on the enzymes responsible for the quality
alteration of foods during storage is needed for the commercialization of PEF processing
(Raso and others 1998). PEF may be effective for the inactivation of some selected
enzymes. Vega-Mercado and others (1995) reported the 90% reduction of plasmin
activity in a simulated milk ultrafiltrate by a PEF treatment at 30 kV/cm for 100 µs. Ho
and others (1997) reported significantly reduced activities of lipase, glucose oxidase,
heat-stable α-amylase, peroxidase, and polyphenol oxidase after PEF treatment. Yeom
and others (1999) observed a 90% inactivation of papain by PEF at 50 kV/cm. Giner and
others (2000) achieved a 94% reduction in the activity of tomato pectin methyl esterase
(PME) with a PEF treatment at 24 kV/cm. They applied first-order kinetic models, the
Hulsheger’s kinetic model, and the Fermi’s kinetic model to the inactivation data of
tomato PME by PEF and showed that these models fit experimental data adequately.
Energy input is considered as the cause of the inactivation of microorganisms and
enzymes by PEF. However, a question can be raised if the inactivation rates are all the
same as long as the amounts of energy input are same. The primary variable in the
inactivation of microorganisms and enzymes by PEF needs to be found to obtain
optimum PEF treatment conditions for desired levels of inactivation. The objectives of
this study were (1) to study the effects of PEF on the inactivation of tomato juice LOX,

154
(2) to evaluate the use of kinetic models for the inactivation of tomato juice LOX by PEF,
and (3) to find the primary variable responsible for the inactivation of tomato juice LOX
by PEF.
MATERIALS AND METHODS
Preparation of tomato juice
Tomatoes (Red Bear, Ruthven, Canada) were purchased from a local grocery
store (Kroger, Columbus, OH, U.S.A.) during August, September, and October in 2002.
Tomato juice was prepared from the tomatoes by a juice maker (JM-I, Juiceman Jr., Mt.
Prospect, IL, U.S.A.).
PEF treatment system
OSU-4A bench scale PEF system (The Ohio State University, Columbus, OH,
U.S.A.) was used for the PEF treatment of tomato juice. OSU-4A can generate voltage
up to 15 kV and provide bipolar or unipolar pulses with a frequency of 0 – 2000 pulses
per second (pps) and a pulse width of 2-15 µs. A signal generator (Model 9310 Quantum
Composers, Bozeman, MT, U.S.A.) controlled pulse width and pulse delay time (time
between the positive and negative pulses). The waveforms of pulses and the dosages of
voltage and current were monitored by a two channel digital oscilloscope (Model TDS-
210, Tektronix Inc., Beaverton, OR, U.S.A.). Bipolar square wave pulse pairs were used
for this research and shown in Figure 5.1. Four (two pairs) co-field tubular PEF
treatment chambers were connected to OSU-4A. Figure 5.2 shows the flow arrangement

155
Figure 5.1: A bipolar square wave pulse pair. A peak voltage and a peak current are indicated.
Current
Voltage Peak voltage
Peak current

156
• • • •
Figure 5.2: Flow arrangement of four PEF treatment chambers connected to stainless coils which tomato juice passed through. T1, T2, T3, and T4 are inlet or outlet temperatures.
High Voltage
Ground
Electrode
Insulator
One set of PEF chamber
Water bath
T1 T2 T3 T4
Gap distance
Inner diameter

157
of four PEF treatment chambers. The inner diameter and gap distance of the PEF
treatment chamber are 0.23 cm and 0.29 cm, respectively. Temperatures, T1, T2, T3, and
T4, were measured at the inlet and outlet of each pair of chambers by placing
thermocouples (Type K, 1.6 mm diameter, Fisher Scientific, Pittsburgh, PA, U.S.A.) to
the surface of stainless steel coils (Figure 5.2). The thermocouples were connected to
temperature readers (Fluke 52, Fluke Corporation, Everett, WA, U.S.A.).
PEF treatment conditions and experimental design
The PEF treatment conditions for the kinetic study of the LOX inactivation by
PEF and for the study determining the primary variable in the LOX inactivation by PEF
are shown in Table 5.1. PEF treatment temperature was T1 (Figure 5.2). A blocked full
factorial design with six electric field strength levels (0, 10, 15, 20, 30, 35 kV/cm), five
PEF treatment time levels (20, 30, 50, 60, 70 µs), and five PEF treatment temperature
levels (10, 20, 30, 40, 50 °C) was used. Experiments at the same PEF treatment
temperature level were executed within 1 block.
Measurement of lipoxygenase activity
Lipoxygenase activity was measured by the method of Morales-Blancas and
others (2002) with some modifications. The 10 mL tomato juice was homogenized with
10 mL cold (4 °C) 0.2 M potassium phosphate buffer (pH 6.5) for 1 min by a
homogenizer (M133/1281-0, Biospec Products Inc., Bartlesville, OK). The 5 mL
homogenate was centrifuged at 18,000 × g for 30 min at 4 °C. The supernatant from the

158
(a)
Treatment parameter Condition
Electric field strength (kV/cm) 10, 15, 20, 30, 35
PEF treatment time (µs) 20, 30, 50, 60 ,70
PEF treatment temperature (°C) 10, 20, 30, 40, 50
Pulse width (µs) 3
Pulse delay time a (µs) 20
Flow rate (mL/s) 1 a Pulse delay time = time between two pulses
(b)
Treatment parameter Condition 1 Condition 2 Condition 3
Electric field strength (kV/cm) 30.1 17.8 9.0
Current (A) 40 24 13
PEF treatment time (µs) 60 165 572
PEF treatment temperature (°C) 20 20 20
Pulse width (µs) 3 8 32
Pulse delay time a (µs) 2.4 2.4 2.4
Flow rate (mL/s) 1 1 1
∆ T c 25 25 25 a Pulse delay time = time between two pulses ∆ T = T4 – T3
Table 5.1: PEF treatment conditions for (a) the inactivation kinetics of tomato juice LOX by PEF and for (b) the study determining the primary variable in tomato juice LOX inactivation by PEF

159
centrifugation was filtered through a 0.45 µm syringe filter (Gelman Sciences, Ann Arbor,
MI, U.S.A.). The filtered supernatant was used as the enzyme extract. To prepare the
LOX substrate solution, 300 µL linoleic acid (Sigma-Aldrich, St. Louis, MO, U.S.A.),
300 µL Tween 20 (Sigma-Aldrich, St. Louis, MO, U.S.A.), and 15 mL distilled water
were mixed. The mixed solution was clarified by adding 1.5 mL sodium hydroxide (1 N)
(Fisher Scientific, Pittsburgh, PA, U.S.A.). Before assay, the 15 mL clarified mixed
solution was diluted to 60 mL with 0.2 M potassium phosphate buffer (pH 6.5). The 60
mL diluted solution was shaken manually for 2 min and then left to settle in the dark at
22 °C for 10 min. The 60 mL solution settled for 10 min was used as the substrate
solution. The 0.5 mL enzyme extract was pipetted into a quartz cuvet (Standard, Fisher
Scientific, Pittsburgh, PA, U.S.A.) containing 3.0 mL substrate solution and mixed with
the substrate solution for 3 s by a vortex (Genie 2, Fisher Scientific, Pittsburgh, PA,
U.S.A.). The absorbance was measured at 234 nm for 3 min at 22 °C by a
spectrophotometer (UV-2401PC, Shimadzu Scientific Instruments, Inc. Columbia, MD,
U.S.A.) immediately after the mixing. A blank was prepared with 0.5 mL distilled water
and 3.0 mL substrate solution. The volume of the 60 mL substrate solution was prepared
for 15 measurements. The spectrophotometer reading was recalibrated with a fresh
substrate solution after each time of the preparation of substrate solution. The rate of the
reaction was automatically computed from the linear portion of the absorbance curve.
The 1 unit of lipoxygenase activity was defined as a change of 0.001 units of absorbance
per minute and milliliter of enzyme extract.

160
Kinetics of LOX inactivation by PEF
The residual activity (RA) of LOX obtained after each PEF treatment was defined
as:
RA = A / A0 (1)
where A is the LOX activity after PEF treatment and A0 is the initial LOX activity before
PEF treatment.
Experimental data were fit to the first-order kinetic models in Equations (2) and
(5), the Hulsheger’s kinetic model (Hulsheger and others 1981) in Equation (6), and the
Fermi’s kinetic model (Peleg 1995) in Equation (7) by Minitab 13.31 (Minitab, Inc., State
College, PA, U.S.A.). The inactivation rate constant of kE or kN was obtained from the
slope of the regression of ln(RA) versus PEF treatment time (t) or versus electric field
strength (E), respectively.
ln(RA) = -kEt (2)
where t is the PEF treatment time (µs) and kE is the first-order kinetic constant with t.
161
Decimal reduction times (D) were calculated using the formula:
D = 2.303 / kE (3)
The activation energy (Ea) (J/mole) was calculated from the slope of the regression of ln
(kE) versus 1/T:
ln (kE) = -Ea / RT ⋅ 1/T (4)
where RT is the universal gas constant (8.3144 J/mole K-1) and T is the PEF treatment
temperature (K).
ln(RA) = -kNE (5)
where E is the electric field strength (kV/cm) and kN is the first-order kinetic constant
with E.
( ) kEE
c
c
ttRA
/−−
= (6)
where t is the PEF treatment time (µs), tc is the critical treatment time below which no
inactivation of LOX occurs (µs), E is the electric field strength (kV/cm), Ec is the critical
electric field strength below which no inactivation of LOX occurs (kV/cm), and k is the
specific rate constant.

162
aEE heRA /)(1
1−+
= (7)
where E is the electric field strength (kV/cm), Eh is the electric field strength (kV/cm)
where RA is 0.5, and a is the parameter indicating the slope of the curve around Eh.
Determination of energy input
The peak power and the energy input during PEF treatment were calculated using
following equations:
Peak power (W) = Peak voltage (V) × Peak current (A) (8)
Energy input (J) = Peak power (W) × PEF treatment time (s) (9)
The peak voltage and the peak current were read from waveforms using the oscilloscope
(Figure 5.1).
Statistical analysis
Analysis of variance and regression analysis were conducted with Minitab 13.31
(Minitab, Inc., State College, PA, U.S.A.) to estimate the model parameters (kE, kt, tc, Ec,
k, Eh, a).

163
RESULTS AND DISCUSSION
First-order kinetic models
Effects of PEF treatment time on the residual activity (RA) of LOX after PEF
treatment at 15, 20, 30, or 35 kV/cm at 30 °C are shown in Figure 5.3. The LOX activity
decreased with any increase in PEF treatment time or electric field strength. A 80 %
reduction of LOX activity was observed when LOX was exposed to PEF at 35 kV/cm for
50 or 60 µs at 30 °C.
The RA values as a function of PEF treatment time at 30 °C at the different levels of
electric field strength were fit to the first-order kinetic model of Equation 2. The
regression parameters of the first-order kinetic model are listed in Table 5.2 (p = 0.05).
The high R2 values indicate that the first-order kinetic model is valid for describing the
inactivation of tomato juice LOX by PEF at the different levels of electric field strength.
The p-value of lack-of-fit, which is a formal assessment of the adequacy of simple linear
regression use, was 0.882, 0.978, 0.940, or 0.867 at 15, 20, 30, or 35 kV/cm, respectively.
The high p-values of lack-of-fit indicate that ln (RA) and PEF treatment time at 30 °C at
the different levels of electric field strength had a linear relationship.
The effect of electric field strength on kE is shown in Figure 5.4(a). The result
showed a positive and exponential dependence (R2 = 0.91) between electric field strength
and kE. As the electric field strength increased from 15 to 35 kV/cm, the kE values

164
0
20
40
60
80
100
0 20 40 60 80
Treatment time (ms)
RA
%
15 kV/cm
20 kV/cm
30 kV/cm
35 kV/cm
Figure 5.3: Effects of PEF treatment time on the residual activity of LOX after PEF treatment at 15, 20, 30, or 35 kV/cm at 30 °C. Points are the average of a duplicate with four measurements. Plotted lines correspond to the adjustment of all points at each electric field strength to a first-order kinetic model.
Treatment time (µs)

165
Electric field
(kV/cm) kE (1/µs) R2
Lack-of-fit
(p-value) D (µs)
15 0.0163 ± 0.0018 0.940 0.882 161.0
20 0.0204 ± 0.0016 0.976 0.978 112.9
30 0.0228 ± 0.0027 0.946 0.940 101.0
35 0.0308 ± 0.0051 0.901 0.867 74.8
Table 5.2: Kinetic constants (KE) of the first-order kinetic model, correlation coefficients (R2), p-values of lack-of-fit, and decimal reduction times (D) of the PEF treatment at 15, 20, 30, or 35 kV/cm at 30 °C on tomato juice LOX

166
increased from 0.0163 to 0.0308 µs-1. This indicates that the LOX inactivation by PEF
increased as electric field strength increased. The effect of electric field strength on kE
can be described as:
kE = 0.0110 × e(0.0277)E (10)
The experimental RA was plotted against the predicted RA from Equation 10 and the plot
is shown in Figure 5.4(b). The slope and intercept obtained by simple regression (p =
0.05) agreed with their predicted values (R2 = 0.96).
D values decreased from 161.0 to 74.8 µs as electric field strength increased from
15 to 35 kV/cm (Table 5.2). The D value is defined as the PEF treatment time required to
reduce the activity by 90% at a given electric field strength and at a PEF treatment
temperature. A 90% inactivation of tomato juice LOX is expected after a PEF treatment
at 35 kV/cm with the PEF treatment time of 74.8 µs.
The temperature dependence of the inactivation of tomato juice LOX by PEF can
be explained with the concept of activation energy (Ea). The calculated activation energy

167
(a)
continued Figure 5.4: The effect of electric field strength (E) on the first-order kinetic constant (kE) (a) and the regression line of experimental residual activity of LOX versus predicted residual LOX activity from Equation 10 (b)
y = 0.011e0.0277x
R2 = 0.9115
0.010
0.015
0.020
0.025
0.030
0.035
10 15 20 25 30 35 40
E (kV/cm)
k (1
/ms)
Electric field strength (kV/cm)
k E (1
/µs)

168
Figure 5.4 continued
(b)
Predicted RA
Expe
rimen
tal R
A

169
of the LOX inactivation by PEF was 35.7 kJ/mole. Yeom and others (2002) reported
that the activation energy of orange pectin methyl esterase (PME) by PEF was 36.4
kJ/mole. Activation energy is the energy required for a reaction to occur. The higher the
activation energy, the slower the reaction (Rawn 1989). Inactivation of orange PME may
be slightly more difficult than the inactivation of tomato juice LOX by PEF treatment.
Effects of electric field strength on the RA of tomato juice LOX after PEF
treatment at 10, 20, 30, 40, or 50 °C for 60 µs are shown in Figure 5.5. The LOX activity
was not changed significantly after PEF treatment at 10 kV/cm at 10, 20, or 30 °C (p >
0.05), but decreased significantly at 15, 20, 30, and 35 kV/cm at any level of PEF
treatment temperature (p < 0.05). A lower RA% was observed at a higher PEF treatment
temperature at 10, 20, 30, or 35 kV/cm. A maximum 88.1% inactivation of tomato juice
LOX was observed with the PEF treatment at 30 kV/cm for 60 µs at 50 °C.
There was about 47% difference between RA% values obtained after PEF
treatment at 10 °C (62.2%) and 50 °C (15.4%) at the same electric field strength of 20
kV/cm (Figure 5.5). The effects of PEF treatment temperature on the PEF inactivation of
microorganisms and PME were reported (Jayaram and others 1992; Zhang and others
1995; Reina and others 1998; Yeom and others 2002). They reported the synergistic
effect between PEF treatment and moderate temperature (45-60 °C). The inactivation of
microorganisms and PME by PEF increased markedly with the moderate treatment
temperature. The synergistic effect between PEF treatment and PEF treatment
temperature was observed in the LOX inactivation by PEF.
The RA was not significantly changed when electric field strength increased from
20 to 30 kV/cm at 40 or 50 °C. Biphasic inactivation models were proposed to describe

170
0
20
40
60
80
100
120
0 10 20 30 40
Electric field strength (kV/cm)
RA
%
10 C
20 C
30 C
40 C
50 C
Figure 5.5: Effects of electric field strength on the residual activity of LOX after PEF treatment at 10, 20, 30, 40, or 50 °C for 60 µs

171
the thermal inactivation kinetics of LOX of green beans, broccoli, green asparagus, and
carrots (Indrawati and others 1999; Morales-Blancas and others 2002). The biphasic
inactivation by thermal treatment was caused by a heat labile fraction and a heat resistant
fraction of LOX isoenzymes (Indrawati and others 1999; Morales-Blancas and others
2002). The tailing in the inactivation of tomato juice LOX by PEF might be due to the
presence of PEF resistant isoenzymes.
The RA values as a function of electric field strength at 60 µs at the different
levels of PEF treatment temperature were fit to the first-order kinetic model of Equation 5.
The regression parameters of the first-order kinetic model are shown in Table 5.3
(p = 0.05). The high R2 values indicate that the first-order kinetic model describe
successfully the inactivation of tomato juice LOX by PEF treatment at the different levels
of PEF treatment temperature. The p-value of lack-of-fit was 0.871, 0.906, 0.898, 0.854,
or 0.865 at 10, 20, 30, 40, or 50 kV/cm, respectively. These high p-values of lack-of-fit
indicate a linear relationship between ln (RA) and electric field strength.
The effect of the PEF treatment temperature on kN is shown in Figure 5.6(a). The result
showed a positive and exponential dependence (R2 = 0.93) between the PEF treatment
temperature and kN. The kN values increased from 0.0225 to 0.0730 cm/kV as the PEF

172
Water bath
temperature (°C) kN (cm/kV) R2
Lack-of-fit
(p-value)
10 0.0225 ± 0.0041 0.908 0.871
20 0.0326 ± 0.0045 0.947 0.906
30 0.0521 ± 0.0076 0.923 0.898
40 0.0726 ± 0.0226 0.838 0.854
50 0.0730 ± 0.0199 0.869 0.865
Table 5.3: Kinetic constants (KN) of the first-order kinetic model, correlation coefficients (R2), and p-values of lack-of-fit of the PEF treatment at 10, 20, 30, 40, or 50 °C at 60 µs on tomato juice LOX

173
(a)
continued Figure 5.6: The effect of PEF treatment temperature on the first-order kinetic constant (kN) (a) and the regression line of experimental residual activity of LOX versus predicted residual LOX activity from Equation 11 (b)
y = 0.0178e0.0315x
R2 = 0.9327
0.01
0.02
0.03
0.04
0.05
0.06
0.07
0.08
0.09
0 10 20 30 40 50 60
Water bath temperature (C)
kN (c
m/k
V)
PEF treatment temperature (°C)
k N (c
m/k
V)

174
Figure 5.6 continued
(b)
Predicted RA
Expe
rimen
tal R
A

175
treatment temperature increased from 10 to 50 °C. This indicates that the LOX
inactivation by PEF increased as the PEF treatment temperature increased. The effect of
PEF treatment temperature on KN can be described as:
kN = 0.0178 × e(0.0315)T (11)
The experimental RA was plotted against the predicted RA from Equation 11 and this
plot is displayed in Figure 5.6(b). The slope and intercept obtained by simple regression
(p = 0.05) agreed with their predicted values by Equation 11 (R2 = 0.86).
Hulsheger’s kinetic model
The model parameters, Ec, tc, and k, obtained from the statistical analysis, were
1.72 kV/cm, 12.83 µs, and 33.44 kV/cm, respectively. The Hulsheger’s kinetic model fit
the experimental data with a very good agreement (R2 = 0.93, p < 0.001).
The experimental RA were plotted against the predicted RA from the Hulsheger’s
kinetic model (Equation 6) and shown in Figure 5.7(a). The slope and intercept obtained
by simple regression (p = 0.05) agreed with their predicted values from the Hulsheger’s
kinetic model (R2 = 0.91). The p-value for the lack-of-fit was 0.782. This p-value
suggests that a simple linear regression model can explain the variability between
experimental RA and predicted RA values.
Hulsheger and others (1981) proposed a model describing the inactivation kinetics
of microorganisms by PEF. Giner and others (2000) used the Hulsheger’s kinetic model
for the inactivation kinetics of tomato PME by PEF and found that the model fit

176
(a)
continued
Figure 5.7: The regression lines of experimental residual LOX activity versus predicted residual LOX activity from the Hulsheger’s kinetic model (a) and the Fermi’s kinetic model (b)
Predicted RA
Expe
rimen
tal R
A

177
Figure 5.7 continued (b)
Predicted RA
Expe
rimen
tal R
A

178
experimental data with a good agreement. They reported Ec of 0.7 kV/cm for PME
inactivation by PEF. The Ec of LOX (1.72 kV/cm) is higher than that of PME. This
indicates that the LOX inactivation began at higher electric fields than the tomato PME
inactivation.
Fermi’s kinetic model
The parameters of the Fermi’s kinetic model for the inactivation of tomato juice
LOX by PEF at 30 °C for 20, 30, 50, 60, and 70 µs are shown in Table 5.4. The Fermi’s
kinetic model fit the experimental data with a good agreement at different levels of PEF
treatment time (R2 > 0.85). The Eh, the electric field strength where RA is 0.5, decreased
from 54.59 to 10.01 kV/cm as the PEF treatment time increased from 20 to 70 µs.
A regression line of experimental RA versus predicted RA from the Fermi’s
kinetic model (Equation 7) is illustrated in Figure 5.7(b). The predicted RA from the
Fermi’s kinetic model agreed with the experimental RA well (R2 = 0.92).
Peleg (1995) reported that the Fermi’s kinetic model successfully described the
survival curves of microorganisms exposed to PEF. Giner and others (2000) applied the
Fermi’s kinetic model to the inactivation of tomato PME by PEF and showed feasibility
to use the Fermi’s model to predict the inactivation of enzymes. The regression analysis
of this study indicates that the Fermi’s kinetic model adequately described the
inactivation of tomato juice LOX by PEF.

179
PEF treatment time
(µs) Eh (kV/cm) a (kV/cm) R2
20 54.59 ± 6.27 40.44 ± 3.82 0.987
30 21.84 ± 3.30 14.85 ± 3.25 0.946
50 15.04 ± 2.71 13.55 ± 2.14 0.934
60 11.39 ± 2.18 15.88 ± 2.32 0.952
70 10.01 ± 1.54 22.68 ± 2.80 0.851
Table 5.4: Fermi’s equation parameter values and correlation coefficients (R2) for the inactivation of tomato juice LOX by PEF treatment at 30 °C for 20, 30, 50, 60, or 70 µs.

180
Effect of electric field strength on inactivation of LOX by PEF treatment with 22 J
The effect of electric field strength on the inactivation of tomato juice LOX by
PEF treatment with 22 J of energy input was studied. The three treatment conditions
were determined to provide 22 J of energy input to tomato juice, but with different levels
of electric field strength (Table 5.1(b)). The ∆T, the temperature difference between T4
and T3, was 25 °C for the all three PEF treatments. The LOX inactivation (%) values
were 4.7, 46.3, and 60.0 % when the values of electric field strength were 9.0, 17.8, and
30.1 kV/cm, respectively. As the electric field strength increased in the three treatments,
the inactivation of tomato juice LOX by PEF also increased even though the levels of
energy input for the three treatments were same as 22 J. Electric field strength can be
considered as the primary variable for the LOX inactivation by PEF.
CONCLUSIONS
The inactivation kinetics of tomato juice LOX by PEF showed that electric field
strength, PEF treatment time, and PEF treatment temperature significantly affected the
efficiency in the inactivation of tomato juice LOX by PEF. The first-order kinetic
models, the Hulsheger’s kinetic model, and the Fermi’s kinetic model adequately
described the inactivation of tomato juice LOX by PEF. Applied electric field strength
was the primary variable for the inactivation of tomato juice LOX by PEF. Information
from this research would be useful in determining remaining LOX activity in tomato
juice after PEF treatment for the quality control of tomato juice.
181
REFERENCES
Braddock RJ. 1999. Single strength orange juices and concentrate. In: Handbook of citrus
by-products and processing technology. New York: Wiley. p 53-83.
Dunn J. 2001. Pulsed electric field processing: An overview. In: Barbosa-Canovas GV,
Zhang QH, editors. Pulsed electric fields in food processing: Fundamental aspects and
applications. Lancaster, PA: Technomic Publishing Company, Inc. p 1-30.
Evrendilek GA, Jin ZT, Ruhlman KT, Qiu X, Zhang QH, Richter ER. 2000. Microbial
safety and shelf life of apple juice and cider processed by bench and pilot scale PEF
systems. Innovative Food Science & Emerging Technologies 1(1):77-86.
Galliard T, Matthew JA, Wright AJ, Fishwick MJ. 1977. The enzymatic breakdown of
lipids to volatile and non-volatile carbonyl fragments in disrupted tomato fruits. J Sci
Food Agric 28:863-868.
Giner J, Gimeno V, Espachs A, Elez P, Barbosa-Canovas GV, Martin O. 2000. Inhibition
of tomato (Licopersicon esculentum Mill.) pectin methylesterase by pulsed electric
fields. Innovative Food Sci & Emerging Technol 1:57-67.
Ho SY, Mittal GS, Cross JD. 1997. Effects of high field electric pulses on the activity of
selected enzymes. J Food Eng 31:69-84.
Hulsheger H, Pottel J, Niemann EG. 1981. Killing of bacteria with electric pulses of high
field strength. Radiat Environ Biophys 20:53-65.
Indrawati, Van Loey AM, Ludikhuyze LR, Hendrickx ME. 1999. Single, combined, or
sequential action of pressure and temperature on lipoxygenase in green beans
(Phaseolus vulgaris L.): A kinetic inactivation study. Biotechnol. Prog. 15:273-277.

182
Indrawati, Van Loey AM, Ludikhuyze LR, Hendrickx ME. 2001. Pressure-temperature
inactivation of lipoxygenase in green peas (Pisum sativum): A kinetic study. J Food Sci
66(5):686-693.
Jayaram S, Castle GSP, Margaritis A. 1992. Kinetics of sterilization of Lactobacillus
brevis cells by the application of high voltage pulses. Biotechnol Bioeng 40:1412-1420.
Jin ZT, Zhang QH. 1999. Pulsed electric field inactivation of microorganisms and
preservation of quality of cranberry juice. J Food Process Pres 23:481-497.
Leoni O, Iori R, Palmieri S. 1985. Purification and properties of lipoxygenase in
germinating sunflower seeds. J Food Sci 50:88-92.
Mertens B, Knorr D. 1992. Developments of nonthermal processes for food preservation.
Food Technol 46(5):124-133.
Morales-Blancas EE, Chandia VE, Cisneros-Zevallos L. 2002. Thermal inactivation
kinetics of peroxidase and lipoxygenase from broccoli, green asparagus and carrots. J
Food Sci 67:146-154.
Peleg M. 1995. A model of microbial survival after exposure to pulsed electric fields. J
Sci Food Agric 67:93-99.
Qiu X, Sharma S, Tuhela L, Jia M, Zhang QH. 1998. An integrated PEF pilot plant for
continuous nonthermal pasteurization of fresh orange juice. Transactions of the ASAE
41(4):1069-1074.
Raso J, Calderon ML, Gongora M, Barbosa-Canovas G, Swanson BG. 1998. Inactivation
of mold ascospores and conidiospores suspended in fruit juices by pulsed electric fields.
Lebensm Wiss u Technol 31:668-672.

183
Rawn JD. 1989. Biochemistry. Burlington, North Carolina: Neil Patterson Publishers. p
150-151.
Reina LD, Jin ZT, Zhang QH, Yousef AE. 1998. Inactivation of Listeria monocytogenes
in milk by pulsed electric field. J Food Prot 61(9):1203-1206.
Rouseff RL, Leahy MM. 1995. Fruit flavors. In: Biogenesis, characterization, and
authentication. Washington DC: American Chemical Society. p 164-181.
Vega-Mercado H, Powers JR, Barbosa-Canovas GV, Swanson BG. 1995. Plasmin
inactivation with pulsed electric fields. J Food Sci 60:1143-1146.
Wong DWS. 1995. Lipoxygenase. In: Food Enzymes. New York: Chapman & Hall. p
237-270.
Yeom HW, Zhang QH, Dunne CP. 1999. Inactivation of papain by pulsed electric fields
in a continuous system. Food Chem 67:53-59.
Yeom HW, Streaker CB, Zhang QH, Min DB. 2000. Effects of pulsed electric fields on
the quality of orange juice and comparison with heat pasteurization. J Agric Food
Chem 48(10):4597-4605.
Yeom HW, Zhang QH, Chism GW. 2002. Inactivation of pectin methyl esterase in
orange juice by pulsed electric fields. J Food Sci 67(6)2154-2159.
Zhang Q, Barbosa-Canovas GV, Swanson BG. 1995. Engineering aspects of pulsed
electric field pasteurization. J Food Eng 25:261-281.

184
ACKNOWLEDGMENTS
We acknowledge the DoD Dual Use Science and Technology Program for
funding this research.

185
CHAPTER 6
Recommendations for Further Studies
Success in extending shelf life of initially high-quality processed food would
depend on food packaging. It was observed that the initially significant differences in
flavor and ascorbic acid contents between thermally processed and PEF processed tomato
and orange juices decreased as storage time increased. The high contents of flavor and
ascorbic acid of PEF processed products can be maintained if appropriate packaging
materials and methods are used. Polyethylene terephthalate (PET) may be considered as
an alternative packaging material for PEF processed food due to their low gas
permeability and appropriateness for aseptic packaging. Modified atmosphere packaging
(MAP) may be applied to control oxygen in headspace and thus to minimize oxidation of
PEF processed foods. Packaging for PEF processed foods need to be further studied and
improved.
The shelf life of foods is extended by inactivating microorganisms and enzymes.
The effects of PEF on the inactivation of enzymes should be further investigated for
commercial juice production by PEF. The conformational change of enzymes, induced
by PEF, has been suggested as the mechanism of enzyme inactivation by PEF. However,

186
the issue of the inactivation of enzymes by PEF is still controversial. This might be due
to the diversity of the systems being used for PEF research. The PEF system needs to be
considered when PEF research is compared. The mechanism for the inactivation of
enzymes by PEF needs to be further studied to elucidate the effect of PEF on enzymes.
Such mechanism is also needed for PEF processing optimization. Primary PEF
processing parameters, directly related to the inactivation, may be enhanced to increase
the microbial or enzymatic inactivation with minimum energy input.
Kinetic models that describe the inactivation of important food enzymes need to
be determined and developed for the commercial juice production by PEF. A kinetic
model that incorporates all major PEF processing parameters, such as electric field
strength and PEF treatment time and temperature needs to be further developed. The
evaluation of kinetic models for the inactivation of enzymes needs to be conducted with
respect to isoenzymes.

187
LIST OF REFERENCES
Ababouch LH, Grimit L, Eddafry R, Busta FF. 1995. Thermal inactivation kinetics of Bacillus subtilis spores suspended in buffer and oils. J Appl Bacteriol 78:669-676.
Abushita AA, Daood HG, Biacs PA. 2000. Change in carotenoids and antioxidant
viatamins in tomato as a function of varietal and technological factors. J Agric Food Chem 48:2075-2081.
Ahmed EM, Dennison RA, Shaw PE. 1978. Effect of selected oil and essence volatile
components on flavor quality of pumpout orange juice. J Agri Food Chem 26:368-372. Aronsson K, Lindgren M, Johansson B, Ronner U. 2001. Inactivation of microorganisms
using pulsed electric fields: the influence of process parameters on Escherichia coli, Listeria innocua, Leuconostoc mesenteroides and Saccharomyces cerevisae. Innov Food Sci Emerg Technol 2:41-54.
Ayhan Z, Streaker CB, Zhang QH. 2001a. Design, construction and validation of a
sanitary glove box packaging system for product shelf-life studies. J Food Process Preserv 25(1):183-196.
Ayhan Z, Yeom HY, Zhang QH, Min DB. 2001b. Flavor, color, and vitamin C retention
of pulsed electric field processed orange juice in different packaging materials. J Agric Food Chem 49(2):669-674.
Bagorogoza K, Bowers J, Okot-Kotber M. 2001. The effect of irradiation and modified
atmosphere packaging on the quality of intact chill-stored turkey breast. J Food Sci 66(2):367-372.
Baner AL. 1999. Partition coefficients. In: Piringer OG, Baner AL, editors. Plastic
packaging materials for food. Weinheim, Germany: Wiley-VCH. P 79-95.

188
Baner AL, Kalyankar V, Shoun LH. 1991. Aroma sorption evaluation of aseptic packaging. J Food Sci 56(4):1051-1054.
Barbosa-Canovas GV, Gongora-Nieto MM, Pothakamury UR, Swanson BG. 1999.
Preservation of foods with pulsed electric fields. San Diego, CA: Academic Press. p 1-19, 20-46, 47-75, 76-107, 108-155, 156-171.
Barsotti L, Dumay E, Mu TH, Diaz MDF, Cheftel JC. 2002. Effects of high voltage
electric pulses on protein-based food constituents and structures. Trends Food Sci Technol 12:136-144.
Ben-aziz A, Grossman S, Ascarelli I, Budowski P. 1970. Linoleate oxidation by
lipoxygenase and heme proteins: A direct spectrophotometric assay. Analytical biochem 34:88-100.
Benz R, Zimmermann U. 1980. Pulse-length dependence of the electrical breakdown in
lipid bilayer membranes. Biochimica et Biophysica Acta 597:637-642. Birk EC, Mannheim CH, Saguy IS. 1998. A rapid method to monitor quality of apple
juice during thermal processing. Lebensm-Wiss u-Technol 31:612-616. Bontovits L. 1981. The effect of processing technologies on colour changes in tomato.
Acta Alimentaria 10(3): 215-228. Braddock RJ. 1999. Single strength orange juices and concentrate. In: Handbook of citrus
by-products and processing technology. New York: Wiley. P 53-83. Bryant G, Wolfe J. 1987. Electomechanical stress produced in the plasma membranes of
suspended cells by applied electrical fields. J Membrane Biol 96:129-139. Buslig BS, Carter RD. 1974. Particle size distribution in orange juices. Annu Mtg Flav
State Hortic Soc 87:302-305. Buttery RG, Seifert RM, Guadagni DG, Ling LC. 1971. Characterization of additional
volatile components of tomato. J Agric Food Chem 19:524-529. Buttery RG, Teranishi R, Ling LC, Flath RA, Stern DJ. 1988. Quantitative studies on
origins of fresh tomato aroma volatiles. J Agric Food Chem 36:1247-1250. Buttery RG, Teranishi R, Flath RA, Ling LC. 1990a. Identification of additional tomato
paste volatiles. J Agric Food Chem 38:792-795. Buttery RG, Teranishi R, Ling LC, Turnbaugh JG. 1990b. Quantitative and sensory
studies on tomato paste volatiles. J Agric Food Chem 38:336-340.

189
Calderun-Miranda ML, Barbosa-Canovas GV, Swanson BG. 1999. Inactivation of Listeria innocua in skim milk by pulsed electric fields and nisin. Int J Food Microbiol 51:19-30.
Castro AJ. 1994. Pulsed electric field modification of activity and denaturation of
alkaline phosphatase. Ph.D dissertation. Washington State University. Castro AJ, Swanson BG, Barbosa-Canovas, Zhang QH. 2001a. Pulsed electric field
modification of milk alkaline phosphatase activity. In: Barbosa-Canovas GV, Zhang QH, editors. Pulsed electric fields in food processing: Fundamental aspects and applications. Lancaster, PA: Technomic Publishing Company, Inc. P 65-82.
Castro AJ, Swanson BG, Barbosa-Canovas, Dunker AK. 2001b. Pulsed electric field
modification of milk alkaline phosphatase activity. In: Barbosa-Canovas GV, Zhang QH, editors. Pulsed electric fields in food processing: Fundamental aspects and applications. Lancaster, PA: Technomic Publishing Company, Inc. P 83-103.
Chandler LA, Schwartz SJ. 1987. HPLC separation of cis-trans carotene isomers in fresh
and processed fruits and vegetables. J Food Sci 52(3):669-672. Chang DC, Reese TS. 1990. Changes in membrane structure induced by electroporation as revealed by rapid-freezing electron microscopy. Biophys J 58: 1-12. Chen CS, Shaw PE, Parish ME. 1993. Orange and tangerine juices. In: Nagy S, Chen CS,
Shaw PE, editors. Fruit Juice Processing Technology. Auburndale, FL: Agscience. P 110-165.
Chung TY, Hayase F, Kato H. 1983. Volatile components of ripe tomatoes and their
juices, purees, and pastes. Agric Biol Chem 47(2):343-351. Cole MB, Davies KW, Munro G, Holyoak CD, Kilsby DC. 1993. A vitalistic model to
describe the thermal inactivation of Listeria monocytogenes. J Industrial Microbiol 12:232-239.
Corredig M, Kerr W, Wicker L. 2001. Particle size distribution of orange juice cloud
after addition of sensitized pectin. J Agric Food Chem 49:2523-2526. Cserhalmi Z, Vidacs I, Beczner J, Czukor B. 2002. Inactivation of Saccharomyces
cerevisiae and Bacillus cereus by pulsed electric fields technology. Innov Food Sci & Emerg Technol 3:41-45.
Deak T, Beuchat LR. 1996. Yeasts in specific types of foods. In: Deak T, Beuchat LR,
editors. Handbook of food spoilage yeasts. New York: CRC Press. p 61-96. Dunn JE. 1995. Pulsed light and pulsed electric field for foods and eggs. Poultry Sci
75:1133-1136.
190
Dunn JE. 2001. Pulsed electric field processing: An overview. In: Barbosa-Canovas GV, Zhang QH, editors. Pulsed electric fields in food processing: Fundamental aspects and applications. Lancaster, PA: Technomic Publishing Company, Inc. P 1-30.
Dunn JE, LaCosta R, Pearlman JS, inventors; Maxwell Laboratories, Inc., assignee. 1987
Sep. 22. Methods and apparatus for extending the shelf life of fluid food products. U.S. Patent 4,695,472.
Ekasari I, Jongen WMF, Vermunt AEM, Pilnik W. 1998. Measurement of heat load in
orange juices: Use of microbiological methods. Food Technol 42(5):124-128. Elkins ER, Heuser JR, Chin H. 1988. Detection of adulteration in selected fruit juices.
Food Sci Technol 30:317-341. Eskin NAM, Grossman S, Pinsky A. 1977. Biochemistry of lipoxygenase in relation to
food quality. Crit Rev Food Sci. Nutr 9(11):1-40. Evrendilek GA, Zhang QH, Richter ER. 1999. Inactivation of Escherichia coli O157:H7
and Escherichia coli 8739 in apple juice by pulsed electric fields. J Food Prot 62:793-796.
Evrendilek GA, Jin ZT, Ruhlman KT, Qiu X, Zhang QH, Richter ER. 2000. Microbial
safety and shelf-life of apple juice and cider processed by bench and pilot scale PEF systems. Innov Food Sci Emerg Technol 1:77-86.
FDA. Food and Drug Administration: U.S. Dept. of Health and Human Services. 2001.
FDA publishes final rule to increase safety of fruit and vegetable juices. Available from: http://www.cfsan.fda.gov/~Ird/hhsjuic4.htm. Accessed Feb 6, 2001.
Fiala A, Wouters PC, van den Bosch E, Creyghton YLM. 2001. Coupled electrical-fluid
model of pulsed electric field treatment in a model food system. Innov Food Sci Emerg Technol 2(4):229-238.
Galliard T, Matthew JA, Wright AJ, Fishwick MJ. 1977. The enzymatic breakdown of
lipids to volatile and non-volatile carbonyl fragments in disrupted tomato fruits. J Sci Food Agric 28:863-868.
Garza S, Ibarz A, Pagan J, Giner J. 1999. Non-enzymatic browning in peach puree during
heating. Food Res Int 32:335-343. Giner J, Gimeno V, Espachs A, Elez P, Barbosa-Canovas GV, Martin O. 2000. Inhibition
of tomato (Licopersicon esculentum Mill.) pectin methylesterase by pulsed electric fields. Innov Food Sci & Emerg Technol 1:57-67.
Goodman CL, Fawcett S, and Barringer SA. 2002. Flavor, viscosity, and color analyses
of hot and cold break tomato juices. J Food Sci 67(1):404-408.

191
Gould WA. 1978. Quality evaluation of processed tomato juice. J Agric Food Chem 26(5):1006-1011.
Gould WA. 1992. Tomato production, processing, & technology. 3rd ed. Baltimore: CTI
Publishing. p 202-203, 254, 297-344, 359-367, 436. Grahl T, Markl H. 1996. Killing of microorganisms by pulsed electric fields. Appl
Microbiol Biotechnol 45:148-157. Gunes G, Lee CY. 1997. Color of minimally processed potatoes as affected by modified
atmosphere packaging and antibrowning agents. J Food Sci 62(3):572-575,582. Gupta RP, Murray W. 1988. Pulsed high electric field sterilization. IEEE Pulsed Power
Conf Rec 58-64. Hamilton WA, Sale AJ. 1967. Effects of high electric fields on microorganisms.
Biochimica et Biophysica Acta 148:789-800. Hammer FE. Oxidoreductases. In: Nagodawithana T, Reed G, editors. Enzymes in food
processing. San Diego: Academic Press. 480 p. Harrison SL, Barbosa-Canovas GV, Swanson BG. 1997. Saccharomyces cerevisiae
structural changes induced by pulsed electric field treatment. Lebensm-Wiss u-Technol 30:236-240.
Hayes WA, Smith PG, Morris AEJ. 1998. The production and quality of tomato
concentrates. Critical Reviews in Food Science and Nutrition 38(7):537-564. Hidalgo A, Pompei C, Zambuto R. 1998. Heat damage evaluation during tomato products
processing. J Agric Food Chem 46:4387-4390. Ho SY, Mittal GS, Cross JD. 1997. Effects of high field electric pulses on the activity of
selected enzymes. J Food Eng 31:69-84. Howard RC, Peterson T, Kastl PR. 1987. High performance liquid chromatographic
determination of ascorbic acid in human tears. J Chromatogr 414:434-439. Hulsheger H, Niemann EG 1980. Lethal effects of high voltage pulses on E. coli K12.
Radiat Environ Biophys 18:281-288. Hulsheger H, Pottel J, Niemann EG. 1981. Killing of bacteria with electric pulses of high
field strength. Radiat Environ Biophys 20:53-65. Hulsheger H, Potel J, Niemann EG. 1983. Electric field effects on bacteria and yeast cells.
Radiat Environ Biophys 22:149-162.

192
IFT. Institute of Food Technologists. 2001. IFT’s comments to FDA regarding “Fresh” labeling. Food Technol 55(2):66
Ikegami T, Nagashima K, Shimoda M, Tanaka Y, Osajima Y. 1991. Sorption of volatile
compounds in aqueous solution by ethylene-vinyl alcohol copolymer films. J Food Sci 56(2):500-509.
Indrawati, Van Loey AM, Ludikhuyze LR, Hendrickx ME. 1999. Single, combined, or
sequential action of pressure and temperature on lipoxygenase in green beans (Phaseolus vulgaris L.): A kinetic inactivation study. Biotechnol. Prog. 15:273-277.
Indrawati, Van Loey AM, Ludikhuyze LR, Hendrickx ME. 2001. Pressure-temperature
inactivation of lipoxygenase in green peas (Pisum sativum): A kinetic study. J Food Sci 66(5):686-693.
Jayaram S, Castle GSP, Margaritis A. 1992. Kinetics of sterilization of Lactobacillus
brevis cells by the application of high voltage pulses. Biotechnol Bioeng 40:1412-1420. Jeon BS, Lee CY. 1999. Shelf-life extension of American fresh ginseng by controlled
atmosphere storage and modified atmosphere packaging. J Food Sci 64(2):328-331. Jeyamkondan S, Jayas DS, Holley RA. 1999. Pulsed electric field processing of foods: a
review. J Food Prot 62:1088-1096. Jia M, Zhang QH, Min DB. 1998. Optimization of solid-phase microextraction analysis
for headspace flavor compounds of orange juice. J Agric Food Chem 46:2744-2747. Jia M, Zhang QH, Min DB. 1999. Pulsed electric field processing effects on flavor
compounds and microorganisms of orange juice. Food Chem 65:445-451. Jin ZT, Ruhlman KT, Qiu X, Jia M, Zhang S, Zhang QH. 1998. Shelf-life evaluation of
pulsed electric fields treated aseptically packaging materiald cranberry juice. IFT 1998 Annual Meeting Book of Abstracts, paper no. 34B-10. 70 p.
Jin ZT, Zhang QH. 1999. Pulsed electric field inactivation of microorganisms and
preservation of quality of cranberry juice. J Food Process Preserv 23(6):481-497. Jin ZT, Zhang QH. 1999. Pulsed electric field inactivation of microorganisms and
preservation of quality of cranberry juice. J Food Proc Eng 23:481-497. Joslyn MA. 1961. Physiological and enzymological aspects of juice production. In:
Tressler DK, Joslyn MA, editor. Fruit and Vegetable Juice. Westport, CT: AVI Publishing. p 64-115.
Kaanane A, Kane D, Labuza TP. 1988. Time and temperature effect on stability of
Moroccan processed orange juice during storage. J Food Sci 53:1470-1473.
193
Kacem B, Cornell JA, Marshall MR, Shireman RB, Mattews RF. 1987. Nonenzymatic browning in aseptically packaged orange drinks: Effect of ascorbic acid, amino acids and oxygen. J Food Sci 52:1668-1672.
Katsuki S, Majima T, Nagata K, Kisitsyn I, Akiyama H, Furuta M, Hayashi T, Takahashi
K, Wirkner S. 2000. Inactivation of Bacillus strearothermophilus by pulsed electric field. IEEE Trans Plasma Sci 28:155-160.
Kattan AA, Ogle WL, Kramer A. 1956. Effect of process variables on quality of canned
tomato juice. Proc Am Soc Hort Sci 68:470-481. Kazeniac SJ, Hall RM. 1970. Flavor chemistry of tomato volatiles. J Food Sci 35:519-
530. Keith WD, Harris LJ, Hudson L, Griffiths MW. 1997. Pulsed electric fields as a
processing alternative for microbial reduction in spice. Food Res Int 30:185-191. Kekez MM, Savic P, Johnson BF. 1996. Contribution to the biophysics of the lethal
effects of electric field on microorganisms. Biochimica et Biophysica Acta 1278:79-88. Kilm M, Nagy S. 1988. An improved method to determine nonenzymatic browning in
citrus juices. J Agric Food Chem 36:1271-1274. Kimball DA. 1991. Juice cloud, color of citrus juices and citrus microbiology. In: Citrus
Processing-Quality Control and Technology. New York: Van Nostrand Reinhold. p 73-101, 117-243.
Kinosita K, Tsong TY. 1977. Formation and resealing of pores of controlled sizes in
human erythrocyte membrane. Nature 268(4):438-440. Klim M, Nagy S. 1988. An improved method to determine nonenzymatic browning in
citrus juices. J Agric Food Chem 36:1271-1274. Knorr D, Geulen M, Grahl T, Sitzman W. 1994. Food application of high electric field
pulses. Trends Food Sci Technol 5:71-75. Labuza TP, Baisier WM. 1992. The kinetics of non-enzymatic browning. In:
Schwartzberg HG, Hartel RW, editors. Physical chemistry of foods. NY: Marcel Dekker Inc. p 595-649.
Lado BH, Yousef AE. 2002. Alternative food-preservation technologies: efficacy and
mechanisms. Microbes and Infection 4:433-440. Landois-Garza J, Hotchkiss JH. 1987. Plastic packaging can cause aroma sorption. Food
Eng 4:39-42.

194
Langlois D, Etievant PX, Pierron P, Jorrot A. 1996. Sensory and instrumental characterization of commercial tomato varieties. Zeitshrift fur Lebensmitteluntersuchung und Forschung 203:535-540.
Lee HS, Nagy S. 1988. Relationship of sugar degradation to detrimental changes in citrus
juice quality. Food Technol 42:91-97. Lelieveld HLM, Wouters PC, Leon AE. 2001. Pulsed electric field treatment of food and
product safety assurance. In: Barbosa-Canovas GV, Zhang QH, editors. Pulsed electric fields in food processing: Fundamental aspects and applications. Lancaster, PA: Technomic Publishing Company, Inc. p 259-264.
Leoni O, Iori R, Palmieri S. 1985. Purification and properties of lipoxygenase in
germinating sunflower seeds. J Food Sci 50:88-92. Lindgren M, Aronsson K, Galt S, Ohlsson T. 2002. Simulation of the temperature
increase in pulsed electric field (PEF) continuous flow treatment chambers. Innov Food Sci Emerg Technol 3:233-245.
Liu X, Yousef AE, Chism GW. 1997. Inactivation of Escherichia coli O157:H7 by the
combination of organic acids and pulsed electric fields. J Food Safety 16:287-299. Lubicki P, Cross JD, Jayaram S, Mazurek B, Staroniewicz Z. 1995. Inactivation of
Yersinia enterocolitica gram-negative bacteria using high-voltage pulse technique. IAS ’95, Conference Record of the 1995 IEEE Industry Applications Conference, 13th IAS Annual Meeting, 2:1388-1343. IEEE, New York.
Malvern Instruments. 1995. Getting started. Mannuals. U.K. Malvern.
Marcy J, Hansen A, Graumlich T. 1989. Effect of storage temperature on the stability of aseptically packaged concentrated orange juice and concentrated orange drink. J Food Sci 54:227-230.
Marcy JE, Graumlich TR, Crandall PG, Marshall MR. 1984. Factors affecting storage of
orange concentrated. J Food Sci 49:1628-1629. Marshall M, Nagy S, Rouseff RL. 1986. Factors impacting on the quality of stored citrus
fruit beverages. In: Charalambous G, editors. The shelf life of foods and beverages. Yew York: Elsevier. P 237-254.
Martin O, Qin BL, Chang FJ, Barbosa-Canovas GV, Swanson BG. 1997. Inactivation of
Escherichia coli in skim milk by high intensity pulsed electric fields. J Food Proc Eng 20:317-336.

195
Martin-Belloso O, Zhang Q, Castro AJ, Barbosa-Canovas GV, Swanson BG. 1994. Pulsed electric fields of high voltage to preserve foods: Microbiological and engineering aspects of the process. Spanish J Food Sci Technol 34:1-34.
McDonald CJ, Lloyd SW, Vitale MA, Petersson K, Innings F. 2000. Effects of pulsed
electric field on microorganisms in orange juice using electric field strengths of 30 and 50 kV/cm. J Food Sci 65(6):984-989.
Meilgaard M, Civille GV, Carr BT. 1991. Sensory evaluation techniques. 2nd ed. Boca
Raton, Florida: CRC Press, Inc. p 2-10, 54-55, 60-67, 237-268. 354 p. Mertens B, Knorr D. 1992. Developments of nonthermal processes for food preservation.
Food Technol 46(5):124-133. Meydav S, Saguy I, Kopelman IJ. 1977. Browning determination in citrus products. J
Agric Food Chem 25:602-604. Miki N. 1974. Effects of chemical components on the browning of tomato juice. Agric
Biol Chem 38:499-506. Miki N, Akatsu K. 1971. Effect of the size distribution of tomato pulp on the color of
tomato products. Nippon Shokuhin Kogyo Gakkai-Shi 18(7):303-308. Min S, Zhang QH. 2002a. Inactivation kinetics of tomato juice lipoxygenase by pulsed
electric fields. J Food Sci Min S, Zhang QH. 2002b. Effects of commercial scale pulsed electric field processing on
flavor and color of tomato juice. J Food Sci Min S, Jin ZT, Yeom HY, Min SK, Zhang QH. 2002a. Effects of commercial scale
pulsed electric field processing on the quality of orange juice. J Food Sci Min S, Jin ZT, Zhang QH. 2002b. Effects of Commercial scale pulsed electric field
processing on the quality of tomato juice. J Agric Food Chem Min S, Laura R, Zhang QH. 2002c. Effects of water activity on the inactivation of
Enterobacter cloacae inoculated in chocolate liquor and a model system. J Food Process Preserv 26:323-337.
Morales-Blancas EE, Chandia VE, Cisneros-Zevallos L. 2002. Thermal inactivation
kinetics of peroxidase and lipoxygenase from broccoli, green asparagus and carrots. J Food Sci 67:146-154.
Murdock DI, Troy VS, Folinazzo JF. 1953. Thermal resistance of lactic acid bacteria and
yeast in orange juice and concentrate. Food Res 18:85-89.

196
Nagy S, Dinsmore HL. 1974. Relation of furfural to temperature abuse and flavor change in commercially canned single strength orange juice. J Food Sci 39:1116- 1119.
Nguyen ML, Schwartz SJ. 1998. Lycopene stability during food processing. Proc Soc
Exp Biol Med 218:101-104. Nielsen TJ, Jagerstad IM, Oste RE, Wesslen BO. 1992. Comparative absorption of low
molecular aroma compounds into commonly used food packaging polymer films. J Food Sci 57(2):490-492.
Nienaber U, Shellhammer TH. 2001. High-pressure processing of orange juice: Kinetics
of pectinmethylesterase inactivation. J Food Sci 66(2):328-331. Noble AC. 1975. Investigation of the color changes in heat concentrated tomato pulp. J
Agric Food Chem 23(1):48-49. Palaniappan S, Sastry SK. 1991. Electrical conductivity of selected juices: influences of
temperature, solids content, applied voltage, and particle size. J Food Process Eng 14(4):247-260.
Peleg M. 1995. A model of microbial survival after exposure to pulsed electric fields. J
Sci Food Agric 67:93-99. Piringer OG. 1999. Partition coefficients. In: Piringer OG, Baner AL, editors. Plastic
packaging materials for food. Weinheim, Germany: Wiley-VCH. P 239-285. Podgorska E, Bujak S, Krzyszczk M. 1983. Change in the vitamin C content of fruit and
vegetable juices during production and storage. Pol Przem Ferment Owocowo-Warzywny. 27(4):25-29.
Pol IE, Arendonk WG, Mastwijk HC, Krommer J, Smid EJ, Moezelaar R. 2001.
Sensitivities of germinating spores and carvacrol-adapted vegetative cells and spores of Bacillus cereus to nisin and pulsed electric field treatment. Appl Environ Microbiol 67(4):1693-1699.
Porretta S. 1991. Nonenzymatic browning of tomato products. Food Chem 40:323-335. Pothakamury UR, Monsalve-Gonzalez A, Barbosa-Canovas GV, Swanson BG. 1995a.
Inactivation of Escherichia coli and Staphylococcus aureus in model food systems by pulsed electric field technology. Food Res Int 28(2):167-171.
Pothakamury UR, Vega H, Zhang Q, Barbosa-Canovas GV, Swanson BG. 1996. Effect
of growth stage and processing temperature on the inactivation of E. coli by pulsed electric fields. J Food Prot 59:1167-1171.
197
Qin BL, Chang FJ, Barbosa-Canovas GV, Swanson BG. 1995a. Nonthermal inactivation of Saccharomyces cerevisiae in apple juice using pulsed electric fields. Lebensm Wiss u Technol 28:564-568.
Qin BL, Pothakamury UR, Vega H, Martin O, Barbosa-Canovas GV, Swanson BG.
1995b. Food pasteurization using high intensity pulsed electric fields. Food Technol 49(12):55-60.
Qin BL, Zhang Q, Barbosa-Canovas GV, Swanson BG, Pedrow PD. 1994. Inactivation of
microorganisms by pulsed electric fields with different voltage wave-forms. IEEE Trans Dielec Electric Insul 1(6):1047-1057.
Qin BL, Zhang Q, Barbosa-Canovas GV, Swanson BG, Peedrow PD. 1995c. Pulsed
electric field treatment chamber design for liquid food pasteurization using the finite element method. Trans ASAE 38:557-565.
Qiu X, Sharma S, Tuhela L, Jia M, Zhang QH. 1998. An integrated PEF pilot plant for
continuous nontheraml pasteurization of fresh orange juice. Trans ASAE. 41:1069-1074.
Raso J, Alvarez I, Condon S, Trepat FJS. 2000. Predicting inactivation of Salmonella
senftenberg by pulsed electric fields. Innov Food Sci Emerg Technol 1:21-29. Raso J, Calderon ML, Gongora M, Barbosa-Canovas GV, Swanson BG. 1998a.
Inactivation of mold ascospores and conidiospores suspended in fruit juices by pulsed electric fields. Lebensm Wiss u Technol 668-672.
Raso J, Calderon ML, Gongora M, Barbosa-Canovas G, Swanson BG. 1998b.
Inactivation of Zygosaccharomyces Bailii in fruit juices by heat, high hydrostatic pressure and pulsed electric fields. J Food Sci 63(1):1042-1044.
Rawn JD. 1989. Biochemistry. Burlington, North Carolina: Neil Patterson Publishers. p
150-151. Reina LD, Jin ZT, Zhang QH, Yousef AE. 1998. Inactivation of Listeria monocytogenes
in milk by pulsed electric field. J Food Prot 61(9):1203-1206. Robertson GL. 1993. Food Packaging: principles and practice. New York: Marcel Dekker.
P 9-62, 318-321. Rodriguez-Amaya DB. 1993. Stability of carotenoids during the storage of foods. In:
Developments in food science 33. New York: Elsevier. P 591-628. Rouseff RL, Leahy MM. 1995. Fruit flavors. In: Biogenesis, characterization, and
authentication. Washington DC: American Chemical Society. p 164-181.
198
Ruan S. 2000. Particle engineering of polyimide composites. Master Thesis. The Ohio State University, Columbus, OH.
Ruhlman KT, Jin ZT, Zhang QH. 2001. Physical properties of liquid foods for pulsed
electric field treatment. In: Barbosa-Canovas GV, Zhang QH, editors. Pulsed electric fields in food processing: Fundamental aspects and applications. Lancaster, PA: Technomic Publishing Company, Inc. P 45-56.
Sadler GD, Parish ME, Wicker L. 1992. Microbial, enzymatic, and chemical changes
during storage of fresh and processed orange juice. J Food Sci 57(5):1187-1191. Saguy I, Kopelman IJ, Mizrahi S. 1978. Simulation of ascorbic acid stability during heat
processing and concentration of grapefruit juices. J Food Process Eng 2:213-225. Sale AJH, Hamilton WA. 1967. Effects of high electric fields on microorganisms. I.
Killing of bacteria and yeasts. Biochim Biophys Acta 148:781-788. Sale AJH, Hamilton WA. 1968. Effects of high electric fields in microorganisms. III.
Lysis of erythrocytes and protoplasts. Biochim Biophys Acta 163:37-43. Salvador ML, Jaime P, Oria R. 2002. Modeling of O2 and CO2 exchange dynamics in
modified atmosphere packaging of Burlat cherries. J Food Sci 67(1):231-235. Sensoy I, Zhang QH, Sastry SK. 1997. Inactivation kinetics of Salmonella Dublin by
pulsed electric field. J Food Process Eng 20:367-381. Servili M, Selvaggini R, Taticchi A, Begliomini AL, Montedoro GF. 2000. Relationships
between the volatile compounds evaluated by solid phase microextraction and the thermal treatment of tomato juice: optimization of the blanching parameters. Food Chem 71:407-415.
Sharma SK, Zhang QH, Chism GW. 1998. Development of a protein fortified fruit
beverage and its quality when processed with pulsed electric field treatment. J Food Qual 21:459-473.
Shaw PE. 1986. The flavour of nonalcoholic fruit beverages. In Morton ED, Macleod AJ,
editors. Food flavours. Part B. The flavour of beverages. Amsterdam, The Netherlands: Elsevier. P 337-368.
Shaw PE. 1992. Shelf life and aging of citrus juices, juice drinks and related soft drinks.
In: Redd JB, Shaw PE, Hendrix Jr. CM, Hendrix DL, editors. Quality control manual for citrus processing plants. Auburndale, FL: Agscience. p 173-199.
Sheung SK. 1995. Sorption of orange juice flavor compounds into polymeric packaging
materials. Master Thesis. The Ohio State University, Columbus, OH.

199
Shomer I, Lindner P, Vasiliver R. 1984. Mechanism which enables the cell wall to retain homogenous appearance of tomato juice. J Food Sci 49: 628-633.
Sizer CE, Waugh PL, Edstam S, Ackerman P. 1988. Maintaining flavor and nutrient
quality of aseptic orange juice. Food Technol. 42:152-159. Smith JJ, Linforth R, Tucker GA. 1997. Soluble lipoxygenase isoforms from tomato fruit.
Phytochemistry 45(3):453-458. Squires SR, Hanna JG. 1979. Concentration and stability of vitamin C in marketed
reconstituted orange juice. J Agric Food Chem 27:639-641. Stanley DW. 1991. Biological membrane deterioration and associated quality losses in
food tissues. In: Clydesdale FM, editor. Critical reviews in food science and nutrition. vol 30. New York: CRC Press. P 487-553.
Takeoka GR, Dao L, Flessa S, Gillespie DM, Jewell WT, Huebner B, Bertow D, Ebeler
SE. 2001. Processing effects on lycopene content and antioxidant activity of tomatoes. J Agric Food Chem 49:3713-3717.
Tangwongchai R, Ledward DA, Ames JM. 2000. Effect of high-pressure treatment on
lipoxygenase activity. J Agric Food Chem 48:2896-2902. Thakur BR, Singh RK, Nelson PE. 1996. Quality attributes of processed tomato products:
A review. Food Rev Int 12(3):375-401. Theobald A, Muller A, Anklam E. 1998. Determination of 5-hydroxymethylfurfural in
vinegar samples by HPLC. J Agric Food Chem 46:1850-1854. Tsong TY. 1990. Electrical modulation of membrane proteins: Enforced conformational
oscillations and biological energy and signal transduction. Annu Rev Biophys Chem 19:83-106.
Tsong TY. 1991. Electroporation of cell membranes. Biophys J 60:297-306. Tsong TY, Astunian RD. 1986. Absorption and conversion of electric field energy by
membrane bound ATPases. Bioelectrochem Bioenerg 15:457-476. Van Willige RWG, Linssen JPH, Voragen AGJ. 2000. Influence of food matrix on
absorption of flavor compounds by linear low-density polyethylene: proteins and carbohydrates. J Sci Food Agric 80:1779-1789.
Vega-Mercado H, Powers JR, Barbosa-Canovas GV, Swanson BG. 1995a. Plasmin
inactivation with pulsed electric fields. J Food Sci 60(5):1143-1146

200
Vega-Mercado H, Powers JR, Barbosa-Canovas GV, Swanson BG, Luedecke L. 1995b. Inactivation of a protease from Pseudomonas fluorescens M3/6 using high voltage pulsed electric fields. IFT 1995 Annual Meeting. Book of Abstracts, paper no. 89-3. 267 p.
Vega-Mercado H, Pothakamury UR, Chang FJ, Barbosa-Canovas GV, Swanson BG.
1996. Inactivation of Escherichia coli by combining pH, ionic strength and pulsed electric fields hurdles. Food Research International 29:117-121.
Vega-Mercado H, Qin BI, Belloso OM, Chang FJ, Ma I, Barbosa-Canovas GV, Swanson
BG. 1997. Nonthermal food preservation by pulsed electric fields. In Jowitt R, editor. Proceedings of ICEF 7. UK: Academic Press. P C81-C84.
Vega-Mercado H, Powers JR, Martin-Belloso O, Luedecke L, Barbosa-Canovas,
Swanson BG. 2001. Change in susceptibility of proteins to proteolysis and the inactivation of an extracellular protease from Pseudomonas fluorescens M3/6 when exposed to pulsed electric fields. In: Barbosa-Canovas GV, Zhang QH, editors. Pulsed electric fields in food processing: Fundamental aspects and applications. Lancaster, PA: Technomic Publishing Company, Inc. P 105-120.
Wong DWS. 1995. Lipoxygenase. In: Food Enzymes. New York: Chapman & Hall. p
237-270. Wouters PC, Alvarez I, Raso J. 2001a. Critical factors determining inactivation kinetics
by pulsed electric field food processing. Trends Food Sci Technol 12:112-121. Wouters PC, Bos AP, Ueckert J. 2001b. Membrane permeabilization in relation to
inactivation kinetics of Lactobacillus species due to pulsed electric fields. Appl Environ Microbiol 67:3092-3101.
Yeom HW, Zhang QH, Dunne CP. 1999. Inactivation of papain by pulsed electric fields
in a continuous system. Food Chem 67:53-59. Yeom HW, Streaker CB, Zhang QH, Min DB. 2000a. Effects of pulsed electric fields in
the activity of microorganisms and pectin methyl esterase in orange juice. J Food Sci 65(8):1359-1363.
Yeom HW, Streaker CB, Zhang QH, Min DB. 2000b. Effects of pulsed electric fields on
the quality of orange juice and comparison with heat pasteurization. J Agric Food Chem 48:4597-4605.
Yeom HW, Zhang QH. 2001a. Enzymatic inactivation by pulsed electric fields: A review.
In: Barbosa-Canovas GV, Zhang QH, editors. Pulsed electric fields in food processing: Fundamental aspects and applications. Lancaster, PA: Technomic Publishing Company, Inc. p 57-63.

201
Yeom HW, Evrendilek GA, Jin ZT, Zhang QH. 2001b. Processing of yogurt-based product with pulsed electric fields. IFT 2001 Annual Meeting Book of Abstracts, paper no. 28-7. 47 p.
Yeom HW, Zhang QH, Chism GW. 2002. Inactivation of pectin methyl esterase in
orange juice by pulsed electric fields. J Food Sci 67(6):2154-2159. Yin Y, Zhang QH, Sudhir SK, inventors; The Ohio State University, assignee. 1997 Nov.
25. High voltage pulsed electric field treatment chambers for the preservation of liquid food products. U.S Patent 5,690,978.
Zhang Q, Monsalve-Gonzalez A, Qin B, Barbosa-Canovas GV, Swanson BG. 1994.
Inactivation of Saccharomyces cerevisiae by square wave and exponential-decay pulsed electric field. J Food Proc Eng 17: 469-478.
Zhang Q, Monsalve-Gonzalez A, Barbosa-Canovas GV, Swanson BG. 1994a.
Inactivation of E. coli and S. cerevisiae by pulsed electric fields under controlled temperature conditions. Trans ASAE 37(2):581-587.
Zhang Q, Chang FJ, Barbosa-Canovas GV, Swanson BG. 1994b. Inactivation of
microorganisms in semisolid foods using high voltage pulsed electric fields. Lebensm Wiss u Technol 27(6):538-543.
Zhang Q, Monsalve-Gonzalez A, Qin BL, Barbosa-Canovas GV, Swanson BG. 1994c.
Inactivation of Saccharomyces cerevisiae in apple juice by square-wave and exponential decay pulsed electric fields. J Food Process Eng 17:469-478.
Zhang Q, Barbosa-Canovas GV, Swanson BG. 1995a. Engineering aspects of pulsed
electric field pasteurization. J Food Eng 25:261-281. Zhang Q, Qin BL, Barbosa-Canovas GV, Swanson BG. 1995b. Inactivation of E. coli for
food pasteurization by high-strength pulsed electric fields. J Food Process Preserv 19:103-118.