
REVIEW OF PULSED POWER FOR EFFICIENT HYDROGEN ...
15
REVIEW OF PULSED POWER FOR EFFICIENT HYDROGEN PRODUCTION Nigel Monk 1 *, Simon Watson 1 1 Centre for Renewable Energy Systems and Technology, Holywell Park, Loughborough University, Loughborough, LEICS LE11 3TU, UK *Corresponding Author E-mail: [email protected] ABSTRACT Pulsed power applied to electrolysis offers a potential method for efficient hydrogen production which has not been comprehensively studied to date. Pulsed and plasma electrolysis are introduced and previous research assessed. Electrolysis use in potential space or aerospace applications is substantially weight and volume sensitive. Pulsed plasma electrolysis is able to far exceed the Faradaic limit on electrolysis at very high surface current densities presenting the opportunity to reduce electrode mass and volume. Pulse generation technology is introduced and challenges inherent in application to electrolysis outlined. KEYWORDS: Pulsed Power, Pulsed Electrolysis, Pulsed Plasma, Plasma Electrolysis 1. INTRODUCTION Faster and/or wider adoption of a hydrogen economy should be enhanced by the provision of cheaper hydrogen. By definition, market forces should respond 'automatically' when hydrogen is a better way to make a profit. However, as McDowall and Eames (2003) discuss, the particular shape of the future hydrogen economy which evolves will be influenced by other issues on top of carbon and cost, as well as contrasting views of sustainability. Clearly, geo-political factors at country, or more- local, levels will be important, e.g. Naterer et al. (2008), Lin et al. (2008), Ren et al. (2015). The future may evolve piecemeal as solutions are adopted or implemented for individual applications. Nonetheless, a general goal is to develop an ecologically sound method of producing hydrogen at a cheaper cost than the financial cost of steam reformation of hydrocarbons or fossil fuels. Cost modelling provides a view of the balance of factors contributing to the final price per unit of hydrogen produced, e.g. Guerrero Lemus and Martinez Duart (2010). Lower price per unit requires lower energy input costs (e.g. cheaper electricity or less electricity), lower capital costs (e.g. cheaper materials, less material or longer life equipment), and/or lower feedstock costs. Aqueous electrolysis has the attraction that the main input other than electricity is water. The efficiencies of the electrolysis process usually considered are energy and exergy (e.g. Rosen 1995, Zeng and Zhang 2010). However, a significant factor is capital cost of the embedded material mass within the electrolyser stack (Morgan et al. 2013). 'Volume efficiency' and ‘weight efficiency’, i.e. the physical size and mass of equipment for a given hydrogen production rate, can be seen to be crucially important in any application which would require mobility such as space and aerospace. Mass and volume are driven by the electrode surface area requirement which is a direct consequence of electrolysis being a surface interfacial process. This has the consequence that to increase hydrogen production for a given process, the physical size of the equipment must be increased, with attendant embedded-energy and materials cost implications. Reducing both embedded energy and electrolyser material volume will be achieved by achieving significantly higher electrode surface current density. Achieving higher current density is a central aim of electrolysis research as discussed in review papers such as Carmo et al. (2013). brought to you by CORE View metadata, citation and similar papers at core.ac.uk provided by Loughborough University Institutional Repository
-
Upload
khangminh22 -
Category
Documents
-
view
3 -
download
0
Transcript of REVIEW OF PULSED POWER FOR EFFICIENT HYDROGEN ...

REVIEW OF PULSED POWER FOR EFFICIENT HYDROGEN PRODUCTION
Nigel Monk1*, Simon Watson1
1Centre for Renewable Energy Systems and Technology, Holywell Park, Loughborough University,
Loughborough, LEICS LE11 3TU, UK
*Corresponding Author E-mail: [email protected]
ABSTRACT
Pulsed power applied to electrolysis offers a potential method for efficient hydrogen production which has not been comprehensively studied to date. Pulsed and plasma electrolysis are introduced and previous research assessed. Electrolysis use in potential space or aerospace applications is substantially weight and volume sensitive. Pulsed plasma electrolysis is able to far exceed the Faradaic limit on electrolysis at very high surface current densities presenting the opportunity to reduce electrode mass and volume. Pulse generation technology is introduced and challenges inherent in application to electrolysis outlined.
KEYWORDS: Pulsed Power, Pulsed Electrolysis, Pulsed Plasma, Plasma Electrolysis
1. INTRODUCTION
Faster and/or wider adoption of a hydrogen economy should be enhanced by the provision of cheaper hydrogen. By definition, market forces should respond 'automatically' when hydrogen is a better way to make a profit. However, as McDowall and Eames (2003) discuss, the particular shape of the future hydrogen economy which evolves will be influenced by other issues on top of carbon and cost, as well as contrasting views of sustainability. Clearly, geo-political factors at country, or more-local, levels will be important, e.g. Naterer et al. (2008), Lin et al. (2008), Ren et al. (2015). The future may evolve piecemeal as solutions are adopted or implemented for individual applications.
Nonetheless, a general goal is to develop an ecologically sound method of producing hydrogen at a cheaper cost than the financial cost of steam reformation of hydrocarbons or fossil fuels. Cost modelling provides a view of the balance of factors contributing to the final price per unit of hydrogen produced, e.g. Guerrero Lemus and Martinez Duart (2010). Lower price per unit requires lower energy input costs (e.g. cheaper electricity or less electricity), lower capital costs (e.g. cheaper materials, less material or longer life equipment), and/or lower feedstock costs.
Aqueous electrolysis has the attraction that the main input other than electricity is water. The efficiencies of the electrolysis process usually considered are energy and exergy (e.g. Rosen 1995, Zeng and Zhang 2010). However, a significant factor is capital cost of the embedded material mass within the electrolyser stack (Morgan et al. 2013). 'Volume efficiency' and ‘weight efficiency’, i.e. the physical size and mass of equipment for a given hydrogen production rate, can be seen to be crucially important in any application which would require mobility such as space and aerospace. Mass and volume are driven by the electrode surface area requirement which is a direct consequence of electrolysis being a surface interfacial process.
This has the consequence that to increase hydrogen production for a given process, the physical size of the equipment must be increased, with attendant embedded-energy and materials cost implications. Reducing both embedded energy and electrolyser material volume will be achieved by achieving significantly higher electrode surface current density. Achieving higher current density is a central aim of electrolysis research as discussed in review papers such as Carmo et al. (2013).
brought to you by COREView metadata, citation and similar papers at core.ac.uk
provided by Loughborough University Institutional Repository

The aim of our project is to study the effects of a pulsed DC electrical supply on the efficiencies of a simple alkaline electrolyser in pursuit of a method to achieve ‘High Intensity Aqueous Electrolysis’. A broad view of efficiency measures will be considered, relevant to the intended application. In thermodynamic terms, pulsing can clearly only hope to recover efficiency lost due to poor or pragmatic equipment design, since natural laws may not be exceeded, but circumventing Faraday’s law, which directly relates hydrogen volume only to electrical charge supplied, will allow other sources of energy and particularly their method of delivery to be considered. The costs of increased complexity and losses incurred within additional equipment such as the pulse generator need to be offset against any enhanced hydrogen production process efficiencies.
Many reviews of the state of alternative hydrogen production methods are published (e.g. Holladay et al. 2010), but none since Bockris et al. (1985) has included pulsed electrolysis. Many comprehensive reviews exist focusing on conventional hydrogen production methods such as alkaline electrolysis (e.g. Zeng and Zhang, 2010) or PEM electrolysis (e.g. Carmo et al. 2013), but none exist for pulsed power applied to electrolysis. A search of reviewed literature reveals that hydrogen from pulsed and plasma electrolysis has been researched only intermittently. Ursua et al. (2009) provide a useful example. A more general internet search identifies only the same few papers.
In a number of fields, pulsed electrical input allows operation of a process under conditions for which the same voltage DC input would cause undesirable effects such as inefficiencies, side reactions or equipment damage (e.g. Puippe and Ibl 1980). However, electrical energy pulses may rupture the conductor carrying them, an obvious danger in many situations but a useful effect in others (e.g. Novac et al. 2007). The same can happen to dielectric materials, whether used as insulators, in energy storage (e.g. capacitors), in the many plasma applications or in aqueous solutions in electrolysis.
This paper broadly examines research pointing to a potential method which has not been comprehensively studied.
2. PULSED ELECTROLYSIS
Conventional DC electrolysis of water produces molecules of hydrogen at the cathode as a result of electrons transferring to hydrogen atoms adsorbed to the electrode surface. Molecules aggregate into bubbles until the balance of forces causes surface detachment and movement within the electrolyte. Super-saturation levels of dissolved gas concentration requirements mean that bubbles are less likely to form spontaneously within the bulk (Lumanauw 2000). Electrolysis occurs when the DC voltage applied across the anode and cathode exceeds around 1.6 volts – ie the sum of 1.23 V, the theoretical decomposition voltage at room temperature, plus an electrode over-voltage necessary to drive the reaction at a non-negligible rate. The rate chosen is a balance between a desire to drive the reaction as fast as possible and a proportionate increase in losses from ion diffusion limitations with increasing current. In this sense, DC electrolysis is primarily rate limited by the diffusion of ions through the electrolyte and particularly through the diffusion layer adjacent to the electrode surface.
Immediately following the application of a voltage to an electrolysis cell, for example at the start of a pulse, formation of the Electric Double Layer (EDL) creates a capacitance which, due in part to its favourable geometry of large surface area and small gap, can be of significant value. Often in published electrolysis research there is no mention of capacitance or EDL. This can be understood for steady state conditions where its impact is negated by an activation period preceding any data recording. For plasma studies, it may be due to the electrode arrangement involving ‘point–to-plate’ geometry, wherein capacitance is negligible; electron emission and/or electrolyte breakdown would occur before observable charge could accumulate on the ‘point’ which is usually in the form of a needle tip electrode (Jadidian et al. 2012).
At this stage, Kirchoff’s current law applies; the entire electrical system containing the drive circuitry and electrolysis cell behaves as a single circuit. The cell behaves as a combination of electrical resistance and capacitance (Ursua and Sanchis 2012, Mazloomi and Sulaiman 2013). However, following termination of the voltage, i.e. at the end of the pulse, the capacitance ‘self-discharges’ through the electrolyte, dissipating stored energy via the electrolyte conductivity provided by ion migration, causing continuing electrolysis. The external circuit is disconnected so Kirchoff no longer applies; changes occur via electrochemical reactions not current flow around a circuit. Where the pulse repetition frequency (p.r.f.) and applied voltage are low, such that stable electrolysis is reached before the pulse is terminated, this represents simple interrupted-DC electrolysis.
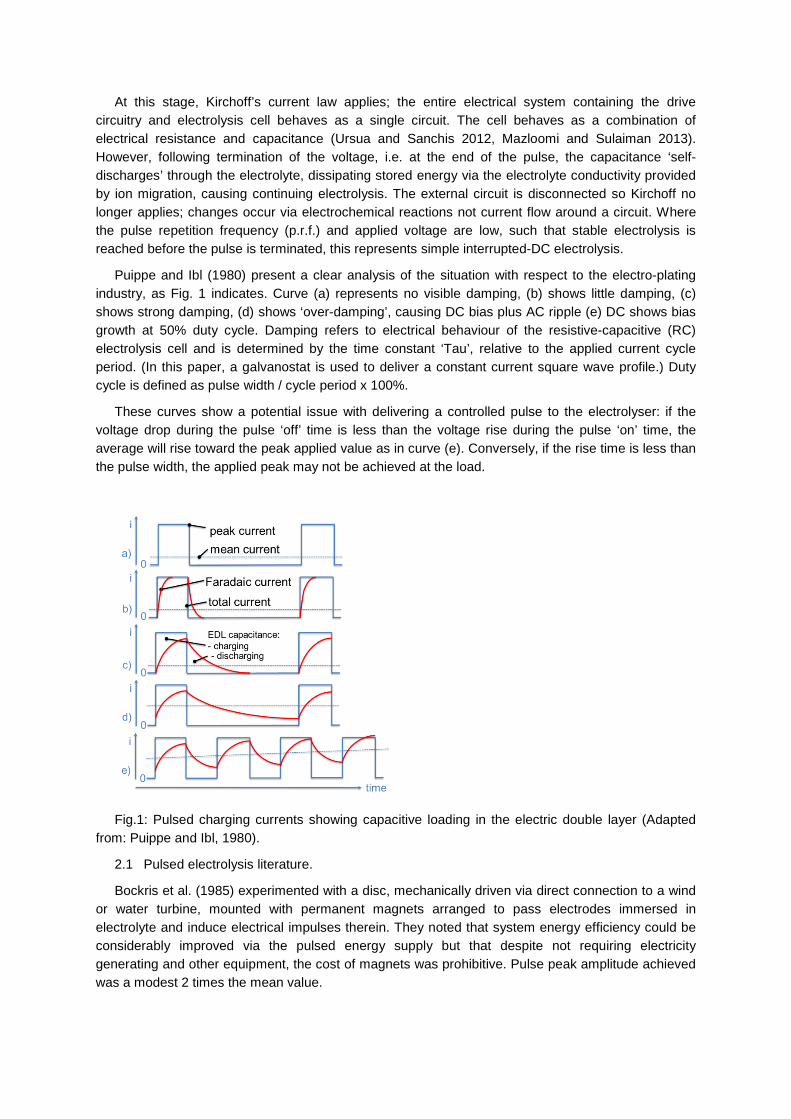
Puippe and Ibl (1980) present a clear analysis of the situation with respect to the electro-plating industry, as Fig. 1 indicates. Curve (a) represents no visible damping, (b) shows little damping, (c) shows strong damping, (d) shows ‘over-damping’, causing DC bias plus AC ripple (e) DC shows bias growth at 50% duty cycle. Damping refers to electrical behaviour of the resistive-capacitive (RC) electrolysis cell and is determined by the time constant ‘Tau’, relative to the applied current cycle period. (In this paper, a galvanostat is used to deliver a constant current square wave profile.) Duty cycle is defined as pulse width / cycle period x 100%.
These curves show a potential issue with delivering a controlled pulse to the electrolyser: if the voltage drop during the pulse ‘off’ time is less than the voltage rise during the pulse ‘on’ time, the average will rise toward the peak applied value as in curve (e). Conversely, if the rise time is less than the pulse width, the applied peak may not be achieved at the load.
Fig.1: Pulsed charging currents showing capacitive loading in the electric double layer (Adapted from: Puippe and Ibl, 1980).
2.1 Pulsed electrolysis literature.
Bockris et al. (1985) experimented with a disc, mechanically driven via direct connection to a wind or water turbine, mounted with permanent magnets arranged to pass electrodes immersed in electrolyte and induce electrical impulses therein. They noted that system energy efficiency could be considerably improved via the pulsed energy supply but that despite not requiring electricity generating and other equipment, the cost of magnets was prohibitive. Pulse peak amplitude achieved was a modest 2 times the mean value.
Shaaban (1994) produced a US Air Force Civil Engineering Division report investigating pulsed DC electrolysis using 5V at 0.5, 5, 10, 25, 40 kHz, at 10, 25, 50, 80% duty cycle. Power required varied from 40W for DC, up to 80W - i.e. pulsing allowed increased power input. These experiments used a commercial ICI Fm01-LC electrolytic cell with polymer Nafion membrane and water. Maximum current density was typically 400mA/cm2. The work was particularly inconclusive and incomplete.
Shimizu et al. (2006) claim to present the first examination of short pulses applied to electrolysis. Their central argument is that if a sufficiently short voltage pulse is applied, neither the electric double layer nor the diffusion layer can fully or stably form, thus the losses from diffusion limitations are avoided. Their calculation of a maximum pulse width (duration) is estimated by assuming the diffusion layer thickness must be larger than the diffusion length during the pulse application, ie that the diffusion layer is not wholly depleted of hydrogen ions during the pulse period.
The maximum pulse width limit is calculated as 3μs in their paper using parameter values they provide. Their pulse generator produces a 300ns pulse between 2.2 to 12.6V. Thus the authors argue their pulse is 1/10th the critical duration and conclude ion movement can be faster (because the bulk ion density is higher) than through a fully formed diffusion layer (where ion density is depleted), leading to the possibility of higher rate electrolysis.
However, re-calculating the maximum pulse width limit using their formula and values provided results in a critical pulse duration of 30 ns which is 10 times shorter than their input pulse. It must be questioned whether the experiments did reach the necessary regime to test their hypothesis or remained within the realm of simple interrupted-DC electrolysis.
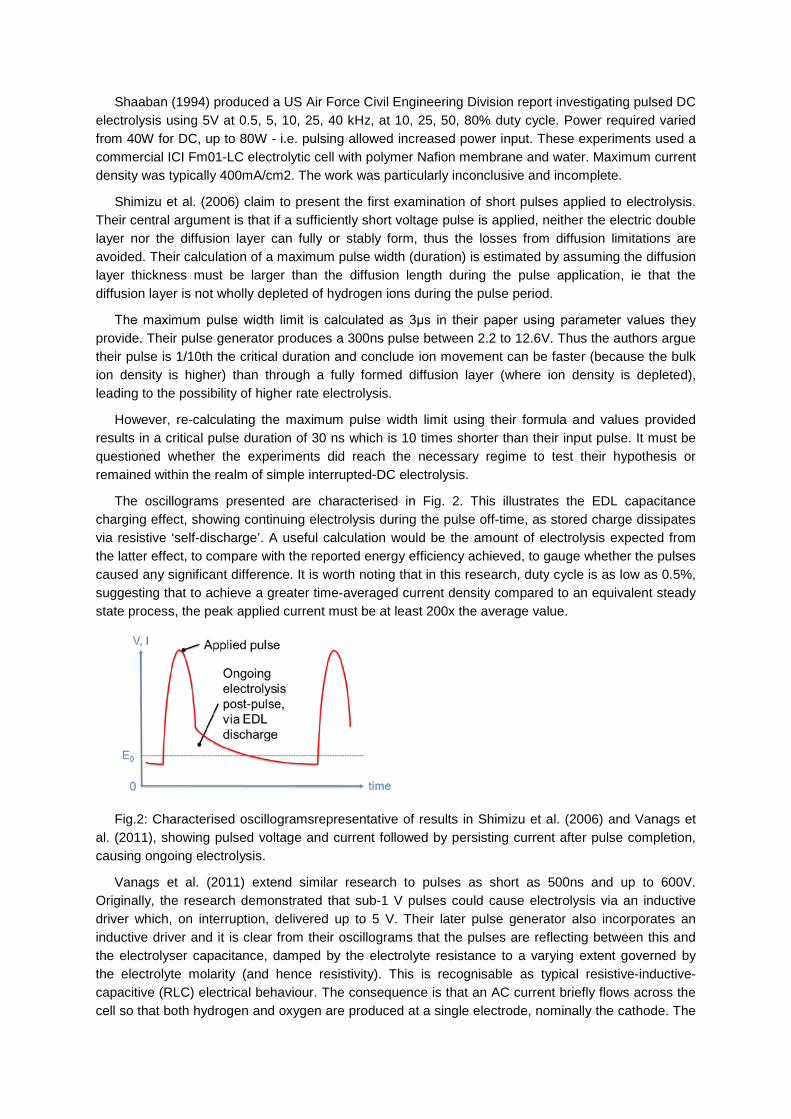
The oscillograms presented are characterised in Fig. 2. This illustrates the EDL capacitance charging effect, showing continuing electrolysis during the pulse off-time, as stored charge dissipates via resistive ‘self-discharge’. A useful calculation would be the amount of electrolysis expected from the latter effect, to compare with the reported energy efficiency achieved, to gauge whether the pulses caused any significant difference. It is worth noting that in this research, duty cycle is as low as 0.5%, suggesting that to achieve a greater time-averaged current density compared to an equivalent steady state process, the peak applied current must be at least 200x the average value.
Fig.2: Characterised oscillogramsrepresentative of results in Shimizu et al. (2006) and Vanags et al. (2011), showing pulsed voltage and current followed by persisting current after pulse completion, causing ongoing electrolysis.
Vanags et al. (2011) extend similar research to pulses as short as 500ns and up to 600V. Originally, the research demonstrated that sub-1 V pulses could cause electrolysis via an inductive driver which, on interruption, delivered up to 5 V. Their later pulse generator also incorporates an inductive driver and it is clear from their oscillograms that the pulses are reflecting between this and the electrolyser capacitance, damped by the electrolyte resistance to a varying extent governed by the electrolyte molarity (and hence resistivity). This is recognisable as typical resistive-inductive-capacitive (RLC) electrical behaviour. The consequence is that an AC current briefly flows across the cell so that both hydrogen and oxygen are produced at a single electrode, nominally the cathode. The
alternating current is visible in the presented oscillograms. The authors propose that the initial high voltage pulse injects additional electrons into the electrolyte, beyond those that are initially transferred onto adsorbed hydrogen ions, and that these react to create the detected oxygen molecules. However, an alternative and possibly simpler hypothesis is that the electrode becomes anodic while current direction is reversed, producing oxygen via a conventional reaction.
More usefully, the oscillograms again illustrate the relaxation behaviour between pulses, as stored charge is dissipated via self-discharge, and the necessary relation between pulse width and pulse gap. The onset of plasma generation is not mentioned.
3. PLASMA ELECTROLYSIS
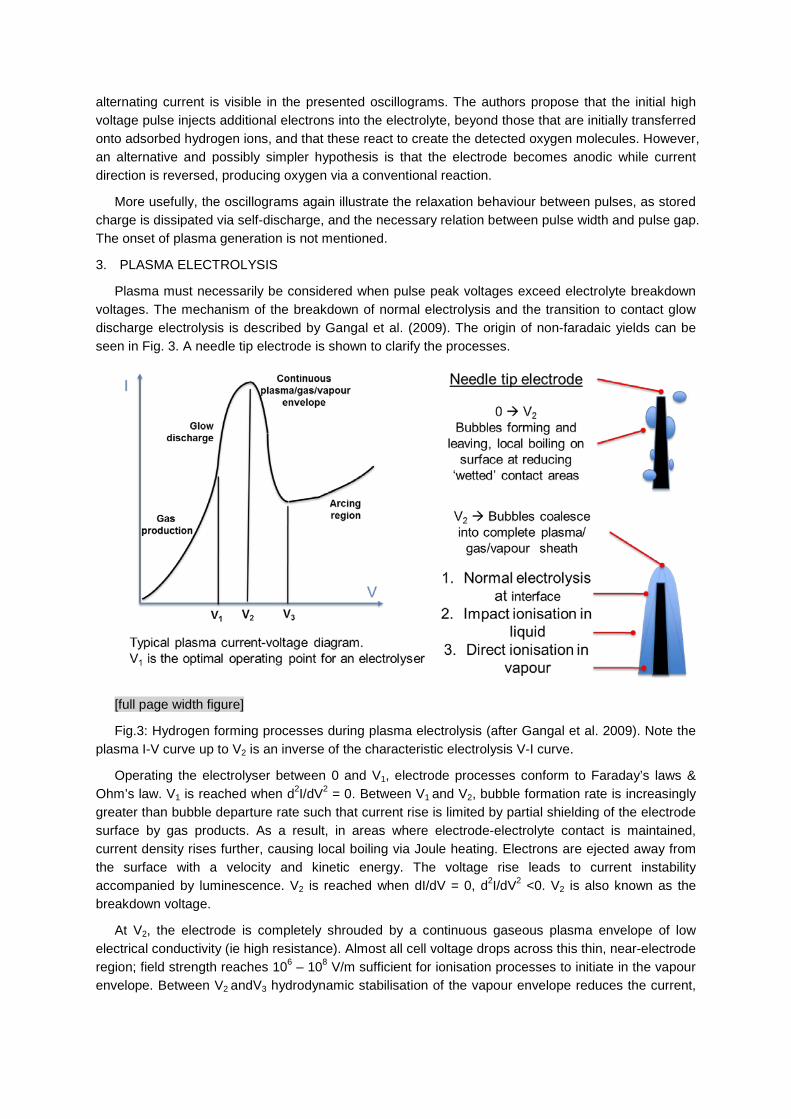
Plasma must necessarily be considered when pulse peak voltages exceed electrolyte breakdown voltages. The mechanism of the breakdown of normal electrolysis and the transition to contact glow discharge electrolysis is described by Gangal et al. (2009). The origin of non-faradaic yields can be seen in Fig. 3. A needle tip electrode is shown to clarify the processes.
[full page width figure]
Fig.3: Hydrogen forming processes during plasma electrolysis (after Gangal et al. 2009). Note the plasma I-V curve up to V2 is an inverse of the characteristic electrolysis V-I curve.
Operating the electrolyser between 0 and V1, electrode processes conform to Faraday’s laws & Ohm’s law. V1 is reached when d2I/dV2 = 0. Between V1 and V2, bubble formation rate is increasingly greater than bubble departure rate such that current rise is limited by partial shielding of the electrode surface by gas products. As a result, in areas where electrode-electrolyte contact is maintained, current density rises further, causing local boiling via Joule heating. Electrons are ejected away from the surface with a velocity and kinetic energy. The voltage rise leads to current instability accompanied by luminescence. V2 is reached when dI/dV = 0, d2I/dV2 <0. V2 is also known as the breakdown voltage.
At V2, the electrode is completely shrouded by a continuous gaseous plasma envelope of low electrical conductivity (ie high resistance). Almost all cell voltage drops across this thin, near-electrode region; field strength reaches 106 – 108 V/m sufficient for ionisation processes to initiate in the vapour envelope. Between V2 andV3 hydrodynamic stabilisation of the vapour envelope reduces the current,
the envelope grows and impedance increases. From V3 onwards, glow discharge transforms into intensive arcing. V3 is reached when dI/dV = 0, d2I/dV2 >0.
Essentially, the objective of pulsed power is to raise V1 without incurring the losses that occur under DC electrolysis.
3.1 Plasma electrolysis literature
Current densities up to 15 A/cm2 are reported by Iza et al. (2009) using pulsed discharges to sustain atmospheric pressure plasmas in air. This is several times higher than is typical in alkaline or PEM electrolysis as described in e.g. Carmo et al's 2013 review on PEM progress. Iza’s system delivers instantaneous power density in excess of 1 MW/m2, compared to 2-4 mW/cm2 (20-40 W/m2) typical for PEM electrolysis. The apparatus is not, however, optimised toward hydrogen production.
Mizuno et al. (2005) describe a series of experiments in which electrolysis is driven at voltages up to 400V DC and current density 2-4 A/cm2. These exceed electrolyte breakdown voltage and cause reactions in the realm of plasma electrolysis. Gas production is reported as up to 20 times the Faradaic limit in water, and 80 times in water vapour, although energy efficiency is around 10%. The process also consumes or destroys the tungsten electrode at an unsustainable rate. However, this work demonstrates the feasibility of going beyond a surface electrochemical reaction to produce hydrogen from within the electrolyte bulk.
In these experiments, the cathode is in the form of a vertical 2cm x 1.5mm diameter tungsten rod whilst the anode is a 5 x 15cm platinum mesh formed into a cylinder around the cathode (approximately 5cm diameter). Both electrodes are suspended in the same electrolyte (0.2M K2CO3) although loosely separated by a glass funnel arranged around the cathode to catch cathodic gases. These are anlaysed using a quadrupole mass spectrometer. Plasma onset was observed at 80V and 4A/cm2 and the authors hypothesize that dissociation was primarily via direct pyrolysis. However, pulsing the driving voltage was not investigated.
Bockris et al. (1985) distinguish between plasmolysis – the use of plasma to generate temperatures sufficient to directly dissociate water into oxygen and hydrogen by pyrolysis, and plasma assisted electrolysis, where plasma is generated to produce photons of appropriate energy so that water could be dissociated in the gas phase. However, the latter requires the addition of aluminium to the plasma thus is not a sustainable approach since it will be oxidised and require re-refining. The authors comment on the difficulty analysing non-thermal plasmas because they do not reach chemical stability, reflecting the steady state limitation on the purview of electrochemistry still prevalent in the 1980’s.
Boudesocque et al. (2006) have also studied hydrogen production by thermal water splitting or plasmolysis. The key difficulty is the quenching, or rapid cooling, of the plasma products in an attempt to prevent recombination which is highly probable due to the co-location of the separated molecules and the highly energetic environment. In related research on the destruction of waste hydrogen sulphide, Nunnally et al. (2014) describe progress in maintaining hydrogen yield whilst reducing energy consumption by introducing oxygen to the plasma reactor vessel. The vessel will typically have a single pair of concentric electrodes with a relatively large volume of working fluid between them. Plasma reactions including hydrogen evolution occur within the bulk of the working fluid, not on the electrode surfaces. Again, the key to success is rapid quenching of the products.
The chemistry and physics of plasma reactions, particularly during onset, are not fully understood (Locke and Thagard 2012). The authors provide an extended review of literature on mathematical modelling of electrical discharge plasmas formed directly in liquid water, covering streamers, arcs and sparks. This modelling does not extend to plasma nucleation or development. Gangal et al. (2009) describe the onset of Contact Glow Discharge Electrolysis (CGDE) and match models and

experiments to the mechanism described by Helmholtz-Taylor hydrodynamic boiling heat transfer theory.
In a series of papers, Seepersad et al. (2013) combine single point to plate, single pulse experiments, observed via ultra-fast photography, with ponderomotive electrostriction theory to understand plasma pre-onset chemistry, particularly the role if any of nano-bubbles in the electrolyte bulk. Sub nanosecond (~400ps), well defined, high voltage (~15-20kV), square pulses are examined singly. This important work has revealed the possibility of plasma formation in liquids without the initial bubble growth stage (Starikovskiy et al. 2011), and under the application of electric fields below the threshold predicted for direct breakdown (Dobrynin 2013). Key to the mechanisms conjectured is the requirement of extremely fast voltage rise times (<5ns).
In the above series of experiments, using a needle tip as the active electrode avoids capacitive loading on the driving pulse. Thus the falling edge of the pulse is faster (~5ns) than planar electrode experiments as used by Shimizu et al. (2006) and Vanags et al. (2011). During the falling edge, a not wholly understood ionisation wave is observed, with propagation speeds approaching 5000 km/s. The authors note the contrast with longer rise time (~40ns) experiments that cause gaseous filamentary channels which propagate at ~2.5-35km/s.
At no time were bubbles observed after the pulses, down to 5μm, against a discharge channel diameter of 50-100μm. The generally accepted view of the fundamental process leading to formation of plasma in liquid media is low density cavities (micro-bubbles) facilitating electron avalanche to initiate breakdown, convincingly elucidated in Bruggerman and Leys (2009), and Ceccatto (2009), with various mechanisms of bubble formation considered (e.g. liquid evaporation due to Joule heating or electrostatic expansion).
The authors note the lack of adequate theoretical basis to model non-equilibrium plasma discharge development in liquids (in 2011), and that their study considers the propagation stage only; initiation at the metal/liquid interface requires additional research. The authors discuss the possibility of void formation given the pulse rise times and conclude that neither electrostatic forces nor thermal expansion pressure waves have sufficient time. They thus conclude the mechanism of direct electron ionisation due to electric field is occurring within the plasma channels.
The authors remark how sensitive the phenomenon is to small changes in voltage rise rate; breakdown is initiated under 2.5MV/cm for a pulse with a rise time of 5.77kV/ns, but no discharge is seen for a rising front of 4.5kV/ns despite a maximum field of 2.7MV/cm. They ascribe this to the hydrodynamic forces having more time to react against slower nanopore growth up to a critical size. Shneider et al. (2012) offer the team’s theoretical study of the initial stage of sub-nanosecond pulsed breakdown in liquid dielectrics.
Thus their initial aim to promote plasma discharge without density reduction is modified in that the conventional bubble growth mechanism is pre-empted via a density altering phenomenon, electrostriction, providing voltage rise rate is sufficiently rapid.
Bockris et al. (1985) also briefly discuss using shock waves to dissociate water and mention research by Boyd and Burns (1981). However, the scale of challenge within this method is shown by research into the behaviour of materials under extra-terrestrial planetary conditions; when subjected to the surface gravity of a gas giant, liquid is compressed to half its terrestrial volume. At a liquid density of ~2g/cm3, there are substantially no bonds in bulk water remaining intact (Schwegler et al. 2001).
4. MODELLING
This section discusses the ability of modelling to create insights to the reaction of an electrolyser under varying electrical inputs. Computer simulation is a tool which is used to test hypotheses; it is an

aid to absorb an otherwise impossible calculation task. If a stable solution is produced, the model has converged and system behaviour may be characterised. If the results reveal an unexpected insight, it is likely the hypothesis has been inadequately analysed or modelled.
Consider first a kinetic model of hydrogen production by plasmolysis of water vapour in an atmospheric pressure, dielectric barrier discharge (DBD), micro-channel reactor (Rehman et al. 2012). The starting reactants comprise an amount of water vapour slightly above boiling point and electrons at varying energy levels between 3 − 5eV and densities, typical of non-thermal plasmas. The presence of a homogeneous quantity of electrons is assumed to be produced by a plasma within the water vapour flow.
The model combines data on reaction pathways drawn from many published studies into a comprehensive arrangement whereby each pathway can be prohibited to study the impact on ion and radical evolution. ‘Dissociation reaction’ and ‘dissociative attachment of electrons’ were found to dominate the water vapour breakdown processes but essentially the outcome reflects the values of reaction rate constants input to the model and demonstrates the nature of mathematical modelling such as this study: Initial conditions will, by definition, assuming convergence is achieved, always evolve to a balanced and steady end state but the relation of the outcome to a physical electrolyser is not evinced.
An alternative approach is to model the behaviour of the electrolyser as an equivalent set of components in an electrical circuit. Ursua et al. (2009) model the electrolyser as a simple resistor but Mazloomi and Sulaiman (2013) place a capacitance in parallel with a resistance to represent the electrolysis cell, in series with an equivalent circuit inductance and resistance. Their purpose is to study the frequency response of the cell to complex current waveforms such as might be delivered by ‘Pulse Width Modulation’ (PWM) control regulators, for example. They conclude the experimental cell shows a second order behaviour characteristic of the resistive-capacitive-inductive (RLC) equivalent circuit proposed. The circuit exhibits a resonant frequency at which minimum impedance is reached, depending on the electrodes’ sizes, spacing and electrolyte molarity.
In a later work, Ursua et al. (2012) develop a more comprehensive electrical equivalent circuit which recognises the different sources of impedance and capacitance between the two electrodes and within the electrolyte, similar to the electrical circuit analogy of Zeng and Zhang (2010). Their purpose is to develop a model capable of predicting electrolyser response to any type of electrical profile input. Typically expected variations would arise from the effects of grid-tied renewable energy sources, for example a wind turbine connected to an electrolyser for storing surplus electricity. The authors identify and evaluate the separate capacitances due to electric double layer (EDL) effects on both the cathode and anode. The electrical variations are typically input at 150Hz with higher frequency harmonics.
The authors use MATLAB-Simulink software. An alternative might be an electrical circuit simulation in one of the versions of SPICE. Milewski et al. (2014) presents a simplified version of the resistive capacitive model which is more appropriate to use for analysis of large complex systems and delivers results within a few percent accuracy of the Ursua electrolysis cell model. However, for the present study, detailed conditions during the pulse leading edge are expected to be key.
Practical limits to computing power require all models to incur simplifying assumptions. In contrast, ab initio models of water structure can, subject to severe constraints, illuminate dynamic behaviour at atomic particle level from scientific first principles. Limited computing power constrains such simulations to include only a few atoms, e.g. a 4x4x4 repeated cube (Hassanali, 2011). A further constraint is that, because atomic level activity takes place on a femto-second timescale, using any such model to study microsecond scale events is practically impossible.
Nonetheless, some useful insights can be found. Auto- or self-protonation or –protolysis is the phenomenon whereby a proton moves to another, adjacent water molecule. The mechanism of proton-transfer or 'hopping' is known as the Grotthus mechanism. In a milestone study, Geissler et al. (2001) show that the rare auto-protolysis of a water molecule (once every 10 hours) is induced by occasional large fluctuations in the electric field generated by the surrounding solvent, i.e. by other water molecules.
Geissler showed that the fluctuations driving auto-ionisation involve the concerted motion of many atoms, as could be expected for a condensed phase chemical reaction. Their simulated system consists of 32 water molecules periodically replicated in space. The complete auto-ionisation event needs coincident breaking of a water wire* (hydrogen bond) to allow continued separation for up to 1ps. The separated ion state sits in an energy well ~20 kCal/mol lower than its neutral state. Recombination is driven not simply by distance but by number of bonds or coordination shells. Separated ions will continue to exist beyond the second coordination shell, i.e. more than 6-7 Ǻ apart. [*A water wire is a term for several water molecules or ions joined in a linear structure as opposed to the clathrate or tetrahedral structural features predominant in bulk water.]
Thus Geissler showed that applying an external electric field can dramatically change the energetic balance of the dissociation reaction from being extremely unfavourable to favouring occurrence.
Classical molecular-dynamics simulation studies by Reischl et al. (2009) have shown that the important contributions to the electric field acting on O-H bonds stem from water molecules less than 7 Ǻ away, corresponding to charges on water molecules of the first and second hydration shells, and that they are able to generate instantaneous fields up to 2.5 to 3.0 V/Ǻ – some ten times that required for dissociation.
Saitta et al. (2012) build on the foregoing progress and, using an ab initio molecular dynamics study of the dissociation of water under an electric field, establishes the quantitative relation between intensity of electric field and extent of dissociation. Classical models are unable to report these variations due to assuming fixed bond lengths.
An important distinction is that Saitta considers the properties of bulk water under an external electric field and consider the numbers of ions created and their lifetimes against the intensity of the fields. For example, at the dissociation threshold (0.35 V/˚A) a single molecule undergoes, on average, 3 proton-hopping events in a time-span of 1 picosecond, about 6 at 0.5 V/˚A, up to 10 at 1.0 V/˚A, and the fraction of instantaneously ionized molecules increases accordingly. In particular, at the most intense field a fraction ≈ 0.15 − 0.20 of the total number of molecules are instantaneously ionic, giving rise to an ohmic conductivity of about 7.8 Ω−1 cm−1 (Seepersad et al. 2013).
The latter finding is in fairly good agreement with the available experimental values of water dissociation under pressures larger than 20 GPa (e.g. Chau et al. 2001, Schwegler et al. 2001). In particular, the authors observed in shock-wave experiments a conductivity of about 30 Ω−1 cm−1, which they attributed to a massive presence of ionic species; they also estimated that fully ionized water (i.e. 100% of dissociated molecules) should have, at those regimes, a conductivity of about 36 Ω−1 cm−1.
These atomic simulations illuminate the potential effects of electrons injected via a plasma but the assumption of a uniform externally applied field will not persist within an electrolysis cell due to the formation of the electric double layers which create an opposing space charge to prevent the field penetrating to the bulk of the electrolyte. Thus, first principles modelling cannot at present provide a clear indication of the effects of applying a pulsed electric supply to a practical aqueous electrolyser.
5. PULSE GENERATION

A number of approaches to pulse power application can be distinguished. This section briefly outlines three and comments on their applicability to hydrogen production before introducing pulse generator technology and suitable experimental topologies.
5.1 Maximum power discrete pulses
Generator development is driven by diverse applications including ground penetrating radar. In this application a highly repetitive, ultra broadband radiation is required. The objective in this category is to achieve the maximum power in a discrete pulse at a repetition rate as high as the equipment design will allow. Sometimes a single pulse is studied. Maximum power is measured as voltage and current rise rate (dV/dt and dI/dt). Pulse repetition frequency (p.r.f.) is generally constrained by waste heat removal. The issue as far as efficient hydrogen production is concerned is that discrete pulses generally only achieve a low averaged power throughput, so the objective to minimise electrolyser volume will be compromised. In contrast, if extended time between pulses is advantageous to allow gas removal, discrete pulses may be an appropriate approach.
5.2 AC Plasma
AC plasma is used in the study of waste remediation and air purification. Plasma studies generally use an AC pulse because they are concerned with maximising energy input to cause a non-equilibrium plasma to maximise ionising radical creation or ionic changes to the subject of the plasma study. A high frequency is standardised at 13.56 MHz. Pulsed plasma is occasionally deployed to assist in quenching the plasma processes.
Applying AC to an electrolyser will cause evolution of cathodic and anodic gases to evolve at the same electrode leading to potentially explosive mixes, recombination losses and the deferred problem of separation, compromising one of the major benefits of electrolysis, production of ultra pure hydrogen.
5.3 Unipolar square waves.
Pulsed lasers use a 'Pockels cell' to control the light output. Pockels cells require a fast rising and falling unipolar pulse and, although this is similar to the needs of an electrolyser, for laser pulse control, energy efficiency is not an over-riding concern. Thus the fast closing speed is achieved by 'dumping' the energy used to charge the cell and electric switch technology has developed to suit. Also, Pockels cells typically have a capacitance of ~10pF whereas electrolysis cell capacitance could be any amount depending on the scale. Puippe and Ibl (1980) estimated the EDL capacitance of an electrode in an aqueous solution to be ~10μF/cm2.
5.4 Short pulse generator technology
A brief review of short pulse generator technology is provided in Mankowski and Kristiansen (2000).
Pulses are characterised by rise time and duration, peak voltage, peak power and average power, fall time and repetition frequency as shown in Fig. 4.
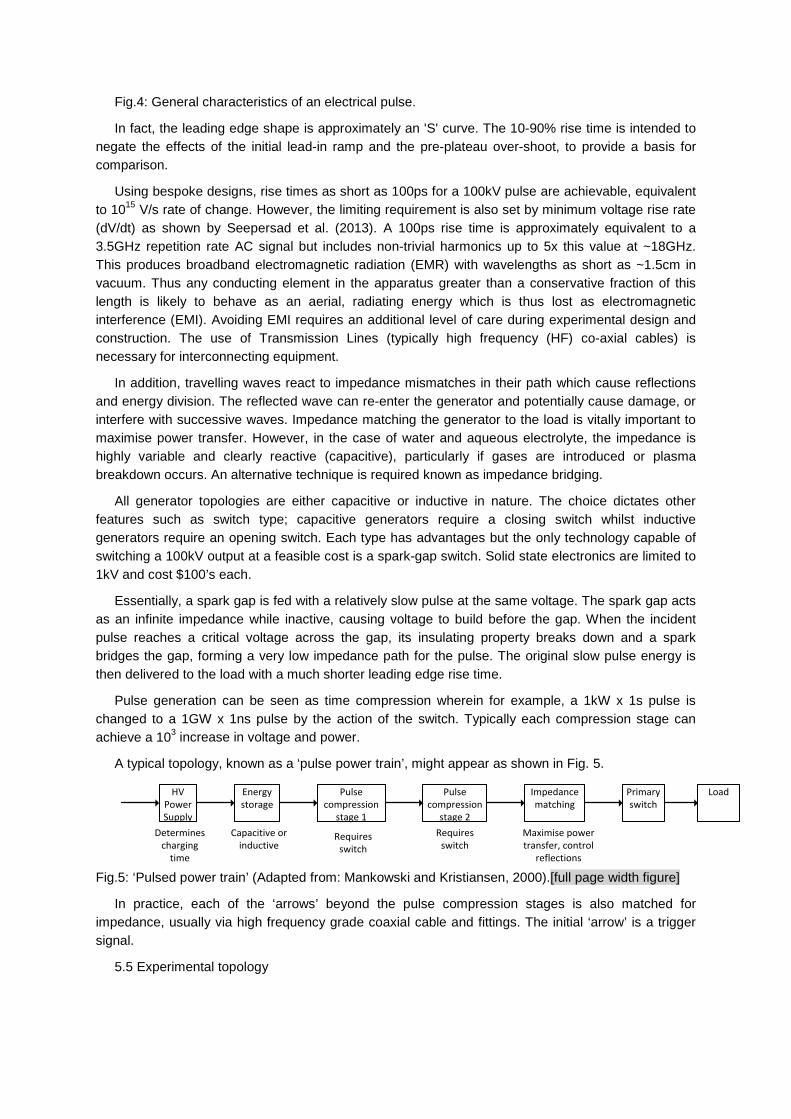
Fig.4: General characteristics of an electrical pulse.
In fact, the leading edge shape is approximately an 'S' curve. The 10-90% rise time is intended to negate the effects of the initial lead-in ramp and the pre-plateau over-shoot, to provide a basis for comparison.
Using bespoke designs, rise times as short as 100ps for a 100kV pulse are achievable, equivalent to 1015 V/s rate of change. However, the limiting requirement is also set by minimum voltage rise rate (dV/dt) as shown by Seepersad et al. (2013). A 100ps rise time is approximately equivalent to a 3.5GHz repetition rate AC signal but includes non-trivial harmonics up to 5x this value at ~18GHz. This produces broadband electromagnetic radiation (EMR) with wavelengths as short as ~1.5cm in vacuum. Thus any conducting element in the apparatus greater than a conservative fraction of this length is likely to behave as an aerial, radiating energy which is thus lost as electromagnetic interference (EMI). Avoiding EMI requires an additional level of care during experimental design and construction. The use of Transmission Lines (typically high frequency (HF) co-axial cables) is necessary for interconnecting equipment.
In addition, travelling waves react to impedance mismatches in their path which cause reflections and energy division. The reflected wave can re-enter the generator and potentially cause damage, or interfere with successive waves. Impedance matching the generator to the load is vitally important to maximise power transfer. However, in the case of water and aqueous electrolyte, the impedance is highly variable and clearly reactive (capacitive), particularly if gases are introduced or plasma breakdown occurs. An alternative technique is required known as impedance bridging.
All generator topologies are either capacitive or inductive in nature. The choice dictates other features such as switch type; capacitive generators require a closing switch whilst inductive generators require an opening switch. Each type has advantages but the only technology capable of switching a 100kV output at a feasible cost is a spark-gap switch. Solid state electronics are limited to 1kV and cost $100’s each.
Essentially, a spark gap is fed with a relatively slow pulse at the same voltage. The spark gap acts as an infinite impedance while inactive, causing voltage to build before the gap. When the incident pulse reaches a critical voltage across the gap, its insulating property breaks down and a spark bridges the gap, forming a very low impedance path for the pulse. The original slow pulse energy is then delivered to the load with a much shorter leading edge rise time.
Pulse generation can be seen as time compression wherein for example, a 1kW x 1s pulse is changed to a 1GW x 1ns pulse by the action of the switch. Typically each compression stage can achieve a 103 increase in voltage and power.
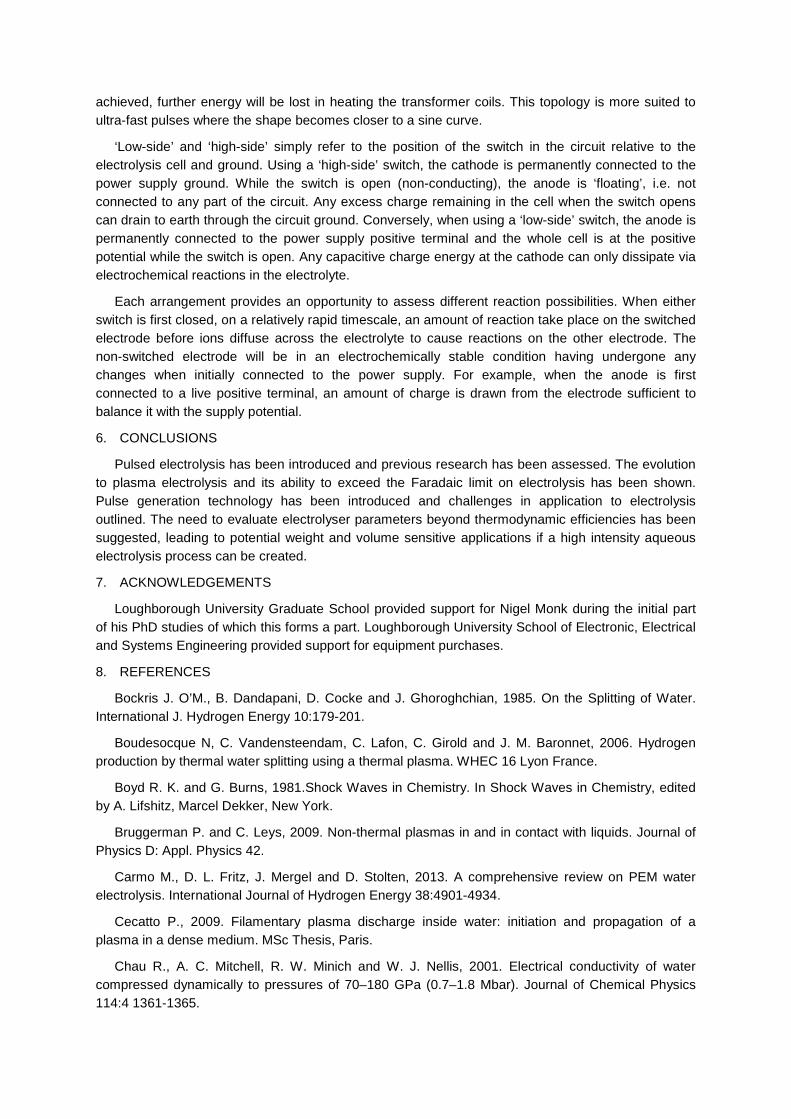
A typical topology, known as a ‘pulse power train’, might appear as shown in Fig. 5.
HV Power Supply
Energy storage
Pulse compression
stage 1
LoadPrimary switch
Determines charging
time
Capacitive or inductive
Requires switch
Pulse compression
stage 2Requires
switch
Impedance matching
Maximise power transfer, control
reflections
Fig.5: ‘Pulsed power train’ (Adapted from: Mankowski and Kristiansen, 2000).[full page width figure]
In practice, each of the ‘arrows’ beyond the pulse compression stages is also matched for impedance, usually via high frequency grade coaxial cable and fittings. The initial ‘arrow’ is a trigger signal.
5.5 Experimental topology

The electrolyser requires pulses with fast rise time and controllable rise time and amplitude. Generally a square pulse is desirable to maximise power throughput; if the rise time and fall time in Fig. 4 extend, they eventually merge to produce a triangular or ‘saw-tooth’ shape as shown in Fig. 6.
Fig.6: Blurring of the distinction between square, triangle and sine waves against increasing p.r.f. Higher frequency may not be possible; shorter pulses may lead to intermittent pulsing.
Examining parts suppliers' parts lists for a widely available solid state electronic component suitable for a primary switch to be an Infineon IPP200N15N3 power MOSFET with 150V 50A capability. Switching time for the device is ~8ns which forms the pulse rise time assuming no other speed limiting factors impinge.
If rise and fall times are set to 1% of pulse width each to ensure ‘square-ness’ of the pulse, maximum feasible p.r.f. using the IPP200N15N3 equals 625KHz at 50% duty cycle. 50% duty is arbitrary but desirable because of the over-riding objective to make the system more compact; a lower duty represents a lower average energy input rate.
Fig. 7 shows the three topologies for applying pulsed power to an electrolyser.
DC
Power Supply
GND
Electrolyser
Switch
N) High side switch
DC
Power Supply
GND
Electrolyser
Switch
a) Isolated switch
Transformer
DC
Power Supply
GND
Electrolyser
Switch
c) Low side switch
Fig.7: Switching topologies.
Applying the pulsed power supply to the load (i.e. the electrolysis cell) via a transformer allows both electrodes to be driven equally; any current circulates around the external circuit including the cell. This is known as applying a balanced pulse. The arrangement allows the switch to be isolated from the load which eases the electronic challenge as well as isolating the supply, preventing any reflections from entering and potentially damaging the circuitry. However, this presents a difficulty if a square wave is desired since transformers will only pass AC; once a stable current plateau is
achieved, further energy will be lost in heating the transformer coils. This topology is more suited to ultra-fast pulses where the shape becomes closer to a sine curve.
‘Low-side’ and ‘high-side’ simply refer to the position of the switch in the circuit relative to the electrolysis cell and ground. Using a ‘high-side’ switch, the cathode is permanently connected to the power supply ground. While the switch is open (non-conducting), the anode is ‘floating’, i.e. not connected to any part of the circuit. Any excess charge remaining in the cell when the switch opens can drain to earth through the circuit ground. Conversely, when using a ‘low-side’ switch, the anode is permanently connected to the power supply positive terminal and the whole cell is at the positive potential while the switch is open. Any capacitive charge energy at the cathode can only dissipate via electrochemical reactions in the electrolyte.
Each arrangement provides an opportunity to assess different reaction possibilities. When either switch is first closed, on a relatively rapid timescale, an amount of reaction take place on the switched electrode before ions diffuse across the electrolyte to cause reactions on the other electrode. The non-switched electrode will be in an electrochemically stable condition having undergone any changes when initially connected to the power supply. For example, when the anode is first connected to a live positive terminal, an amount of charge is drawn from the electrode sufficient to balance it with the supply potential.
6. CONCLUSIONS
Pulsed electrolysis has been introduced and previous research has been assessed. The evolution to plasma electrolysis and its ability to exceed the Faradaic limit on electrolysis has been shown. Pulse generation technology has been introduced and challenges in application to electrolysis outlined. The need to evaluate electrolyser parameters beyond thermodynamic efficiencies has been suggested, leading to potential weight and volume sensitive applications if a high intensity aqueous electrolysis process can be created.
7. ACKNOWLEDGEMENTS
Loughborough University Graduate School provided support for Nigel Monk during the initial part of his PhD studies of which this forms a part. Loughborough University School of Electronic, Electrical and Systems Engineering provided support for equipment purchases.
8. REFERENCES
Bockris J. O’M., B. Dandapani, D. Cocke and J. Ghoroghchian, 1985. On the Splitting of Water. International J. Hydrogen Energy 10:179-201.
Boudesocque N, C. Vandensteendam, C. Lafon, C. Girold and J. M. Baronnet, 2006. Hydrogen production by thermal water splitting using a thermal plasma. WHEC 16 Lyon France.
Boyd R. K. and G. Burns, 1981.Shock Waves in Chemistry. In Shock Waves in Chemistry, edited by A. Lifshitz, Marcel Dekker, New York.
Bruggerman P. and C. Leys, 2009. Non-thermal plasmas in and in contact with liquids. Journal of Physics D: Appl. Physics 42.
Carmo M., D. L. Fritz, J. Mergel and D. Stolten, 2013. A comprehensive review on PEM water electrolysis. International Journal of Hydrogen Energy 38:4901-4934.
Cecatto P., 2009. Filamentary plasma discharge inside water: initiation and propagation of a plasma in a dense medium. MSc Thesis, Paris.
Chau R., A. C. Mitchell, R. W. Minich and W. J. Nellis, 2001. Electrical conductivity of water compressed dynamically to pressures of 70–180 GPa (0.7–1.8 Mbar). Journal of Chemical Physics 114:4 1361-1365.

Dobrynin D., Y. Seepersad, M. Pekker and M. Shneider, 2013. Non-equilibrium nanosecond-pulsed plasma generation in the liquid phase (water, PDMS) without bubbles: fast imaging, spectroscopy and leader-type model. Journal of Physics D: Applied Physics 46.
Gangal U., M. Srivastava and S. K. Sengupta, 2009 . Mechanism of the Breakdown of Normal Electrolysis and the Transition to Contact Glow Discharge Electrolysis. Journal of the Electrochemical Society 156:10.
Geissler P. L., C. Dellago, D. Chandler, J. Hutter and M. Parinello, 2001. Autoionisation in liquid water. SCIENCE 291:2121-2124.
Guerrero Lemus R. and J. M. Martinez Duart, 2010. Updated hydrogen production costs and parities for conventional and renewable technologies. International Journal of Hydrogen Energy 35:3929-3936.
Hassanali A., M. K. Prakesh, H. Eshet and M. Parrinello, 2011. On the recombination of hydronium and hydroxide ions in water. PNAS 108:51 20410–20415.
Holladay J.D., J.Hu, D. L. King and Y. Wang, 2010. An overview of hydrogen production technologies.Catalysis Today 139:244-260.
Iza F., J. L. Walsh and M. G. Kong, 2009. From Submicrosecond- to Nanosecond-Pulsed Atmospheric-Pressure Plasmas. IEEE Transactions on Plasma Science 37:1289-1296.
Jadidian J., M. Zahn, N. Lavesson, O. Widlund and K. Borg, 2012. Impulse breakdown delay in dielectric liquids.Applied Physics Letters 100:192910-192914.
Lin Z., C-W.Chen, J. Ogden and Y. Fan, 2008. The least-cost hydrogen for Southern California. International Journal of Hydrogen Energy 33:3009:3014.
Locke T. and S. M. Thagard, 2012. Analysis and Review of Chemical Reactions and Transport Processes in Pulsed Electrical Discharge Plasma Formed Directly in Liquid Water. Plasma Chemistry and Plasma Processing 32:5 875-917.
Lumanauw, D. 2000. Hydrogen Bubble Characterisation in Alkaline Electrolysis. MSc Thesis, University of Toronto, Toronto.
Mankowski J. and M. Kristiansen, 2000. A Review of Short Pulse Generator Techonology. IEEE Transactions on Plasma Science 28:1.
Mazloomi K, and N. Sulaiman, 2013. Analysis of the frequency response of a water electrolysis cell. International Journal of Electrochemical Science 8.
McDowall W. and Eames, M, 2003. Towards a sustainable hydrogen economy: A multi-criteria sustainability appraisal of competing hydrogen futures. International Journal of Hydrogen Energy 32:4611-4626.
Milewski J., G. Guandalini and S. Campanari, 2014. Modeling an alkaline electrolysis cell through reduced-order and loss-estimate approaches. Journal of Power Sources 269:203-211.
Mizuno T., T. Akimoto, K. Azumi, T. Ohmori, Y. Aoki and A. Takahashi, 2005. Hydrogen Evolution by Plasma Electrolysis in Aqueous Solution. Japanese Journal of Applied Physics 44:1a 396–401
Morgan E. R., J. F. Manwell and J. G. McGowan, 2013. Opportunities for economies of scale with alkaline electrolyzers. International Journal of Hydrogen Energy 38:15903-15909.
Naterer G. F., M. Fowler, J. Cotton and K. Gabriel, 2008. Synergistic roles of off-peak electrolysis and thermochemical production of hydrogen from nuclear energy in Canada. International Journal of Hydrogen Energy 33:6849-6857.

Novac B. M., I. R. Smith, P. R. Downs, P. Marston and D. Fahey, 2007. Cockpit canopy shattering using exploding wire techniques. Journal of Physics D: Applied. Physics 40:2217–2222.
Nunnally T., K. Gutsol, A. Rabinovich, A. fridman and A. Gutsol, 2014. Plasma dissociation of H2S with O2 addition. International Journal of Hydrogen Energy 39:12480-12489.
Puippe, J.-C. and N. Ibl, 1980. Influence of charge and discharge of electric double layer in pulse plating. Journal of Applied Electrochemistry 10:775-784.
Rehman F., J. Lozano-Parada and W. Zimmerman, 2012. A kinetic model for H2 production by plasmolysis of water vapours at atmospheric pressure in a dielectric barrier discharge microchannel reactor. International Journal of Hydrogen Energy 37:17678-17690.
Reischl B., J. Kolfinger and C. Dellago 2009. The statistics of electric field fluctuations in liquid water. Molecular Physics 107:495-502.
Ren J., S. Gao, S. Tan, L. Dong, A. Scipioni and A. Mazzi, 2015. Role prioritization of hydrogen production technologies for promoting hydrogen economy in the current state of China. Renewable and Sustainable Energy Reviews 41:1217-1229.
Rosen M., 1995. Energy and exergy analyses of electrolytic hydrogen production. International Journal of Hydrogen Energy 20:547-553.
Saitta M. A., F. Saija and P. V. Giaquinta, 2012. Ab initio molecular dynamics study of dissociation of water under an electric field. Physical Review Letters 108.
Schwegler E., G. Galli, F. Gygi and R. Q. Hood, 2001. Dissociation of Water under Pressure. Physical Review Letters 87:26.
Seepersad Y., M. Pekker, M. N. Shneider and A. Fridman, 2013. Investigation of positive and negative modes of nanosecond pulsed discharge in water and electrostriction model of initiation. Journal of Physics D: Applied Physics 46.
Shaaban A. 1994. Pulsed DC and Anode Depolarisation in water electrolysis for hydrogen generation.US Air Force.
Shimizu N., S. Hotta, T. Sekiya and Ota 2006. A novel method of hydrogen generation by water electrolysis using an ultra-short-pulse power supply. Journal of Applied Electrochemistry 36:419–423.
Shneider M. N., M. Pekker and A. Fridman, 2012. Theoretical study of the initial stage of sub-nanosecond pulsed breakdown in liquid dielectrics. IEEE Transactions on Dielectrics and Electrical Insulation 19:5 1579-1582.
Starikovskiy A., Y. Yang, Y. I. Cho and A. Fridman, 2011. Non-equilibrium plasma in liquid water.Plasma Sources Science and Technology 20.
Ursua A., L. Marroyo, E. Gubia, L. M. Gandia, P. M. Dieguez and P. Sanchis, 2009. Influence of the power supply on the energy efficiency of an alkaline water electrolyser. International Journal of Hydrogen Energy 34:3221-3233.
Ursua A., and P. Sanchis, 2012. Static-dynamic modelling of the electrical behaviour of a commercial advanced alkaline water electrolyser. International Journal of Hydrogen Energy 37:18598-18614.
Vanags M., J. Kleperis and G. Bajars, 2011. Electrolyses model development for metal/electrolyte interface: Testing with micro respiration sensors. International Journal of Hydrogen Energy 36:13136-1320.
Zeng K. and D. Zhang, 2010. Recent progress in alkaline water electrolysis for hydrogen production and applications. International Journal of Hydrogen Energy 36:307-326.