
Highly efficient CuO incorporated TiO 2 nanotube photocatalyst for hydrogen production from water
9
Highly efficient CuO incorporated TiO 2 nanotube photocatalyst for hydrogen production from water Shiping Xu, Alan Jianhong Du, Jincheng Liu, Jiawei Ng, Darren Delai Sun* School of Civil and Environmental Engineering, Nanyang Technological University, 50 Nanyang Avenue, Singapore 639798, Singapore article info Article history: Received 27 December 2010 Received in revised form 17 February 2011 Accepted 20 February 2011 Available online 24 March 2011 Keywords: TiO 2 nanotube CuO Hydrogen production abstract Highly dispersed CuO was introduced into TiO 2 nanotube (TNT) made by hydrothermal method via adsorptionecalcination process or wet impregnation process, to fabricate CuO incorporated TNT photocatalysts (CuO-TNT) for hydrogen production. It was found that CuO-TNT possessed excellent hydrogen generation activity, which was constantly vigorous throughout 5 h reaction. Depending on the preparation method, hydrogen evolution rates over CuO-TNT were founded in the range of 64.2e71.6 mmol h 1 g 1 catalyst , which was much higher than the benchmark P25 based photocatalysts, and even superior to some Pt/Ni incorporated TNT. This high photocatalytic activity of CuO-TNT was mainly attrib- uted to the unique 1-D tubular structure, large BET surface area and high dispersion of copper component. Compared to wet impregnation, adsorptionecalcination process was superior to produce active photocatalyst, since it was prone to produce photocatalyst with more highly dispersed CuO. Copyright ª 2011, Hydrogen Energy Publications, LLC. Published by Elsevier Ltd. All rights reserved. 1. Introduction Depletion of non-renewable fossil fuels and global warming problem have made hydrogen an ideal future energy source, due to its high energy content and zero emission of green- house gases. Currently, the majority of hydrogen demands are sourced from steam reforming of natural gas; however, this process does not mitigate dependence on fossil fuels, and generates large amount of carbon dioxide. Alternatively, photocatalytic water splitting has been considered as one of the most promising approach for renewable hydrogen production, ever since the discovery of photoelectrochemical water splitting at a TiO 2 electrode by Fujishima and Honda [1]. TiO 2 , as a representative photocatalyst, is used widely because of its high activity, chemical stability, cheap and environ- ment-friendly properties. However, hydrogen generation efficiency over bare TiO 2 is low, mainly due to the fast recombination of electron/hole pairs [2]. To overcome this hindrance, many effective modification techniques to TiO 2 have been identified, such as, noble metal loading [3,4], metal ion doping [5e7], and semiconductor composition [8]. Recently, some researchers found that cost-effective copper incorporated TiO 2 (copper-TiO 2 ) possessed satisfactory pho- tocatalytic activity for the reduction of water under sacrificial conditions to produce hydrogen [9e14], since copper compounds facilitated the charge separation and provided reduction sites for hydrogen formation. In our previous study [15], CuO incorporated TiO 2 (CuO-TiO 2 ) even exhibited supe- rior activity to some noble metals loaded TiO 2 . Moreover, several copper compounds (CuO/Cu 2 O/Cu) have been proved to be active [16e19], which further affirms the huge potential of copper-TiO 2 in photocatalytic hydrogen generation. TiO 2 nanotube (TNT) has been widely studied since its inception and discovery by Kasuga et al. in 1998 [20], by a simple hydrothermal treatment of TiO 2 powder in NaOH aqueous solution. Many studies have been devoted to understand the * Corresponding author. Tel.: þ65 67906273; fax: þ65 67910676. E-mail address: [email protected] (D.D. Sun). Available at www.sciencedirect.com journal homepage: www.elsevier.com/locate/he international journal of hydrogen energy 36 (2011) 6560 e6568 0360-3199/$ e see front matter Copyright ª 2011, Hydrogen Energy Publications, LLC. Published by Elsevier Ltd. All rights reserved. doi:10.1016/j.ijhydene.2011.02.103
-
Upload
independent -
Category
Documents
-
view
1 -
download
0
Transcript of Highly efficient CuO incorporated TiO 2 nanotube photocatalyst for hydrogen production from water

i n t e rn a t i o n a l j o u r n a l o f h y d r o g e n en e r g y 3 6 ( 2 0 1 1 ) 6 5 6 0e6 5 6 8
Avai lab le at www.sc iencedi rect .com
journa l homepage : www.e lsev ie r . com/ loca te /he
Highly efficient CuO incorporated TiO2 nanotubephotocatalyst for hydrogen production from water
Shiping Xu, Alan Jianhong Du, Jincheng Liu, Jiawei Ng, Darren Delai Sun*
School of Civil and Environmental Engineering, Nanyang Technological University, 50 Nanyang Avenue, Singapore 639798, Singapore
a r t i c l e i n f o
Article history:
Received 27 December 2010
Received in revised form
17 February 2011
Accepted 20 February 2011
Available online 24 March 2011
Keywords:
TiO2 nanotube
CuO
Hydrogen production
* Corresponding author. Tel.: þ65 67906273; fE-mail address: [email protected] (D.D.
0360-3199/$ e see front matter Copyright ªdoi:10.1016/j.ijhydene.2011.02.103
a b s t r a c t
Highly dispersed CuO was introduced into TiO2 nanotube (TNT) made by hydrothermal
method via adsorptionecalcination process or wet impregnation process, to fabricate CuO
incorporated TNT photocatalysts (CuO-TNT) for hydrogen production. It was found that
CuO-TNT possessed excellent hydrogen generation activity, which was constantly vigorous
throughout 5 h reaction. Depending on the preparation method, hydrogen evolution rates
over CuO-TNT were founded in the range of 64.2e71.6 mmol h�1 g�1catalyst, which was
much higher than the benchmark P25 based photocatalysts, and even superior to some
Pt/Ni incorporated TNT. This high photocatalytic activity of CuO-TNT was mainly attrib-
uted to the unique 1-D tubular structure, large BET surface area and high dispersion of
copper component. Compared to wet impregnation, adsorptionecalcination process was
superior to produce active photocatalyst, since it was prone to produce photocatalyst with
more highly dispersed CuO.
Copyright ª 2011, Hydrogen Energy Publications, LLC. Published by Elsevier Ltd. All rights
reserved.
1. Introduction hindrance, many effective modification techniques to TiO2
Depletion of non-renewable fossil fuels and global warming
problem have made hydrogen an ideal future energy source,
due to its high energy content and zero emission of green-
house gases. Currently, themajority of hydrogen demands are
sourced from steam reforming of natural gas; however, this
process does not mitigate dependence on fossil fuels, and
generates large amount of carbon dioxide. Alternatively,
photocatalytic water splitting has been considered as one of
the most promising approach for renewable hydrogen
production, ever since the discovery of photoelectrochemical
water splitting at a TiO2 electrode by Fujishima and Honda [1].
TiO2, as a representative photocatalyst, is usedwidely because
of its high activity, chemical stability, cheap and environ-
ment-friendly properties. However, hydrogen generation
efficiency over bare TiO2 is low, mainly due to the fast
recombination of electron/hole pairs [2]. To overcome this
ax: þ65 67910676.Sun).2011, Hydrogen Energy P
have been identified, such as, noble metal loading [3,4], metal
ion doping [5e7], and semiconductor composition [8].
Recently, some researchers found that cost-effective copper
incorporated TiO2 (copper-TiO2) possessed satisfactory pho-
tocatalytic activity for the reduction of water under sacrificial
conditions to produce hydrogen [9e14], since copper
compounds facilitated the charge separation and provided
reduction sites for hydrogen formation. In our previous study
[15], CuO incorporated TiO2 (CuO-TiO2) even exhibited supe-
rior activity to some noble metals loaded TiO2. Moreover,
several copper compounds (CuO/Cu2O/Cu) have been proved
to be active [16e19], which further affirms the huge potential
of copper-TiO2 in photocatalytic hydrogen generation.
TiO2 nanotube (TNT) has been widely studied since its
inceptionanddiscoverybyKasugaetal. in1998 [20], byasimple
hydrothermal treatment of TiO2 powder in NaOH aqueous
solution. Many studies have been devoted to understand the
ublications, LLC. Published by Elsevier Ltd. All rights reserved.

i n t e r n a t i o n a l j o u r n a l o f h y d r o g e n en e r g y 3 6 ( 2 0 1 1 ) 6 5 6 0e6 5 6 8 6561
formationmechanismsof TNTduringhydrothermal synthesis
[21], and to optimize fabrication conditions [22], as well as to
study the properties of TNT. It has been reported that TNT
possesses a unique combination of morphological and physi-
cochemical properties, such as large specific surface area,
mesoporous structure, high aspect ratio, and efficient electron
conductivity [23]. TNT has exhibited immense potential in
a wide variety of applications, ranging from environmental
purification [24,25], energystorage [26] andgas sensing [27], but
little is known about its performance in photocatalytic
hydrogen production. In the limited studies about TNT for
hydrogen generation, TNT with Pt [28e30], Ir and Co nano-
particles [31], or hydrated Ni complex [32] was proved to be
active; however, no performance about cost-effective copper
incorporated TNThas been investigated yet. Herewe reported,
for the first time, that CuO-TNT possessed excellent hydrogen
generation activity, even superior to some Pt/Ni incorporated
TNT. This may pave way for the large application of highly
efficient CuO-TNT photocatalyst in hydrogen generation.
In this paper, 1-D TNT was fabricated via hydrothermal
route, and then incorporated with CuO by adsorptionecalci-
nation (AeC) or wet impregnation (WI) method. After struc-
ture and component characterizations, the fabricated CuO-
TNT was evaluated in photocatalytic hydrogen generation. It
was found that CuO-TNT fabricated by AeC method was
highly efficient for hydrogen generation, with activity superior
to sample fabricated byWImethod, andmuch better than P25
based photocatalysts. Factors contributing to high activity
were also discussed in this paper.
2. Experimental
2.1. Preparation of TNT and CuO-TNT
TNT was fabricated by a typical hydrothermal method fol-
lowed by calcination process. Degussa P25 (Germany) powder
was added to 10 M NaOH (Merck, AR) aqueous solution, fol-
lowed by an ultrasonic process and thorough mixing. The
homogeneous suspensionwas then hydrothermally treated in
a Teflon-lined autoclave at 150 �C for 48 h. The obtained
precipitate was first washed with de-ionized water (Milli-Q,
ultrapure), and then dispersed into 0.1 M HCl (Merck, AR)
under continuous stirring for 24 h. The acid treatment was
repeated for 3 times, and the product was washed thoroughly
with de-ionizedwater until the resulting pHwas neutral. After
drying in a freeze dryer, the product was calcined at 400 �C to
obtain the final TNT photocatalyst.
Copper compound was introduced into TNT by AeC or WI
method, with Cu(NO3)2$3H2O (Merck, GR) as precursor. With
reference to our previous study [15], during fabrication, Cu/Ti
ratio was controlled at 10 atom% by adjusting Cu(NO3)2concentration.
Adsorption of Cu2þ on TNT in AeCmethod was carried out
in Cu(NO3)2 solution with aqueous ammonia, since high pH
promoted cation adsorption on TNT, and Cu2þ could be stabi-
lized by complexation with ammonia. During preparation,
aqueous ammonia solution was added into Cu(NO3)2 solution
dropwise to forma clear solution. TNTwas then dispersed into
the respective solution and stirred for 20 h to ensure
homogeneous dispersion and diffusion. After carefully
washing with de-ionized water to remove excess Cu2þ, theproduct was dried at 60 �C overnight and calcined in air at
400 �C for 2 h. The obtained sample was denoted as TNT-AeC.
In WI method, TNT was added into Cu(NO3)2 solution at
a ratio of 1g/3 ml, followed by ultrasonication and thorough
mixing to obtain a homogeneous slurry. After wet impregna-
tion, the sample underwent same dry and calcination
processes as TNT-AeC, to yield TNT-WI photocatalyst.
As comparison, P25 based CuO-TiO2 photocatalysts (CuO-
P25) were also fabricated by AeC and WI methods, and were
denoted as P25-AeC, and P25-WI, respectively.
2.2. Characterization of TNT and CuO-TNT
X-ray diffraction (XRD) pattern was obtained using a Bruker
D8 Advance X-ray diffractometer with monochromated high-
intensity Cu Ka radiation (l ¼ 1.5418 A). Elemental composi-
tions of photocatalyst were detected using an energy disper-
sive X-ray spectrometer (EDS) attached to a scanning electron
microscope (Jeol JSM-6360). Samplemorphology was observed
by a high-resolution transmission electron microscope
(HRTEM, Jeol JEM-2010). BET surface area and pore size
distribution were determined at liquid nitrogen temperature
(77 K) using a Micromeritics ASAP 2010 system. X-ray photo-
electron spectroscopy (XPS) analysis was carried out in an
ultrahigh vacuum chamber with a base pressure below
2.66 � 10�7 Pa at room temperature. Photoemission spectra
were recorded by a Kratos Axis Ultra spectrometer equipped
with standard monochromatic Al Ka excitation source
(hn ¼ 1486.71 eV). All binding energies were referenced to C 1s
at 284.8 eV. Absorption spectra of photocatalysts were recor-
ded using a Thermo Scientific Evolution 300 UVevisible
spectrophotometer equipped with an integration sphere.
2.3. Photocatalytic hydrogen production
The photocatalytic reaction was performed in an inner-irra-
diation type Pyrex reactor (volume: 270 ml) with a 400 W high
pressure Hg lamp (Riko, UVL-400HA) as the light source. The
peak wavelength of the Hg lamp is centred at 365 nm. To
maintain a constant reactor temperature of 25 �C, a quartz
water jacket, whichwas cooled by recycledwater, was utilized
to cover the lamp. Powdered photocatalyst was suspended in
10 volume% methanol water mixture at a concentration of
1 g L�1. A magnetic stirrer was placed at the bottom of the
reactor to ensure homogeneity of the suspension during
reaction. Prior to irradiation, the photocatalyst suspension
was de-aerated thoroughly for 30min by nitrogen gas purging.
Gas produced via the photocatalytic reaction was analyzed
using an off-line TCD-type gas chromatography (Agilent
7890A, HP-PLOT MoleSieve/5A).
3. Results and discussion
3.1. Characterization of photocatalysts
Fig. 1 shows theXRDpatternsof theas-preparedTNTandCuO-
TNT photocatalysts, with P25 based photocatalysts as

Fig. 2 e EDS spectra of photocatalysts (a: TNT; b: TNT-AeC;
c: TNT-WI).
i n t e rn a t i o n a l j o u r n a l o f h y d r o g e n en e r g y 3 6 ( 2 0 1 1 ) 6 5 6 0e6 5 6 86562
comparison. It can be seen that the fabricated TNT and CuO-
TNT exhibited characteristic features of anatase TiO2 (JCPDS
21-1272), but no obvious copper components were detected in
CuO-TNT samples, although EDS analysis of CuO-TNT
confirmed the existence of copper. Xu et al. reported the
instances where diffraction peaks of copper species dis-
appeared when copper component was highly dispersed in
TiO2 [33]. Therefore, it is believed that the copper components
in CuO-TNT were highly dispersed in the samples, with small
dimensions below XRD detection limit. Different from CuO-
TNT samples, in XRD pattern of P25-WI, diffraction peaks of
tenoriteCuO (JCPDS48-1548)wereclearlyobserved, evidencing
relativelypoorerdispersionof coppercomponents inP25based
samples. In addition, diffraction pattern of pure TNT indicated
that crystallinity of TiO2 in TNT was poorer than P25. The
calcination process carried out during copper incorporation
improved crystallinity and enhanced the intensity of TiO2
peaks in TNT-WI sample; whereas TNT-AeC possessed better
thermalstability, andmaintainedsimilardiffractionpatternas
TNT. Thiswas related to the exchange of Cu2þ into TNT lattice,
and would be discussed in the XPS analysis later.
EDS was employed to detect elemental compositions of
photocatalysts, with spectra showed in Fig. 2 and data
summarized in Table 1. In EDS spectrum of TNT, peaks of C, O,
Au, Ti were clearly observed, where C and Au were attributed
to the carbon tape and gold coating required by the EDS test.
Therefore, the as-prepared TNT sample was supposed to
contain only O and Ti elements. Na was expected to be
introduced into the fabricated TNT during the alkaline
hydrothermal process [34]; however, it was not detected in
EDS analysis. It indicated that Na concentration in the sample
was reduced by repeated washing in dilute HCl solution, and
less than the lower detection limit of EDS. In the spectra of
CuO-TNT samples, Cu peakswere clearly observed, alongwith
elements presented in TNT. Comparing Cu/Ti ratio in all TNT
and P25 based CuO-TiO2 samples (Table 1), it is interesting to
find that TNT-AeC contained nearly same amount of copper
Fig. 1 e XRD patterns of photocatalysts (a: TNT; b: TNT-
AeC; c: TNT-WI; d: P25; e: P25-AeC; f: P25-WI).
with TNT-WI, whereas copper content in P25-AeC was much
lower than P25-WI. Considering the preparation procedure, it
indicated that, TNT possessed great Cu2þ adsorption ability,
which was much higher than P25.
Microstructures of the fabricated TNT and CuO-TNT were
studied by HRTEM. Fig. 3a revealed that TNT possessed
a multilayered nanotubular structure, and the majority of
nanotubes were open at both ends. The inner and outer
diameters of the nanotubes were c.a. 5e7 nm and 10e12 nm,
respectively. With copper incorporation, TNT-AeC sample
still maintained similar tubular structure with TNT, while
some aggregation of nanotubes occurred. Surprisingly, no
obvious copper component could be identified from HRTEM
image of TNT-AeC. On the contrary, in TNT-WI sample,
particles of copper componentwith diameter of c.a. 3 nmwere
clearly observed. Larger cluster of copper component in TNT-
WI than TNT-AeC might be due to characteristics of WI
method: continuously variation of liquid phase composition
during drying, and less adsorption of Cu2þ on TNT surface. In
addition, for TNT-WI sample, 1-D structure of TNT was still
maintained; nevertheless, the inner tubes became much
narrower, even disappeared, and relatively serious aggrega-
tion of nanotubes occurred.
Table 1 e Summary of elemental compositions detectedby EDS and BET surface area of photocatalysts.
Catalyst Elementalcomposition (atom %)
Cu/Ti (%) BET surfacearea
(m2 g�1)O Ti Cu
TNT 58.2 41.8 0.0 0.0 279.9
TNT-AeC 49.0 46.8 4.2 9.0 152.4
TNT-WI 54.5 41.6 4.0 9.6 96.3
P25-AeC 45.5 51.4 3.1 6.0 41.0
P25-WI 65.9 30.7 3.5 11.3 36.1

Fig. 3 e HRTEM images of photocatalysts (a: TNT; b: TNT-AeC; c: TNT-WI).
i n t e r n a t i o n a l j o u r n a l o f h y d r o g e n en e r g y 3 6 ( 2 0 1 1 ) 6 5 6 0e6 5 6 8 6563
BET surface area of photocatalyst was determined by N2
adsorption/desorption, with data summarized in Table 1. N2
adsorption/desorption isotherm of the as-prepared TNT
exhibiteda typical type IVcurvewithahysteresis loop (datanot
shown), indicating mesoporosity of the photocatalyst [35].
Mesoporous nanotubular structure endowed the fabricated
TNT with large BET surface area of 279.9 m2 g�1, which could
account for the superior Cu2þ adsorption ability of TNT
compare to P25. However, copper incorporation depressed BET
surface area of TNT to a certain extent; surface areas of TNT-
AeC and TNT-WI reduced to 152.4 and 96.3 m2 g�1, respec-
tively. Nevertheless, compared to CuO-P25, TNT based photo-
catalysts still possessed relatively large surface area, which is
attractive and critical towards enhancing photoactivity.
Pore size distribution curves of the photocatalysts (Fig. 4)
supported the observation of HRTEM images and BET surface
area changes. The nanotubular TNT exhibited distinct pore
size distribution curve, which comprised two portions with
peak values of c.a. 2e3 nmand 20e30 nm, respectively. Taking
into account the morphology of TNT, the smaller pores could
be attributed to the inner wall of the nanotubes, with its size
similar to the inner diameter of the nanotubes; while, the
larger pores should refer to the pores between the nanotubes
[22]. With incorporation of copper, TNT-AeC sample main-
tained similar pore size distribution as TNT, but pore volumes
of both portions were observed to decrease. It seems that both
inner and outer surfaces of TNT were occupied by copper
species. Considering pore size distribution curvewith EDS and
HRTEM results, it is believed that the copper component in
TNT-AeC sample was attached and highly dispersed on both
inner and outer surfaces of TNT, without forming any visible
clusters in the HRTEM image. For TNT-WI sample, small pores
corresponding to pores inside of TNT almost disappeared;
meanwhile, larger pores, associated with pores between the
nanotubes, shrank to smaller size, with diameters of
10e20 nm. This is consistent with the observation of HRTEM
image: narrowing of inner tube pores and aggregation of
nanotubes. Both phenomena attributed to the large particles
of copper component prepared viaWImethod, where plugged
copper particles narrowed even blocked the inner hollow
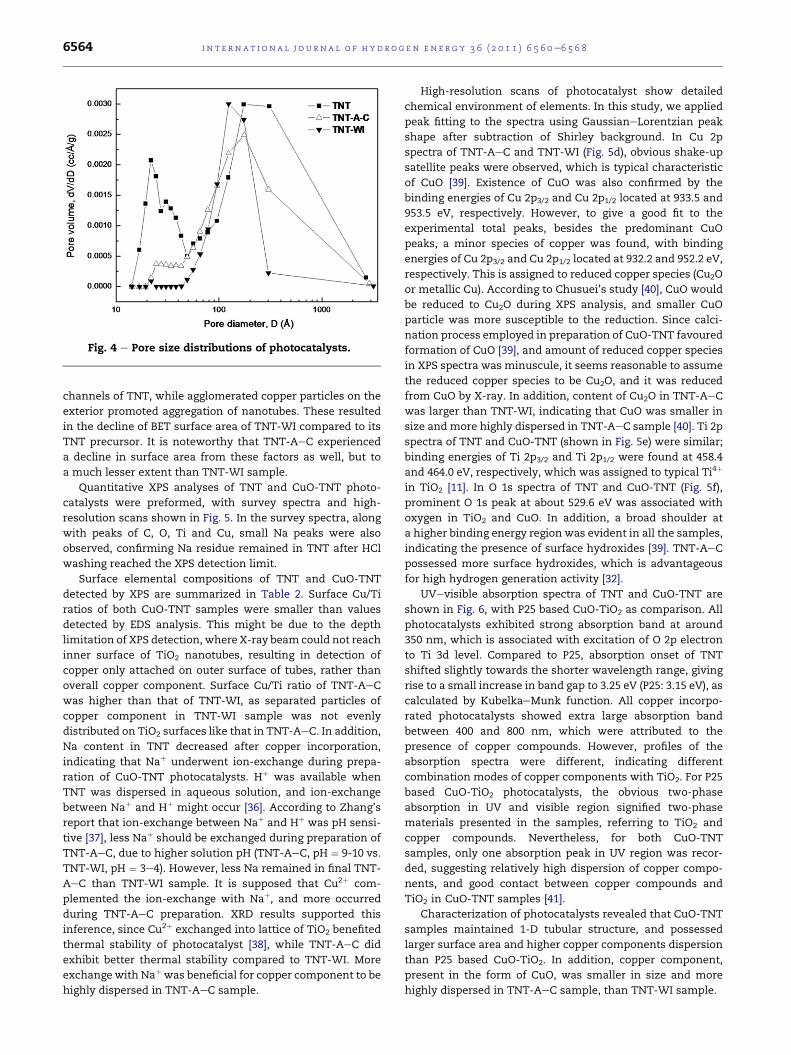
Fig. 4 e Pore size distributions of photocatalysts.
i n t e rn a t i o n a l j o u r n a l o f h y d r o g e n en e r g y 3 6 ( 2 0 1 1 ) 6 5 6 0e6 5 6 86564
channels of TNT, while agglomerated copper particles on the
exterior promoted aggregation of nanotubes. These resulted
in the decline of BET surface area of TNT-WI compared to its
TNT precursor. It is noteworthy that TNT-AeC experienced
a decline in surface area from these factors as well, but to
a much lesser extent than TNT-WI sample.
Quantitative XPS analyses of TNT and CuO-TNT photo-
catalysts were preformed, with survey spectra and high-
resolution scans shown in Fig. 5. In the survey spectra, along
with peaks of C, O, Ti and Cu, small Na peaks were also
observed, confirming Na residue remained in TNT after HCl
washing reached the XPS detection limit.
Surface elemental compositions of TNT and CuO-TNT
detected by XPS are summarized in Table 2. Surface Cu/Ti
ratios of both CuO-TNT samples were smaller than values
detected by EDS analysis. This might be due to the depth
limitation of XPS detection, where X-ray beam could not reach
inner surface of TiO2 nanotubes, resulting in detection of
copper only attached on outer surface of tubes, rather than
overall copper component. Surface Cu/Ti ratio of TNT-AeC
was higher than that of TNT-WI, as separated particles of
copper component in TNT-WI sample was not evenly
distributed on TiO2 surfaces like that in TNT-AeC. In addition,
Na content in TNT decreased after copper incorporation,
indicating that Naþ underwent ion-exchange during prepa-
ration of CuO-TNT photocatalysts. Hþ was available when
TNT was dispersed in aqueous solution, and ion-exchange
between Naþ and Hþ might occur [36]. According to Zhang’s
report that ion-exchange between Naþ and Hþ was pH sensi-
tive [37], less Naþ should be exchanged during preparation of
TNT-AeC, due to higher solution pH (TNT-AeC, pH ¼ 9-10 vs.
TNT-WI, pH ¼ 3e4). However, less Na remained in final TNT-
AeC than TNT-WI sample. It is supposed that Cu2þ com-
plemented the ion-exchange with Naþ, and more occurred
during TNT-AeC preparation. XRD results supported this
inference, since Cu2þ exchanged into lattice of TiO2 benefited
thermal stability of photocatalyst [38], while TNT-AeC did
exhibit better thermal stability compared to TNT-WI. More
exchange with Naþ was beneficial for copper component to be
highly dispersed in TNT-AeC sample.
High-resolution scans of photocatalyst show detailed
chemical environment of elements. In this study, we applied
peak fitting to the spectra using GaussianeLorentzian peak
shape after subtraction of Shirley background. In Cu 2p
spectra of TNT-AeC and TNT-WI (Fig. 5d), obvious shake-up
satellite peaks were observed, which is typical characteristic
of CuO [39]. Existence of CuO was also confirmed by the
binding energies of Cu 2p3/2 and Cu 2p1/2 located at 933.5 and
953.5 eV, respectively. However, to give a good fit to the
experimental total peaks, besides the predominant CuO
peaks, a minor species of copper was found, with binding
energies of Cu 2p3/2 and Cu 2p1/2 located at 932.2 and 952.2 eV,
respectively. This is assigned to reduced copper species (Cu2O
or metallic Cu). According to Chusuei’s study [40], CuO would
be reduced to Cu2O during XPS analysis, and smaller CuO
particle was more susceptible to the reduction. Since calci-
nation process employed in preparation of CuO-TNT favoured
formation of CuO [39], and amount of reduced copper species
in XPS spectra was minuscule, it seems reasonable to assume
the reduced copper species to be Cu2O, and it was reduced
from CuO by X-ray. In addition, content of Cu2O in TNT-AeC
was larger than TNT-WI, indicating that CuO was smaller in
size and more highly dispersed in TNT-AeC sample [40]. Ti 2p
spectra of TNT and CuO-TNT (shown in Fig. 5e) were similar;
binding energies of Ti 2p3/2 and Ti 2p1/2 were found at 458.4
and 464.0 eV, respectively, which was assigned to typical Ti4þ
in TiO2 [11]. In O 1s spectra of TNT and CuO-TNT (Fig. 5f),
prominent O 1s peak at about 529.6 eV was associated with
oxygen in TiO2 and CuO. In addition, a broad shoulder at
a higher binding energy region was evident in all the samples,
indicating the presence of surface hydroxides [39]. TNT-AeC
possessed more surface hydroxides, which is advantageous
for high hydrogen generation activity [32].
UVevisible absorption spectra of TNT and CuO-TNT are
shown in Fig. 6, with P25 based CuO-TiO2 as comparison. All
photocatalysts exhibited strong absorption band at around
350 nm, which is associated with excitation of O 2p electron
to Ti 3d level. Compared to P25, absorption onset of TNT
shifted slightly towards the shorter wavelength range, giving
rise to a small increase in band gap to 3.25 eV (P25: 3.15 eV), as
calculated by KubelkaeMunk function. All copper incorpo-
rated photocatalysts showed extra large absorption band
between 400 and 800 nm, which were attributed to the
presence of copper compounds. However, profiles of the
absorption spectra were different, indicating different
combination modes of copper components with TiO2. For P25
based CuO-TiO2 photocatalysts, the obvious two-phase
absorption in UV and visible region signified two-phase
materials presented in the samples, referring to TiO2 and
copper compounds. Nevertheless, for both CuO-TNT
samples, only one absorption peak in UV region was recor-
ded, suggesting relatively high dispersion of copper compo-
nents, and good contact between copper compounds and
TiO2 in CuO-TNT samples [41].
Characterization of photocatalysts revealed that CuO-TNT
samples maintained 1-D tubular structure, and possessed
larger surface area and higher copper components dispersion
than P25 based CuO-TiO2. In addition, copper component,
present in the form of CuO, was smaller in size and more
highly dispersed in TNT-AeC sample, than TNT-WI sample.

Fig. 5 e XPS survey spectra of photocatalysts (a: TNT; b: TNT-AeC; c: TNT-WI), and high-resolution spectra of (d) Cu 2p, (e) Ti
2p, and (f) O 1s.
i n t e r n a t i o n a l j o u r n a l o f h y d r o g e n en e r g y 3 6 ( 2 0 1 1 ) 6 5 6 0e6 5 6 8 6565
3.2. Photocatalytic hydrogen production
Fig. 7 shows time courses of hydrogen evolution over CuO-
TNT photocatalysts, with CuO-P25 as comparison; average
hydrogen generation rates over 5 h reactions are summarized
in the inset. It was observed that negligible hydrogen was
evolved over bare TiO2, although bare TNT possessed large
BET surface area. As compared to bare TiO2, presence of CuO
significantly promoted hydrogen generation activity. This can
be credited to effective charge separation in CuO-TiO2 pho-
tocatalysts, which is crucial for efficient hydrogen generation.
Take CuO-TNT as example, charge transfer and separation in
CuO-TiO2 is illustrated in Fig. 8. Since conduction band of TiO2
is more negative than that of CuO, excited electrons in TiO2
would easily transfer to CuO, resulting in accumulation of
excess electrons in CuO, and negative shift in Fermi level of
CuO [9]. This endowed CuO with required overvoltage for
proton reduction, and serving as hydrogen formation site.
Efficient charge separation in CuO-TiO2 mitigated the elec-
tron/hole recombination, and gave rise to high activity of
hydrogen generation.
From Fig. 7, it also can be found that TNT based CuO-TiO2
photocatalysts exhibited excellent hydrogen generation activity;
hydrogen evolution rate over TNT-AeC was 7.9 ml min�1

Table 2 e Summary of surface elemental compositions ofphotocatalysts detected by XPS.
Catalyst Surface elementalcomposition(atom %)
Cu/Ti (%) Na/Ti (%)
O Na Ti Cu
TNT 71.0 2.7 26.3 0.0 0.0 10.2
TNT-AeC 72.2 1.2 25.1 1.5 6.1 4.7
TNT-WI 73.4 1.6 23.6 1.3 5.7 6.8
Fig. 7 e Time courses of hydrogen evolution over
photocatalysts under irradiation. Inset: average hydrogen
evolution rates in 5 h reactions.
i n t e rn a t i o n a l j o u r n a l o f h y d r o g e n en e r g y 3 6 ( 2 0 1 1 ) 6 5 6 0e6 5 6 86566
(71.6 mmol h�1 g�1catalyst), which was c.a. 70% higher than P25
based CuO-TiO2, and even superior to some Pt/Ni incorporated
TNT [28,32]. Nevertheless, compared to TNT-AeC, TNT-WI with
relatively larger CuO particles showed inferior activity, with
hydrogen evolution rate recorded at 7.1 ml min�1
(64.2 mmol h�1 g�1catalyst).
Different activity of CuO-TiO2 photocatalysts implied that,
in addition to efficient charge separation, there were still
several factors that influencedactivityofCuO-TiO2.Combining
hydrogen generation activity with photocatalyst character-
ization, it suggested that 1-D tubular structure, large surface
area, and high copper component dispersion were advanta-
geous for CuO-TiO2 for high hydrogen generation activity.
Compared with CuO-P25 photocatalysts, CuO-TNT exhibi-
ted greater hydrogen generation activity. This was primarily
attributed to the unique 1-D nanotubular structure, rather
than pure anatase crystal structure, since pure anatase gran-
ular TiO2 was proved to possess similar hydrogen generation
activity with anatase/rutile mixture of P25 [19]. 1-D tubular
structure facilitated fast electrons transfer due to reduced
grain boundary, and was expected to improve charge sepa-
ration in photocatalytic reactions [31]. In addition, large
surface area inherent with nanotubular structure provided
more active sites in CuO-TNT photocatalysts, which increased
probability for protons in the aqueous phase to contact the
reduction sites, and accelerated hydrogen formation further.
Comparing activity of TNT-AeC and TNT-WI, it can be
induced that higher CuO dispersion in CuO-TiO2 was
Fig. 6 e UVevisible absorption spectra of photocatalysts
(a:P25-WI;b:P25-AeC;c:TNT-WI;d:TNT-AeC;e:P25; f:TNT).
beneficial for high hydrogen generation activity. Both TNT-
AeC and TNT-WI samples possessed similar tubular struc-
ture, copper content, and copper chemical state; but CuO in
TNT-AeC was more highly dispersed than that in TNT-WI.
Therefore, it is reasonable to attribute superior hydrogen
generation activity of TNT-AeC to higher copper component
dispersion. High CuO dispersion improved cohesion between
copper component with TiO2, facilitated charge transfer from
TiO2 to copper compound, and then enhanced proton reduc-
tion; whereas, relatively larger CuO clusters in TNT-WI might
act as the recombination centres, and depressed hydrogen
generation activity [31]. Advantage of high CuO dispersion
was also manifested within CuO-P25 photocatalysts, where
P25-AeC with higher copper component dispersion but infe-
rior copper content, exhibited relatively higher hydrogen
generation activity, in comparison with P25-WI. In addition,
CuO-TNT possessed higher CuO dispersion than CuO-P25,
which should partly contribute to higher activity that CuO-
TNT exhibited.
It is worthy to note that hydrogen evolution rates over
CuO-TNT photocatalysts remained vigorous during 5 h reac-
tion, with no deactivation occurred. Excellent activity and
stability ensured CuO-TNT a potential candidate for intensive
photocatalytic hydrogen production.
Fig. 8 e Schematic diagram of charge transfer in CuO-TNT
photocatalyst under irradiation.
i n t e r n a t i o n a l j o u r n a l o f h y d r o g e n en e r g y 3 6 ( 2 0 1 1 ) 6 5 6 0e6 5 6 8 6567
4. Conclusion
CuO incorporated TNT photocatalyst fabricated via adsorp-
tionecalcination or wet impregnation was proved to be highly
efficient for photocatalytic hydrogen production. Hydrogen
evolution rates over both CuO-TNT during 5 h reaction were
recorded at 7.9 and 7.1 ml min�1 respectively, which were
much higher than P25 based CuO-TiO2, even superior to some
Pt/Ni incorporated TNT. Both CuO-TNT photocatalysts were
characterized by 1-D tubular structure, large specific surface
area, and high copper component dispersion, all of which
were proved to be advantageous for high hydrogen generation
activity. CuO-TiO2 fabricated by adsorptionecalcination
process showed superior activity to that prepared by wet
impregnation, due to better CuO dispersion. During 5 h reac-
tion, hydrogen generation rate over CuO-TNT remained
vigorous, and no deactivation occurred. High efficiency and
excellent stability highlight the great potential of CuO-TNT for
large applications in photocatalytic hydrogen production.
r e f e r e n c e s
[1] Fujishima A, Honda K. Electrochemical photolysis of water ata semiconductor electrode. Nature 1972;238:37e8.
[2] Ni M, Leung MKH, Leung DYC, Sumathy K. A review andrecent developments in photocatalytic water-splitting usingTiO2 for hydrogen production. Renew Sust Energ Rev 2007;11:401e25.
[3] Rosseler O, Shankar MV, Du MKL, Schmidlin L, Keller N,Keller V. Solar light photocatalytic hydrogen production fromwater over Pt and Au/TiO2 (anatase/rutile) photocatalysts:influence of noble metal and porogen promotion. J Catal2010;269:179e90.
[4] Zhang YX, Gao B, Puma GL, Ray AK, Zeng HC. Self-assembledAu/TiO2/CNTs ternary nanocomposites for photocatalyticapplications. Sci Adv Mater 2010;2:503e13.
[5] Dholam R, Patel N, Adami M, Miotello A. Hydrogenproduction by photocatalytic water-splitting using Cr- or Fe-doped TiO2 composite thin films photocatalyst. Int JHydrogen Energy 2009;34:5337e46.
[6] Lucky RA, Charpentier PA. Synthesis of Fe doped TiO2
nanostructures in supercritical CO2: morphology andphotocatalytic properties. Sci Adv Mater 2009;1:167e74.
[7] Manivel A, Naveenraj S, Kumar PSS, Anandan S. CuO-TiO2
nanocatalyst for photodegradation of acid red 88 in aqueoussolution. Sci Adv Mater 2010;2:51e7.
[8] So WW, Kim KJ, Moon SJ. Photo-production of hydrogen overthe CdS-TiO2 nano-composite particulate films treated withTiCl4. Int J Hydrogen Energy 2004;29:229e34.
[9] Bandara J, Udawatta CPK, Rajapakse CSK. Highly stable CuOincorporated TiO2 catalyst for photocatalytic hydrogenproduction from H2O. Photochem Photobiol Sci 2005;4:857e61.
[10] Sreethawong T, Yoshikawa S. Comparative investigation onphotocatalytic hydrogen evolution over Cu-, Pd-, and Au-loaded mesoporous TiO2 photocatalysts. Catal Commun2005;6:661e8.
[11] Choi HJ, Kang M. Hydrogen production frommethanol/waterdecomposition in a liquid photosystem using the anatasestructure of Cu loaded TiO2. Int J Hydrog Energy 2007;32:3841e8.
[12] Yoong LS, Chong FK, Dutta BK. Development of copper-doped TiO2 photocatalyst for hydrogen production undervisible light. Energy 2009;34:1652e61.
[13] Gombac V, Sordelli L, Montini T, Delgado JJ, Adamski A,Adami G, et al. CuOx-TiO2 photocatalysts for H2 productionfrom ethanol and glycerol solutions. J Phys Chem A 2010;114:3916e25.
[14] Miwa T, Kaneco S, Katsumata H, Suzuki T, Ohta K, Verma SC,et al. Photocatalytic hydrogen production from aqueousmethanol solution with CuO/Al2O3/TiO2 nanocomposite. Int JHydrogen Energy 2010;35:6554e60.
[15] Xu SP, Sun DD. Significant improvement of photocatalytichydrogen generation rate over TiO2 with deposited CuO. Int JHydrogen Energy 2009;34:6096e104.
[16] Sakata Y, Yamamoto T, Okazaki T, Imamura H, Tsuchiya S.Generation of visible light response on the photocatalyst ofa copper ion containing TiO2. Chem Lett; 1998:1253e4.
[17] Wu NL, Lee MS. Enhanced TiO2 photocatalysis by Cu inhydrogen production from aqueous methanol solution. Int JHydrogen Energy 2004;29:1601e5.
[18] Wu YQ, Lu GX, Li SB. The role of Cu(I) species forphotocatalytic hydrogen generation over CuOx/TiO2. CatalLett 2009;133:97e105.
[19] Xu SP, Ng JW, Zhang XW, Bai HW, Sun DD. Fabrication andcomparison of highly efficient Cu incorporated TiO2
photocatalyst for hydrogen generation from water. Int JHydrogen Energy 2010;35:5254e61.
[20] Kasuga T, Hiramatsu M, Hoson A, Sekino T, Niihara K.Formation of titanium oxide nanotube. Langmuir 1998;14:3160e3.
[21] Chen Q, Zhou WZ, Du GH, Peng LM. Trititanate nanotubesmade via a single alkali treatment. Adv Mater 2002;14:1208e11.
[22] Bavykin DV, Parmon VN, Lapkin AA, Walsh FC. The effect ofhydrothermal conditions on the mesoporous structure ofTiO2 nanotubes. J Mater Chem 2004;14:3370e7.
[23] Bavykin DV, Walsh FC. Elongated titanate nanostructuresand their applications. Eur J Inorg Chem; 2009:977e97.
[24] Zhang X, Pan JH, Fu W, Du AJ, Sun DD. TiO2 nanotubephotocatalytic oxidation for water treatment. Water SciTechnol Water Supply 2009;9:45e9.
[25] Ng J, Zhang X, Zhang T, Pan JH, Du JHA, Sun DD. Constructionof self-organized free-standing TiO2 nanotube arrays foreffective disinfection of drinking water. J Chem TechnolBiotechnol 2010;85:1061e6.
[26] Armstrong G, Armstrong AR, Canales J, Bruce PG. Nanotubeswith the TiO2-B structure. Chem Commun; 2005:2454e6.
[27] Sennik E, Colak Z, Kilinc N, Ozturk ZZ. Synthesis of highly-ordered TiO2 nanotubes for a hydrogen sensor. Int JHydrogen Energy 2010;35:4420e7.
[28] Lin CH, Lee CH, Chao JH, Kuo CY, Cheng YC, Huang WN, et al.Photocatalytic generation of H2 gas from neat ethanol overPt/TiO2 nanotube catalysts. Catal Lett 2004;98:61e6.
[29] Khan MA, Akhtar MS, Woo SI, Yang OB. Enhancedphotoresponse under visible light in Pt ionized TiO2
nanotube for the photocatalytic splitting of water. CatalCommun 2008;10:1e5.
[30] Li CL, Yuan JA, Han BY, Jiang L, Shangguan WF. TiO2
nanotubes incorporated with CdS for photocatalytichydrogen production from splitting water under visible lightirradiation. Int J Hydrogen Energy 2010;35:7073e9.
[31] Khan MA, Yang OB. Photocatalytic water splitting forhydrogen production under visible light on Ir and Co ionizedtitania nanotube. Catal Today 2009;146:177e82.
[32] Jang JS, Choi SH, Kim DH, Jang JW, Lee KS, Lee JS. Enhancedphotocatalytic hydrogen production from water-methanolsolution by nickel intercalated into titanate nanotube. J PhysChem C 2009;113:8990e6.

i n t e rn a t i o n a l j o u r n a l o f h y d r o g e n en e r g y 3 6 ( 2 0 1 1 ) 6 5 6 0e6 5 6 86568
[33] Xu B, Dong L, Chen Y. Influence of CuO loading on dispersionand reduction behavior of CuO/TiO2 (anatase) system. JChem Soc Faraday Trans 1998;94:1905e9.
[34] Thorne A, Kruth A, Tunstall D, Irvine JTS, Zhou WZ.Formation, structure, and stability of titanate nanotubes andtheir proton conductivity. J Phys Chem B 2005;109:5439e44.
[35] Gregg SJ, Sing KSW. Adsorption, surface area and porosity.2nd ed. London: Academic Press; 1982.
[36] Xing CJ, Jing DW, Liu MC, Guo LJ. Photocatalytic hydrogenproduction over Na2Ti2O4(OH)2 nanotube sensitized by CdSnanoparticles. Mater Res Bull 2009;44:442e5.
[37] Zhang SL, Zhou JF, Zhang ZJ, Du ZL, Vorontsov AV, Jin ZS.Morphological structure and physicochemical properties ofnanotube TiO2. Chin Sci Bull 2000;45:1533e6.
[38] Sun XM, Li YD. Synthesis and characterization of ion-exchangeable titanate nanotubes. ChemeEur J 2003;9:2229e38.
[39] Poulston S, Parlett PM, Stone P, Bowker M. Surface oxidationand reduction of CuO and Cu2O studied using XPS and XAES.Surf Interface Anal 1996;24:811e20.
[40] Chusuei CC, Brookshier MA, Goodman DW. Correlation ofrelative X-ray photoelectron spectroscopy shake-upintensity with CuO particle size. Langmuir 1999;15:2806e8.
[41] Bokhimi X, Morales A, Novaro O, Lopez T, Chimal O,Asomoza M, et al. Effect of copper precursor on thestabilization of titania phases, and the optical properties ofCu/TiO2 prepared with the sol-gel technique. Chem Mater1997;9:2616e20.