Energetics, structure and excess electrons in small sodium-chloride clusters

Journal of Electron Spectroscopy and Related Phenomena 100 (1999) 409–433www.elsevier.nl / locate /elspec
Studies of fullerenes by the excitation, emission, and scattering ofelectrons
a , b c* ¨Petra Rudolf , Mark S. Golden , Paul A. Bruhwilera ´Laboratoire Interdisciplinaire de Spectroscopie Electronique, Facultes Universitaires Notre-Dame de la Paix, Rue de Bruxelles 61,
B-5000 Namur, Belgiumb ¨ ¨Institut f ur Festkorperforschung, IFW Dresden e.V., PO Box 270016, D-01171 Dresden, Germany
cDepartment of Physics, Uppsala University, Box 530, S-75121 Uppsala, Sweden
Received 2 April 1999; accepted 14 June 1999
Abstract
This paper presents an overview of how electron spectroscopies have contributed to advances in fullerene research. Inparticular, we illustrate the vital role these techniques have played in improving our understanding of the importance ofstrong electronic correlation and of electron-phonon coupling in these materials, in the derivation of electron hopping rates,in providing a direct determination of charge transfer and hybridisation in both fullerene salts and adsorbed fullerenes and indetermining the optical gap of these systems. We discuss systems of increasing complexity, starting with C in the gas phase60
and in the solid state, and moving on to C salts and to C adsorbed on surfaces. Finally we look at both higher fullerenes60 60
and fullerenes with a heteroatom either on or inside the cage. 1999 Elsevier Science B.V. All rights reserved.
1. Introduction behaviour. However, arguably as important as theirproperties is the fact that fullerenes in general, and
Over the past decade, the fullerenes have been the C in particular, possess extremely high symmetry.60
subject of scientific scrutiny on a scale unpre- This point goes far beyond their aesthetic appeal tocedented in research into conjugated carbon-based the human desire for structural symmetry, and in factsystems. The reasons for this are two-fold. Firstly, allows access to an experimental and theoreticalthe fullerenes and their compounds exhibit an ex- understanding of a large-scale molecular system on atremely rich collection of interesting and potentially extraordinarily fundamental level. Taking these twouseful physical properties: they are excellent electron facets of fullerene science together, one can under-acceptors, can be transformed into synthetic metals, stand why C has become the conjugated carbon-60
exhibit superconductivity at transition temperatures based molecule par excellence, a system whoseonly exceeded by those of the cuprates, support properties can be systematically followed from theferromagnetism (without the presence of d or f gas phase, via ultra-thin films adsorbed on surfaces,electrons) and display remarkable non-linear optical to solid state compounds.
With these points in mind, electron spectroscopiespresent themselves as ideal tools with which to study*Corresponding author. Tel.: 132-81-725-237; fax: 132-81-724-both the electronic and vibrational properties of these595.
E-mail address: [email protected] (P. Rudolf) systems with parallel analysis of their molecular and
0368-2048/99/$ – see front matter 1999 Elsevier Science B.V. All rights reserved.PI I : S0368-2048( 99 )00058-4

410 P. Rudolf et al. / Journal of Electron Spectroscopy and Related Phenomena 100 (1999) 409 –433
solid-state structure. In this review, we aim to by the electron spectroscopic investigation of theseillustrate the central role which has been played by materials can be summed up as an awareness that theelectron spectroscopies in fullerene research up to physics and chemistry of these molecules and theirthe present. For more exhaustive accounts of the compounds goes far beyond that of pristine or dopedspectroscopic aspects of both surface related and carbon-based semiconductors. The view that hassolid state fullerene research, we refer the reader to emerged from the efforts of the community over theRefs. [1–5]. To give the reader an idea of the breadth last ten years is rather that these fascinating materialsover which electron spectroscopy has made an are more correctly described as narrow band, strong-impact, some of the landmark contributions are listed ly correlated Jahn-Teller systems.below:
2. C in the gas phase60
• Direct photoemission spectroscopy (PES), inversephotoemission (IPES) and X-ray absorption Before C or other fullerenes were available in60
(XAS) macroscopic quantities, electron spectroscopic• the role played by strong electronic correla- studies of these molecules were being conducted on
tion molecular beams. Fig. 1 shows the two important• the importance of electron-phonon coupling quantities which can be obtained directly from gas• direct determination of charge transfer and phase electron spectra: the ionisation potential (IP)
hybridisation and electron affinity of C . A vertical IP of about60
• derivation of phase diagrams for the ful- 7.75 eV [6–8] can be estimated from photoelectron1lerene salts spectra of neutral C (which gives C in the final60 60
• local structural information state). The adiabatic IP is closer to 7.54 eV asmeasured by photoionisation yield [9], which is alsosupported by analysis of the vibronic structure in
• Resonant photoemission (RESPES) and Auger high-resolution PES data [7]. Comparisons of theseelectron spectroscopy (AES) values to other techniques are given elsewhere [10].
• the role played by strong electronic correla- PES of the negative ion (giving a neutral C final60
tion state) determines the electron affinity (EA) to be• determination of hopping rates about 2.80 eV [11–13] and the intrinsic energy
separation (D) between the h (highest occupiedu
molecular orbital – HOMO) and the t (lowest1u
• Electron energy loss spectroscopy (EELS) unoccupied molecular orbital – LUMO) to be 2 eV• determination of optical gaps and exciton [14]. The IP and EA values make it clear that one
binding energies would expect C to be a good electron acceptor and60
• vibrational characterisation at surfaces a poor donor, a conclusion which has been borne out• the role played by strong electronic correla- in many experiments. The energy IP2EA2D defines
tion in the intercalated systems the on-ball Coulomb interaction, U, thus giving avalue to U of the order of 3 eV for the free molecule.
In the main body of the review, examples of many A representative wider-range gas phase PES spec-of the points listed above will be given, presented trum [6] is shown in the left side of Fig. 2. One canupon a framework of increasing structural complexi- immediately get a sense of the high degree of orbitalty, starting with gas phase data, going on to the solid degeneracy which is the hallmark of C : although60
state and intercalated compounds, including adsorp- the system has 60 p-electrons, PES shows only ation and doping of C on surfaces, and finally handful of peaks at low binding energy. It is in fact60
touching on some of the more exotic systems such as relatively straightforward [15] to correlate the fea-the higher fullerenes, endohedral and heteroful- tures in the photoemission spectrum with the differ-lerenes. ent molecular orbitals (MOs) of icosahedral C . The60
Taken in its entirety, the major contribution made states nearest to the chemical potential are derived
P. Rudolf et al. / Journal of Electron Spectroscopy and Related Phenomena 100 (1999) 409 –433 411
latter was determined from the C 1s IP of solid C60
as in Refs. [20,21], using the gas phase-to-solid statescreening shift for the HOMO band. However, sincethe shift taken there uses the peak in the gas phaseHOMO band at 7.61 eV instead of the centroid at7.75 eV, the experimental screening shift should notbe 0.7 eV as given there, rather |0.85 eV, which iswhat we use here. This results in a predicted gasphase C 1s IP of 290.45 eV. The next point toconsider is that the photon energies of the differentXAS transitions are virtually the same for solid, gas,and matrix-isolated phases [18,19], so that calibrat-ing the matrix-isolated XAS data in this way shouldgive an accurately calibrated final result. As seen, theXAS spectrum is dominated by sharp p* resonances,the first pair of which can be considered to betransitions into the t and t MOs (or LUMO and1u 1g
LUMO11), modified by the presence of a core hole[22]. The high symmetry is seen again via therelatively sharp and sparse peaks in the spectrum(the shaded peak is due to CO frozen into the Xematrix). As seen here, XAS is a technique thatallows one to access the unoccupied levels without aconvolution over occupied states (the first level isavailable via PES [11]). Since the C 1s IP gives theelectron removal threshold in the spectra, the spec-trum calibrated in this way represents the energyrequired to ionise a core-excited molecule, and thusis quite similar to PES energetically (note that the
Fig. 1. Gas phase PES data of the indicated levels from neutral correlation energy of a positive hole is common toand negatively-charged free C (the term LUMO refers here to60 both spectra). The main difference is that the corethe ground state of the neutral molecule), from Refs. [7,11]. See
hole can enhance, e.g., the LUMO binding energythe discussion in the text for interpretation of the energy differ-due to the precise distribution of the wave function,ence and spectral widths.
which should be an effect of the order of 0.2–0.3 eV[18,19,22]. Thus the HOMO-LUMO separation DE|
from the h HOMO. The peak which comes next in 1.8 eV, shown in Fig. 2, is very close to the true1u
energy is due to both the h and g states and is singlet gap of |2.0–2.2 eV [23]. The small differ-g g
generally referred to as the HOMO-1. Both the ence is just the core hole effect, which is difficult toHOMO and the HOMO-1 are pure p-MOs [15]. The measure precisely due to the difficulty of determin-features at higher energy result from the overlap of ing the singlet gap energy and the gas phase C 1s IP,both p and s-MOs. Recent work [16,17] has shown but which appears to be of the expected magnitude.that the cross sections of these peaks vary due to There have also been EELS measurements of C60
interference effects arising from the shell-like struc- in the gas phase [24–28], which, apart from reveal-ture of C . ing low-energy interband transitions, also show60
The right side of Fig. 2 shows the corresponding C collective excitations such as the p- and s-plasmons1s excitation spectrum of matrix-isolated C , mea- [29], as do photo-ion yield studies [9].60
sured using XAS [18,19], and placed on a common Valuable information on vibrational coupling canbinding energy scale. This was done by subtracting be obtained from high-resolution PES measurementsthe photon energy from the gas phase C 1s IP. The on cooled, negatively-charged C beams [11]. These60

412 P. Rudolf et al. / Journal of Electron Spectroscopy and Related Phenomena 100 (1999) 409 –433
Fig. 2. Gas phase PES [6] compared to matrix-isolated C 1s XAS data [18,19] for C . The data are placed on a common binding energy60
scale (E 5vacuum level) as described in the text.v
data, combined with sophisticated calculations [11], [31], showing that it is possible to achieve highare the only direct measure of the parameters em- levels of charge transfer in this manner, with an
2ployed in the most common model of superconduc- electronic structure quite reminiscent of that of C ,60
tivity in the alkali-fullerides (to which we return in as expected for a simple charge-transfer-bonded2Section 4). For C , the triply-degenerate LUMO is complex. Effects of alkali-C vibrations were also60 60
the level in which the single charge resides, and it detected in the spectra. The fact that the electronwill couple to all of the H vibrations via the Jahn- affinity tends monotonically towards 0 eV withg
Teller effect, which breaks the electronic degeneracy increasing K ‘coverage’, indicates an electronicto lower the total energy [11,30]. Analogous data for limitation on the extent to which charge transfer can
1C , as measured in PES on neutral beams [7], be expected to explain the bonding of K to C , a60 60
suggest that the vibrational-electronic (vibronic) cou- topic which has been studied further in films (Sec-pling to a vacancy, or hole, in the HOMO is even tion 4).stronger than the coupling to an electron in theLUMO. This difference in coupling strengths be-tween the case of final states with a hole in the 3. C in the condensed phase60
HOMO (PES of C ) and the neutral LUMO (PES602of C ) can be seen by eye in Fig. 1. The nearly-spherical structure and large size of60
It is possible to obtain a stable higher charge state C comprise a unique structural unit for condensed60
on the C cage in the gas phase, but only by materials. In the solid at 300 K, the C molecules60 60
forming a complex with, e.g., alkali atoms that rotate very rapidly (they are in fact more labile thanreadily donate their single valence charge. A study of in solution), resulting in a lattice with fcc symmetry
˚this by PES in the gas phase has been carried out and a lattice constant of a 514.2 A [32,33]. Below0

P. Rudolf et al. / Journal of Electron Spectroscopy and Related Phenomena 100 (1999) 409 –433 413
|260 K there is a first order phase transition from fcc This is the energy gap of solid C relevant for60
to an orientationally ordered simple cubic (sc) phase determining transport properties. Comparing this(the icosohedral point group symmetry of the C value with the gas phase data above, one can60
molecule is incompatible with a rotationally ordered conclude that the effective Coulomb interaction isfcc phase). The C molecules, however, continue to reduced due to the effects of long-range screening60
‘ratchet’ from one preferred orientation to another. [39], which in this case involves the dielectricThis rotation is finally frozen out on crossing a glass screening of both charges (i.e. the hole in the HOMOtransition at |90 K, which leaves |85% of the C in PES and the electron in the LUMO in IPES).60
molecules in one orientation and the remaining 15% Calculations of this screening agree that it amountsin another orientation of slightly higher energy [34]. to slightly more than 0.8 eV for each charge [40–42],These structural properties are, in general, consistent giving a total of |1.6 eV reduction in U from the gasvan der Waals bonding (as expected for spherical phase value of 3 eV (see above) to |1.4 eV. Thisgraphitic molecules) [35], and suggest that the value can be checked independently by comparingelectronic and vibrational states should be closely Auger and PES data [40,43,44], as shown in Fig. 4.related to those of the isolated molecule. This is There the Auger, with a smooth component removedfound to be the case, but there are interesting and to reveal the fine structure, is plotted with the self-non-trivial properties which emerge in studying pure convolution of the PES spectrum. Since Augerfullerite with electron spectroscopies. creates a two-hole final state (necessarily on the
Looking at Fig. 3, which shows both the PES [36] same molecule), whereas photoemission creates aand IPES [37] spectra of a thin, crystalline film of one-hole final state, the self-convolution of PES is aC on Au(110), and comparing it to the gas phase reasonable approximation to the two-hole energy60
data of Fig. 1, one can see that there is a strong spectrum for the case where the holes are onsimilarity between the electronic structures of free different C molecules. This is seen to be the case60
and condensed C . A broadening of all levels is in the figure, with the exception of an energy shift of60
observed in the solid. The energy separation of the |1.4 eV needed to align the spectra; indeed, theHOMO in electron removal and the LUMO in self-convolution gives a good approximation to theelectron addition is |3.5 eV [4,38] (peak to peak). unmanipulated Auger spectrum [45]. This required
Fig. 3. PES [36] and IPES [37] data of thin multilayer films of C /Au(110), placed on a common energy scale (E 5vacuum level) in60 v
analogy to Fig. 1.

414 P. Rudolf et al. / Journal of Electron Spectroscopy and Related Phenomena 100 (1999) 409 –433
Fig. 4. Auger intensity oscillations compared to those of a self-convoluted PES spectrum in order to estimate U in solid C [43]. The inset60
shows the raw data and self-convolution.
shift is just U, here detected as an intramolecular such a manner as to redistribute the net charge of 11hole-hole interaction. A closer examination indicates almost uniformly over the entire molecular surfacethat U varies with the final state, corresponding to [41]. A similar phenomenon is found to explain thesubtleties in the details of the intramolecular lowest energy C 1s shake-up line [49], whichCoulomb interaction with charge distribution, which establishes a characteristic for aromatic systems fromhas been discussed in more detail elsewhere benzene to graphite [50], and reflects a metal-like[44,46,47]. ability to screen internal charges.
Another aspect of the reduction of U in the solid It should be noted that at 1.4–1.6 eV U in solidis the surface core level shift. Because the dielectric C is larger than one-electron bandwidths (W50.5–60
screening varies between surface and bulk, so does 1.0 eV) near the HOMO-LUMO gap from LDAthe screening shift observed in PES. The observed calculations [51,52], thus placing pristine solid C60
[41,48] shift of |0.1 eV for the C 1s level is in the Mott-Hubbard regime (U .W ) [40]. This factconsistent with numerical estimates [41,42]. To also has consequences for the nature of its electronicunderstand this, however, it was vital to note that a excitations as can be seen in Fig. 5. Here we show1s vacancy is screened internally by the molecule in EELS spectra for solid C , measured both in60

P. Rudolf et al. / Journal of Electron Spectroscopy and Related Phenomena 100 (1999) 409 –433 415
layer in C undergoes the high temperature orienta-60
tional phase transition at temperatures |35 K lowerthan the bulk [62].
As we consider the EELS spectra of Fig. 5, goingto higher loss-energies, apart from a number oftransitions between individual p and p* MOs (inter-band transitions), the main feature is the so-calledp-plasmon located at 6 eV, which results from thecollective excitation of the complete p-electronsystem (i.e. all p–p* transitions). EELS measure-ments as a function of momentum transfer show thatthe p-plasmon exhibits negligible dispersion [60,61],contrary to the behaviour observed for p-systemsinvolving delocalised electronic states such asgraphite [63], or single-wall carbon nanotubes [64].At still higher energies (not shown), there contributeinterband transitions involving the s* manifold ofMOs and the (p1s)-plasmon is observed at around25 eV [53–56], as was the case in the gas phase.
Both angle resolved direct (ARPES) and inversephotoemission (KRIPES) have been applied with theaim of determining the dispersive bandwidth in solid
Fig. 5. EELS of solid C measured in both transmission [55,56]60 C . In the ARPES data, the dispersion is dominated60and reflection [53,54].by that of the unoccupied states [5,65–67], whereasthe KRIPES data showed minimal dispersion [68].Thus there has been no direct experimental confirma-tion of band dispersions on the order of the theoret-
reflection [53,54] (E 510 eV and 30 eV), and ical bandwidth estimates [51,52]. On the other hand,p
transmission [55,56] (E 5170 keV). For low primary PES data for a monolayer of C on graphitep 60
energies, the first electronic excitation is located at compared to gas phase data indicate vibronic effects1.55 eV [53,54]. However, for high primary energies could well account for a large fraction of thethe first structure is at 1.8 eV. This illustrates that, observed solid state bandwidths, and that screeningrather than giving a measure of the ‘band gap’, these effects [41] complicate the data analysis considerablyEELS experiments reveal the energy required to [7].form on-ball (Frenkel) excitons [40,42,57]. The The comparison of RESPES and XAS data of
3lowest lying excitation is the T triplet state solid and matrix-isolated C , shown in Fig. 6,2g 60
[58,59], with the higher energy feature representing illustrates nicely both sides of the ‘bandwidth’ coin.the corresponding singlet. This first pair of features RESPES spectra show that there exists a significantarise from h →t transitions and are thus formally intermolecular hopping pathway for electrons in theu 1u
dipole forbidden. This tallies with the observed q- close-packed C solid [18,19]. On the other hand,60
dependence of the spectral weight at 1.8 eV in EELS the XAS data illustrate that the vibronic coupling,in transmission studies [60,61]. which explains the linewidths in the spectrum of the
However, the fact that the triplet exciton energy isolated molecule, remains undiminished in the solidshows a slight temperature dependence [62], does phase spectrum [18,19]. In particular, as the firstimply that this excitation possesses some degree of XAS resonance lies in the fundamental gap, it candelocalisation. Furthermore, this temperature depen- essentially only be vibronically broadened. In thisdence can be used to show that the outermost surface respect, solid, pristine C is an excellent testbed for60

416 P. Rudolf et al. / Journal of Electron Spectroscopy and Related Phenomena 100 (1999) 409 –433
Fig. 6. RESPES and XAS data comparing matrix-isolated to solid C for the extraction of bonding effects [18,19].60
our understanding of the interplay between electronic intercalation of C in UHV [69]. Electron spec-60
and vibronic (i.e. polaronic) properties for such large troscopies offer a direct way of determining thesystems [7]. charge state of the C molecules, for example60
showing clearly that the highest possible intercala-tion stage of six results in complete filling of the
624. Intercalated C in the solid state LUMO-derived states (i.e. (C ) ), and that for60 60
intermediate doping a clear Fermi edge signals theC forms compounds with the alkali or alkaline presence of a metallic phase. Fig. 8 illustrates that60
62earth metals leading to A C salts. In general, these (C ) does not necessarily represent a limit for thex 60 60
salts involve the occupation of the interstitial sites of maximal charge state. In this case, C has been60
the C lattice by the cations. For fcc C , two deposited at sub-monolayer (ML) coverages on a60 60
tetrahedral and one octahedral site per molecule are thick K film [70], which results in PES and XASavailable for intercalation. The extreme variation in spectra consistent with a metallic fulleride systemthe physical properties of intercalated C com- with a C charge state of ca. 211, leading to near60 60
pounds makes the investigation of their electronic complete filling of the t (LUMO11)-derived1g
and vibrational characteristics of great interest. Fig. 7 states. For increased C coverage, a series of non-60
shows one of the early combined PES/XAS studies metallic systems results until eventually K C is6 60
of thin films of K C obtained by successive reached. In general, the intercalation behaviour of thex 60

P. Rudolf et al. / Journal of Electron Spectroscopy and Related Phenomena 100 (1999) 409 –433 417
Fig. 7. PES and XAS of K C [69] for successive intercalation of K into C .x 60 60
heavier alkali metals (Rb, Cs) with C is very could show clearly that there exists strong hybridisa-60
similar to that of K. For the case of Na, its small size tion between the electronic states of the alkalineresults in multiple occupancy of the octahedral site, earth and the C .60
with interesting results for the electronic structure. In order to be able to investigate the electronic andFig. 9 shows a series of C 1s excitation spectra of the geometrical structure of the different C compounds60
Na C system recorded using EELS in transmission in detail, it is vital to be able to control the phasex 60
[71]. Up to Na C , the C charge state increases purity of the samples. Crucially, it was shown early6 60 60
linearly with doping. However, as can be seen in the on that core level BE shifts between the intercalantinset, between x56–8, the charge state of the ions situated at the tetrahedral and octahedral sitesfullerene remains constant, before once again in- provide a highly effective monitor of phase purity of
102creasing to a maximum of (C ) for Na C . fulleride samples prepared in UHV [77]. This led to60 12 60
This pause in the charge transfer is a direct conse- the development of recipes allowing the preparationquence of the formation of a fully ionised Na- of phase-pure fulleride samples via vacuum distilla-aggregate around the octahedral site, giving rise to tion of multiphase intercalated C [78,79].60
an ‘O void’ with an attractive potential for electrons Fig. 10 shows transmission EELS data from[71,72]. The ‘O’ state has neither pure Na 2s nor C distilled, phase-pure samples of K C (x50, 3, 4, 6)60 x 60
character and is populated by 2 electrons before [5,80]. EELS in transmission possesses the additionalfurther intercalation leads to the onset of the filling advantage that by setting the loss energy to zero,of the C t -derived states. Further systems in electron diffraction studies can be carried out in situ,60 1g
which the t levels of C become populated are the allowing a further characterisation of the phase1g 60
Ca or Ba fullerides. Here PES [73,74], EELS in purity of the samples under investigation. The energytransmission [75] and RESPES [76] investigations range displayed (up to 2 eV) contains only features

418 P. Rudolf et al. / Journal of Electron Spectroscopy and Related Phenomena 100 (1999) 409 –433
Fig. 8. PES and XAS of K C [70] for successive evaporation of C onto a K multilayer.x 60 60
related to the low energy intra- and inter-band the same figure contains an analysis of the data in(p→p*) excitations. K C shows a single, strong, terms of a Lorentz model, enabling the extraction of6 60
asymmetric peak located at 1.35 eV resulting from the energy of the first transition as a function of thedipole allowed t →t interband transitions [5]. The inter-C spacing in the different crystal structures1u 1g 60
loss of function of K C also indicates an insulating (shown as symbols). Unlike the transitions at higher4 60
ground state for this system [81,82], which is energies, this first transition clearly depends upon thecontrary to the expectations from a rigid-band picture intermolecular distance, and thus can be attributed tofor doping in which the LUMO-derived band would the intermolecular ‘gap’ transition. The d-depen-
2]be filled. The scenarios proposed to explain this dence of this transition is well reproduced by a3
observation have included the suggestion of a Mott- simple Mott-Hubbard model [87], shown as solidHubbard ground state [40,83] for A C , or a lines in the right-hand panel of Fig. 11. Thus, the4 60
description of these compounds as Jahn-Teller in- insulating nature of the A C systems is a result of4 60
sulators [84,85]. The EELS loss of function of K C the strong electronic correlation prevalent in C , as4 60 60
is comprised of four features (two strong, two discussed in Sections 2 and 3. However, the fact thatshoulders). As only t →t transitions are possible the data of Figs. 10 and 11 clearly show at least three1u 1g
in this energy range, this indicates that these MOs features are consistent with a Jahn-Teller distortion42 82are split in this material [80,86]. Further information of the (C ) (or (C ) ) molecules and the60 60
can be derived from an analysis of the optical consequent splitting of the t and t -derived elec-1u 1g
conductivity of different A C compounds (derived tronic levels [86,87].4 60
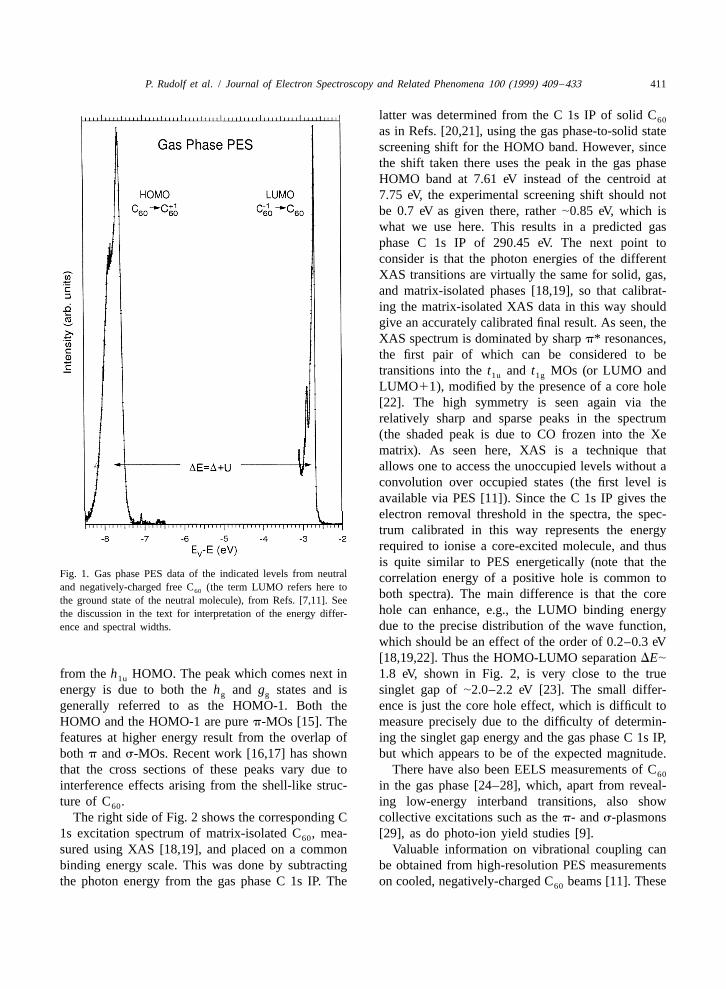
from Kramers-Kronig transformation of the loss Apart from in the EELS data discussed above, the1]function) as well as of Na C (which has filled impact of electron correlation in the A C system10 60 x 603
t -derived states [71]), which is shown in the left- can also be illustrated using the PES/IPES spectra1g
hand panel of Fig. 11 [87]. The right-hand panel of [88] of vacuum distilled, phase pure C C , shown in6 60

P. Rudolf et al. / Journal of Electron Spectroscopy and Related Phenomena 100 (1999) 409 –433 419
Fig. 10. The loss function of phase-pure K C measured usingx 60
EELS transmission [5].
We begin our discussions of the A C materials3 60
by returning to Fig. 10. The loss function of K C3 60
contains two low energy features: at 0.55 eV is aFig. 9. Transmission EELS data at the C 1s edge for Na C [71].x 60
The inset shows the charge state as a function of x derived from combination of the plasmon associated with the t1uthe t -derived spectral weight.1g charge carriers and transitions within the three t1u
sub-bands [90], the t →t transitions appearing at1u 1g
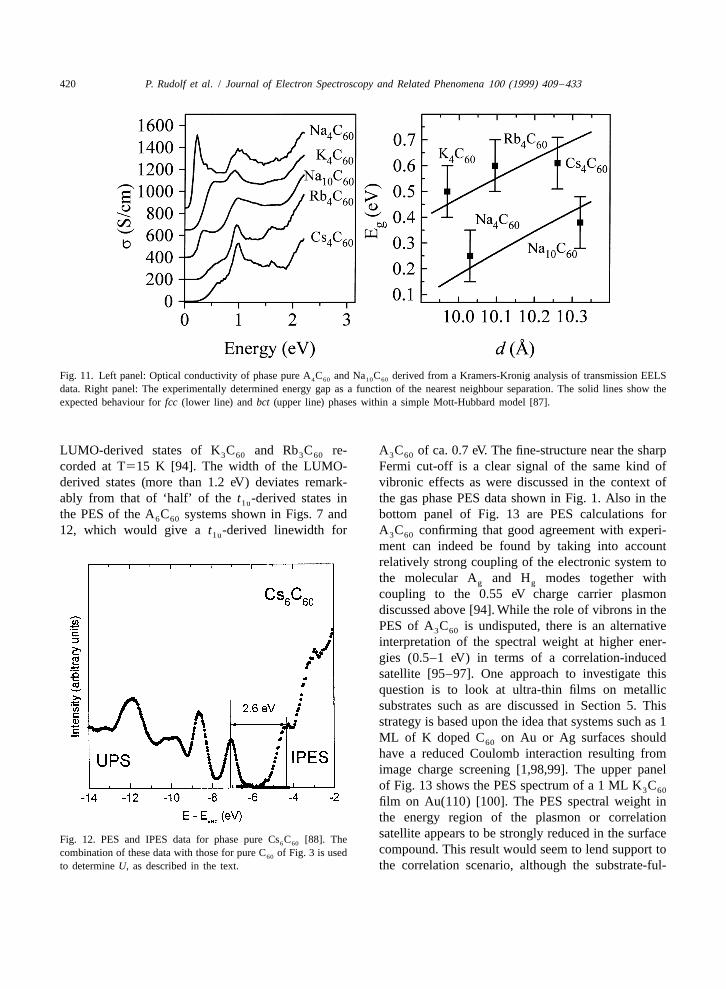
Fig. 12. The energy scale is referenced to the 1.2 eV. Momentum dependent EELS investigationsvacuum level [20,21,89]. The peak to peak energetic [91] have shown that the 0.55 eV plasmon (whoseseparation of the t and t -derived spectral features, width of 0.5 eV is a result of electron-phonon1u 1g
which measures the solid state equivalent to the gas interactions [92]), is essentially dispersionless, whichphase IP2EA, is 2.6 eV. Under the assumption of disagrees with theoretical predictions of a negativerigid band filling, this quantity may be compared plasmon dispersion due to local crystal field effectswith the energy separation of D51.2 eV in the IPES [93]. In fact, these effects are exactly cancelled outof solid C (Fig. 3). These numbers imply that by the reduced screening of the plasmon by inter-60
U51.4 eV, which is in good agreement with the band transitions at higher q [91].results of Auger /PES investigations of K C [43]. The 0.55 eV plasmon also makes itself felt in high6 60
An analogous analysis of the data for Cs C leads resolution PES studies of A C [94,95]. The bottom4 60 3 60
to a similar value of U.1.5 eV [89]. panel of Fig. 13 shows the PES profiles of the
420 P. Rudolf et al. / Journal of Electron Spectroscopy and Related Phenomena 100 (1999) 409 –433
Fig. 11. Left panel: Optical conductivity of phase pure A C and Na C derived from a Kramers-Kronig analysis of transmission EELS4 60 10 60
data. Right panel: The experimentally determined energy gap as a function of the nearest neighbour separation. The solid lines show theexpected behaviour for fcc (lower line) and bct (upper line) phases within a simple Mott-Hubbard model [87].
LUMO-derived states of K C and Rb C re- A C of ca. 0.7 eV. The fine-structure near the sharp3 60 3 60 3 60
corded at T515 K [94]. The width of the LUMO- Fermi cut-off is a clear signal of the same kind ofderived states (more than 1.2 eV) deviates remark- vibronic effects as were discussed in the context ofably from that of ‘half’ of the t -derived states in the gas phase PES data shown in Fig. 1. Also in the1u
the PES of the A C systems shown in Figs. 7 and bottom panel of Fig. 13 are PES calculations for6 60
12, which would give a t -derived linewidth for A C confirming that good agreement with experi-1u 3 60
ment can indeed be found by taking into accountrelatively strong coupling of the electronic system tothe molecular A and H modes together withg g
coupling to the 0.55 eV charge carrier plasmondiscussed above [94]. While the role of vibrons in thePES of A C is undisputed, there is an alternative3 60
interpretation of the spectral weight at higher ener-gies (0.5–1 eV) in terms of a correlation-inducedsatellite [95–97]. One approach to investigate thisquestion is to look at ultra-thin films on metallicsubstrates such as are discussed in Section 5. Thisstrategy is based upon the idea that systems such as 1ML of K doped C on Au or Ag surfaces should60
have a reduced Coulomb interaction resulting fromimage charge screening [1,98,99]. The upper panelof Fig. 13 shows the PES spectrum of a 1 ML K C3 60
film on Au(110) [100]. The PES spectral weight inthe energy region of the plasmon or correlationsatellite appears to be strongly reduced in the surfaceFig. 12. PES and IPES data for phase pure Cs C [88]. The6 60compound. This result would seem to lend support tocombination of these data with those for pure C of Fig. 3 is used60
to determine U, as described in the text. the correlation scenario, although the substrate-ful-

P. Rudolf et al. / Journal of Electron Spectroscopy and Related Phenomena 100 (1999) 409 –433 421
phases of Rb C using valence photoemission:1 60
high-temperature rocksalt, stable polymer, andquenched dimer. Each phase showed a characteristicnear-E electronic structure, varying from metallic,F
semimetallic, to insulating, respectively [101]. Simi-lar PES structures (without phase purity, due to roomtemperature preparation) have been observed forCs C [102–104], K C [102,103,105], Na C1 60 1 60 1 60
[103], and Li C [106], suggesting that this ten-1 60
dency is common to all the alkali metals. Calcula-tions have shown that doping with one electron perfullerene lowers the barrier to polymerisation by thepopulation of ‘intermolecular’ bonding orbitals[107].
Summing up this section, much of the informationregarding electronic ground states of the A C and3 60
A C materials won using electron spectroscopies is4 60
consistent with a picture in which the former are juston the metallic side of a Mott transition, whereas thelatter are just on the insulating side. This scenarioreceives support from theory in the form of thedegeneracy-dependent Jahn-Teller contribution to theCoulomb interaction, which would tend to increase Uin the A systems, but decrease U in A [108]. There4 3
is also growing experimental support for this picture:for example, A C can be induced to be metallic4 60
under pressure [109], and the expansion of theinterfullerene spacing in the K C by ammoniation3 60
leads to the formation of an antiferromagneticallyordered insulator [110,111] (which itself can bedriven metallic and superconducting by applicationof pressure).
5. C on surfaces60
Fig. 13. High-resolution PES spectra of (a) K C and (b)3 60The adsorption of C on well-defined surfacesRb C , recorded at 15 K, compared to (c) a model spectrum 603 60
enables one to control the physical properties of theincluding coupling both to intramolecular vibrations and thecharge carrier plasmon [94]. Upper panel: PES spectrum of 1 ML overlayer with a precision unmatched in bulk materi-K C /Au(110) [100].3 60 als. This section aims to give a flavour of the
defining role played by electron spectroscopies in thelerene interaction is by no means limited to a mere detailed characterisation of such systems. Firstly wescreening of U, as will be amply demonstrated in deal with the strength of the fullerene-substrateSection 5 below. interaction, and then the issue of charge transfer both
The A C family were also a topic of interest for at the surface and in novel two-dimensional A C1 60 x 60
electron spectroscopists. Using distillation methods compounds.[77], and with knowledge of the rich phase diagram, The interaction of C with different surfaces is60
it was possible to study all three known primary not only of van der Waals type as originally thought
422 P. Rudolf et al. / Journal of Electron Spectroscopy and Related Phenomena 100 (1999) 409 –433
[112], and is actually observed on surfaces like GeS except the one on GeS(001) show a shift in binding[113], SiO [114], or graphite [7], but results in a energy compared to the multilayer. It is difficult to2
great variety of both bond strength and bond charac- extract quantitative information regarding chargeter. On all metallic and conventional (Si, Ge, GaAs) transfer at the surface via comparison of C 1s BEssemiconductor surfaces investigated so far [115], from ML and thick films. This is a consequence offullerenes are always chemisorbed, but the degree of the fact that many of the monolayers are metallic,hybridisation of the C molecular orbitals with the whereas thicker films and van der Waals bound MLs60
substrate electronic states and the amount of charge are essentially insulators. This difference expressestransfer differs greatly from substrate to substrate. itself in terms of the different energy references andThe structure of the C monolayers is hexagonal or screening contributions relevant to the two cases. Let60
quasi-hexagonal resulting in compressed or enlarged us consider now the width of the C1s line. TheC –C spacings compared to the C solid in order intrinsic width for a thick film is measured to be of60 60 60
to achieve commensurate structures [1,2,115]. Photo- the order of 0.4 eV [117], which is much larger thanelectron diffraction studies [116] showed that differ- the core hole lifetime broadening (|0.1 eV) [18,19].ent adsorption geometries are possible for the The observed width can be attributed primarily tochemisorption case, comprising a ring, a single or intrinsic electron-phonon coupling, as indicated bydouble bond of the C cage or even only a C edge the similar width of the LUMO resonance in XAS,60 60
atom facing the substrate, and that the adsorbed which, as discussed in the context of Fig. 6, isfullerenes do not rotate at room temperature. essentially only vibronically broadened. Within the
Even for C MLs which are only physisorbed, Z11 approximation, this broadening is purely a60
PES has shown a slight change in the electronic consequence of the symmetry-breaking due to theproperties of the molecule, namely a broadening of core hole [22], the magnitude of which should bethe valence band features [7,113] due to the symme- quite similar for XPS and XAS. Increases in the C 1stry reduction brought upon by adsorption which width above the intrinsic value therefore providereduces the degeneracy of the molecular orbitals. In information on the bonding interaction of C .60
the case of polar substrates [113], a shift of substrate Depending on the system in question, this extravalence levels (band bending) attests to a polarisa- broadening in principle reflects a combination of thetion of the adsorbed C . A chemisorptive interaction following effects: C atomic sites with significantly60
has been deduced from much more substantial different environments; creation of electron-holechanges in the PES, IPES and XAS data in which the pairs; coupling to the charge carrier plasmon. Thespectral features derived from HOMO, HOMO-1, latter two are dominant in cases involving significantLUMO, LUMO11 and LUMO12 MOs (i.e. all charge transfer, such as C /Ag(111) shown here,60
orbitals with essentially p-character) change in width for which EELS data [118] show a high intensity ofand shift in energy compared to their respective low-energy electronic excitations and the chargelinewidths and positions in the C solid. The carrier plasmon at 0.9 eV. We note that in the C 1s60
sensitivity of the individual shifts and broadening to lineshape the coupling to the charge carrier plasmonoverlap with substrate electronic states clearly points is difficult to resolve. Typical for the covalentlyto the effects of hybridisation [1,2]. The spectral bound MLs in which little or no charge transferfeatures associated with higher or lower lying MOs occurs (such as C /Pt(111) shown here) are narrow60
(including those which have significant s character, C 1s lines. This observation tends to rule out aas well as the C 1s level, e.g. Fig. 16 of Ref. [2]) significant role for inequivalent C sites, which can beshow only rigid shifts and a slight broadening. tentatively explained by the very efficient in-
Additional information on the C -substrate inter- tramolecular screening of local charges, as calculated60
action has been retrieved from the C 1s photo- explicitly for a core hole [41].emission line and its shake-up satellites spectra such A further source of information is the shake-upas those presented in Fig. 14 for a C multilayer and structure, blown up in the right panel of Fig. 1460
a ML grown on GeS(001), and a ML on Ag(111), [1,115]. This structure corresponds to core-ionisedPt(111) and Ni(110), respectively [1,115]. All MLs final states in which a valence electron is promoted

P. Rudolf et al. / Journal of Electron Spectroscopy and Related Phenomena 100 (1999) 409 –433 423
Fig. 14. PES spectra [1,115] of the C 1s core level for a multilayer of C on GeS(001), and for 1 ML C on GeS(001), Ag(111), Ni(110)60 60
and Pt(111), respectively. The right panel shows an enlargement of the shake-up region for the same samples.
from an occupied to an unoccupied level [49,50], and strength, should fall in between C /Ag(111) and60
is therefore similar to a convolution of the occupied C /Ni(110) or Pt(111). The same trends were60
and unoccupied parts of the valence band. For the observed in the EELS spectra [118,120] and XASC ML on GeS one sees only these very sharp [2,89], which probe the electronic excitations. How-60
intrinsic shake-up structures while in the multilayer ever, for the C ML on all three metal surfaces60
extrinsic losses of the outgoing photoelectron shown here, the energy positions of EELS peaks andproduce additional structures in the same energy shake-up structures do not coincide, testifying to therange [113]. The broadening of the shake-up struc- influence of the core-hole.tures in the other ML films can be regarded as a PES [89,121], XAS [89] and EELS [121] experi-measure for the bonding interaction with the sub- ments have also demonstrated that in the case ofstrate. On Ag(111), similarly to that on Au(110) [89] chemisorption on a noble metal substrate, the in-and Al(110) [2], the shake-up features are still rather fluence of the substrate is always limited to the firstsharp and an intermediate bond strength is deduced. adsorbed layer of molecules. The thermal stability ofFor the C ML adsorbed on Ni(110) and on adsorbed C on metal surfaces has been explored by60 60
Pt(111), the shake-up structures are nearly totally PES, IPES, EELS and AES by following the dis-washed out, pointing to an increased bonding inter- appearance of the fingerprint of the C electronic60
action, identifiable with a more covalent character of structure and the appearance of that of decomposi-the bond. A markedly increased broadening has also tion products after both long-term annealingbeen reported also for C MLs on Al(111) [2] and [98,99,120,122,123] and nanosecond UV pulsed laser60
Cr [119] which, based on this criterion of bond irradiation [124]. In the latter case it was found that

424 P. Rudolf et al. / Journal of Electron Spectroscopy and Related Phenomena 100 (1999) 409 –433
on transition metal surfaces like Ni(111), the by reacting the fullerene with alkali metals and thischemisorptive bond ensures effective energy dissipa- is true also for an adsorbed C ML. Fig. 15 shows60
tion into the substrate and therefore allows the high resolution EELS data for a C ML deposited60
molecule to resist surface temperatures up to 2500 K on various coverages of Cs on a Au(110) surface:for a very short time [124]. Long-term annealing one clearly sees large shifts of C ’s vibrational60
experiments showed that coverages above 1 ML frequencies when the gold surface is pre-dosed withdesorb at 455 K, while the chemisorbed first layer Cs [36]. By calibrating these shifts against the valuesC desorbs molecularly from noble metal surfaces for bulk A C compounds [126–128], it has been60 x 60
like Ag(111) at 670 K [98,99]. On more reactive possible to demonstrate that in the two-dimensionalsurfaces decomposition of the molecule is observed A C overlayers (A5K,Cs) one obtains distinctx 60
2 2at temperatures as low as 690 K and 560 K on phases with charge states of approximately 3 , 42Pt(111) and Ni(110), respectively, and this catalytic and 6 (depending on the amount of alkali present)
process is found to be a kinetically-limited reaction and that no intermediate charge states are formed[122]. [36,125]. The similarity in electronic structure be-
High resolution EELS in reflection has been used tween the two- and three-dimensional compounds isfor a quantitative estimate of charge transfer from a confirmed by the comparison shown in Fig. 16 of thenoble or transition metal substrate to C based on electronic transitions measured by EELS in reflection60
the shift of the vibrational frequencies [118,120,125]. (top panels) and the valence band photoemissionThese measurements have shown that the chargestate of the adsorbed fullerene (about 1 electrontransferred on Au and Ag, about 2 electrons on Ni) isstrongly dependent on the type of metal but ratherindependent of the work function. The assignmentsof charge state were given qualitative support by theelectronic excitations in the overlayers measured byEELS [118,120,125], which also clearly confirmedthe metallic character of the overlayers previouslydeduced from PES and XAS data [89]. Alternatively,the charge transfer has also been estimated fromvalence band PES where it manifests itself in theappearance of new LUMO-derived spectral featuresclose to the Fermi edge. For C MLs on Ag(111)60
and on polycrystalline Au, Ag and Cu this LUMO-derived intensity was normalised to the areas beneaththe MO structures at higher binding energies aftersubtraction of the clean substrate signal and a chargetransfer of about 1.860.2 electrons per C molecule60
on Cu, 1.760.2 on Ag (0.75 on Ag(111)) and1.060.2 on Au was deduced [98,99]. Although thesevalues agree with those deduced from vibrationalEELS, this procedure, which relies on the subtractionof the clean substrate signal for quantification of the‘pure’ adsorbate signal, is questionable since hybridi-sation of C MOs with substrate electronic states is60
Fig. 15. High resolution EELS spectra measured in reflection inimportant as pointed out by the authors of Ref.the specular geometry from C MLs adsorbed on Au(110) with60[98,99], and explained above. different Cs pre-coverages. The spectrum from an undoped 5 ML
As seen in Section 4 for intercalated bulk com- C film is shown at the bottom for comparison. All spectra are60
pounds of C , higher charge states can be achieved normalised to the elastic peak intensity [36].60

P. Rudolf et al. / Journal of Electron Spectroscopy and Related Phenomena 100 (1999) 409 –433 425
Fig. 16. (a) EELS spectra showing the evolution of the electronic transitions of a ML C adsorbed on a Cs-pre covered Au(110) surface as60
a function of Cs coverage. The spectrum from an undoped 5 ML C film is shown at the bottom for comparison. The solid lines are the zero60
levels of the spectra. (b) EELS spectra from phase-pure vacuum distilled CsC , Cs C and Cs C samples. (c) Valence band PES from C60 4 60 6 60 60
MLs adsorbed on a Cs-precovered Au(110) surface as a function of Cs coverage and normalised to the HOMO-derived peak height. ThePES spectra of a bare Au(110) surface and of a C multilayer are shown at the bottom and the top, respectively, for comparison. (d) Valence60
band PES from phase-pure vacuum distilled CsC , Cs C and Cs C samples. The spectra are normalised to the HOMO-derived peak60 4 60 6 60
height [36].

426 P. Rudolf et al. / Journal of Electron Spectroscopy and Related Phenomena 100 (1999) 409 –433
(bottom panels) of Cs C and 1 ML C /1.4 ML imity of a metal has been investigated [130] by4 60 60
Cs /Au(110) or Cs C and 1 ML C /2 ML Cs/ measuring the valence band PES spectra for an6 60 60
Au(110) [36]. The EELS and valence band PES of 1 undoped and a fully K-doped C ML on Ag(111)60
ML C /1 ML Cs/Au(110) should be compared to and the IPES spectra for the undoped C ML. For60 60
the K C bulk compound spectra in Figs. 10 and 13, the undoped C ML the energy separation of the3 60 60
respectively, since pure phase Cs C has not been HOMO in electron removal and the LUMO in3 60
successfully produced by vacuum distillation so far. electron addition is |2.2 eV [130] (peak to peak),There are, however, some important differences which is a strongly reduced value compared to that
between bulk and surface compounds: in the latter of C bulk and bulk compounds quoted in Sections60
the alkali does not give up its s electron entirely to 3 and 4 above (see Figs. 3, 4 and 12). From the PESthe fullerene, but there is a competition between of the fully K-doped monolayer, an energy differ-charge transfer to the substrate and charge transfer to ence between the HOMO- and LUMO-derivedC , since a Cs:C ratio of approximately 4:1 is peaks, D51.6 eV [130] has been deduced, which is60 60
2needed to produce a 3 charge state in the case of 1 the same as in bulk K C (see Fig. 7 above [69])6 60
ML C /1 ML Cs/Au(110). Moreover, if one com- and very close to that in other A C bulk com-60 x 60
pares the shifts of the vibrational frequencies in the pounds (see for example Fig. 16 above [88], andbulk [126–128] and surface compounds, one notes Refs. [95,103,104]), showing that D is quite insensi-that except for 1 ML C on 2 or more MLs of tive to the chemical environment and to the charge60
alkali, one of the vibrational modes, the T (4) (at state of the molecule [130]. From the difference1u
178 meV in the pure C multilayer) remains ‘stiffer’ E 2D, U for the surface compound has been de-60 g
in the surface compounds than in the corresponding termined to be 0.6 eV [130]. A similar analysis ofbulk compounds as the alkali content increases PES [1] and IPES [37] data of 1 ML C /Au(110)60
[36,125] Since theory [129] predicts that molecular gives U52.1 eV21.6 eV50.5 eV. This reduction hasdistortion is important in determining the softening been explained in terms of screening from the metalof this mode, it is likely that this stiffness arises from [130]. These authors point out that such a screeninganisotropies induced in the molecule by bonding to mechanism due to the proximity of a metal surface isthe substrate. Another important difference is that by no means unique to fullerene /metal interfaces butwhile for bulk compounds the A C phase is the should also strongly modify the electronic structure4 60
thermodynamically most stable one [78,79], it is the of correlated ionic insulators at their interface with a2surface compound corresponding a 3 charge state metal. We point out, however, that this analysis
which is stabilised by the interaction with the neglects the chemical bond and the charge transfersubstrate. In fact, EELS and PES data have shown between the C molecule and the substrate while it60
that this phase can also be produced by annealing has been shown that a consequence of this bond isCs C or Cs C multilayers on Au(110) to 800 K that C 1s binding energy coincides with the XAS1 60 4 60
and AES measurements showed that it desorbs threshold indicating metallic screening [89].stoichiometrically above 900 K [36]. This desorptionbehaviour suggests that the substrate may form achemical bond with both the Cs adatoms and the C 6. Exotics /other doping routes60
in this phase. The formation of A C surfacex 60
compounds is obviously not unique to the co-deposi- In this section, we move away from C , aiming to60
tion of C and alkalis on Au(110) but has been give an impression of the wealth of somewhat more60
followed by valence band PES [98,99,130] and IPES exotic systems to which the fullerene family plays[130] also for K-doped monolayers on Ag(111) and host. Fig. 17 illustrates schematically the three typeson polycrystalline Cu, Ag and Au. Again the surface of doping strategy available for the modification of
2compound with the 3 charge state was found to be the electronic structure and properties of fullerenes:the most stable [98,99]. exohedral doping (intercalation), on-ball doping
The important question as to how the on-site (heterofullerene formation) and in-ball doping (endo-Coulomb interaction, U, is influenced by the prox- hedral fullerene formation). Exohedral doping has

P. Rudolf et al. / Journal of Electron Spectroscopy and Related Phenomena 100 (1999) 409 –433 427
Fig. 17. Schematic representation of three possible doping routes in fullerenes.
been dealt with already in Sections 4 and 5, thus weconcentrate here on the two remaining doping meth-ods, both of which involve moving away from the‘all carbon’ standpoint. The insights offered byelectron spectroscopies into the similarities anddifferences between these systems and C forms the60
basis of this section.The first heterofullerene to be synthesised in
macroscopic quantities is C N, or azafullerene59
[131]. In this system a carbon atom has beenreplaced by N – a situation formally equivalent ton-type doping. In the solid state, C N forms dimers59
which condense in a monoclinic crystal structure[132]. Fig. 18 shows a comparison of the valenceband PES and the C 1s excitation spectra (measuredusing EELS) of (C N) and C [133]. Also shown59 2 60
is diazafullerene’s N 1s excitation spectrumdownshifted in energy by 115.5 eV (5BE –BE )N1s C1s
[134]. At the bottom of each panel are plottedbroadened calculated N-derived partial DOS (PDOS)and the total DOS, which were obtained fromcalculations based upon density functional theory[133,135], shifted such that the energy of the leadingmaximum matches that observed in experiment. For
Fig. 18. PES and core level excitation spectra [133] measured(C N) , both the PES and C 1s excitation spectra59 2using transmission EELS of multilayers of C and (C N) : [s]60 59 2are broader than those of C , but the energy60 – pure C ; [d] – (C N) ; [^] – N 1s excitation of (C N)60 59 2 59 2positions of the main features remain essentially shifted as described in the text. The solid lines show both the
unchanged – a result of the lower molecular symme- calculated total DOS of (C N) , as well as that projected onto the59 2
try. Additionally, the first photoemission maximum N atomic wave functions.
428 P. Rudolf et al. / Journal of Electron Spectroscopy and Related Phenomena 100 (1999) 409 –433
of (C N) has a shoulder at about 0.5 eV lower BE, mation is far from a mere n-type doping of C , with59 2 60
which can be assigned to states related to the extra the altered molecular structure and presence of theelectron which maintains a high degree of nitrogen extra nuclear charge at the N site both playing acharacter. This conclusion is in perfect agreement major role in shaping the electronic structure ofnot only with the N 2p-PDOS, but also with the C 1s diazafullerene.and N 1s excitation spectra. Not only is the overall The next ‘doping’ strategy to be considered isshape of the C 1s excitation spectrum of the endohedral doping. One of the key parameters ofheterofullerene very similar to that of C , the endohedrally doped fullerenes is the charge transfer60
spectral weight of all p*-derived structures is in fact between the encaged atom and the fullerene mole-identical for both systems. This indicates that the cule. The vast majority of work on monometalloful-N-substitution does not lead to significant occupation lerenes containing lanthanide ions has discussedof the C-derived low-lying unoccupied states of C , charge transfer exclusively in terms of a60
31 32in agreement with the calculated unoccupied C- M @(C ) configuration (i.e. a charge transfer of82
PDOS. These results are a direct consequence of the 3 electrons). However, already early on, core levelelectron density distribution of the HOMO and the photoemission data pointed to a degree of covalenceLUMO of the C N dimer. The HOMO of (C N) in the La@C system equivalent to that in LaBr59 59 2 82 3
is very different from that of C and also from that [139,140], and a more recent RESPES study sug-601of a single C N molecule [136], being strongly gested a La valence state of 2.7 [141].59
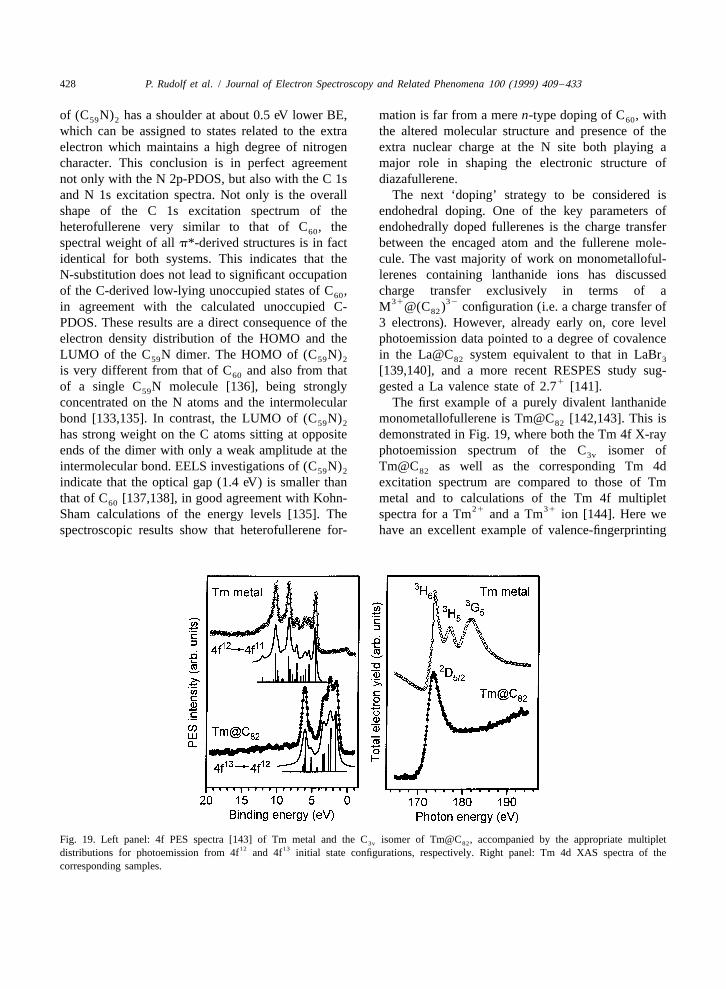
concentrated on the N atoms and the intermolecular The first example of a purely divalent lanthanidebond [133,135]. In contrast, the LUMO of (C N) monometallofullerene is Tm@C [142,143]. This is59 2 82
has strong weight on the C atoms sitting at opposite demonstrated in Fig. 19, where both the Tm 4f X-rayends of the dimer with only a weak amplitude at the photoemission spectrum of the C isomer of3v
intermolecular bond. EELS investigations of (C N) Tm@C as well as the corresponding Tm 4d59 2 82
indicate that the optical gap (1.4 eV) is smaller than excitation spectrum are compared to those of Tmthat of C [137,138], in good agreement with Kohn- metal and to calculations of the Tm 4f multiplet60
21 31Sham calculations of the energy levels [135]. The spectra for a Tm and a Tm ion [144]. Here wespectroscopic results show that heterofullerene for- have an excellent example of valence-fingerprinting
Fig. 19. Left panel: 4f PES spectra [143] of Tm metal and the C isomer of Tm@C , accompanied by the appropriate multiplet3v 8212 13distributions for photoemission from 4f and 4f initial state configurations, respectively. Right panel: Tm 4d XAS spectra of the
corresponding samples.

P. Rudolf et al. / Journal of Electron Spectroscopy and Related Phenomena 100 (1999) 409 –433 429
via the characteristic multiplets in the PES and EELS C molecule of 160.2 eV has been arrived at [145],70
in transmission spectra. The almost perfect agree- placing C in a similar ball-park as C . Unlike C70 60 60
ment between the endohedral fullerene’s Tm 4f PES though, there have been no spectroscopic (or other)13 12spectrum and the calculations for a 4f →4f photo- indications of metallic behaviour in any intercalated
emission process, together with the single peak in the or otherwise modified C system. As regards the70
core-level excitation spectrum prove conclusively a other higher fullerenes, there have been electron13Tm 4f ground state configuration and thus the pure spectroscopic studies of a large number of these,
divalent nature of Tm in Tm@C . This conclusion both in their pristine state and intercalated with alkali82
is backed up by autoionisation studies (not shown) metals, in which the samples were in the form of awhere even with the photon energy tuned to the mixture of more than one structural isomer. Underenergy of one of the Tm(III) 4d→4f excitation this category fall studies of C [147–149], C76 78
11channels, no emission corresponding to a 4f final [149,150], C [151], C [149], C [149,152], and80 82 84
state is observed. Unlike other systems containing C [149]. To give a flavour of the trends observed,9621Tm , the divalent Tm state in the endohedral we show here in Fig. 20 a collection of photo-
fullerene is highly stable, both in UHV and even in emission and C1s excitation data recorded withair, illustrating the novel properties conferred upon EELS in transmission for a range of higher ful-the rare earth ion by its encapsulation within the lerenes.fullerene molecule. There is an overall similarity of the occupied and
The last class of fullerenes which we would like to unoccupied electronic states of the fullerenes showntake up are the higher fullerenes and the fullerene in Fig. 20, which is a natural expression of theirpolymers. Inevitably, the most widely studied higher common molecular architecture. In general, thefullerene is the next up on the fullerene family-tree energy onset of the C 1s excitation decreases withfrom C : C , which shares C ’s (experimental) increasing fullerene size resulting from the decrease60 70 60
advantage of existing in only a single isomeric form. in curvature and concurrent decrease of the C 2sC has been investigated in the gas phase [23] as contribution to the p-derived states. Noteworthy,70
well as in solid form [145], as have its intercalation however, are the marked differences in the p-derivedcompounds with the alkali metals K [146] and Rb structures near the chemical potential in the spectra[5]. Through the comparison between Auger and of the two C isomers of C [153], despite the fact2v 78
photoemission data, an estimate of the Coulomb that these two molecules differ only by a Stone-repulsion between two electrons or holes on a single Wales transformation (a rotation of one C–C unit by
Fig. 20. Left panel: PES spectra of multilayer films of the indicated fullerenes. Right panel: Corresponding C 1s excitation spectra measuredusing EELS in transmission.

430 P. Rudolf et al. / Journal of Electron Spectroscopy and Related Phenomena 100 (1999) 409 –433
908 [154]). This observation illustrates that even very and D. Lynch. Many thanks also to M.R.C. Hunt forsmall variations in the molecular structure have critical reading of the manuscript.considerable impact on the relative energy positionof the lowest lying electronic levels, and underscoresthe importance of isomer-separated material in the
Referencesspectroscopic investigation of fullerene-based materi-als.
[1] P. Rudolf, in: H. Kuzmany, J. Fink, M. Mehring, S. Roth(Eds.), Fullerenes and Fullerene Nanostructures, World Sci-entific, Singapore, 1996, p. 263.
7. Summary ¨ ¨[2] A.J. Maxwell, P.A. Bruhwiler, D. Arvanitis, J. Hasselstrom,˚M.K.-J. Johansson, N. Martensson, Phys. Rev. B57 (1998)
7312.We hope we have succeeded in communicating an[3] J.H. Weaver, D. Poirier, in: H. Ehrenreich, F. Spaepen (Eds.),impression of the numerous valuable insights given
Solid State Physics: Fullerenes, Academic, Boston, 1994, p.by electron spectroscopies in the investigation of the 1.fascinating fullerene family. The intimate connection [4] J.H. Weaver, J. Phys. Chem. Solids 53 (1992) 1433.between structure and electronic properties, which is [5] M.S. Golden, M. Knupfer, J. Fink, J.F. Armbruster, T.R.
Cummins, H.A. Romberg, M. Roth, M. Sing, M. Schmidt, E.even more pronounced for molecular or nano-scaleSohmen, J. Phys. Condens. Matter 7 (1995) 8219.objects, suggests that the techniques described here
[6] D.L. Lichtenberger, M.E. Jatcko, K.W. Nebesny, C.D. Ray,will continue to play an important role as the study D.R. Huffman, L.D. Lamb, Mat. Res. Soc. Symp. Proc. 206of the fullerenes and other carbon-based nanostruc- (1991) 673.tures evolves. A relatively underdeveloped compo- ¨[7] P.A. Bruhwiler, A.J. Maxwell, P. Baltzer, S. Andersson, D.
˚Arvanitis, L. Karlsson, N. Martensson, Chem. Phys. Lett.nent in the electron spectroscopic arsenal which is279 (1997) 85.likely to increase in importance is that of spec-
[8] Taking the centroid of the peak, which is the definition of thetroscopy using the scanning tunnelling microscope,vertical ionization potential. The typically-noted value of 7.6
as well as the use of higher resolution EELS in the eV refers to the strong peak in the spectrum.transmission electron microscope. While the latter [9] I.V. Hertel, H. Steger, J. deVries, B. Weisser, C. Menzel, B.
Kamke, W. Kamke, Phys. Rev. Lett. 68 (1992) 784.has been applied so far mainly to carbon nanotubes[10] C. Lifshitz, Mass. Spectrom. Rev. 12 (1993) 261.[155], the former has been used to measure the[11] O. Gunnarsson, H. Handschuh, P.S. Bechthold, B. Kessler,superconducting energy gap of Rb C [156], and to3 60 ¨G. Gantefor, W. Eberhardt, Phys. Rev. Lett. 74 (1995) 1875.
characterise C MLs on metals [157–160]. The60 [12] We take the centroid of the data of Ref. [11], shown in Fig.spatial resolution inherent in these techniques opens 1, and not peak just below 2.70 eV, which corresponds to the
adiabatic electron affinity.new avenues in the investigation of materials as yet[13] L.-S. Wang, J. Conceicao, C. Jin, R.E. Smalley, Chem. Phys.unavailable in pure form in macroscopic quantities,
Lett. 182 (1991) 5.thus enabling a more efficient investment of re-[14] L.-S. Wang, O. Cheshnovsky, R.E. Smalley, J.P. Carpenter,
sources in a still rapidly expanding field. S.J. Hwu, J. Chem. Phys. 96 (1992) 4028.¨ ´[15] B. Wastberg, A. Rosen, Phys. Scripta 44 (1991) 276.
[16] T. Liebsch, O. Plotzke, F. Heiser, U. Hergenhahn, O.Hemmers, R. Wehlitz, J. Viefhaus, B. Langer, S.B. Whitfield,AcknowledgementsU. Becker, Phys. Rev. A52 (1995) 457.
[17] Y.B. Xu, M.Q. Tan, U. Becker, Phys. Rev. Lett. 76 (1996)This work was supported by the European Union3538.
(TMR contract ERB FMRX-CT 970155) and would ¨[18] P.A. Bruhwiler, A.J. Maxwell, P. Rudolf, C.D. Gutleben, B.have been impossible without the dedication of a ¨ ˚Wastberg, N. Martensson, Phys. Rev. Lett. 71 (1993) 3721.
[19] Gas phase data at higher temperature, for which vibrationallarge number of people in the Namur, Dresden andexcitation and/or lower resolution obscure some details areUppsala laboratories. We would like to heartily thankgiven in: S. Krummacher, M. Biermann, M. Neeb, A.the following persons for contributing data whichLiebsch, W. Eberhardt, Phys. Rev. B48 (1993) 8424.
was (or was considered to be) included in some of ¨ ¨[20] A.J. Maxwell, P.A. Bruhwiler, D. Arvanitis, J. Hasselstrom,the figures: N. Gruhn and D. Lichtenberger; B. ˚N. Martensson, Chem. Phys. Lett. 260 (1996) 71.
¨ ¨Kessler, G. Gantefor, and W. Eberhardt; C. Olson [21] P.A. Bruhwiler (unpublished).
P. Rudolf et al. / Journal of Electron Spectroscopy and Related Phenomena 100 (1999) 409 –433 431
¨ ¨[22] B. Wastberg, S. Lunell, C. Enkvist, P.A. Bruhwiler, A.J. [47] D.P. Joubert, Solid State Commun. 87 (1993) 1009.˚Maxwell, N. Martensson, Phys. Rev. B50 (1994) 13031. [48] G. Gensterblum, K. Hevesi, B.-Y. Han, L.-M. Yu, J.-J.
[23] R.E. Haufler, L.-S. Wang, L.P.F. Chibante, C. Jin, J. Conce- Pireaux, P.A. Thiry, R. Caudano, A.-A. Lucas, D. Bernaerts,icao, Y. Chai, R.E. Smalley, Chem. Phys. Lett. 179 (1991) S. Amelinckx, G. Van Tendeloo, G. Bendele, T. Buslaps,449. R.L. Johnson, M. Foss, R. Feidenhans’l, G. Le Lay, Phys.
Rev. B50 (1994) 11981.[24] J.W. Keller, M.A. Coplan, Chem. Phys. Lett. 193 (1992) 89.¨[49] C. Enkvist, S. Lunell, B. Sjogren, S. Svensson, P.A.[25] C. Bulliard, M. Allan, S. Leach, Chem. Phys. Lett. 209
¨ ˚Bruhwiler, A. Nilsson, A.J. Maxwell, N. Martensson, Phys.(1993) 434.Rev. B48 (1993) 14629.[26] R. Abouaf, J. Pommier, S. Cvejanovic, Chem. Phys. Lett.
¨ ¨[50] C. Enkvist, S. Lunell, B. Sjogren, P.A. Bruhwiler, S.213 (1993) 503.Svensson, J. Chem. Phys. 103 (1995) 6333.[27] A. Burose, T. Dresch, A. Ding, Z. Phys. D 26 (1993) S294.
[51] E.L. Shirley, S.G. Louie, Phys. Rev. Lett. 71 (1993) 133.[28] For theory see K. Yabana, G.F. Bertsch, J. Chem. Phys. 100[52] S.G. Louie, E.L. Shirley, J. Phys. Chem. Solids 54 (1993)(1994) 5580.
1767.[29] A. Bulgac, N. Ju, Phys. Rev. B46 (1992) 4297.[53] G. Gensterblum, L.-M. Yu, J.-J. Pireaux, P.A. Thiry, R.[30] For recent theory and a review, see N. Breda, R.A. Broglia,
Caudano, J.P. Vigneron, Ph. Lambin, A.A. Lucas, W.`G. Colo, H.E. Roman, F. Alasia, G. Onida, V. Ponomarev, E.¨Kratschmer, Phys. Rev. Lett. 67 (1991) 2171.Vigezzi, Chem. Phys. Lett. 286 (1998) 350.
[54] A. Lucas, G. Gensterblum, J.-J. Pireaux, P.A. Thiry, R.[31] L.-S. Wang, O. Cheshnovsky, R.E. Smalley, J.P. Carpenter,¨Caudano, J.P. Vigneron, Ph. Lambin, W. Kratschmer, Phys.S.J. Hwu, J. Chem. Phys. 96 (1992) 4028.
Rev. B45 (1992) 13694.[32] R.M. Fleming, T. Siegrist, P.M. Marsh, B. Hessen, A.R.¨[55] E. Sohmen, J. Fink, W. Kratschmer, Europhys. Lett. 17Kortan, D.W. Murphy, R.C. Haddon, R. Tycko, G. Dabbagh,
(1992) 51.A.M. Mujsce, M.L. Kaplan, S.M. Zahurac, Mat. Res. Soc.[56] E. Sohmen, J. Fink, Phys. Rev. B47 (1993) 14532.Symp. Proc. 206 (1991) 691.[57] R. Eder, A.M. Janner, G.A. Sawatzky, Phys. Rev. B53[33] P.A. Heiney, J.E. Fischer, A.R. McGhie, W.J. Romanow,
(1996) 12786.A.M. Denenstein, J.P. McCauley, A.B. Smith, D.E. Cox,Phys. Rev. Lett. 66 (1991) 2911. [58] F. Negri, G. Orlandi, F. Zerbetto, Chem Phys Lett 144
(1998) 31.[34] W.I.F. David, R.M. Ibberson, J.C. Matthewman, K. Pras-sides, T.J.S. Dennis, J.P. Hare, H.W. Kroto, R. Taylor, [59] C. Cepek, A. Goldoni, S. Modesti, F. Negri, G. Orlandi, F.D.R.M. Walton, Nature 353 (1991) 147. Zerbetto, Chem. Phys. Lett. 250 (1996) 537.
[35] However, bond charge interactions have to be invoked as [60] H. Romberg, E. Sohmen, M. Merkel, M. Knupfer, M.well to account for the stability of the low temperature Alexander, M.S. Golden, P. Adelmann, T. Pietrus, J. Fink, R.phase; see for example: J. Yu, L. Bi, R.K. Kalia, P. Vashishta, Seemann, R.L. Johnson, Synth. Met. 55–57 (1993) 3038.Phys. Rev. B49 (1994) 5008. [61] D. Li, S. Velasquez, S.E. Schnatterly, Phys. Rev. B49 (1994)
[36] M.R.C. Hunt, P. Rudolf, S. Modesti, Phys. Rev. B55 (1997) 2969.7889. [62] A. Goldoni, C. Cepek, S. Modesti, Phys. Rev. B54 (1996)
[37] M. Pedio, M.L. Grilli, C. Ottaviani, M. Capozi, C. 2890.Quaresima, P. Perfetti, P.A. Thiry, R. Caudano, P. Rudolf, J. [63] K. Zeppenfeld, Z. Phys. 243 (1971) 229.Electron Spectrosc. Related. Phenom. 76 (1995) 405. [64] T. Pichler, M. Knupfer, M.S. Golden, J. Fink, A. Rinzler,
[38] R. Schwedhelm, L. Kipp, A. Dallmeyer, M. Skibowski, R.E. Smalley, Phys. Rev. Lett. 80 (1998) 4729.Phys. Rev. B58 (1998) 13176. [65] P.J. Benning, C.G. Olson, D.W. Lynch, J.H. Weaver, Phys.
[39] M.B.J. Meinders, L.H. Tjeng, G.A. Sawatzky, Phys. Rev. Rev. B50 (1994) 11239.Lett. 73 (1994) 2937. [66] G. Gensterblum, J.-J. Pireaux, P.A. Thiry, R. Caudano, T.
[40] R.W. Lof, M.A. van Veenendaal, B. Koopmans, H.T. Jon- Buslaps, R.L. Johnson, G. Le Lay, V. Aristov, R. Gunther, A.kman, G.A. Sawatzky, Phys. Rev. Lett. 68 (1992) 3924. Taleb-Ibrahimi, G. Indlekofer, Y. Petroff, Phys. Rev. B48
¨[41] E. Rotenberg, C. Enkvist, P.A. Bruhwiler, A.J. Maxwell, N. (1993) 14756.˚Martensson, Phys. Rev. B54 (1996) R5279. [67] G. Gensterblum, J. Electron Spectrosc. Related Phenom. 81
[42] E.L. Shirley, L.X. Benedict, S.G. Louie, Phys. Rev. B54 (1996) 89.(1996) 10970. [68] J.-M. Themlin, S. Bouzidi, F. Coletti, J.-M. Debever, G.
¨ ˚[43] P.A. Bruhwiler, A.J. Maxwell, A. Nilsson, N. Martensson, O. Gensterblum, L.-M. Yu, J.-J. Pireaux, P.A. Thiry, Phys. Rev.Gunnarsson, Phys. Rev. Rev. B48 (1993) 18296. B46 (1992) 15602.
[44] R.W. Lof, M.A. vanVeenendaal, H.T. Jonkman, G.A. [69] C.-T. Chen, L.-H. Tjeng, P. Rudolf, G. Meigs, J.E. Rowe, J.Sawatzky, J. Electron Spectrosc. Related Phenom. 72 (1995) Chen, J.P. McCauley, A.B. Smith, A.R. McGhie, W.J.83. Romanow, E.W. Plummer, Nature 352 (1991) 603.
¨ ˚ ¨ ˚[45] P.A. Bruhwiler, A.J. Maxwell, N. Martensson, Int. J. Mod. [70] A.J. Maxwell, P.A. Bruhwiler, S. Andersson, N. Martensson,Phys. B 6 (1992) 3923. P. Rudolf, Chem. Phys. Lett. 247 (1995) 257.
[46] O. Gunnarsson, D. Rainer, G. Zwicknagl, Int. J. Mod. Phys. [71] W. Andreoni, P. Giannozzi, J.F. Armbruster, M. Knupfer, J.B 6 (1992) 3993. Fink, Europhys. Lett. 34 (1996) 699.

432 P. Rudolf et al. / Journal of Electron Spectroscopy and Related Phenomena 100 (1999) 409 –433
[72] W. Andreoni, P. Giannozzi, M. Parrinello, Phys. Rev. Lett. J. Fink, M. Mehring, S. Roth (Eds.), Fullerenes and72 (1994) 848. Fullerene Nanostructures, World Scientific, Singapore,
1996, p. 298.[73] Y. Chen, D.M. Poirier, M.B. Jost, C. Gu, T.R. Ohno, J.L.Martins, J.H. Weaver, L.P.F. Chibante, R.E. Smalley, Phys. [101] D.M. Poirier, C.G. Olson, J.H. Weaver, Phys. Rev. B52Rev. B46 (1992) 7961. (1995) 11662.
[74] G.K. Wertheim, G.N.E. Buchanan, J.E. Rowe, Science 258 [102] S.L. Molodtsov, C. Casado, M.E. Davila, M. Moreno, F.(1992) 1638. Soria, M.C. Asensio, J. Phys.: Condens. Matter 6 (1994)
[75] H.A. Romberg, M. Roth, J. Fink, Phys. Rev. B49 (1994) 925.1427. [103] M. De Seta, F. Evangelisti, Phys. Rev. B51 (1995) 6852.
[76] M. Knupfer, F. Stepniak, J.H. Weaver, Phys. Rev. B49 [104] M. De Seta, L. Petaccia, F. Evangelisti, J. Phys.: Condens.(1994) 7620. Matter 8 (1996) 7221.
[77] D.M. Poirier, Appl. Phys. Lett. 64 (1994) 1356. ´[105] A. Gutierrez, S.L. Molodtsov, J. Phys.: Condens. Matter 9[78] D.M. Poirier, J.H. Weaver, Phys. Rev. B47 (1993) 10959. (1997) 11151.
¨ ˚[79] D.M. Poirier, D.W. Owens, J.H. Weaver, Phys. Rev. B51 [106] J. Schnadt, P.A. Bruhwiler, N. Martensson, F. Rohmund, A.(1995) 1830. Lassesson, E.E.B. Campbell (unpublished).
¨ ¨[80] M. Knupfer, J.F. Armbruster, H.A. Romberg, J. Fink, Synth. [107] J. Fagerstrom, S. Stafstrom, Phys. Rev. B53 (1996) 13150.Met. 70 (1995) 1321. [108] O. Gunnarsson, Phys. Rev. B51 (1995) 3493.
[81] F. Stepniak, P.J. Benning, D.M. Poirier, J.H. Weaver, Phys. [109] R. Kerkoud, P. Auban-Senzier, D. Jerome, S. Brazovskii, I.Rev. B48 (1993) 1899. Luk’yanchuk, N. Kirova, F. Rachdi, C. Goze, J. Phys.
[82] R.F. Kiefl, T.L. Duty, J.W. Schneider, A. MacFarlane, K. Chem. Solids 57 (1996) 143.Chow, J.W. Elzey, P. Mendels, G.D. Morris, J.H. Brewer, E.J. [110] C.M. Brown, K. Prassides, Y. Iwasa, H. Shimoda, in: K.M.Ansaldo, C. Niedermayer, D.R. Noakes, C.E. Stronach, B. Kadish, R.S. Ruoff (Eds.), Recent Advances in the Chemis-Hitti, J.E. Fischer, Phys. Rev. Lett. 69 (1992) 2005. try and Physics of Fullerenes and Related Materials,
[83] J.P. Lu, Phys. Rev. B49 (1994) 5687. Electrochemical Society, Pennington, NJ, 1997, pp. 1224–1231.[84] Y. Iwasa, T. Kaneyasu, M. Nagata, N. Mizutani, Synth. Met.
70 (1995) 1361. [111] K. Prassides, K. Tanigaki, Y. Iwasa, Physica C 282 (1997)307.[85] R. Kerkoud, P. Auban-Senzier, D. Jerome, S. Brazovskii, N.
Kirova, I. Lukyanchuk, F. Rachdi, C. Goze, Synth. Met. 77 [112] R.J. Wilson, G. Meijer, D.S. Bethune, R.D. Johnsson, D.D.(1996) 205. Chambliss, M.S. de Vries, H.E. Hunziker, H.R. Wendt,
Nature 348 (1990) 621.[86] M. Knupfer, J. Fink, J.F. Armbruster, Z. Phys. B 101 (1996)57. [113] G. Gensterblum, K. Hevesi, B.Y. Han, L.M. Yu, J.-J.
Pireaux, P.A. Thiry, R. Caudano, A.A. Lucas, D. Bernaerts,[87] M. Knupfer, J. Fink, Phys. Rev. Lett. 79 (1997) 2714.S. Amelinck, G. Van Tendeloo, G. Bendele, T. Buslaps,[88] M.R.C. Hunt, S. Modesti, M. Pedio, P. Rudolf, unpublished.R.L. Johnson, M. Foss, R. Feidenhans’l, G. LeLay, Phys.¨ ˚[89] A.J. Maxwell, P.A. Bruhwiler, A. Nilsson, N. Martensson, P.Rev. B50 (1994) 11981.Rudolf, Phys. Rev. B 49 (1994) 10717.
[114] A.V. Hamza, M. Balooch, Chem. Phys. Lett. 201 (1993)[90] M. Knupfer, J. Fink, J.F. Armbruster, H.A. Romberg, Z.404.Phys. B 98 (1995) 9.
[115] P. Rudolf, G. Gensterblum, R. Caudano, J. Phys. France 7[91] O. Gunnarsson, V. Eyert, M. Knupfer, J. Fink, J.F. Armbrus-(1997) C6–136.ter, J. Phys.: Condens. Matter 8 (1996) 2557.
[116] R. Fasel, P. Aebi, R.G. Agostino, D. Namovic, J. Osterwal-[92] A.I. Liechstenstein, O. Gunnarsson, M. Knupfer, J. Fink, J.F.der, A. Santaniello, L. Schlapbach, Phys Rev. Lett. 76Armbruster, J. Phys.: Condens. Matter 8 (1996) 4001.(1996) 4733.[93] V.V. Kresin, V.Z. Kresin, Phys. Rev. B49 (1994) 2715.
[117] J.E. Rowe, P. Rudolf, L.H. Tjeng, R.A. Malic, G. Meigs,[94] M. Knupfer, M. Merkel, M.S. Golden, J. Fink, O. Gunnar-C.T. Chen, J. Chen, E.W. Plummer, Int. J. Mod. Phys. B6sson, V.P. Antropov, Phys. Rev. B47 (1993) 13944.(1992) 3909.[95] P.J. Benning, F. Stepniak, D.M. Poirier, J.L. Martins, J.H.
[118] M.R.C. Hunt, S. Modesti, P. Rudolf, R.E. Palmer, Phys.Weaver, L.P.F. Chibante, R.E. Smalley, Phys. Rev. B47Rev. B51 (1995) 10039.(1993) 13843.
[119] T.R. Ohno, Y. Chen, S.E. Harvey, G.H. Kroll, J.H. Weaver,[96] G.A. Sawatzky, in: H. Kuzmany, J. Fink, M. Mehring, S.R.E. Haufler, R.E. Smalley, Phys. Rev. B44 (1991) 13747.Roth (Eds.), Physics and Chemistry of Fullerenes and
[120] C. Cepek, A. Goldoni, S. Modesti, Phys. Rev. B53 (1996)Derivatives, World Scientific, 1995, p. 373.7466.[97] M. Meinders, Ph.D. Thesis, University of Gronginen, 1994.
[121] M.R.C. Hunt, P. Rudolf, S. Modesti, Phys. Rev. B55 (1997)[98] L.H. Tjeng, R. Hesper, A.C.L. Heessels, A. Heeres, H.T.7882.Jonkman, G.A. Sawatzky, Solid State Commun. 103 (1997)
[122] M. Pedio, K. Hevesi, N. Zema, M. Capozi, P. Perfetti, R.31.Gouttebaron, J.-J. Pireaux, R. Caudano, P. Rudolf, Surface[99] B.W. Hoogenboom, R. Hesper, L.H. Tjeng, G.A. Sawatzky,Science, in press.Phys. Rev. B57 (1998) 11939.
¨[100] A. Muller, R. Manzke, P. Rudolf,V. Saltas, in: H. Kuzmany, [123] A. Sellidj, B.E. Koel, J. Phys. Chem. 97 (1993) 10076.

P. Rudolf et al. / Journal of Electron Spectroscopy and Related Phenomena 100 (1999) 409 –433 433
[124] Ch. Kusch, B. Winter, R. Mitzner, A. Gomes-Silva, E.E.B. [141] B. Kessler, A. Bringer, S. Cramm, C. Schlebusch, W.Cambell, I.V. Hertel, Chem. Phys. Lett. 275 (1997) 469. Eberhardt, S. Suzuki, Y. Achiba, F. Esch, M. Barnaba, D.
[125] S. Modesti, S. Cerasari, P. Rudolf, Phys. Rev. Lett. 71 Cocca, Phys. Rev. Lett. 79 (1997) 2289.(1993) 2469. [142] U. Kirbach, L. Dunsch, Angew. Chem. Int. Ed. Engl. 35
[126] Y. Iwasawa, T. Kaneyasu, Phys. Rev. B51 (1995) 3678. (1996) 2380.[127] T. Pichler, M. Matus, H. Kuzmany, Solid State Commun. [143] T. Pichler, M.S. Golden, M. Knupfer, J. Fink, U. Kirbach,
86 (1993) 221. P. Kuran, L. Dunsch, Phys. Rev. Lett. 79 (1997) 3026.[128] T. Pichler, R. Winkler, H. Kuzmany, Phys. Rev. B49 (1994) [144] F. Gerken, J. Phys. F 13 (1983) 703.
15879. [145] M. Knupfer, D.M. Poirier, J.H. Weaver, Phys. Rev. B49[129] P. Giannozzi, W. Andreoni, Phys. Rev. Lett. 76 (1996) (1994) 2281.
4915. [146] M. Knupfer, D.M. Poirier, J.H. Weaver, Phys. Rev. B49[130] R. Hesper, L.H. Tjeng, G.A. Sawatzky, Europhysics Lett. (1994) 8464.
40 (1997) 177. [147] S. Hino, K. Matsumoto, S. Hasegawa, H. Inokuchi, K. Seki,[131] J.C. Hummelen, B. Knight, J. Pavlovich, R. Gonzales, F. K. Kikuchi, S. Suzuki, I. Ikemoto, Y. Achiba, Chem. Phys.
Wudl, Science 269 (1995) 1554. Lett. 197 (1992) 38.[132] C.M. Brown, L. Cristofolini, K. Kordatos, K. Prassides, C. [148] J.F. Armbruster, H.A. Romberg, P. Schweiss, P. Adelmann,
Bellavia-Lund, R. Gonzales, M. Keshavarz-K, F. Wudl, M. Knupfer, J. Fink, R.H. Michel, J. Rockenberger, F.A.K. Cheetham, J.P. Zhang, W. Andreoni, A. Curioni, A.N. Hennrich, H. Schreiber, M.M. Kappes, Z. Phys. B 95Fitch, P. Pattison, Chem. Mater. 8 (1996) 2548. (1994) 469.
[133] T. Pichler, M. Knupfer, M.S. Golden, S. Haffner, R. [149] S. Hino, K. Kikuchi, Y. Achiba, Synth. Met. 70 (1995)Friedlein, J. Fink, W. Andreoni, A. Curioni, M. Keshavarez- 1337.K, C. Bellavia-Lund, A. Sastre, J.C. Hummelen, F. Wudl, [150] S. Hino, H. Takahashi, K. Iwasaki, T. Miyazaki, K.Phys. Rev. Lett. 78 (1997) 4249. Kikuchi, Y. Achiba, Chem. Phys. Lett. 230 (1994) 165.
¨[134] S. Haffner, T. Pichler, M. Knupfer, B. Umlauf, R. Friedlein, [151] T.R. Cummins, M. Burk, M. Schmidt, J.F. Armbruster, D.M.S. Golden, J. Fink, M. Keshavarez-K, C. Bellavia-Lund, Fuchs, P. Adelmann, S. Schuppler, R.H. Michel, M.M.A. Sastre, J.C. Hummelen, F. Wudl, Eur. Phys. J. B 1 Kappes, Chem. Phys. Lett. 261 (1996) 228.(1998) 11. [152] J.F. Armbruster, M. Roth, H.A. Romberg, M. Sing, M.
[135] W. Andreoni, A. Curioni, K. Holczer, K. Prassides, M. Schmidt, P. Schweiss, P. Adelmann, M.S. Golden, J. Fink,Keshavarz-K, J.C. Hummelen, F. Wudl, J. Am. Chem. Soc. R.H. Michel, J. Rockenberger, F. Hennrich, M.M. Kappes,118 (1996) 11335. Phys. Rev. B50 (1994) 4933.
¨[136] W. Andreoni, F. Gygi, M. Parrinello, Chem. Phys. Lett. 190 [153] M. Knupfer, O. Knauff, M.S. Golden, J. Fink, M. Burk, D.(1992) 159. Fuchs, S. Schuppler, R.H. Michel, M.N. Kappes, Chem.
[137] T. Pichler, M. Knupfer, R. Friedlein, S. Haffner, B. Umlauf, Phys. Lett. 258 (1996) 513.M.S. Golden, O. Knauff, H.D. Bauer, J. Fink, M. Keshavar- [154] A.J. Stones, D.J. Wales, Chem. Phys. Lett. 128 (1986) 501.
´ezk, C. Bellavia-Lund, A. Sastre, J.-C. Hummelen, F. Wudl, [155] See for example: N. Demoncy, O. Stephan, N. Brun, C.Synth. Met. 86 (1997) 2313. Colliex, A. Loiseau, H. Pascard, Euro. Phys. J. B4 (1998)
[138] T. Pichler, M. Knupfer, M.S. Golden, J. Fink, J. Winter, M. 147.Haluska, H. Kuzmany, M. Keshavarez-K, C. Bellavia- [156] Z. Zhang, C.-C. Chen, S.P. Kelty, H. Dai, C.M. Lieber,Lund, A. Sastre, J.-C. Hummelen, F. Wudl, Appl. Phys. 64 Nature 353 (1991) 33.(1997) 301. [157] J.K. Gimzewski, S. Modesti, C. Gerber, R.R. Schlittler,
[139] J.H. Weaver, Y. Chai, G.H. Kroll, C. Lin, T.R. Ohno, R.E. Chem. Phys. Lett. 213 (1992) 401.Hauffler, T. Guo, J.M. Alford, J. Conceicao, L.P.F. [158] Y. Kuk, D.K. Kim, Y.D. Suh, K.H. Park, H.P. Noh, S.J. Oh,Chibante, A. Jain, G. Palmer, R.E. Smalley, Chem. Phys. S.K. Kim, Phys. Rev. Lett. 70 (1993) 1948.Lett. 190 (1992) 460. [159] E.I. Altman, R.J. Colton, Phys. Rev. B48 (1993) 18244.
[140] D.M. Poirier, M. Knupfer, J.H. Weaver, W. Andreoni, K. [160] M.K.-J. Johansson, A.J. Maxwell, S.M. Gray, P.A.¨ ˚Laasonen, M. Parrinello, D.S. Bethune, K. Kikuchi, Y. Bruhwiler, D.C. Mancini, L.S.O. Johansson, N. Martensson,
Achiba, Phys. Rev. B49 (1994) 17403. Phys. Rev. B54 (1996) 13472.
Copyright © 2022 FDOKUMEN