Ultrafast Carrier Dynamics and Recombination in Green Emitting InGaN MQW LED
11
Ultrafast Carrier Dynamics and Recombination in Green Emitting InGaN MQW LED Alexander N. Cartwright 1 , Maurice C-K. Cheung 1 , Fatemeh Shahedipour-Sandvik 2 , J. R. Grandusky 2 , M. Jamil 2 , V. Jindal 2 , Christian Wetzel 3 , Ping Li 4 , Theeradetch Dtechprohm 4 , and Jeffery S. Nelson 4 1 Electrical Engineering, Universisty at Buffalo, The State University of New York, Buffalo, NY, 14260 2 College of Nanoscale Science and Engineering, University at Albany-State University of New York, Albany, NY, 12203 3 Future Chips Constellation, Department of Physics, Rensselaer Polytechnic Institute, Troy, NY, 12180 4 Uniroyal Optoelectronics, 401 Cragmont Drive, Tampa, Florida, 33619 ABSTRACT Ultrafast spectroscopy, in particular time-resolved photoluminescence, can help in the development of InGaN/GaN heterostructures for long wavelength visible emitters. In this paper, we present recent results that underscore the current understanding of two approches to achieve desired emission characteristics and recombination mechanisms in InGaN/GaN MQWs for green LEDs. Specifically, the photoluminescence decay of samples grown using two different design approaches is discussed. In one approach, samples, with high indium incorporation, were grown on a high quality AlN substrate to achieve green emission. The resulting photoluminescence decay of the green luminescence is long-lived and non-exponential. Quantitative analysis showed that the decay is non-exponential and consists of a stretched-exponential decay component, at short times, followed by a power law decay component at longer times. This non-exponential decay, resulting in significant elongation of the radiative lifetime, is indicative of inhomogeneity in the quantum wells. Thus carrier localization, in a structure with low defect density, proves to be an effective means to achieve green emission. In another approach, a piezoelectric Stark-like ladder effect is used. In this case, a methodical layer-by-layer growth homogeneity optimization process was adopted to achieve an optical transition below the electron to heavy-hole (e 1 hh 1 ) transition when the quantum well is subjected to the presence of the strong piezoelectric polarization dipole. An advantage of this approach is that it has proven successful in achieving green luminescence on conventional sapphire substrates. The resulting photoluminescence decay at 14 K of a sample grown by this approach is single exponential and shorter in duration than the decay observed in the first approach. This exponential decay further supports previous AFM studies that revealed a homogeneous active region. INTRODUCTION Nitride materials have demonstrated remarkable versatility as light emitting devices. These materials have become the standard for developing UV and visible LED and laser sources [1]. Obviously, the early technological breakthroughs for low indium content InGaN/GaN heterostructures have resulted in successful commercialization. However, deep UV laser sources and long wavelength (red and green) visible emitters remain as major challenges for nitride
Transcript of Ultrafast Carrier Dynamics and Recombination in Green Emitting InGaN MQW LED

Ultrafast Carrier Dynamics and Recombination in Green Emitting InGaN MQW LED Alexander N. Cartwright1, Maurice C-K. Cheung1, Fatemeh Shahedipour-Sandvik2, J. R. Grandusky2, M. Jamil2, V. Jindal2, Christian Wetzel3, Ping Li4, Theeradetch Dtechprohm4, and Jeffery S. Nelson4 1Electrical Engineering, Universisty at Buffalo, The State University of New York, Buffalo, NY, 14260 2College of Nanoscale Science and Engineering, University at Albany-State University of New York, Albany, NY, 12203 3Future Chips Constellation, Department of Physics, Rensselaer Polytechnic Institute, Troy, NY, 12180 4Uniroyal Optoelectronics, 401 Cragmont Drive, Tampa, Florida, 33619
ABSTRACT
Ultrafast spectroscopy, in particular time-resolved photoluminescence, can help in the development of InGaN/GaN heterostructures for long wavelength visible emitters. In this paper, we present recent results that underscore the current understanding of two approches to achieve desired emission characteristics and recombination mechanisms in InGaN/GaN MQWs for green LEDs. Specifically, the photoluminescence decay of samples grown using two different design approaches is discussed. In one approach, samples, with high indium incorporation, were grown on a high quality AlN substrate to achieve green emission. The resulting photoluminescence decay of the green luminescence is long-lived and non-exponential. Quantitative analysis showed that the decay is non-exponential and consists of a stretched-exponential decay component, at short times, followed by a power law decay component at longer times. This non-exponential decay, resulting in significant elongation of the radiative lifetime, is indicative of inhomogeneity in the quantum wells. Thus carrier localization, in a structure with low defect density, proves to be an effective means to achieve green emission. In another approach, a piezoelectric Stark-like ladder effect is used. In this case, a methodical layer-by-layer growth homogeneity optimization process was adopted to achieve an optical transition below the electron to heavy-hole (e1hh1) transition when the quantum well is subjected to the presence of the strong piezoelectric polarization dipole. An advantage of this approach is that it has proven successful in achieving green luminescence on conventional sapphire substrates. The resulting photoluminescence decay at 14 K of a sample grown by this approach is single exponential and shorter in duration than the decay observed in the first approach. This exponential decay further supports previous AFM studies that revealed a homogeneous active region.
INTRODUCTION
Nitride materials have demonstrated remarkable versatility as light emitting devices. These materials have become the standard for developing UV and visible LED and laser sources [1]. Obviously, the early technological breakthroughs for low indium content InGaN/GaN heterostructures have resulted in successful commercialization. However, deep UV laser sources and long wavelength (red and green) visible emitters remain as major challenges for nitride

materials. Remarkably, the recent unexpected discovery of a narrow band gap energy of InN (~0.7 eV) [2-4] provides new opportunities for the application of InGaN ternary alloy as multi-junction solar cells [5] and invigorates research efforts to achieve visible to infrared emitters from the InGaN system. However, there is still significant fundamental physics underlying the material properties and operation of these devices that must be understood.
The design and fabrication of efficient III-N emitters in the green wavelengths (510 nm ~ 570 nm), where the human eye has the highest sensitivity, is of immediate interest to the research and industrial communities. Although phosphors and filters can be used to provide green emission for solid state lighting, the development of highly efficient, high-power green light emitters could dramatically improved the efficiency of lighting and display systems. LumiLEDs has already demonstrated green emitters with extremely high brightness [6]. However, the successful development of these green InGaN light emitting devices (LEDs) is not without challenges. To date, most researchers have adopted one of two approaches: a) In-segregation and localization to provide low energy (long wavelength) radiative emission sites and b) exploitation of the quantum confined Stark effect to provide low energy radiative emission. In general, a high mole fraction (> 0.2) of In is needed to decrease the bandgap of InGaN sufficiently to achieve emission in the green. This, in turn, results in tremendous strain at the InGaN/GaN interface. This strain can be detrimental, especially for multiple quantum well (MQW) devices, if it results in the propagation or initiation of non-radiative recombination sites. In addition, In-segregation effects such as compositional fluctuation and phase-separation become more prominent as the InN mole fraction increases [7]. Although studies have shown that segregation effects can be beneficial to the efficiency of InGaN UV and blue emitters [1, 8-11], additional research is still needed to mature this effect for green emitters. Alternatively, one can exploit the polarization-induced electric field that can exist within the barriers and well of InGaN/GaN MQW device.[12] As a result, the emission of these devices are red shifted due the quantum confined Stark Effect (QCSE) or other polarization related mechanism.[13-19] Therefore, the piezoelectric polarization can be designed within the InGaN/GaN device so that green luminescence is achievable.[20-22]
In this paper, we report and discuss results of time-resolved photoluminescence studies of a InGaN MQW samples designed for green solid-state light emitting devices. Among the devices that we have studied, two different approaches, mentioned earlier, have been used as shown in Figure 1. In the first approach (Figure 1a), the device was grown on a high quality bulk AlN substrate as opposed to the commonly used sapphire substrate [23]. The bulk AlN substrate offers low dislocation density in the range of 100 cm-2 and freedom in the choice of crystallographic direction (c-, a- and m-planes). Moreover, the high indium content InGaN required for emission in the deep green-yellow wavelength region is achieved through strain dependant growth. The interfacial strain helps in the formation of 3D structures such as QDs through the Stranski-Krostanov growth mode. In this approach, an active region of QDs localizes the carriers and prevents lateral diffusion of carriers to defects.

High Indium concentration sample grown on AlN
eFLw
e1hh1
eFLw
TransitionEnergy
Electric Field
F = 0 F ! 105 V/cm F ! 106 V/cm
Stark-likeLadder
QCSE
EL / PL
eFLw
e1hh1
eFLw
TransitionEnergy
Electric Field
F = 0 F ! 105 V/cm F ! 106 V/cm
Stark-likeLadder
QCSE
EL / PL
x, y
h" (green)
Ec
Ev
QD like
x, y
h" (green)
Ec
Ev
QD like
Stark-like Ladder from piezoelectric field
a) b)
Figure 1. The two approaches in generating green emission from InGaN MQW devices.
In the second approach (Figure 1b), a piezoelectric Stark-like ladder effect was exploited for
the design of a green emitter [21]. In this case, in direct contrast to the previous case where inhomegeneity was desirable, an advanced layer-by-layer optimization of growth homogeneity was used. The resulting layer-by-layer homogeneity elucidates a discrete level in the joint density of states that is below the electron to heavy-hole (e1hh1) transition when the quantum well is subject to the presence of the strong polarization dipole [17, 18]. The photoluminescence (PL) emission from this level was found to follow the e1hh1 transition by an energetic red shift equivalent to the polarization dipole FeLw, where F is the piezoelectric field, e is the electron charge, and Lw is the quantum well width [17].
In the following experimental section, we present results from samples grown using the two approaches discussed above. It is important to note that we do not provide a direct comparison of the efficiencies of these samples grown using the two approaches but rather compare the carrier dynamics within the grown structures.
EXPRIMENTAL DETAILS
Approach 1: InGaN MQW samples on AlN for exploitation of In segregation
A turbodisc Veeco D180 MOCVD system was used to grow MQW structures on a AlN (0001) substrate. The AlN bulk crystal was provided by Crystal IS Inc. Trimethygallium (TMGa), triethygallium (TEGa), trimethyindium (TMIn) and NH3 were used as precursors. Nitrogen was used as the carrier gas. Prior to growth on the bulk AlN substrate, the substrate was annealed at 1100oC for 5 minutes under H2 followed by 10 minutes under H2-NH3 mixture. A thin strained layer of GaN (~ 2nm) was grown on the AlN followed by four layers of the InGaN well and GaN barrier layers at 750oC. The average indium content is expected to be higher than 50% and the average thicknesses of the well and barrier layers were around 3 and 12 nm, respectively. For the growth of a reference green MQW on a sapphire substrate, a 3 µm thick n-GaN layer was grown on the sapphire substrate followed by an active region identical to that grown on the bulk AlN substrate.

Approach 2: InGaN MQW samples on Sapphire for exploitation of piezoelectric effects
The growth of the layer-by-layer optimized sample on sapphire was achieved using metal organic vapor phase epitaxy (MOVPE) in an Emcore D-180 Spectra GaN rotating disk multiwafer system. The MQW structure consisted of five QWs with nominal well width Lw = 3 nm, separated by barriers with nominal thickness Lb = 11 nm. In the final form, the MQW structure would be embedded in a p-n junction on a (0001) sapphire substrate to form an LED structure. However, to examine the time-resolved photoluminescence (TRPL) properties of the MQW without the influence of the carrier transfer and electric field formed by the p-i-n structure, the growth of these samples was terminated before the final deposition of the p layer. Moreover, a reference sample with the same, Lb, Lw and total number of wells was grown as well. In this case, growth parameters such as temperature, pressure, V/III ratio, and variation of carrier gas flow were adjusted and optimized by a straightforward extension of the optimal design of an existing high performance blue (470 nm) LED. For convenience in later discussions, we have used the label “MQW A” for the reference device and “MQW B” for the device grown by the layer-by-layer optimization.
Time-resolved photoluminescence
In all experiments report here, a femtosecond pulsed laser was used as the excitation source for the TRPL experiments. The laser pulses were generated by a regenerative amplifier (Coherent: RegA) seeded by a mode locked Ti:Sapphire (Coherent: Mira) laser. The laser runs at a repetition rate of 250 kHz with a pulse width of 200 fs. The wavelength of the laser was tuned to 800 nm. The 800 nm pulses were frequency doubled using a BBO crystal to provide an excitation source at 400 nm to effectively excite the active region of the InGaN visible emitters. The resulting back-scattered PL emission from the sample was collected and spectrally dispersed using a Chromex 250IS monochromator. The spectrally resolved light from the monochromator was temporally dispersed using a Hamamatsu C4334 streak camera with a typical temporal jitter of 20 ps. The resulting streak image provides spectral (~1 nm resolution) and temporal (~ 20 ps resolution) information of the emission. A 15K cryostat equipped with optical windows was used for the temperature dependent measurements.
THEORY
Using the temporal resolving power of our streak camera, we can analyze the decay of the PL qualitatively and quantitatively to determine certain aspects of the carrier dynamics. Single exponential decay is the simplest type of decay to analyze and explain. A single-exponential PL decay of emission from a semiconductor usually implies a simple carrier recombination process which is usually the case when the material is of a high quality and homogeneity. However, because of the inhomogeneity caused by the immiscibility of indium in InGaN alloy [24], the carrier dynamics in InGaN devices is often much more complicated, and the PL decay is non-exponential.
For these more complicated decay mechanisms, it is necessary to discuss two models that have been used throughout the literature. Specifically, stretched exponential decay and power

law decay are associated with two well-known carrier dynamics models that are used to describe complicated decay mechanisms. For example, a stretched exponential function has been very successfully in fitting PL decay of porous silicon and InGaN [25-29], and is define by
I(t) = I(0)exp # t $( )%[ ], (1)
where % is called the stretched exponential parameter and 0 < % & 1. Note that when % = 1, it becomes a simple exponential decay. In the PL decay of InGaN, it has been argued that the observed stretched exponential decay is a result of carrier hopping caused by the disorder from indium segregation, and the smaller the value of % the larger the degree of disorder. By using Equation 1 and plotting ln I(0) I (t)[ ] on a log-log plot as a function of t, % and $ can be directly determined. The other type of non-exponential PL decay, the power-law decay has been extensively studied in amorphous and porous silicon [30-33], and it is characterized by I(t) ~ t-p. On a log-log plot of I(t) as a function of t, a power law decay results in a straight line. It has be shown by simulation that the stretched exponential decay is due to hopping of excitons [31, 33], while the power law decay is the result of hopping of uncorrelated electron-hole pairs [33]. Understanding the underlying mechanism of these decay models will be helpful in the TRPL data analysis of the samples.
DISCUSSION
Green emitters grown on AlN
TRPL was performed with the pump excitation set to 400 nm with an energy density of ~ 0.1 mJ/cm2 per pulse. Figure 2 shows typical time slices of the TRPL at 14 K and at 300 K (room temperature). In the top section of Figure 2, each curve represents the PL signal for each 40 ns interval from t = 0 ns to t = 400 ns at 14 K. In the bottom section of Figure 2, each curve represents the PL for each 20 ns interval from t = 0 to t = 40 ns at 300 K. At 14 K, the PL peaked at 530 nm (~ 2.3 eV), and this peak redshifts by about 20 nm (~ 90 meV) in 400 ns. A similar shift was not observable at room temperature (RT). This low temperature red shift could be the result of relaxation from band filling, or relaxation from field screening in the QW’s, or a combination of both.

Figure 2. Time slices of the TRPL at 14 K (top) and 300 K (bottom) for the sample grown on an AlN buffer. The spectral curve of maximum PL intensity is mark “0 ns”. In (a), each curve represents the PL for each 40 ns interval since maximum PL; while in (b), each curve represents the PL from each 20 ns interval.
Figure 3 shows a semi-log plot of the normalized PL decay at 14 K and RT. From this semi-
log plot, it is clear that the PL decay is non-exponential at both temperatures. Moreover, the decay is significantly more rapid at room termperature than at low temperature. This rapid decay at room temperature is generally indicative of the fact that non-radiative recombination is likely to dominate over radiative recombination at room temperaterature [34]. The non-exponential PL decay can be attributed to localized carrier hopping. Specifically, localization resulting from the indium compositional fluctuation that in the extreme case, can lead to segregation islands of In-rich dots. More importantly, a log-log plot of Ln[I(0) / I(t)] as a function of time (Figure 4a) shows that at 14 K the decay fits well with the stretched exponential function between 20 ns and 120 ns after the pulse excitation. In Figure 4a, the dashed line on the plot represents equation 1 with $ = 44 ns and % = 0.65. In addition, at room temperature, the decay also exhibits a stretched exponential behavior between 10 ns and 40 ns, with $ = 5 ns and % = 0.62. Furthermore, A log-log plot of the normalized PL versus time follows a power law dependence for times longer than 200 ns after pulse excitation (see Figure 4(b)) with p = -1.7 at 14 K. In contrast, at room temperature the decay follows a power law dependence beginning at much shorter times.
To understand this, we use the simulation results that was discussed earlier. Initially, immediately after pulsed excitation, electrons and holes are bound together by their Coulomb interaction (excitons). While these bound carriers decay, a stretched exponential decay is observed. After the excitons have dissipated, the remaining uncorrelated carriers will continue to

recombine or hop, resulting in the final power law decay. Moreover, the thermal dissipation of excitons resulting from increasing temperature would reduce the duration of the stretched exponential decay, while hastening the onset of the power law decay, as we have observed when comparing the decay at 14 K and room temperature. Thus, in these samples, the optical properties are consistent with a carrier-hopping model through localized high indium content regions.
Figure 3. PL decay of the sample grown on AlN at 14 K and room temperature (300 K).
Figure 4. (a) Log-log plot of Ln[I(0)/I(t)] versus time for the sample grown on AlN showing the time period over which the decay followed the stretched exponential model (equation 1). (b) Log-log plot of the normalized PL decay versus time showing when the decay follows the power law model. The dashed lines represent the best fittings.

Green emitters grown on sapphire
In our previous work [21], AFM was used to show that a layer-by-layer optimization process yields a device with superior smoothness and significantly reduced defect densities over a straightforward extension of the growth optimization of blue LED. Here, we provide time-resolved photoluminescence measurements of the emission from two samples: i) “MQW A” which was grown following a straightforward optimization of the growth techniques used for blue emitters and ii) “MQW B” which used a layer-by-layer optimization technique described earlier [21]. The improvement resulting from layer-by-layer optimization is reflected in the time-resolved PL spectra that are shown in Figure 5. One obvious difference between the two spectra is the broadness of the emission. MQW A has a broad emission with two features, the major peak was in the green region centered at 540 nm (labeled A2), then there was a shoulder in the deep blue region near 420 nm (labeled A1). Assuming the two features are Gaussian in nature, we estimated the full width half maximum (FWHM) of the feature A1 to be about 33 nm, while the FWHM is ~ 80 nm for A2. In contrast, the single green peak of MQW B (labeled B) clearly exhibits a narrower emission, with its FWHM = 33 nm, with no evidence of a second peak. The two features of the PL in MQW A could be the result of phase separation or similar phenomenon, with A2 emanating from the localized indium rich regions, while A1 emanates from a more homogenous region with less indium incorporation.
Aside from the difference in the broadness of the emission, there is a marked difference in the PL intensity between the two MQW structures. Under similar power density of pulsed excitation (~ 1.5 mJ/cm2), the peak intensity of B was almost 20 times greater than that of A2. The comparison of the FWHM and intensity directly support the argument that the layer-by-layer optimization yields a much higher quality material.
Figure 5. Normalized PL spectrum showing a broad emission of MQW A with features centered at 430nm (A1) and 550nm (A2), in contrast MQW B has a much finer PL peaked at 490 nm (B).
In the TRPL experiment, this difference in the material quality is reflected in the observed
decay dynamics. The PL decay curves at 14 K and room temperature are shown in the semi-log plots in Figure 6. One of the major differences between the PL decay of the two samples is the shape of the decay. For MQW A, the PL decay of feature A1, as well as the decay of the

dominant green peak A2, are non-exponential. On the other hand, the PL peak B has a single exponential decay at 14 K, and a bi-exponential decay at room temperature.
In terms of the rate of decay, A1 has the most rapid decay. For the measurement at 14K, the intensity of feature A1 diminished by one decade in 200 ps. On the other hand, the broad green peak, A2, took more than 2 µs to decrease by one decade. This difference in the rate of decay of two features is consistent with a channel for carriers to transfer from the higher energy (band edge) states associated with feature A1 to the lower energy (localized) states associated with peak A2. With this extra means for carrier relaxation, the PL decay time of A1 should be shorter than the PL decay time of A2. In contrast, MQW B (the layer-by-layer optimized sample) exhibits a PL decay time of 2.4 ns (as estimated for 14 K), while the decay times of the two components of sample MQW A at room temperature are 0.62 ns and 1.1 ns, which is consistent with its sample quality and homogeneity.
For A1, we fitted the PL decay at 14 K with the stretched exponential function (Equation 1) using $ = 7 ps and % = 0.42, but at room temperature it’s decay was too rapid for a meaningful fitting. To quantitatively measure the decay of peak A2, we have to take into account carrier accumulation since the pump pulses arrive at the sample every 4 µs. A simple way to simulate this accumulation is to take the sum of a series of equation 1 defined by
I(t) = I(0) exp # t # nT$
' ( )
* + ,
%-
. /
0
12
n=1
3
4 , (2)
where T is the is period of the pump pulse. In our fitting, we found that Equation 2 does converge, and the sum of the first 100 terms is sufficient to get a reasonable estimate. Using this estimate, we calculated that $ = 110 ns with % = 0.37 at 14 K, and $ = 350 ns with % = 0.53 at room temperature.
Figure 6. PL decay of the peaks A1 (left), A2 (middle) and B (right) at 14 K and room temperature, the fitted stretched exponential decay for peaks A1 and A2 are represented by the smoothed solid curves, while the exponential decays of peak B is represented by the straight lines.
CONCLUSIONS
In summary, we have studied the TRPL of InGaN/GaN MQWs grown by different approches to achieve green emission. On the one hand, high indium mole fraction was used to reduce the bandgap for green emission, and on other hand, a piezoelectric Stark-like ladder effect was used. To achieve highly efficient green emission by strong indium incorporation, a high quality AlN substrate was used [23]. Not only do the high quality substrate reduce defects, but the
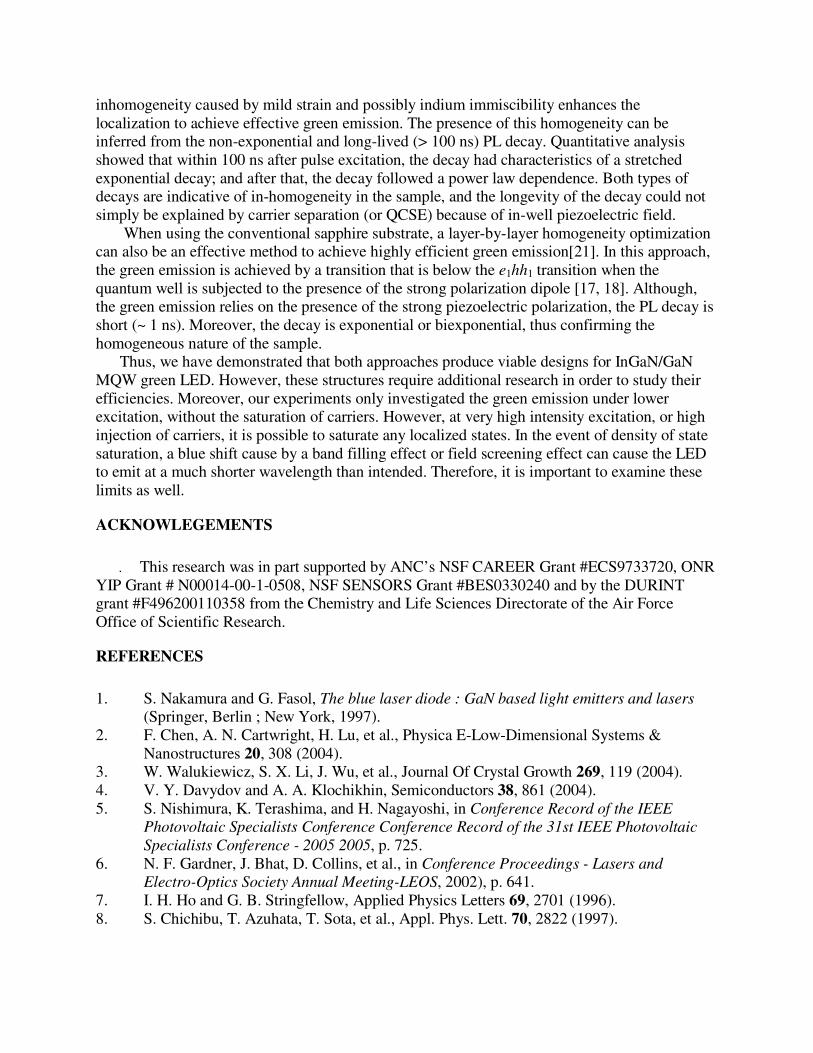
inhomogeneity caused by mild strain and possibly indium immiscibility enhances the localization to achieve effective green emission. The presence of this homogeneity can be inferred from the non-exponential and long-lived (> 100 ns) PL decay. Quantitative analysis showed that within 100 ns after pulse excitation, the decay had characteristics of a stretched exponential decay; and after that, the decay followed a power law dependence. Both types of decays are indicative of in-homogeneity in the sample, and the longevity of the decay could not simply be explained by carrier separation (or QCSE) because of in-well piezoelectric field.
When using the conventional sapphire substrate, a layer-by-layer homogeneity optimization can also be an effective method to achieve highly efficient green emission[21]. In this approach, the green emission is achieved by a transition that is below the e1hh1 transition when the quantum well is subjected to the presence of the strong polarization dipole [17, 18]. Although, the green emission relies on the presence of the strong piezoelectric polarization, the PL decay is short (~ 1 ns). Moreover, the decay is exponential or biexponential, thus confirming the homogeneous nature of the sample.
Thus, we have demonstrated that both approaches produce viable designs for InGaN/GaN MQW green LED. However, these structures require additional research in order to study their efficiencies. Moreover, our experiments only investigated the green emission under lower excitation, without the saturation of carriers. However, at very high intensity excitation, or high injection of carriers, it is possible to saturate any localized states. In the event of density of state saturation, a blue shift cause by a band filling effect or field screening effect can cause the LED to emit at a much shorter wavelength than intended. Therefore, it is important to examine these limits as well.
ACKNOWLEGEMENTS
This research was in part supported by ANC’s NSF CAREER Grant #ECS9733720, ONR YIP Grant # N00014-00-1-0508, NSF SENSORS Grant #BES0330240 and by the DURINT grant #F496200110358 from the Chemistry and Life Sciences Directorate of the Air Force Office of Scientific Research.
REFERENCES
1. S. Nakamura and G. Fasol, The blue laser diode : GaN based light emitters and lasers (Springer, Berlin ; New York, 1997).
2. F. Chen, A. N. Cartwright, H. Lu, et al., Physica E-Low-Dimensional Systems & Nanostructures 20, 308 (2004).
3. W. Walukiewicz, S. X. Li, J. Wu, et al., Journal Of Crystal Growth 269, 119 (2004). 4. V. Y. Davydov and A. A. Klochikhin, Semiconductors 38, 861 (2004). 5. S. Nishimura, K. Terashima, and H. Nagayoshi, in Conference Record of the IEEE
Photovoltaic Specialists Conference Conference Record of the 31st IEEE Photovoltaic Specialists Conference - 2005 2005, p. 725.
6. N. F. Gardner, J. Bhat, D. Collins, et al., in Conference Proceedings - Lasers and Electro-Optics Society Annual Meeting-LEOS, 2002), p. 641.
7. I. H. Ho and G. B. Stringfellow, Applied Physics Letters 69, 2701 (1996). 8. S. Chichibu, T. Azuhata, T. Sota, et al., Appl. Phys. Lett. 70, 2822 (1997).

9. F. Chen, P. M. Sweeney, J. S. Flynn, et al., in GaN and Related Alloys (Materials Research Society Symposium - Proceedings. v 693 2002., Boston, MA, United States, 2001), p. p. 377.
10. T. Mukai, S. Nagahama, N. Iwasa, et al., J Phys-Condens Mat 13, 7089 (2001). 11. Y. S. Lin, K. J. Ma, C. C. Yang, et al., J. Cryst. Growth 242, 35 (2002). 12. O. Ambacher, J. Majewski, C. Miskys, et al., J Phys-Condens Mat 14, 3399 (2002). 13. T. Tekeuchi, S. Sota, M. Katsuragawa, et al., Jpn. J. Appl. Phys. 36, L382 (1997). 14. T. Takeuchi, C. Wetzel, S. Yamaguchi, et al., Appl Phys Lett 73, 1691 (1998). 15. L. H. Peng, C. W. Chuang, and L. H. Lou, Appl. Phys. Lett. 74, 795 (1999). 16. C. Wetzel, T. Takeuchi, H. Amano, et al., J Appl Phys 85, 3786 (1999). 17. C. Wetzel, T. Takeuchi, H. Amano, et al., Jpn J Appl Phys 2 38, L163 (1999). 18. C. Wetzel, T. Takeuchi, H. Amano, et al., Phys Rev B 62, R13302 (2000). 19. F. Chen, M. C. Cheung, P. M. Sweeney, et al., J. Appl. Phys. 93, 4933 (2003). 20. T. D. P. L. J. S. N. Christian Wetzel, physica status solidi (c) 1, 2421 (2004). 21. C. Wetzel, T. Salagaj, T. Detchprohm, et al., Appl Phys Lett 85, 866 (2004). 22. P. L. T. D. J. S. N. C. Wetzel, physica status solidi (c) 2, 2871 (2005). 23. F. Shahedipour-Sandvik, J. R. Grandusky, M. Jamil, et al., in Proceedings of SPIE - The
International Society for Optical Engineering Fifth International Conference on Solid State Lighting (SPIE, 2005), Vol. 5941, p. 37.
24. I. h. Ho and G. B. Stringfellow, in Appl. Phys. Lett., 1996). 25. M. Cheung, G. Namkoong, M. Furis, et al., in Gan and Related Alloys (Materials
Research Society Symposium - Proceedings. v 743 2002., Boston, MA, United States, 2002), p. 659.
26. M. Pophristic, F. H. Long, C. Tran, et al., J. Appl. Phys. 86, 1114 (1999). 27. S. F. Chichibu, T. Onuma, T. Aoyama, et al., Journal of Vacuum Science & Technology
B 21, 1856 (2003). 28. M. Pophristic, F. H. Long, C. Tran, et al., MRS Internet J N S R 5, art. no. (2000). 29. L. Pavesi, J. Appl. Phys. 80, 216 (1996). 30. K. Murayama, K. Ohno, Y. Ando, et al., Physica Status Solidi B-Basic Research 230, 221
(2002). 31. Y. Ando, A. Sasaki, M. Shingai, et al., Physica Status Solidi B-Basic Research 230, 15
(2002). 32. D. Nesheva, Z. Levi, Z. Aneva, et al., Journal of Nanoscience and Nanotechnology 2, 645
(2002). 33. H. E. Roman and L. Pavesi, Journal of Physics-Condensed Matter 8, 5161 (1996). 34. Y. Kawakami, K. Omae, A. Kaneta, et al., J Phys-Condens Mat 13, 6993 (2001).