U1 GOR - DTIC
83
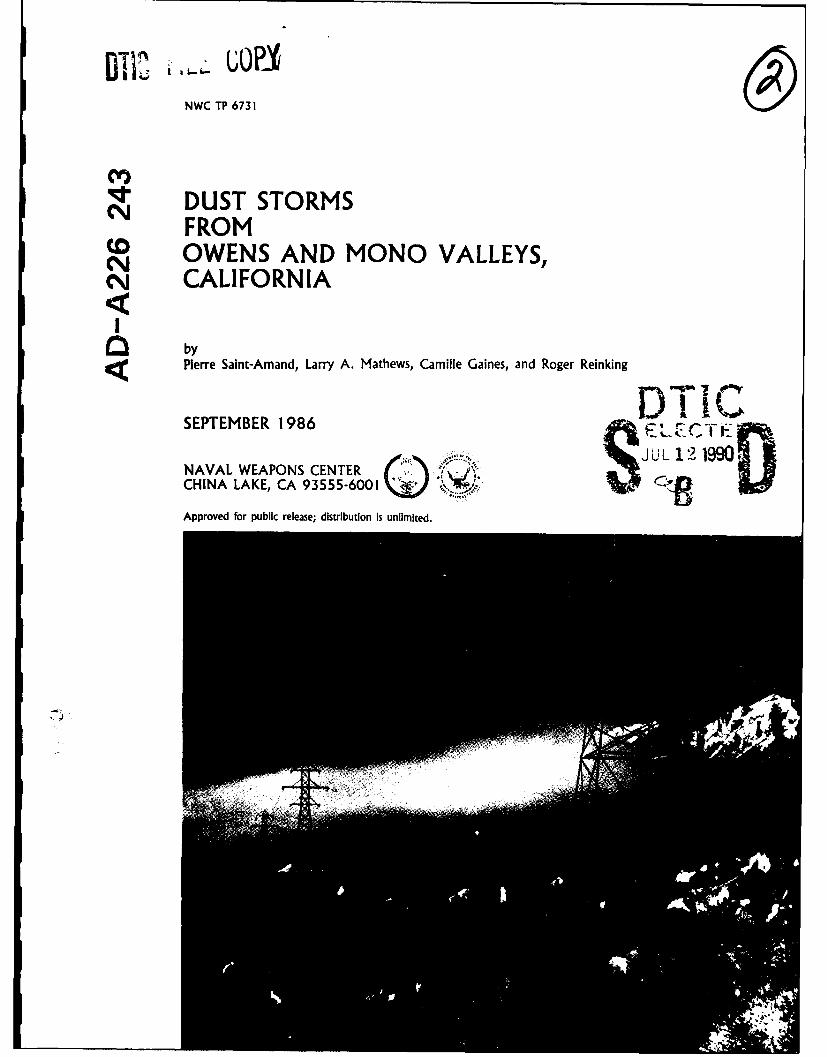
U1 GOR NWC TP 6731 DUST STORMS N FROM CD OWENS AND MONO VALLEYS, N CALIFORNIA ~I by Pierre Saint-Amand, Larry A. Mathews, Camille Gaines, and Roger Reinking SEPTEMBER 1986 DTI J UL 12 1990 NAVAL WEAPONS CENTER 00 CHINA LAKE, CA 93555-6001 Approved for public release; distribution Is unlimited.
-
Upload
khangminh22 -
Category
Documents
-
view
4 -
download
0
Transcript of U1 GOR - DTIC
U1 GORNWC TP 6731
DUST STORMSN FROMCD OWENS AND MONO VALLEYS,N CALIFORNIA
~I byPierre Saint-Amand, Larry A. Mathews, Camille Gaines, and Roger Reinking
SEPTEMBER 1986 DTIJ UL 12 1990
NAVAL WEAPONS CENTER 00CHINA LAKE, CA 93555-6001
Approved for public release; distribution Is unlimited.

Naval Weapons Center
FOREWORD
This report discusses the periodic dust storms that arise from the surface of Owens Lake, adry lake located in the Owens Valley some 50 miles north of the Naval Weapons Center, andfrom the area around Mono Lake, 100 miles north of Owens Lake. The report considers thecauses of the dust storms and suggests some treatments to alleviate the problem.
The work upon which this report is based was begun in 1975 and completed in 1986. It ishoped that the material contained herein will prove helpful riot only to those whose interest liesin controlling the dust storms from Owens and Mono Lakes, but also to researchers in otherparts of the world who are faced with the problem of putting marginal land to productive use,
This report has been reviewed for technical accuracy by Dr. R. L. Hoffmann.
Approved and released for publication by Under authority ofG. R. SCHIEFER J. A. BURTTechnical Director Capt., USN30 August 1986 Commander
NWC Technical Publication 6731
Published by ...................................... Technical Information DepartmentC ollation ........................................................ C over, 41 leavesFirst printing, September 1986 ........................................... 510 copiesSecond printing, February 1989 ........................................... 75 copies

UNCLASSIFIEDSECURITY CLASSIFICATION OF THIS PAGE
REPORT DOCUMENTATION PAGEla. REPORT SECURITY CLASSIFICATION lb RESTRICTIVE MARKINGS
UNCLASSIFIED2a SECURITY CLASSIFICATION AUTHORITY 3 DISTRIBUTION/AVAILABILITY OF REPORT
2b DECLASSIFICATION/ DOWNGRADING SCHEDULE Approved for public release: distribution is unlimited.
4 PERFORMING ORGANIZATION REPORT NUMBER(S) 5 MONITORING ORGANIZATION REPORT NUMBER(S)
NWC TP 6731
6a. NAME OF PERFORMING ORGANIZATION 6b OFFICE SYMBOL 7a NAME OF MONITORING ORGANIZATION
Naval Weapons Center (If applicable)
6c ADDRESS (City, State, and ZIP Code) 7b ADDRESS (City, State, and ZIP Code)
China Lake, CA 93555-6001
Ba. NAME OF FUNDING/ SPONSORING 8b OFFICE SYMBOL 9 PROCUREMENT INSTRUMENT IDENTIFICATION NUMBER
ORGANIZATION (if applicable)
Naval Weapons Center
Bc. ADDRESS (City, State, and ZIP Code) 10 SOURCE OF FUNDING NUMBERS
PROGRAM PROJECT TASK WORK JN'T
China Lake, CA 93555-6001 ELEMENT NO NO NO NO
11 TITLE (Include Security Classification)
DUST STORMS FROM OWENS AND MONO VALLEYS, CALIFORNIA
12 PERSONAL AUTHOR(S)Saint-Amand, P.; Mathews, L. A.; Gaines, C.; and Reinking, R.
13a. TYPE OF REPORT 13b TIME COVERED 14 DATE OF REPORT (Year, Month, Day) 115 PAGE COUNT
Summary _ FROM 1975 TO 1986 September 1986I 79
16 SUPPLEMENTARY NOTATION
17 COSATI CODES 18 SUBJECT TERMS (Continue on reverse if necessary and identify by block number)
FIELD GROUP SUB-GROUP Owens Valley PlayasMono Valley DesertsDust Storms
19 ABSTRACT (Continue on reverse if necessary and identify by block number)
(U)This report discusses the dust storms that periodically rise from playas at Owens and Mono Lakes
in California, the causes and effects of these storms, and some treatments to alleviate the problem. ," ,
20 DISTRIBUTION/ AVAILABILITY OF ABSTRACT 21 ABSTRACT SECURITY CLASSIFICATION
0 UNCLASSIFIED/UNLIMITED 0 SAME AS RPT [J)TIC USERS Unclassified
22a NAME OF RESPONSIBLE INDIVIDUAL 22b TELEPHONE (Include Area Code) 22c OFFICE SYMBOL
P. Saint-Amand 619-939-3104 Code 013
DO FORM 1473, 84 MAR 83 APR edition may be used until exhausted SECURITY CLASSIFICATION OF THIS PAGEAll other editions are obsolete UNCLASSIFIED

UNCLASSIFIED
SECURITY CLASSIFICATION OF THIS PAGE
UNCLASSIFIED
U CI RIY C ASI IC ONOFTH IS PAG E

NWC TP 6731
CONTENTS
Executive Summary............................................................ 3
Introduction.................................................................. 3
Background................................................................... 6Geography................................................................ 6Geology.................................................................. 6Pleistocene Lakes .......................................................... 8Shorelines..................... ........................................... 8Lacustrian Clays .......................................................... 10Rainfall ................................................................. 11
Dessication of Owens Lake...................... ........... .................... 14Advent of Agriculture .............................................. ....... 14Export of Water........................................................... 14Changes in Lake Level..................................................... 15Historical Ecology of Owens Lake....................................... I..... 17Salinity .............................................. ................... 17
Dessication of Mono Lake....................................................... 17Lake Adobe .............................................................. 18Export of Water From Mono Lake ........................................... 19Exposed Lake Surface .............................................. I....... 19
Descriptions of Owens Lake Dust Storms......................... ................. 21Seasonal Occurrance....................................................... 21Methods of Observation..................................................... 21Characteristics of Major Storms .............................................. 22Dust Loading............................................................. 26Particle Size and Concentration Measurements.................................. 26Mass of Material Involved in a Storm ......................................... 29Chemical Composition of the Dust ........................................... 31
Effects of the Dust ............................................................ 32
Provenance of the Dust......................................................... 33
Meteorology ......................................................... ...... 3,5
Conditions of the Playa Surface.......... ................... .................... 38Lake Water ....................................... .............. ........ 38H ydrobiology .. . . . . . . . . . . . . . . . . . . . . . . . . . . . . . .40L akebeds .. . . . . . . . . . . . . . . . . . . . . . . . . . . . . . . . . .40
1

NWC TP 6731
C hem istry of the C rust ............................................................ 46Volum e Change Upon Hydration ................................................ 55D ust From O ther Playas ....................................................... 56
Treatment to Alleviate the Dust Problem ............................. .......... ... 57
Suggestions for Further W ork ....................................................... 62
C om m ents on D eserts .............................................................. 64
A cknow ledgem ents ................................................................ 67
R eferen ces . .. .. .. ... . ... .. ... .. .. .. ... . ... ... . ... . ... .. .. .. .. ... .. .. ... .. .. ... .. . 69
G lo ssa ry . . . . . . . . . . . . . . . . . . . . . . . . . . . . . . . . . . . . . . . . . . . . . . . . . . . .. . . . . . . . . . . . . . . . . . . . .7 6
Accession For
NTIS GRA&I M~DTIC TAB 7Unat:ounced 0JujtIfIcation
By_
Di stribution/ . .
AvallaibilJitY Codes @Aail and/or
2

NWC TP 6731
EXECUTIVE SUMMARY
Climatic change, local consumptive use of wate-, and export of surface and ground waterare dessicating Owens Valley. Dust storms originate from dry portions of the saline playa ofOwens Lake and to a lesser extent from the surrounding shores and from the valley floor. Thedust storms usually occur in late fall, winter, and early spring. The dust storms are worsefollowing winter rains, snow, or in years in which water has been added to the usually drylake. As many as 10 major dust storms per year are caused by northerly winds aligned with theaxis of the valley, usually at passage of a low pressure trough. Dust from these storms has beenobserved on satellite photographs for at least 250 kilometers south of Owens Lake and coveringareas of over 90,000 square kilometers. More frequent, but often less severe, storms occurwhenever the winds blow in any direction.
Visibility during such storms is often reduced to 1 kilometer or less. Atmospheric loadinghas exceeded 1.5 metric tons per square kilometer, and particulate concentrations have reached2,600 micrograms per cubic meter of air 100 kilometers to the south of Owens Lake. Theparticles are much smaller than those of most desert dust and sand storms. Over 90% of theparticles are less than 0.1 micron in diameter. They consist of alkali chlorides, carbonates, andsulfates as well as silts and clays. The small size of the particles makes retention by the lungs ahealth hazard.
The fine dust suspended in the storms arises from a solanchak developed on the surface ofthe playa by the growth of alkali crystals that disrupt the clays and silts. The growth of thecrystals is caused by upward capillary and osmotic transport of dissolved solids from thegroundwater table. During hot weather, a hard crust develops. In cool weather, the carbonateand sulfate salts gain water of hydration and expand. Subsequently they lose water of hydra-tion, decrease in volume, and become anhydrous, amorphous masses of finely divided light andfluffy powder leaving the dissaggregated clays and the alkali free to be blown by the wind.
There are many potential approaches to the problem of dust blowing from Owens andMono Valleys. These range from a complete hands-off approach to the installation of a systemof polders combined with water-table lowering. Certain of these treatments may haveapplication in desert playas both in this country and in other parts of the world.
INTRODUCTION
Dust from the bed of Owens Lake and from the floor of Owens Valley is often picked upby winds in excess of 15 knots, regardless of wind direction. Small dust storms are common.Gigantic dust storms, created when a north wind blows, carry dust southward for hundreds ofkilometers. These storms interfere with air and ground transport, curtail operations at theNaval Weapons Center and Edwards Air Force Base, and disrupt activities in the nearby desertcommunities. Dust from such storms, when scavenged by rain, has fallen in Orange County.The storms are worse in years when there has been rain, snow, or flooding of the dry lakesurface. A condition similar to that in Owens Valley is developing at Mono Lake. Figures 1and 2 show the locations. A previous paper (Reinking et al. 1975) called attention to thesituation. This document explores the causes and suggests ameliorative measures.

NWC TP 6731
PAONO LAKF
NIONO CRATCHS
MONO VALLEY
P, VALLEY
MONOCO ADOBE VALLEY
CHALFANT VALLE
SIERRA BISHOPNEVADA
OWE NS RIVER
POVERTY HILLS
TINNEMAHA RESERVOIR
WAUCOBA ENIBAYMENT
WHITE INY(.)%IOUNTAINS
ALABANIA HILLS
0 E S LONE PINE
OWENS LAKE
CREST OF ROSE VALLEYSIERRA
PANAMINT VALLEY
NAVAL WEAPONS CENTER
IN OKERN
INDIAN WELLS ALLF
CHINA LAKE RIDGECREST
TRONA
tARLES VALLEY
SAN INYOCO DOUBL
JOAQUIN %l(lUNTAl%
TEHAL;HAPI E Y KERN COMOUNTAINS
E nWfAR DS
AIR F(IRCE
EASE
LANCASTER
SAN 6ABRIEL
PALMDALE VOL
MOJAVE DESEANTELOPE
VALLEYSAN SAN BERNARDINO CO,
FERNANDO
VALLEY
LOS ANG.ELES.* .............
0 RANGE CO --
FIGURE 1. Regional Nlap Sluming Locations Referred to in the Tcxt.
4

N'WC TP 6731
WAUCOBA WHITE MOUNTAINS TINNEMAHA RESERVI
EMBAYMENT IY
BIG PONE
SPRINGS
INDEPSNLINE
OWENSVVALLE
GO~ ATRN
MOUEPNTAN j,- PA
HAEGA .ARCT
RIVGECRES
FASEA ZONES
FLNALAK

NWC TP 6731
BACKGROUND
GEOGRAPHY
Owens Valley (Figure 3) is a north-northwesterly trending trough in eastern California,bounded by the Sierra Nevada on the west and the White-Inyo Mountains on the east. Thelowest point of the valley is at 3,552 feet above mean sea level (MSL) on the surface of theOwens Lake playa, which serves as a sump for the rest of the valley. The valley floor rises to4,120 feet at Bishop, where the trough widens to several tens of kilometers and bifurcates. Tothe north the trough is called Chalfant Valley; to the north-northwest the trough is calledLong Valley.
GEOLOGY
At the end of Pliocene, about three million years ago, Owens Valley was a shallowindentation in an erosion surface of low relief that extended from north of the present site ofBishop, southward to the Mojave Desert block. This protovalley, filled with a lake or lakes,deepened during early Pleistocene as the Sierra Nevada and the Inyo Mountains grew (Walcott1897; Spurr 1903; Reid 1908; Trowbridge 1911; Zbur 1963; Axelrod 1962: Bachman 1974 and1978; and Saint-Amand and Roquemore 1977).
The western side of Owens Valley is festooned with coalesced alluvial fans that reach fromthe rocky slopes of the Sierra to the central portion of the valley (Figure 4). The alluvial coneson the eastern sides are less well developed and mainly confined to the mouths of canyons; thesteep mountain slopes often reach the flat floor of the valley. The valley is filled withfanglomerates that taper to, and interfinger with, a clay plug in the central and easternportions of the valley (Figure 5). The maximum depth of fill, as measured by geophysicaltechniques, is at least 6,000 feet (Pakiser et al. 1964). Pittsburgh Plate Glass Co. drilled a wellto a depth of 6,000 feet, near its plant on the western shore of the lake, without striking eitherbedrock or a salt body. Detailed stratigraphy is available only for one well (Smith and Pratt1957).
T*1w-
r. . ......
FIG;URE :1. Ox un Loake (View Looking EaOt).
6

4lk 4
j~p
i r ,i~ii~i t 1(,i i N, rt N

NWC TP 6731
SIERRA ALABAMA OWENS INYO SALINE
NEVADA HILLS VALLEY MOUNTAINS VALLEY
ALLUVIAL FANS SEDIMENTS OWENS RIVER
INDEPENDENCE FAULTSFAULT OWENS
VALLEY FANS
IGNEOUS ROCK FAULT ZONE PALEOZIC METAMORPHICROCKS IGNEOUS
ROCK
MILEz
-10 . ..
A/T TIA
FIGURE 5. Cross-Sectional View of Sierra Nevada. Owens Valley, and the Invo Mountains at theLatitude of Swansea (After Knopf, 1918).
The valley is tectonically active, as attested by the 1872 earthquake on the Owens ValleyFault. The western side of Owens Lake, then full of water, dropped 1 meter with respect tothe eastern side (Hobbs 1910). The older shorelines are offset by faulting. The 15,000-year-oldTioga shoreline is multiply offset-an aggregate of 1 mile horizontally and 100 feet verticallyon the southeast side of the lake (Figure 6).
PLEISTOCENE LAKES
Owens Valley was intermittently filled with lakes that were part of a chain of lakes thatextended from Mono Lake and Adobe Valley to Death Valley (Gale 1914) (Figure 7). Theselakes received runoff from the Sierra and local catchment basins during the glacial epochs aswell as during some intervening pluvial epochs that did not result in major glaciations.Meltwater from the glaciers and runoff from the mountains carried clays, pyroclastic materials.and other debris into the lakes. At times, the runoff was charged with solids dissolved fromfreshly erupted volcanic rocks in Long Valley and in Owens Valley.
SHORELINES
Prominent shorelines at an elevation of 3,880 feet msl, 328 feet above the present lakesurface, are incised by small gulleys, partially obscured with windblown sand and offset byfaults but otherwise little altered (Figure 8)(see Carver 1967). Fans from the Inyo Mountainshave partially obscured the eastern shorelines. The shorelines may be traced from Swansea onthe eastern side of the lake (Figure 9) into Haiwee Gap, where they are lost in the incompetentbeds of the Coso Formation. On the western side, shorelines reach to the northern end of theAlabama Hills.
8

NWC TP 6731
OFFSETSHORELINE
Thr. hic~r hIoreli ic( arc ISO) lect .ii)4)e thc prtseit 1)111 lt d Ilo -1 (lk I i .t 3.T100It.I )o(M Ieutt iii ( ifI hc (Idi!1da! (hlalilirl nlt I os \ alh I IT l~ )!I\ I hap w I aidttl\
h-( alit ()III\ a l(,\\ indi(jtila(t dwltim(' areI \jsjhh hct. ttII the .; ss(u-hwt m t~ hIel i.,I htelltd to he kite WVtl(enm (TiIIIa) ill aILt (pwhahk\Iat) I 100 X talf aw. and the
()IIIli.!vr "lorclilics. (I(,eltojl(( at tllt tum ir t tis ceiitiir\ ,ait ;.31-9I feel
Thc spillii l (d oth tIn alley is abouit 150t feel aoetill o\ th ,I p-4niit 'il lOw lake het. 'I h-II iiaitl (I r\ itZ i I IIII, I a\c I ia pptIi ra p idlk, heffore a dtI allIT,] ult li m tdh(ct thIT p I it Ithe Ii apit If il\\ee. Pw- b,\j I I, t i lke .-\-I , Wa i I I lti' t-ed It a \ ; I(t( t io - h) m 1 1-1 1 lu r I L

NWC TP 6731
OREp I
IDAHO
00 LAKE,...ONNEVII
LAKELAHONTAN?
ADOBE VALLEY
MONO LAKE iDEATH4.VALLEY
OWENS RIVER UTAH
OWENS LAKE
EV~nAPA NA MINTVALLEY
ROSE VALLEYAND LAKE
o t "SEARE
CHINA LAKE FOREARI Z !AKE
CALF R N'Ik r ARIZONA
FIGURE 7. Map of Pleistocene Lakes and Drainave.
LACUSTRIAN CLAYS
Lacustrian clays are exposed on the valley floor as far north as Bishop, but the 3,880-foot
stand of the lake would hav reached only to the vicinity of Tinemaha Reservoir. The Poverty
Hills are partly covered by tilted mid-Pleistocene lacustrian sediments, dated by Cleveland
(1958) on the basis of diatoms. Bachman (1978) has mapped Mid-Pleistocene lakebeds well
above the valley floor in the Waucoba Embayment.
10

NWC TP 6731
OWENS
FR U( F. RE Clomp \'ttN of ( w~cnN I a kt Shorchnet
RAINFALL.
Tht LO's AlliCelt, 1)eiprtinciit of Wa.tcv ai ' x h (Tv (LI \ ;it 10761i ruprts filat (li
'mitheril part (ot Owtens Valle.N recci\ts ahoot 4 t. 6i inehtCIR ! Oi iii j)Cl \cm~l. adl tilt northerni
parn of the valc\ a little mre (Fi !Inre IM. Priccipit itionl il." tH. "IciaI Crest readics 20judO'is 11(1 %caf. 'Ilit hmtl andi Vhitc M.omiitamrs Ltt !t ttx. tn S andI 12 inlis. Thew
pirecipitation ill the, \ill(,, i,, sporaic. Saint %( ars 11a,11\ passx' ithlt rainl or swm. hutt)c'('dxltilkIV Iarit' tlhiuil 'rst orins canle Hlash ll4 tllIid nt pivdtct debhris Tb. het present'lrairiafze art'a is 2.901) squarc Ile. ih prteipitatiol durinl,- ill, tale', in) wh0101 thet whlolelake xas flll oI water ni ha\,-. !)-,j) '3 to -) t intcs Nhiat it i" .xxunts, titl( (liiiate x' is nunebctooler (smitli and Strect Perrmit iPsl() At it, hil.Jist tinl. (m nx s iake iatitajined af near-
tthlnl irill Ill level loIi4 nlid I' tk d~ltp Ill toiispti I;:.- 'liuitints oii th eastcrni and
souithern sides of itl lakt c, iu pvtlrcsi\ chinativ eha1;11ts t l.lakes tlritt and thec,0x l nh \% fromi olt, \a! 1 If. ill( nwO\ v

NWC TP 6731
OWENS RIVER
1872 FAULTZONE _
SWANSEA
SHORELINES 1
BARTLETTSPOINT
PITTSBURGPLATE__
COMPANY * . -
WESTEC -AT
hr \CARTAGO
A OWENS L A
12A

NWC TP 6731
20
15
10 BISHOP
9 (
8
7
6 , 10
?. 7
6
10 6
LONE F'INE 7
6
5 -~ 571
4 1'~4
6/
CARTAGO U/ OWENS LAKE
OLANCHA s~
FI(;UIll 10, B ilfidl \Liji ) t'i \ illh \uma ber,
ifldiiatc fiwhcl I, rainfall at ul-tlit li iaal.
1:3

NWC TP 6731
DESSICATION OF OWENS LAKE
Although Owens Lake probably dried up in hot, dry, interglacial periods, well cores donot indicate that any extensive salt bodies are buried in the sediments. The latest dessicationwas initiated by a natural climatic change and accelerated by local irrigation and by export ofwater. The story of the water export, well known in the area and still fraught with someemotion, is told from quite different points of view by Chalfant (1933), Nadeau (1950), andKahrl (1982). We here recount, as well as we can reestablish them, only such facts as bear onthe environmental problems.
ADVENT OF AGRICULTURE
Between 1840 and 1890, the rainfall of coastal Southern California decreased (Lynch1931, p. 3, fig. 1). In 1862, 1863, and 1864, many stockmen and farmers left that area andmoved to the mountains and to Owens Valley, where surface water was abundant (Dasmann1968). At that time, Owens Valley had numerous springs and artesian wells. While the minesat Cerro Gordo operated, two small steamers plied the waters of the lake between Keeler andCartago (Krauter 1959). Farmers withdrew irrigation water from Owens River and subsidiarystreams. Over 40,000 acres were extravagantly irrigated. By 1904 some 297,000 acre-feet werebeing diverted with an average depth of application of 7.5 feet per year (Lee 1906, p. 23et seq.) leaving about 65,000 acre-feet to flow to the lake. The equilibrium requirements forevaporation for the 110-square-mile lake would be at least 350,000 acre-feet per year,depending on weather. A good deal more land was placed in pasturage, which, although notirrigated, used more water than the native xerophytes and thus added to the water burden.
In 1917 Thalia Weed Newcomb conducted an inventory of Invo County- 41,000 acreswere in alfalfa, 8,000 acres in wheat, 1,700 in barley, 2,560 in oats, 6,000 in clover, 750 inbeans, 1,500 in potatoes, and 400 in sugar beets. Orchards were well developed; there were anestimated 114,000 apple trees, 28,500 peach trees, 17,600 pear trees, and some berries. In 1910the population of Invo County, mostly in the Owens Valley. was 6,974: in 1917 it was about8,000. Farming and ranching continued on a large scale until tbey tapered off in the 1920s.The local consumptive use of water exceeded the evaporative demands of Owens Lake andeventually dessicated the lake during periods of drought, even before the export of water (1913)to Los Angeles.
EXPORT OF WATER
In 1904 the Department of Water and Power of the City of Los Angeles obtained landsand water rights in Owens Valley. An aqueduct, the greatest engineering feat of its day, wasbuilt to convey the water to the San Fernando Valley. Water first arrived in the San FernandoValley on 5 November 1913 (Nadeau 1950): full flow has been maintained since 1926 with butminor interruptions. In 1918, the LADWP started sinking wells into Owens Valley to withdrawgroundwater. Between 1930 and 1969, the Department acquired water rights to all theheadwaters of the Owens River and diverted all the major streams in Long Valley and MonoBasin into the Los Angeles water system. A second aqueduct was built to export more water tothe Los Angeles area.
14

NWC TP 6731
CHANGES IN LAKE LEVEL
Natural causes have created great fluctuations in the water level in Owens Lake. Smithand Pratt (1957) give core logs on a 920-foot well in the central part of Owens Lake. Theupper 740 feet show a continuous series of clays and silts with no buried saline deposits. Smithand Street-Perrott (1983, p. 198) conjecture that the lake had not dessicated naturally forseveral hundred thousand years. The drainage was probably through-going during most of thetime in which these sediments were deposited. However, some episodic drying must have takenplace, because fossil sand dunes are found in the northeastern corner of the lake bed and onboth sides of Owens River near the lake. The presence of artesian wells within the playa areaindicates that extensive layers of high permeability are present within and beneath the clays.These were probably deposited during dry epochs. Moreover, ample evidence has beendeveloped to show that China Lake and Searles Lake both dried tip several times during thePleistocene.
During the Tioga Glaciation (Late Wisconson) the lake was filled to the 3,880-footcontour and covered 240 square miles. The lake drained through whatever dammed it at thelevel of those shorelines and eroded the outlet down to a level of 3,760 feet. This overflowappears to have been dammed in turn by alluviation from the sides. Shortly thereafter, the lakeceased to drain into Rose Valley. Smith and Street-Perrott (1983) estimate, based on theamount of salines on the present lakebed, that this drainage must have ceased about 2,000years ago. Gale (1914) estimates between 3,500 years and 4,200 years. Langbein (1961)critiques this technique. Since the spillage ceased, more water has evaporated than has beenreceived. By 1872 the lake had dropped to a level of 3,597 feet and covered an area of 112square miles (Gale 1914, citing Loew 1876).
During the period of intensive farming, whilst a general drought persisted in California,the level of the lake dropped to 3,567 feet in 1905. The lake then began to rise. and by July1911 it had reached 3,578 feet. On the basis of data from Gale (1914), Lynch (1931), andNewcomb (1917), it seems that fluctuations in the amount of precipitation contributed more tothe changing levels of the lake than did the amount of irrigation. In 1917, with the extensiveuse of water for irrigation and the removal of water by the LADW\P, the level of the lake Nvasstill quite high due to a period of above-normal rainfall. The city increased its removal ofwater during drought years, and the lake completely dried tip in 1926. From that time to thepresent, water has reached the lake intermittently when damage occurred to the aqueduct orwhen a surplus of water made discharge to the lake desirable.
Figure 11, reconstructed from data furnished by the I.ADWP and from reports by Gale(1914) and Lee (1913) shows the history of the lake level. Concomitant with the drying of thelake, the artesian sources of water, and most of the naturally flowing springs. such as FishSprings, have dried up (Tolmnan 1937, p). 194). Artesian wells still exist around and on Owenslake, and numerous springs feed the playa from the sides (Fignure 12).
15

NWC TP 6731
3583 - _-__ __________
-i FLUCTUATIONS IN LEVEL OF OWENS LAKE
>3570 -__ -______
0
z2 3563 - __ __
I-
3556'
355OLLILiLiAii1iJi .1 V11 iilitii ii1111ILIili Ilt 4 1 1 IA-i-I iil--I..-IIII .L LLLIJ LL.J1894 1900 05 10 15 20 25 30 35 40 45 50 55 60 65 70 74 81 85
YEAR
FIGURE 11. Changes in Level of Owens Lake From 1894 to 1985.
-S.7
FIGURE 12. Dirtv Socks, an Artesian WVell on the South Side of Owens Lake. To the left,vegetation grows around natural springs.
16

NWC TP 6731
HISTORICAL ECOLOGY OF OWENS LAKE
A few descriptions of the ecology of the lake in the 1800s survive. Capt. J. NV. Davidson,in his report on the 1859 expedition to Owens Lake (\Vilke and Lawton 1976), is one of thefirst men to describe this region. He mentions that the Indians used the alkali flies of OwensLake as a food source. Apparently the Indians gathered the larvae as they were blown ashore.Guy C. Earl, Jr. (1976, p. 61), in the posthumous publication of his father's memoirs, mentionsthat the Indians used the flies as food. Guy Earl, Sr.. was a boy at the time of the greatearthquake in 1872. He says "In the extremely alkaline water of Owens Lake no animal life isto be found except an insect (of about the size and appearance of a housefly) called locally'lake flies,' but which I am told is in reality a kind of shrimp. These insects breed in massesseveral feet wide and a foot or more thick. The Paiutes dried them for food, carrying themaway in sacks to their rancherias in different parts of the Enchanted Valley. I have often eatenthem at the Indian camps."
Loew (1876) says that large quantities of "algous or fungoid" plant material floated uponthe lake in small globular masses of a whitish or yellowish green. These apparently served asaircraft carriers for hordes of alkali flies (Ephydra) whose larvae inhabited the lake waters.Chatard (1890) says that the water swarmed with alkali shrimp (Artemia). By 1906 Willis Leefound that the conditions had changed since these earlier observations (Lee 1906). In 1904, thelake was 16 feet lower than in 1894, and although larvae were still present, the flies werefailing to develop. Dr. Noah Wrinkle, superintendent of the soda recovery works at Keeler. ascited by Lee (1906, p. 21), opined that the larvae were failing to develop because of theincreasing salinity, whereas at Mono Lake they were as numerous as ever. Today, only a fewflies are found around Owens Lake, usually in places where an abandoned artesian well or aspring dilutes the saline waters.
SALINITY
According to Gale (1914. p. 258 et seq.), the weight percent of the total dissolved solids inanhydrous form ranged from 6% in 1876 to a high of 21.4c in 1905. This material is, ofcourse, the dissolved solids that were in the lake when it ceased to spill to the south, and thesolids that have been brought in by the Owens River since then, concentrated by evaporation.When the water body is but a foot or so deep, it occupies only a few square miles of the sumpon the western side of the lake, where the land level was lowered during the earthquake of1872 and its predecessors. The liquid at such time is saturated, and crystals grow on thebottom and on the surface. When the lake bed is dry. enormous deposits of trona. mirabilite.natron. burkeite. thenardite and similar evaporites are found on the western reaches of thelake.
DESSICATION OF MONO LAKE
Pleistocene Lake Mono (Figure 13) was formerly 650 feet deep. It reached a maximumlevel of 7.165 feet, as shovn by abandoned terraces, and occupied about five times its presentarea (Russell 1889. p. 229). Precipitation was at least four or five times that of today. Smithand Strect-Perrott (1983, p. 198) report that drill corc examined by Lajoie revealed no sdlinelayers even below the Bishop Tuff, which they take to mean that the lake had not dried up
17

NWC TP 6731
TOCARSONCITY 22?A ...
BRIDGEPORT \: /,
HuNTOON
-~PLEISTOCENE LAEMONO VLE7,165 FT ELEVATION
: : :! ::*: : i
NEGIT ..... .. %f,..... . .W .. i:
ISLAND.i i i '
IA ISAN
SLANDMONTGOMERYPASS
LEE VININ( ADOBE VALLEY
SJUNE LAKE "
LOOP 39
TO BISHOP
LAKES TO BISHOP
FIGURE 13. Map of Mono Lake.
completely for at least 700,000 years. Following the end of glacial activity, the level of LakeMono began to fall. In 1883 the level of the lake was at 6,410 feet. By 1919, after a long perodof abundant rainfall, it had reached a high of 6,429. During the drought years of themid-1920s and 30s, the lake level fell to 6,416 (Stine 1981). Figure 14 shows abandonedshorelines of recent vintage around Mono Lake.
LAKE ADOBE
At Its peak, Mono Lake overflowed into Adobe Valley. Lake Adobe, in turn, overflowedinto Owens Valley (Figure 13). Lake Adobe refilled about 8,000 years ago and again about4,000 years ago, but is now dry (Batchelder 1970).
18

NWC TP 6731
FIGUiE 14- Mono Lake Shorehirlis.
EXPORT OF WATER FROM MONO LAKE
LADWP took its first water from Mono Basin in 1941. A tunnel driven through the MonoCraters carries the water into the Owens River and thence to Los Angeles. The secondaqueduct vas completed in 1970, and about 100,000 acre-feet of water per year has beenexported since then. The continued drop in the level of the lake is mainly due to this export ofwater, although climatic conditions have also contributed.
EXPOSED LAKE SURFACE
Loeffler (1977) developed a model that predicts that the level of Mono Lake will stabilizeat 6.223 feet just after the year 2050, if the present water export and climatic conditionscontinue. Ten square miles of barren lake bed had been exposed by 1964 (Figure 15).B 2050.an additional 43 square miles will be exposed.
Just how much exposure will actually take place depends some-what upon legal decisionsconcerning the awount of water that can be exported from that valley. Many groups wish tosee the lake level remain as high as possible. but this would be a grave loss of domestic wvatervitall needed in Southern California.
The newly exposed lakebed is covered with a fluffy alkaline crust produced by evaporationof the saline lake waters. This gives rise to dust storms whenever the surface wid exceeds15 knots (Figure 16). Kusko and Cahill (1 984) discuss the nature of the dust. The region willbe a source of dust for centuries to come. Much of the material that follow\s, developed forO-wens Lake. also applies to Mono Lake. although some differences in climate and chemistrywill require modification of the aru ments.
19)

NWG TP 6731
U. LL U. U.
N m.
-i -C
xI m
200

NWC TP 6731
FIGURE 16. Dust Storm From Mono Lake.
DESCRIPTIONS OF OWENS LAKE DUST STORMS
SEASONAL OCCURRENCE
Severe dust storms from Owens Lake occur most often during dry wvindy periods in latefall, winter, and early spring. Dust storms during hot weather are rare and never large. evenwith winds strong enough to move coarse sand. As many as ten dust storms each year reach theIndian Wells Valley. Figure 17 shows one such storm advancing upon Ridgecrest.
METHODS OF OBSERVATION
Dust storms have been observed from ground level in Owens Valley. on the floor of thedry lake, from the ground at China Lake. and from points in between. Observation flightswere made during some of the storms, satellite photographs were studied, and cameras weremounted on the surrounding hills to record the storms. Samples of the dust \were obtained withhigh-volume samplers, and measurements were made of particle size. L.aboratorv studies weredone on the behavior of the saline components. and models were c'nstructed usint! lake-bedclays and brines. We visited the plava monthly in 1985.
21

CHIARAC.TERISIC 0(5 1' MAJOR ST ORMS
rcacht- the 'Sicirii (rct ti thle %\(t- (,Intl l.,YtMt h-t iilmx thet ,roliiid. (lin 22 Jaiiiirx, 1Wt,5(ii't \xa tiit at I 3 5ti1 ti-it \ISI.. 1),% (,\(. ixr tit( '-,trra tiixxarli tinalt' iiiaJ("'iiii Va\ aie III
at ,cric,, if ,t(trl )m I j it I i I it mid Fchriirx iit'. ii. \ iititritit the air Ix% raill. h-i1 a,
far (Iltit &, ( rimll& ( wiilt \ ,x \dicr it hi (al a a \ t-rtt Ode in dtali hil iti paint and \\,I\ in
chdc ald al~in-,allrl ttj~. ~j l Tit 1ii nj(ir t( leiw 1!(i iitxxrksi: d that it \tx a'
a fil (Ii a(id rain'
I jixi(kcri toi ( Wx (It xale to, th,'tr% (- dit tiirrll III pri(-ru , Fintri.t H' a id 1i4 ht,\\x tinl
tir rraf t ii knii Airpirt. Tl ic SIt- . 3) ililit a\\ i\ . ( lm'ilt h(t '( il l ic \,\ Indt (' tihe
i'fiiilli at hIn\iikcrit i ha tr~i 31)( dci.,ri t' at 31, kiititx -iiomtjl I t 401 At icctfet. a dlll~e
hLanket If ihii't lii bif tl , the( Iwiili djll ii~tlti\~ \ iid, to tii linortil. caxt. and ,% cxt
lII't r'illtilllicd t,,II Ii. lI tt(f Fiiirc 20t l I - air ahtttxc anid itr t I(t >,olrra xx it, lr\ oitalcar
I -tk .T (,Ii Iti " I t I t IhI i ii l (it h t Iii' I dl 1ii ( i '' X a' a] iii I i I bli - \1I x i i i it I\ it aii rii ir
\ , I I , Ir I f I T ,, II I ) I I I , II II I I i I t , \ \\ it 111 ) - a m n 'lr. \ I 11 1) 1 t I I. I
t t r I I , n( dth i . t it I v.I Iwt i 1 1 m d 1 0 k i, t i itIr- rcI

pow

NWNC TP 6731
FIGURE 20. Top of Dust Storm View From Aircraft,.
FIGURF 21. Clear Air over Sierra iRight . Dust Over ON~ens Valle% Left,
24

NWC TP 6731
The air over the north shore and central part of Owens Lake was clear and clean. Airdescended upwind of, and into, the clear area at a rate of 200 to 300 feet per minute. The lakecontained water, streaked by the wind. Dust was blowing along the center and the eastern sideof Owens Valley from the vicinity of Tinnemaha Reservoir toward Owens Lake. This dustmoved around the eastern side of the lake and across the eastern half of the dry lake bed. Thewestern side of Owens Valley, north of Lone Pine, was free of dust.
Little or no dust came from the northern shores or northern side of the playa. Windappeared to be lifted over this area and to be stiiking the slightly rising ground on the southernhalf of the lake bed. Spiralling streamers of dust arose from south of the water body to theregion of the sand dunes, where an opaque cloud rose to 8,500 feet in the space of 1 mile orless.
On the western side of the lake, the rising dust was carried northward in a gigantic eddyto the vicinity of Bartlett Point. There, the uppermost part of the dust cloud was swept to thesouth over the rising lower portions of the cloud. Figure 22 shows the situation. Dust was beingtransported through the gap at Haiwee, through lower Centennial Pass, over the CosoMountains, through Carricut Valley and Etcheron Valley into the Panamint Valley, and thenceto Trona in Searles Valley (Figure 1).
FI(UBE 22. Owens Lake During Major Dust Storm.
25

NWC TP 6731
Upon our return to Inyokern, the dust plume was concentrated on the western side ofIndian Wells Valley; the eastern side had become remarkably clear. To the south, the jet ofdust that passed over Inyokern spread out as the wind lost velocity in the expanses of theIndian Wells Valley and the Antelope Valley. The San Gabriel Mountains were still obscured.
By noon that day, the dust cleared in Indian Wells Valley. but between 1300 and 1500 thevisibility decreased to 8 miles because of dust circling back from the southeast. At about 3,000feet, a low-level counter circulation had been set up and dust- laden air was flowingnorthward into Searles Valley and thence through Burro Canyon to the north end of IndianWells Valley. During the dust incursions, the visibility in different parts of Indian Wells Valleyvaries greatly. It is not uncommon to have a wall of dust in the western half of the valley, andbut a minor amount in the eastern half.
DUST LOADING
On the day of the flight described above, a total suspended particulate load of 408.5micrograms per cubic meter was measured over a 24-hour period at Trona by theSan Bernardino County Air Pollution Control District. In the same 24-hour period, the KernCounty Air Pollution Control District found 150 micrograms per cubic meter at the ChinaLake station. The dust storm at China Lake lasted from 3 to 4 hours, and the whole of the dustwas deposited in that time span. Hence the loading at China Lake must have been 6 to 8 timesthese average values: close to 1,200 micrograms per cubic meter during the actual storm.
Twenty-four-hour samples yielding 350 micrograms per cubic meter are common. Inalmost every case, these are from dust storms that last only a few hours. The suspcndedparticulate load often exceeds the alert level of 375 micrograms per cubic meter, established asthe National Episode Criteria for particulate matter.
PARTICLE SIZE AND CONCENTRATION MEASUREMENTS
Size distributions of the dust particles were measured at China Lake by a WhitbvElectrical Aerosol Analyzer and a Royco Optical Particle Counter (see Whitby, Husar. and Liu1973 and Zinky 1962). The electrical aerosol analyzer counts particles having diametersbetween 0.0075 and 0.6 microns. The optical particle counter serves between 0.3 and 10microns.It is thus necessary to use both instruments. The juncture between their areas ofeffectiveness is at about 0.4 microns. The electrical analyzer yields counts that are too high andthe optical counter yields counts that are too low over the size range betwen 0.3 and 0.6microns (Cook and Kirker 1975 and Carroz et al. 1977). The transition points betweenobservations made by the two instruments can be noted in Figure 23. Both instruments arecalibrated with small, spherical, plastic particles that have different optical and electricalproperties than the airborne clays and alkalis, which are of irregular shape. The assumptionthat the aerosol particles are spherical leads to uncertainty in deitrrninqtion of size distributionand mass loading. Table I shows the mass loading of the aerosols and the visibility during thedust storms originating from Owens Lake. as compared with observations made during a clearday in the Indian Wells Valley and a smoggy day in Los Angeles.
26

NWC TP 6731
104
4
102 3
E 1M-10 0E:5. /~o° 3
0001-
10-1
10-2-
10- 3 1I
10-2 10-1 100 101
D, Pm
FIGURE 23. Plot of Volumetric Particle Distribution for Clear Air (1),Smog (2), 10-Mile Visibility (3), and 1-Mile Visibility (4).
TABLE 1. Mass Loading of Aerosol Particles in ClearAir, Smog, and Owens Valley Dust Storms.
Mass loading, Visibility, ConditionDate Time g/m 3 miles'
1/20/1978 1110 1.55 100+ Clear8 and 9/1969 . . . 100 . . . Smoggy3/25/1976 1305 497 10 Dusty4/16/1976 0920 2578 1 Dusty
27

NWC TP 6731
We used Table 2 to prepare AV/AlogD plots (Whitby et al. 1973). We assume that theparticle count, ANi, measured for each size interval, Di to Di + 1, represents the number ofparticles having an equivalent diameter, D, equal to the square root of the product of thelimiting diameters. The volume of an equivalent particle within each size interval is thus
AVi = (ir/6) (DiD(i + 1))3/2
Multiplying AVi by ANi gives the equivalent volume of the particles within one size interval.
The aggregate mass for each size interval is obtained by multiplying the volumes by adensity appropriate to the size and the material: 2.0 for the dust, and 1.72 for the smog.Forming the sum of all sizes of particles we obtain the cumulative mass for the suspendedmaterial in micrograms per cubic meter.
Figure 23 shows the data plotted for clear air, for Los Angeles smog, and for visibilities of1 and 10 miles in dust. The air entering Owens Valley on days when dust storms occur isremarkably clear and clean initially. For example, on 20 January 1978, with a gentle northwind, the total loading was 1.55 micrograms per cubic meter. PEDCO-EnvironmentalSpecialists, Inc., (1973) gives 25 to 30 micrograms per cubic meter as typical for this area.Visibility is usually in excess of 100 miles. During the dust storms, the number of particles isincreased by orders of magnitude.
Figure 24 shows the visibility, V, plotted as a function of the suspended dust loading, Q,as determined at China Lake between 1975 and 1979. The limited data suggest a lineal trendon log-log paper. The geometric slope of near unity suggests that the equation developed byMiddleton (1963) and by Noll et al. (1968)
log V = Ca log Q
TABLE 2. Cumulative Numbers of Suspended Particles per Cubic Centimeter of Air.a
Dust Dust Dust Dust DustDiameter, Clear day Smog (visibility (visibility (visibility (visibilitv (visibilitymicrons (China Lake)b (Los Angeles) 10 miles b 7.5 milesb 5 miles b 2.5 miles1b I mile b
0.02 4.4 x 10³ 4.1x10⁴ 1.0 x 10⁴ 1.8x 10⁴ 6.4x 10³ 4.7x 10³ 1.3x 10⁴
0.03 1,5x10 3 2.0x 10⁴ 3.1 x 10³ 3.1 x 10³ l.9x 103 1.4- 103 2.9x 1030.06 5.1 x 10² 9.2x 10³ 1.4 x 10³ 1.0 x 10³ 8.7 x 10² 5.6 x 10² 1.5x 10³
0.10 1.9x 10² 4.7x 10³ 5.8x 10² 4.0x 10² 4.0x 10² 2.7x 10² 9.7 102
0.15 8.8x 101 2.3x 10³ 2.5x 10² 1.9x 10² 2.1 x 10² 1.8x 10² 5.8x 10²
0.30 3.4 x 100 3.3x 10² 4.1 x 101 3.5x 101 3.6x 101 6.3x 101 1.3 x 10²
0.50 1.2x 10⁻¹ 5.0x 101 1.2x 101 7.6x 100 1.2x 101 2.7 x 101 5.1 x 1010.80 1.1 x 10⁻² 9.0x 100 8.6x 100 5.3 x 100 9.3 x 100 2.0. 101 4,1 x 1011.20 0 2.5x 100 6.3x 100 3.4x 100 7.2x 100 1.4x 101 3.1 x 1012.00 0 6.2 x 10- 1 4.2 x 100 2.0 x 100 4.8 x 100 8.0 x 100 2.0 x 1014.00 0 1.2 x 10- 1 1.7 x 100 8.6x 10⁻¹ 1.9x 100 3.5 x 100 8.4 x 1006.00 0 3.5 x 10⁻² 6.0x 10- 1 2.3 x 10⁻¹ 7.6x 10⁻¹ 1.1x 100 3.3) 100
a Cumulative number of particles with diameters greater than shown, but less than 10 microns.b Measurements taken at China Lake, Earth and Planetary Sciences Laboratory: 2.5- and 7.5-miles visibility
data taken on 20 May 1975, 5- and 10-mile on 25 March 1976, and 1-mile on 16 April 1976.c Smog is summary for August and September 1969 by Whitby et al.. 1972.
28

NWC TP 6731
100 , 111l 111 , I _
- O0
0 0
E 0\
100
_ \ _
0
10
20 50 100 500 1000 5000
DUST LOADINU OF AIR, mq/rn3
FIGURE 24. Visibility as a Function of Suspended Dust Loading.
where C and a are constants, is applicable to dust storms.The visibility depends on nianv.factors, such as color of the dust, color of the background, phase angle of illumination, sizeand shape of the particles, and the complex dielectric constants of the dust; however, a simplerelationship of this sort makes it possible to estimate suspended dust loading without recourseto an array of instruments. For example, on 26 March 1970, visibility was 0.25 miles for3 hours and then averaged 2.5 miles for 3 more hours. Observations were only made for 16hours on that day, and so for a 24-hour period, a minimum loading, as collected by a high-volume sampler, would have been more than 1,100 micrograms per cubic meter. The storm of26 March 1975 would have yielded a minimum value of about 955 micrograms per cubic meterfor 24 hours.
MASS OF MATERIAL INVOLVED IN A STORM
The amount of dust removed from the bed of Owens Lake by a storm can be estimatedfrom the atmospheric loading. The mass of material, M, suspended over 1 square meter of theground at a given time during a dust storm is given by
M 50Q H x 103
29

NWC TP 6731
where M is the total suspended mass in micrograms, Q is the mass loading in micrograms percubic meter, and H is the plume depth in kilometers, all values being averaged throughout thetotal column.
Assuming a loading of 1,000 micrograms per cubic meter and a plume height of2 kilometers as being typical of the China Lake area during a severe storm, 2 tons of materialare suspended per square kilometer. If this were an average value for the whole of the dustcloud from Owens Lake to the southern end of Antelope Valley, shown in Figure 25, the totalsuspended mass at the time of the photograph would be about 80,000 metric tons.
The flux of material from Owens Lake in one storm is many times this amount. The activesurface of the lake is about 280 square kilometers. Assuming a density of 2 grams per cubiccentimeter for the dust, a layer only 150 microns thick could produce the dust cloud thatextends over the entire affected area. A wind of 25 meters per second could replenish the entirecloud every 3 hours. Thus about 7 tons of material would be removed each second. Sustainedfor 24 hours, such a wind would erode 0.12 centimeters of sediment, a thickness smallcompared to that of the dessication crust that overlies the lake bed.
FIC;URF 25. Satellite Photograph of Dust Cloud Extending fromOw'ens Lake to Souithern End oif Antelope Valle%.
30 I

NWC TP 6731
CHEMICAL COMPOSITION OF THE DUST
On 26 March 1975 a Lundgren Impactor was operated for 12 hours to obtain dustsamples. These samples were analyzed by X-ray activation, and thus the clays and other rockparticles were analyzed along with the alkalis. The average compositions for all particle sizesare given in Table 3. The main constituents are sodium, aluminum, silicon, sulphur, chlorine,potassium, calcium, and iron, as well as trace amounts of titanium, manganese, copper, zinc,and chromium. Although the X-ray activation techniques did not report the presence of sulfateor carbonate radicals, these are important constituents of the dust. The chemistry of the dustvaries with the season of the year. It is to be expected that the earliest dust storms of the seasonwould contain more alkalis than later storms. The color varies, ranging from ash-white todove-gray to dark gray as the season progresses. Samples of dust furnished by the Great BasinAir Pollution Control District in 1985 were analyzed by ion chromatography. The analysesappear in Table 4. A study of the aerosols in Owens Valley was published by Barone, Kusko.Ashbaugh, and Cahill (1979).
TABLE 3. Aserasye Elemental Composition of
Dust for the Time Period 0800-2000 PST.26 March 1975.
Element ,ug m3 umol n13
Sodium. ........ 224.7 9.771Aluminum 63.8 2.365Silicon 145.9 5.194Sulfur 37.6 1.i73Chlorine 38.4 1.083Potassium 29.7 0.760Calcium 33.9 0.843Iron . 39.0 0.6,98Magnesium 3.0 0.125Titanium . . . 3.4 0.171Manganese 1.05 0.019Copper . 0.01 0.0002Zinc 0.003 0.00005Chromium o.003 0.00(106
Total 620.500 22. 10500
TABI.E 4. Percentage by \Weight of Components of ()O ens Lake Dust Samtpli.
Date sample Concentration. Soluble. Na. K, CL. NO 3 , S04. C) 3 ,taken t g,,n3 " ; ' " + ; "
22.31985 207.69 15.60 31.40 1.41 8.65 2.46 9.57 46.483' 3/1985 7627.9 4.16 39.14 0.76 7.74 0.14 14.87 37.353 3/1985 552.)19 46.26 33.83 ).71 4.73 0.28 16.90 43.573127 198!, 989.03 16.04 31.401 0.85 6.91 0.23 20.660 40.02
3,129/1985 2059.55 10.96 45.00 1.23 11.70 0.05 13.33 2N.694'26:1985 797.05 5.14 43.05 1.39 10.61 2.01 20.05 22.94?26, 1985 371.82 6690 32.26 0.85 6.23 0.79 12.45 47.424.26,1985 284.94 65.73 56.33 W94 11.26 1.44 10.00 20.03
Mean weight, 39.96 1.01 8.45 0.98 14.80) 43.80Mean roole, "f 62.65 095 8.55 0.58 5.67 21.63Standard deviation. mole, 7.52 1.24 1.88 (.52 1.74 7.,98
NOTE: Analysis b% ion chromatoura l)hy 03 ( ) and C(). 3 are determined toiether.Samples courteN of Creat Basin Air 'olluhtim Control [ )itrnet
31
NWC TP 6731
EFFECTS OF THE DUST
The airborne particles from Owens Valley storms are smaller than those from desert sandstorms. The dust particles are nonabrasive and produce no sound on impact. The particles areelectrically charged, cause radio static, and stick to windshields of automobiles and aircraft.Suspended wires develop a high charge that makes it dangerous to handle ordnance itemsduring these episodes.
Dr. Bruce Chandler, M.D., F.C.C.P.; Dr. Robert Gilmer, M.D., F.C.C.P.; and Dr. JackSchraeder, M.D., F.A.C.C. (personal communications) state that medical problems areaggravated by the dust. Patients at the Ridgecrest medical complex who suffer fromemphysema, asthma, and chronic bronchitis are subject to increased morbidity. Hospitalizationof these patients with bronchial spasm and related pulmonary problems increases during dustepisodes. The populace complains of coughing, sneezing, and irritation of the eyes.Psychological problems emerge as some people become apprehensive because of difficulty inbreathing. People become annoyed and anxious. Cats behave aberrantly. Dust enters buildingsthrough cracks and crevices and covers exposed items.
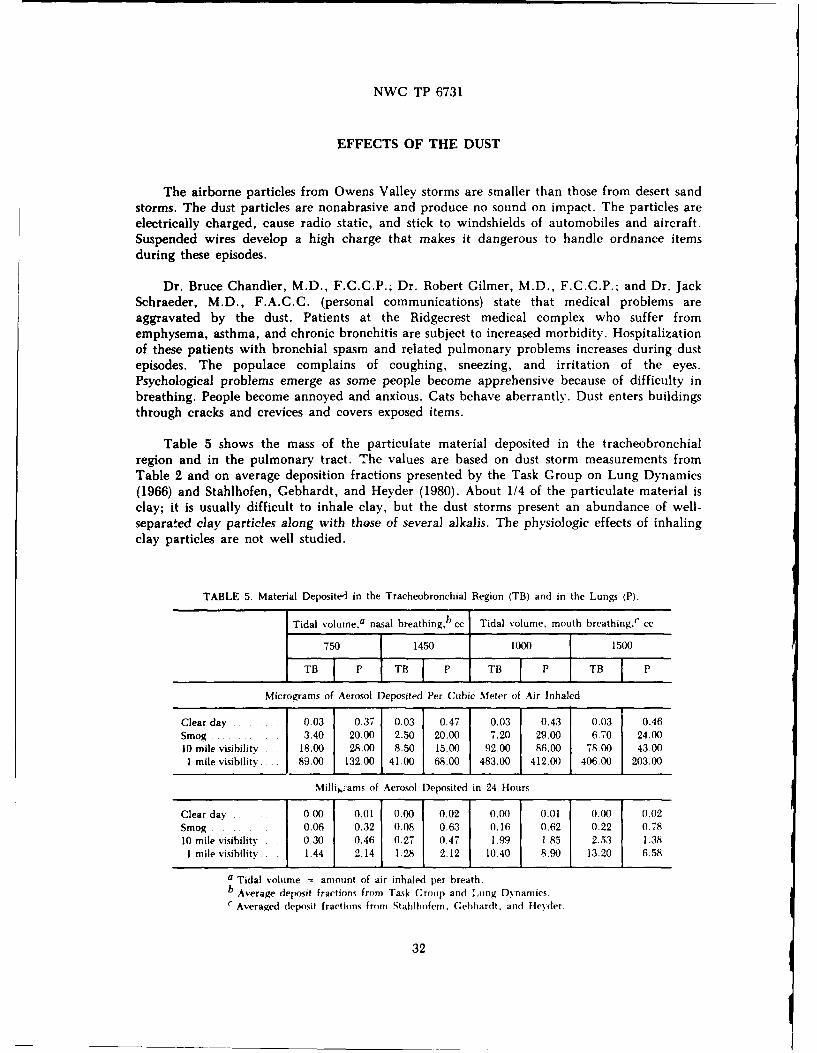
Table 5 shows the mass of the particulate material deposited in the tracheobronchialregion and in the pulmonary tract. The values are based on dust storm measurements fromTable 2 and on average deposition fractions presented by the Task Group on Lung Dynamics(1966) and Stahlhofen, Gebhardt, and Heyder (1980). About 1/4 of the particulate material isclay; it is usually difficult to inhale clay, but the dust storms present an abundance of well-separated clay particles along with those of several alkalis. The physiologic effects of inhalingclay particles are not well studied.
TABLE 5. Material Deposited in the Tracheobronchial Region (TB) and in the Lungs (P).
Tidal volumea nasal breathing,b cc Tidal volume, mouth breathing, c cc
750 1450 1000 1500
Micrograms of Aerosol Deposited Per Cubic Meter of Air Inhaled
Clear day .. 0.03 1 0.37 0.03 0.47 1 0.03 0.43 0.03 1 0.46Smog ... ... 3.40 20.00 2.50 20.00 7.20 29.00 6.70 24.0010 mile visibility. 18.00 28.00 8.50 15.00 92.00 86.00 78.00 43.001 mile visibility 89.00 132.00 41.00 68.00 483.00 412.00 406.00 203.00
Milli 1 ,:-ams of Aerosol Deposited in 24 Hours
Clear day ..... 0.00 0.01 0.00 0.02 0.00 0.01 0.00 0.02Smog ........ 0.06 0.32 0.08 0.63 0.16 0.62 0.22 0.7810 mile visibility 0.30 0.46 0.27 0.47 1.99 1.85 2.53 1.38I mile visibility 1.44 2.14 1.28 2.12 j 10.40 I 8.90 13.20 6.58
a Tidal volume - amount of air inhaled per breath.b Average deposit fractions from Task Group and Lung Dynamics.
c Averaged deposit fractions from Stahlhofem, Gehhardt. and Heyder.
32

NWC TP 6731
In the Sahara Desert, studies of the ecological effects of sand and dust storms indicate thatthere may be a significant health hazard depending on the type of dust. Lundholm (1977,p. 67), states that one might expect a very unhealthy dust coming from the numerous saltpans.Although little is known about the health effects of the dust, a report cited by Lundholmstates that the Kalahari area of Botswana, which is very overgrazed in parts, has the highestdeath rate from lung diseases in the world.
PROVENANCE OF THE DUST
Visits to Owens Valley during windy conditions reveal that dust arises from the followingplaces. The locales are listed in order from the ones that contribute the most dust to the onethat contributes the least.
1. The southern half of the Owens Lake plava, usually beginning about a mile from anywater body present.
2. The rest of the playa ,h n not covered by water, including the northern portion(Figure 26).
FIGURE 26. Dust Stori ('iev from Northcast Side of (mens Lake).
33

NWC TP 6731
3. The area immediately north of Tinnemaha Reservoir. This situation has been notedonly when the water in Tinnemaha is low.
4. The valley floor between Independence and Owens Lake, for a short distance on eitherside of the river bed. This happens after a protracted dry spell.
5. The north and south shorelines. Sand, with but little dust, blows across the lakebedfrom these shorelines and forms sand dunes to the north-northeast and south of the lake. Thedunes on the north side are being deflated, and those on the south side are accumulating a mileor two to the south of the lake; the area between is being deflated. The sand does not travelvery far and ultimately is deposited in dunes. Some dunes form where updrafts tend to occuron the lake bed.
Areas near springs, which have been flushed clear of alkalis and have colonies of sacatonand other halophytic vegetation growing on them, do not produce dust. The boron content ofthe lake surface precludes the natural growth of vegetation thereon, but, where it has beenflushed away, halophytic grasses and other vegetation seem to thrive. Figure 27 shows the areaaround an artesian well in wintertime, with a thick growth of alkaline crust over and aroundthe grasses. Figure 28 shows the same area in summer with a verdant growth of grasses.
FIGURE 27. Area ATrImin an Artesian Well in % tte.
34

tyts
Aht 1h
Iil l fillt ' ,
o II

NWC TP 6731
trough passes to the east over Owens Valley. Arctic air is advected at all levels up to a fewhundred millibars. The lapse rate is extremely stable; the air is dry and cold. The air dropsfrom about 9,000 teet in the Mono Lake region to about 2,500 feet in the Indian Wells Valley.The already dry air is thus heated by compression. The relative humidity often drops to lessthan 10%.
3. Visibility Reduction. Minimum visibility occurs some hours after the onset of the storm.Strong winds from the north-northwest continue as the visibility decreases. Winds subside atthe surface before clearing begins.
4. Clearing. Clearing occurs when the winds at the ground weaken and/or changedirection so that they are no longer aligned with Owens Valley. The period of clearing may beprolonged, with remissions and exacerbations of the storm. Dust is deposited on bushes, andany winds that blow within a week after a major storm produce minor, secondary, localepisodes from this source.
Within Owens Valley, wind from any direction in excess of 15 knots causes lifting of dustfrom the lake bed. To describe all the meteorological situations that will produce this gamut ofresults is impossible.
FI(URE 29. Dust Clouds Raised 1).% Westerly Winds Blowing, Across the
Sierra (Vie% Looking Smith).
36

NWVC TP 6731
X 3: -
C -
37

NWC TP 6731
CONDITIONS ON THE PLAYA SURFACE
If dust is to be produced from the playa, the surface material must be such that it can bepicked up by the wind or be amenable to being dislodged by a secondary agent. We will nowdescribe the playa under different conditions of weather, season, and water supply'.
The playa is fairly flat and uniform in appearance, but conditions on the surface varywidely. Owens River has created a delta that overlies and interfingers with the clays of the lakebed. Water collects in the western sump and to a lesser extent in low places on the eastern side.Numerous springs have locally modified the surface, washing away saline water and the alkalicrust that often develops. Abandoned artesian wells locally flood their surroundings, giving riseto lush growths of grasses.
Abandoned evaporators, pipe lines, tracks, and roads are spread over the entire lake.Refuse from mining operations is being piled in one locality on the eastern shore. Largedeposits of evaporites are located in the sump. The lake is fringed with shorelines and beachbars developed during the high stand of 1913. Mud volcanoes, developed in the vicinity of faultzones during past earthquakes, are arranged in lines on the playa, indicating the likely courseof recently active faults. Large cracks cross the surface.
Some secondary grabens lie on the valley floor to the north of the lake bed. The surface ofthe lake bed is fractured into huge polygons that are N isible when the playa is dry. To someextent, the distribution of the materials on the surface is changed by wave action duringperiods of flooding. Wind redistributes sand, making and destroying small dunes and removinglarge quantities of alkali and clay.
LAKE WATER
Numerous analyses of the water in Owens Lake have been made since the first one wasconducted by a Professor Phillips of England in January 1866 (Phillips 1877). This andsubsequent analyses are cited by Willis Lee (1906), Gale (1914), and Clarke (1924). Theseresults, as well as a few more recent ones, are given in Table 6. On the basis of these analyses,the total solute load of Owens Lake is estimated to be 160,000,000 tons of anhydrous salts(Gale 1914). This treasure trove of sodium products works out to 67,000,000 tons of sodiumchloride; 63,000,000 tons of sodium carbonate; 23,000,000 tons of sodium sulfate: and7,400,000 tons of potassium, boron, iro-i, aluminum, lithium, etc.
These substances, as strange a cast of characters as ever appeared in an ionic soap opera,readily change their chemical and physical properties, forming a wide variety of complexes,depending upon conditions to which the substances are submitted. When concentrated, theyprecipitate a minerologist's delight of e'aporite minerals to be identified and named. The worstpart is that they do not stay fixed; man) are hydrated. and these change dramatically withvariations in temperature, pressure, humidity, and atmospheric carbon-dioxide content.
These compounds change composition whiie being sampled, transported, and tested. Thelake brine dissolves glassware rapidly enough to change the apparent concentration of thesilicate ion in a short time. Inclusion of suspended particles of silt in the sample can easily lead
38

NWC TP 6731
C:l
Z- z Zm0 -1 c
cc~~~ ~ ~ z -U o 5 x rI- =l -= - ! - - cll C
- - -- - - --- - -
co I- - = In -c '- rc, r
C, C' If, cP CA IC' IC' ..C Z -. -in c f - I C -
. .. . . . . . - V2 cl - C11 -I- r C'
- -^ Cl p' I I I IC '' C - 0
C, -~ - . CICC-l1- xCC C
Ln~~ --
cr -' l t cn in
Cl Cl C) 1 1, CA clI- N C, 1 1c C) rlt
CICICIICIrlt CII'CC C C C4CC Cl r
cCl -rC .CrC- C^ I C - - mIC^ C^
4 C C I Z-C I 1 .- 1 - - - -l. - x' in
CCC'P2Cl~- - IC ZZ -- C CI l
39I
NWC TP 6731
to an increase in the silica content without representing dissolved silica in the original sample.This may have happened with the samples of river water cited in our Table 6. The brine canalso take up carbon dioxide from the air in sufficient quantities to change the bicarbonate ionconcentration during storage, unless the sample is very carefully sealed. Trona can beprecipitated during periods of high temperature, thus removing a complex of sodiumcarbonate, sodium bicarbonate, and water from solution. Mirabilite and natron form duringcold weather, but will either melt or dehydrate as you watch them. The laboratory results varya good deal because of the difficulties involved in transport, storage, and analysis. In formerdays, the bicarbonate ion was determined along with the carbonate ion, as probably was theborate ion. Lithium and potassium were often analysed as sodium. Determination of thebicarbonate ion in the presence of much carbonate is still difficult.
HYDROBIOLOGY
The water in Mono Lake is not colored, but water in Owens Lake has a red tint.described by explorers in the 1800s. Chatard (1890, p. 95) discusses the coloration. He citesPayen who contended that decomposing Artemia caused the red color. Although thisobservation has been widely quoted, we do not think that this is the reason for the color. Brinealgae in saline solutions include Dunaliela salina and D. viridis. Dunaliela salina colors brinered. A few types of bacteria that exist in these environments also give brine a red color.Halobacterium and Halococcus (chemo-organotrophic halophilic bacteria) are red due tocarotenoids in the cells (Larsen 1980, p. 25). Jannasch (as cited by Larsen 1980) found that thered, phototrophic sulfur bacteria Thiorhodaceae dominate Wadi Natrun. a carbonate playa inEgypt from whose name, by mispronunciation, the word Trona arose. Other sulphurmetabolizing bacteria are Chromatium and Ectothiorhodospira (Larsen 1980. p. 30).
The red color of the microorganisms may reduce the effects of sunlight on the biota andraise the water temperature, giving the microbes a longer growing season (Dundas and Larsen.as cited by Larsen 1980). Richard Tew, a resident of Keeler. has made a series of studies on themicroorganisms in the lake (Tew 1966 and 1980).Bacteria that metabolize sulphur, givenenough time, are capable of changing the chemistry of the lake waters. The algal componentsand the plant flagellates are also quite capable of changing the carbon dioxide content of thelake waters.
LAKEBEDS
The floor of Owens Lake is composed mainly of lacustrian clays, covered in places by asand layer of variable thickness. The uniformity of the surface is broken by evaporators on theeastern and western sides and by the delta of the Owens river on the north. The delta consistsof coarser debris deposited onto the lake while the river was flowing. Since the river dried up.the only material brought in has been fairly coarse debris swept along during periods of heavyrain, or when excess water was dumped into the lake.
The lacustrian clays are fine grained, highly cohesive, and run the spectrum of colors fromgreenish gray to black. Droste (1961) identifies the clays as illite and montmorillonite and lesseramounts of chlorite and kaolinite. Some of the clays near the surface are mixed with aeoliansands. The dry surface of the playa is covered with an alkaline crust. When the lake surface isdry, hot, and has not been recently wetted, the crust is quite hard and easily supports the
40

NWC TP 6731
weight of people and vehicles. The crust is arched up, out of contact with the underlying clays.except for occasional points that support the mass. Once the crust is wet and the temperature islow, the crust is puffy, soft, and friable. While the crust is wet it can not support its ownweight and falls on the clays beneath. The reasons for these changes will be discussed later,along with the chemistry of the crust.
The moisture content of the clay increases with depth, unless rain has recently fallen, inwhich case the surface may be quite wet. The uppermost clay is usually dry, but at a depth ofa few inches it becomes damp and at a depth of about 2 feet it is wet and plastic (see Table 7).On the surface itself, the edges of the cracks, which form the sides of polygons several feet to10 or more feet in diameter, are upturned, with a generous growth of saline crust on the edges(Figure 31). In cross section, these polygonal cracks descend into the clay as distinct fracturesthat reach the plastic damp material beneath. Figure 32 shows the effects of water being pipedinto the clay beneath by means of the fractures.
The clay in the dried zone is friable, and the pieces are well separated. To a depth of afew inches in late winter to 2 or 3 feet in early autumn, the clay is broken into pieces less thanan inch in diameter. The sizes of the pieces and of the fractures increase with depth. At adepth of about 2 feet, the pieces between fractures are up to several inches in diameter. Thefractures do not extend into the damp, plastic clay: but as the clay dries further, the fracturescontinue to propagate downward (Figure 33).
When the playa has been dry for 2 or 3 months, the upper 4 to 5 inches of crust crumblesand, dissaggregates into pieces a centimeter or less in diameter. This disturbance to the clay inthe upper levels has been postulated to be chemical in nature, caused by the growth anddestruction of crystals of the various saline materials. This may happen, and in fact in otherplayas we have seen small flecks of gypsum in the spaces between cracks. We feel, however.that this fracturing is brought about by drying of the expansive clays. The progressivedeepening of the cracks over the space of a month or less in the "dry season" indicates thatdessication is the primary mode of formation of this zone, The clay beneath the crumbled zoneis often a dark black solanetz with fragments of leaves preserved therein. The organic materialhas apparently been reduced to carbon by action of the carbonate ion. The lack of suchorganic detritus in the upper disturbed region indicates that it has been aerated by virtue of itsporosity. whereas the clay beneath the disturbed layer has not been so oxidized.
TABLE 7. (Cmposit ion of Core, Taken at (vn,,ens Lake.
Date core Site" Depth, Na. K. Sit)2. C S. 504. (( 3. IICO. B. Solubl.1, Iln hibl. .
taken ft ."i' ; * . (- iark
10 10 1985 SP 0.5 44 0-3 3 5 2.4 1.07 itd 1).1 11 71 sS 21 :30 ltand dul10110 1985 SP 1.0 17.6 2.3 . . . 2.3 6.3 16.3 bt 0.32 45.2 54.5, 30 Hand dkii11 15.1985 SP 1.0 15.6 0.34 . . . 22.0 9 7 2,S5 bt 1 . 30.40 -11 51 40 Hand diiz
11 15 1985 SP 2.0 3.03 0.23 0.16 5..6 9.S ()lS 1.22 10.06 21.27 7.S.73 41 Cri 1 .1511985 SP 4.0 2.44 11.16 0.14 3.1 1.7 1).71 lt ).114 S..34 91.6 41 Cor10 I011985 W C , . 3.1 10.21 . .1 1.7 22 0, f/ iS lt 1 06 , -, 'i. 1 41 ( ,rc
NOTE: The %tater content of the ilavs N a, determind eparatcl% Iro I ithe iciitrxa SP indicates old sulphate plant in cetier (f pla.%a: WC i, the \csitc i , tm i w % t c, (d olti pla ah Indicates all material s.libhI in water.
" Indicate, Material not %olileh, in %%atir. but iclude, %atir of hdratio and ,, atvr in claN,bt indicate, helm thrnfhold of d,.tctin
41

\\'( i 7k 1
HI .*Id 31 ( r.m ki ett Pla.%rai'
lIn the vici nit\ of clai at d ikc ' and fractuiires. thle bhi i back color ks absent. and the ela\is the usual izrav or hibutft 1(r listanc- o wi ecral cc t i met ers )fm the tractuores. Folinwi n! rain.snow,. or other wxet t int thcn ha rd cru ;t (d si 111cr col lapses and falls upon the dlistuiirbed layer.JWrejtin it. Tli i (iistjrl)t'(l ]i ave(r t lit iiswlIs reconlipact s. and imlpr ~ves the hvdrolo[ziccontinuity with thle (impilj clai\ beneathi The result kis a eaonal openlinj and closing of thecracks: the reuTVirig1- aeration destro\, t~n' orgLanic miaterial that olrdinarilv color, the clays, blackFiture 33).
The t'lavs are not \(rx portitalt. A hlt (ig it'tper thtan the level it an adjoining w\aterbody. will not till \\ itlo xsato r fir las 11 td . Tit title particle sizc of the (-lclays results, in atvery ctotsiderablte tcnen( Ic t ss ard (aiiliars uplitt (d s% ater troml belb .\
Oil the other hand. iii it ctitt \s\5ition at mile, or so) to th bt' ater hiod\. \s here coarse sand
o)vrlies th l " aoi depth if i t 'xs\ feet. thle tendency tt msaril cajliliarit is grtatl\ reducedbecause of the largerr particlt siic's (d th Il 501( and th lit uchi i.reator t id spaces,. IHere. thbealkaline crust niav be alnitit otirtis absent. t'\el tliomii0h it mla% be weNll des eltped a few% feetaway in any\ direction where c-it axi prcett at th lie ulrfacu. I mitead areas 5' it b deep sandremlain liuse and frt of salts to a dt'ptt (dt 1,,tt (or si. dle1'idiwlg uipttn tilt jgrttlnd\ator level.
Iinnediatc]lv btlos this Immos moa'toriall. rlj21t '111 ttq i the I it5att'r, the andO( is, %%tll cemen'itedI b.\

Tar
44 4
I4.

W C\ TP 6-1b3
iI -
- ~SCLANETZ -
e4£ tEACHE D ZONL
ACKA,,
a solid, hard mays ot c'. istajliu Suct h Niel alts arc i alx if exer. founid xx ithin the cia\ massexcept in) the wes~terinost Nuiii. w\here saturated soluitions remini for \ears at a timec on top ofthe clas. and other i-las. (lepi siteul on top of a laser olf esaporites. ma\ proteet the evaporitesfrom solution.
Ordinarils. as noted I~ F sluai P(u p0 . 57-5-W, mlost ufi til slie are concentrated at orjust below the suirfaee. anid tin( clax hem atli tie alkaline erust ini a pla\ a is not saturated w\ithsalts. At at (1e1)th of a foo4t or- so) tie wolition is dliluite. OnI M\wens lake. howevecr, w\hen theclevel of the brine ini tin w\atcr bos hias icn-e u\traordliiarilv high beeause of plartial refilling ofthe lake and~ redlist ribuutioniuf soon td tin bruuo'. tihe risinij gruiiiuulwater near the w\ater body ismore eoneentrated andl xx ill reouaiui si) mit i the alkali has been retraiisported to the surfaee.Strongz w inds bloss tin'h ini about iin thn' Fattcr pairts of the pla\ a suirfacc and so spiread itlaterally fromi the tree xx ater. ( oAmu samupht [rout tin' \cestee area and from the \iiiitv if the

NWC TP 6731
Old Sulfate Plant (see Figure 9) were analhzed for solutes and for water content. The resultsappear in Table 7. The clays contain up to 48', water by weight, the total solute varies from8", to 50 depending upon depth and upon the state of recent flooding of the plava.
Unless the area has been subjected to an increase in brine 1 flooding of the lake, thesalines present at the surface are probably derived from the \ertical transport of groundwaterby capillarity. The capillarity works best when the clay is not disrupted by fracturing or is notmixed with sand. When it is, the water reaches the surface primarily by vap)r-phase transferthrough the cracks, condensing in the upper portions as the surface cools at night. When thesurface is damp, the capillary conductivity is greatly enhanced because the particles are onceagain in intimate contact.When the saline crust wholly or partially dissolves in the first fewcentimeters of the surface sands and clays, osmosis comes into play and migration of moredilute water from beneath is hastened. Osmosis and capillarity then work together. Acombination of these effects causes the alkaline crust to grow faster in winter than in summer.On this basis, the assumption that evaporation rate from the surface of a clay playa dependsprimarily on temperature is in question: more groundwater may be evaporated in the winterbecause more of it is nearer the surface and is less protected from what heat there may be.
Upon dampening of the surface in hot weather, the superficial mateiial dissolves. Thisprocess leaves an area of high saturation near the surface: however, with respect to the clays ata depth of only a few centimeters, th, solution is stLpersaturated because the clays are cooler.The ions of the solute migrate downward into the cooler region below. where temperatures ofonly 15'C are common. There the solution is supersatured and precipitation of the salinesresults just below the surface. Thus when the temperature is high, the Soret effect become.snoticeable.
Following a light rain in July 1985, when the soil temperature at the surface sometimesexceeded 65°C in the early afternoon on windless days, new crystal growth on the underside ofthe crust was quite apparent. This growth consisted of a centimeter or more of fine transparentcrystals with hair-like apophyses that descended into the clays beneath. \Where the crust wasarched up, the slender crystals extended down into the open spaces below.
Without rain to dampen the surface, the effect is not noticeable, except near the brine
pool where the water table is so high that the soil remains permanently moist. There a thinlayer of crystaline material develops beneath a layer of damp clay only a few millimeters thick.The two layers are separated by a gelatinous solution, possibly containing dissolved silica. Asilica gel has been reported in hydrothermal waters in Lake Magadi, Kenya. at temperaturesbetween 67 and 82'C and p11 about 9 (Eugster and Jones 1968. p. 160).The temperature in thefirst centimeter may reach 60 to 65' C, but the temperature of the water beneath may only be15'C or less. At the high surface temperatures, the hydrated versions of sodium sulfate andcarbonate break down to the nionohvdrates and anhydrous forms, with release of water andadsorption of heat. Thus the precipitated crvstal body can act as a gigantic heat sink in the
permanently damp. concentrated brine.
45

NVC TP 6731
CHEMISTRY OF THE CRUST
The concentration of the various ions in the crust varies from place to place on the surfaceof the lake bed. Near the water body, the composition is probably identical with that of thelake brine in terms of the relative amounts of the various ions present. In places near flowingwells and springs, or where the salines are derived from rising groundwater, the composition isprobably richer in chlorides and relatively impoverished with respect to sulfates andcarbonates. A thick deposit of trona was removed from an area several hundred feet square onthe south side of the road leading to the Lake Mineral workings. A new crust that containsalmost pure sodium chloride has grown in this area.
We have conducted analyses of the crust at a few places. The results for the Westec sitearea and for the sulfate Plant area are given in Table 8 for various seasons of the year. Thenature of the salts involved are such that small changes in relative humidity during storage andpreparation for testing may result in changes in the composition because of the accumulationor loss of carbon dioxide and water from the air. We have taken pains to keep the samples wellsealed and at reasonable temperature, but it is not possible to guarantee that no changes tookplace.
The analysis of dust from samples collected by the Great Basin Air Pollution ConrolDistrict were presented in Table 4. The relative amounts of the various alkalis are about thesame as those in the samples of the crust taken in the wintertime, except that the samples ofthe dust that we had were enriched with respect to sodium carbonate. Table 9 summarizes theanalyses of the waters, cores and crusts, in the section on crusts, we did not include aberrantsamples that were taken from places where some special activity had altered the chemicalcomposition of the water or the playa. The analysis, by ion chromatography. interpretedcarbonate and bicarbonate as one compound because in the process of determination, thecarbonate changes to bicarbonate. The size of the samples did not permit a careful distinctionbetween these phases. In the future it would be well to get largtr samples and to sample eachstorm in turn throughout the season in order to distinguish between the bicarbonate andcarbonate ions.
The primary active agents are sodium chloride, sodium carbonate, and sodium sulfate.Potassium and lithium compounds account for only a few percent of the material, and thesecompounds should not behave markedly differently from tb sodium compounds. Little or noalkaline earth ions are present because they are rapidly precipitated by the carbonate andsulfate ions.
The composition of the alkali crust depends upon the degree of moisture present. theconcentration of carbon dioxide in the water and air, and even more so upon the temperature.While sodium carbonate was being recovered commercially from the waters of the lake. thesolutions were concentrated in evaporation pans on the edges of the lake. In summer. trona. asodium sesquicarbonate-dihv'drate, formed and was precipitated in the ponds. The trona thusrecovered, called "summer soda." was heated to drive off the water and the excess carbondioxide. The anhydrous or monohydrated sodium carbonate was shipped out. This processbecame obsolete when the lake water itself became so concentrated that the t- 9na precipitatedonto the lake bottom. Subsequently, the water was further concentrated and placed in largetanks where it was carbonated with carbon dioxide recovered from flue gases or produced fromlimestone and dolomite from nearby mines. Ovens Lake was the main source of soda ash forthe United States for many years. and much soda ash was shipped to China for themanufacture of fine porcelain.
46

NWC TP 6731
co -f
-7 -
-- - - I- - - ---r
IS- r c- , -if ; '
777
rn t - -
I - z -7
47

NWC TP 6731
TABLE 9. Summary of Composition of Principal Components of Owens Lake Salines.
Sample Na, K, Cl, NO 3 " SO4. CO 3. HCO 3 " SiO 2 ' Remarksfrom % % ,C %
River water .... 22.73 ... 10.88 ... 17.80 34.21 .. . 14.21 Sample reported in Clark. 1924,adjusted to 100'- .
Lake water .... 38.78 2.02 26.45 .. . 9.45 18.44 4.91 0.24 Mean of all values.
Clay cores .... 34.17 3.12 15.34 .. . 27.01 19.08 ... 0.75 Mean of all values of soluble materials.adjusted to 100,.
Crust ......... 37.64 1.90 21.69 ... 23.21 14.58 . . 0.98 Mean of values for undisturbed playa
surface, adjusted to 100", .Dust ......... 39.92 1.01 8.45 0.98 14.80 24.80 .. . XMean of all values of soluble materials,
I___ I- I I I Ia d j u s te d to 1 0 0 .
In the winter when the temperature drops, trona does not form; however, natron, adecahydrate of sodium cabonate (called "winter soda"), formed ice-like crystals in theevaporation ponds. These were recovered and exposed to the air, to which their water ofhydration was lost. The resulting amorphous powder was then shipped as "soda ash,"anhydrous sodium carbonate. Production by this process came to an end when the lake levelfell below the point where it was profitable to pump the brine into the evaporators.Eventually, more profitable schemes involving the injection of carbon dioxide into the brineand careful recovery of the boron content were used. These too came to an end whenreaddition of water to the lake during good water years diluted the concentrated brine to thepoint where the newer plants could not handle it effectively, and some of the facilities werecovered by water.
The process upon the surface of the playa reflects these reactions to a large degree. Figure34 is a logic diagram that shows the reactions that occur on the lake surface as a function oftemperature and humidity. This diagram is oversimplified to the extent that we have notconsidered the for'nation of complex minerals such as Brookite and the other rarer species.Various polyhydrates seem to be present at the lower temperatures. An economic lemma ofOccam's Law entered here, having identified the process involved, we were forced to stop,leaving the elaboration of further detail to others. The minerals of greatest importance arecalled out in Table 10. It is not quite appropriate to regard them as minerals sensu strictubecause some are amorphous. The crust, when damp, is more properly regarded as a collectionof ions than a group of discrete compounds.
Of the minerals shown in Table 10, only halite, natron, thermonatrite, thenardite,mirabalite and trona play an important role in the development of the surface crust, althoughdihydrates and septahydrates are also present. Nacholite can not form under ordinaryatmospheric conditions because of insufficient carbon dioxide or temperatures that are too low.The species involving calcium are not found in important quantities because the abundance ofthe carbonate ion causes precipitation of the alkaline earths. Burkeite is found in the crystalbody that develops in the concentrated brine (Smith, Friedman, and McLaughlin 1986), buthas not yet been identified on the surface of the playa. It has been reported from other playas(Jones 1962, p. 3569).
The right side of Figure 34 shows the summertime processes. Starting with clay thatcontains brine, one notes that if the temperature is greater than 17.9°C (Eugster and Smith
48

NWC TP 6731
START
M INAITE NDMMSRABLE
CLAY. SAND. WITH WATER NIR CI
so4F COC
3 U HCO3 , CC2EVAPORATION OCCURS TO 44
SATURATION
SNOILTSLITL
MUCH TRONA. HALITE, TRONA HALITEANDBAND T>8CTHENARDITE YERAIN MIRAB LITE FORM FORM -4 RAN
~AND REFORM
NO SOFT CRUST FIRM CRUST
AMOPHOUES SANDA ANDHALTEE.S
YES NO . YES
N!O YES YES OTRONA-'NATRON / TRONA. HALITE SOME TOA'TEMMIRABILITE, AND STABLE TRONA TOA TEM
HALITE STABLE MIRABILITE SUST NATRITEDEHYDRATES SUSPENDED OTHERS STABLE
PUFFY CRUST PUFFY CRUSTEALTESUPEDE
H A L I T E~SALTATES
MUCH RAI LITTLE YES
AD IT TNO N O NO TAL
LOTSOT
SUN LITEN ALL PHASES
FIU, 3.Aeatins OcurnAnte my ufc saFnt ofTempe Grat e dOWidtN
AILNOAND S TABEE
DUSTUFFY CRUST CRUS HAD
P YES A L
MSULFATE RIC
NATRON NaCLAY WIND OAN
YAI E S SENDEORDUSTS
MUC LIT SUFT OMLOSSAND ALPAE
CLAY~~AN ANNaO EFCT)SAOTAT HALITE
AMORPHOUSO NOLTT STORMT
FIG U ES STABL CARBONATE, O c u rn n t e P a a S r a e a c i n o e p r t r NO u i iy
SULFTE ICHWIN

NWC TP 6731
TABLE 10. Common Compounds Found in Evaporite Deposits.
MolecularName Composition h Density Transition a
Weight
Burkeite .............. .. Na 6 (SO4 )2CO 3 229Gaylussite........... ........ Na 2 Ca(CO 3 )2.5H 2 0 296 ,. SO-,t0Glauberite ..................... Na 2 (SO4 ).Ca(SO 4 ) 314 2.7
Halite ........................ NaCI 58 2.2 -20.NaCL,2H 2 0
Mirabilite .................... Na 2 SO 4 .10H2 0 322 1.5 32.4- H20
Nahcoliteb ..... . NaHCO 3 84 2.2 270-CO2,Natron ..... Na 2CO 3 .10H 20 286 1.4 33.5-H.OPirssonite ...................... Na 2 Ca(CO 3 )2 .2H 2 0 242 2.3 80-211.0Thenardite .IS......... N-- O 4 142 2.7 2.7
Thermonatrite ................ Na 2 CO 3 H2 0 124 2.2 100-11,0Trona (Urao) ......... ........ Na3H(CO 3 )2.2HO 226 2.1 DecomposesSodium-carbonate-dihydratec ....... Na2C03-2H 2 0 146
Sodium-carbonate-hept ahvdratec. Na 2CO 3 .7H 2 0 232 1.5 32--tt20Sodium-sulphate-heptahvdratec .. Na9S0 4 .7H20 268 1.4? Trans to anhydrous
a Degrees C at which transition occurs; -H1 2 0 means loss of water. -C)o means loss of carbon
dioxide.b Probably cannot form on the playa at Owens Lake.c These compounds have not been identified as minerals on Owvens Lake: their presence is inferred
from chemical considerations.
1965, p. 484), the evaporation of the brine leads to the formation of trona, thenardite. andhalite. If enough rain falls, the crust entirely or partially dissolves and the process returns tothe starting box.
If little or no rain falls, the minerals are stable and the crust is hard: the clay beneath
begins its seasonal drying.If the temperature rises above 65'C, trona becomes unstable andconverts to thermonatrite: halite and thenardite remain stable. If the temperature then dropsbelow 65°C, trona slowly reforms. If the temperature does not drop. thenardite.thermonatrite, and halite remain undisturbed unless enough rain falls to dissolve the
constituents, whereupon the process returns to the starting box. While summer conditionsprevail, the crust is hard and stable (Figure 35), and dust is rarely produced from the playa.regardless of how hard the wind blows. The superficial sand is also cemented into the crust.
and, except for sand from loose dunes and from deposits around sand fences and the like, evenblowing sand is infrequent.
Summer rains are infrequent: they usually fall in July and August and rarely do more than
just wet the surface. The rains can, however, become quite severe, and on rare occasionsdeposit up to 10 inches of water. Following a slight rain, crystals of all the minerals are foundgrowing on the underside of the crust, presumably because the water .vashed the solutes there,but more likely because of the Soret effect. Figure 36 shows an inverted piece of summer crust.in July 1985, with crystals growing on the underside. A light rain preceded the picture byabout 7 days. The solution near the surface, while warm. is near saturation. but at a depth ofa few centimeters, the temperature is near the average annual temperature and the solution isthus saturated, resulting in the precipitation of the solutes there. Sometimes dessication of theunderlying soil takes place to the extent that loose silt, dust, and clays are found directly
beneath the crust (even though the clay at slight depth may be almost half water by weight).
50

low-.
A;- aef 1( .(

NWC TP 6731
The winter regime is different. The lower temperatures present in the winter produce adifferent set of reactions than does the heat of summer. The left hand side of the diagram(Figure 34), shows that, if the temperature is below 17.9°C and above about 10'C (atemperature that depends upon the concentration of the other components of the brine), halite,trona, and mirabilite form (Eugster and Smith 1965, p. 484). If enough rain falls, the alkalis ofthe crust dissolve and the process starts over. If a little rain or snow falls, then the amount ofmirabilite increases. The halite and the trona remain in stable form except for what wasdissolved by the rain. The formation of the mirabilite is accompanied by a considerableincrease In volume. The mirabilite dehydrates upon exposure to dry air. After several cyclesthat depend upon rain and wind, the crust is conditioned for production of asulfate/bicarbonate-rich dust. Throughout the winter regime, it is quite possible that a numberof polyhydrates of both sodium sulfate and sodium carbonate form, but we do not haveevidence for this at this time.
Should the temperature fall much below about 10'C, the trona converts to natron. Bothnatron and mirabilite are then present in the crust; both form with an increase in volume andthen dehydrate with a concomitant decrease in volume. After several cycles that depend uponwind, rain, and temperature, the crust is prepared for removal of a carbonate/sulfate-richdust.
The presence of sand is not a prerequisite to the production of dust storms. Observationsmade on the playa during dust storms indicate that the sand does saltate, and quite possiblyhelps break up the crust. The upper few millimeters of the farinaceous crust are easily strippedoff by the wind, and, consisting as they do of micron-sized particles of the amorphous alkalis,become suspended in the turbulent airflow at the surface. Some particles of sodium chlorideare fine enough to become airborne, as is the clay that has been thoroughly disaggregated bythe expansion and contraction of the alkalis. The larger particles of salt and the sand formdunes wherever the wind velocity Is a little lower or the upward component of velocity is lowenough to permit them to settle. A far more important factor in dislodging particulate matter isthe presence of large pieces of the lower part of the crust, which become undermined by thewind and are broken off, tumbling over the ground and scarifying the surface. It is quiteinstructive, although uncomfortable, to watch the process in action.
The effects of cold weather and moisture are dramatically illustrated by the events of early1986. During January a white crust completely covered Owens Lake bed, except for the brinepool. On 30 and 31 January, an inch of rain fell and almost completely dissolved the entirecrust. On 31 January, the alkali crust was dissolved and the lake-bed clays were showing as adark olive color over almost all the surface. This rain was followed by a few cold days, duringwhich the temperature fell below 00 C. By the morning of 2 February (Groundhog Day), thecrust had begun to reform. By late afternoon, some white dust was arising from the extremesoutheast corner and from the south side of Owens Lake playa, just seaward of Dirty Socks (seeFigure 9). It took but 4 days for the crust to reform. The entire surface, except for the brinepool, appeared as if covered with snow, although none had fallen. The surface was againwhite. On the morning of 6 February the wind, blowing about 15 knots, picked up dust andcarried it over Keeler and Cerro Gordo. Subsequently the wind shifted and the dust wascarried southward towards the Indian Wells Valley. The dust originated from the same area ason 2 February, except that there was a good deal more of it. The brilliant whiteness of the dustIndicated that It was mainly alkali (probably sodium carbonate) and contained very little clay.
52

NWC TP 6731
The cold weather during the first days of February probably promoted the formation ofthe decahydrates of sodium sulfate (mirabalite) and sodium carbonate. These processes takeplace rapidly when the temperature is low. The rain dissolved the previously formed crust andleft a concentrated solution at the surface. While not concentrated enough to produce halite,the solution was enough to permit the formation of the decahydrates. The solubility of halitedoes not change much with temperature, but the solubilities of mirabilite and natron do. Theformation and dehydration of the decahydrates can take place within the space of 2 or 3 days.The wind was quite dry on both days of observation, being adiabatically heated by descentfrom the Sierra.
Figure 37 shows the concentration as a function of temperatures at which the severalcompounds precipitate from solution. The solubility of sodium chloride does not change muchwith temperature; when cold it does not precipitate much more readily than when hot. On theother hand, the carbonates and sulphates of sodium have an extreme variability in solubilitybecause of the formation of hydrates. At or near the freezing point, both natron and mirabilitewill precipitate from solutions containing less than 10% solute. Thus, following a rain, crystalsof either decahydrate can form on the surface of a still-wet playa and dehydrate to form theamorphous powder that produces dust. A caveat is in order here: because of the formation ofhydrates, a certain amount of water is tied up with the compounds, even in solution; thereforethe apparent concentration of water molecules will appear to be different with respect to thevarious compounds because some of the water has been removed from solution. Thus thetransition points for a pure solution on any one solute will be different in the presence of theothers. Moreover, a number of complex salts may form, which will in turn affect the reactions.
The growth of the mirabilite is accompanied by a large volume increase. If the surfacedries off, those crystals of mirabilite near the surface soon loose their water of hydration to thedry air. This gives rise to a powdery amorphous phase, consisting primarily of anhydroussodium sulfate, with a concomittant reduction of volume. Trona does not so readily loose waterof hydration. If no wind blows and more rain falls, the material either dissolves or rehydrateswith another volume increase. Each volume change serves to break up the clays and toseparate the hard summertime crust into a very soft, fluffy solanchak. Once the salts lose waterof hydration, a 15-knot wind can blow away the sodium sulfate, and because the otherconstituents are no longer held together, the halite, trona, clay, and sand can also betransported.
If the temperature falls to near 10'C, the trona and whatever thermonatrite may bepresent change to natron. The formation of natron is also accompanied by a volume increase.Once again, if much rain falls, the materials dissolve. If a little rain or snow falls, more of thesodium carbonate and sodium sulfate is converted to the decahydrates. As long as themirabilite, natron, and halite remain damp, they are stable. In the presence of sodium sulfate,halite forms a dihydrate at temperatures near 0°C (D'Ans 1933), with a slight volume increase.but this is not of great importance in Owens Lake. Once permitted to dry, the mirabilite andthe natron quickly loose their water of hydration and both become powdery amorphousmasses. The loss of water of hydration is hastened by osmotic transport to the halite. Once theamorphous phases form, removal bv wind is easy.
An almost identical process has been described by Juan Puyeo Mur (1979, p. 39) in theephemeral lakes of the Provinces of Zaragosa and Teruel, Spain. He reports the formation ofmirabilite in efflorescences in winter, with subsequent dehydration to a "'farinaceous"thenardite, often psuedomorphous after the mirabilite when the crystals of mirabilite have not
53

NWC TP 6731
80NA 2 CO 3 H2 0
70 -
60 -
NASO 4
50-
) NA 2 CO 3 • 7H 2 0
L. 40-
NASO4 10H2 0
20
10 - NACL
10
0 ENA2 CO 3 "10H 20
II I I
0 10 20 30 40 50 60
CONCENTRATION, % (GRAMS 100 GRAMS H2 0)
FIGURE 37. Concentration as a Function of Temperatures atWhich the Compounds Precipitate From Solution.
been disturbed by the wind during dehydration. He mentions that. because of themicrocrystalline structure, the thenardite is easily dispersed by the wind. Because X-raycrystallography shows that the powdery sodium sulfate is amorphous. some question arises as towhether it is properly called thenardite, which has a regular crystalline form. Indeed. X-raycrystallography of the winter crust reveals only halite and silica in crystalline form. althoughchemical tests clearly show the presence of both sulfate and carbonate ions.
One would expect, because of the temperature dependence of the formation of thedecahydrates, to find dust of a different composition depending upon the weather just beforethe dust storm. For example, the dust of storms that occur in the beginning and at the end ofthe season might have more sodium sulfate, relative to carbonate, while those occurring in thecoldest times might show an increase of the carbonate content with respect to the sulfate. Asthe season advances and the supply of loose alkali is depleted for that year, one would expectto find a greater percentage of clays in the dust. It would be interesting to check out theseconjectures.
54

NWC TP 6731
Because of the temperature dependence, diurnal cycles in temperature lead to cyclingthrough parts of the process shown in Figure 34. Makrov, as cited by Strakhov (1970) describesa diurnal process at Lake Bolshoi Mormyshanskoe whereby the crystals of mirabilite form bynight and change to amorphous thenardite by day. The complex hydrates are quite similar toice in appearance, and, because of the large amount of water present, are really an impureform of ice. If the temperature is elevated to the decomposition point, they melt, very like ice,and the carbonates and sulfates dissolve in their own water of hydration. They lose water ofhydration readily. Were it only for loss of water by evaporation, the increasing molality causedby evaporation would result in decreased vapor pressure, which would in turn cause decreasedevaporation. The salts would only asymptotically approach total dessication.
Playas with only sodium chloride usually remain a bit damp and hard throughout theyear, except in areas of extreme aridity, such as the Atacama Desert. Playas with sodiumcarbonate and sodium sulfate often develop a dry surface in cool weather shortly after a rain.Dust storms rarely if ever develop from the surface of a playa that contains only sodiumchloride. Because of the extreme lability of the decahydrates, osmotic transfer of salts to thebase of such a crystal would raise the exposed surface, which could then dehydrate, causing afurther growth of the efflorescence as the season wore on.
VOLUME CHANGE UPON HYDRATION
Thenardite, Na 2 SO4 , has a molecular weight of 142.04 and density of 1.464. One moleoccupies 53.0 cubic centimeters. Mirabilite has a molecular weight of 322.19 and density of1.464. One mole occupies 220.8 cubic centimeters. Therefore, an expansion of 4.15 times takesplace upon formation of the decahydrate from the anhydrous salt. Upon dehydration, thevolume of a given quantity of this material will decrease to 1/4th of the volume of the hydratedsalt. Sodium carbonate, has a molecular weight of 105.99 and a density of 2.532. One moleoccupies 41.86 cubic centimeters. Natron has a molecular weight of 286.14 and a density of1.44. One mole occupies 198.71 cubic centimeters. An expansion of 4.75 times takes place uponhydration, and the volume of the hydrated material will decrease to 1/5th of the originalvolume upon dehydration. Trona, if dehydrate,' vould decrease in volume to about 0.75 ofthe hydrated volume.
The volume change upon dehydration is an important factor in causing the clays tobecome friable enough to be dispersed by the winds. Firstly, the growth of the hydratedcrystals by evaporation of the brines carried up by capillarity and osmosis will result in aconsiderable volume increase. Secondly, the dehydration of the crystalline material after it hasonce formed will result in a volume decrease, leaving the clays with considerable voids, andthe particles well separated, perhaps even more finely divided, by the growth of crystals increvices and fissures (Driessen and Schoorl 1973). The wooden tripod in Figure 38 illustratesthe effects of crystal growth upon the legs of a wooden tripod situated in a puddle of brine.Not only has the crystallizing alkali greatly expanded the cross section of each of the piers atwater level, it has also decomposed the wood.
In summer. the salts forming at the surface are hard and unhvdrated becausethe middaytemperatures rise well above the decomposition temperatures of mirabilite and natron. Thus.the firm crust consists of hard crystals of salt and the carbonates and sulfates without water ofhydration, or with only minimal hydration, such as the monohvdrates. With progressivelydecreasing temperatures. polyhydrates will reform. We suspect from laboratory experiments
,55,

Ak.7
!;~1 J , e_ T
~ttrc ii tt it N(rrt at t U if ilr - t It itt iL~ if tilt, I f )I;pii i 1it 11 !it " I I~ h\ I tfI
tellieratm, (f th matriak
N\VC TP 6731
TREATMENT TO ALLEVIATE THE DUST PROBLEM
No easy solution is likely to be found. Each of the following 11 treatment options for the110-square-mile lake surface -will certainly involve a good deal of time. expense, and effort.Most of them will probably not work. The game is rigged, but if we don't bet, -we can't win(W. C. Fields). Any approach, if it is to succeed, must provide some economically usefuladvantage or some desirable by-products that will make the approach worthwhile, over andabove the alleviation of the dust problem.
1. Do Nothing. The removal of the alkali dust by the wind results in a depletion of sodiumcarbonate, a lesser depletion of sodium sulfate with respect to sodium chloride, and theremoval of several tons of clay per minute during the more violent storms. In due time, all the
alkalis of importance -will be wafted away and the salt will remain, but this will take centuries.
Alkali dust will be spread over the entire continent, and the useful components of the dust willbe lost.
2. Interfere With the Wind. So far the only attempts that have been made to interferewith the wind have involved putting up dust fences and planting vegetation. No successresulted from these efforts, and there is little reason to expect any.
The basic premise underlying these efforts to interfere with the wind was that blowingsand impacted the surface in the process of saltation and thus dislodged particles of clay and
alkali. These particles were ultimately removed by the wind. The alkali is much more easilymoved than the sand, which is often cemented into the crust by sodium chloride. Pieces of the
winter crust are often undermined and then dislodged by the vind, with the result that these
rather large fragments strike the ground, breaking up not only themselves but also the crusted
surface (Figure 39).
Sand fences may stop the sand, but they do nothing to prevent the removal of the alkalis
and the clay particles. In fact, by increasi1g the turbulence near the ground, they may actually
increase the rate of removal of the smaller fractions. Were enough of the 110-square-mile lakebed covered by sand fences, in an intermeshing pattern so as to be effective in stopping sand
regardless of wind direction, it might ultimately be possible to increase the thickness of sand on
the entire surface to discourage the development of the solanchak crust. This process Vould be
very costly.
.3. Cover the Plava 'With Sand. A layer of sand upon the surface would slo\\ the upward
inovement of the saline groundwater by capillarity. but unless the layer \were several feet thick.
it would be just a matter of time until the salines were at the surface. One consequence might
be the formation of hard crystalline layers of the evaporites at the base of the sand. Such
layering is noted around the present water body in places near the delta of the Owens River,where loose coarse sand covers the surface to depths of a few feet. If the sand were to be
placed upon the surface, it might then be possible to start some shallow rooted vegetation to
stabilize the sand )ecause the vegetation could begin to grow by using water brought upwardinto the sand through vapor-phase transport. The sheer volumne of sand required. which \\ould
amount to at least 200.000 acre-feet ( roughly 2 billion metric tons), makes this idea lessattractive, unless the sand could be trapped and held by the sand fences: a most unlikely event.
It the wvater table were to remain high or the lake flooded, the sands .would then become
saturated with the alkalis, and the crust \would grow on the top of the sal( in spite of thereduced capillarity. The success of this system -would have an adverse effect upon the recover\of the sodium compounds from tie lake.
57

NAV: TP 67T31I
'Ne
' I~~- lilt, r I' 1 ,r~ i- i
Laro III, In

NWC TP 6731
4. Encourage Vegetation and/or Revegetation. The whole of the playa is contaminatedwith the various alkalis and with salt, but it might be possible to find some vegetative coverthat could survive on the surface. This would be an attractive soluion, except that the soilcontains enough boron to preclude use of even the most halophvtic plants.On the other hand.where an artesian well or spring has been permitted to overflow the surface, grasses and othervegetation do well all year round. This tells us that the soil can be cleaned and the more toxicelements removed, offering a possibility for stabilization of at least a part of the surface. Werean option of this sort to be tried, it would be necessary to take steps to ensure that futureflooding of the lake surface by deliberate dumping of water would not occur. A useful by-product would be the development of limited agriculture or livestock grazing.
5. Flood the Playa. It is often suggested that the surface of the lake could be flooded andkept damp. If enough water were available to totally refill the lake to the 1913 level orthereabouts (approximately 2,400,000 acre feet, not counting the ensuing groundwaterrecharge), the water might well prevent the major dust storms. Some smaller storms woulddevelop on areas peripheral to the lake where efflorescent crusts would develop after a time. Itwould take more water to flood the playa and maintain it in a wet state than is now available.The surface would require at least 10 feet of water a year to compensate for evaporation andkeep the surface wet. This would be a waste of between 300,000 and 700.000 acre feet ofpotable water that can not be spared. Any attempt to keep the surface slightly moist wouldresult in an exacerbation of the problem. in that it would cause more growth of the alkalinecrust.
6. Coat the Plava. It has been suggested that the surface of the playa could be coatedwith some sort of membrane, asphalt, or other material that would prevent evaporation. Thismight work if it were possible to prevent the destruction of such a surface by the growth ofcrystalline precipitates and the action of the sodium carbonate. The cost would be enormous.and the actual work would have to be preceded by several years of careful research to findsuch a material.
7. Treat With Chemicals. It has also been suggested that limestone or similar material beplaced upon the surface to cause it to become harder. It might be possible to apply calciumsulfate, which might eventually turn to calcium carbonate and form a harder surface, but itwould be only a short time until that crust was also broken tip. Adding limestone or gypsum tothe surface might also result in the formation of complexes of sodium and calcium carbonateand sulfate, and this might aggravate the situation. To try a test plot with this treatment.however, would be useful.
8. Stabilize the Blowing Sand From the Lake Shores. A treatment to prevent the blowingof sand from the northern and southern shores of the lake and to keel) the sand dunes frommigrating back and forth is within the realm of ordinary reclamation efforts. There seems to beno pressing reason to (1o this now. The dust will be dislodged, and dust storms created, with orwithout the sand.
). Clean the Playa by rise of Polders. Sidney S. Alderman. Vice President of Aizriculturaland Industrial Minerals. Inc.. of San Carlos. California. has suggested that a system of poldersbe developed to wash the alkali from the surface soils into the srrnip at the western side of thelake (Alderman 1980). This is the technique used by the Dutch to clear the soil of Holland ofsea salt. It could work, but the cost of ringing the lake with such a system of dikes would behigh. In 190 Alderman calculated a cost of .S25,000, 00) ove.r a period of 15 \ears.
59

NWC TP 6731
In concentric strips around the north, east, and south sides of the lake, fresh waterimpounded behind dikes would percolate through the lake bed and be picked up in drainageditches after having dissolved the alkali salts and leached them from the soil (Figures 40 and41). This water would then be pumped by windmills into the sump where it could evaporate,leaving the solids behind.
The water to do this would come from water now entering the playa area from aroundthe sides. Some 80,000 acre-feet a year of good water is now lost by evaporation. This watercould be pumped into the polders and then removed to more down-slope polders. or putdirectly into the sump. Once an area were cleared of enough alkali, some sort of vegetationcould be made to grow, temporarily at least, in that part of the surface and the land could beused for livestock.
This scheme would concentrate about 150,000,000 metric tons of sodium products, worthabout 4.5 billion dollars, on the west shore of the lake where they could be recovered. Thisamount of salines would, not counting water of solution and of hydration, fill the lower part ofthe lake to at least the 3,553 foot contour (Figure 40).
10. Lower the Water Table. As has been noted by David Thompson. C.H. Lee, WillisLee, and many others, efflorescent crusts do not develop on playa surfaces where tbe depth togroundwater is at least 10 feet below the surface. Following the removal of the surface alkalisby leaching, and transport into the sump, it would be advisable to lower the water table to atleast 10 feet below the surface. This lowering could be accomplished with a set of windmillsthat could remove the water from sand layers beneath the playa surface-as some of theartesian wells, even in the center of the lake, do at present. The clays are but poorly permeableand will not yield water readily, although-given enough time-they would dewater into theunderlying sandy sediments. If the water table could then be established at 3.555 feet at theedge of the water body, and permitted to remain at least 10 feet beneath the surface fromthere to the edge of the playa, the dust problem would ameliorate within a decade or two.Once the polder system had cleaned the surface, the natural evaporation would help lower thewater table, even if pumping were confined to areas peripheral to the playa itself.
IMPOUNDMENT DIKEBRINE PUMPED TO IMONETDK
CENTER OF LAKE BEDj FRESH WATER
LEACHED AND RECLAIMvED LAKE BED
FRESH WATER
BRINE
SALT BRINE DEPOSIT
(b)
FIGURE 40, Polder System: (a) Operation (i Single Dike and Drain Ditch, and (b Section "Fhr1tiihCenter of lake Bed with Multiple Contoured Dikes and Ditches. (After AIM lIn,.. 19S,4.1
60

NWC TP 6731
~ HWY
613
.../ ' .. " ..45 'KEE"ER
5 4"3"
/19
," 3553 FOOT CONTOUR
! f SHORELINE OF PRE- 1917 LAKE
0 1 2 3 4
~MILES
FIGURE 41. Owens Lake Bed Showing Location of Concentric Strips for Polder System.
61

NWC TP 6731
Following the lowering of the water table, some of the water that accumulates in thesprings around the lake, as well as that which flows south into the plava along the course ofthe Owens River, could be used locally for irrigation or exported for use elsewhere, such as theIndian Wells Valley, where it will soon be needed.
11. Combine Polders With Groundwater Lowering. The concept of lowering the watertable is sound enough by itself, although it would yield an enormous mass of water that wouldhave to be disposed of in some way. Initially, about 70,000 acre-feet of dilute brine wouldhave to be removed, and subsequently about 70,000 acre-feet per year would have to bepumped. The advantage of the polder system is that it gives an excellent means of evaporatingthe water while developing a saleable by-product. If the domestically useful water were to beused locally or exported. another benefit would accrue. However, any attempt to export morewater from Owens Valley is likelv to lead to public-relations problems. unless the matter isclearly explained beforehand or unless it can be shown that the water's export would benefitthe local folks.
The option of using polders combined with groundwater lowering is attractive. It wouldbe worthwhile to try a pilot plant approach, using several square miles as test areas.
SUGGESTIONS FOR FURTHER WORK
Although we feel that we have made a good start toward understanding the mechanismsof dust storm development, we feel strongly that much more can be done. It is not necessary toconsider only the practical aspects of this particular problem. a myriad of opportunities fordoing useful research lie untouched, beyond our ability to look into them. A few examplesfollow.
* A more careful analysis of larger dust samples taken throughout the year would leadnot only to a better understanding of the seasonal nature of the mechanism but also to adetermination of the chemical composition of the dust as a function of the weather.
* A careful distinction should be made analytically between the presence of sodiumcarbonate and the presence of sodium bicarbonate.
* More detailed analysis of cores should be done, with determination of the water contentand chemical content of the cores as a function of depth. Cores should he taken to considerablygreater depths than we could attain.
e It is time to revisit the problem of determining the evaporation from playas as afunction of temperature and season of the year. The isolation of the upper surface of the playaby formation of the crumbly clay section certainly decreases the capillary conductivity of thesurface layers to the point that loss of water from the playa ma\ actually be less in summerthan in winter.This work would lead to reassessment of the recharge rates of desert basins thatwere made by estimating the evaporation from playa surfaces.
62

NWC TP 6731
* A theoretical and experimental study to determine the effects of osmosis on the upwardtransfer of solute in cold weather, when osmosis and capillarity both act in the same direction,might lead to further understanding of the processes in saline environments. The totalevaporation rate from clay-covered surfaces may be greater than heretofore thought.
* The concentration of trace compounds such as nitrates might be controlled by tinydifferences in osmotic behavior and solubility. It is not by accident that the only nitrates foundin surface deposits are encountered in regions where rainfall is scant. The extreme solubilitycannot alone be the answer. The nitrate deposits in California are all encountered in thedissagregated surface of a hard claystone, immediately above the less weathered portion of theclay. More than likely the nitrates were washed down from the more superficial layers; but itmay be possible that the underlying clay exerted an osmotic attraction on such rain water aswet the interface between the disaggregated clays and the hard claystone, removing the waterfrom the nitrates solutes and thus hastening their drying.
9 The study of the development of the crumbly surface on top of the clay during thecourse of a year and the effects of this layer upon evaporation would make an interestingdoctoral thesis.
e Deep coring of the playa would yield considerable information on past climates. It mustbe done with more than ordinary care in order not to overlook periods of dessication of the thelake.
. A careful sectioning of the surface crust should be made at regular and frequentintervals throughout the year and following rainy periods and other weather conditions so thatthe actual distribution of the compounds as a function of their vertical position can bedetermined.
e Test plots using different surface treatments would be worthwhile to see the effects ofadding other ions to the melange.
o The locality is ideal for studying the effects of saltating sands. Collectors coulddetermine the "scale height" of the moving sand as a function of height above ground andparticle size. The long fetch available would make a useful experiment possible, especially if itwere accompanied by use of devices to adjust and regulate the wind flow.
e Ample opportunity exists to study means of stabilizing sand by use of vegetation or othertechniques.
* Opportunity exists to consider the development of halophytic plants for landreclamation purposes and to develop boron-tolerant species, if such be possible.
* Owens Lake would be a fine site to study the effects of vibration on clays and todetermine how clays could be mobilized for engineering purposes.
This list could go on indefinitely. We will probably not be able to return to this problemor to do as much as this interesting and valuable area would tempt us to. Others will, wehope, find it worthwhile to rise to the challenge.
63

NWC TP 6731
COMMENTS ON DESERTS
It is well to try to learn how to handle situations such as the dust problem on OwensLake. Some new thinking and considerable effort is needed. Any process by which land isreturned to some reasonable use that is itself adapted to the climate can yield benefits tohumanity at large, since large portions of the earth's surface are now virtually useless foragricultural purposes. As the drying trend of the last 9,000 years continues, more land will beadded to the world's deserts. Land now held to be useful or marginally useful will becomemuch less so.
Attempts to put deserts into agricultural production, without the importation of water,have been notably successful, but only for a short time. Whenever the water balance of aregion is disturbed by massive use of groundwater, in excess of recharge, the same thing hashappened: the culture that has depended upon the locally supplied irrigation expands farbeyond what can be supported for a very long time and eventually collapses. The groundwateris soon used up, leaving dessicated fields from which even desultory breezes remove soil.
This process has been rampant in India for the last century. The Rahjastan Desert is nowgrowing by kilometers per year. The air pollution resulting from the removal of dust from thatsurface approaches 5 tons per square kilometer. This pollution has in turn changed theweather. As the situation worsens with the passage of time, and with nothing done to correctit, the desert will eventually spread throughout the whole of the Ganges plain.
In Eygpt the annual floods of the Nile havv. now been controlled bv the High Aswan Dam.with the result that groundwater recharge has been reduced downstream. The soil has beendeprived of its annual enrichment, and large areas of salinization of the top soil havedeveloped. Worse, during the post-war period, exploration led to the discovery of vastquantities of groundwater beneath the Sahara. This soon led to increased agriculturaldevelopment, which some 40 years later has resulted in the depletion of most of thegroundwater and a serious decrease in the arability of the land, Well-meant plans that do notconsider long-term factors often lead to unforeseen consequences that make matters worse.
Lake Aral is a brackish water body in southwest central Soviet Asia, with an original areaof about 26,000 square miles. Withdrawal of water from the Amu and Svr Dary'va Rivers hascaused the level of the Aral Sea to drop some 10 meters between 1975 and 1984. Dust stormsare developing from the northeast shores of the lake and from the dessicated lake bottom.Streams of dust up to 500 kilometers in length and 4,000 meters in height have been noted insatellite photographs. The dust particles appear to be mainly in the 1.75 to 4.2 micron sizerange (Kondratyev et al. 1985).
Whenever the consumptive use of water exceeds the annual recharge, trouble develops.Taken out of context, the famous quotation from Isaiah (35:1), "The wilderness and thesolitary place shall be glad for them; and the desert shall rejoice. and blossom as the rose." haslead to widespread hope-and justification-for development of desert regions. The desert mayindeed be made to bloom as a rose, but only until consumptive use of water exceeds thesustainable perennial yield-unless water can be imported from some \vater-rich region, whichis the opposite of what is happening now in Owens Valley.
64

NWC TP 6731
The situation in Owens Lake, originally created by local irrigation projects andaggravated by export of water to the City of Los Angeles, would have developed in apy casewith the passage of time as the climate continued to dry. If, on the other hand, the rainfallwere to increase for a protracted period, even with water export, the lake might refill. Tobring this about would take only a change from a 5-inch-per-year rainfall to a 10-inch rainfall.As it is, in the odd year when rainfall is abundant, the LADWP dumps water into the lakepartially filling it.
The certain recurrence of protracted rainy periods will once again fill the lake, perhapsnot to overflowing, but certinly enough to change the nature of our problem. Such eventshave occurred within the last 2,000 years, when, for example, the north playa of PanamintValley was filled by runoff from its own internal drainage. This point is being dramaticallydemonstrated in Utah, where Great Salt Lake is filling beyond its banks and creating asituation that may or may not be correctable, and correctable only at enormous cost. Thismakes it necessary to consider that any surface treatment not be such that it would create otherproblems in the event of a refilling of the lake by runoff. This comment would also apply toany desert playa in the western United States that might be considered as a logical place for awaste dump.
The Owens valley has a series of problems of unbelievable complexity that derive from thepeculiar way law is generated in California. During a series of lawsuits in the 1930s and 40s,the Natural Soda Products Co. was trying to prevent the LADWP from releasing water into thelake bed. The reason for dumping the water is that the water flow is needed to produceelectricity and that storage farther down stream can not receive the water fast enough tosustain the electrical production. The soda company was informed that not only was LosAngeles permitted to dump water into the lake, it was obligated to do so because that is wherethe water would have gone if it had not been diverted in the first place (Kahrl 1982, p. 378 etseq.). This sort of policy, based on legalistic reasoning, is not likely to lead to a sensibledevelopment of the water resources of a region or to the solution of environmental problems,and is certain to cause economic hardship and discontent. The courts eventually found that theNatural Soda Products Co. should be compensated for damages to their plant.
California water law is complicated and difficult to understand or to apply. Intrusion intothe scene of federal agencies and district regulatory bodies does little to clarify the law. In 1906President Roosevelt decreed that the water taken from Owens Valley could not be sold toanyone outside the Los Angeles area. In 1945 a new California statute prohibited the wastingof the water from Mono Basin and Owens Valley by the LADWP. In 1950 the courts onceagain permitted the LADWP to release even more water into the lakebed than the LADWPhad in the Natural Soda Products case, but only after all reasonable attempts had been madeto use the water. Each addition or amendment to California's water laws has been promotedby special interest groups, to meet a particular perceived threat or need, without regard to thetotal impact of this collection of conflicting provisions. The problem is aggravated by suchdraconian decisions as the Supreme Court's distribution of Colorado River water, whichallocated vast quantities to Arizona and thus created great difficulties for Southern California.
The problem involving Owens Lake is further complicated by accident of ownership.triginally the lake and the river were under control of the Army Corps of Engineers because
65

NWC TP 6731
the lake and river were navigable waterways. Subsequently, the lake was given to theCalifornia State Lands Commission, which leases portions of it to various groups. The dustproblem, therefore, properly belongs to the State of California-even though the LADVPusually gets the credit for it. So far, the level of cooperation between the several agenciesinvolved has been high, and the state legislature has tried to help by passing acts grantingmoney to build sand fences, etc.
We have no doubt that the production of the dust can be controlled. We are also sure thatsuch an effort will be of great benefit elsewhere. To accomplish this end. an eclectic approachto the problem is necessary, and only the willing, whole-hearted cooperation of the severalagencies involved can make this possible. In the years since our first paper on the subjectappeared (Reinking et al. 1975), a new attitude of wholesome cooperation has emerged. Itmust continue.
Intelligent use of the desert has untold benefits for mankind. Careless use of the desert iscertain to lead to a worsening of worldwide conditions. We are looking at an example of suchpractice in Owens Valley and the Mono Basin. By learning how to cope with the problems thatarise, it may be possible not only to rectify those situations, but, on a larger scale, to improveconditions elsewhere to the point where some marginal regions of the earth's surface maybecome useful again. Climate depends upon land use. as land use depends upon climate. It willbe a challenge for future generations to master this interaction and to bring about better use ofthe earth.
66

NWC TP 6731
ACKNOWLEDGEMENTS
Many people have given freely of their time and talent in helping us prepare thisdocument.We will start with those within NWC and its predecessor, the Naval Ordnance TestStation. This study was started by Dr. Roger Reinking (Reinking et al. 1975). He calledattention to the Owens Lake dust problem and he contributed impetus to finishing this studyeven after he left to work for the Department of Commerce. Dr. Ward "Ed'" Hindmanaccompanied the senior author on flights to photograph the phenomena. Dr. Sheldon D. Elliottdrew on his enormous background in Owens Valley and made several field studies of theproblems there. Dr. Roland von Huene made considerable input to our understanding of thestructural geology and the problems of playas in general. Dr. Carl Austin discussed thegeochemistry with us. Kenreth Pringle made his X-ray diffraction apparatus available andidentified many of the minerals. Oreste W. Lombardi, on the basis of his work in SalineValley, laid the foundation for our understanding of the geochemistry of playas. TommyWright, Royal Gould, and John Gibson helped us understand the wind and weather patterns.Harold Cronin helped with many of the laboratory efforts and prepared apparatus for us. Dr.Glenn Roquemore accompanied us on several field trips and arranged for the placement ofcameras to study the sources of the dust.
The geochemistry was worked out in detail by Camille Gaines during her visit to NWC asa summer student; her logic diagram helps in understanding the dependence of the storms onweather conditions. Professor David Rein worked with us on the hydrology of the lake. PerrieBarnes helped us research the history of Owens Valley. Gene P. Saint-Amand and David C. H.Saint-Amand accompanied us on many field trips, took photographs, collected data, and dugholes.
Considerable encouragement came from Rear Admiral R. G. "Doc" Freeman III whoenabled us to continue into what was then troubled waters. Mr. Burrell Hays, as NWVCTechnical Director, made it possible to enjoy the services of Miss Gaines and Prof. Rein.
The Environmental Branch of the Public Works Department at NWC has spared no effortsin helping us. Dr. Tom McGill, Tom Campbell, Raymond Kelso. Michael Stoner, Thomas)odson, and several others all made contributions. James Manion of the Test and Evaluation
Directorate also suggested ideas.
Dr. George I. Smith of the United States Geological Survey, who has been working on thegeochemistry of the saline water body and the pluvial history of the region, has shared hisknowledge with us on many occasions and made his own data freely available. Mr. W. R.Moyle, Jr.. retired hydrologist with the Geological Survey, has helped us immeasurably onseveral occasions with his knowledge of the hydrology, history, and structural geology of theregioii,.Dr. George E. Ericksen, an old field partner from the salares and salitreras of Chile,discussed many of the aspects of playas with us.
67

NWC TP 6731
Members of the Ridgecrest medical community, including Drs. Bruce Chandler, JackSchrader, Robert Gilmer, Robert Hamblin, and Dennis Welcome, have added to ourunderstanding of the health effects of the dust.
Other members of the Owens Valley Task force have showed the cooperation that hasbecome the hallmark of the new progressive attitude toward solving complicated regionalproblems. William McClung and Paul A. Lamos of Lake Minerals Corp. aided us in coring thesediments in the lake bed and shared their knowledge of the geochemisty of the western sump.Cathy Goss of Lone Pine and Bruce Kuebler, Mark J. Aldrian, Duane Georgeson, and anumber of others from the Los Angeles Department of Water and Power have aided in manyways.
The Great Basin Air Pollution Control District provided samples of the dust taken withtheir high-volume samplers. On many occasions, Charles Fryxell, William Cox, EllenHardbeck, and Larry Cameron furnished support and encouragement.
Although we have shamelessly borrowed from these and many others, we do not mean toimply that all or any of them agree with all or any of this paper. One's point of viewsometimes depends on one's interests. We have tried to avoid making pejorative comments,rekindling old disputes, or drawing moral conclusions. We hope that the contents of this paperwill enable others to go ahead, develop a better understanding of the dust problem, and moreeffectively deal with government agencies in putting the problem, further research, andpossible solutions into clearer perspective.
68

NWC TP 6731
REFERENCES
Alderman, S. S., Jr., The Control of Dust at Owens Dry Lake. AIM, Inc., San Carlos, CA,1980. 6 pp., map and figure.
Axelrod, D. I. Post Pliocene Uplift of the Sierra Nevada, California Geological Society ofAmerica Bulletin, Volume 73, 1962. Pp. 183-198.
Bachman, S. B. Depositional and Structural History of the Waucobi Lake Bed Deposits, OwensValley, California. Master of Science Thesis in Geology, University of California, LosAngeles, CA, UCLA, 1974.
"Pliocene-Pleistocene Break-up of the Sierra Nevada-White-Inyo Mountains Blockand Formation of Owens Valley." Geology, Volume 6, 1978. Pp. 4661-463.
Barone, J. B., B. H. Kusko, L. Ashbaugh, and T. A. Cahill. A Study of Ambient Aerosols inthe Owens Valley Area. Air Quality Group, University of California, Davis, CA, UCD,1979. 37 pp. Numerous graphs and tables. (Final Report to the California Air ResourcesBoard on Contract No. A7-178-30.)
Batchelder, G. L. Post-Glacial Fluctuations in Lake Level in Adobe Valley, Mono County,California. In American Quaternary Association First Biennial Meeting Abstracts, p. 7.Bozeman, MT, 1970.
Bernasovskii, V. Y. Natural Dehydration of Mirabilite, Vol. 10, No. 12 (Whole No. 105).Vestnik Akademii Nauk Kazakhskoi S.S.R, 1953. Pp. 87-90.
Bespalov, N. D. Pochvy Mongol'skoi Narodnoi Respubilik (Soils of Outer Mongolia).Izdatel'stov Akademii Nauk S.S.R., Moscow, 1951. Issued in translation by Israel Programfor Scientific Translations, Jerusalem, 1964. 328 pp.
Brady, F. D., and T. A. Cahill. Development of X-Ray Fluorescence Analysis and Application.Report to National Science Foundation, Crocker Nuclear Laboratory, University ofCalifornia, Davis, CA, UCD, 1973. 117 pp. (Report No. UCD-CNL166.)
Carroz, J. W., F. K. Odencrantz, and W. G. Finnegan. Generation of Fumes SimulatingParticulate Air Pollutants. Environmental Protection Series. Environmental ProtectionAgency, Research Triangle Park, NC, EPA, 1977. 86 pp. (Report No. EPA600/2-77-1132.)
69

NWC TP 6731
Carver, G. A. Quaternary Tectonism and Surface Faulting in the Owens Lake Basin,California. Mackay School of Mines, University of Nevada, Reno, NV, UN, 1970. P. 103.(Technical Report AT-2.)
"Shoreline Deformation at Owens Lake." California Geology. Volume 28,p. 111, 1967.
Chalfant, W. A. The Story of Inyo. Chalfant Press, Lone Pine, CA, 1933. 430 pp.
Chatard, T. M. Natural Soda, Its Occurrence and Utilization. USGS Bulletin 60, 1890.Pp. 27-101.
"Analyses of Waters of Some Ancient Alkaline Lakes." American Journal ofScience, 3rd Series, Vol. 36, 1888. Pp. 146-150.
Clarke, F. W. The Data of Geochemistry, 2nd Edition. USGS Bulletin 491, 1911. P. 58.
Clarke, F. W. The Data of Geochemistry, 5th Edition. USGS Bulletin 770, 1924. P. 841.
Cook, D. D., and M. Kerker. "Response Calculations for Light-Scattering Aerosol ParticleCounters." Applied Optics, Volume 14, Number 3, 1975. Pp. 734-739.
D'Ans, J. Die Losungsgleichgewichte der Systeme der Salse Oceanischer Salzablagerungen.Kali-Forrschungs-Anstalt G.m.b.H., Berlin, Verlagsgellschaft Fur Ackerbau M.B.H.,Berlin SWll, Dessauer Strasse 31, 1933. 254 pp.
Dasmann, R. F. The Destruction of California. Collier, New York, 1968. 223 pp.
The Data of Geochemistry, 5th Edition. USGS Bulletin 770, 1924. P. 841.
Driessen, P. M., and R. Schoorl. "Mineralogy and Morphology of Salt Efflorescences on SalineSoils in the Great Konya Basin," Turkey Journal of Soil Science, Vol. 24, No. 4, 1973. Pp.436-442.
Droste, J. B. Clay Minerals in Sediments of Owens, China. Searles, Panamint. Bristol, Cadizand Danby Lake Basins, California. GSA Bulletin, Volume 72, Nov. 1961. Pp. 1713-1722.
Dub, G. D. Owens Lake-Source of Sodium Minerals. New York. NY, American Institute ofMining and Metallurgical Engineers, 1946. Pp. 1-13. (Technical Publication No. 2235.)
Earl, G. C. The Enchanted Valley and Other Sketches. Arthur H. Clark Co.. Glendale. CA.1976. 160 pp.
Eugster, H. P. "Sodium Carbonate-Bicarbonate Minerals as Indicators of PCO2." Journal ofGeophysical Research, Vol, 71, No. 14, 1966. Pp. 3369-3377.
"Origin and Deposition of Trona." Contrib. to Geology, Vol.10. No.l. 1971.Pp. 49-55.
70

NWC TP 6731
Eugster, H. P., and Blair F. Jones, "Gels Composed of Sodium-Aluminum Silicate,Lake Magadi, Kenya." Science, Volume 161, 12 July 1968. Pp. 160-163.
Eugster, H. P., and G. I. Smith. "Mineral Equilibria in the Searles Lake Evaporites."California Journal of Petrology. Vol. 6, 1965. Pp. 473-522.
Fairbanks, H. W. "Notes on the Geology of Eastern California." American Geologist, Volume17, 1896. P. 69.
Foshag, XV. F. "Saline Lakes of the Mojave Desert Region." Economic Geology, Volume 21,1926. Pp. 56-64.
Friedman, . G. 1. Smith, and K. G. Hardeastle. "Studies of Quaternary Saline Lakes:Isotopic and Compositional Changes During Desiccation of the Brines in Owens lake,California 1969-1871." Geochimica et Cosmochimica Acta, Vol. 40, 1976. Pp. 501-511.
Gale, H. S. "Salines in the Owens, Searles and Panamint Basins, Southeastern California."Contributions to Economic Geologt,. 1913. USGS, 1914. 323 pp., 88 figures. (Part I-LBulletin 580-L.)
Glennie, K. W. Desert Sedimentary Environments. Elsevier Publishing Company, Amsterdam,1970. 2f.2 pp,
Gould. R. C. A Case History of the Unusual Southern California Windstorm of 26 March 1970.China ake, CA. Naval Weapons Center, 1970. (Unpublished.)
Henshaw, F H. D. McGlashan, and E. A. Porter. Surface Water Supply of the United States,1911. 1"irt X. The Great Basin. USGS, 1913. P. 78. (Water Supply Paper 310.)
Hobbs, XV. H. "The Earthquake of 1872 in Owens Valley. California." Bietrage zurGeophy,.k, BD X, Heft 3, 1910. Pp. 352-385.
Hobbs. P. C . L. F. Radke. and E. E. Hindman It. "An Integrated Airborne Particle SamplingFacility and Its Preliminary Use in Aerosol Studies." Journal of Atmospheric Sciences,1975.
Hsu. K. J. and C. Siegenthaler. "'Preliminary Experiments on Hydrodynamic MovementInduce( by Evaporation and Their Bearing on the Dolomite Problem." Sedimentology.Vol. V, 1969. Pp. 11-25.
Jones. B. F. "Stability of Burkeite and .ts Significance in Lacustrine Evaporites." Journal ofGcophyical Research, Vol. 67, No. 9. 1962. Pp, 3569-3580.
Kahrl. W. L. Water and Power. University of California Press. Berkeley and Los Angeles, CA,1982. 574 pp.
Knapp. S. A. Occrrrence and Treatment of the Carbonate of Soda Deposits of the Great Basin.\lining and Scientific Press, Nov. 5, 1898. P. 448.
71

NWC TP 6731
Knopf, A. A Geologic Reconnaissance of the Inyo Range and the Eastern Slope of the SierraNevada, California, With a Section of the Stratigraphy of the Inyo Range by Edwin Kirk.USGS, 1918. 110 pp. (Professional Paper 1043.)
Kondratyev, K-Ya, A. A. Grigoryev, V. F. Zhvalev, and V. V. Melentyev. "Multi-SidedStudies of Dust Storms in the Aral Region." Meteorologiya i Gidrolgiya, Vol. 85, No. 14,1985. Pp. 32-38.
Krauter, F. C. The Story of Keeler. Informal Pamphlet. Library, Lone Pine, CA, 1959. 32 pp.
Kusko, B. H., and T. A. Cahill. Study of Particle Episodes at Mono Lake. Air Quality Group,Crocker Nuclear Laboratory, University of California Davis. Davis, CA, UCD, 1984. 52pp, numerous appendices, graphs, and tables. (Final Report to the California AirResources Board, Contract No. A1-144-32.)
Lajoie, K. R. "Quaternary Stratigraphy and Geologic History of Mono Basin, EasternCalifornia." Ph.D. Dissertation, University of California Berkeley, 1968.
Langbein, W. B. Salinity and Hydrology of Closed Lakes. USGS, 1961. 20 pp. Diagrams andtables. (Professional Paper 412.)
Larsen, H. Ecology of Hypersaline Environments in Hypersaline Brines and EvaporiticEnvironments: Proceedings of the Bat Sheva Seminar on Saline Lakes and Natural Brines.Ed. A. Nissenbaum, Elsevier Scientific Publishing Co., Amsterdam, 1980. Pp. 23-39.
le Conte, J. A. "Post Tertiary Elevation of the Sierra Nevada, Shown by River Beds."American Journal of Science, 3rd Series, Vol. 32, 1886. Pp. 167-181.
Lee, C. H. An Intensive Study of the Water Resources of a Part of Owens Valley, California.USGS, 1913. (Survey Water Supply Paper 294.)
Lee, W. T. Geology and Water Resources of Owens Valley, California. USGS, 1906. (WaterSupply Paper 181.)
Lines, G. C. Hydrology and Morphology of the Bonneville Salt Flats and Pilot Valley Playa,Utah. USGS, 1979. (Water Supply Paper 205734.)
Loeffler, R. M. An Ecological Study of Mono Lake, California. University of California atDavis, D.W. Winkler, Editor. Davis, CA, UCD, 1977. Pp. 23-26. (Institute of EcologyPublications Number 12.)
Loew, 0. The Owens Lake, lnyo County, California, Annual Report, West of the 100thMeridian. USGS, 1876. Pp. 189-190.
Los Angeles Department of Water and Power. Environmental Impact Report on IncreasedPumping of the Owens Valley Ground-Water Basin, Volume II, Part B-Ill-1. LosAngeles, CA, DWP, 1976.
. Communication to Mr. Gerry Budlong, Planning Department, County of Invo.Los Angeles, CA, DWP, 1985.
72

NWC TP 6731
Lundgren, D. A. "Mass Distribution Data from the 1969 Pasadena Smog Experiment." Journalof Air Pollution Contributors Association, Vol 17, 1972. Pp. 225-229.
Lundhohn, B. Ecology and Dust Transport; Chapter 3, In Saharan Dust. Christer Morales, ed.John Wiley and Sons, NY, 1977. 297 pp.
Lynch, H. B. Rainfall and Stream Run-off in Southern California Since 1769. Los Angeles,CA, The Metroplitan Water District of Southern California. August 1931. 31 pp. 8 Figs,4 Appendixes.
Mayo, E. B. "The Pleistocene Long Valley Lake in Eastern California." Science, Volume 80,Number 2063, 27 July 1934. Pp. 95-96.
McCormac, B. M. Introduction to the Scientific Study of Air Pollution. R. Reidel, Dordrecht-Holland, 1971. Pp. 100-102.
McGlashan, H. S., and H. J. Dean. Water Resources of California Part III StreamMeasurements in the Great Basin and Pacific Coast River Basins. USGS, 1913. (WaterSupply Paper 30044.)
Middleton, W. E. K. Vision Through the Atmosphere. University of Toronto Press. Toronto,1963.
Nadeau, R. A. The Water Seekers. Peregrine Smith, Inc., Santa Barbara, CA, 1950. 278 pp.
Newcomb, T. W. Agricultural and Industrial Survey of Inyo County, California. CaliforniaDevelopment Board of San Francisco. Unpublished typewritten manuscript done for theBoard of Supervisors of Inyo County, June and July 1917.
Noll, K. E., P. K. Mueller, and M. Imada. "Visibility and Aerosol Concentration in UrbanAir." Atmospheric Environment, Volume 2, 1968. Pp. 465-475.
Pakiser, L.C., M. F. Kane, and W. H. Jackson. Structural Geology and Volcanism of OwensValley. California-A Geophysical Study. USGS, 1964. 68 pp Maps. (Professional Paper438.)
Patterson, E. M., D. A. Gillete, and G. W. Grams. "The Relation Between Visibility and theSize-Number Distribution of Airborne Soil Particles." Journal of Applied Meteorology,Volume 15, 1976. Pp. 470-478.
PEDCO-Environmental Specialists, Inc. Investigation of Fugitive Dust Sources, Emissions andControl. Report to Environmental Protection Agency; N.I.T.S., 1973. (Report No.APTD- 1582.)
Phillips, J. A. "The Alkaline and Boracic Lakes of California." Popular Science Review,Volume 16, (2nd Series, Vol. 1), London, 1877. Pp. 153-164.
Pueyo Mur, J. J. "La Precipitacion Evaporitica Actual en las Lagunas Saladas del Area,Bujaraloz, Sastago, Caspe, Alcaniz y Calanda (Provincias de Zaragosa y Teruel.)."Geologicas de la Diputation de Barcelona. Volumen 33. Revista del Instituto deInvestigaciones, 1979
73

NWC TP 6731
Reid, J. A. "A Note on the Geology of the Coso Range, Inyo County." California Journal ofGeology, Volume 16, 1908. Pp. 64-72, map and 4 views.
Reinking, R. F., L. A. Mathews, and P. St.-Amand. Dust Storms Due to the Dessication ofOwens Lake. Preprints of International Association Conference on Environmental Sensingand Assessment, September 14-19, Las Vegas, NV, I.E.E.E. Publications, 1975.
Russell, I. C. Quaternary History of Mono Valley. Eighth Annual Report of the USGS, Part 1,USGS, 1889. Pp. 261-294.
St.-Amand, P., and G. R. Roquemore. "Tertiary and Holocene Development of the SouthernSierra Nevada and Coso Range, California." Tectonophysics 52, 1979. Pp. 409-410.
Scholl, D. W., R. von Huene, P. St.-Amand, and J. B. Ridlon. Age and Origin of TopographyBeneath Mono Lake, a Remnant Pleistocene Lake, California. Geological Society ofAmerica Bulletin, Volume 22, 1967. Pp. 583-600.
Sheridan, D. Decertification of the United States Council on Environmental Quality, 1981.
Smith, G. I. "Paleohydrologic Regimes in the Southwestern Great Basin, 0-3.2 Million YearsAgo, Compared with other Long Records of Global Climate." Quaternary Research,Volume 22, 1984. Pp. 1-17.
Smith, G. I. Subsurface Statigraphy and Geochemistry of Late Quaternary Evaporites. SearlesLake, California. USGS, 1979. 1130 pp., 2 plates, 44 figures, 22 tables. (ProfessionalPaper 1043.)
Smith, G. I., V. J. Barczak, G. F. Moulton, and J. C. Liddicott. Core KM-3. a Surface-to-Bedrock Record of Late Cenozoic Sedimentation in Searles Valley, California. USGS,1983. 24 pp., 4 Plates, 6 Figures, 3 Tables. (Professional Paper 1256.)
Smith, G. I., I. Friedman, and R. J. McLaughlin. "Studies of Quarternary Saline Lakes:Mineral, Chemical, and Isotopic Evidence of Salt Solution and Crystallization Processes inOwens Lake, California, 1969-1971." Geochemica et Cosmochemica Acta. (In process.)
Smith, G. I., and W. P. Pratt. Core Logs from Owens, China. Searles and Panamint Basins.California. USGS, 1957. Pp. 1-62. (Bulletin 1045-A.)
Smith, G. I., and Alayne Street-Perrott. "Pluvial Lakes in the Western United States." Chapter10 in Late Quaternary Environments of the United States. H. E. Wright, ed.: Volume 1:"The Late Pleistocene," Stephen C. Porter, ed. Universitv of Minnesota Press,Minneapolis, MN, 1983. Pp. 190-212.
Spurr, J. E. Descriptive Geology of Nevada South of the Fortieth Parallel and AdjacentPortions of California. USGS, 1903. 229 pp. (Bulletin No. 208.)
Stahlhofen, W. J., J. Gebhardt, and J. Heyder. American Industrial Hygene AssociationJournal, Volume 41, 1980. P. 385.
74
I

NWC TP 6731
Stine, S. A Reinterpretation of the 1857 Surface Elevation of Mono Lake. California WaterResources Center, University of California, Davis, CA, UCD, 1981. 41 pp. Maps andgraphs. (Report Number 52.)
Strakhov, N. M. Principles of Lithogenesis, Vol. 13. Plenum Publ. Co., New York, NY, 1970.557 pp. Translated from the Russian.
Task Group on Lung Dynamics. Health Physics, Volume 12, 1966. P 173.
Teeple, J. E. The Industrial Developement of Searles Lake Brines with Equilibrium Data. TheChemical Catalog Company, Inc., New York, NY, 1929. P. 182.
Tew, R. W. Photosynthetic Halophils from Owens Lake. NASA Access No. NASA-CR-361,1966.
"Halotolerant Ectothiorhodospira Survival in Mirabilite; Experiments witha Model of Chemical Stratification by Hydrate Deposition in Saline Lakes."Geomicrobiology Journal, Volume 2, No. 1, 1980, Pp. 13-20.
Thompson, D. G. The Mohave Desert Region, California. A geographic, geologic andhydrologic reconnaissance. USGS, 1929. 536 pp. (Water Supply Paper 578.)
Tolman, C. F. Ground Water. McGraw-Hill Book Company, Inc., New York and London,First Edition, Sixth Impression, 1937. P. 593.
Trowbridge, A. C. "The Terrestrial Deposits of Owens Valley, California." Journal ofGeology, Volume 19, 1911. Pp. 136-163.
von Huene, R. "'Structural Geology and Gravimetery of Indian Wells Valley, SoutheasternCalifornia." Ph.D. Thesis, University of California at Los Angeles, 1960.
Walcott, C. D. "Post Pliocene Elevation of the Inyo Range." Journal of Geology, Volume 5,Number 4. 1897. Pp. 304-348.
Whitbv. K. T., R. B. Husar, and B. Y. Liu. Advances in Instrumentation and Techniques ofAerosol Generation and Measurement. Particle Technology Laboratory, Department ofMechanical Engineering, University of Minnesota, Minneapolis, MN, 1973. 39 pp.(Publication No. 216.)
Wilke, P. J., and H. W. Lawton. The Expedition of Capt. 1. W. Davidson From Fort Tejon tothe Owens Valley in 1859. Ballena Press Publications in Archaeology. Ethnology, andHistory, No. 8. Ballena Press, NM, 1976. 55 pp.
Zinky, W. R. "A New Tool for Air Pollution Control, the Aerosol Particle Counter." Journal ofAir Polution Control Association, Volume 12, 1962. Pp 578-583.
Zbur, R. T. A Geophysical Investigation of Indian Wells Valley, California. Naval OrdnanceTest Station, China Lake, CA, NOTS, 1967. 48 pp. (NOTS TP 2795.)
75

NWC TP 6731
GLOSSARY
Advect-To carry into an area, as of a stream of air being moved into a region by large scalecirculation patterns.
Aeolian-Windblown, as with sand brought in by the wind. Named for the Greek god Aeolus,ruler of the winds.
Adiabatically-Referring to the compression or expansion of a gas without exchange of energywith its surroundings. Adiabatically compressed air is warmed because the same amount ofenergy occupies a lesser space; thus air brought down a mountain slope by the wind iswarmed. Air that rises adiabatically is cooled as it goes up.
Alert level--One of several levels of concern over air pollution as defined by the EnvironmentalProtection Agency.
Alkali-One of several univalent metals such as sodium, potassium, or lithium whose oxidesand/or carbonates are markedly basic. From the Arabic "Al-qili," the ashes of a plant formerlygrown to produce alkalis for soap making. Tumbleweed, Salsola kali, was also formerly grownfor this purpose.
Alkali earths-The oxides of any of several divalent metals such as calcium, strontium, andbarium that produce strongly basic reactions.
Alkali-earth chlorides-Chloride salts of any of the alkali earths. These salts are usually quitesoluble and very hygroscopic.
Amorphous- Without crystalline structure.
Anhydrous-Not containing water as a bound chemical entity.
Artesian wells-Also called flowing wells. Wells in which water comes to the surfacewithout pumping. The hydrostatic head for such water is above ground level, the water beingheld down by some impermeable layer of clay or other material through which it cannotpenetrate.
Biota-The fauna and flora of a region.
Capillary-A narrow space in which liquid can rise because of molecular attraction to the sidesof the space. As an adjective, it describes the process by which liquids can rise in a solidbecause of molecular attraction of the solid for the liquid. Capillary rise is inverselyproportional to the square root of the particle size in sediments, hence on the order of feet inclays and inches in sands.
76

NWC TP 6731
Circulation-Any movement in a rotary fashion, or, less precisely, any mass movement such asthe movement of air in weather systems.
Clastic dike-A crack in soil or rock that has been filled with other material that entered thefissure. Clastic dikes in the lake bed are usually of sand that has fallen or been washed intoopenings in the clay of the playa surface.
Crust-The hardened upper surface of almost anything, here applied to the accumulation ofalkaline and saline materials on the surface of the playa.
Cyclogenesis-The development of a cyclone, or storm system, caused usually by interactionwith rising ground or by exchange of heat with the surface. Any tendency of a storm tointensify as it goes along.
Dihydrate-A chemical compound that has two molecules of water attached to one molecule ofthe parent material. Thus, sodium chloride dihydrate has the form: NaC1.2H 20. The chemicalproperties are not usually changed much, but the density and other physical properties are
Evaporation ponds-Ponds constructed for the purpose of isolating a quantity of liquid so thatthe water therein can be evaporated in order to concentrate the salts dissolved in the water.Used for the production of soda and salt. Also called evaporators.
Evaporites-Minerals formed by evaporation of water from lakes, seas, or other bodies suchthat beds or the evaporites remain behind.
Fanglomerate-Rocks, gravels, and sand that have been deposited in an alluvial fan and havesince become cemented into solid rock.
Fetch-The distance along open land or water over which the wind blows.
Flowing wells-(see Artesian wells)
Graben-A block of land dropped down between two faults. The opposite of a horst.
Great Basin Air Pollution Control District-A governmental agency responsible for measuringthe purity of the air and Ior taking corrective measures to prevent its contamination.
Heat sink-Any body of material that can adsorb large amounts of heat, usually preventing alarge temperature rise in the process.
Hydration-The addition of water molecules to a chemical compound.
Ion-An electrically charged atom or molecule. When a solid capable of disassociation-suchas salt-dissolves, the molecule spiits into ions. Some substances, such as sugar, do not splitupon solution and do not produce ions.
Lake basin-A basin that contains or formerly contained a lake. Usually a closed depression,such as Owens Valley.
Lake brine-Any solution of salts dissolved in water in a lake. The term usually refers to arather strong concentration.
77

NWC TP 6731
Laminar-Anything in layers, from the Latin "lamina," layer. Laminar flow is nonturbulentflow, as applied to the wind when the air is thermodynamically stable.
Lapse rate-The rate at which the temperature of the air "lapses" or changes with altitude. Asair rises it is cooled; as it descends it is warmed, usually about 2.2°C per 1,000 feet in cloud-free air.
Millibar-One bar is the pressure of the atmosphere under standard conditions at sea level,about 14.7 pounds per square inch. A millibar is one one-thousandth of a bar. A unit used inpreparation of weather maps.
Multiply offset-Displacement of any geologic feature in more than one locality by a fault.
National episode criteria-A set of criteria produced by the Federal Government to describeepisodes of air pollution or other types of pollution.
Orographic-Having to do with a mountain or mountains. May refer to winds, clouds, orother weather situations.
Osmosis-A process whereby liquids will move to a region where the concentration of a salt isgreater, or by which the molecules and/or ions of the salt will move toward a region of lesserconcentration.
Particulate load-The weight of solid material suspended as particulate matter, either in gasesor liquids. In air pollution, the particulate load is usually expressed in micrograms of solids percubic meter of air. It may also be expressed in tons per unit area, such as tons per squarekilometer or tons per square mile.
Playa-Spanish for beach, applied to dry desert lakes because they are all beach. In Spanish itmay also mean seashore.
Polder-A track of land reclaimed from a body of water.
Rotor-A term used to describe a horizontal whirlpool that develops in the lee of steepmountain slopes when the wind velocity aloft is high and is usually increasing with altitude.When these violent rotors touch the ground, the wind direction may actually reverse locally,and sand and small gravel is often lofted to considerable height. Turbulence in rotors is quitehazardous to aircraft; the wind on one side may be going up several thousand feet a minuteand down at an equal rate on the other side.
Lake Russell-Ancestral Mono Lake. During Pleistocene, Mono Lake occupied about five timesits present area. The ice age lake has been named Lake Russell for Isreal Russell. who firstdescribed the area for the Geological Survey.
Saltating Sands-Sand particles being moved by the wind in a series of short leaps or bounces.
Septahydrate-A chemical compound in which seven molecules of water are attached to onemolecule of the parent compound.
Silica Gel-A gelatinous solution of sodium silicate. Formerly used for preserving eggs.
78

NWC TP 6731
Solanchak-From Russian, a sodum-rich soil. Usually refers to the puff' "self-rising" surfaceof saline desert playas in which clay particles and sand are mixed with the alkalis.
Solanetz-From Russian, a bluish-black sodium-rich soil in which organic material has beenreduced by the action of sodium carbonate to relatively pure carbon.
Soret Effect-From "Le effet Soret," a French term for a process whereby dissolved solids willmove in the direction of a temperature gradient. Thus in hot weather, salts will movedownward toward cooler soils just below the surface, and in cold weather such salts will movetoward the surface because it is warmer below.
Synoptic Situation-Meteorological term used to describe the weather conditions over a widearea.
Tioga (see Wisconsin)
Total loading-The total of all suspended particulate material above an area.
Wisconsin-The most recent of thp four major glacial advances during the ice age. It beganabout 24,000 years ago and ended about 9,000 years ago. In the west it is called Tioga.
Zonal airflow-Usually refers to the westerly winds developed during fall, winter, and spring,in which the wind flow is roughly parallel to the pressure field, running from west to east.
Sulphate plant-People trom the Owens Lake area refer to a collection of loading ramps,wells, and other debris in the central playa, reached by a road from the east side of the lake asthe "old sulphate plant." It was formerly serviced by a railroad and h, an artesian wellassociated with it.
Lake workings-Usually refers to the operations of Lake Minerals Corp. on the wes side ofOwens lake, near the brine pool.
Pittsburgh Plate Glass Co.-A producer of plate glass that formerly operated an elaborate sodaand borax recovery operation near Bartlett's Point on the west side of Owen,, Lake. Productionceased in the 1950s because the level of the water in the lake could not be stabilized.
Wcstce area-An experimental plot, reached fiom the Lake Minerals compound on the westside of the lake, where the Westec Company attempted vainly to stabilize the dust through theuse of snow fences and the planting of shrubbery.
Xeroph/lt,-A plant that is structurally adapted for life with a limited water supply.
79