
Preclinical Neurochemical and Electrophysiological Profile of 1192U90, A Potential Antipsychotic
Upload
independentCategory
view
0download
0
NOTE
Two-Site Reproducibility of Cerebellar and BrainstemNeurochemical Profiles With Short-Echo, Single-VoxelMRS at 3T
Dinesh K. Deelchand,1* Isaac M. Adanyeguh,2 Uzay E. Emir,1 Tra-My Nguyen,2
Romain Valabregue,2,3,4 Pierre-Gilles Henry,1 Fanny Mochel,2,4,5,6 and G€ulin €Oz1
Purpose: To determine whether neurochemical concentrations
obtained at two MRI sites using clinical 3T scanners can bepooled when a highly optimized, nonvendor short-echo, sin-
gle-voxel proton MRS pulse sequence is used in conjunctionwith identical calibration and quantification procedures.Methods: A modified semi-LASER sequence (TE ¼ 28 ms)
was used to acquire spectra from two brain regions (cerebellarvermis and pons) on two Siemens 3T scanners using the same
B0 and B1 calibration protocols from two different cohorts ofhealthy volunteers (N ¼ 24–33 per site) matched for age andbody mass index. Spectra were quantified with LCModel using
water scaling.Results: The spectral quality was very consistent betweenthe two sites and allowed reliable quantification of at least 13
metabolites in the vermis and pons compared with 3–5metabolites in prior multisite magnetic resonance spectros-
copy trials using vendor-provided sequences. The neuro-chemical profiles were nearly identical at the two sites andshowed the feasibility to detect interindividual differences in
the healthy brain.Conclusion: Highly reproducible neurochemical profiles can
be obtained on different clinical 3T scanners at different sites,provided that the same, optimized acquisition and analysistechniques are used. This will allow pooling of multisite data in
clinical studies, which is particularly critical for rare neurologi-cal diseases. Magn Reson Med 000:000–000, 2014. VC 2014Wiley Periodicals, Inc.
Key words: 3 Tesla; multi-site; reproducibility; spectroscopy
INTRODUCTION
Proton MR spectroscopy (1H MRS) is a noninvasive toolthat allows the measurement of a wide range of biochem-ical compounds in the brain in both health and disease.The method has been demonstrated to be valuable in theevaluation of several common disorders of the centralnervous system, including tumors, neonatal hypoxia-ischemia, inherited metabolic diseases, demyelinatingdisorders, and infectious brain lesions (1). Because meta-bolic alterations are thought to precede structuralchanges, magnetic resonance spectroscopy (MRS) islikely to provide dynamic biomarkers of neuronal dys-function at an earlier stage of disease progression thanstructural MRI. This is of even greater importance fortherapeutic approaches for which a neuroprotectiveeffect is expected. However, unlike structural MRI, MRShas not gained widespread acceptance as a routine clini-cal tool for diagnostic and prognostic purposes (2,3).This is partially due to the relatively large variation inmetabolite concentrations or ratios reported from differ-ent sites (4–9).
As higher magnetic fields are becoming routinelyavailable, the increased sensitivity and resolution theyprovide can benefit metabolite quantification (10–12)and facilitate robust clinical applications of the tech-nique. However, with this potential, the need to stand-ardize robust MRS acquisition and analysis methods iscritical, as also emphasized by the recent MRS Consen-sus Group study (1). Such standardized MRS methodol-ogy would allow pooling of data from multiple sites,which is particularly important for clinical research andclinical trials in rare diseases. Prior multisite MRS trialsprimarily have used vendor-provided MRS sequences(PRESS and STEAM) and were able to quantify 3–5metabolites—such as N-acetylaspartate (NAA), total crea-tine (tCr), total choline (tCho), and myo-inositol (Ins)—atboth 1.5T and 3T (6–9).
Recently, optimized short-echo sequences such as SPE-CIAL (12) and semi-LASER (13) were implemented onclinical platforms, thereby allowing an extended
1Center for Magnetic Resonance Research, Department of Radiology,University of Minnesota, Minneapolis, Minnesota, USA.2INSERM UMR S975, Brain and Spine Institute, Hospital La Salpetriere,Paris, France.3Institut du Cerveau et de la Moelle, Centre de NeuroImagerie de Recherche,Hopital La Salpetriere, Paris, France.4University Pierre and Marie Curie, Paris, France.5AP-HP, Department of Genetic, Hospital La Salpetriere, Paris, France.6Neurometabolic Unit, Hospital La Salpetriere, Paris, France.
Grant sponsor: National Institute of Neurological Disorders and Stroke;Grant number: R01 NS070815; Grant sponsor: Assistance Publique desHopitaux de Paris and the program “Investissements d’avenir”; Grant num-ber: ANR-10-IAIHU-06; Grant sponsor: National Center for ResearchResources; Grant number: P41 RR008079 (CMRR); Grant sponsor: NationalInstitute of Biomedical Imaging and Bioengineering; Grant number: P41EB015894 (CMRR); Grant sponsor: Institutional Center Cores for AdvancedNeuroimaging; Grant number: P30 NS076408 (CMRR).
*Correspondence to: Dinesh K. Deelchand, Ph.D., Center for Magnetic Res-onance Research, University of Minnesota, 2021 6th St SE, Minneapolis,MN 55455, USA. E-mail: [email protected]
Additional Supporting Information may be found in the online version ofthis article.
Current address for Uzay E. Emir: Oxford Centre for Functional MRI of theBrain, John Radcliffe Hospital, University of Oxford, Headington, OxfordOX3 9DU, UK.
Received 3 December 2013; revised 8 April 2014; accepted 25 April 2014
DOI 10.1002/mrm.25295Published online 00 Month 2014 in Wiley Online Library (wileyonlinelibrary.com).
Magnetic Resonance in Medicine 00:00–00 (2014)
VC 2014 Wiley Periodicals, Inc. 1

neurochemical profile consisting of both singlet and J-coupled metabolites to be measured. Therefore, there is aneed to determine the between-site reproducibility ofsuch profiles.
The aim of the present study was to examine the repro-ducibility of metabolite concentrations measured in twobrain regions using a short-echo, single-shot, full-intensity sequence with identical experimental protocolsat two different sites on clinical 3T scanners. A previ-ously described semi-LASER sequence (14) was used toachieve lower apparent T2 relaxation, minimal J-couplingevolution, and smaller chemical shift displacement errorsrelative to the standard PRESS sequence. Two relativelychallenging brain regions were chosen for this two-sitecomparison: the cerebellar vermis and pons (15).
METHODS
Two 3T whole-body Siemens Tim Trio (Siemens MedicalSolutions, Erlangen, Germany) scanners were used inthis study; one located at the Center for Magnetic Reso-nance Research (CMRR) in Minnesota and the other oneat the Institut du Cerveau et de la Moelle (ICM) in Paris.Healthy subjects who were matched for age and bodymass index (Table 1) were enrolled after giving informedconsent according to procedures approved by the Institu-tional Review Board at CMRR and by the local ethicscommittee at ICM. The standard body radiofrequency(RF) coil was used for RF transmission, and the 32-channel phased-array Siemens head coil was used forsignal reception. Soft pads were used to hold each sub-ject’s head in place to minimize head movement in theMR system. T1-weighted MPRAGE images (repetitiontime [TR] ¼ 2530 ms; echo time [TE] ¼ 3.65 ms; flipangle ¼ 7�; slice thickness ¼ 1 mm; 224 slices; field-of-view ¼ 256 � 176 mm2; matrix size ¼ 256 � 256) wereacquired to position the volume-of-interest (VOI) for
MRS measurements. B0 shimming was achieved using anadiabatic version of FAST(EST)MAP (16), which is avail-able as a work-in-progress (WIP) package on the Siemenssystem.
Proton spectra were acquired using a modified semi-LASER sequence (TE ¼ 28 ms; TR ¼ 5 s; 64 averages)(14) from two VOIs: the cerebellar vermis (10 � 25 � 25mm3) and pons (16 � 16 � 16 mm3). Voxel placementwas based on anatomical landmarks. The fourth ventri-cle, cervical spinal cord and the brainstem were used toseparate the cerebellum. The surfaces, lobes, lobules,and fissures of the cerebellum were then used as land-marks in positioning the voxel in the vermis. For ponsVOI placement, the midbrain, fourth ventricle, andmedulla were used as landmarks.
The semi-LASER sequence (14) used in this study is amore compact version of the originally published semi-LASER sequence (17). Briefly, the sequence consisted ofa 2-ms asymmetric slice-selective 90� pulse (18) followedby two pairs of slice selective adiabatic full passagepulses (4 ms duration, HS4 modulation, R25) (19), whichwere interleaved, rather than applied sequentially, toimprove suppression of unwanted coherences withshorter spoiler gradient pulses. Water suppression wasachieved with VAPOR, which was interleaved with outervolume suppression (OVS) to suppress unwanted coher-ences (18). A substantially lower chemical shift displace-ment error is obtained with the semi-LASER sequence(3.6% /ppm for the slice-selective 90� pulse and 2% /ppm for the adiabatic full passage pulses) comparedwith the standard PRESS sequence provided on the Sie-mens platform (12%–13% /ppm).
B1 levels required for localization pulses and for watersuppression were adjusted for each voxel. Specifically,the RF power magnitude for the 90� asymmetric pulsewas calibrated by monitoring the signal intensity whileincreasing the RF power and choosing the RF power set-ting that produced the maximum signal. The power forthe adiabatic full passage pulses was automatically setrelative to the 90� pulse. A similar procedure was per-formed for the water suppression calibration.
On the scanner, signals from individual coil elementswere combined after correcting for phase shifts betweenelements and weighting them based on the coil sensitiv-ities (20) to generate a free induction decay. Each freeinduction decay was then individually saved for shot-to-shot frequency and phase correction before averaging.Two nonsuppressed water spectra were acquired: one foreddy current correction (the RF pulses of the VAPORscheme were turned off) and one for use as reference formetabolite quantification (VAPOR and OVS schemesturned off in order to eliminate magnetization transfereffects). To evaluate the cerebrospinal fluid (CSF) contri-bution to each VOI, fully relaxed unsuppressed watersignals were acquired at different TEs ranging from 28–4000 ms (TR ¼ 15 s) with the entire VAPOR and OVSscheme turned off (21).
All spectral processing was performed in MATLAB bythe same investigator prior to LCModel fitting. Eddy cur-rent correction was performed first to correct for dis-torted line shapes and zero-order phase. Individual shotsaffected by subject motion (based on water suppression
Table 1Demographics and Spectroscopic Parameters Measured in Two
Brain Regions
CMRR ICM Pa
Subjects scanned (N) 24 33
Sex (male/female) 13/11 15/18 0.52b
Age (years) 53 6 15 48 6 13 0.19BMI (kg/m2) 26 6 6 25 6 4 0.47
Vermis n ¼ 24 n ¼ 33Water linewidth (Hz) 8 6 1 7 6 1 0.06
T2 tissue water (ms) 80 6 8 80 6 7 0.93CSF fraction (%) 11 6 5 9 6 4 0.04SNR of NAAc 56 6 5 59 6 9 0.21
Pons n ¼ 16 n ¼ 23Water linewidth (Hz) 8 6 1 8 6 1 0.57T2 tissue water (ms) 67 6 4 68 6 2 0.34
CSF fraction (%) 1 6 1 2 6 2 0.16SNR of NAAc 27 6 5 28 6 6 0.49
Values are presented as the mean 6 standard deviation.aUnpaired, two-tailed Student’s t test except when noted
otherwise.bChi-squared test.cSNR was measured in the frequency domain (defined as peak
height divided by 2 times root mean square noise), and no apod-ization functions were applied to the data.
2 Deelchand et al.

efficiency) were removed. Single-shot frequency correc-tion was performed using a cross-correlation algorithmand phase correction was performed using a least-squarefit algorithm. All steps were completely automatedexcept for the removal of free induction decays affectedby motion. Finally, the summed spectrum was refer-enced based on NAA resonance at 2.01 ppm.
Spectra were then analyzed with LCModel (22) withthe water scaling option (version 6.3-0G). The modelbasis set was generated based on density matrix formal-ism as described previously (23). The basis set alsoincluded macromolecule spectra, which were acquiredusing an inversion-recovery technique in four healthysubjects (total averages ¼ 928; TR ¼ 2.5 s; inversion time¼ 0.75 s; VOI ¼ 15.6 mL; 5 ms duration HS5 inversionpulse; occipital cortex). Due to the shorter T1 relaxationtime of the methylene protons of tCr at 3.93 ppm relativeto other metabolite protons (24), this resonance was pres-ent in the metabolite-nulled macromolecule spectra andwas removed using a Hankel singular value decomposi-tion algorithm in MATLAB. A 12.5-Hz Gaussian linebroadening was also applied to the macromolecule spec-tra after incorporating a reference peak at 0 ppm (Sup-porting Information). No baseline correction, zero-filling,or apodization functions were applied to the in vivo dataprior to the analysis. LCModel fitting (Supporting Infor-mation) was performed over the spectral range from 0.5to 4.2 ppm.
Metabolite concentrations were determined after cor-recting for tissue water content and CSF contributions inthe selected VOI using the water-scaling option inLCModel. The transverse relaxation times (T2) of tissuewater and percent CSF contribution to the VOI wereobtained by fitting the integrals of the unsuppressedwater spectra acquired in each VOI at different TE valueswith a biexponential fit (21), with the T2 of CSF fixed at740 ms based on measurement of T2 of water in a smallvoxel located in ventricles with the same semi-LASERsequence (four healthy subjects; TR ¼ 15 s; VOI ¼ 0.125–0.360 mL; 12 TE values ranging from 28 to 4000 ms), andthree free parameters: T2 of tissue water, amplitude oftissue water, and amplitude of CSF water.
In order to obtain accurate metabolite concentrations,corrections must be made for T2 relaxation of both waterand metabolites. In the case of semi-LASER, T2 relaxa-tion is slowed due to the Carr-Purcell (CP) conditions,and T2 values under CP conditions must be used forquantification. For water, these values can be estimatedby correcting the free precession T2 value measured forthe tissue water signal at different echo times by a fixedfactor to account for CP effects. A previous study com-pared water T2 values measured with LASER and CP-LASER sequences at 4T and 7T (25). Extrapolating fromthat study, we assumed that the T2 of water under CPconditions is 1.5 � longer than the measured free preces-sion T2 at 3T. Signal loss due to T2 relaxation of metabo-lites was neglected, since the apparent T2 is sequence-dependent. This assumption is justified by the fact thatmetabolites have longer T2 such that correction factorswould be small at TE ¼ 28 ms. Nonetheless, this choicewill result in somewhat underestimated metabolite con-centrations relative to the true concentrations in tissue.
A water content of 82% and 72% was used for the ver-mis and pons, respectively (26,27).
Metabolites that were quantified with Cram�er-Raolower bounds (CRLB) �50% from at least half of thespectra from a particular brain region were included inthe neurochemical profile. In addition, if the correlationbetween two metabolites was very high (i.e., if the corre-lation coefficient r was more negative than �0.7) in themajority of the spectra from a region, then only theirsum was reported (e.g., tCr [creatine þ phosphocreatine]and tCho [glycerophosphorylcholine þ phosphorylcho-line]). If there was indication for pairwise correlationwith r from �0.5 to �0.7, then the concentration sum ofthe pair was reported in addition to the individualmetabolites’ concentrations (e.g., NAA, NAAG and totalNAA [tNAA, NAA þ NAAG]), as recommended by theLCModel manual (22). Moreover, spectra with the associ-ated water reference linewidth greater than 10 Hz wereexcluded due to trends observed in overestimating aspar-tate and ascorbate and underestimating glutamate inthese spectra. Water linewidths >10 Hz only occurredfor spectra acquired from the pons region.
RESULTS
Using the modified semi-LASER sequence with identicalparameters and identical B0 and B1 calibration protocolson two 3T scanners, consistently high quality 1H spectrawith comparable peak signal-to-noise ratio (SNR) wereobtained at both sites (Fig. 1A, Table 1). No noticeablebaseline distortions due to insufficient water suppressionor contamination by signals from outside the voxel, suchas out-of-phase lipids, were observed. The peak SNR inthe pons was lower than in the vermis due to the smallervoxel size and lower sensitivity of the receive coil in thisparticularly deep brain region. Examples of LCModel fitsobtained in both regions are illustrated in Figure 1B. Noobvious residual was observed around the 0.9 to 2 ppmregion, suggesting that the macromolecule spectrumacquired from the occipital cortex is appropriate whenfitting spectra from vermis and pons. This finding is con-sistent with a recent study (28), which showed that thedifferences in macromolecule signal between gray andwhite matter regions are relatively small and concludedthat a general macromolecule baseline provides suffi-ciently accurate neurochemical profiles.
At CMRR, pons data were not collected from threesubjects due to poor B0 shimming in two cases and sub-ject movement in one case and five spectra were rejecteddue to the broad linewidth criteria. Similarly at ICM,pons data from eight subjects were not acquired due topoor shimming and two spectra were rejected due tobroad water linewidth. This was consistent with theknown challenges with shimming in the brainstem (29)due to the presence of the sphenoid sinus. All spectrafrom the vermis were used in the final results (Table 1).Motion effects were minimal in this cohort of healthyvolunteers and only one single-shot in the vermis (out of64) was excluded from the sum in one subject due tomotion.
No statistical differences were observed in the spectralquality metrics (i.e., water peak linewidth and SNR), as
Reproducibility of Neurochemical Profiles at 3T 3

well as tissue water T2 values between the two sites in bothbrain regions (Table 1). CSF fraction was found to beslightly higher in the vermis VOI from CMRR relative to
ICM (P ¼ 0.04). As expected, the T2 of tissue water in ponswas shorter compared with that in vermis consistent withthe fact that pons consists mainly of white matter (30).
FIG. 1. a: Typical proton spectra obtained from the cerebellar vermis and pons in two different subjects at the two sites using semi-
LASER (TE ¼ 28 ms, TR ¼ 5 s, 64 averages) at 3T. The locations of the VOI are shown on the T1-weighted images. Spectra were proc-essed with a 1-Hz exponential decay and 5-Hz Gaussian functions. Comparable spectral quality and pattern are apparent for eachregion at both sites. b: LCModel fits of the spectra shown in panel A without any apodization functions. Top to bottom: the in vivo spec-
trum, the fit, the residual after subtracting the fit from the in vivo spectrum, and the baseline. [Color figure can be viewed in the onlineissue, which is available at wileyonlinelibrary.com.]
4 Deelchand et al.
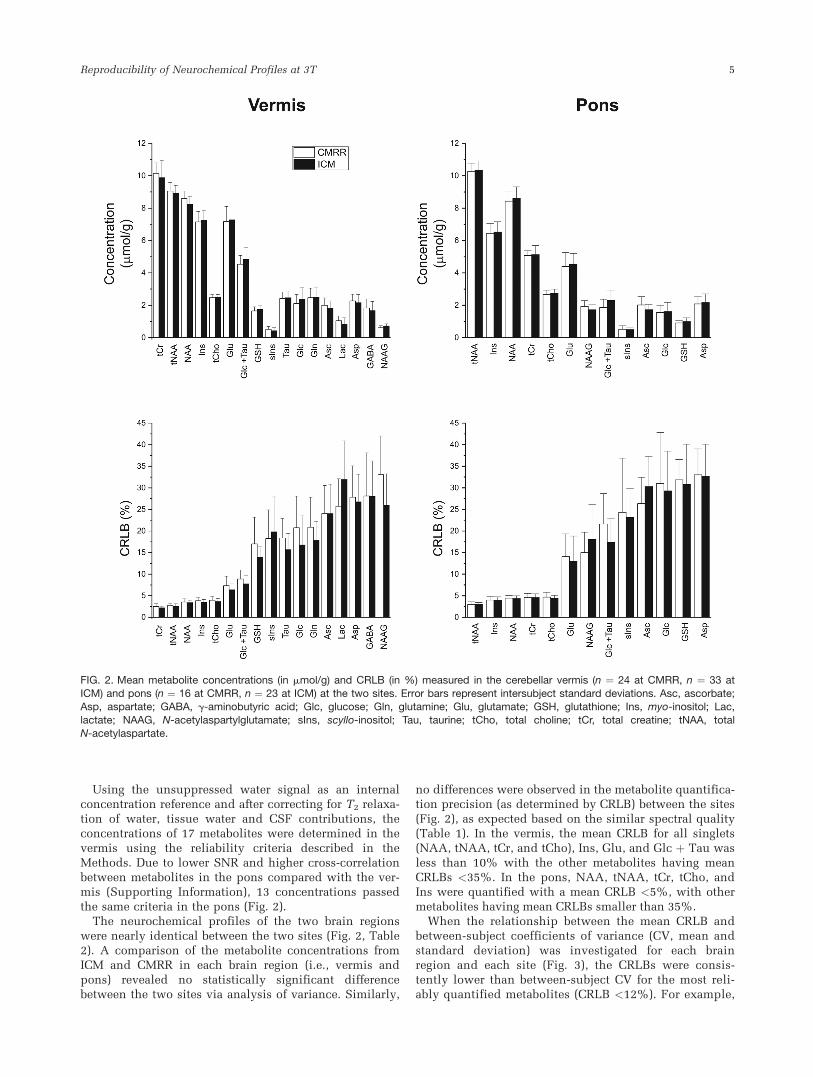
Using the unsuppressed water signal as an internalconcentration reference and after correcting for T2 relaxa-tion of water, tissue water and CSF contributions, theconcentrations of 17 metabolites were determined in thevermis using the reliability criteria described in theMethods. Due to lower SNR and higher cross-correlationbetween metabolites in the pons compared with the ver-mis (Supporting Information), 13 concentrations passedthe same criteria in the pons (Fig. 2).
The neurochemical profiles of the two brain regionswere nearly identical between the two sites (Fig. 2, Table2). A comparison of the metabolite concentrations fromICM and CMRR in each brain region (i.e., vermis andpons) revealed no statistically significant differencebetween the two sites via analysis of variance. Similarly,
no differences were observed in the metabolite quantifica-tion precision (as determined by CRLB) between the sites(Fig. 2), as expected based on the similar spectral quality(Table 1). In the vermis, the mean CRLB for all singlets(NAA, tNAA, tCr, and tCho), Ins, Glu, and Glc þ Tau wasless than 10% with the other metabolites having meanCRLBs <35%. In the pons, NAA, tNAA, tCr, tCho, andIns were quantified with a mean CRLB <5%, with othermetabolites having mean CRLBs smaller than 35%.
When the relationship between the mean CRLB andbetween-subject coefficients of variance (CV, mean andstandard deviation) was investigated for each brainregion and each site (Fig. 3), the CRLBs were consis-tently lower than between-subject CV for the most reli-ably quantified metabolites (CRLB <12%). For example,
FIG. 2. Mean metabolite concentrations (in mmol/g) and CRLB (in %) measured in the cerebellar vermis (n ¼ 24 at CMRR, n ¼ 33 at
ICM) and pons (n ¼ 16 at CMRR, n ¼ 23 at ICM) at the two sites. Error bars represent intersubject standard deviations. Asc, ascorbate;Asp, aspartate; GABA, g-aminobutyric acid; Glc, glucose; Gln, glutamine; Glu, glutamate; GSH, glutathione; Ins, myo-inositol; Lac,
lactate; NAAG, N-acetylaspartylglutamate; sIns, scyllo-inositol; Tau, taurine; tCho, total choline; tCr, total creatine; tNAA, totalN-acetylaspartate.
Reproducibility of Neurochemical Profiles at 3T 5
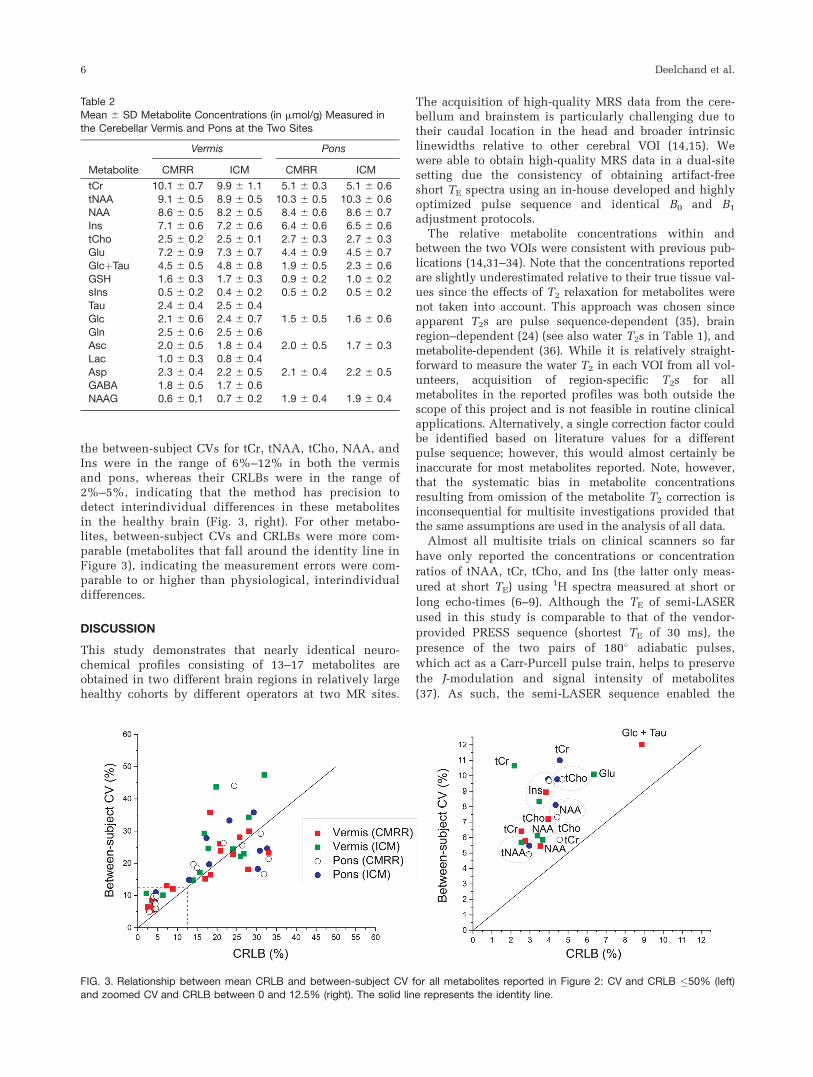
the between-subject CVs for tCr, tNAA, tCho, NAA, andIns were in the range of 6%–12% in both the vermisand pons, whereas their CRLBs were in the range of2%–5%, indicating that the method has precision todetect interindividual differences in these metabolitesin the healthy brain (Fig. 3, right). For other metabo-lites, between-subject CVs and CRLBs were more com-parable (metabolites that fall around the identity line inFigure 3), indicating the measurement errors were com-parable to or higher than physiological, interindividualdifferences.
DISCUSSION
This study demonstrates that nearly identical neuro-chemical profiles consisting of 13–17 metabolites areobtained in two different brain regions in relatively largehealthy cohorts by different operators at two MR sites.
The acquisition of high-quality MRS data from the cere-bellum and brainstem is particularly challenging due totheir caudal location in the head and broader intrinsiclinewidths relative to other cerebral VOI (14,15). Wewere able to obtain high-quality MRS data in a dual-sitesetting due the consistency of obtaining artifact-freeshort TE spectra using an in-house developed and highlyoptimized pulse sequence and identical B0 and B1
adjustment protocols.The relative metabolite concentrations within and
between the two VOIs were consistent with previous pub-lications (14,31–34). Note that the concentrations reportedare slightly underestimated relative to their true tissue val-ues since the effects of T2 relaxation for metabolites werenot taken into account. This approach was chosen sinceapparent T2s are pulse sequence-dependent (35), brainregion–dependent (24) (see also water T2s in Table 1), andmetabolite-dependent (36). While it is relatively straight-forward to measure the water T2 in each VOI from all vol-unteers, acquisition of region-specific T2s for allmetabolites in the reported profiles was both outside thescope of this project and is not feasible in routine clinicalapplications. Alternatively, a single correction factor couldbe identified based on literature values for a differentpulse sequence; however, this would almost certainly beinaccurate for most metabolites reported. Note, however,that the systematic bias in metabolite concentrationsresulting from omission of the metabolite T2 correction isinconsequential for multisite investigations provided thatthe same assumptions are used in the analysis of all data.
Almost all multisite trials on clinical scanners so far
have only reported the concentrations or concentration
ratios of tNAA, tCr, tCho, and Ins (the latter only meas-
ured at short TE) using 1H spectra measured at short or
long echo-times (6–9). Although the TE of semi-LASER
used in this study is comparable to that of the vendor-
provided PRESS sequence (shortest TE of 30 ms), the
presence of the two pairs of 180� adiabatic pulses,
which act as a Carr-Purcell pulse train, helps to preserve
the J-modulation and signal intensity of metabolites
(37). As such, the semi-LASER sequence enabled the
Table 2Mean 6 SD Metabolite Concentrations (in mmol/g) Measured in
the Cerebellar Vermis and Pons at the Two Sites
Metabolite
Vermis Pons
CMRR ICM CMRR ICM
tCr 10.1 6 0.7 9.9 6 1.1 5.1 6 0.3 5.1 6 0.6
tNAA 9.1 6 0.5 8.9 6 0.5 10.3 6 0.5 10.3 6 0.6NAA 8.6 6 0.5 8.2 6 0.5 8.4 6 0.6 8.6 6 0.7Ins 7.1 6 0.6 7.2 6 0.6 6.4 6 0.6 6.5 6 0.6
tCho 2.5 6 0.2 2.5 6 0.1 2.7 6 0.3 2.7 6 0.3Glu 7.2 6 0.9 7.3 6 0.7 4.4 6 0.9 4.5 6 0.7
GlcþTau 4.5 6 0.5 4.8 6 0.8 1.9 6 0.5 2.3 6 0.6GSH 1.6 6 0.3 1.7 6 0.3 0.9 6 0.2 1.0 6 0.2sIns 0.5 6 0.2 0.4 6 0.2 0.5 6 0.2 0.5 6 0.2
Tau 2.4 6 0.4 2.5 6 0.4Glc 2.1 6 0.6 2.4 6 0.7 1.5 6 0.5 1.6 6 0.6
Gln 2.5 6 0.6 2.5 6 0.6Asc 2.0 6 0.5 1.8 6 0.4 2.0 6 0.5 1.7 6 0.3Lac 1.0 6 0.3 0.8 6 0.4
Asp 2.3 6 0.4 2.2 6 0.5 2.1 6 0.4 2.2 6 0.5GABA 1.8 6 0.5 1.7 6 0.6NAAG 0.6 6 0.1 0.7 6 0.2 1.9 6 0.4 1.9 6 0.4
FIG. 3. Relationship between mean CRLB and between-subject CV for all metabolites reported in Figure 2: CV and CRLB �50% (left)and zoomed CV and CRLB between 0 and 12.5% (right). The solid line represents the identity line.
6 Deelchand et al.

quantification of at least 13 metabolites in the pons and
vermis at each site, thereby showing the feasibility of
consistently measuring J-coupled metabolites in addition
to singlet metabolites between different sites.Multisite trials utilizing 1H MRS have been challeng-
ing due to large variations in reported metabolite concen-
trations between sites, even within each site. In such
investigations the within-site CVs ranged between 2%
and 30% and between-site CVs were between 2% and
35% for singlet metabolites (5,6,9). These reproducibility
issues might be related to various factors such as the
quality of the raw spectral data, number of subjects stud-
ied, reference used for quantification, or the stability of
the MR scanner. On the other hand, multisite studies
that have used metabolite ratios (e.g., tNAA/tCr or
tNAA/tCho) have reported lower within-site CV of less
than 10% (38,39). Although quantifying ratios does not
require corrections for T2 and water content and there-
fore is easier, it does not provide a clear understanding
on how individual metabolites change under different
pathological conditions. For instance, tCr concentration,
which is generally used as an internal reference, was
reported to change in various neurological conditions
(40,41).In the present study, we took the more challenging
approach of water scaling (also referred to as “absolute”
quantification). The within-site CV for singlet metaboliteconcentrations was between 6% and 12% (Fig. 3), which
lies in the lower end of the CV range reported in prior
multisite investigations. Furthermore, the mean CRLBs,which indicate quantification precision, were substan-
tially lower (3%–5%) than CVs for these metabolites,
indicating that the CV is dominated by between-subjectdifferences rather than measurement errors. This demon-
strates the feasibility of detecting interindividual differ-
ences in the healthy brain at high field, consistent withour prior experience at 4T and 7T (11). Similarly, a
recent two-site 3T MRS imaging study using semi-
LASER reported mean CRLBs of �6% for tNAA, tCr,tCho, and Ins in selected gray and white matter VOI in
the cerebrum and also demonstrated lower within-
subject variation in these metabolites than between-subject variation (13). No between-site CVs are reported
in the present study, since different subjects were
scanned at each site. However, since the percent differ-ence in metabolite concentrations between sites was very
small, the between-site CV is also expected to be low.The semi-LASER sequence was developed and opti-
mized (i.e., spoiler gradients and OVS parameters) atCMRR prior to the transfer to the ICM site. The onlyrequirements to successfully run the spectroscopysequence was to adjust the first- and second-order shimsusing FAST(EST)MAP and to calibrate the RF powerrequired for the 90� and water suppression pulses. Thisstep was done in each study for each VOI locationbecause the standard slice-based voltage adjustmentdone by the scanner once at the beginning of the scan-ning session often under/overestimates the RF powerrequired in the selected VOI. The MRS data acquiredat the two sites using widely available commercialhardware demonstrates that nonvendor, ready-to-use MRS
sequences can be shared among sites, generating highlyreproducible spectral quality. This is expected to facilitaterobust, multisite MRS trials where large numbers of data-sets can be acquired in a relatively short time.
The main limitation of the current study was that thereproducibility of neurochemical profiles was tested attwo sites using an MR scanner and hardware from thesame vendor. For more generalized conclusions, it is crit-ical to investigate across-vendor reproducibility of neuro-chemical profiles in larger multisite investigations. Suchefforts were reported recently in abstract form (42).Another limitation was the need to manually initiate thevoxel-specific B1 calibrations; automating these steps asdone in standard vendor-provided packages is feasibleand will be important for seamless application in theclinical environment.
CONCLUSION
This dual-site study shows that a wide range of metabo-lites (singlet and J-coupled) can be quantified on clinical3T scanners with highly reproducible neurochemicalprofiles using an in-house developed and highly opti-mized pulse sequence. These profiles can be pooled inmultisite investigations provided that the same acquisi-tion and analysis techniques are used at all sites.
Furthermore, within each site, the between-subjectcoefficients of variance for singlet resonances and myo-inositol were substantially higher than their CRLBs, indi-cating precision to detect interindividual differences inthe healthy brain.
ACKNOWLEDGMENTS
We thank Diane Hutter for assistance with subjectrecruitment; Petr Bedna�r�ık for providing the measuredT2 value of CSF; Ivan Tk�ac for discussions about theLCModel control parameter choices; Lynn Eberly for chi-square statistics; and the staff of the Center for MRResearch for maintaining and supporting the MR sys-tems. Dinesh K. Deelchand, Isaac M. Adanyeguh, FannyMochel, and G€ulin €Oz contributed equally to the study.
REFERENCES
1. €Oz G, Alger J, Barker P, et al. Clinical proton MR spectroscopy in
central nervous system disorders: the MRS Consensus Group. Radiol-
ogy 2014;270:658–679.
2. Wattjes MP. Structural MRI. International Psychogeriatrics 2011;
23(Supplement S2):S13–S24.
3. Hentschel F, Kreis M, Damian M, Krumm B, Frolich L. The clinical
utility of structural neuroimaging with MRI for diagnosis and differ-
ential diagnosis of dementia: a memory clinic study. Int J Geriat Psy-
chiatry 2005;20:645–650.
4. Komoroski RA, Kotrla KJ, Lemen L, Lindquist D, Diaz P, Foundas A.
Brain metabolite concentration ratios in vivo: multisite reproducibil-
ity by single-voxel 1H MR spectroscopy. Magn Reson Imaging 2004;
22:721–725.
5. Traber F, Block W, Freymann N, et al. A multicenter reproducibility
study of single-voxel 1H-MRS of the medial temporal lobe. Eur Radiol
2006;16:1096–1103.
6. Jessen F, Gur O, Block W, et al. A multicenter 1H-MRS study of the
medial temporal lobe in AD and MCI. Neurology 2009;72:1735–1740.
7. Chard DT, Parker GJM, Griffin CMB, Thompson AJ, Miller DH. The
reproducibility and sensitivity of brain tissue volume measurements
derived from an SPM-based segmentation methodology. J Magn Reson
Imaging 2002;15:259–267.
Reproducibility of Neurochemical Profiles at 3T 7

8. Keevil SF, Barbiroli B, Brooks JCW, et al. Absolute metabolite quanti-
fication by in vivo NMR spectroscopy: II. A multicentre trial of proto-
cols for in vivo localised proton studies of human brain. Magn Reson
Imaging 1998;16:1093–1106.
9. Vavasour I, Laule C, Meyers S, M€adler B, Harris T, Li D, Traboulsee
A, MacKay A. Cross-site reproducibility of 1H-MRS. Proc Intl Soc
Mag Reson Med 2010;18:2008.
10. Deelchand DK, Iltis I, Henry P-G. Improved quantification precision
of human brain short echo-time 1H magnetic resonance spectroscopy
at high magnetic field: a simulation study. Magn Reson Med 2013.
doi: 10.1002/mrm.24892.
11. Tkac I, Oz G, Adriany G, Ugurbil K, Gruetter R. In vivo 1H NMR
spectroscopy of the human brain at high magnetic fields: metabolite
quantification at 4T vs. 7T. Magn Reson Med 2009;62:868–879.
12. Mekle R, Mlyn�arik V, Gambarota G, Hergt M, Krueger G, Gruetter R.
MR spectroscopy of the human brain with enhanced signal intensity
at ultrashort echo times on a clinical platform at 3T and 7T. Magn
Reson Med 2009;61:1279–1285.
13. Wijnen JP, van Asten JJA, Klomp DWJ, Sjobakk TE, Gribbestad IS,
Scheenen TWJ, Heerschap A. Short echo time 1H MRSI of the human
brain at 3T with adiabatic slice-selective refocusing pulses; reprodu-
cibility and variance in a dual center setting. J Magn Reson Imaging
2010;31:61–70.
14. €Oz G, Tkac I. Short-echo, single-shot, full-intensity proton magnetic
resonance spectroscopy for neurochemical profiling at 4 T: validation
in the cerebellum and brainstem. Magn Reson Med 2011;65:901–910.
15. €Oz G. MR spectroscopy in health and disease. In: Manto M, Gruol
DL, Schmahmann JD, Koibuchi N, Rossi F, eds. Handbook of the Cer-
ebellum and Cerebellar Disorders. Vol 1. New York, NY: Springer
Dordrecht; 2013:713–733.
16. Gruetter R, Tkac I. Field mapping without reference scan using asym-
metric echo-planar techniques. Magn Reson Med 2000;43:319–323.
17. Scheenen TWJ, Klomp DWJ, Wijnen JP, Heerschap A. Short echo
time 1H-MRSI of the human brain at 3T with minimal chemical shift
displacement errors using adiabatic refocusing pulses. Magn Reson
Med 2008;59:1–6.
18. Tkac I, Starcuk Z, Choi IY, Gruetter R. In vivo 1H NMR spectroscopy
of rat brain at 1 ms echo time. Magn Reson Med 1999;41:649–656.
19. Tannus A, Garwood M. Improved performance of frequency-swept
pulses using offset-independent adiabaticity. J Magn Reson Series A
1996;120:133–137.
20. Natt O, Bezkorovaynyy V, Michaelis T, Frahm J. Use of phased array
coils for a determination of absolute metabolite concentrations. Magn
Reson Med 2005;53:3–8.
21. Ernst T, Kreis R, Ross BD. Absolute quantitation of water and metab-
olites in the human brain. I. Compartments and water. J Magn Reson
Series B 1993;102:1–8.
22. Provencher SW. Estimation of metabolite concentrations from local-
ized in vivo proton NMR spectra. Magn Reson Med 1993;30:672–679.
23. Deelchand DK, Henry P-G, Ugurbil K, Marjanska M. Measurement of
transverse relaxation times of J-coupled metabolites in the human
visual cortex at 4 T. Magn Reson Med 2012;67:891–897.
24. Traber F, Block W, Lamerichs R, Gieseke J, Schild HH. 1H metabolite
relaxation times at 3.0 Tesla: measurements of T1 and T2 values in
normal brain and determination of regional differences in transverse
relaxation. J Magn Reson Imaging 2004;19:537–545.
25. Bartha R, Michaeli S, Merkle H, Adriany G, Andersen P, Chen W,
Ugurbil K, Garwood M. In vivo 1H2O T2þ measurement in the
human occipital lobe at 4T and 7T by Carr-Purcell MRI: detection of
microscopic susceptibility contrast. Magn Reson Med 2002;47:742–750.
26. Siegel GJ (ed.). Basic neurochemistry: molecular, cellular and medical
aspects. Lippincott-Raven Publishers: Philadelphia, PA, 1999.
27. Randall L. Chemical topography of the brain. J Biol Chem 1938;124:
481–488.
28. Schaller B, Xin L, Gruetter R. Is the macromolecule signal tissue-
specific in healthy human brain? A 1H MRS study at 7 Tesla in the
occipital lobe. Magn Reson Med 2013. doi: 10.1002/mrm.24995.
29. Pouwels PJW, Frahm J. Regional metabolite concentrations in human
brain as determined by quantitative localized proton MRS. Magn
Reson Med 1998;39:53–60.
30. Frahm J, Bruhn H, Gyngell ML, Merboldt KD, Hanicke W, Sauter R.
Localized proton NMR spectroscopy in different regions of the
human brain in vivo. Relaxation times and concentrations of cerebral
metabolites. Magn Reson Med 1989;11:47–63.
31. €Oz G, Hutter D, Tkac I, Clark HB, Gross MD, Jiang H, Eberly LE,
Bushara KO, Gomez CM. Neurochemical alterations in spinocerebel-
lar ataxia type 1 and their correlations with clinical status. Mov Dis-
ord 2010;25:1253–1261.
32. Baker EH, Basso G, Barker PB, Smith MA, Bonekamp D, Horska A.
Regional apparent metabolite concentrations in young adult brain
measured by 1H MR spectroscopy at 3 Tesla. J Magn Reson Imaging
2008;27:489–499.
33. Michaelis T, Merboldt KD, Bruhn H, Hanicke W, Frahm J. Absolute
concentrations of metabolites in the adult human brain in vivo: quan-
tification of localized proton MR spectra. Radiology 1993;187:219–
227.
34. Mascalchi M, Brugnoli R, Guerrini L, Belli G, Nistri M, Politi LS,
Gavazzi C, Lolli F, Argenti G, Villari N. Single-voxel long TE 1H-MR
spectroscopy of the normal brainstem and cerebellum. J Magn Reson
Imaging 2002;16:532–537.
35. Michaeli S, Garwood M, Zhu XH, DelaBarre L, Andersen P, Adriany
G, Merkle H, Ugurbil K, Chen W. Proton T2 relaxation study of water,
N-acetylaspartate, and creatine in human brain using Hahn and
Carr-Purcell spin echoes at 4T and 7T. Magn Reson Med 2002;47:
629–633.
36. Xin L, Gambarota G, Mlynarik V, Gruetter R. Proton T2 relaxation
time of J-coupled cerebral metabolites in rat brain at 9.4 T. NMR
Biomed 2008;21:396–401.
37. Allerhand A. Analysis of Carr-Purcell spin-echo NMR experiments
on multiple-spin systems. I. The effect of homonuclear coupling. J
Chem Phys 1966;44:1–9.
38. Currie S, Hadjivassiliou M, Wilkinson I, Griffiths P, Hoggard N. Mag-
netic resonance spectroscopy of the normal cerebellum: what degree
of variability can be expected? The Cerebellum 2013;12:205–211.
39. Lee PL, Yiannoutsos CT, Ernst T, et al. A multi-center 1H MRS study
of the AIDS dementia complex: validation and preliminary analysis. J
Magn Reson Imaging 2003;17:625–633.
40. Vrenken H, Barkhof F, Uitdehaag BMJ, Castelijns JA, Polman CH,
Pouwels PJW. MR spectroscopic evidence for glial increase but not
for neuro-axonal damage in MS normal-appearing white matter.
Magn Reson Med 2005;53:256–266.
41. €Oz G, Iltis I, Hutter D, Thomas W, Bushara KO, Gomez CM. Distinct
neurochemical profiles of spinocerebellar ataxias 1, 2, 6, and cerebel-
lar multiple system atrophy. The Cerebellum 2011;10:208–217.
42. van de Bank BL, Emir UE, Boer VO, van Asten JJA, Wijnen JP, Kan
HE, €Oz G, Klomp DWJ, Scheenen TWJ. Multi-center reproducibility
of short echo time single voxel 1H MRS of the human brain at 7T
with adiabatic slice-selective refocusing pulses. Proc Intl Soc Mag
Reson Med 2013:3982.
8 Deelchand et al.
Copyright © 2022 FDOKUMEN


![3T[WXaX^cbPX\TSc^VPX] U^aTXV]\TSXPPccT]cX^]](https://static.fdokumen.com/doc/165x107/633431d762e2e08d49028554/3twxaxcbpxtscvpx-uatxvtsxppcctcx.jpg)