REM Sleep Deprivation Reverses Neurochemical and Other Depressive-Like Alterations Induced by...
12
REM Sleep Deprivation Reverses Neurochemical and Other Depressive-Like Alterations Induced by Olfactory Bulbectomy Maira J. Maturana & Cláudia Pudell & Adriano D. S. Targa & Laís S. Rodrigues & Ana Carolina D. Noseda & Mariana H. Fortes & Patrícia dos Santos & Cláudio Da Cunha & Sílvio M. Zanata & Anete C. Ferraz & Marcelo M. S. Lima Received: 5 February 2014 /Accepted: 17 April 2014 # Springer Science+Business Media New York 2014 Abstract There is compelling evidence that sleep deprivation (SD) is an effective strategy in promoting antidepressant ef- fects in humans, whereas few studies were performed in relevant animal models of depression. Acute administration of antidepressants in humans and rats generates a quite similar effect, i.e., suppression of rapid eye movement (REM) sleep. Then, we decided to investigate the neurochemical alterations generated by a protocol of rapid eye movement sleep depri- vation (REMSD) in the notably known animal model of depression induced by the bilateral olfactory bulbectomy (OBX). REMSD triggered antidepressant mechanisms such as the increment of brain-derived neurotrophic factor (BDNF) levels, within the substantia nigra pars compacta (SNpc), which were strongly correlated to the swimming time (r =0.83; P <0.0001) and hippocampal serotonin (5-HT) content (r =0.66; P =0.004). Moreover, there was a strong correlation between swimming time and hippocampal 5-HT levels (r =0.70; P =0.003), strengthen the notion of an antide- pressant effect associated to REMSD in the OBX rats. In addition, REMSD robustly attenuated the hippocampal 5-HT deficiency produced by the OBX procedure. Regarding the rebound (REB) period, we observed the occurrence of a sustained antidepressant effect, indicated mainly by the swim- ming and climbing times which could be explained by the maintenance of the increased nigral BDNF expression. Hence, hippocampal 5-HT levels remained enhanced in the OBX group after this period. We suggested that the neurochemical complexity inflicted by the OBX model, counteracted by REMSD, is directly correlated to the nigral BDNF expression and hippocampal 5-HT levels. The present findings provide new information regarding the antidepressant mechanisms triggered by REMSD. Keywords REM sleep deprivation . Bulbectomy . Intranigral . Dopamine . Substantia nigra pars compacta . Parkinson’ s disease Introduction The German psychiatrist Walter Schulte (1910–1972) intro- duced today’ s practice of treating patients with depressive disorders with sleep deprivation (SD) [1]. Thus, there is com- pelling evidence that SD is an effective strategy in promoting antidepressant effects in humans [2–6]. Whereas only few studies were performed in relevant animal models of depres- sion [7–10], therefore many questions regarding the antide- pressant mechanism triggered by SD still remain. According to Vogel, rapid eye movement (REM) sleep deprivation (REMSD) fits the criteria for being the mecha- nism of action of the antidepressant drugs. Hence, REMSD by itself improves endogenous depression; that M. J. Maturana : C. Pudell : A. D. S. Targa : L. S. Rodrigues : A. C. D. Noseda : M. H. Fortes : P. dos Santos : A. C. Ferraz : M. M. S. Lima Laboratório de Neurofisiologia, Departamento de Fisiologia, Universidade Federal do Paraná, Curitiba, PR, Brazil C. Da Cunha Laboratório de Fisiologia e Farmacologia do Sistema Nervoso Central, Departamento de Farmacologia, Universidade Federal do Paraná, Curitiba, PR, Brazil S. M. Zanata Laboratório de Neurobiologia, Departamento de Patologia Básica, Universidade Federal do Paraná, Curitiba, PR, Brazil M. M. S. Lima (*) Setor de Ciências Biológicas, Departamento de Fisiologia, Universidade Federal do Paraná, Av. Francisco H. dos Santos s/n, ZIP: 81.531-990Caixa Postal: 19031, Curitiba, Paraná, Brazil e-mail: [email protected] M. M. S. Lima e-mail: [email protected] Mol Neurobiol DOI 10.1007/s12035-014-8721-x
Transcript of REM Sleep Deprivation Reverses Neurochemical and Other Depressive-Like Alterations Induced by...

REM Sleep Deprivation Reverses Neurochemical and OtherDepressive-Like Alterations Induced by Olfactory Bulbectomy
Maira J. Maturana & Cláudia Pudell & Adriano D. S. Targa & Laís S. Rodrigues &
Ana Carolina D. Noseda & Mariana H. Fortes & Patrícia dos Santos &
Cláudio Da Cunha & Sílvio M. Zanata & Anete C. Ferraz & Marcelo M. S. Lima
Received: 5 February 2014 /Accepted: 17 April 2014# Springer Science+Business Media New York 2014
Abstract There is compelling evidence that sleep deprivation(SD) is an effective strategy in promoting antidepressant ef-fects in humans, whereas few studies were performed inrelevant animal models of depression. Acute administrationof antidepressants in humans and rats generates a quite similareffect, i.e., suppression of rapid eye movement (REM) sleep.Then, we decided to investigate the neurochemical alterationsgenerated by a protocol of rapid eye movement sleep depri-vation (REMSD) in the notably known animal model ofdepression induced by the bilateral olfactory bulbectomy(OBX). REMSD triggered antidepressant mechanisms suchas the increment of brain-derived neurotrophic factor (BDNF)levels, within the substantia nigra pars compacta (SNpc),which were strongly correlated to the swimming time(r=0.83; P<0.0001) and hippocampal serotonin (5-HT)content (r=0.66; P=0.004). Moreover, there was a strong
correlation between swimming time and hippocampal 5-HTlevels (r=0.70; P=0.003), strengthen the notion of an antide-pressant effect associated to REMSD in the OBX rats. Inaddition, REMSD robustly attenuated the hippocampal 5-HTdeficiency produced by the OBX procedure. Regarding therebound (REB) period, we observed the occurrence of asustained antidepressant effect, indicated mainly by the swim-ming and climbing times which could be explained by themaintenance of the increased nigral BDNF expression. Hence,hippocampal 5-HT levels remained enhanced in the OBXgroup after this period. We suggested that the neurochemicalcomplexity inflicted by the OBX model, counteracted byREMSD, is directly correlated to the nigral BDNF expressionand hippocampal 5-HT levels. The present findings providenew information regarding the antidepressant mechanismstriggered by REMSD.
Keywords REMsleepdeprivation .Bulbectomy . Intranigral .
Dopamine . Substantia nigra pars compacta . Parkinson’sdisease
Introduction
The German psychiatrist Walter Schulte (1910–1972) intro-duced today’s practice of treating patients with depressivedisorders with sleep deprivation (SD) [1]. Thus, there is com-pelling evidence that SD is an effective strategy in promotingantidepressant effects in humans [2–6]. Whereas only fewstudies were performed in relevant animal models of depres-sion [7–10], therefore many questions regarding the antide-pressant mechanism triggered by SD still remain.
According to Vogel, rapid eye movement (REM) sleepdeprivation (REMSD) fits the criteria for being the mecha-nism of action of the antidepressant drugs. Hence,REMSD by itself improves endogenous depression; that
M. J. Maturana :C. Pudell :A. D. S. Targa : L. S. Rodrigues :A. C. D. Noseda :M. H. Fortes : P. dos Santos :A. C. Ferraz :M. M. S. LimaLaboratório de Neurofisiologia, Departamento de Fisiologia,Universidade Federal do Paraná, Curitiba, PR, Brazil
C. Da CunhaLaboratório de Fisiologia e Farmacologia do Sistema NervosoCentral, Departamento de Farmacologia, Universidade Federal doParaná, Curitiba, PR, Brazil
S. M. ZanataLaboratório de Neurobiologia, Departamento de Patologia Básica,Universidade Federal do Paraná, Curitiba, PR, Brazil
M. M. S. Lima (*)Setor de Ciências Biológicas, Departamento de Fisiologia,Universidade Federal do Paraná, Av. Francisco H. dos Santos s/n,ZIP: 81.531-990Caixa Postal: 19031, Curitiba, Paraná, Brazile-mail: [email protected]
M. M. S. Limae-mail: [email protected]
Mol NeurobiolDOI 10.1007/s12035-014-8721-x

the improvements produced by REMSD and by theantidepressant drugs have the same magnitude and sametime course; that both within and across drugs, individ-ual differences in antidepressant efficacy are positivelyrelated to the REMSD produced by the drugs [11]. In addition,it was observed that the acute administration of fluoxetine inrats generated a quite similar effect to other antidepressants,i.e., suppression of REM sleep [10].
In general, improvement can be detected for all signs andsymptoms of depression [5] including a rapid increase in thelevels of serum brain-derived neurotrophic factor (BDNF) ofpatients subjected to 48 h of total SD [2]. However, it has alsobeen known that some patients only react to SD after noctur-nal sleep rebound [12]. A number of biological markersindicate that endogenous depression is associated with a gen-eral decrease in serotonergic and noradrenergic central neuro-transmissions [13]. REMSD is thought to modulate serotoner-gic [14] and dopaminergic neurotransmission [15–17]. Elec-trophysiological activity of serotonergic neurons in the nucle-us raphe dorsalis [18] as well as serotonin (5-HT) release athippocampus are maximal during wakefulness, reduced dur-ing slowwave sleep, and minimal during REM sleep (see [13]for review). Thus, 5-HT being released during wakefulnessinhibits sleep facilitatory or sleep-executive neurons, mostlythrough post-synaptic serotonergic receptors [19].
These observations, together with the fact that most anti-depressant drugs inhibit REM sleep, have led to the theorythat REM sleep pressure is enhanced in depressed patients[20, 5, 13]. Then, we decided to investigate the neurochemicalalterations generated by the REMSD in the notably knownanimal model of depression induced by the bilateral olfactorybulbectomy (OBX) [21]. To test this rationale, we performedneurochemical quantifications of dopamine (DA), noradrena-lin (NA), and 5-HT, as well as its metabolites levels within thestriatum and hippocampus of OBX rats submitted to REMSDand sleep rebound (REB). Then we evaluated the effects ofREMSD on depressive-like behaviors assessed through theopen-field and forced swimming tests. Lastly, nigral levels ofBDNFwere determined in both REMSD and REB paradigms.
Material and Methods
Animals
Male Wistar rats from our breeding colony weighing 280–320 g at the beginning of the experiments were used. Theanimals were randomly housed in groups of five in polypro-pylene cages with wood shavings as bedding and maintainedin a temperature-controlled room (22±2 °C) on a 12-h light–dark cycle (lights on at 7:00 AM). The animals had free accessto water and food throughout the experiment.
Ethics Statement
The studies were carried out in accordance with the guidelinesof the Committee on the Care and Use of Laboratory Animals,United States National Institutes of Health. In addition, theprotocol complies with the recommendations of Federal Uni-versity of Paraná and was approved by the Institutional EthicsCommittee (approval ID no. 607).
Stereotaxic Surgery
Ratswere anesthetizedwith intramuscular xylazine (60mg/kg;Syntec do Brasil Ltda, Brazil) and intramuscular ketamine(4 mg/kg; Syntec do Brasil Ltda, Brazil) and were givenintramuscular penicillin G-procaine (0.1 mL, 5,000,000 U in5 mL; Ariston Laboratory, Brazil) to avoid infection. OBXwas accomplished by making a 2-cm rostral-caudal midlineincision in the scalp, and drilling burrs into the skull 8 mmrostral of bregma and 2 mm lateral of midline, and also3.5 mm rostral of bregma and 2 mm lateral of midline, withthe aim of opening a window in the rat skull to access theolfactory bulb (modified from [22]). These structures wereremoved by aspiration with a vacuum pump, and the skin wassutured; sham-operated animals were just sutured, with theolfactory bulbs being left intact. Behavioral testing began after20 days of surgical recovery. Rats whose frontal cortex werephysically damaged or in which bulbectomy was incompletewere discarded from the study.
REMSD Procedure
REMSD was attained by means of the single platform meth-od. Rats were individually placed on a circular platform(6.5 cm in diameter) in a cage (23×23×30 cm) filled withwater up to 1 cm below the platform level. At the onset of eachREM sleep episode, the animal experiences a loss of muscletonus and falls into the water, thus being awakened. Whenplatforms of this size are used, REM sleep is completelyeliminated [23]. Throughout the study, the experimental roomwas maintained at controlled conditions (22±2 °C, 12 h light/dark cycle, lights on 7:00 a.m.). The control group was kept inthe same room as the REMSD rats during the study. Food andwater were provided ad libitum by placing chow pellets in adispenser positioned inside the cage and water bottles on agrid located on top of the tank.
Experimental Design
Before the stereotaxic surgeries, the animals were distributedrandomly in six groups: sham control (n=20–22), OBX con-trol (n=20–22), sham REMSD (n=20–22), OBX REMSD(n=20–22), sham REB (n=20–22), and OBX REB(n=20–22). Stereotaxic surgeries were performed on day zero
Mol Neurobiol

and the depressive-like behaviors were investigated throughthe modified forced swimming test, initially on day 21(control period of observation), followed by the open-fieldtest (9:00 to 12:00 AM). Subsequently, we carried out theREMSD procedure for 72 h and immediately after that weconducted the animals (9:00 to 12:00 AM) to the forcedswimming and open-field tests, respectively (REMSD periodof observation). Without delay, after these tests, the animalswere decapitated for a striatal, nigral, and hippocampal stan-dardized dissection for neurochemical and molecular pur-poses. A corresponding route was completed directly after a24 h of REB (REB period of observation) with the remaininganimals that were not behaviorally tested in the first section.
Open-Field Test
The apparatus consists of a circular arena (1 m of diameter)limited by a 40-cm-high wall and illuminated by four 60-Wlamps situated 100 cm above the arena floor, providing illumi-nation around 300 lx [24]. The animals were gently placed in thecenter of the arena and were allowed to freely explore the areafor 5 min. During the experiments, the open-field was videorecorded and the measures for ambulatory distance, mean ve-locity, and ambulatory paths were computed online by an imageanalyzer (Smart Junior, PanLab, Harvard Apparatus, Spain).
Modified Forced Swimming Test
The procedure used was a modification of the method pro-posed by [25, 26]. The test was conducted in two sessions.First, in the training session, the rats were placed in a tank(20×20×40 cm) containing water at a temperature of 24±1 °C at a depth of 30 cm for 15 min. Twenty-four hours afterthe training session, the rats were subjected to the forcedswimming test for 5 min, which was video recorded forsubsequent quantification of the following parameters: immo-bility (defined as the lack of motion of the whole bodyconsisting only of the small movements necessary to keepthe animal’s head above the water); climbing (vigorous move-ments with forepaws in and out of the water, usually directedagainst the wall of the tank) and swimming (was coded whenlarge forepaw movements displacing the body around thecylinder, more than necessary to merely keep the head abovethe water). The water was changed after each animal to avoidthe influence of substance and temperature.
BDNF Immunoassay
Quantification of nigral BDNF was performed with a two-siteenzyme-linked immunosorbent assay with the method forBDNF extraction from rat brain tissue described by [27]. Ratswere decapitated, and the substantia nigra was rapidly dissect-ed, placed on dry ice, and stored at −80 °C. Prior to analysis,
an initial tissue homogenisation (volume, 1:10w/v) with lysisbuffer containing 100 mM Tris–HCl (pH 7.2), 400 mMNaCl,4 mM EDTA, 0.05 % sodium azide, 0.5 % gelatin, 0.2 %Triton X-100, 2 % bovine serum albumin, 1 mMphenylmethylsulfonylfluoride, 1 mM N-ethylmaleimide, and2.5 mM phenantroline was performed with short sonicationpulses for 15 s. After 40 min on ice, the homogenates werecentrifuged (11,000×g, 20 min, 4 °C), and the supernatant wascollected. Dilutions of nigral (1:12) extracts were used for theanalysis of BDNF concentration [27], determined with thePromega BDNF Emax Immunoassay System (Promega,Madison, WY, USA) according to the manufacturer’sinstructions. Absorbance was measured at 450 nm. Allstandards and salts were purchased from Sigma.
Quantification of Neurotransmitters, Metabolites,and Turnovers
The striatum and the hippocampus of the rats were rapidlydissected, placed on dry ice, and stored at −80 °C until theneurochemical quantification. The endogenous concentrationsof DA, 3,4-dihydroxyphenylacetic acid (DOPAC),homovanillic acid (HVA), 5-HT, 5-hydroxyindoleacetic acid(5-HIAA), NA, and dihydroxyphenylglycol (DHPG) wereassayed by reverse-phase high-performance liquid chroma-tography (HPLC) with electrochemical detection.
Briefly, the system consisted of a Synergi Fusion-RP C-18reverse-phase column (150×4.6 mm i.d., 4-μm particle size)fitted with a 4×3.0 mm pre-column (Security Guard Car-tridges Fusion-RP); an electrochemical detector (ESACoulochem ΙΙΙ Electrochemical Detector) equipped with aguard cell (ESA 5020) with the electrode set at 350 mV anda dual electrode analytical cell (ESA 5011A); a LC-20ATpump (Shimadzu) equipped with a manual Rheodyne 7725injector with a 20-μL loop. The columnwas maintained insidein a temperature-controlled oven (25 °C). The cell containedtwo chambers in series: each chamber including a porousgraphite coulometric electrode, a double counter electrode,and a double reference electrode. Oxidizing potentials wereset at 100 mV for the first electrode and at 450 mV for thesecond electrode. The tissue samples were homogenized withan ultrasonic cell disrupter (Sonics) in 0.1 M perchloric acidcontaining sodiummetabisulfite 0.02 % and internal standard.After centrifugation at 10,000×g for 20 min at 4 °C, 20 μL ofthe supernatant was injected into the chromatograph.
The mobile phase, used at a flow rate of 1 mL/min, had thefollowing composition: 20 g citric acid monohydrated(Merck), 200 mg octane-1-sulfonic acid sodium salt(Merck), 40 mg ethylenediaminetetraacetic acid (EDTA)(Sigma), 900 mL HPLC-grade water. The pH of the bufferrunning solution was adjusted to 4.0 then filtered through a0.45-μm filter. Methanol (Merck) was added to give a finalcomposition of 10 % methanol (v/v). The neurotransmitters
Mol Neurobiol

and metabolites concentrations were calculated using standardcurves that were generated by determining in triplicate theratios between three different known amounts of the internalstandard. The unit was expressed as nanogram per gram ofwet weight.
Statistical Analysis
Homogeneity of variance was assessed by the Bartlett test andnormal distribution of the data by the Kolmogorov–Smirnovtest. Differences between groups were analyzed by two-wayanalysis of variance (ANOVA)—with REMSD as thebetween-subjects factor, OBX as the within-subjects factorand interaction between these factors as the interaction fac-tor—followed by the Bonferroni post hoc test. Pearson’scorrelation coefficients (r) were calculated to establish rela-tionships between neurochemical and behavioral parametersor molecular and neurochemical or behavioral and molecularparameters. Values are expresses as mean±standard error ofmean (SEM). The level of significance was set at P≤0.05.
Results
Open-Field Test
As can be seen in Fig. 1a, the OBX control group demonstrat-ed a significant increase in the distance traveled compared tothe sham control (P<0.01), OBX REMSD (P<0.01), andOBX REB (P<0.01) groups. Two-way ANOVA indicatedsignificant effects for REMSD [F(2.42)=4.62; P=0.015]and interaction [F(2.42)=3.73; P=0.032] factors, but not forthe OBX [F(1.42)=3.07; P=0.087] factor. Analogous signif-icant effects were found for the mean velocity parameter(Fig. 1b) concerning the OBX control group compared tothe same sham control (P<0.01), OBX REMSD (P<0.01)and OBX REB (P<0.01) groups, as indicated by the REMSD[F(2.42)=4.54; P=0.016], OBX [F(1.42)=3.48; P=0.07] andinteraction [F(2.42)=4.11; P=0.02] factors.
Modified Forced Swimming Test and Nigral BDNFExpression
Regarding the swimming (Fig. 2a), the OBX control groupdemonstrated a significant decrease in this parameter in com-parison to the sham control (P<0.05), sham REMSD(P<0.05), OBX REMSD (P<0.001), and OBX REB groups(P<0.001), as revealed by the REMSD [F(2.36)=12.22;P=0.0002], OBX [F(1.36)=0.15; P=0.7] and interaction[F(2.36)=10.73; P=0.0005] factors. In addition, the analysisof climbing (Fig. 2b) showed that this behavior is increased inthe OBX control group compared to the sham REMSD(P<0.01) and OBX REMSD (P<0.01) groups. Moreover,
the OBX REB group also presented an increased climbingtime compared to the OBX REMSD group (P<0.01) asdemonstrated by the REMSD [F(2.36)=11.74; P=0.0002],OBX [F(1.36)=5.08; P=0.031], and interaction [F(2.36)=1.37; P=0.27] factors. Complementarily, the analysis of theimmobility parameter (Fig. 2c) revealed that the OBX controlgroup presented a significant increase compared to the shamcontrol group (P<0.05). However, the OBX REMSD groupexhibited a decreased immobility time in comparison to thesham REMSD (P<0.05) and OBX control (P<0.05) groupsas indicated by the REMSD [F(2.36)=0.13; P=0.87], OBX[F(1.36)=0.92; P=0.34], and interaction [F(2.36)=13.13;P=0.0001] factors.
The analysis of the nigral BDNF levels (Fig. 2d) showedthat the OBX control group demonstrated a decreased
0
10
20
30
40
Sham OBX
Control
OBXSham
REMSD
**
OBXSham
REB
****
Dis
tan
ce t
rave
led
(m
)
0.00
0.05
0.10
0.15
Sham OBX
Control
OBXSham
REMSD
**
OBXSham
REB
****
Mea
n v
elo
city
(m
/s)
B
A
Fig. 1 Locomotor parameters obtained from the open-field test. aThe distance traveled and b the mean velocity. Values areexpressed as mean ± SEM. **P<0.01. Two-way ANOVA followedby the Bonferroni post hoc test
Mol Neurobiol

expression of this neurotrophic factor in comparison to thesham control group (P<0.05). Nevertheless, the OBXREMSD (P<0.01) and the OBX REB (P<0.05) groups re-vealed significant increases in their respective BDNF contentscompared to the OBX control group, as demonstrated by theREMSD [F(2.36)=5.8; P=0.007], OBX [F(1.36)=22.05;P<0.0001], and interaction [F(2.36)=0.39; P=0.68] factors.
Quantification of Striatal Neurotransmitters, Metabolites,and Turnovers
Figure 3 shows the alterations in the neurotransmission withinthe striatum. Accordingly, DA levels (Fig. 3a) were intenselyincreased in the sham REB group compared to the shamcontrol (P<0.001), sham REMSD (P<0.01), and OBX REB(P<0.01) groups, as demonstrated by the REMSD [F(2.36)=10.6; P=0.003], OBX [F(1.36)=6.9; P=0.013], and interac-tion [F(2.36)=4.02; P=0.03] factors. Besides, considering theDOPAC levels (Fig. 3b) the sham REMSD group showed anincrement in this metabolite compared to the sham control
(P<0.001), OBX REMSD (P<0.001), and sham REB(P<0.001) groups. Moreover, the OBX REB group presentedan increment in the DOPAC content in comparison to thesham REB (P<0.01) and OBX control (P<0.01) groups, asdemonstrated by the REMSD [F(2.36)=6.03; P=0.006],OBX [F(1.36)=1.16; P=0.29], and interaction [F(2.36)=15.23; P<0.0001] factors. In addition, HVA levels (data notshown) were intensely increased in the sham REMSD groupcompared to the sham control (P<0.01) and sham REB(P<0.01) groups, as demonstrated by the REMSD[F(2.36)=12.32; P=0.0001], OBX [F(1.36)=0.04; P=0.84],and interaction [F(2.36)=3.36; P=0.04] factors. Consequent-ly, the calculation of the striatal DA turnover (Fig. 3c) revealedthat the sham REMSD group showed an increased turnovercompared to the sham REB group (P<0.01). Furthermore, theOBX REB group also presented an increase in the DA turn-over, in comparison to the sham REB group (P<0.05) asdemonstrated by the REMSD [F(2.36)=5.06; P=0.01],OBX [F(1.36)=0.51; P=0.5], and interaction [F(2.36)=4.7;P=0.017] factors.
0
50
100
150
200
250
300
Sham OBX Sham OBX Sham OBX
REBREMSDControl
**** *
***
Sw
imm
ing
(s)
0
20
40
60
80
100
Sham OBX Sham OBX Sham OBX
REBREMSDControl
****
**
Clim
bin
g (
s)
0
25
50
75
100
125
Sham OBX Sham OBX Sham OBX
REBREMSDControl
***
**
Imm
ob
ility
(s)
0
20
40
60
80
100
Sham OBX Sham OBX Sham OBX
REBREMSDControl
*
***
BD
NF
(n
g/m
g)
BA
DC
Fig. 2 Depressive-like parameters were counteracted by the REMSDevidenced by the forced swimming test and nigral BDNF expression. aSwimming, b climbing, c immobility, and d BDNF. Values are expressed
as mean ± SEM. *P<0.05, **P<0.01, ***P<0.001. Two-way ANOVAfollowed by the Bonferroni post hoc test
Mol Neurobiol

Regarding the 5-HT levels detected in the striatum(Fig. 3d), the sham REB group exhibited increments of thisneurotransmitter when compared to the sham control(P<0.001), sham REMSD (P<0.001), and OBX REB(P<0.001) groups, as indicated by the REMSD [F(2.36)=16.43; P<0.0001], OBX [F(1.36)=24.9; P<0.0001], and in-teraction [F(2.36)=3.86; P=0.04] factors. In addition, themetabolite 5-HIAA (Fig. 3e) presented a significant increasein the sham REMSD group compared to the sham control(P<0.001), OBX REMSD (P<0.05), and sham REB(P<0.05) groups as demonstrated by the REMSD [F(2.36)=9.64; P=0.0008], OBX [F(1.36)=4.34; P=0.05], and interac-tion [F(2.36)=1.76; P=0.19] factors. As a result, the 5-HT
turnover within the striatum (Fig. 3f) showed a significantaugmentation in the sham REMSD group compared to thesham control (P<0.05). Moreover, the OBX REMSD groupalso presented an increase in comparison to the OBX REB(P<0.01), as represented by the REMSD [F(2.36)=20.38;P<0.0001], OBX [F(1.36)=7.13; P=0.013], and interaction[F(2.36)=0.57; P=0.57] factors.
Lastly, in relation to the variations of NA, Fig. 3g indicatesthat the sham REMSD group was increased in comparison tothe sham control (P<0.01) and OBX REMSD groups(P<0.001). In addition, the sham REB group presented asignificant increase when compared to the sham control(P<0.01) group, and the OBX REB group also presented an
0
2000
4000
6000
8000
10000
Sham OBX Sham OBX Sham OBX
REBREMSDControl
***** **
DA
(n
g/m
g)
0
1000
2000
3000
4000
Sham OBX Sham OBX Sham OBX
REBREMSDControl
**
*** ********
**
DO
PA
C (
ng
/mg
)
0.0
0.2
0.4
0.6
0.8
Sham OBX Sham OBX Sham OBX
REBREMSDControl
**
*
Tur
nove
r(D
OP
AC
+HV
A/D
A)
0
1000
2000
3000
4000
Sham OBX Sham OBX Sham OBX
REBREMSDControl
*********
5-H
T (
ng
/g)
0
500
1000
1500
Sham OBX Sham OBX Sham OBX
REBREMSDControl
****
*
5-H
IIA (
ng
/g)
0.0
0.2
0.4
0.6
0.8
Sham OBX Sham OBX Sham OBX
REBREMSDControl
***
Tu
rno
ver
(5-
HIIA
/ 5-H
T)
0
20
40
60
Sham OBX Sham OBX Sham OBX
REBREMSDControl
****
******
***
NA
(n
g/g
)
0
200
400
600
800
Sham OBX Sham OBX Sham OBX
REBREMSDControl
DH
PG
(n
g/g
)
0
20
40
60
80
Sham OBX Sham OBX Sham OBX
REBREMSDControl
*
**
*
*
Tur
nove
r(D
HP
G/N
A)
A B C
D E F
G H I
Fig. 3 Neurochemical examination of the striatal concentrations of DA,5-HT, NA, and their respective metabolites. a DA, b DOPAC, c DAturnover, d 5-HT, e 5-HIAA, f 5-HT turnover, g NA, h DHPH, and i
NA turnover. Values are expressed as mean ± SEM. *P<0.05, **P<0.01,***P<0.001. Two-way ANOVA followed by the Bonferroni post hoc test
Mol Neurobiol
increase in NA content compared to the OBX REMSD(P<0.001) and OBX control (P<0.001) groups, as demon-strated by the REMSD [F(2.36)=20.33; P<0.001], OBX[F(1.36)=0.76; P=0.4], and interaction [F(2.36)=6.6;P=0.005] factors. However, Fig. 3h shows the absence ofstatistical differences among the groups, considering the levelsof DHPG, as revealed by the REMSD [F(2.36)=0.47;P=0.63], OBX [F(1.36)=0.36; P=0.55], and interaction[F(2.36)=0.17; P=0.84] factors. Concerning the NA turnover(Fig. 3i), the sham REMSD group presented a significantdecrease compared to the sham control (P<0.05) and OBXREMSD (P<0.05) groups. In fact, the sham REB groupmanifested a decrease in this parameter in comparison to thesham control (P<0.05) group. In addition, the OBX REBgroup exhibited a decrease compared to the OBX control(P<0.05) and OBXREMSD (P<0.05) groups, as demonstrat-ed by the REMSD [F(2.36)=11.48; P=0.0003], OBX[F(1.36)=2.48; P=0.13], and interaction [F(2.36)=3.34;P=0.05] factors.
Quantification of Hippocampal Neurotransmitters,Metabolites, and Turnovers
Figure 4 shows the alterations in the neurotransmission withinthe hippocampus. DA levels (Fig. 4a) have been found to bereduced in the sham REMSD group compared to the shamcontrol (P<0.05) and OBX REMSD (P<0.05) groups asdemonstrated by the REMSD [F(2.36)=4.43; P=0.02],OBX [F(1.36)=10.86; P=0.003], and interaction [F(2.36)=2.58; P=0.09] factors. Furthermore, concerning the hippo-campal DOPAC content (Fig. 4b), the sham REMSD groupexhibited a significant increase in this metabolite compared tothe OBX REMSD (P<0.05) and sham REB (P<0.001)groups. Also, the sham REB group presented a decrement inthe DOPAC levels in comparison to the sham control group(P<0.05) as indicated by the REMSD [F(2.36)=14.26;P<0.0001], OBX [F(1.36)=4.7; P=0.04], and interaction[F(2.36)=1.57; P=0.23] factors. In addition, the quantifica-tion of HVAmetabolite (data not shown) indicated an absenceof statistical differences among groups as evidenced by theREMSD [F(2.36)=0.34; P=0.72], OBX [F(1.36)=0.22;P=0.65], and interaction [F(2.36)=0.93; P=0.41] factors.Finally, the DA turnover (Fig. 4c) demonstrated to be in-creased in the sham REMSD group when compared to theOBX REMSD group (P<0.05), according to the REMSD[F(2.36)=2.35; P=0.12], OBX [F(1.36)=5.08; P=0.033],and interaction [F(2.36)=0.72; P=0.5] factors.
Considering the 5-HT content (Fig. 4d), the OBX controlgroup revealed a significant decrease in this neurotransmittercompared to the sham control (P<0.05), sham REMSD(P<0.05), OBX REMSD (P<0.05), sham REB (P<0.01),and OBX REB (P<0.001). In addition, the OBX REB groupdemonstrated a significant increase when compared to the
OBX REMSD (P<0.05), as indicated by the REMSD[F(2.36)=12.43; P=0.0002], OBX [F(1.36)=2.55; P=0.12],and interaction [F(2.36)=4.37; P=0.02] factors. Regardingthe metabolite 5-HIAA (Fig. 4e), it has been found to beincreased in the sham REMSD group in comparison to thesham control (P<0.05) and sham REB (P<0.01) groups ac-cording to the REMSD [F(2.36)=8.86; P=0.001], OBX[F(1.36)=2.87; P=0.1], and interaction [F(2.36)=2.1;P=0.14] factors. Furthermore, the analysis of 5-HT turnoverindicated that the OBX control group manifested an incrementin this parameter compared to the sham control (P<0.001) andOBX REB groups (P<0.001). Likewise, the sham REMSDgroup also presented increased 5-HT turnover compared to thesham control (P<0.05) and sham REB groups (P<0.05).Besides, the OBX REMSD group demonstrated an increasein this parameter when compared to the OBX REB group(P<0.05), as indicated by the REMSD [F(2.36)=12.1;P=0.0002], OBX [F(1.36)=8.7; P=0.007], and interaction[F(2.36)=5.98; P=0.008] factors.
NA levels (Fig. 4g) indicated that the OBX REB grouppresented a significant increase in comparison to the OBXcontrol (P<0.01) and OBX REMSD (P<0.01) groups asdemonstrated by the REMSD [F(2.36)=11.21; P=0.0004],OBX [F(1.36)=0.59; P=0.45], and interaction [F(2.36)=1.01; P=0.38] factors. Furthermore, the metabolite DHPG(Fig. 4h) demonstrated to be increased in the sham REMSDgroup in comparison to the sham control (P<0.05) and shamREB (P<0.01) groups. In addition, the OBX REMSD grouppresented a significant increase when compared to the OBXcontrol (P<0.01) and OBX REB (P<0.05) groups as revealedby the REMSD [F(2.36)=15.7; P<0.0001], OBX [F(1.36)=0.02; P=0.89], and interaction [F(2.36)=0.21; P=0.81] fac-tors. Lastly, regarding the NA turnover (Fig. 4i) the shamREMSD group showed a significant increase in this parameterin comparison to the sham control (P<0.01) and sham REB(P<0.001). Moreover, the OBX REMSD group exhibited anincrement in this parameter in comparison to the OBX control(P<0.001) and OBX REB (P<0.001) groups, as depicted bythe REMSD [F(2.36)=30.5; P<0.0001], OBX [F(1.36)=0.02; P=0.87], and interaction [F(2.36)=0.19; P=0.8] factors.
Statistical Correlations Between Behavioraland Neurochemical Parameters
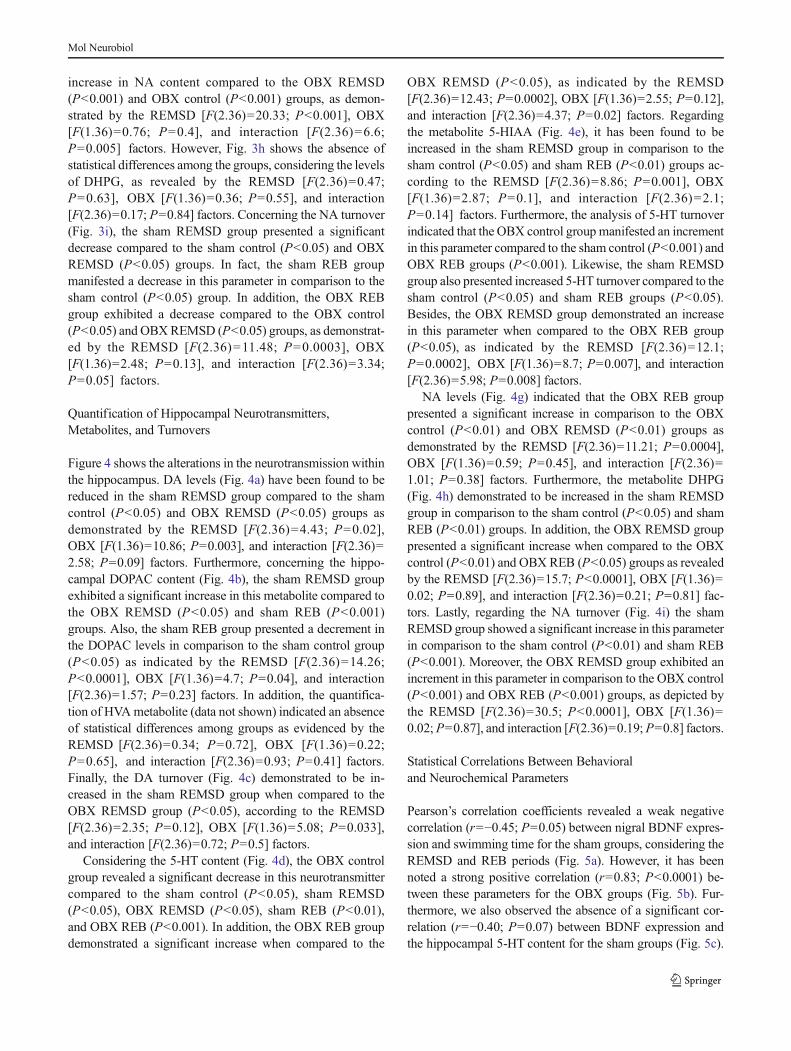
Pearson’s correlation coefficients revealed a weak negativecorrelation (r=−0.45; P=0.05) between nigral BDNF expres-sion and swimming time for the sham groups, considering theREMSD and REB periods (Fig. 5a). However, it has beennoted a strong positive correlation (r=0.83; P<0.0001) be-tween these parameters for the OBX groups (Fig. 5b). Fur-thermore, we also observed the absence of a significant cor-relation (r=−0.40; P=0.07) between BDNF expression andthe hippocampal 5-HT content for the sham groups (Fig. 5c).
Mol Neurobiol

Nevertheless, the OBX groups demonstrated a significantmoderate correlation (r=0.66; P=0.004) along the periods ofexamination (Fig. 5d). Avery similar pattern was observed forthe correlation between the swimming time and the hippo-campal 5-HT content. In fact, these parameters did not signif-icantly correlated (r=0.25; P=0.18) for the sham groups(Fig. 5e), although, they are strongly correlated (r=0.70;P=0.003) for the OBX groups (Fig. 5f).
Further correlations, were also performed for other param-eters (Table 1). Interestingly, striatal NA content significantlycorrelated with nigral BDNF expression for both; sham(r=0.55; P=0.02) and OBX (r=0.57; P=0.01) groups.
Discussion
In our study, depressive-like behaviors were observed afterOBX. These included increased open-field activity and timespent immobile in the forced swimming test associated toreduced swimming time. These data are in accordance toprevious reports that also described the ability of antidepres-sant drugs to counteract these changes [28–31]. In parallel,BDNF levels within the SNpc also reflected a remarkableOBX-induced impairment, typical of an animal model ofdepression. Moreover, reduced hippocampal levels of BDNFin OBX animals provides further support for the BDNF deficit
0
10
20
30
40
Sham OBX Sham OBX Sham OBX
REBREMSDControl
**
DA
(n
g/m
g)
0
10
20
30
40
Sham OBX Sham OBX Sham OBX
REBREMSDControl
****
*
DO
PA
C (
ng
/mg
)
0
1
2
3
Sham OBX Sham OBX Sham OBX
REBREMSDControl
*
Tu
rno
ver
(DO
PA
C+H
VA
/DA
)
0
1000
2000
3000
Sham OBX Sham OBX Sham OBX
REBREMSDControl
**
*
*****
*
5-H
T (
ng
/g)
0
500
1000
1500
Sham OBX Sham OBX Sham OBX
REBREMSDControl
***
5-H
IIA (
ng
/g)
0.0
0.2
0.4
0.6
Sham OBX Sham OBX Sham OBX
REBREMSDControl
****
*
****
Tur
nove
r (5
-HIIA
/ 5-H
T)
0
100
200
300
400
500
Sham OBX Sham OBX Sham OBX
REBREMSDControl
****
NA
(n
g/g
)
0
200
400
600
800
Sham OBX Sham OBX Sham OBX
REBREMSDControl
**
****
DH
PG
(n
g/g
)
0
1
2
3
Sham OBX Sham OBX Sham OBX
REBREMSDControl
******
*****
Tur
nove
r(D
HP
G/N
A)
A B C
D E F
G H I
Fig. 4 Neurochemical examination of the hippocampal concentrations ofDA, 5-HT, NA, and their respective metabolites. a DA, b DOPAC, c DAturnover, d 5-HT, e 5-HIAA, f 5-HT turnover, g NA, h DHPH, and i NA
turnover. Values are expressed as mean ± SEM. *P<0.05, **P<0.01,***P<0.001. Two-way ANOVA followed by the Bonferroni post hoc test
Mol Neurobiol

hypothesis of depression, corroborating previous reports[32–34]. In fact, BDNF co-localizes with tyrosine hydroxy-lase in midbrain dopaminergic cell bodies suggesting its in-volvement in the synaptic function of these neurons [35].Infusion of this neurotrophin into the SNpc, VTA, and nucleusaccumbens increases DA release and enhances locomotoractivity induced by psychostimulant drugs [36]. Moreover, itis reported that BDNF controls the expression of the D3receptor gene [37], a major dopamine receptor in the striatum
[38], and the D3 agonist pramipexole, developed as anantiparkinsonian drug, possesses clinical efficacy in the treat-ment of unipolar as well as bipolar depression [39, 40]. In thiscontext, REMSD triggered antidepressant mechanisms suchas the increment of BDNF levels which were strongly corre-lated to the swimming time (r=0.83; P<0.0001) and hippo-campal 5-HT content (r=0.66; P=0.004). Moreover,there was a strong correlation between swimming timeand hippocampal 5-HT levels (r=0.70; P=0.003),
160 180 200 220 240 260
40
60
80
100
120
r = -0.45P = 0.05
Sham
Swimming (s)
BD
NF
(ng/
g)
150 200 250 30020
40
60
80
r = 0.83P < 0.0001
OBX
Swimming (s)
BD
NF
(ng/
g)
1500 2000 2500 3000 350025
50
75
100
125
r = -0.40P = 0.07
Sham
5-HT (ng/mg) - Hippocampus
BD
NF
(ng/
g)
1000 2000 3000 4000
20
40
60
80
r = 0.66P = 0.004
OBX
5-HT (ng/mg) - Hippocampus
BD
NF
(ng/
g)
1500 2000 2500 3000 3500160
180
200
220
240
260
r = 0.25P = 0.18
Sham
5-HT (ng/mg) - Hippocampus
Sw
imm
ing
(s)
1000 2000 3000 4000100
150
200
250
300
350
r = 0.70P = 0.003
OBX
5-HT (ng/mg) - Hippocampus
Sw
imm
ing
(s)
A B
C D
E F
Legend: Control REMSD REB
Fig. 5 Different alterations induced by the OBX model werecounteracted by REMSD as indicated by correlations of different param-eters in the sham and OBX groups. Pearson’s correlation coefficients
were calculated considering the following: a BDNF×swimming—sham,b BDNF×swimming—OBX, c BDNF×5-HT—sham, d BDNF×5-HT—OBX, e swimming×5-HT—sham, and f swimming×5-HT—OBX
Mol Neurobiol

strengthen the notion of an antidepressant effect associated toREMSD in the OBX rats.
OBX leads changes in behavior and in the endocrine,immune, and neurotransmitter systems that simulate manychanges seen in patients with major depression [41]. It isworth mentioning that there are differences between humansand rodents regarding the olfactory system and the biologicalsignificance of this chemical sense. In fact, olfactory discrim-ination in rodents is crucial to making differential responses tostimuli according to their significance. In natural environ-ments, animals also face more complex problems such asconcentration- and background- invariant odor recognitionand odor source localization. This suggests that for rodents,specific odor images could be mapped to specific locations,helping to build a more detailed map of an olfactory environ-ment [42]. Such evidence implies that in rodents the role ofolfaction is much more complex and relevant compared tohumans. Still concerning this contrast, other study reportedthat human olfactory perception was comparable with indicesextracted from activity patterns evoked in the glomerular layerof the olfactory bulb in rats [43]. In addition, olfactory dys-function is frequently observed in patients with idiopathicREM sleep behavior disorder (RBD), such as Parkinson’sdisease, which also often co-presents with depression, as wellas idiopathic RBD [44]. This suggests that the olfactory bulbmay play an important role in regulating REM sleep distur-bances and depression [10].
The antidepressant effect of SD has been widely investi-gated in depressed patients. This procedure has proven itsefficacy for alleviating depression in approximately 60 % ofthe cases after a single session, and in almost 90 % after threesessions performed at 1-week intervals [13, 45]. Furthermore,in a randomized study it was found that lower amounts of
REM sleep were correlated with a greater reduction in depres-sive symptom ratings [3]. However, this effect usually is onlytransient, and in most cases relapse occurs after the firstepisode of sleep rebound [46]. Thus, endogenous depressionis associated with an increase in cholinergic and decrease inserotonergic neurotransmission [47, 48], it has been proposedthat this imbalance would be responsible for the disinhibitionof REM sleep in depressed patients.
Accordingly, 5-HT being released during wakefulness in-hibits sleep facilitatory or sleep-executive neurons, mostlythrough post-synaptic serotonergic receptors [19]. In that re-spect, our neurochemical findings showed a remarkable re-duction in the 5-HT levels within the hippocampus, but not inthe striatum, of the control OBX group. DA and NA appearedto be not influenced by the OBX procedure, suggesting thatthis model of depression is possibly more associated to a 5-HTdeficiency, as also indicated by themodified forced swimmingtest. In addition, REMSD strongly attenuated this hippocam-pal 5-HT deficiency regarding its levels and their turnover.Furthermore, a robust decrease in the hippocampal DA in thesham REMSD group, but not in the OBX REMSD is ob-served. Also, the decrement in DA degradation induced by theREMSD in the OBX group, in both hippocampus and stria-tum, indicates some level of contribution of the dopaminergicsystem in this antidepressant mechanism.
Of note, REMSD alone promoted an important increase instriatal levels of NA, and allied to the OBX procedure a clearturnover increase was achieved. This result is supported by thefact that REMSD can boost the expression of tyrosine hydrox-ylase and NA transporter in the locus coeruleus [49], similar todesipramine [50], indicating that REMSD and antidepressanttreatments cause similar molecular changes in the noradren-ergic system [49].
Regarding the REB period, we observed the occurrence ofa sustained antidepressant effect, indicated mainly by theswimming and climbing times which could be explained bythe maintenance of the increased nigral BDNF expression.Furthermore, other studies reported a SD-induced elevation ofboth BDNF protein and its mRNA levels in the hippocampus[51], additionally, SD is also related to increments in the slowwave sleep [52] may representing, respectively, electrophysi-ological and molecular correlates of mood improvement fol-lowing REMSD. In addition, hippocampal 5-HT levelsremained enhanced in the OBX group after the REB period,as well as NA. Nevertheless, within the striatum, only NApresented a similar profile, indicating a secondary participa-tion of DA and even 5-HT in this structure for the wholemechanism. However, it is noteworthy that we observe anincreased striatal DA turnover in the striatum, suggesting apossible compensatory mechanism elicited in this period. Infact, there is described a mutual association between DA and5-HT in mood disorders, particularly in Parkinson’s disease[53]. This hypothesis considers a 5-HT-induced DA release in
Table 1 Pearson’s correlations between different behavioral and neuro-chemical parameters
Correlations Groups
Sham OBX
BDNF vs swimming r=−0.45; P=0.05a r=0.83; P<0.001a
BDNF vs climbing r=0.43; P=0.05a r=0.29; P=0.15
BDNF vs immobility r=0.43; P=0.06 r=0.30; P=0.15
Striatum
5-HT vs BDNF r=−0.05; P=0.42 r=0.20; P=0.23
DA vs BDNF r=0.12; P=0.33 r=0.15; P=0.30
NA vs BDNF r=0.55; P=0.02a r=0.57; P=0.01a
Hippocampus
5-HT vs BDNF r=−0.40; P=0.07 r=0.66; P=0.004a
DA vs BDNF r=−0.21; P=0.22 r=−0.16; P=0.29NA vs BDNF r=−0.05; P=0.43 r=0.29; P=0.14
a Significant correlations are indicated
Mol Neurobiol

the nucleus accumbens which is downregulated by 5-HT2Creceptors [54]. As a result, reductions in the 5-HT content orincreases in the 5-HT2C inhibitory activity could be associat-ed to a decline on dopaminergic neurotransmission. In thelight of our findings, this hypothesis seems plausible becauseboth DA and 5-HT presented similar fluctuations in the stria-tum and hippocampus structures which are closely related tothe nucleus accumbens that collectively define the so calledneural circuitry of depression [55, 56]. Interestingly, theseareas are part of the brain reward pathway and any dysfunc-tion at this level may contribute to anhedonia, which repre-sents an important feature of depression.
The present findings provide new information regardingthe antidepressant mechanisms triggered by a short period ofREMSD. Indeed, we demonstrated that this effect is onlyeffective in the presence of the OBX condition (absence ofsignificant correlations in the sham groups) suggesting that theREMSD procedure only possess therapeutic validity in thepresence of the mood disorder. Thus, the neurochemical com-plexity inflicted by the OBXmodel, counteracted byREMSD,is directly correlated to the nigral BDNF expression andhippocampal 5-HT levels. Perhaps the purportedly secondaryparticipation of DA and NA are in accordance to their mod-ulatory roles in the neural circuitry of depression.
Acknowledgements This paper was supported by CAPES andthe Conselho Nacional de Desenvolvimento Científico eTecnológico—CNPq—Brasil Grants Casadinho/Procad no. 552226/2011-4 and Universal no. 473861/2012-7 to MMSL. MMSL, SMZ, andCDC are recipients of CNPq fellowship. The authors wish to express theirsincere gratitude to Prof. Dr. Roberto Andreatini from PharmacologyDepartment of UFPR for the technical assistance.
Conflict of Interest The authors have declared that no conflict ofinterests exists.
References
1. Schulte W (1966) Kombinierte Psycho- und Pharmakotherapie beiMelancholikern. Probleme der pharmakopsychiatrischenKombinations- und Langzeitbehandlung. Karger
2. Gorgulu Y, Caliyurt O (2009) Rapid antidepressant effects of sleepdeprivation therapy correlates with serum BDNF changes in majordepression. Brain Res Bull 80(3):158–162
3. Landsness EC, Goldstein MR, Peterson MJ, Tononi G, Benca RM(2011) Antidepressant effects of selective slowwave sleep deprivationinmajor depression: a high-density EEG investigation. J Psychiatr Res45(8):1019–1026. doi:10.1016/j.jpsychires.2011.02.003
4. Kreuzer PM, Langguth B, SchecklmannM, Eichhammer P, Hajak G,LandgrebeM (2012) Can repetitive transcranial magnetic stimulationprolong the antidepressant effects of sleep deprivation? Brain Stimul5(2):141–147. doi:10.1016/j.brs.2011.02.005
5. Giedke H, Schwarzler F (2002) Therapeutic use of sleep deprivationin depression. Sleep Med Rev 6(5):361–377
6. Palagini L, Baglioni C, Ciapparelli A, Gemignani A, Riemann D(2013) REM sleep dysregulation in depression: state of the art. SleepMed Rev 17(5):377–390. doi:10.1016/j.smrv.2012.11.001
7. Zant JC, Leenaars CH, Kostin A, Van Someren EJ, Porkka-Heiskanen T (2011) Increases in extracellular serotonin and dopa-mine metabolite levels in the basal forebrain during sleep depriva-tion. Brain Res 1399:40–48. doi:10.1016/j.brainres.2011.05.008
8. Meyers N, Fromm S, Luckenbaugh DA, Drevets WC, Hasler G(2011) Neural correlates of sleepiness induced by catecholaminedepletion. Psychiatry Res 194(1):73–78. doi:10.1016/j.pscychresns.2011.06.015
9. Sei H, Saitoh D, Yamamoto K, Morita K, Morita Y (2000)Differential effect of short-term REM sleep deprivation on NGFand BDNF protein levels in the rat brain. Brain Res 877(2):387–390
10. WangYQ, Tu ZC, XuXY, Li R, QuWM,Urade Y, Huang ZL (2012)Acute administration of fluoxetine normalizes rapid eye movementsleep abnormality, but not depressive behaviors in olfactorybulbectomized rats. J Neurochem 120(2):314–324. doi:10.1111/j.1471-4159.2011.07558.x
11. Vogel GW (1983) Evidence for REM sleep deprivation as the mech-anism of action of antidepressant drugs. Prog NeuropsychopharmacolBiol Psychiatry 7(2–3):343–349
12. Giedke H, Geilenkirchen R, Hauser M (1992) The timing of partialsleep deprivation in depression. J Affect Disord 25(2):117–128
13. Adrien J (2002) Neurobiological bases for the relation between sleepand depression. Sleep Med Rev 6(5):341–351
14. Asikainen M, Toppila J, Alanko L, Ward DJ, Stenberg D, Porkka-Heiskanen T (1997) Sleep deprivation increases brain serotoninturnover in the rat. Neuroreport 8(7):1577–1582
15. Lima MMS, Andersen ML, Reksidler AB, Ferraz AC, Vital AM,Tufik S (2012) Paradoxical sleep deprivation modulates tyrosinehydroxylase expression in the nigrostriatal pathway and attenuatesmotor deficits induced by dopaminergic depletion. CNS NeurolDisord Drug Targets 11:359–368
16. Lima MM, Andersen ML, Reksidler AB, Silva A, Zager A, ZanataSM, Vital MA, Tufik S (2008) Blockage of dopaminergic D(2)receptors produces decrease of REM but not of slow wave sleep inrats after REM sleep deprivation. Behav Brain Res 188(2):406–411.doi:10.1016/j.bbr.2007.11.025
17. Proenca MB, Dombrowski PA, Da Cunha C, Fischer L, Ferraz AC,Lima MM (2014) Dopaminergic D2 receptor is a key player in thesubstantia nigra pars compacta neuronal activationmediated byREMsleep deprivation. Neuropharmacology 76 Pt A:118–126. doi:10.1016/j.neuropharm.2013.08.024
18. Guzman-Marin R, AlamMN, Szymusiak R, Drucker-Colin R, GongH, McGinty D (2000) Discharge modulation of rat dorsal rapheneurons during sleep and waking: effects of preoptic/basal forebrainwarming. Brain Res 875(1–2):23–34
19. Tissier MH, Lainey E, Fattaccini CM, Hamon M, Adrien J (1993)Effects of ipsapirone, a 5-HT1A agonist, on sleep/wakefulness cy-cles: probable post-synaptic action. J Sleep Res 2(2):103–109
20. Vogel GW, Buffenstein A, Minter K, Hennessey A (1990) Drugeffects on REM sleep and on endogenous depression. NeurosciBiobehav Rev 14(1):49–63
21. van Riezen H, Leonard BE (1990) Effects of psychotropic drugs onthe behavior and neurochemistry of olfactory bulbectomized rats.Pharmacol Ther 47(1):21–34
22. Cairncross KD, Cox B, Forster C, Wren AF (1977) The olfactorybulbectomized rat: a simple model for detecting drugs with antide-pressant potential [proceedings]. Br J Pharmacol 61(3):497P
23. Machado RB, Hipolide DC, Benedito-Silva AA, Tufik S (2004) Sleepdeprivation induced by the modified multiple platform technique:quantification of sleep loss and recovery. Brain Res 1004(1–2):45–51
24. Broadhurst PL (1960) Experiments in psychogenetics. In: EinsenkHJ (ed) Experiments in personality. Routledge and Kegan Paul,London, pp 52–71
25. Porsolt RD, Anton G, Blavet N, Jalfre M (1978) Behavioural despairin rats: a new model sensitive to antidepressant treatments. Eur JPharmacol 47(4):379–391
Mol Neurobiol

26. Reneric JP, Bouvard M, Stinus L (2002) In the rat forced swimmingtest, chronic but not subacute administration of dual 5-HT/NA anti-depressant treatments may produce greater effects than selectivedrugs. Behav Brain Res 136(2):521–532
27. Elfving B, Plougmann PH, Wegener G (2010) Detection of brain-derived neurotrophic factor (BDNF) in rat blood and brain prepara-tions using ELISA: pitfalls and solutions. J Neurosci Methods187(1):73–77. doi:10.1016/j.jneumeth.2009.12.017
28. Bertaina-Anglade V, La Rochelle CD, Scheller DK (2006)Antidepressant properties of rotigotine in experimental models ofdepression. Eur J Pharmacol 548(1–3):106–114. doi:10.1016/j.ejphar.2006.07.022
29. Artaiz I, Zazpe A, Innerarity A, Del Olmo E, Diaz A, Ruiz-OrtegaJA, Castro E, Pena R, Labeaga L, Pazos A, Orjales A (2005)Preclinical pharmacology of F-98214-TA, a novel potent serotoninand norepinephrine uptake inhibitor with antidepressant and anxio-lytic properties. Psychopharmacology (Berlin) 182(3):400–413. doi:10.1007/s00213-005-0087-3
30. Breuer ME, Groenink L, Oosting RS, Buerger E, Korte M, Ferger B,Olivier B (2009) Antidepressant effects of pramipexole, a dopamineD3/D2 receptor agonist, and 7-OH-DPAT, a dopamine D3 receptoragonist, in olfactory bulbectomized rats. Eur J Pharmacol 616(1–3):134–140. doi:10.1016/j.ejphar.2009.06.029
31. Breuer ME, Groenink L, Oosting RS, Westenberg HG, Olivier B(2007) Long-term behavioral changes after cessation of chronicantidepressant treatment in olfactory bulbectomized rats. BiolPsychiatry 61(8):990–995. doi:10.1016/j.biopsych.2006.08.032
32. Sowa-Kucma M, Legutko B, Szewczyk B, Novak K, Znojek P,Poleszak E, Papp M, Pilc A, Nowak G (2008) Antidepressant-likeactivity of zinc: further behavioral and molecular evidence. J NeuralTransm 115(12):1621–1628. doi:10.1007/s00702-008-0115-7
33. Hendriksen H, Meulendijks D, Douma TN, Bink DI, Breuer ME,Westphal KG, Olivier B, Oosting RS (2012) Environmental enrich-ment has antidepressant-like action without improving learning andmemory de f i c i t s i n o l f a c t o r y bu l be c t om i z ed r a t s .Neuropharmacology 62(1):270–277. doi:10.1016/j.neuropharm.2011.07.018
34. Pudell C, Vicente BA, Delattre AM, Carabelli B,MoriMA, SucheckiD, Machado RB, Zanata SM, Visentainer JV, de Oliveira Santos OJ,Lima MM, Ferraz AC (2013) Fish oil improves anxiety-like,depressive-like and cognitive behaviors in olfactory bulbectomisedrats. Eur J Neurosci. doi:10.1111/ejn.12406
35. Seroogy KB, Lundgren KH, Tran TM, Guthrie KM, Isackson PJ,Gall CM (1994) Dopaminergic neurons in rat ventral midbrain ex-press brain-derived neurotrophic factor and neurotrophin-3 mRNAs.J Comp Neurol 342(3):321–334. doi:10.1002/cne.903420302
36. Pierce RC, Bari AA (2001) The role of neurotrophic factors inpsychostimulant-induced behavioral and neuronal plasticity. RevNeurosci 12(2):95–110
37. Sokoloff P, Guillin O, Diaz J, Carroll P, Griffon N (2002) Brain-derived neurotrophic factor controls dopamine D3 receptor expres-sion: implications for neurodevelopmental psychiatric disorders.Neurotox Res 4(7–8):671–678. doi:10.1080/1029842021000045499
38. Sokoloff P, Giros B,Martres MP, Bouthenet ML, Schwartz JC (1990)Molecular cloning and characterization of a novel dopamine receptor(D3) as a target for neuroleptics. Nature 347(6289):146–151. doi:10.1038/347146a0
39. Corrigan MH, Denahan AQ, Wright CE, Ragual RJ, Evans DL(2000) Comparison of pramipexole, fluoxetine, and placebo in pa-tients with major depression. Depress Anxiety 11(2):58–65. doi:10.1002/(SICI)1520-6394(2000)11:2<58::AID-DA2>3.0.CO;2-H
40. Zarate CA Jr, Payne JL, Singh J, Quiroz JA, Luckenbaugh DA,Denicoff KD, Charney DS, Manji HK (2004) Pramipexole for bipo-lar II depression: a placebo-controlled proof of concept study. BiolPsychiatry 56(1):54–60. doi:10.1016/j.biopsych.2004.03.013
41. Song C, Leonard BE (2005) The olfactory bulbectomised rat as amodel of depression. Neurosci Biobehav Rev 29(4–5):627–647. doi:10.1016/j.neubiorev.2005.03.010
42. Uchida N, Mainen ZF (2003) Speed and accuracy of olfactorydiscrimination in the rat. Nat Neurosci 6(11):1224–1229. doi:10.1038/nn1142
43. Soh Z, Saito M, Kurita Y, Takiguchi N, Ohtake H, Tsuji T (2014) Acomparison between the human sense of smell and neural activity inthe olfactory bulb of rats. Chem Senses 39(2):91–105. doi:10.1093/chemse/bjt057
44. Ebrahim IO, Peacock KW (2005) REM sleep behavior disorder–psychiatric presentations: a case series from the United Kingdom. JClin Sleep Med 1(1):43–47
45. Wirz-Justice A, Van den Hoofdakker RH (1999) Sleep deprivation indepression: what do we know, where do we go? Biol Psychiatry46(4):445–453
46. Southmayd SE, David MM, Cairns J, Delva NJ, Letemendia FJ,Waldron JJ (1990) Sleep deprivation in depression: pattern of relapseand characteristics of preceding sleep. Biol Psychiatry 28(11):979–988
47. Mineur YS, Obayemi A, Wigestrand MB, Fote GM, Calarco CA, LiAM, Picciotto MR (2013) Cholinergic signaling in the hippocampusregulates social stress resilience and anxiety- and depression-likebehavior. Proc Natl Acad Sci U S A 110(9):3573–3578. doi:10.1073/pnas.1219731110
48. Gillin JC, Sutton L, Ruiz C, Kelsoe J, Dupont RM, Darko D, RischSC, Golshan S, Janowsky D (1991) The cholinergic rapid eye move-ment induction test with arecoline in depression. Arch GenPsychiatry 48(3):264–270
49. Basheer R, Magner M, McCarley RW, Shiromani PJ (1998) REMsleep deprivation increases the levels of tyrosine hydroxylase andnorepinephrine transporter mRNA in the locus coeruleus. Brain ResMol Brain Res 57(2):235–240
50. Shores MM, Szot P, Veith RC (1994) Desipramine-induced increasein norepinephrine transporter mRNA is not mediated via alpha 2receptors. Brain Res Mol Brain Res 27(2):337–341
51. Fujihara H, Sei H, Morita Y, Ueta Y, Morita K (2003) Short-termsleep disturbance enhances brain-derived neurotrophic factor geneexpression in rat hippocampus by acting as internal stressor. J MolNeurosci 21(3):223–232
52. DuncanWC, Sarasso S, Ferrarelli F, Selter J, Riedner BA, Hejazi NS,Yuan P, Brutsche N, Manji HK, Tononi G, Zarate CA (2013)Concomitant BDNF and sleep slow wave changes indicateketamine-induced plasticity in major depressive disorder. Int JNeuropsychopharmacol 16(2) :301–311. doi :10.1017/S1461145712000545
53. Schrag A (2004) Psychiatric aspects of Parkinson’s disease—anupdate. J Neurol 251(7):795–804
54. Dremencov E, NewmanME, Kinor N, Blatman-Jan G, Schindler CJ,Overstreet DH, Yadid G (2005) Hyperfunctionality of serotonin-2Creceptor-mediated inhibition of accumbal dopamine release in ananimal model of depression is reversed by antidepressant treatment.Neuropharmacology 48(1):34–42
55. Blandini F, Nappi G, Tassorelli C, Martignoni E (2000) Functionalchanges of the basal ganglia circuitry in Parkinson’s disease. ProgNeurobiol 62(1):63–88
56. Nestler EJ, BarrotM,DiLeone RJ, Eisch AJ, Gold SJ,Monteggia LM(2002) Neurobiology of depression. Neuron 34(1):13–25
Mol Neurobiol