Two levels decision system for efficient planning and implementation of bioenergy production
15
Two levels decision system for efficient planning and implementation of bioenergy production Nasser Ayoub * , Ricardo Martins, Kefeng Wang, Hiroya Seki, Yuji Naka Chemical Resources Laboratory, Process Systems Engineering Division, Tokyo Institute of Technology, R1-19, 4259 Nagatsuta, Midori-ku Yokohama 226-8503, Japan Received 9 March 2006; accepted 10 September 2006 Available online 13 November 2006 Abstract When planning bioenergy production from biomass, planners should take into account each and every stakeholder along the biomass supply chains, e.g. biomass resources suppliers, transportation, conversion and electricity suppliers. Also, the planners have to consider social concerns, environmental and economical impacts related with establishing the biomass systems and the specific difficulties of each country. To overcome these problems in a sustainable manner, a robust decision support system is required. For that purpose, a two levels general Bioenergy Decision System (gBEDS) for bioenergy production planning and implementation was developed. The core part of the gBEDS is the information base, which includes the basic bioenergy information and the detailed decision information. Basic bio- energy information include, for instance, the geographical information system (GIS) database, the biomass materials’ database, the bio- mass logistic database and the biomass conversion database. The detailed decision information considers the parameters’ values database with their default values and the variables database, values obtained by simulation and optimization. It also includes a scenario database, which is used for demonstration to new users and also for case based reasoning by planners and executers. Based on the information base, the following modules are included to support decision making: the simulation module with graph interface based on the unit pro- cess (UP) definition and the genetic algorithms (GAs) methods for optimal decisions and the Matlab module for applying data mining methods (fuzzy C-means clustering and decision trees) to the biomass collection points, to define the location of storage and bioenergy conversion plants based on the simulation and optimization model developed of the whole life cycle of bioenergy generation. Further- more, Matlab is used to set up a calculation model with crucial biomass planning parameters (e.g. costs, CO 2 emissions), over the pre- defined biomass supply chains. The GIS based interface allows visualization of all bioenergy conversion plants and storage data to support the users’ decision based on quantifiable outputs. With the help of the graphical interface, the users can define easily the feasible biomass supply chains, take decisions and evaluate them according to their own interests, might they be environmental, economical, social or others. Therefore, the gBEDS supports biomass energy planners in both national and regional levels to assess the options (tech- nically and economically) of biomass utilization and plan for bioenergy generation in a competent and sustainable way. Ó 2006 Elsevier Ltd. All rights reserved. Keywords: Decision support systems; Geographical information system; Bioenergy; Data mining; Fuzzy C-means clustering; Biomass 1. Introduction Bioenergy production from biomass resources is of great importance to keep the level of CO 2 emissions under con- trol. The decisions of planning and establishing biomass utilization projects have to overcome satisfactorily wide- spread types of problems such as: economical and technical feasibilities of bioenergy production; low energy values of biomass and complicated supply chain designs [1–3]. In the last two decades, many research works have been direc- ted towards estimating biomass potential as a source of energy at all levels of evaluation, i.e. global, national and regional [4–7]. At the same time, many attempts were con- ducted in the form of product and process development trying to overcome the different hindrances and provide 0196-8904/$ - see front matter Ó 2006 Elsevier Ltd. All rights reserved. doi:10.1016/j.enconman.2006.09.012 * Corresponding author. Tel.: +81 45 924 5258; fax: +81 45 924 5270. E-mail address: [email protected] (N. Ayoub). www.elsevier.com/locate/enconman Energy Conversion and Management 48 (2007) 709–723
-
Upload
independent -
Category
Documents
-
view
5 -
download
0
Transcript of Two levels decision system for efficient planning and implementation of bioenergy production

www.elsevier.com/locate/enconman
Energy Conversion and Management 48 (2007) 709–723
Two levels decision system for efficient planning and implementationof bioenergy production
Nasser Ayoub *, Ricardo Martins, Kefeng Wang, Hiroya Seki, Yuji Naka
Chemical Resources Laboratory, Process Systems Engineering Division, Tokyo Institute of Technology, R1-19, 4259 Nagatsuta,
Midori-ku Yokohama 226-8503, Japan
Received 9 March 2006; accepted 10 September 2006Available online 13 November 2006
Abstract
When planning bioenergy production from biomass, planners should take into account each and every stakeholder along the biomasssupply chains, e.g. biomass resources suppliers, transportation, conversion and electricity suppliers. Also, the planners have to considersocial concerns, environmental and economical impacts related with establishing the biomass systems and the specific difficulties of eachcountry. To overcome these problems in a sustainable manner, a robust decision support system is required. For that purpose, a twolevels general Bioenergy Decision System (gBEDS) for bioenergy production planning and implementation was developed. The core partof the gBEDS is the information base, which includes the basic bioenergy information and the detailed decision information. Basic bio-energy information include, for instance, the geographical information system (GIS) database, the biomass materials’ database, the bio-mass logistic database and the biomass conversion database. The detailed decision information considers the parameters’ values databasewith their default values and the variables database, values obtained by simulation and optimization. It also includes a scenario database,which is used for demonstration to new users and also for case based reasoning by planners and executers. Based on the informationbase, the following modules are included to support decision making: the simulation module with graph interface based on the unit pro-cess (UP) definition and the genetic algorithms (GAs) methods for optimal decisions and the Matlab module for applying data miningmethods (fuzzy C-means clustering and decision trees) to the biomass collection points, to define the location of storage and bioenergyconversion plants based on the simulation and optimization model developed of the whole life cycle of bioenergy generation. Further-more, Matlab is used to set up a calculation model with crucial biomass planning parameters (e.g. costs, CO2 emissions), over the pre-defined biomass supply chains. The GIS based interface allows visualization of all bioenergy conversion plants and storage data tosupport the users’ decision based on quantifiable outputs. With the help of the graphical interface, the users can define easily the feasiblebiomass supply chains, take decisions and evaluate them according to their own interests, might they be environmental, economical,social or others. Therefore, the gBEDS supports biomass energy planners in both national and regional levels to assess the options (tech-nically and economically) of biomass utilization and plan for bioenergy generation in a competent and sustainable way.� 2006 Elsevier Ltd. All rights reserved.
Keywords: Decision support systems; Geographical information system; Bioenergy; Data mining; Fuzzy C-means clustering; Biomass
1. Introduction
Bioenergy production from biomass resources is of greatimportance to keep the level of CO2 emissions under con-trol. The decisions of planning and establishing biomassutilization projects have to overcome satisfactorily wide-
0196-8904/$ - see front matter � 2006 Elsevier Ltd. All rights reserved.
doi:10.1016/j.enconman.2006.09.012
* Corresponding author. Tel.: +81 45 924 5258; fax: +81 45 924 5270.E-mail address: [email protected] (N. Ayoub).
spread types of problems such as: economical and technicalfeasibilities of bioenergy production; low energy values ofbiomass and complicated supply chain designs [1–3]. Inthe last two decades, many research works have been direc-ted towards estimating biomass potential as a source ofenergy at all levels of evaluation, i.e. global, national andregional [4–7]. At the same time, many attempts were con-ducted in the form of product and process developmenttrying to overcome the different hindrances and provide

710 N. Ayoub et al. / Energy Conversion and Management 48 (2007) 709–723
possible promotion methods for biomass utilization [8–12]or as decision support systems that deal with a set of com-plicated problems to provide acceptable solutions [13–16].Mitchell [13], reviewed a large number of decision supportmodels and systems, but those were mostly built anddesigned for supporting the technical and economical feasi-bilities, while some others were established for environmen-tal impacts estimations and only a few handle the socialimpact of biomass use. Some decision support systemsare developed considering both the environmental and eco-nomical sides and benefits from the geographical informa-tion system (GIS) capabilities [17,18,14,16]. However, thepreviously proposed decision support systems and modelsin the bioenergy field are mostly constructed for one typeof biomass from a specific point of view, i.e. economical,environmental or social, and focus on one decision level,either regional or national [19,20]. This exemplifies the needfor a system that handles all bioenergy production stake-holders’ objectives in both national and regional decisionlevels and involves different possible types of biomass witheffective potential for energy production.
Decision support systems (DSS) are computer technol-ogy systems that can be used to support complex decisionmaking and problem solving [21], providing the user withan accessible computer interface where the results are pre-sented in a readily understandable form. DSS link theinformation processing capabilities of a management infor-mation system with modeling techniques and the judgmentof managers to support decision making in unstructuredsituations. As the social concern is slowly moving towardsseeking not only economical but also sustainable energyproduction methods as well as social benefits [22], a useroriented decision support system is needed to support theenergy planners in meeting such changes in interests. In thisrespect, a general bioenergy decision system (gBEDS) withknowledge discovery capabilities, i.e. data mining has beenproposed to assist in planning and implementing bioenergyproduction systems. In the following paragraphs, some ofthe aforementioned DSSs will be analyzed.
1.1. DSS for economical and environmental decisions
The development of an economical DSS is very popularin all applied science fields to deal with the entangled set ofproduction and marketing problems to reach an optimal ornear optimal solution, e.g. production planning, risk man-agement [23] and recently in environmental decisionmaking [24,25]. However, little work is found in the bioen-ergy planning field for economical and environmental deci-sion making. This might be explained by the loweconomical attractiveness of biomass. The bioenergyassessment model (BEAM), a spreadsheet based decisionsupport system has been developed [19] for technoeco-nomic assessment of biomass to electricity schemes, includ-ing investigation on the interfacing issues. The modelconsiders biomass supply from conventional forestry andshort rotation coppice and has the possibility of handling
different conversion routes, combustion, pyrolysis, gasifica-tion and integrated gasification combined cycle (IGCC) toelectricity as well as two biological routes to ethanol. Amodule for investigating the collection and generation ofelectricity from municipal solid waste (MSW) was also pre-sented. Additionally, different scenarios of electricity andheat production from biomass were proposed and dynam-ically evaluated for economic efficiency by a mixed integerlinear optimization model [26]. The model aimed at deter-mination of the economic energy supply structure consider-ing different kinds of users and investors to reduce biomassfuel prices. A decision support framework for choosing effi-cient, environmentally sound and economically feasiblegreenhouse gas (GHG) emission reduction scenarios in for-estry is also constructed and tested for realistic scenariosincluding forest conservation, forest expansion, forest man-agement, forest products usability and substitution of fossilfuels with woody biomass [20]. The system consists of threeevaluation modules: the carbon assessment module forestimating emission reduction per hectare per year; theenvironmental assessment module for assessment of envi-ronmental impacts of carbon projects and the economicassessment module to obtain the net cost of 1 ton emissionreduction.
1.2. DSS integrated with GIS
The idea of using the geographical information system(GIS) in decision support systems is not new and is foundin the development of many decision support systems [27–30]. However, the integration between the GIS and theDSS technology is comparatively less extensive in the bio-energy planning field. An optimal planning decision sup-port system of biomass as a source of energy for aconsortium of municipalities in an Italian mountain regionwas developed [15]. That study suggests actions and poli-cies for biomass exploitation in the region, the sizing ofplants and the verification of the performance over theentire system. The authors applied mathematical optimiza-tion technologies integrated with the GIS and databases,whose information was gathered through experimentaltests and interaction with experts. Voivontas [18] presenteda method for estimating the potential of bioenergy produc-tion from agriculture residues at the regional level througha GIS decision support system. This DSS provides tools toidentify the geographic distribution of the economical bio-mass potential in four exploitation levels, i.e. theoretical,available, technological and economical, relying on themodeling capabilities of the GIS environment. The authorsused electricity production cost as the main criterion in theidentification of the sites of economically exploited biomasspotential. A two part method for estimating potential fuel-wood resources from forests based on forest inventory datawas also presented [14]. The first part considers the assess-ment of fuelwood resources potential, and the second partdeals with the economical availability of resources. Thebiomass assessment data, location of conversion facilities
N. Ayoub et al. / Energy Conversion and Management 48 (2007) 709–723 711
and projected consumption were incorporated into an eco-nomic model based on the GIS to form industrial marginalcost of supply curves from an optimization of the alloca-tion of fuelwood using linear programming. Another meth-odology, used a GIS application to generate marginal pricesurfaces when the number of potential supply points andthe number of candidate plant locations are both verylarge, was developed to identify locations for switch grassto ethanol conversion plants [31]. The same methodologywas tested to evaluate two ways of procurement pricing,fixed and discriminatory [32]. In the fixed pricing methodof procurement, the facility pays one fixed price per deliv-ered ton. In the discriminatory pricing method of procure-ment, the facility pays a source specific price per ton beforedelivery and then pays the cost of delivery transportation.Their results show a cost advantage of discriminatory overfixed pricing with the relative cost advantage variation as afunction of location and facility size.
1.3. Data mining DSS
The use of data mining in decision support systems ispopular in medical, information technology [30,33] andrecently in environmental applications [34,35]. However,in the field of biomass planning and utilization, no previouswork was conducted.
After reviewing previous works and careful consider-ation of their limitations, a two level general bioenergydecision system (gBEDS) is proposed to overcome suchdrawbacks and assist in planning for bioenergy generationfrom biomass and introduce data mining methods as a newdecision support tool in the biomass energy productionfield. The proposed system provides general functions ofdata visualization, data analysis and simulation methodsto support decisions regarding bioenergy generation. ThegBEDS divides the bioenergy generation decisions intonational and regional levels. Different methods of data
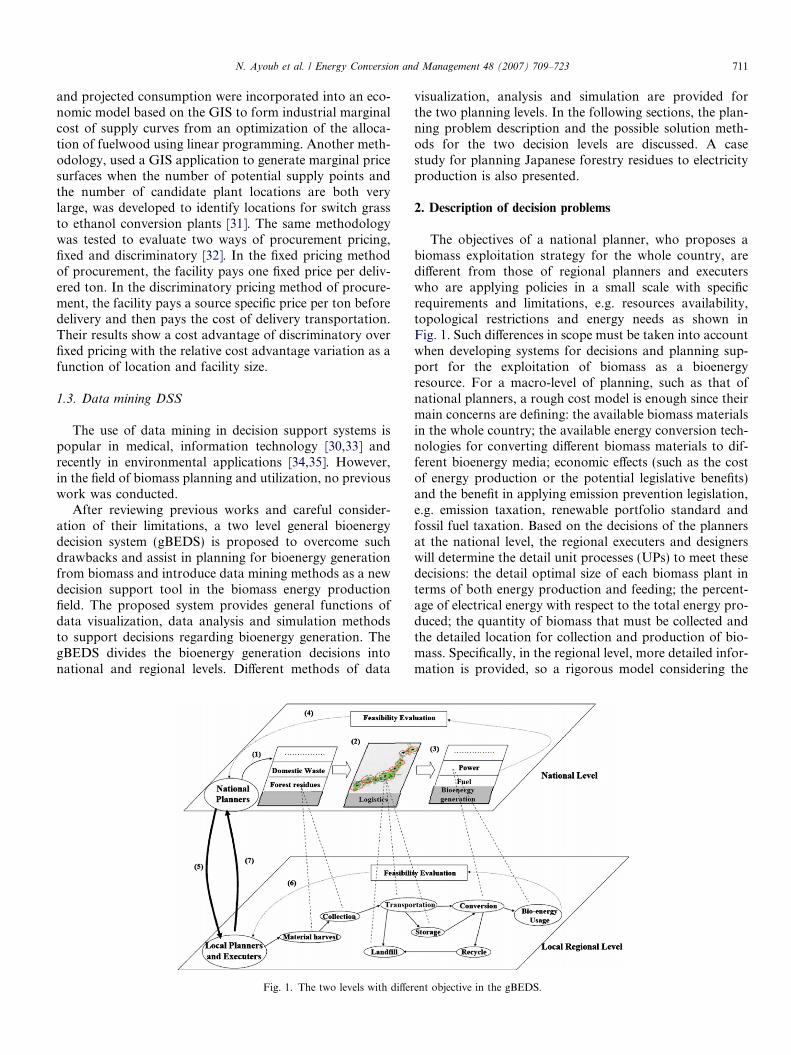
Fig. 1. The two levels with differ
visualization, analysis and simulation are provided forthe two planning levels. In the following sections, the plan-ning problem description and the possible solution meth-ods for the two decision levels are discussed. A casestudy for planning Japanese forestry residues to electricityproduction is also presented.
2. Description of decision problems
The objectives of a national planner, who proposes abiomass exploitation strategy for the whole country, aredifferent from those of regional planners and executerswho are applying policies in a small scale with specificrequirements and limitations, e.g. resources availability,topological restrictions and energy needs as shown inFig. 1. Such differences in scope must be taken into accountwhen developing systems for decisions and planning sup-port for the exploitation of biomass as a bioenergyresource. For a macro-level of planning, such as that ofnational planners, a rough cost model is enough since theirmain concerns are defining: the available biomass materialsin the whole country; the available energy conversion tech-nologies for converting different biomass materials to dif-ferent bioenergy media; economic effects (such as the costof energy production or the potential legislative benefits)and the benefit in applying emission prevention legislation,e.g. emission taxation, renewable portfolio standard andfossil fuel taxation. Based on the decisions of the plannersat the national level, the regional executers and designerswill determine the detail unit processes (UPs) to meet thesedecisions: the detail optimal size of each biomass plant interms of both energy production and feeding; the percent-age of electrical energy with respect to the total energy pro-duced; the quantity of biomass that must be collected andthe detailed location for collection and production of bio-mass. Specifically, in the regional level, more detailed infor-mation is provided, so a rigorous model considering the
ent objective in the gBEDS.

712 N. Ayoub et al. / Energy Conversion and Management 48 (2007) 709–723
biomass and its logistic costs, the energy conversion costsproduced by the whole system and the labor cost shouldbe applied for its whole life cycle. To keep biomass exploi-tation sustainable, users need to determine which biomassand what quantities are feasible for collection, the collec-tion points and, consequently, their geographical position.According to the decisions made by the regional plannersand executers, the decisions of the national level may beapplied, rejected or modified, as a result of typical regionalinputs, as seen in the number sequence in Fig. 1.
3. System description
3.1. The gBEDS conceptual structure
As shown in Fig. 2, the proposed gBEDS consists offour parts; a common database; a simulation module; anin line domain knowledge evaluation module; and a userinterface. The common database includes relevant dataabout biomass types database, biomass logistics database,biomass conversion database and GIS database. The plan-ners define the feasible paths from the common databasesupported by the in line domain knowledge evaluationmodule, e.g. the selection of sewage sludge cannot matchwith the gasification without severe drying. After selectionof the feasible path for biomass material, simulation andfurther data analysis performed by fuzzy C-means cluster-ing algorithms and GAs [36,37] produce the results, whichare visualized via ArcGIS for easier evaluation of thedesired supply chain for decision making.
3.2. Development of the gBEDS
The gBEDS is built on a technological informationinfrastructure concept that captures the biomass entire lifecycle [38] to support the design and operation simulta-neously, considering economical impacts (total investmentsto establish the bioenergy business, costs per MWh of bio-energy etc.), environmental impacts (GHG emissions,energy saving and renewable portfolio standard (RPS) pro-
GISDB
Biomass DB
LogisticsDB
ConversionDB
Harvest Transport Store Co
R
Unit Process (
Feasible p
Infeasible
Fig. 2. The conceptual str
motion) and social impacts (job creation potential andenergy tax application). gBEDS deals with the biomass uti-lization problems as a source of bioenergy from a nation-wide perspective to a regional one. The main ideas forgBEDS development will now be presented.
3.2.1. Technological information base
In this system, the whole life cycle from biomassresources to bioenergy should be considered due to theenvironmental problems, and many actors will be involvedin the decisions, from the officer in the national level andthe regional level to the detail experts in biomass harvest,transportation and bioenergy conversion and so on. There-fore, a general information base is developed and consid-ered as the core of the system. The information system isbuilt on MS Access 2000, which provides not only the func-tions to save the data but also the interface to edit andsearch the relevant data.
The technological information base includes:
(1) The basic information for the whole life cycle of bio-mass and bioenergy, e.g. the GIS database, the bio-mass material database, the logistic database andthe conversion database.
(2) The model information for decision taking about bio-mass and bioenergy, e.g. model database saving thevariables, parameters and equations, which are com-posed of some sub-model, i.e. UP database.
(3) The detail decision information, e.g. the parametersdatabase, where default values are saved, the variabledatabase, which is composed of the simulation valuedatabase (values obtained by simulation), the optimi-zation value database (values obtained after optimi-zation) and the real value database (values actuallyused).
(4) The scenario database, which is used for demonstra-tion purposes for new users and as case based reason-ing by planners and executers. Communication withthe different database is managed by a proper ODBC(open database connectivity) interface.
Evaluationsystem with in-line domain knowledge
nversion Use
ecycle Use
UP)
Interface
ath
path
ucture of the gBEDS.

Fig. 3. gBEDS architecture.
N. Ayoub et al. / Energy Conversion and Management 48 (2007) 709–723 713
3.2.2. System architecture
The decision support is provided based on the following
modules as shown in Fig. 3:(1) The technological information base, which is sharedby the users.
(2) The GIS based interface using the ESRI commercialArcGIS9 environment [39] for data visualization.
(3) The fuzzy C-means clustering methods and GA meth-ods for optimal decisions; whose source code is pro-vide by the Matlab environment [40].
(4) The unit process (UP) simulation interface modulebased on the UP definition [38].
(5) The in line domain knowledge for evaluating the userselections of the supply chain.
(6) The user interface between the modules mentionedabove and the users.
The user’s computer should have the followingcharacteristics:
• At least 256 MB memory.• 10 MB or more of free disk space (The data preservation
area is excluded).• A SVGA Monitor (800 · 600 256 colors) or better.• Pointing device, such as mouse.• Operating system that operates J2SE1.4 or higher as
Java execution environment.
3.3. Solution methods for decision problems in the national
level
The biomass GIS database for the country is provided,assigning the amount of biomass resource quantity attri-
butes to each city in a year base (ton/year) in the form ofpoints in case of spot production methods, e.g. food indus-try, saw mill residues or uniformly distributed over the cityarea. To help the user to have useful information from suchdata available, gBEDS provides the solution of the decisionproblems as explained in the following subsections.
3.3.1. Defining the feasible biomass quantityThe gBEDS classifies the biomass resources into avail-
able (all biomass resources produced), possible (the quanti-ties of biomass that can be easily collected for all uses) andfeasible (the biomass quantities that can be used for energyproduction). The first step is to subtract the biomass quan-tities used for different purposes, like fertilizers, bio-prod-ucts or others, to have the possible quantities for energyproduction. At this level, the utilized quantity from the bio-mass type is estimated assuming a fixed utilization ratio ofthe total available quantity of the resource in the country.However, in the regional level, the specific quantity in eachcity is employed. In the case of distributed quantities, thetotal number of possible collection points and their loca-tions in each city are determined by applying the algorithmshown in Fig. 4.
For all biomass types, the possible biomass quantities arefeasible for collection except for the forestry residues wherethe feasible biomass quantities are determined based on themaximum access distance inside the forest from the road inthe country and has to be defined by the user, the systemomits all points located a distance more than the desired dis-tance. The process algorithm is explained in Fig. 5.
3.3.2. Setting the technically feasible supply chainThe activities that take place in the biomass supply
chain are highly interconnected, and it is easy to under-stand how upstream decision making affects later activities
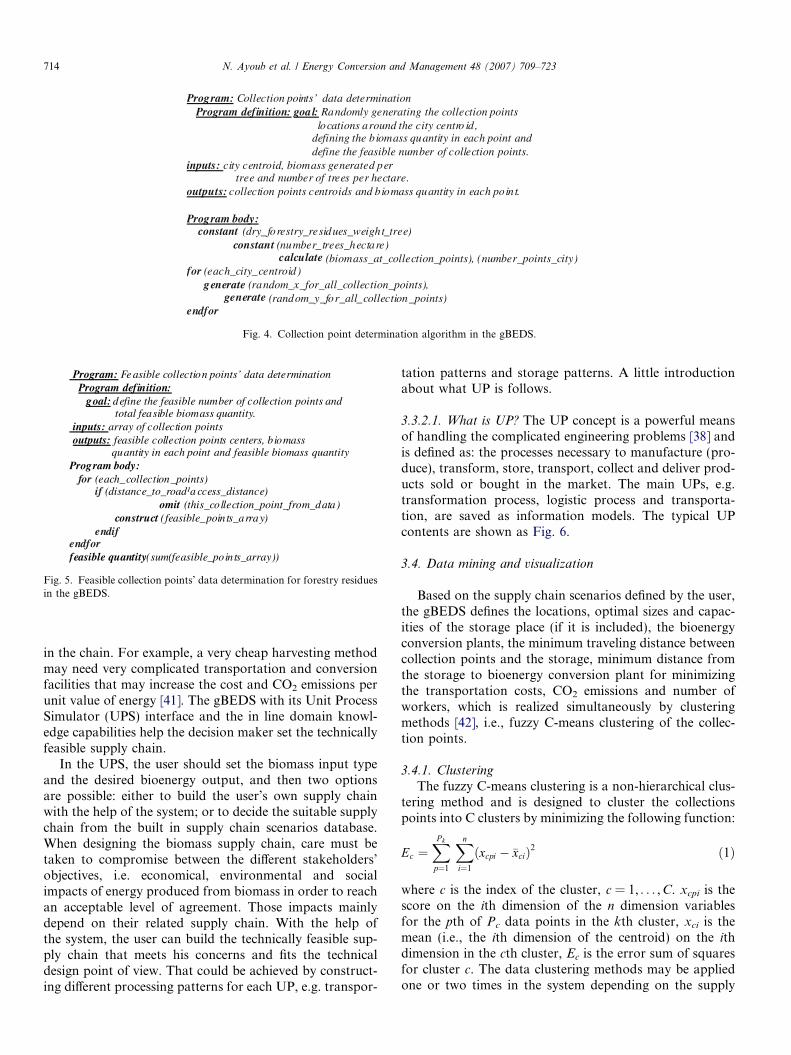
Program: Collection points’ data determination Program definition: goal: Randomly generating the collection points locations around the city centro id, defining the biomass quantity in each point and
define the feasible number of collection points. inputs: city centroid, biomass generated per
tree and number of trees per hectare. outputs: collection points centroids and biomass quantity in each point.
Program body: constant (dry_forestry_residues_weight_tree)
constant (number_trees_hectare) calculate (biomass_at_collection_points), (number_points_city) for (each_city_centroid) generate (random_x_for_all_collection_points), generate (random_y_for_all_collection_points) endfor
Fig. 4. Collection point determination algorithm in the gBEDS.
Program: Fe asible collection points’ data determination Program definition: goal: define the feasible number of collection points and total feasible biomass quantity. inputs: array of collection points outputs: feasible collection points centers, biomass
quantity in each point and feasible biomass quantity Program body: for (each_collection_points) if (distance_to_road¹a ccess_distance) omit (this_collection_point_from_data)
construct (feasible_points_array) endif endfor feasible quantity(sum(feasible_points_array))
Fig. 5. Feasible collection points’ data determination for forestry residuesin the gBEDS.
714 N. Ayoub et al. / Energy Conversion and Management 48 (2007) 709–723
in the chain. For example, a very cheap harvesting methodmay need very complicated transportation and conversionfacilities that may increase the cost and CO2 emissions perunit value of energy [41]. The gBEDS with its Unit ProcessSimulator (UPS) interface and the in line domain knowl-edge capabilities help the decision maker set the technicallyfeasible supply chain.
In the UPS, the user should set the biomass input typeand the desired bioenergy output, and then two optionsare possible: either to build the user’s own supply chainwith the help of the system; or to decide the suitable supplychain from the built in supply chain scenarios database.When designing the biomass supply chain, care must betaken to compromise between the different stakeholders’objectives, i.e. economical, environmental and socialimpacts of energy produced from biomass in order to reachan acceptable level of agreement. Those impacts mainlydepend on their related supply chain. With the help ofthe system, the user can build the technically feasible sup-ply chain that meets his concerns and fits the technicaldesign point of view. That could be achieved by construct-ing different processing patterns for each UP, e.g. transpor-
tation patterns and storage patterns. A little introductionabout what UP is follows.
3.3.2.1. What is UP? The UP concept is a powerful meansof handling the complicated engineering problems [38] andis defined as: the processes necessary to manufacture (pro-duce), transform, store, transport, collect and deliver prod-ucts sold or bought in the market. The main UPs, e.g.transformation process, logistic process and transporta-tion, are saved as information models. The typical UPcontents are shown as Fig. 6.
3.4. Data mining and visualization
Based on the supply chain scenarios defined by the user,the gBEDS defines the locations, optimal sizes and capac-ities of the storage place (if it is included), the bioenergyconversion plants, the minimum traveling distance betweencollection points and the storage, minimum distance fromthe storage to bioenergy conversion plant for minimizingthe transportation costs, CO2 emissions and number ofworkers, which is realized simultaneously by clusteringmethods [42], i.e., fuzzy C-means clustering of the collec-tion points.
3.4.1. Clustering
The fuzzy C-means clustering is a non-hierarchical clus-tering method and is designed to cluster the collectionspoints into C clusters by minimizing the following function:
Ec ¼XP k
p¼1
Xn
i¼1
ðxcpi � �xciÞ2 ð1Þ
where c is the index of the cluster, c = 1, . . . ,C. xcpi is thescore on the ith dimension of the n dimension variablesfor the pth of Pc data points in the kth cluster, xci is themean (i.e., the ith dimension of the centroid) on the ithdimension in the cth cluster, Ec is the error sum of squaresfor cluster c. The data clustering methods may be appliedone or two times in the system depending on the supply
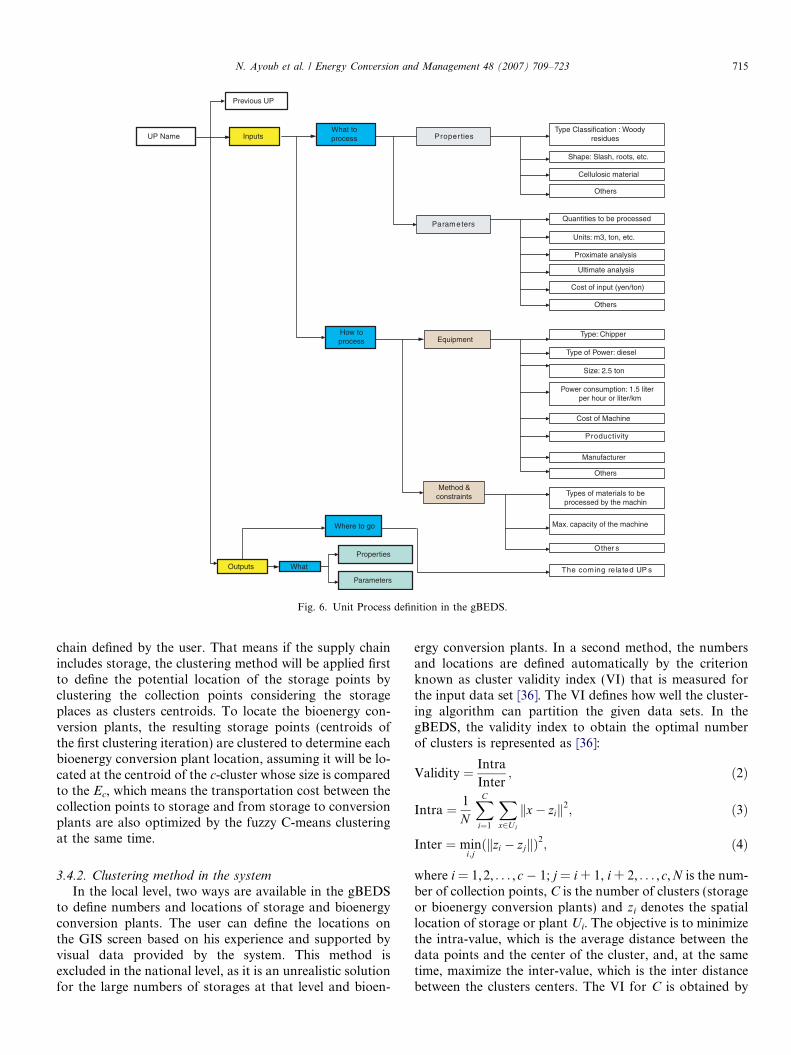
UP Name What toprocess
How toprocess
Where to go
Type Classification : Woodyresidues
Shape: Slash, roots, etc.
Units: m3, ton, etc.
Quantities to be processed
Inputs
Outputs
Proper ties
Parameters
Ultimate analysis
Proximate analysis
Others
Equipment
Method &constraints
Type: Chipper
Type of Power: diesel
Size: 2.5 ton
Power consumption: 1.5 literper hour or liter/km
Cost of Machine
Types of materials to beprocessed by the machin
Productivity
Cellulosic material
Cost of input (yen/ton)
Others
Manufacturer
Max. capacity of the machine
Other s
Others
The coming re lated UP s
Properties
Parameters
What
Previous UP
Fig. 6. Unit Process definition in the gBEDS.
N. Ayoub et al. / Energy Conversion and Management 48 (2007) 709–723 715
chain defined by the user. That means if the supply chainincludes storage, the clustering method will be applied firstto define the potential location of the storage points byclustering the collection points considering the storageplaces as clusters centroids. To locate the bioenergy con-version plants, the resulting storage points (centroids ofthe first clustering iteration) are clustered to determine eachbioenergy conversion plant location, assuming it will be lo-cated at the centroid of the c-cluster whose size is comparedto the Ec, which means the transportation cost between thecollection points to storage and from storage to conversionplants are also optimized by the fuzzy C-means clusteringat the same time.
3.4.2. Clustering method in the systemIn the local level, two ways are available in the gBEDS
to define numbers and locations of storage and bioenergyconversion plants. The user can define the locations onthe GIS screen based on his experience and supported byvisual data provided by the system. This method isexcluded in the national level, as it is an unrealistic solutionfor the large numbers of storages at that level and bioen-
ergy conversion plants. In a second method, the numbersand locations are defined automatically by the criterionknown as cluster validity index (VI) that is measured forthe input data set [36]. The VI defines how well the cluster-ing algorithm can partition the given data sets. In thegBEDS, the validity index to obtain the optimal numberof clusters is represented as [36]:
Validity ¼ Intra
Inter; ð2Þ
Intra ¼ 1
N
XC
i¼1
X
x2Ui
kx� zik2; ð3Þ
Inter ¼ mini;jðkzi � zjkÞ2; ð4Þ
where i = 1,2, . . . ,c � 1; j = i + 1, i + 2, . . . ,c,N is the num-ber of collection points, C is the number of clusters (storageor bioenergy conversion plants) and zi denotes the spatiallocation of storage or plant Ui. The objective is to minimizethe intra-value, which is the average distance between thedata points and the center of the cluster, and, at the sametime, maximize the inter-value, which is the inter distancebetween the clusters centers. The VI for C is obtained by
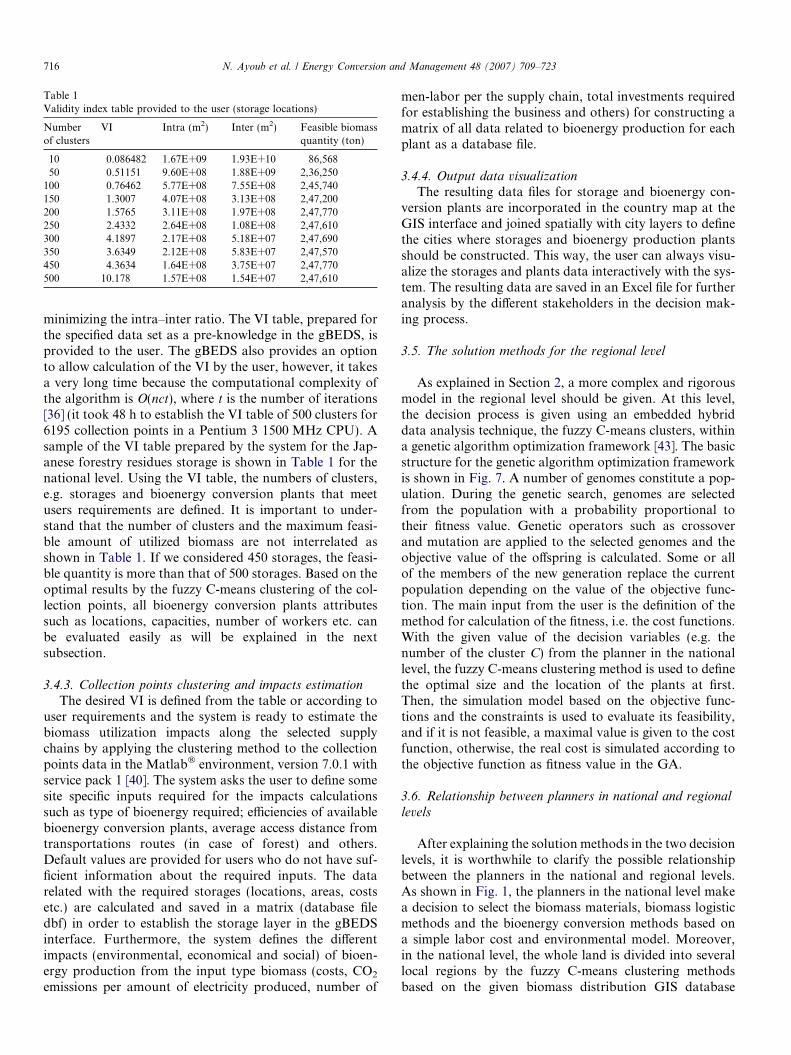
Table 1Validity index table provided to the user (storage locations)
Numberof clusters
VI Intra (m2) Inter (m2) Feasible biomassquantity (ton)
10 0.086482 1.67E+09 1.93E+10 86,56850 0.51151 9.60E+08 1.88E+09 2,36,250
100 0.76462 5.77E+08 7.55E+08 2,45,740150 1.3007 4.07E+08 3.13E+08 2,47,200200 1.5765 3.11E+08 1.97E+08 2,47,770250 2.4332 2.64E+08 1.08E+08 2,47,610300 4.1897 2.17E+08 5.18E+07 2,47,690350 3.6349 2.12E+08 5.83E+07 2,47,570450 4.3634 1.64E+08 3.75E+07 2,47,770500 10.178 1.57E+08 1.54E+07 2,47,610
716 N. Ayoub et al. / Energy Conversion and Management 48 (2007) 709–723
minimizing the intra–inter ratio. The VI table, prepared forthe specified data set as a pre-knowledge in the gBEDS, isprovided to the user. The gBEDS also provides an optionto allow calculation of the VI by the user, however, it takesa very long time because the computational complexity ofthe algorithm is O(nct), where t is the number of iterations[36] (it took 48 h to establish the VI table of 500 clusters for6195 collection points in a Pentium 3 1500 MHz CPU). Asample of the VI table prepared by the system for the Jap-anese forestry residues storage is shown in Table 1 for thenational level. Using the VI table, the numbers of clusters,e.g. storages and bioenergy conversion plants that meetusers requirements are defined. It is important to under-stand that the number of clusters and the maximum feasi-ble amount of utilized biomass are not interrelated asshown in Table 1. If we considered 450 storages, the feasi-ble quantity is more than that of 500 storages. Based on theoptimal results by the fuzzy C-means clustering of the col-lection points, all bioenergy conversion plants attributessuch as locations, capacities, number of workers etc. canbe evaluated easily as will be explained in the nextsubsection.
3.4.3. Collection points clustering and impacts estimation
The desired VI is defined from the table or according touser requirements and the system is ready to estimate thebiomass utilization impacts along the selected supplychains by applying the clustering method to the collectionpoints data in the Matlab� environment, version 7.0.1 withservice pack 1 [40]. The system asks the user to define somesite specific inputs required for the impacts calculationssuch as type of bioenergy required; efficiencies of availablebioenergy conversion plants, average access distance fromtransportations routes (in case of forest) and others.Default values are provided for users who do not have suf-ficient information about the required inputs. The datarelated with the required storages (locations, areas, costsetc.) are calculated and saved in a matrix (database filedbf) in order to establish the storage layer in the gBEDSinterface. Furthermore, the system defines the differentimpacts (environmental, economical and social) of bioen-ergy production from the input type biomass (costs, CO2
emissions per amount of electricity produced, number of
men-labor per the supply chain, total investments requiredfor establishing the business and others) for constructing amatrix of all data related to bioenergy production for eachplant as a database file.
3.4.4. Output data visualizationThe resulting data files for storage and bioenergy con-
version plants are incorporated in the country map at theGIS interface and joined spatially with city layers to definethe cities where storages and bioenergy production plantsshould be constructed. This way, the user can always visu-alize the storages and plants data interactively with the sys-tem. The resulting data are saved in an Excel file for furtheranalysis by the different stakeholders in the decision mak-ing process.
3.5. The solution methods for the regional level
As explained in Section 2, a more complex and rigorousmodel in the regional level should be given. At this level,the decision process is given using an embedded hybriddata analysis technique, the fuzzy C-means clusters, withina genetic algorithm optimization framework [43]. The basicstructure for the genetic algorithm optimization frameworkis shown in Fig. 7. A number of genomes constitute a pop-ulation. During the genetic search, genomes are selectedfrom the population with a probability proportional totheir fitness value. Genetic operators such as crossoverand mutation are applied to the selected genomes and theobjective value of the offspring is calculated. Some or allof the members of the new generation replace the currentpopulation depending on the value of the objective func-tion. The main input from the user is the definition of themethod for calculation of the fitness, i.e. the cost functions.With the given value of the decision variables (e.g. thenumber of the cluster C) from the planner in the nationallevel, the fuzzy C-means clustering method is used to definethe optimal size and the location of the plants at first.Then, the simulation model based on the objective func-tions and the constraints is used to evaluate its feasibility,and if it is not feasible, a maximal value is given to the costfunction, otherwise, the real cost is simulated according tothe objective function as fitness value in the GA.
3.6. Relationship between planners in national and regional
levels
After explaining the solution methods in the two decisionlevels, it is worthwhile to clarify the possible relationshipbetween the planners in the national and regional levels.As shown in Fig. 1, the planners in the national level makea decision to select the biomass materials, biomass logisticmethods and the bioenergy conversion methods based ona simple labor cost and environmental model. Moreover,in the national level, the whole land is divided into severallocal regions by the fuzzy C-means clustering methodsbased on the given biomass distribution GIS database

PopulationInitialization
Mutation
ReplaceIndividuals Crossover
Terminate? Selection
Evaluation
EndYes
No
Fig. 7. General structure of genetic algorithms used in the gBEDS.
N. Ayoub et al. / Energy Conversion and Management 48 (2007) 709–723 717
where the real geography information in the local regions isnot considered. For instance, the difficulties imposed byhills are not taken into account in the possibility of trans-portation. Therefore, such decisions made in the nationallevel should be reviewed in the regional level for its effectiveand practical feasibility. While making the decisions in theregional level, some input information should be given bythe strategic planers in the national level to evaluate the realcost based on a detailed model. Therefore, we can concludethat there should be a synergetic integration among actors,perspectives, objectives and tools in both levels for efficientdecision making.
3.7. System users and application
When designing any planning support system, oneshould consider who will use the system and the types offunctionality the system will provide. In the following sec-tions, these two important issues are considered under theframework of the system presented here.
3.7.1. User classificationThe target users of the system include governmental pol-
icy designers of energy systems in the national level, indi-viduals related to eco-management (environmentalprotection, environmental accounting and reporting) atthe enterprise and governmental level, university and gov-ernment researchers and companies interested in biomassmanagement and technology in both the national and locallevels.
3.7.2. Functionality
The proposed gBEDS is designed to provide the follow-ing functions:
• GIS data visualization methods to identify the geo-graphic distribution of the economically exploitable bio-mass potential;
• data analysis methods (e.g., fuzzy C-means clusteringmethods and decision trees) for assessment of the theo-retical, available and economically exploitable biomasspotential;
• determination of the economical biomass collectionpoints, storage points and bioenergy conversion plantsgeographical distribution; and
• simulation methods based on cost modeling to provideoptimal decision making for bioenergy generation atthe national and local levels.
4. Case study: electricity from forestry residues in Japan
Designing the forestry residues supply chains for powergeneration in Japan has different characteristics than inother countries like, for instance European countries.These differences originate from the nature of the land, for-est residues density, forestry population and weather. Forexample, Japanese weather is mostly wet, and it can rainat any time, which creates a need for covered material stor-age. Also, the mountainous topography prevents highcapacity equipments from being employed. Limited accessdistances and low density forests result in difficulties in esti-mating the feasible amount of forestry residues that may beused as a source of bioenergy. In this case study, the Japa-nese geographical information system data base (GISDB)for forestry residues is applied to demonstrate the gBEDSis efficient in supporting decision making for bioenergyproduction.
4.1. Supply chain in the case study
In this study, the harvesting is assumed in three epi-sodes depending on the weather, two months for each[44]. After harvesting, the forestry residues are left todry at the harvesting site for another two months beforechipping at the harvesting site using a mobile chipper

718 N. Ayoub et al. / Energy Conversion and Management 48 (2007) 709–723
and moved to the roadside using small size forwarders[44–46]. Small size trucks are used along the roadsidefor transporting the chips to the storage place. Forestryresidues chips are stored a maximum of 4 months beforedelivery to the power plant. That means storage facilitiesare utilized the whole year by one third of the chipsamount, which reduce the storage costs to one third ofwhole year storage costs.
Because of the wet Japanese climate, indoor storagenear the forests is assumed. The GHG emissions fromstorage in the system were modeled based on Wihersaari[47], assuming that CH4 is released from wood chips inthe first two months of storage and then N2O starts tobe released. Then, chips are transported in mediumcapacity trucks to be converted in the fluid bed combus-tion system, followed by steam turbine cycle power gen-eration (C/ST). At last, after conversion, the ash istransported for landfill. In the bioenergy supply chainseen in Fig. 8, the costs of the connections and sellingelectricity are also included for cost estimation. Emis-sions from fossil fuels production, equipment manufac-turing and infrastructure are not included in thecalculations. These factors seem, however, to be of minorimportance as stated in previous investigations [48].
Storage of chips at tent
Truck transportation for ch
Conversion of wood celectricity at the powe
Connection to Electricity
Selling electricit
Chipping Forestry residue
Forwarding chips to roa
Truck transportation to
Forestry residues proand dried at harvestin
Energy
Capital
Equipments
Operations
System boundaries for cost calculations
Fig. 8. Bioenergy supply c
4.2. Data used in the case study
In this case study, the data was collected from two mainresources: meetings with experts and literature, not onlyfrom Japan, but also from other countries. All currency fig-ures in this work are expressed in Japanese yen, JPY, on a2005 year base unless otherwise noted. The required con-version to European Euro, €, and US dollar, $, has beendone at the rate of 140.299 JPY and 118 JPY, respectively.Costs from the literature beyond year 2000 were used with-out considering the inflation rate, assuming that the costreduction from the promotion of biomass utilization com-pensates the cost difference. The case study aims at estimat-ing the different impacts of power generation usingJapanese forestry residues. The forestry residues propertiesare shown in Table 2, and the equipment data and valuesare presented in Table 3.
In this case study, we assumed no cost for buying theforestry residues as it is mostly left in the forest until dete-rioration. For the electricity production planning, the costmodel developed by Caputo [49] was used for the plantcosts estimations, however, their cost model was con-structed for 5 MW electricity power plants, which mayincrease the uncertainty in the costs estimation.
house
ips to Plant
hips to r plant
network Ash landfilled
y
s at harvesting
dside
storage
Ash transportation tolandfill
duced g site
CO2 Emissions
Electricity
Revenue
System boundaries for CO2
emission
Labours
hain in the case study.

Table 3Equipment data
Feature Value
Plant life (years) 30b
Net plant efficiency (LHV) (%) 30b
Plant operating hours (h/year) 8000a
Forwarders capacities (ton) 2.5–10a
Chippers weight (ton) 2.5a
Chippers productivity (ton/h) 0.45a
Truck capacity for transportation to storage (ton) 4Truck capacity for transportation to plant (ton) 15
a Ref. [44].b Ref. [50].
Table 2Forestry residues properties
Characteristics Value
Moisture content (%) 35a
Heating values (MJ ton�1, LHV) 14650a
Bulk density during transport 0.2518b
(dry ton m�3)Ash contents (%) 2a
a Ref. [49].b Ref. [44].
N. Ayoub et al. / Energy Conversion and Management 48 (2007) 709–723 719
4.3. The gBEDS results for the supply chain
As explained in the targets of this research work, thegBEDS is constructed to support decisions making thatcan fulfill, as much as possible, the intentions of all thestakeholders in the bioenergy field. In this respect, theresults are classified as: biomass potential (how much bio-mass is available in the country or the region); results forenvironmental decision support (CO2 emissions, energysaving); results for economical decision support (cost ofenergy production, annual investments) and results forsocial decision support (number of workers, energy taxes).Those results are all shown to the user as explained in thefollowing sub-sections.
4.3.1. Forestry residues potentialThe amount of available forestry residues in Japan as
calculated from the Japanese forestry GISDB was foundto be 1.84 million ton of 15% moisture contents. However,according to our model calculations only a maximum ofabout 13% of that is feasible for all uses (in this case study,all residues were used for electricity production), whichmay produce about 50 MW for 200 m access distanceinside the forest or almost 70 MW, if the access distanceis increased to 300 m.
4.3.2. Results for environmental decision support
The CO2 emissions from bioenergy production is con-sidered as the main motivating reason in promoting bio-mass utilization projects in order to replace the mainsource of GHG, fossil fuels. The CO2 emissions of electric-ity production from forestry residues was calculated for all
the power plants locations proposed by the system andfound to be between 125 and 135 kg CO2/MWh. TheCO2 emissions from electricity production using oil asraw material in Japan is 742.3 kg CO2/MWh [51] (this fig-ure is supposed to be very high compared to that of Fin-land and Hungry, 312 and 342.8, respectively [52]). Thebig difference between biomass emissions and oil emissionsmay clarify their potential of emissions reduction whenused as the source of electricity. More specific data are alsoprovided by the system for each power plant to help deci-sion makers in taking individual decisions for establishingor rejecting the proposed locations. The gBEDS includesmore environmental decision support parameters individu-ally described for each power plant, such as emissions fromeach UP considered.
4.3.3. Results for economical decision support
The gBEDS estimates total investments per year for thewhole country for each proposed power plant location andthe production costs of 1 MWh of bioenergy. The costs ofelectricity production ranged from 30,000 to 50,000 JPY/MWh depending on the location of the power plant andits distance to collection points. These cost figures are, asexpected, very high compared to that of depleted materials.However, it is in good agreement with those of renewableenergies [53,54]. The effect of applying environmental car-bon taxation is also included in order to give the user infor-mation about the situation if the tax is applied. Withenvironmental carbon tax equal to 9000 JPY/ton CO2
released from fossil fuels use the costs per MWh could bereduced by about 5500 JPY. Also, many economicalparameters are given for each power plant in the gBEDS,e.g. annual total required investments, number of equip-ment in each UPand costs of storage UP.
4.3.4. Results for social decision support
Carbon dioxide and energy taxes have a distinguishedimpact in the promotion of renewable energy and, atthe same time, reduce the environmental impacts. Onthe other hand, these taxes are mainly paid by all societysectors, where we always find an immense resistanceagainst applying them. Convincing the people throughexplaining the possible merits of renewable energy canbe supported in the gBEDS by viewing the possible num-ber of jobs that can be generated via bioenergy projectsestablishment. For instance, the forestry residues utiliza-tion for electricity production in Japan could generateabout 1300 jobs with an average of 30 workers for thepower plant. Furthermore, the emission reduction poten-tial per MWh is also a social advantage of using forestryresidues that is found to be about 600 kg CO2/MWh. Theenergy saving potential of biomass is another issue that ishandled by the gBEDS, which raises our responsibilitytowards the rights of new generations to save as muchas we can from earth resources and environment. The uti-lization of Japanese forestry residues will save 1.2 milliontonnes of oil equivalent (TOE).

720 N. Ayoub et al. / Energy Conversion and Management 48 (2007) 709–723
4.4. Data visualization
As mentioned before, the data in the gBEDS areexposed to the user in three ways; first, the GIS visualiza-tions, where all power plants data in the country are shownto the user. Figs. 9 and 10 show the name of the city, aneconomical location, where power plants should be posi-tioned and the feasible biomass quantity of each city,respectively. The data also are given in matrix form forusers who want to use further analysis.
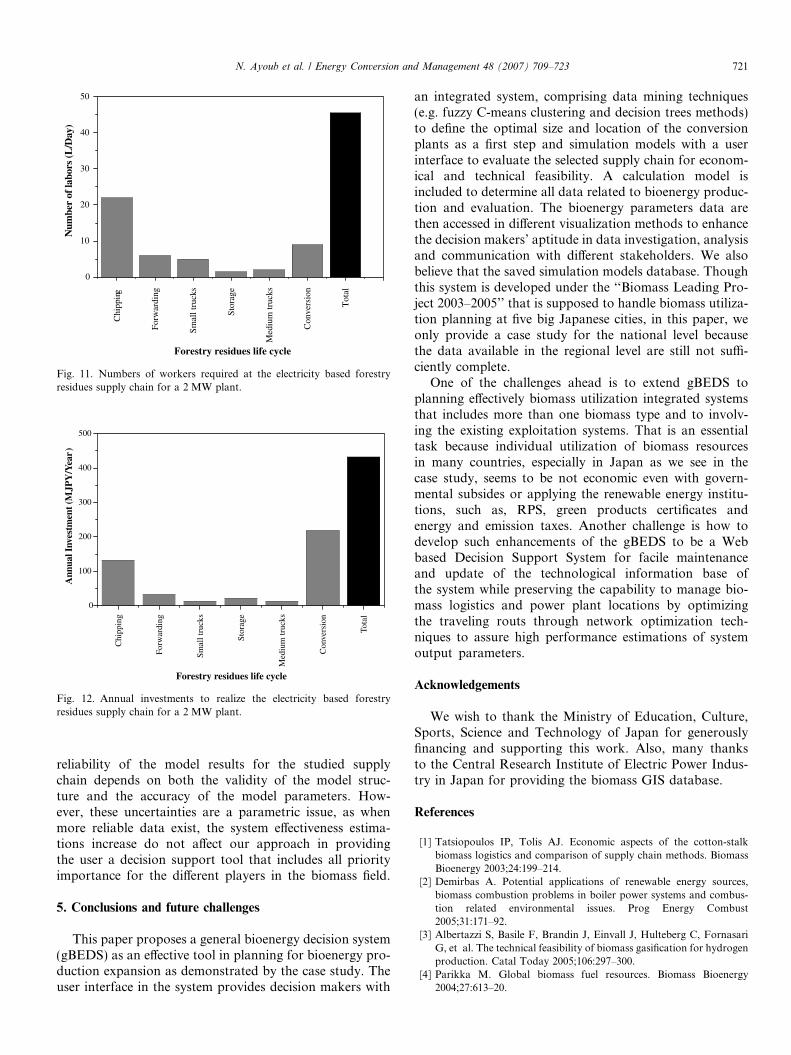
Finally, the data are visualized as a bar drawing formfor quick revision of the results as shown in Figs. 11 and
Fig. 9. Power plants data v
Fig. 10. Power plants data visualized
12 for the daily number of workers and annual investmentsrequired for a 2 MW capacity power plant.
4.5. Calculations uncertainties
The overall uncertainty of the estimates made in thiscase study is difficult to calculate because they are basedon data from several sources with wide differences in reli-ability. Nevertheless, the chips storage is considered themost uncertain part of these calculations. First of all,the chosen emission factors have not been verified byany measurements from chips storage. That means the
isualized by city name.
by feasible biomass quantities.
Chi
ppin
g
Forw
ardi
ng
Smal
l tru
cks
Stor
age
Med
ium
truc
ks
Con
vers
ion
Tot
al
0
10
20
30
40
50
Num
ber
of la
bors
(L/D
ay)
Forestry residues life cycle
Fig. 11. Numbers of workers required at the electricity based forestryresidues supply chain for a 2 MW plant.
Chi
ppin
g
Forw
ardi
ng
Smal
l tru
cks
Stor
age
Med
ium
truc
ks
Con
vers
ion
Tota
l
0
100
200
300
400
500
Ann
ual I
nves
tmen
t (M
JPY
/Yea
r)
Forestry residues life cycle
Fig. 12. Annual investments to realize the electricity based forestryresidues supply chain for a 2 MW plant.
N. Ayoub et al. / Energy Conversion and Management 48 (2007) 709–723 721
reliability of the model results for the studied supplychain depends on both the validity of the model struc-ture and the accuracy of the model parameters. How-ever, these uncertainties are a parametric issue, as whenmore reliable data exist, the system effectiveness estima-tions increase do not affect our approach in providingthe user a decision support tool that includes all priorityimportance for the different players in the biomass field.
5. Conclusions and future challenges
This paper proposes a general bioenergy decision system(gBEDS) as an effective tool in planning for bioenergy pro-duction expansion as demonstrated by the case study. Theuser interface in the system provides decision makers with
an integrated system, comprising data mining techniques(e.g. fuzzy C-means clustering and decision trees methods)to define the optimal size and location of the conversionplants as a first step and simulation models with a userinterface to evaluate the selected supply chain for econom-ical and technical feasibility. A calculation model isincluded to determine all data related to bioenergy produc-tion and evaluation. The bioenergy parameters data arethen accessed in different visualization methods to enhancethe decision makers’ aptitude in data investigation, analysisand communication with different stakeholders. We alsobelieve that the saved simulation models database. Thoughthis system is developed under the ‘‘Biomass Leading Pro-ject 2003–2005’’ that is supposed to handle biomass utiliza-tion planning at five big Japanese cities, in this paper, weonly provide a case study for the national level becausethe data available in the regional level are still not suffi-ciently complete.
One of the challenges ahead is to extend gBEDS toplanning effectively biomass utilization integrated systemsthat includes more than one biomass type and to involv-ing the existing exploitation systems. That is an essentialtask because individual utilization of biomass resourcesin many countries, especially in Japan as we see in thecase study, seems to be not economic even with govern-mental subsides or applying the renewable energy institu-tions, such as, RPS, green products certificates andenergy and emission taxes. Another challenge is how todevelop such enhancements of the gBEDS to be a Webbased Decision Support System for facile maintenanceand update of the technological information base ofthe system while preserving the capability to manage bio-mass logistics and power plant locations by optimizingthe traveling routs through network optimization tech-niques to assure high performance estimations of systemoutput parameters.
Acknowledgements
We wish to thank the Ministry of Education, Culture,Sports, Science and Technology of Japan for generouslyfinancing and supporting this work. Also, many thanksto the Central Research Institute of Electric Power Indus-try in Japan for providing the biomass GIS database.
References
[1] Tatsiopoulos IP, Tolis AJ. Economic aspects of the cotton-stalkbiomass logistics and comparison of supply chain methods. BiomassBioenergy 2003;24:199–214.
[2] Demirbas A. Potential applications of renewable energy sources,biomass combustion problems in boiler power systems and combus-tion related environmental issues. Prog Energy Combust2005;31:171–92.
[3] Albertazzi S, Basile F, Brandin J, Einvall J, Hulteberg C, FornasariG, et al. The technical feasibility of biomass gasification for hydrogenproduction. Catal Today 2005;106:297–300.
[4] Parikka M. Global biomass fuel resources. Biomass Bioenergy2004;27:613–20.

722 N. Ayoub et al. / Energy Conversion and Management 48 (2007) 709–723
[5] Balat M. Use of biomass sources for energy in Turkey and a view tobiomass potential. Biomass Bioenergy 2005;29:32–41.
[6] Filho PA, Badr O. Biomass resources for energy in North-EasternBrazil. Appl Energy 2004;77:51–67.
[7] Parikka M. Biosims – a method for the calculation of woody biomassfor fuel in Sweden. Ecol Eng 2000;16:73–82.
[8] Kong HW. Biomass energy utilisation in Malaysia – prospects andproblems. Renew Energy 1999;16:1122–7.
[9] Devi L, Krzysztof JP, Janssen FJJG. A review of the primarymeasures for tar elimination in biomass gasification processes.Biomass Bioenergy 2003;24:125–40.
[10] Yang YB, Sharifi VN, Swithenbank J. Effect of air flow rate and fuelmoisture on the burning behaviours of biomass and simulatedmunicipal solid wastes in packed beds. Fuel 2004;83:1553–62.
[11] Yang YF, Feng CP, Inamori Y, Maekawa T. Analysis of energyconversion characteristics in liquefaction of algae. Resour ConservRecy 2004;43:21–33.
[12] Akella AK, Sharma MP, Saini RP. Optimum utilization of renewableenergy sources in a remote area. Renewable Sustainable Energy Rev2005:1–15.
[13] Mitchell CP. Development of decision support system for bioenergyapplications. Biomass Bioenergy 2000;18:265–78.
[14] Larsen TN, Talbot B. Assessment of forest-fuel resources inDenmark: technical and economic availability. Biomass Bioenergy2004;27:97–109.
[15] Davide F, Minciardia R, Robbab M, Rovattia M, Sacilea R,Taramassoa A. Optimizing forest biomass exploitation forenergy supply at a regional level. Biomass Bioenergy 2004;26:15–25.
[16] Chinese D, Meneghetti A. Optimisation models for decision supportin the development of biomass-based industrial district-heatingnetworks in Italy. Appl Energy 2005;82:228–54.
[17] Voivontas D, Assimacopoulos D, Mourelatos A. Evaluation ofrenewable energy potential using a GIS decision support system.Renew Energy 1998;13:333–44.
[18] Voivontas D, Assimacopoulos D, Koukios EG. Assessment ofbiomass potential for power production: a GIS based method.Biomass Bioenergy 2001;20:101–12.
[19] Mitchell CP, Bridgwater AV, Stevens DJ, Toft AJ, Watters MP.Technoeconomic assessment of biomass to energy. Biomass Bioen-ergy 1995;9:205–26.
[20] Garcia-Quijano JF, Deckmyn G, Moons E, Proost S, Ceulemans R,Muys B. An integrated decision support framework for the predictionand evaluation of efficiency, environmental impact and total socialcost of domestic and international forestry projects for greenhousegas mitigation: description and case studies. Forest Ecol Manag2005;207:245–62.
[21] Shim JP, Warkentin M, Courtney JF, Power DJ, Sharda R, CarlssonC. Past, present, and future of decision support technology. DecisSupport Syst 2002;33:111–26.
[22] Sims REH. Bioenergy to mitigate for climate change and meet theneeds of society, the economy and the environment. MitigationAdaptation Strategies for Global Change 2003;8:349–70.
[23] Da Silva CG, Figueira J, Lisboa J, Barman S. An interactive decisionsupport system for an aggregate production planning model based onmultiple criteria mixed integer linear programming. Omega2006;34:167–77.
[24] Denzer R. Generic integration of environmental decision sup-port system state-of-the-art. Environ Modell Softw 2005;20:1217–1223.
[25] Reynolds KM. Integrated decision support for sustainable forestmanagement in the United States: fact or fiction? Comput ElectronAgr 2005;49:6–23.
[26] Nagel J. Determination of an economic energy supply structure basedon biomass using a mixed-integer linear optimization model. EcolEng 2000;16:91–102.
[27] Simkowitz HJ. Transportation applications of geographic informa-tion systems. Comput Environ Urban Syst 1988;12:253–71.
[28] Van der Meulen GG. Geographical information and decision supportsystem. Comput Environ Urban Syst 1992;16:187–93.
[29] Chen K, Blong R, Jacobson C. MCE-RISK: integrating multicriteriaevaluation and GIS for risk decision-making in natural hazards.Environ Modell Softw 2001;16:387–97.
[30] Chae YM, Ho SH, Cho KW, Lee DH, Ji SH. Data mining approachto policy analysis in a health insurance domain. Int J Med Inform2001;62:103–11.
[31] Noon CE, Zhan FB, Graham RL. GIS-based analysis of marginalprice variation with an application in ethanol plant location. NetwSpatial Econ 2002;2:79–93.
[32] Zhan FB, Chen X, Noon CE, Wu G. A GIS-enabled comparisonoffixed and discriminatory pricing strategies for potential switchgrass-to-ethanol conversion facilities in Alabama. Biomass Bioenergy2005;28:295–306.
[33] Wang H. Intelligent agent-assisted decision support systems: integra-tion of knowledge discovery, knowledge analysis, and group decisionsupport. Expert Syst Appl 1997;12(3):323–35.
[34] Gibert K, Marre MS, Roda IR. GESCONDA: an intelligentdata analysis system for knowledge discovery and management inenvironmental databases. Environ Modell Softw 2006;21(1):115–120.
[35] Ekasingh B, Ngamsomsuke K, Letcher RA, Spate J. A datamining approach to simulating farmers’ crop choices for inte-grated water resources management. J Environ Manage 2005;77(4):315–25.
[36] Shen J, Chang SI, Lee ES, Deng Y, Brown SJ. Determination ofcluster number in clustering microarray data. Appl Math Comput2005;169:1172–85.
[37] La’zaro J, Arias J, Martı’n JL, Cuadrado C, Astarloa A. Implemen-tation of a modified fuzzy C-means clustering algorithm for real-timeapplications. Microprocess Microsy 2005;29:375–80.
[38] Naka Y, Hirao M, Shimizu Y, Muraki M, kondo Y. Technologicalinformation infrastructure for product life cycle engineering. In: Proc7th int sympos on process syst eng, Keystone, Colorado, USA; 2000.p. 665–70.
[39] ESRI GIS and mapping software, www.esri.com.[40] The MathWorks Inc., www.mathworks.com.[41] Allen J, Browne M, Hunter A, Boyd J, Palmer H. Int J Phys
distribution log, Manage 1998;28(6):463–87.[42] Witten IH, Frank E. Data mining: practical machine learning tools
and techniques. 2nd ed. Morgan Kaufman; 2005.[43] Wang K, Salhi A, Fraga ES. Process design optimization using
embedded hybrid visualization and data analysis techniques within agenetic algorithm optimization framework. Chem Eng process2004;43:663–75.
[44] Yoshioka T, Aruga K, Nitami T, Kobayashi H, Sakai H. Energyand carbon dioxide (CO2) balance of logging residues asalternative energy resources: system analysis based on the methodof a life cycle inventory (LCI) analysis. J Forest Res 2005;10:125–134.
[45] Yoshioka T, Iwaoka M, Sakai H, Kobayashi H. Feasibility of aharvesting system for logging residues as unutilized forest biomass. JForest Res 2000;5:59–65.
[46] Yoshioka T, Aruga K, Sakai H, Kobayashi H, Nitami T. Energyand carbon dioxide (CO2) effectiveness of harvesting and trans-porting system for residual forest biomass. J Forest Res 2002;7:157–163.
[47] Wihersaari M. Evaluation of greenhouse gas emission risksfrom storage of wood residue. Biomass Bioenergy 2005;28:444–453.
[48] Wihersaari M. Greenhouse gas emissions from final harvestfuel chip production in Finland. Biomass Bioenergy 2005;28:435–443.
[49] Caputo CA, Palumbo M, Pelagagge PM, Scacchia F. Economicsof biomass energy utilization in combustion and gasificationplants: effects of logistic variables. Biomass Bioenergy 2005;28:35–51.

N. Ayoub et al. / Energy Conversion and Management 48 (2007) 709–723 723
[50] Kumar A, Cameron JB, Flynn PC. Biomass power cost and optimumplant size in western Canada. Biomass Bioenergy 2003; 24:445–64.
[51] Hondo H. Life cycle GHG emission analysis of power generationsystems: Japanese case. Energy 2005;30:2042–56.
[52] Wihersaari M. Aspects on bioenergy as a technical measure to reduceenergy related greenhouse gas emissions. Ph.D. thesis; TechnicalResearch Centre of Finland (VTT); 2005.
[53] Nomura N, Akai M. Willingness to pay for green electricity in Japanas estimated through contingent valuation method. Appl Energy2004;78:453–63.
[54] Matsumura Y, Minowab T, Yamamotoc H. Amount, availabil-ity, and potential use of rice straw (agricultural residue) biomassas an energy resource in Japan. Biomass Bioenergy 2005;29:347–354.