Prof. Srinivasalu S - Present Position Present Additional ...

Present and prospective role of bioenergy inregional energy system
T.V. Ramachandra*, N.V. Joshi, D.K. Subramanian
Centre for Ecological Sciences, Indian Institute of Science, Bangalore, 560012, India
Received 15 February 1997; accepted 20 March 2000
Abstract
Bioenergy is the energy released from the reaction of organic carbon material withoxygen. The organic material derived from plants and animals is also referred to as
biomass. Biomass is a ¯exible feedstock capable of conversion into solid, liquid and gaseousfuels by chemical and biological processes. These intermediate biofuels (such as methanegas, ethanol, charcoal) can be substituted for fossil based fuels. Wood and charcoal areimportant as household fuels and for small scale industries such as brick making, cashew
processing etc. The scarcity of biofuels has far reaching implications on the environment.Hence, expansion of bioenergy systems could be in¯uential in bettering both the socio-economic condition and the environment of the region. This paper examines the present
role of biomass in the region's (Uttara Kannada District, Karnataka State, India) energysupply and calculates the potential for future biomass provision and scope for conversionto both modern and traditional fuels. Based on the detailed investigation of biomass
resource availability and demand, we can categorise the Uttara Kannada District into twozones (a) Biomass surplus zone consisting of Taluks mainly from hilly area (b) Biomassde®cit zone, consisting of thickly populated coastal Taluks such as Bhatkal, Kumta,Ankola, Honnavar and Karwar. Fuel wood is mainly used for cooking and horticulture
residues from coconut, arecanut trees are used for water heating purposes. Most of thehouseholds in this region still use traditional stoves where e�ciency is less than 10%. Thepresent ine�cient fuel consumption could be brought down by the usage of fuel e�cient
stoves (a saving of the order of 27%). Availability of animal residues for biogas generationin Sirsi, Siddapur, Yellapur Taluks gives a viable alternative for cooking, lighting fuel and auseful fertiliser. However to support the present livestock population, fodder from
agricultural residues is insu�cient in these Taluks. There is a need to supplement the fodder
1364-0321/00/$ - see front matter 7 2000 Elsevier Science Ltd. All rights reserved.
PII: S1364 -0321 (00)00002 -2
Renewable and Sustainable Energy Reviews
4 (2000) 375±430
www.elsevier.com/locate/rser
* Corresponding author. Tel.: +91-080-3600985; fax: +91-080-3601428.
E-mail address: [email protected] (T.V. Ramachandra).

availability with fodder crops as successfully tried in Banavasi village by some progressivefarmers. 7 2000 Elsevier Science Ltd. All rights reserved.
Keywords: Bioenergy; Fuel wood consumption; Integrated energy planning; Energy e�cient devices; Per
capita fuel consumption; Techno economic analyses; Biogas; Wood gasi®cation; Energy plantation
1. Introduction
Biomass refers to solid carbonaceous material derived from plants and animals.
These include the residues of agriculture and forestry, animal wastes and wastes
from food processing operations. A small amount of solar energy is used by
plants in the process of photosynthesis and this trapped energy can be used in
various ways. Wood and grass can be dried and then burnt to release heat. Plant
material particularly rich in starches and sugars such as sugarcane, wheat etc., can
be fermented to produce ethanol. Alternately, methanol can be produced by the
distillation of biomass which contains considerable cellulose such as wood and
bagasse (residue from sugarcane). Both of these alcohols can be used to fuel
vehicles and machinery, and can be mixed with petrol to make a petrol/alcohol
blend. Although biomass energy use is predominantly in rural areas, it also
provides an important fuel source for the urban poor and many rural, small and
medium scale industries. In order to meet the growing demand for energy, it is
imperative to focus on e�cient production and uses of biomass energy to meet
both traditional (as a heat supplier) and modern fuel requirements (such as
electricity and liquid fuels). This production of biomass in all its forms for fuel,
food and fodder demands environmentally sustainable land use and integrated
planning approaches.
Detailed planning would be required from National, to State, to District, to
Taluk and Village levels. The inappropriate selection and site matching of species
or management strategies can have adverse e�ects and lead to the degradation
and abandonment of land. However, the correct selection of plant species can
allow the economic production of energy crops in areas previously capable of only
low plant productivities. Simultaneously multiple bene®ts may accrue to the
environment. Such selection strategies allow synergistic increases in food crop
yield and decreased fertiliser applications while providing a local source of energy
and employment [1±3]. In this paper, the resource base in Uttara Kannada
District under each sector such as forests, agriculture, horticulture and animal
residues are explained Talukwise. Also, an attempt is made to illustrate the
present role of biomass energy, the resource base for future development and
some promising conversion technologies and uses. Biogas, wood based steam
power generation, energy plantation and biomass gasi®cation are the most
promising bioenergy technologies.
T.V. Ramachandra et al. / Renewable and Sustainable Energy Reviews 4 (2000) 375±430376

1.1. Present role of bioenergy
Bioenergy is one of the primary sources of fuel in our country. A recent studyby the authors on energy utilisation in Karnataka considering all types of energysources and sectorwise consumption revealed that traditional fuels such as®rewood (7.440 million tonnes of oil equivalent Ð 43.62%), agro residues (1.510million tonnes of oil equivalent Ð 8.85%), biogas, cowdung (0.250 million tonnesof oil equivalent Ð 1.47%) accounts for 53.20% of the total energy consumptionin Karnataka. In rural areas the dependence on bioenergy to meet the domesticrequirements such as cooking and water heating purposes are as high as 80±85%.Fuel wood and agricultural residues are also widely used as fuel in rural industriessuch as cashew processing and other agro processing industries, brick kilns, and incommercial sectors such as hotels etc. Detailed investigation of energyconsumption in 90 villages in Kumta Taluk reveals that annual per capita fuelwood consumption for domestic purposes such as cooking, water heating etc., isin the range of 0.7±1.1 tonnes and in rural industries such as cashew processing,fuel wood consumption is in the range of 4.5±8.5 kg per kg of cashew kernels.One tonne of fuel wood (logs) for processing 5 tonnes of sugar cane (for makingjaggery), 400±800 kg of fuelwood for making 1000 bricks etc.
2. Bioenergy
2.1. Resources from forests
The District of Uttara Kannada is situated between lat 13855'N and 15831'Nand long 7489'E and 7584'E, and covers an area of 10,291 km2 (Fig. 1(a)) and issubdivided into 11 Taluks that can be grouped according to their geographicalcharacteristics:
. The coastal region, which has hot and humid climate (rainfall varies between2500±3556 mm) and comprises the Taluks of Karwar, Ankola, Kumta,Honnavar and Bhatkal.
. The hilly region of the Western Ghats (500±1000 m high), which is very humidto the south (rainfall varies from 3048±3556 mm) and comprises the Taluks ofSirsi, Siddapur, Supa and Yellapur.
. The region of transition, which is drier (rainfall varies between 1016±1524 mm),and comprises the Taluks of Mundgod and Haliyal.
This geographical diversity is responsible for the growth of four vegetation typesfound throughout the District:
. Evergreen forest type, found mainly in Sirsi, Siddapur and the hilly easternregion of Honnavar, Kumta, Ankola and Karwar.
. Semi deciduous forest type, on the slopes of Ankola, Kumta, Karwar,Honnavar, Siddapur and Sirsi.
T.V. Ramachandra et al. / Renewable and Sustainable Energy Reviews 4 (2000) 375±430 377

Fig. 1(a). Geographical location of Uttara Kannada District.
T.V. Ramachandra et al. / Renewable and Sustainable Energy Reviews 4 (2000) 375±430378

. Deciduous forest type, in Haliyal, Supa and Mundgod.
. Moist deciduous forest type, in Ankola, Bhatkal, Yellapur, West Karwar andthe coastal region of Kumta.
About 80.58% of the District's geographical area is under forests (8292.65 km2).The per capita forest area is about 0.64 hectares and per capita land area is about0.83 hectares. Total geographical area in hectares, population as per 1991 census,area under forests, per capita land area, per capita forest area and the ratio offorest area to total land area Ð Talukwise, are listed in Table 1. It is seen thatBhatkal among coastal Taluks is thickly populated (3.61 persons/hectare) while,Supa Taluk is very thinly populated (0.53). Table 1 also provides information onTalukwise vegetation cover. Yellapur Taluk has 87% vegetation cover while theminimum cover of 67% is in Kumta. This information is shown pictorially inFig. 1(b). The forest area according to legal status in the District could beclassi®ed as (1) reserve forests (7727.84 km2, 93.18% of total forest area) (2)protected forests (542.77 km2) (3) village forests (20.20 km2) (4) unclassi®edforests (1.84 km2).
A signi®cant majority of people in Uttara Kannada meet the bulk of theirresource needs from plant and animal matter, either gathered directly from noncultivated land (from forests) or water, or produced on crop lands and orchardsmostly under rainfed conditions. The needs of biomass in this region varies from awide range of needs apart from fuel, fodder and food. Madhav Gadgil [4] in his
Fig. 1(b). Population, geographical area forest area (in hectares).
T.V. Ramachandra et al. / Renewable and Sustainable Energy Reviews 4 (2000) 375±430 379

Table
1
Population(1991),totalarea,areaunder
forestsin
Uttara
Kannada
TALUK
Totalarea
(km
2)
Totalarea
(ha)
Populationtotal
(1991)
Forest
(ha)
Noofpersonsper
geo.area
Forest/totalarea
Forest
area/person
Totalarea/person
Supa
1895.1
189,514.23
99,519
160,609
0.53
0.85
1.61
1.90
Yellapur
1301.1
130,110
81,410
113,430
0.63
0.87
1.39
1.60
Ankola
918.7
91,870
91,310
75,432.4
0.99
0.82
0.83
1.01
Haliyal
864.9
86,489.33
94,363
59,099.8
1.09
0.68
0.63
0.92
Siddapur
859.3
85,930
94,202
62,274.6
1.10
0.72
0.66
0.91
Sirsi
1333.4
133,342.62
152,935
103,227
1.15
0.77
0.67
0.87
Mundgod
668.9
66,890
77,939
51,167.4
1.17
0.76
0.66
0.86
Honavar
775.5
77,546.13
145,842
57,416.7
1.88
0.74
0.39
0.53
Karw
ar
732.1
73,210
142,845
52,808.7
1.95
0.72
0.37
0.51
Kumta
584.9
58,486.81
134,144
39,187.6
2.29
0.67
0.29
0.44
Bhatkal
357.3
35,731.96
129,017
25,390.5
3.61
0.71
0.20
0.28
District
10,291.2
1,029,121.08
1,243,526
800,042
1.21
0.78
0.64
0.83
T.V. Ramachandra et al. / Renewable and Sustainable Energy Reviews 4 (2000) 375±430380
report, has listed 80 di�erent plant species from natural vegetation used forpurposes ranging from food, condiments, masticatories, fuel for domestic cooking,bath water heating, agro processing, fodder for livestock, thatch and small timberfor houses and cattlesheds, matting for protecting the houses during the rainyseason, poles for fencing, leaf manure for ®elds and orchards, mulch for weedcontrol, leaves for the control of insect pests, wood for the manufacture of woodcarts and agricultural implements, ®shing traps, brooms, mats, baskets, ropes,idols and garlands and decorative articles. This dependence on biomass from non-cultivated lands or rainfed cultivation is mainly due to necessity, apart fromdiverse tradition.
2.2. Working plans
During colonial rule, the concept of working plans were established in India(1890) to document the forest policies of the State, scienti®c and rational forestmanagement. The working plans prepared so far since 1890 focus mainly onecological information of the area, ¯oristic information, the forest produce and itsmarket potential, availability of labour, growth and yield statistics, technicalproposals for future management, details of felling succession, ®nancial forecastand the cost of the plan. The choice of the criteria in working plans, althoughsubjective, is intended to give an accurate view of the forest policy and themanagement system followed. Scanning through all the working plans reveals thatthey have been concentrated in some areas such as the valleys of the Kalinadi,Gangavali, Aghnashini and Sharavati rivers, because of easier access to the banksfrom the river and cheaper transport facilities. Also most of the wood depots wereeither located on the coasts at the river mouths or nearby places such as Kodibag,Karwar, Honnavar, Bhatkal etc. or above the Ghats, near the logging sites suchas Kirwatti, Londa, Haliyal, Dandeli. The second major area of interest is thedrier tract of Haliyal, Mundgod which was easily accessible and also containedrich deciduous species like Teak (Tectona grandis ), Nandi (Lagerstroemiamicrocarpa ), Honne (Pterocarpus marsupium ), Kindal (Terminalia paniculata ),Matti (Terminalia tomentosa ), Dindal (Anogeissus latifolia ), and Jungle wood. Thelimitation of the economically interesting species to a small proportion of the totalforest could have been helpful to sustainable management if the foresters wouldhave contented themselves only to the felling of these species. But the silviculturalsystems followed actively discouraged the growth of non economic species to thedetriment of the ¯oristic wealth of the tropical forest.
2.3. Vegetation types in the Uttara Kannada District
Flora of the Uttara Kannada Forests were studied by various persons.Buchanan [5] in his book, gives a brief account of the plants encountered in thecourse of his journey through this District. Botany of Uttara Kannada forests ofrecent times is provided by Talbot [6]. A good deal of ¯oristic information on
T.V. Ramachandra et al. / Renewable and Sustainable Energy Reviews 4 (2000) 375±430 381

coastal, interior and inland high forest is available from the forest working plans[7±10]. Denudation of the Kanara coast is well accounted by Dhareshwar [11].
Recently Subash Chandran, [12] after a detailed survey of various types offorests in Uttara Kannada, linked the forest composition with management of theforest ecosystem and makes certain recommendations for most sustainableutilisation of forest resources and betterment of the degraded forest ecosystem. Healso discusses the e�ect of slash and burn agriculture practiced in the interior hillsand its subsequent ban by the close of the 19th century, on forest composition. Hehighlights the return of evergreen forests with the stoppage of slash and burnagriculture. The return of evergreens is considered one of the major factors for thereduction of the incidence of deciduous trees like Tectona grandis from theevergreen forest belt. The Forest map of South India [13], published by InstituFrancais de Pondicherry covering Belgaum-Dharwar-Panaji, Shimoga are used toidentify the vegetation types in the Uttara Kannada District. Secondary moistdeciduous forest could be seen in the river valleys of Kali, Gangavali andAghnashini. These are secondary forests as the evergreen patch in this region isclear felled as part of the government's Working Plans in the early 19th century.Many such patches Ð yellow in colour Ð could be seen with the evergreen forestfragments. From this analyses, it is evident that the percentage evergreen patch isabout 51.1%, the moist deciduous type is 23.2%, the dry deciduous type is 8.6%,and the coastal is 17.1%
The forests are divided according to convenience of administration by theForest Department as follows:
1. Reserve forests maintained by the Forest Department.2. Forest plantations maintained by the Forest Department. Out of those areas
noti®ed under the Forest Act, the barren lands and hillocks that are denudedof tree growth are being a�orested by raising plantations like cashew, etc.
3. Reserve forests under Section 4 of the Karnataka Forest Act.4. Revenue plantations maintained by the Revenue Department representing the
a�orestation works done in the unreserved lands for which a noti®cation underSection 4 of the Act is issued.
5. Unreserved lands are maintained by the Revenue Department. Protection andmanagement of tree growth in unreserved kinds are vested with the ForestDepartment. Suitable areas of reserved kinds are vested with the ForestDepartment. Suitable areas of unreserved lands in compact blocks have beensurveyed and demarcated and the noti®cation under Section 4 of the Act hasbeen issued for constituting them as reserve forests.
6. Several panchayats in the recent years have commenced maintaining certainareas of wastelands to develop forests under the scheme ``Farm Forestry''which envisages the creation of fuel reserves to help people to get their supplyof fuel, small-sized timber to meet their agricultural demands and to providegreen manure, fodder and grazing to village cattle.
Table 2 gives details of forest area according to legal status as in 1980±1981 in theDistrict.
T.V. Ramachandra et al. / Renewable and Sustainable Energy Reviews 4 (2000) 375±430382

2.4. Loss of forest area
The increasing population has a direct bearing on the increased demand foragricultural lands and this has always an adverse e�ect on valuable forests.Unauthorised cultivation poses a serious problem. The high tension electricitylines riddling the forests, increased communications, settlement of expropriatedryots and refugees on release of lands for irrigation and hydro-electric projectshave a heavy impact on forests. People settling down in colonies in the interiordepend on forests for their requirement of timber and ®rewood. Grazing also hasdeleterious e�ect on forests. The release of forest lands has now been discouragedand any such proposal has to be approved by both the Houses of Legislature.According to the recently enacted Central Forest Conservation Act, no forest landcan be released for non-forestry purpose in the State without speci®c approval ofthe Government of India. Table 3 gives the purpose and the areas so far lost inthe District.
Pascal [14], classi®es vegetation in this region as follows:
1. Group I Ð Evergreen or semi evergreen climax and potentially related forests:(a) Evergreen or semi evergreen climax and potentially related forests
(1) Low elevation (0±850 m in the south and 0±650 m in the north).
Table 2
Details of forest area according to legal status as in 1980±1981 in the District
Forest types Area (km2)
Reserve forests 7727.84
Protected forests 542.77
Village forests 20.2
Unclassi®ed forests 1.84
Total 8292.65
Table 3
The purpose and the areas lost in the District
Purposes Extent lost (in ha)
Area gone under submersion 304
Area released for rehabilitation 4202
Area gone under power lines 626
Area given for cultivation 50,158
Area gone for mining 26,713
Area given for townships 1097
Area given for non agricultural purpose 7383
Area lost under the Kali Power Project 14,176
Area lost under the Bedthi Project 300
Area lost for colony and roads 273
Total 105,232
T.V. Ramachandra et al. / Renewable and Sustainable Energy Reviews 4 (2000) 375±430 383

Dipterocarpus indicus-Diospyros candolleana-Diospyros oocarpa type:Honnavar and Kumta (scanty distribution);Persea macrantha-Diospyros spp.-Holigarna type: Honnavar andKumta;Diospyros spp-Dysoxylum malabaricum-Persea macrantha kan foresttype: Eastern Sirsi.
(2) Medium elevation (650±1400 mm).
Transition type: Supa, Joida; Memecylon umbellatum-Syzigium cumini-Actinodaphne angustifolia type.
(b) Secondary or degraded stages(1) Evergreen and semi evergreen forests.
Disturbed low elevation: all Taluks except Haliyal and Mundgod.Disturbed transition: Supa, Joida.Secondary low elevation: Bhatkal, Honnavar, Kumta, Sirsi andSiddapur.
(2) Secondary moist deciduous forests.Dense forest: Joida, Yellapur, Sirsi.Woodland to savanna woodland: all except Haliyal and Mundgod.
(3) Other degraded stages.
Thicket low elevation: all except Haliyal and Mundgod.Thicket medium elevation: Supa, Joida.Tree savanna to grass savanna low elevation: all except Haliyal andMundgod.Scattered shrubs low elevation: Bhatkal, Honnavar, Kumta, Ankola,Karwar.
2. Group II Ð Deciduous climax forests and degradation. Occur in North easternparts of the District.
3. Group III Ð Plantations. Acacia catechu, Casuarina equisetifolia, Eucalyptusspp., Tectona grandis.
4. Group IV Ð Scrub type is common along the minor forest tract which runs asa belt of 8±16 km along the coast.
2.5. Types of vegetation in various Taluks
Talukwise distribution of various vegetation [15,16] are discussed in thefollowing section:
T.V. Ramachandra et al. / Renewable and Sustainable Energy Reviews 4 (2000) 375±430384

2.5.1. Ankola TalukIn Ankola Taluk, as one goes from east to west, forest types changes from
laterite thorn to moist deciduous, laterite semi-evergreen in nala pockets andinterior depression. The western part which adjoins the coast is also denuded tounrestricted exercise of privileges and due to kumri (shifting) cultivation in thepast. The inland areas of moist deciduous and semi-evergreen are closed as fuelforest and high forest areas, yielding ®rewood and timber respectively. Roundabout Hattikeri, in laterite thorn forests, one can come across the khair trees(Acacia catechu ) which yield valuable economic forest produce called katha. TheGangavali river valley area supports valuable teak forests having the mostcommon under growth, bamboo.
2.5.2. Bhatkal TalukThe type of forests in Bhatkal Taluk changes from laterite thorn to laterite
evergreen. There is very little moist deciduous forest. The barren hills aroundMurdeshwar and Bhatkal are a testimony to the acts of unrestricted fellings. Asone goes into the interior, the vegetation improves gradually. The evergreenforests round about Kop village in the north-east part of the Taluk containvaluable timber for matches and plywood. The laterite thin forests situated in thenorth-west and south-west of the Taluk contain a large number of khair trees.These are bigger in the girth in the Balke forests in the south-west part of theborder of the Dakshina Kannada District.
2.5.3. Haliyal TalukThe eastern and north-western parts of Haliyal Taluk comprise a teak pole area
tending to scrub type towards the border of the Dharwad District. The foresttowards the western half of this Taluk are constituted at High Forests, yieldingvaluable teak timber. The timber extracted from these high forest areas istransported to the Dandeli and Alnavar forest depots. There is sandalwood indrier parts of the area and this is extracted annually on a sustained yield basis.There are patches of evergreen forest towards the western side in the lowerportions of the valleys of rivers and perennial nalas. Bamboo is considered as oneof the most valuable constituents of economic forest produce.
2.5.4. Honnavar TalukIn the Honnavar Taluk, the forest type changes from laterite to laterite semi-
evergreen and evergreen. There is very little of the moist deciduous type which canbe seen only on tops of small hills in the western part of the belt. The coastal stripof the forests is all denuded and in many parts, the land has become un®t even tobear poor grass. As one advances in the interior, the forest growth improvesgradually. These forests contain valuable timber trees like poon, ganjan, bobbi,honne, kindal, jamba, nandi, bharangi and others, suitable for matches andplywoods. The laterite semi-evergreen forests and evergreen forests in the north-east corner, in the Mahime and Jankadkal villages of the Taluk, contain talepalms. The belt of Acacia catechu also passes in this Taluk, mostly con®ned to the
T.V. Ramachandra et al. / Renewable and Sustainable Energy Reviews 4 (2000) 375±430 385

south-west part of the Taluk. The evergreen forests of Gerusoppa contain varietiesof canes which are exported outside the District.
2.5.5. Karwar TalukIn Karwar Taluk, as one goes from west to east, the forest types gradually
changes from laterite thorn to moist deciduous and laterite semi-evergreen toevergreen. The forests to the west of Honkane village have been depleted due tothe unrestricted exercise of privileges. The deciduous forests in the lower slopestend to be towards high forests, yielding valuable timber of teak, sissum, honne,kindal, etc. Jamba is the predominant species of this tract. The upper slopes andlower valleys and banks of perennial nalas contain patches of evergreen forestsand large quantities of canes (Calamum ) that are exported to various places. Theupper slopes are not worked due to their inaccessibility. Reserved forests of themoist deciduous type in the patches of laterite semi-evergreen in the interiorsituated on the steep hills round Karwar had been classi®ed as ``Karwar TownFive Miles Special Reserves''.
2.5.6. Kumta TalukIn the Kumta Taluk, the types of forest change from laterite thorn to moist
deciduous, laterite semi-evergreen and evergreen as one advances from west toeast as is the case in other Taluks. The timber bearing high forests are con®ned tothe south-east part of the Taluk at the foot of the Nilkund and Dodmane Ghatsround about the Soppinahosahalli village. Around Mirjan, the laterite thornforests contain khair trees which yield valuable catechu. Bamboos occur in theAghanashini valley around Soppinahosahalli.
2.5.7. Mundgod TalukThe forest type in Mundgod Taluk changes from scrub in the south-west near
the Sirsi Taluk boundary. The stock improves as one advances from east to west.The eastern half is comprised of a teak pole area and the western half is in thehigh forest area. The deep valleys, in the south-west and the perennial nala beltsare covered with patches of semi-evergreen forests. The drier parts of the teakpole arch, towards the border of the Dharwad District, contain sandalwood.
2.5.8. Siddapur TalukOwing to the scanty growth in the eastern side and also to the major part of
Siddapur Taluk being very hilly, no part is organised except the area covered bysandalwood trees towards the north-east, east and south-east. This sandalwoodbelt extends to Sirsi, Mundgod Taluks also. The eastern part is drier and as oneadvances from east to west towards the Ghats, the forest type improves to semi-evergreen. There are many large patches of evergreen forests called kans in thisTaluk, mostly con®ned to the west round about Dodmane, Nilkund andMalemane Ghats. These contain valuable matchwood, the extraction of which willbe economical only when communications are improved.
T.V. Ramachandra et al. / Renewable and Sustainable Energy Reviews 4 (2000) 375±430386
2.5.9. Sirsi TalukThe forest of Sirsi Taluk are ®rstly semi-evergreen and evergreen types. The
evergreen forests are attached here and there all over the area. The belt ofsandalwood forest of Siddapur Taluk runs over this Taluk and is mostly con®nedto the south-eastern part bordering Siddapur Taluk and the Shimoga District.
2.5.10. Supa TalukThe greater part of the Supa tract is very hilly and preciphorous. The forest
area falls into two di�erent types of forests. The south-eastern part of this Talukcontains high forests, near Gund and portions of the Nagjhari valley and theKalinadi and the Kaneri slope forests, yielding mainly timber of valuable species.Gund has the ®nest teak plantations. Evergreen patches are also found in thevalleys. The forests of the northern point near Castlerock yields only fuel and itmerges into scrub forests, wherever the soil is very poor. Bamboo growsabundantly in this Taluk.
2.5.11. Yellapur TalukThe northern parts of the Yellapur Taluk is a valuable forest of teak. Bamboo
is also plentiful here, con®ned to the catchment area of Gangavali. The bamboobelt extends to Ankola Taluk also.
With the knowledge of vegetation in each Taluk, we try to estimate the litterand above ground biomass availability in the Uttara Kannada District.
3. Litter production in tropical moist forests of Western Ghats
Based on a three year study in Attapadi evergreen forests, Pascal [17] estimatesthat the total mean production of litter is 8.5 t/ha/year, that of leaves and foliarfragments is 6.4 t/ha/year which is nearly 74.75% of total production.
Recent study on litter production in the Uttara Kannada forests is by Bhat [18]at Sonda reserve forest (percentage composition of evergreen species 44.77%,deciduous species 55.23%), Santgal reserve forest (percentage composition ofevergreen species 86.76%, deciduous species 13.24%), Nagur reserve forest(percentage composition of evergreen species 66.66%, deciduous species 33.34%)and Bhairumbe leaf manure forest (percentage composition of evergreen species43.83%, deciduous species 56.17%). The estimation of micro litterfall (leaf matter,reproductive parts, small wood R 2 cm diameter), total ground litter (micro litterand dead herbs), large wood litterfall (wood between 2±10 cm) based on two yearsstudy are given in Table 4. In all sites studied, leaf litter is a major componentwhich constitutes 65±92% of the total micro litter and 75±94% of the totalground litter. The micro litter estimated by others in the similar type of vegetationis 8.8±12.0 t/ha/year [19], 6.00 t/ha/year [20], 3.44±4.20 t/ha/year [21], 12.9±14.1 t/ha/year [22].
T.V. Ramachandra et al. / Renewable and Sustainable Energy Reviews 4 (2000) 375±430 387
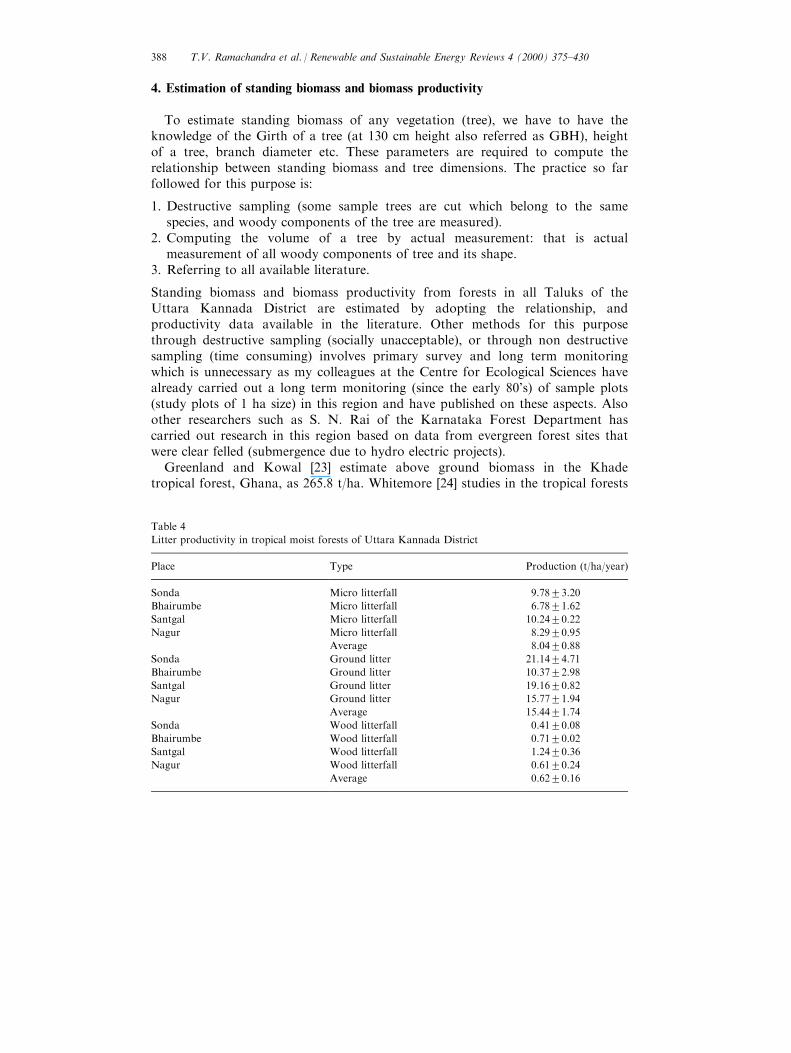
4. Estimation of standing biomass and biomass productivity
To estimate standing biomass of any vegetation (tree), we have to have theknowledge of the Girth of a tree (at 130 cm height also referred as GBH), heightof a tree, branch diameter etc. These parameters are required to compute therelationship between standing biomass and tree dimensions. The practice so farfollowed for this purpose is:
1. Destructive sampling (some sample trees are cut which belong to the samespecies, and woody components of the tree are measured).
2. Computing the volume of a tree by actual measurement: that is actualmeasurement of all woody components of tree and its shape.
3. Referring to all available literature.
Standing biomass and biomass productivity from forests in all Taluks of theUttara Kannada District are estimated by adopting the relationship, andproductivity data available in the literature. Other methods for this purposethrough destructive sampling (socially unacceptable), or through non destructivesampling (time consuming) involves primary survey and long term monitoringwhich is unnecessary as my colleagues at the Centre for Ecological Sciences havealready carried out a long term monitoring (since the early 80's) of sample plots(study plots of 1 ha size) in this region and have published on these aspects. Alsoother researchers such as S. N. Rai of the Karnataka Forest Department hascarried out research in this region based on data from evergreen forest sites thatwere clear felled (submergence due to hydro electric projects).
Greenland and Kowal [23] estimate above ground biomass in the Khadetropical forest, Ghana, as 265.8 t/ha. Whitemore [24] studies in the tropical forests
Table 4
Litter productivity in tropical moist forests of Uttara Kannada District
Place Type Production (t/ha/year)
Sonda Micro litterfall 9.7823.20
Bhairumbe Micro litterfall 6.7821.62
Santgal Micro litterfall 10.2420.22
Nagur Micro litterfall 8.2920.95
Average 8.0420.88
Sonda Ground litter 21.1424.71
Bhairumbe Ground litter 10.3722.98
Santgal Ground litter 19.1620.82
Nagur Ground litter 15.7721.94
Average 15.4421.74
Sonda Wood litterfall 0.4120.08
Bhairumbe Wood litterfall 0.7120.02
Santgal Wood litterfall 1.2420.36
Nagur Wood litterfall 0.6120.24
Average 0.6220.16
T.V. Ramachandra et al. / Renewable and Sustainable Energy Reviews 4 (2000) 375±430388
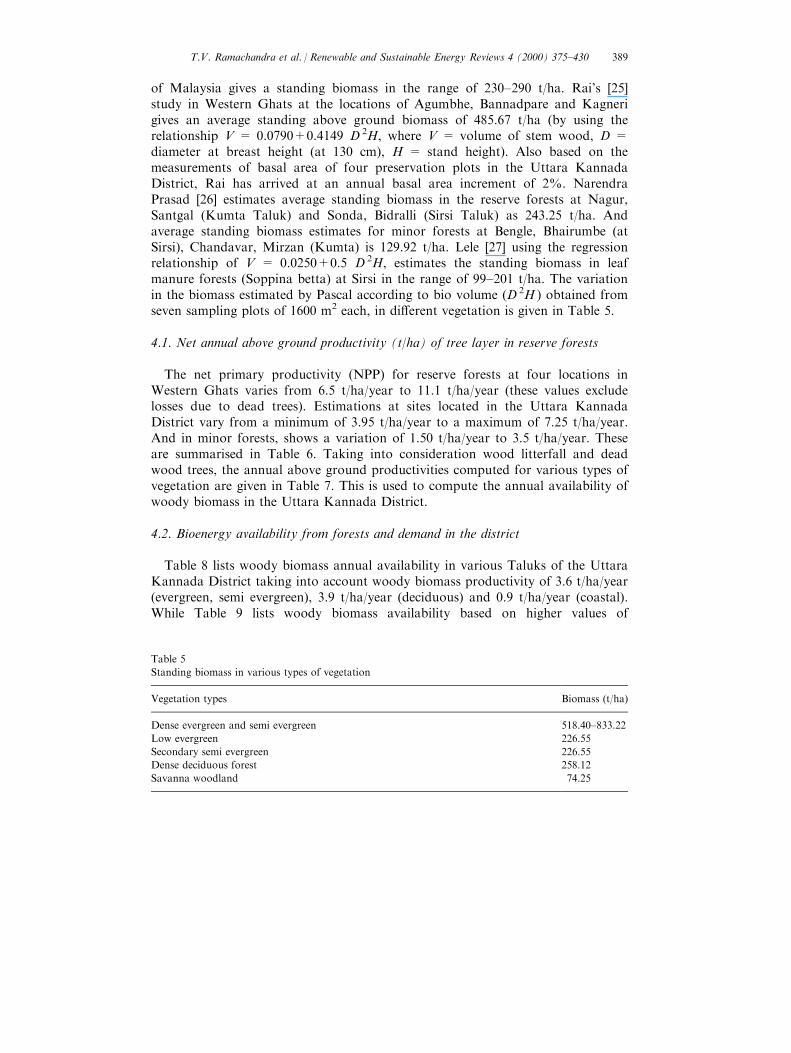
of Malaysia gives a standing biomass in the range of 230±290 t/ha. Rai's [25]study in Western Ghats at the locations of Agumbhe, Bannadpare and Kagnerigives an average standing above ground biomass of 485.67 t/ha (by using therelationship V = 0.0790+0.4149 D 2H, where V = volume of stem wood, D =diameter at breast height (at 130 cm), H = stand height). Also based on themeasurements of basal area of four preservation plots in the Uttara KannadaDistrict, Rai has arrived at an annual basal area increment of 2%. NarendraPrasad [26] estimates average standing biomass in the reserve forests at Nagur,Santgal (Kumta Taluk) and Sonda, Bidralli (Sirsi Taluk) as 243.25 t/ha. Andaverage standing biomass estimates for minor forests at Bengle, Bhairumbe (atSirsi), Chandavar, Mirzan (Kumta) is 129.92 t/ha. Lele [27] using the regressionrelationship of V = 0.0250+0.5 D 2H, estimates the standing biomass in leafmanure forests (Soppina betta) at Sirsi in the range of 99±201 t/ha. The variationin the biomass estimated by Pascal according to bio volume (D 2H ) obtained fromseven sampling plots of 1600 m2 each, in di�erent vegetation is given in Table 5.
4.1. Net annual above ground productivity (t/ha) of tree layer in reserve forests
The net primary productivity (NPP) for reserve forests at four locations inWestern Ghats varies from 6.5 t/ha/year to 11.1 t/ha/year (these values excludelosses due to dead trees). Estimations at sites located in the Uttara KannadaDistrict vary from a minimum of 3.95 t/ha/year to a maximum of 7.25 t/ha/year.And in minor forests, shows a variation of 1.50 t/ha/year to 3.5 t/ha/year. Theseare summarised in Table 6. Taking into consideration wood litterfall and deadwood trees, the annual above ground productivities computed for various types ofvegetation are given in Table 7. This is used to compute the annual availability ofwoody biomass in the Uttara Kannada District.
4.2. Bioenergy availability from forests and demand in the district
Table 8 lists woody biomass annual availability in various Taluks of the UttaraKannada District taking into account woody biomass productivity of 3.6 t/ha/year(evergreen, semi evergreen), 3.9 t/ha/year (deciduous) and 0.9 t/ha/year (coastal).While Table 9 lists woody biomass availability based on higher values of
Table 5
Standing biomass in various types of vegetation
Vegetation types Biomass (t/ha)
Dense evergreen and semi evergreen 518.40±833.22
Low evergreen 226.55
Secondary semi evergreen 226.55
Dense deciduous forest 258.12
Savanna woodland 74.25
T.V. Ramachandra et al. / Renewable and Sustainable Energy Reviews 4 (2000) 375±430 389

productivities such as 13.5 t/ha/year for deciduous, 6.5 t/ha/year for evergreen andsemi evergreen) and 1.5 t/ha/year for the coastal region of the District. Based on
®eld data collected from villages in Kumta, Sirsi and Siddapur, fuel demand inthis region is found to be approximately 1.1 t/capita/year (higher estimate) and 0.7
t/capita/year (lower estimate). Fuel demand Talukwise computed based on the
survey result is listed in the 10th columns of Table 8 and Table 9 respectively. Thelast columns in these Tables gives the ratio of productivity and fuel wood
Table 6
Estimates of net annual above ground productivity (t/ha)
Forest type Locality NPP (t/ha/year) of oven dry matter Reference
Reserve Bidralli 3.946 [26]
Nagur 7.250
Santgal 5.296
Sonda 5.088
Minor Bengle 3.533
Bhairumbe 3.314
Chandavar 3.476
Mirzan 1.501
Reserve Agumbe 11.10 [43]
Bannadpare 6.500
Kagneri 9.20
South Bhadra 9.500
Reserve Malenalli 6.2 (thick veget.) [27]
3.6 (medium type)
0.9 (low density)
Arasapura 6.2 (high density)
3.6 (medium type)
0.9 (low density)
Shrublayer
Reserve Sonda 1046.88 kg/ha [26]
Bidralli 969.75 kg/ha
Nagur 224.14 kg/ha
Herblayer Minor forest 8.01623.50 t/ha
Reserve 3.15023.69 t/ha
Table 7
Biomass productivities in various types of vegetation
Vegetation types Biomass (t/ha/year)
Dense evergreen and semi evergreen 13.41±27.0
Low evergreen 3.60±6.50
Secondary evergreen 3.60±6.50
Dense deciduous forest 3.90±13.50
Savanna woodland 0.50±3.50
Coastal 0.90±1.50
T.V. Ramachandra et al. / Renewable and Sustainable Energy Reviews 4 (2000) 375±430390

Table
8
Population(1991),areaunder
di�erenttypes
ofvegetationin
Uttara
Kannada(Talukwise).
Production±dem
andratio(Talukwise)
consideringfuel
wooddem
andas0.7
t/person/year
Taluk
Populationtotal(1991)
Forest(ha)
Dry
deciduous
Moistdeciduous
Evergreen
Sem
ievergreen
Coastal
Biomassproduction
Biomassdem
and
Prod/dem
andratio
Bhatkal
129,017
25,390.46
5078.1
8124.9
12,187.4
58,449.6
141,918.7
0.41
Kumta
134,144
39,187.59
7837.5
11,756.3
7837.5
11,756.3
109,333.4
147,558.4
0.74
Karw
ar
142,845
52,808.68
10,561.7
15,842.6
10,561.7
15,842.6
147,336.2
157,129.5
0.94
Honavar
145,842
57,416.68
2870.8
20,095.8
17,225.0
17,225.0
160,192.5
160,426.2
1.00
Ankola
91,310
75,432.37
15,086.5
22,629.7
15,086.5
22,629.7
210,456.3
100,441
2.10
Haliyal
94,363
59,099.78
23,639.9
23,639.9
11,820.0
219,851.2
103,799.3
2.12
Siddapur
94,202
62,274.6
40,478.5
21,796.1
224,188.6
103,622.2
2.16
Sirsi
152,935
103,226.57
15,484.0
46,452.0
41,290.6
371,615.7
168,228.5
2.21
Mundgod
77,939
51,167.36
28,142.0
23,025.3
192,645.1
85,732.9
2.25
Yellapur
81,410
113,429.56
51,043.3
62,386.3
408,346.4
89,551
4.56
Supa
99,519
160,608.71
40,152.2
120,456.5
578,191.4
109,470.9
5.28
District
1,243,526
800,042.36
51,782.0
189,701.3
356,995.7
121,922.4
79,641.0
2,680,656.3
1,367,879
1.96
T.V. Ramachandra et al. / Renewable and Sustainable Energy Reviews 4 (2000) 375±430 391

Table
9
Population(1991),areaunder
di�erenttypes
ofvegetationin
Uttara
Kannada(Talukwise).
Production±dem
andratio(Talukwise)
consideringfuel
wooddem
andas1.1t/person/year
Taluk
Populationtotal(1991)
Forest(ha)
Dry
deciduous
Moistdeciduous
Evergreen
Sem
ievergreen
Coastal
Biomassproduction
Dem
and@
1.1t/pers
Production/dem
and
Supa
99,519
160,608.71
40,152.2
120,456.5
1,031,911.0
109,470.9
9.43
Yellapur
81,410
113,429.56
51,043.3
62,386.3
721,979.1
89,551
8.06
Mundgod
77,939
51,167.36
28,142.0
23,025.3
522,674.6
85,732.9
6.10
Haliyal
94,363
59,099.78
23,639.9
23,639.9
11,820.0
542,536.0
103,799.3
5.23
Sirsi
152,935
103,226.57
15,484.0
46,452.0
41,290.6
666,327.5
168,228.5
3.96
Siddapur
94,202
62,274.6
40,478.5
21,796.1
404,784.9
103,622.2
3.91
Ankola
91,310
75,432.37
15,086.5
22,629.7
15,086.5
22,629.7
372,635.9
100,441
3.71
Honavar
145,842
57,416.68
2870.8
20,095.8
17,225.0
17,225.0
286,222.1
160,426.2
1.78
Karw
ar
142,845
52,808.68
10,561.7
15,842.6
10,561.7
15,842.6
260,874.9
157,129.5
1.66
Kumta
134,144
39,187.59
7837.5
11,756.3
7837.5
11,756.3
193,586.7
147,558.4
1.31
Bhatkal
129,017
25,390.46
5078.1
8124.9
12,187.4
104,100.9
141,918.7
0.73
District
1,243,526
800,042.36
51,782.0
189,701.3
356,995.7
121,922.4
79,641.0
4,562,742.2
1,367,879
3.34
T.V. Ramachandra et al. / Renewable and Sustainable Energy Reviews 4 (2000) 375±430392

demand. This ratio at less than one, means that in that Taluk there is fuel wood
scarcity while a ratio of greater than one indicates that the Taluk has a surplus of
fuel wood. Fuel wood scarcity is evident in thickly populated coastal Taluks
namely Karwar (0.94). Kumta (0.74) and Bhatkal (0.41) as listed in Table 8.
Taking into account the inaccessibility of dense forests and the degradation of
forests closer to the villages, the available biomass computed in Table 8, based on
lower productivity values in each type of vegetation, seems to be more realistic
than the values computed in Table 9. Talukwise fuel wood available from forests
to demand, are shown pictorially in Figs 2 and 3 (are based on computations in
Tables 8 and 9).
It appears that in many Taluks household energy consumption doesn't, in itself,
trigger the removal of tree cover and land degradation. In fact, where energy
demand puts a heavy, directly observable damage on the environment, it is the
overall framework of development rather than energy demand of the residential
sector which is the prime cause of the problem. In coastal Taluks, the forest based
industries and grazing pressure (due to non availability of fodder) and the
encroachment and conversion of forest land for other purposes have resulted in a
decrease of vegetation cover and barren hill tops.
Fig. 2. Availability to demand ratio woody biomass (Talukwise).
T.V. Ramachandra et al. / Renewable and Sustainable Energy Reviews 4 (2000) 375±430 393

5. Bioenergy from agriculture
In this section assessment of residues from major crops such as paddy, oil seeds,maize etc. are carried out.
5.1. Agricultural population in the Uttara Kannada District
As per 1991 census, out of a total number of 428,663 workers, 141,345 arecultivators (32.98%), 82,283 are agricultural labourers (19.19%), and 56,937depend on livestock and forestry (13.28%). Thus, the population depending onagriculture and allied jobs, amounts to 65.45%. The Talukwise land utilisation forvarious agricultural crops, production and yield are given in Table 10. The netcropped area in the District is about 1084.28 km2, which amounts to 10.54% ofthe total area (compared to 55% of the Karnataka State) as against 12% in 1980±1981. The percentage of the area sown more than once is about 15% of the netarea sown. Agriculture and plantation are the major source of District revenue(nearly 50%). It is noticed that paddy yield is at a minimum in Mundgod (0.91 t/ha for improved variety, 1.62 for HY variety). While, it is maximum for Sirsi(3.04 t/ha for HY variety, 1.42 for improved variety) and Siddapur (1.62 t/ha forimproved variety). Based on 1984±1985 to 1993±1994 Talukwise crop data,average production (in tonnes), standard deviation and maximum and minimumvalues for major crops computed are listed in Table 11.
Fig. 3. Availability to demand ratio woody biomass (Talukwise).
T.V. Ramachandra et al. / Renewable and Sustainable Energy Reviews 4 (2000) 375±430394
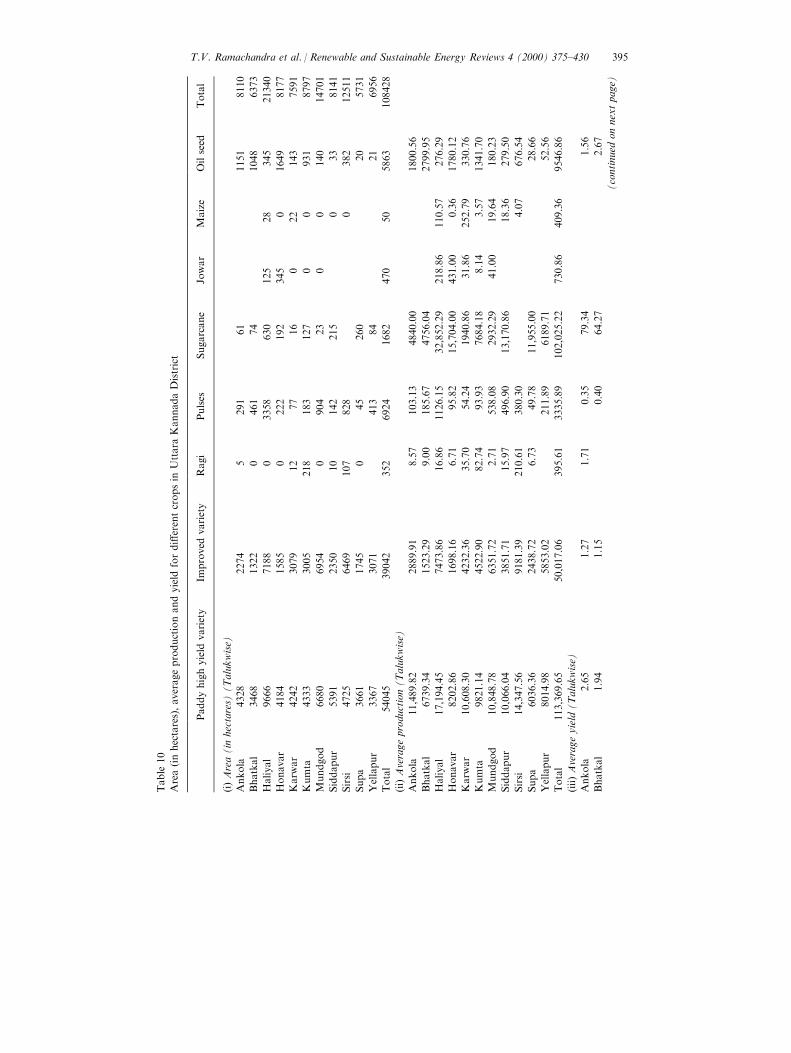
Table
10
Area(inhectares),averageproductionandyield
fordi�erentcropsin
Uttara
KannadaDistrict
Paddyhighyield
variety
Improved
variety
Ragi
Pulses
Sugarcane
Jowar
Maize
Oilseed
Total
(i)Area(in
hectares)
(Talukwise)
Ankola
4328
2274
5291
61
1151
8110
Bhatkal
3468
1322
0461
74
1048
6373
Haliyal
9666
7188
03358
630
125
28
345
21340
Honavar
4184
1585
0222
192
345
01649
8177
Karw
ar
4242
3079
12
77
16
022
143
7591
Kumta
4333
3005
218
183
127
00
931
8797
Mundgod
6680
6954
0904
23
00
140
14701
Siddapur
5391
2350
10
142
215
033
8141
Sirsi
4725
6469
107
828
0382
12511
Supa
3661
1745
045
260
20
5731
Yellapur
3367
3071
413
84
21
6956
Total
54045
39042
352
6924
1682
470
50
5863
108428
(ii)Averageproduction(Talukwise)
Ankola
11,489.82
2889.91
8.57
103.13
4840.00
1800.56
Bhatkal
6739.34
1523.29
9.00
185.67
4756.04
2799.95
Haliyal
17,194.45
7473.86
16.86
1126.15
32,852.29
218.86
110.57
276.29
Honavar
8202.86
1698.16
6.71
95.82
15,704.00
431.00
0.36
1780.12
Karw
ar
10,608.30
4232.36
35.70
54.24
1940.86
31.86
252.79
330.76
Kumta
9821.14
4522.90
82.74
93.93
7684.18
8.14
3.57
1341.70
Mundgod
10,848.78
6351.72
2.71
538.08
2932.29
41.00
19.64
180.23
Siddapur
10,066.04
3851.71
15.97
496.90
13,170.86
18.36
279.50
Sirsi
14,347.56
9181.39
210.61
380.30
4.07
676.54
Supa
6036.36
2438.72
6.73
49.78
11,955.00
28.66
Yellapur
8014.98
5853.02
211.89
6189.71
52.56
Total
113,369.65
50,017.06
395.61
3335.89
102,025.22
730.86
409.36
9546.86
(iii)Averageyield
(Talukwise)
Ankola
2.65
1.27
1.71
0.35
79.34
1.56
Bhatkal
1.94
1.15
0.40
64.27
2.67
(continued
onnextpage)
T.V. Ramachandra et al. / Renewable and Sustainable Energy Reviews 4 (2000) 375±430 395

Table
10(continued
)
Paddyhighyield
variety
Improved
variety
Ragi
Pulses
Sugarcane
Jowar
Maize
Oilseed
Total
Haliyal
1.78
1.04
0.34
52.15
1.75
3.95
0.80
Honavar
1.96
1.07
0.43
81.79
1.25
1.08
Karw
ar
2.50
1.37
2.98
0.70
121.30
11.49
2.31
Kumta
2.27
1.51
0.38
0.51
60.51
1.44
Mundgod
1.62
0.91
0.60
127.49
1.29
Siddapur
1.87
1.64
1.60
3.50
61.26
8.47
Sirsi
3.04
1.42
1.97
0.46
1.77
Supa
1.65
1.40
1.11
45.98
1.43
Yellapur
2.38
1.91
0.51
73.69
2.50
Total
23.66
14.69
8.63
8.91
767.78
3.00
15.44
25.33
T.V. Ramachandra et al. / Renewable and Sustainable Energy Reviews 4 (2000) 375±430396

Table 11
Average (avg), standard deviation (Sd), maximum, minimum production (in tonnes), during the period
1984±85 to 1993±94
Crop Avg Sd Max Min
Paddy (high yield variety)
Ankola 11,489.82 3159.50 18,513.00 8179.00
Bhatkal 6739.34 785.40 7838.00 5303.00
Haliyal 17,194.45 6315.85 23,607.00 5676.00
Honavar 8202.86 2248.29 11,494.00 3838.00
Karwar 10,608.30 3162.13 16,276.00 7300.00
Kumta 9821.14 2408.96 15,152.00 6693.00
Mundgod 10,848.78 6030.95 20,375.00 1275.00
Siddapur 10,066.04 1573.61 13,075.00 7964.00
Sirsi 14,347.56 4337.03 22,761.00 10,535.94
Supa 6036.36 2131.31 8758.55 1788.00
Yellapur 8014.98 2243.38 10,637.00 3650.00
Paddy (improved variety)
Ankola 2889.91 742.50 3874.00 1545.00
Bhatkal 1523.29 315.86 2010.00 1094.00
Haliyal 7473.86 3074.39 11,511.00 3015.00
Honavar 1698.16 650.97 2473.00 406.00
Karwar 4232.36 999.74 6027.00 2997.00
Kumta 4522.90 1225.35 6340.00 2883.00
Mundgod 6351.72 4154.18 13,217.00 640.00
Siddapur 3851.71 702.39 5275.00 2900.00
Sirsi 9181.39 2652.26 12,095.00 4633.00
Supa 2438.72 1401.81 5468.00 938.00
Yellapur 5853.02 2136.59 9755.00 2631.00
Jowar
Haliyal 218.86 56.82 300.00 138.00
Mundgod 431.00 271.03 1080.00 204.00
Sirsi 31.86 61.58 181.00 0.00
Supa 8.14 10.96 30.00 0.00
Yellapur 41.00 57.25 168.00 0.00
Maize
Haliyal 110.57 52.52 220.00 56.00
Honavar 0.36 0.87 2.50 0.00
Mundgod 252.79 207.40 577.00 28.00
Siddapur 3.57 8.75 25.00 0.00
Sirsi 19.64 27.61 85.50 0.00
Supa 18.36 16.50 40.50 0.00
Yellapur 4.07 6.91 20.50 0.00
Oilseeds
Ankola 1800.56 160.76 2142.00 1620.00
Bhatkal 2799.95 3532.12 11,420.00 717.00
Haliyal 276.29 101.72 449.26 124.25
Honavar 1780.12 363.05 2122.00 1027.00
Karwar 330.76 143.98 570.00 198.00
Kumta 1341.70 711.78 2739.92 130.00
Mundgod 180.23 95.99 318.00 56.00
(continued on next page)
T.V. Ramachandra et al. / Renewable and Sustainable Energy Reviews 4 (2000) 375±430 397

5.2. Agricultural residues
5.2.1. Paddy residuesPaddy (Oryza sativa ) constitutes a major cereal crop (85.85%, 93,087 ha) in the
Uttara Kannada District. Rice husk and stalks are the major residues of paddycultivation. The potential availability of husk and stalk Talukwise is given inTable 12. The quality of husk depends upon the type of rice mill. In the single
Table 11 (continued )
Crop Avg Sd Max Min
Siddapur 279.50 197.14 616.00 60.47
Sirsi 676.54 175.50 951.00 397.00
Supa 28.66 16.31 47.00 3.00
Yellapur 52.56 27.48 111.00 29.00
Pulses
Ankola 103.13 22.22 141.00 73.00
Bhatkal 185.67 39.82 248.00 132.00
Haliyal 1126.15 214.76 1419.00 794.00
Honavar 95.82 24.54 137.00 61.00
Karwar 54.24 34.28 109.00 25.00
Kumta 93.93 29.68 129.00 52.31
Mundgod 538.08 358.77 1365.00 247.00
Siddapur 496.90 573.99 1858.00 73.32
Sirsi 380.30 117.55 587.00 196.00
Supa 49.78 40.65 139.00 16.00
Yellapur 211.89 81.54 364.00 110.00
Ragi
Ankola 8.57 6.19 21.00 0.00
Bhatkal 9.00 10.41 28.00 0.00
Haliyal 16.86 10.89 31.00 0.00
Honavar 6.71 4.83 14.00 0.00
Kumta 35.70 19.82 69.00 0.00
Mundgod 82.74 80.62 259.00 0.00
Siddapur 2.71 4.49 12.00 0.00
Sirsi 15.97 10.90 32.00 0.00
Supa 210.61 152.01 424.00 0.00
Yellapur 6.73 7.61 24.00 0.00
Sugar cane
Ankola 4840.00 1109.79 6717.00 3658.00
Bhatkal 4756.04 2130.00 6717.00 50.26
Haliyal 32,852.29 10,118.43 47,520.00 14,286.00
Honavar 15,704.00 8109.91 35,250.00 10,348.00
Karwar 1940.86 1100.44 3500.00 928.00
Kumta 7684.18 3616.40 12,500.00 86.26
Mundgod 2932.29 3480.65 10,604.00 0.00
Siddapur 13,170.86 5861.12 22,776.00 5250.00
Sirsi
Supa 11,955.00 5771.85 19,493.00 4425.00
Yellapur 6189.71 742.05 7308.00 4890.00
T.V. Ramachandra et al. / Renewable and Sustainable Energy Reviews 4 (2000) 375±430398

Table
12
Energyfrom
agriculturalresidues
forfuel
andfodder
inlakhkWh
Crop
Production
Residues
intonnes
Energy(lakhkWh)thatcould
begeneratedoutofthiswaste
Average
Sd
Husk
Stalk
Husk±fuel
Stalk±fodder
Paddy(highyield
variety)
Ankola
11,489.82
3159.50
3431.89
11,486.32
119.64
400.41
Bhatkal
6739.34
785.40
2012.97
6737.29
70.17
234.86
Haliyal
17,194.45
6315.85
5135.80
17,189.21
179.03
599.22
Honavar
8202.86
2248.29
2450.11
8200.36
85.41
285.86
Karw
ar
10,608.30
3162.13
3168.59
10,605.07
110.46
369.69
Kumta
9821.14
2408.96
2933.47
9818.15
102.26
342.26
Mundgod
10,848.78
6030.95
3240.42
10,845.48
112.96
378.07
Siddapur
10,066.04
1573.61
3006.62
10,062.97
104.81
350.80
Sirsi
14,347.56
4337.03
4285.47
14,343.19
149.39
500.00
Supa
6036.36
2131.31
1803.00
6034.52
62.85
210.36
Yellapur
8014.98
2243.38
2393.99
8012.53
83.45
279.32
Total
113,369.65
33,862.31
113,335.09
1180.44
3950.86
Paddy(im
provedvariety)
Ankola
2889.91
742.50
863.19
2889.03
30.09
100.71
Bhatkal
1523.29
315.86
454.99
1522.83
15.86
53.09
Haliyal
7473.86
3074.39
2232.36
7471.58
77.82
260.46
Honavar
1698.16
650.97
507.22
1697.64
17.68
59.18
Karw
ar
4232.36
999.74
1264.16
4231.07
44.07
147.50
Kumta
4522.90
1225.35
1350.94
4521.53
47.09
157.62
Mundgod
6351.72
4154.18
1897.19
6349.79
66.14
221.35
Siddapur
3851.71
702.39
1150.47
3850.54
40.11
134.23
Sirsi
9181.39
2652.26
2742.38
9178.59
95.60
319.97
Supa
2438.72
1401.81
728.42
2437.98
25.39
84.99
Yellapur
5853.02
2136.59
1748.24
5851.24
60.94
203.97
Total
50,017.06
14,939.57
50,001.82
520.79
1743.06
(continued
onnextpage)
T.V. Ramachandra et al. / Renewable and Sustainable Energy Reviews 4 (2000) 375±430 399

Table
12(continued
)
Crop
Production
Residues
intonnes
Energy(lakhkWh)thatcould
begeneratedoutofthiswaste
Average
Sd
Husk
Stalk
Husk±fuel
Stalk±fodder
Jowar
Haliyal
218.86
56.82
262.60
9.15
Mundgod
431.00
271.03
517.14
18.03
Sirsi
31.86
61.58
38.22
1.33
Supa
8.14
10.96
9.77
0.34
Yellapur
41.00
57.25
49.19
1.71
Total
730.86
457.64
876.92
30.57
Maize
Haliyal
110.57
52.52
110.57
221.14
4.50
8.99
Honavar
0.36
0.87
0.36
0.71
0.01
0.03
Mundgod
252.79
207.40
252.79
505.57
10.28
20.56
Siddapur
3.57
8.75
3.57
7.14
0.15
0.29
Sirsi
19.64
27.61
19.64
39.29
0.80
1.60
Supa
18.36
16.50
18.36
36.71
0.75
1.49
Yellapur
4.07
6.91
4.07
8.14
0.17
0.33
Total
409.36
409.36
818.71
16.65
33.30
Oilseeds
Ankola
1800.56
160.76
539.78
21.95
Bhatkal
2799.95
3532.12
839.37
34.14
Haliyal
276.29
101.72
82.83
3.37
Honavar
1780.12
363.05
533.65
21.70
Karw
ar
330.76
143.98
99.15
4.03
Kumta
1341.70
711.78
402.22
16.36
Mundgod
180.23
95.99
54.03
2.20
Siddapur
279.50
197.14
83.79
3.41
Sirsi
676.54
175.50
202.81
8.25
Supa
28.66
16.31
8.59
0.35
Yellapur
52.56
27.48
15.76
0.64
Total
9546.86
2861.97
116.40
T.V. Ramachandra et al. / Renewable and Sustainable Energy Reviews 4 (2000) 375±430400

Pulses
Ankola
103.13
22.22
51.57
1.80
Bhatkal
185.67
39.82
92.84
3.24
Haliyal
1126.15
214.76
563.08
19.63
Honavar
95.82
24.54
47.91
1.67
Karw
ar
54.24
34.28
27.12
0.95
Kumta
93.93
29.68
46.97
1.64
Mundgod
538.08
358.77
269.04
9.38
Siddapur
496.60
573.99
248.45
8.66
Sirsi
380.30
117.55
190.15
6.63
Supa
49.78
40.65
24.89
0.87
Yellapur
211.89
81.54
105.94
3.69
Total
3335.89
1667.94
58.14
Ragi
Ankola
8.57
6.19
4.29
0.15
Bhatkal
9.00
10.41
4.50
0.16
Haliyal
16.86
10.89
8.43
0.29
Honavar
6.71
4.83
3.36
0.12
Kumta
35.70
19.82
17.85
0.62
Mundgod
82.74
80.62
41.37
1.44
Siddapur
2.71
4.49
1.36
0.05
Sirsi
15.97
10.90
7.99
0.28
Supa
210.61
152.01
105.31
3.67
Yellapur
6.73
7.61
3.36
0.12
Total
395.61
197.81
6.90
Sugarcane
Ankola
4840.00
1109.79
1462.83
59.49
Bhatkal
4756.04
2130.00
1437.45
58.46
Haliyal
32,852.29
10,118.43
9929.18
403.82
Honavar
15,704.00
8109.91
4746.33
193.03
Karw
ar
1940.86
1100.44
586.60
23.86
Kumta
7684.18
3616.40
2322.44
94.45
Mundgod
2932.29
3480.65
886.25
36.04
Siddapur
13,170.86
5861.12
3980.72
161.90
(continued
onnextpage)
T.V. Ramachandra et al. / Renewable and Sustainable Energy Reviews 4 (2000) 375±430 401

Table
12(continued
)
Crop
Production
Residues
intonnes
Energy(lakhkWh)thatcould
begeneratedoutofthiswaste
Average
Sd
Husk
Stalk
Husk±fuel
Stalk±fodder
Sirsi
8865.65
2341.35
2679.53
108.98
Supa
11,955.00
5771.85
3613.24
146.95
Yellapur
6189.71
742.05
1870.76
76.08
Total
110,890.87
33,515.33
1363.07
Cotton
Haliyal
6376.75
2564.12
22,318.63
778.03
Mundgod
4406.33
2300.12
15,422.16
537.62
Siddapur
9.13
6.22
31.96
1.11
Sirsi
497.67
243.45
1741.85
60.72
Supa
124.57
43.56
436.00
15.20
Yellapur
591.37
231.12
2069.80
72.15
Total
12,005.82
5388.59
42,020.37
1464.83
Uttara
Kannadatotalenergyfrom
agri.residues
inlakhkWh
3197.35
7287.66
T.V. Ramachandra et al. / Renewable and Sustainable Energy Reviews 4 (2000) 375±430402

huller the husk is obtained in a ®ne broken state and is always mixed with branand broken rice. This husk bran mix is used by the farmers as cattle feed and bymill owners as boiler fuel. In the sheller-huller or sheller and modern rice mills,the husk is free from bran and broken rice. The average higher calori®c value ofrice husk ranges from 2937.5 to 3461.31 kcals (the higher calori®c value includesthe latent heat of water vapour in the product of combustion Ð obtained with thehelp of a bomb calorimeter). The lower calori®c value ranges from 2637.29 to3161.25 kcals. Proximate analysis of paddy husk shows that the volatile matterranges from 66.6±69.3%, ®xed carbon in the range of 12.7±16.9% and ash in therange of 16.5±18.6%. Based on the quantity of paddy production in each Taluk,energy equivalent in kWh is computed for husk and stalk. Stalk is mainly used asfodder. The energy equivalent of paddy husk (both HY and improved variety) asindicated in Table 12 is about 1701.23 lakh kWh.
5.2.2. BagasseSugarcane (Saccharum o�cinarum ) is one of the important cash crops in
Karnataka's economy. The area under sugarcane in Uttara Kannada is about1682 ha with a production of 102,025 tonnes. Talukwise area, production andyield of sugarcane is listed in Table 10. While Table 11 provides quantities ofbagasse available in the District. Bagasse is the ®brous residue left after theextraction of juice from sugarcane. The quantity of bagasse depends upon the®brous content, and is in the range of 30±32%. Juice from sugarcane is used tomanufacture jaggery. The bagasse produced is used for making jaggery as fuelalong with logs of wood. The average gross calori®c value of bagasse is about3500 kcals. One tonne of bagasse generates about 2.5 tonnes of steam. Bagasse isbeing used to generate methane. One tonne of bagasse generates about 200 cu mof combustible gas. In the sugar industry bagasse is used for generating steam inthe boilers to drive the prime movers as well as for boiling and concentratingjuice. The quantity of bagasse available in Uttara Kannada is about 33,515 tonnesand its energy equivalent is 1363 lakh kWh.
5.2.3. Oil seedGroundnut (Arachis hypogea ) in terms of weight, is the most important oil seed
crop ranking next to cotton. The Uttara Kannada District has about 5863 ha(5.48%) under oil seed crop. Depending upon variety, season and soil conditionsabout 30% of the groundnut pod consists of shell. On average about 2861.97tonnes of shell is available in the District. The average higher calori®c value ofshell is about 4532.15 kcal/kg and the lower calori®c value is about 4248.58 kcal/kg. The energy equivalent of the total available Groundnut husk is about 116.4lakh kWh. Groundnut shells are also reported to be good raw materials for themanufacture of activated carbons for bleaching purposes, and compare favourablywith other good quality carbons.
5.2.4. Maize residuesMaize cobs constitute about 30% of maize grain (Zea mays ). The cobs are used
T.V. Ramachandra et al. / Renewable and Sustainable Energy Reviews 4 (2000) 375±430 403

as fuel or as a supplementary feed for cattle. About 409.36 tonnes of maize huskand 818.71 tonnes of stalk (mainly used as fodder) are available. The energyequivalent of husk works out to be about 16.65 lakh kWh. While, residues of ragi(Eleusine coracana ) also refereed as ®nger millet (197.81 tonnes), pulses (1667.84tonnes), cotton (Gossypium hirsutum ) (42020.37 tonnes) and jowar (Sorghumvulgare ) (876.92 tonnes) are used mainly as fodder. Energy equivalents of theseresidues are listed in Table 12.
6. Bioenergy from horticulture
Next to paddy plantations crops such as areca (Areca catechu ), cashew(Anacardium occidentale ), coconut (Cocos nucifera ), pepper (Piper nigrum ) andcardamom (Elletaria cardamomum ) occupy an important place. The area broughtunder these crops shows an upward trend during recent years. The cultivation ofareca is con®ned to the Taluks of Sirsi, Siddapur, Honnavar, Kumta andYellapur. In the coastal belt, coconut is the important cash crop. Talukwise area,production of areca, coconut and cashew are listed in Tables 13±15. Area underareca, coconut and cashew in Uttara Kannada are 8499 ha, 5685 ha and 1749 harespectively.
6.1. Horticulture residues
6.1.1. Coconut residuesThe fuel biomass of coconut palms are leaves (12/tree/year), in¯orescence (12±
15/tree/year), shells (100/tree/year), husk (100/tree/year) and leaf sheath. Theweight of these constituents, per tree, are given in Table 16.
Coconut husk is generally used for making rope, coir products and also formulching in coconut plantations in the Uttara Kannada District. Coir dust whichconstitutes 70% of husk, decomposes very slowly in the soil as its pentosan ligninratio is less than 0.5. It absorbs about eight times its weight of water and partswith it comparatively slowly [28]. The plaited leaves of coconut palm are used forthatching houses, fencing and for making baskets. Unplaited leaves are also usedfor fencing, mulching and for shading nurseries. The lower hard portion of leavesis used as fuel, which constitute 40±50% of the total weight of leaf.
Coconut shells are mainly used for fuel and to a lesser extent for themanufacture of various domestic utensils, fancy items etc. The calori®c value ofshell is in the range of 4500±4800 kcals/kg. The commercial utilisation of coconutshell for the production of shell charcoal, activated carbon and shell ¯our is nowgaining importance. The output of charcoal by ordinary processes is about 30%of the original shells. The average output has been found to be 35 kg charcoalfrom 1000 whole shells. Talukwise energy equivalent of coconut residues areestimated assuming 100% shells, 100% in¯orescence, 30% husk and 40% ofleaves would be available to use as fuel, (as listed in Tables 13±15). It is seen thatcoastal Taluks contribute a major share of 84.49% of the total. The energy
T.V. Ramachandra et al. / Renewable and Sustainable Energy Reviews 4 (2000) 375±430404

Table
13
Horticulturalcrop-A
reca.
Area(inhectares),production(intonnes)andnet
energyavailable
(lakhkWh)
Area
(hectares)
Percentageshare
Production
(tonnes)
Leaves
(tonnes)
In¯orescence
(tonnes)
Nuts
andhusk
(tonnes)
Leafsheath
(tonnes)
Energy:
Husk
(30%)
+in¯ore+leafsheath
(50%)
+leaf(50%)
Ankola
235
2.77
293.75
1443.49
1443.49
875.61
951.75
101.00
Bhatkal
234
2.75
292.50
2874.69
2211.30
871.88
947.70
150.21
Haliyal
0.00
Honavar
922
10.85
1152.50
11,326.77
8712.90
3435.37
3734.10
591.85
Karw
ar
23
0.27
28.75
282.56
217.35
85.70
93.15
14.76
Kumta
459
5.40
573.75
5638.82
4337.55
1710.23
1858.95
294.64
Mundgod
77
0.91
96.25
945.95
727.65
286.90
311.85
49.43
Siddapur
2400
28.24
5280.00
29,484.00
22,680.00
8942.40
9720.00
1540.61
Sirsi
2925
34.42
6435.00
35,933.63
27641.25
10,898.55
11,846.25
1877.62
Supa
94
1.11
206.80
1154.79
888.30
350.24
380.70
60.34
Yellapur
1130
13.30
2486.00
13,882.05
10,678.50
4210.38
4576.50
725.37
Total
8499
100.00
16,845.30
102,966.73
79,538.29
31,667.27
34,420.95
5405.83
T.V. Ramachandra et al. / Renewable and Sustainable Energy Reviews 4 (2000) 375±430 405

Table
14
Horticulturalcrop-coconut.
Area(inhectares),production(intonnes)andnet
energyavailable
(lakhkWh)
Area
Percentageshare
Nutsin
'000s
Leaves
(tonnes)
In¯orescence
(tonnes)
Husk
Nut/shells
Leafsheath
Energy:
Shell+
30%
husk+
leafsheath+
in¯ore+
leaves
(40%
)
Ankola
641
11.28
7692.00
3772.93
699.20
1153.80
3030.65
396.14
278.55
Bhatkal
642
11.29
7704.00
3778.81
700.29
1155.60
3035.38
396.76
278.98
Haliyal
14
0.25
168.00
82.40
15.27
25.20
66.19
8.65
6.08
Honavar
1535
27.00
18,420.00
9035.01
1674.38
2763.00
7257.48
948.63
667.04
Karw
ar
785
13.81
9420.00
4620.51
856.28
1413.00
3711.48
485.13
341.13
Kumta
1200
21.11
14,400.00
7063.20
1308.96
2160.00
5673.60
741.60
521.47
Mundgod
53
0.93
636.00
311.96
57.81
95.40
250.58
32.75
23.03
Siddapur
45
0.79
540.00
264.87
49.09
81.00
212.76
27.81
19.55
Sirsi
373
6.56
4476.00
2195.48
406.87
671.40
1763.54
230.51
162.09
Supa
81
1.42
972.00
476.77
88.35
145.80
382.97
50.06
35.20
Yellapur
316
5.56
3792.00
1859.98
344.69
568.80
1494.05
195.29
137.32
Total
5685
100.00
68,220.00
33,461.91
6201.20
10,233.00
26,878.68
3513.33
2470.44
T.V. Ramachandra et al. / Renewable and Sustainable Energy Reviews 4 (2000) 375±430406

equivalent of coconut residues for Uttara Kannada is about 2470.44 lakh kWh,with Honnavar 667.04 lakh kWh followed by Kumta 521.47 lakh kWh.
6.1.2. Areca residuesThe fuel biomass of Arecanut palm are leaves (6±7/tree/year), in¯orescence
(4±5/tree/year), husk and leaf sheath.
1. Areca husk Ð husk is the outer cover of areca fruit. It constitutes about 60±80% of the total volume and weight of the fruits (fresh weight basis) [29].Currently, this is being largely wasted in Uttara Kannada except for use as aninferior fuel and mulch. The husk ®bers are predominantly composed ofcellulose with varying proportions of hemicellulose (35±64.8%), lignin (13.0±26.0%), pectin and protopectin. These properties make it a good raw materialin the manufacture of hard boards, paper boards, activated carbon etc.Properly composted husk could be a good organic manure. It consists of 1.0±1.1% N2, 0.4±0.5% P2O5, and 1.0±1.5% K2O. It has been estimated [30] that a
Table 15
Horticultural crop-cashew
Area (in hectares), production (in tonnes) and net energy available (lakh kWh)
Area Percentage share Tonnes Husk
(tonnes)
Fuelwood
(tonnes)
Energy:
Husk+fuelwood
Ankola 304 17.38 212.80 319.20 1064.00 63.70
Bhatkal 188 10.75 131.60 197.40 658.00 39.39
Haliyal 10 0.57 7.00 10.50 35.00 2,.10
Honavar 340 19.44 238.00 357.00 1190.00 71.24
Karwar 140 8.00 98.00 147.00 490.00 29.33
Kumta 627 35.85 827.64 1241.46 2194.50 148.36
Mundgod 8 0.46 5.60 8.40 28.00 1.68
Siddapur 13 0.74 9.10 13.65 45.50 2.72
Sirsi 69 3.95 48.30 72.45 241.50 14.46
Supa 33 1.89 23.10 34.65 115.50 6.91
Yellapur 17 0.97 11.90 17.85 59.50 3.56
Total 1749 100.00 1613.04 2419.56 6121.50 383.45
Table 16
Fuel biomass from coconut palm per year
Components Productivity/tree Biomass (kg)/tree
Leaves 12/tree/year 48.50
In¯orescence 12±15 tree/year 10.00
Shells 100/tree/year 14.91
Husk 100/tree/year 39.55
Leaf sheath 6.55
Total 119.51
T.V. Ramachandra et al. / Renewable and Sustainable Energy Reviews 4 (2000) 375±430 407
lakh tonne of composted husk provides about 1000 tonnes of N2, 500 tonnes ofP2O5 and 1000 tonnes of K2O. Also it is reported that husk is very resistant tomicrobial degradation because of the presence of ligno cellulose.
2. Leaf sheath Ð areca palm sheds about 5±6 leaves per year. About 34,420.95tonnes of leaf sheath are available in the District (Talukwise availability islisted in Tables 13±15). The sheath measure about 75±85 cm long and 35±40 cmwide at the center and 15±20 cm at the stalk end. Freshly fallen leaves containabout 55±60% moisture. The major constituents of leaf sheath are cellulose(43%), crude ®bre (33%) and ash (5%). About 34,420.95 tonnes of leaf sheathare available in the Uttara Kannada District. In Sirsi, Siddapur Taluks leafsheath is also used as cattle feed by some farmers. From an organic manurepoint of view, it consists of 0.7% N2, 0.3% P2O5, and 1.0% K2O.
In coastal Taluks like Honnavar, sheaths are used to manufacture hats forfarm workers. In some places it is used to manufacture throw-away cups andplates, packing cases, leaf sheath plyboards, decorative vaneer panels andpicture mounts.
3. Leaf Ð the quantity of areca leaves available is about 102,966.7 tonnes. Atpresent, it is used for thatching and also as a mulch in areca gardens. Theleaves are a good source of organic manure. Approximate composition is0.94% N2, 0.096% P2O5, and 1.0% K2O.
4. Other residues such as in¯orescence are used mainly as fuel. About 79,538.39tonnes of in¯orescence is available annually. With the assumption that 30%husk, 50% leaf sheath and 100% in¯orescence is available for fuel, the energyequivalent computed from areca residues works out to be 5405.83 lakh kWh.
6.1.3. CashewThe Cashewnut tree was introduced for the purpose of checking soil erosion on
coastal lands and hill slopes. It does not grow satisfactorily at elevations higherthan 300 m [31]. Cashewnut has gained commercial importance during the lasttwo decades on account of the increased demand for its edible kernel and shell oilin the international markets.
The area under Cashew plantation in Uttara Kannada is about 1749 ha with anannual production of 1613 tonnes of Cashew kernels. Cashew shell husk is animportant residue of cashew and the quantity available is about 2419.56 tonnes.Considering net primary productivity of Cashew wood from plantations as 3 t/ha/year, total quantity of fuel wood available annually is about 6121.5 tonnes. Theenergy equivalent of Cashew shell husk and fuel wood is 383.45 lakh kWh.Talukwise information of area under Cashew production, quantity of husk andfuel wood available annually are given in Tables 13±15.
T.V. Ramachandra et al. / Renewable and Sustainable Energy Reviews 4 (2000) 375±430408

7. Bioenergy from animal residues
7.1. Livestock
Livestock is an important component of the agro ecosystem. For instance,livestock provide the critical energy input to the crop lands that is required forploughing, threshing and other farm operations. Animal dung provides essentialnutrients required for soil fertility and crop yields in the form of organic manure.Uttara Kannada farmers are distinct example of practitioners with a mix ofagriculture, animal care and silviculture which requires the intensive use of croplands, grazing lands and forest lands adjoining the village (which forms part of theintegrated village ecosystem). In this section, the quantity of animal residueavailable and the option of converting it to biogas for cooking purposes isdiscussed.
Data collected from Taluk's Veterinary Department regarding livestockpopulation is tabulated in Tables 17±19. There are about 463,729 cattle, 100,786bu�aloes, 18.853 goats and 4997 sheep in Uttara Kannada. The quantity of dungyield per cattle varies from place to place. It is seen that cattle dung available peranimal in the coastal Taluk is about 3±4.5 kg/adult animal, in the hilly Taluks ofSirsi and Siddapur it ranges from 8±10 kg/animal, bu�aloes 12±15 kg, stall fedbu�alo about 15±18 kg, hybrid ones about 15±18 kg. By considering lower ®gures(such as 3 kg per animal for coastal cattle, 8 kg/animal for Sirsi, Siddapur cattle,12 kg/animal for bu�aloes), the total cattle dung available is about 844,414.18tonnes/year and total bu�alo dung available is about 441,442.7 tonnes/year. Withthe assumption of 0.036 m3 of biogas yield per kg of cattle/bu�aloes dung [32], weestimate that total quantity of gas available (if all is used for biogas) is about46,290.85 thousand m3. It is estimated that per capita requirement of gas is about0.34±0.43 m3/day for domestic purposes. Which means, that gas generated byanimal dung is su�cient to meet the requirement of 30% of the total populationof Uttara Kannada District. Talukwise availability of gas and the percentage ofthe population's requirement computed is listed in Tables 17±19. The same isshown pictorially in Fig. 4. From this analysis it is evident that in hilly Talukssuch as Sirsi, Siddapur and Yellapur biogas if opted, can meet the requirement ofmore than 50% of these respective Taluk's populations. It is seen that the dungyield in sheep is about 1.5 kg/day, goat is about 1.5 kg/day and pig is about 2.5kg/day. Gas yield per kg of pig dung is about 0.062 m3 and sheep and goat isabout 0.054 m3. As indicated in Tables 17±19 the total quantity of gas availablefrom sheep, goat and pig is about 897,340 m3. Livestock sustain on fodder fromgrasslands, agricultural residues and from forest lands. We now look at thequantity of fodder available in the District from various categories of vegetation.
7.2. Fodder availability
Litter production in forests under various vegetation types is estimatedTalukwise and the same is listed in Table 20. While Table 21, is a compilation of
T.V. Ramachandra et al. / Renewable and Sustainable Energy Reviews 4 (2000) 375±430 409

Table
17
Livestock
population(Talukwise),estimateddungandgasyield
per
year
Taluk
Cattle
Totalcattle
dungproduced(tonnes)
Bu�alo
Totalbu�alo
dungproduced(tonnes)
Male
Fem
ale
Total
Male
Fem
ale
Total
Ankola
15,943
11,749
27,692
30,322.74
2951
4107
7058
30,914.04
Bhatkal
10,613
11,838
22,451
24,583.85
2936
3846
6782
29,705.16
Haliyal
21,978
17,118
39,096
85,620.24
3572
9635
13,207
57,846.66
Honavar
19,811
28,863
48,674
53,298.03
2103
4807
6910
30,265.8
Karw
ar
11,220
8932
20,152
22,066.44
3654
4144
7798
34,155.24
Kumta
18,269
19,066
37,335
40,881.83
2014
4831
6845
29,981.1
Mundgod
18,757
15,122
33,879
74,195.01
1331
4673
6004
26,297.52
Sirsi
44,298
48,670
92,968
203,599.92
3925
13,305
17,230
75,467.4
Siddapur
36,927
36,646
73,573
161,124.87
2451
9807
12,258
53,690.04
Supa
12,390
9178
21,569
47,235.45
2720
2100
4820
21,111.6
Yellapur
21,883
24,457
46,341
101,485.80
4263
7611
11,874
52,008.12
District:
232,090
231,639
463,729
844,414.18
31,920
68,866
100,786
441,442.68
T.V. Ramachandra et al. / Renewable and Sustainable Energy Reviews 4 (2000) 375±430410
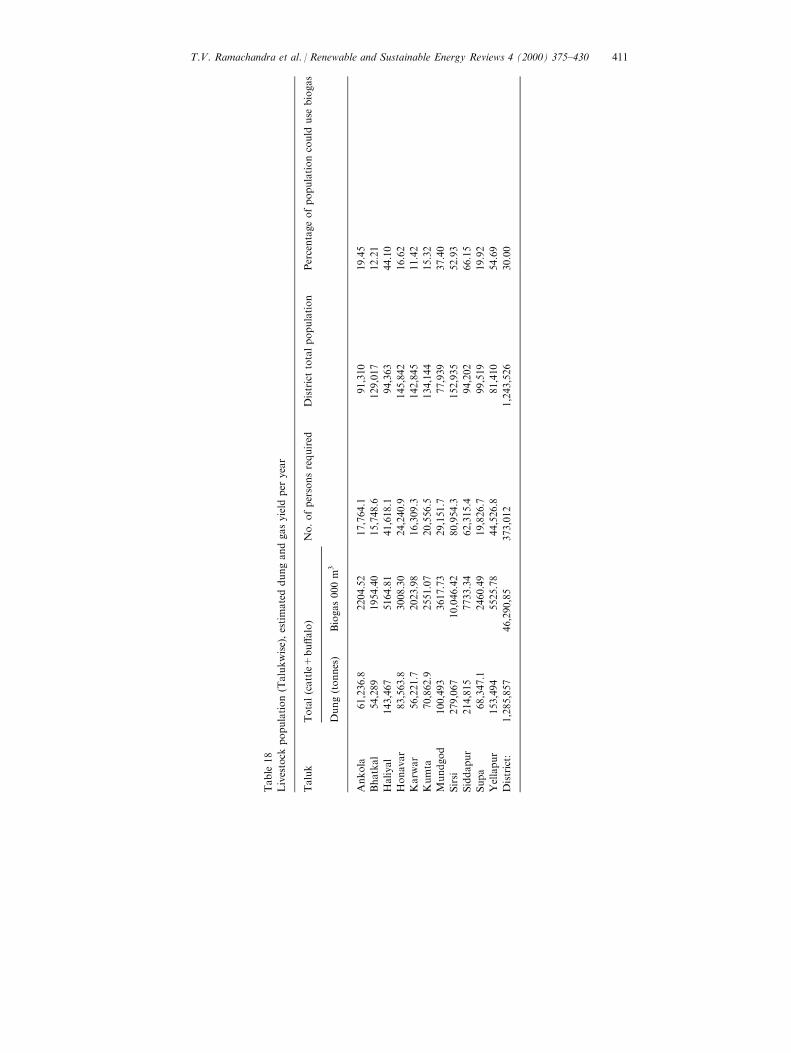
Table
18
Livestock
population(Talukwise),estimateddungandgasyield
per
year
Taluk
Total(cattle+
bu�alo)
No.ofpersonsrequired
Districttotalpopulation
Percentageofpopulationcould
use
biogas
Dung(tonnes)
Biogas000m
3
Ankola
61,236.8
2204.52
17,764.1
91,310
19.45
Bhatkal
54,289
1954.40
15,748.6
129,017
12.21
Haliyal
143,467
5164.81
41,618.1
94,363
44.10
Honavar
83,563.8
3008.30
24,240.9
145,842
16.62
Karw
ar
56,221.7
2023.98
16,309.3
142,845
11.42
Kumta
70,862.9
2551.07
20,556.5
134,144
15.32
Mundgod
100,493
3617.73
29,151.7
77,939
37.40
Sirsi
279,067
10,046.42
80,954.3
152,935
52.93
Siddapur
214,815
7733.34
62,315.4
94,202
66.15
Supa
68,347.1
2460.49
19,826.7
99,519
19.92
Yellapur
153,494
5525.78
44,526.8
81,410
54.69
District:
1,285,857
46,290,85
373,012
1,243,526
30.00
T.V. Ramachandra et al. / Renewable and Sustainable Energy Reviews 4 (2000) 375±430 411

Table
19
Livestock
population(Talukwise),estimateddungandgasyield
per
year
Taluk
Sheep
Goats
Pigs
Wasteproducedin
tonnes/year
Biogas'000m
3No.ofpersonsrequired/yr
Ankola
46
458
2277.77
17.22
138.77
Bhatkal
196
701
491.11
30.45
245.36
Haliyal
850
2230
987
2586.94
160.39
1292.43
Honavar
75
338
40
262.62
16.28
131.20
Karw
ar
357
303
286
622.33
38.58
310.91
Kumta
384
196
67
378.69
23.48
189.19
Mundgod
741
2779
1927.20
119.49
962.82
Sirsi
853
7245
55
4483.84
278.00
2240.11
Siddapur
415
3975
2403.53
149.02
1200.79
Supa
619
155
8431.07
26.73
215.36
Yellapur
461
473
106
608.09
37.70
303.80
District:
4997
18,853
1551
14,473.16
897.34
7230.75
T.V. Ramachandra et al. / Renewable and Sustainable Energy Reviews 4 (2000) 375±430412

agro residues such as paddy, cotton maize, pulses stalk etc. It is found that about208,918.67 tonnes of agro residues are available in the District.
7.3. Fodder demand
The average weight of cattle and bu�alo is approximately about 200 and 260 kgrespectively. Taking the daily fodder requirement at about 2.5% of body weight,the fodder requirement computed for the district is about 10.85 lakh tonnes. Asindicated in Table 22, the total agro residue available is about 2.08 lakh tonnes.The balance of 8.77 lakh tonnes of fodder is being provided by forests and grasslands. The productivity of grass land is about 5±15 t/ha. In Sirsi, Siddapur andYellapur the yield is as high as 15±60 t/ha. Grass is generally available during themonsoon period. In Uttara Kannada, land under permanent pasture is about20,369 ha, and grass production is about 1.01 lakh tonnes. With the onset of thedry months, the grass availability declines and crop residues obtained fromagriculture and leaf fodder obtained from trees, help to tide over the scarcityperiod. In some parts of Sirsi, at places like Banavasi, fodder crop such assunhemp is grown during the kharif season as a second crop. The portion offodder crops is left (about 25±30%) which in land provides the nutrient for rabicrop. This practice has yielded a higher yield of paddy and also helped in gettingover fodder scarcity. In recent years croplands have been expanded onto grazing
Fig. 4. Percentage of population requirement can be met with biogas option.
T.V. Ramachandra et al. / Renewable and Sustainable Energy Reviews 4 (2000) 375±430 413

Table
20
Talukwiselitter
productionin
tonnes
Taluk
Forest
(ha)
Areain
hectaresÐ
under
variousvegetation
Coastal
Litterproduction±biomass
production
Dry
deciduous
Moistdeciduous
Evergreen
Sem
ievergreen
Totaltonnes
Ankola
75,432.37
15,086.5
22,629.7
15,086.5
22,629.7
481,107.7
Bhatkal
25,390.46
5078.1
8124.9
12,187.4
120,706.2
Haliyal
59,099.78
23,639.9
23,639.9
11,820.0
571,258.5
Honavar
57,416.68
2870.8
20,095.8
17,225.0
17,225.0
351,935.5
Karw
ar
52,808.68
10,561.7
15,842.6
10,561.7
15,842.6
336,813.8
Kumta
39,187.59
7837.5
11,756.3
7837.5
11,756.3
249,938.4
Mundgod
51,167.36
28,142.0
23,025.3
513,362.1
Siddapur
62,274.6
40,478.5
21,796.1
510,807.4
Sirsi
103,226.57
15,484.0
46,452.0
41,290.6
868,496.7
Supa
160,608.71
40,152.2
120,456.5
1,391,273.0
Yellapur
113,429.56
51,043.3
62,386.3
1,016,385.6
District
800,042.36
51,782.0
189,701.3
356,995.7
121,922.4
79,641.0
2,680,656.3
T.V. Ramachandra et al. / Renewable and Sustainable Energy Reviews 4 (2000) 375±430414

Table
21
Bioresidues
available
from
variouscrops
Crop:PaddyÐ
highyield
variety
Residues
intonnes,paddy(improved)
Total(from
Paddy)
Total(paddy+others)
Husk
Stalk
Husk
Stalk
Husk
Stalk
Husk
Stalk
12
34
56=
2+
47=
3+
58=
6+
16
9=
7+
17
Ankola
3431.89
11,486.32
863.19
2889.03
4295.07
14,375.35
4295.07
14,431.20
Bhatkal
2012.97
6737.29
454.99
1522.83
2467.96
8260.12
2467.96
8357.45
Haliyal
5135.80
17,189.21
2232.36
7471.58
7368.16
24,660.79
7478.73
48,034.66
Honavar
2450.11
8200.36
507.22
1697.64
2957.33
9898.00
2957.69
9949.98
Karw
ar
3168.59
10,605.07
1264.16
4231.07
4432.75
14,836.14
4432.75
14,863.26
Kumta
2933.47
9818.15
1350.94
4521.53
4284.42
14,339.68
4284.42
14,404.49
Mundgod
3240.42
10,845.48
1897.19
6349.79
5137.61
17,195.26
5390.40
33,950.54
Siddapur
3006.62
10,062.97
1150.47
3850.54
4157.09
13,913.51
4160.66
14,202.42
Sirsi
4285.47
14,343.19
2742.38
9178.59
7027.85
23,521.78
7047.49
25,539.27
Supa
1803.00
6034.52
728.42
2437.98
2531.42
8472.51
2549.78
9085.18
Yellapur
2393.99
8012.53
1748.24
5851.24
4142.22
13,863.77
4146.30
16,100.21
Total
33,862.31
113,335.09
14,939.57
50,001.82
48,801.88
163,336.91
49,211.24
208,918.67
Total(others)
Crop:Ragi
Stalk
Jowarstalk
Maizehusk
Maizestalk
Pulses
stalk
Cottonstalk
Husk
Stalk
10
11
12
13
14
15
16
17
Ankola
4.29
51.57
0.00
55.85
Bhatkal
4.50
92.84
0.00
97.34
Haliyal
8.43
262.60
110.57
221.14
563.08
22,318.63
110.57
23,373.87
Honavar
3.36
0.36
0.71
47.91
0.36
51.98
Karw
ar
27.12
0.00
27.12
Kumta
17.85
46.97
0.00
64.82
(continued
onnextpage)
T.V. Ramachandra et al. / Renewable and Sustainable Energy Reviews 4 (2000) 375±430 415

Table
21(continued
)
Total(others)
Crop:Ragi
Stalk
Jowarstalk
Maizehusk
Maizestalk
Pulses
stalk
Cottonstalk
Husk
Stalk
10
11
12
13
14
15
16
17
Mundgod
41.37
517.14
252.79
505.57
269.04
15,422.16
252.79
16,755.27
Siddapur
1.36
3.57
7.14
248.45
31.96
3.57
288.91
Sirsi
7.99
38.22
19.64
39.29
190.15
1741.85
19.64
2017.49
Supa
105.31
9.77
18.36
36.71
24.89
436.00
18.36
612.68
Yellapur
3.36
49.19
4.07
8.14
105.94
2069.80
4.07
2236.44
Total
197.81
876.92
409.36
818.71
1667.94
42,020.37
409.36
45,581.76
T.V. Ramachandra et al. / Renewable and Sustainable Energy Reviews 4 (2000) 375±430416

Table
22
Fodder
requirem
entin
Uttara
Kannada
Taluk
Cattle
total
Bu�alo
total
Cattle
bodywt:200kg,Bu�alo:260kg,totalbodyweight(tonnes)
Fodder
dem
and@
2.5%
ofbodywt.(tonnes)
Ankola
27,692
7058
7373.48
67,283.01
Bhatkal
22,451
6782
6253.52
57,063.37
Haliyal
39,096
13,207
11,253.02
102,683.81
Honavar
48,674
6910
11,531.4
105,224.03
Karw
ar
20,152
7798
6057.88
55,278.16
Kumta
37,335
6845
9246.7
84,376.14
Mundgod
33,879
6004
8336.84
76,073.67
Sirsi
92,968
17,230
23,073.4
210,544.78
Siddapur
73,573
12,258
17,901.68
163,352.83
Supa
21,569
4820
5566.94
50,798.33
Yellapur
46,341
11,874
12,355.35
112,742.57
District:
463,729
100,786
118,950.21
1,085,420.67
T.V. Ramachandra et al. / Renewable and Sustainable Energy Reviews 4 (2000) 375±430 417
and forest lands. Reduction of grazing land areas has resulted in overgrazing inthe remaining grazing lands, turning them to wastelands. To ®nd fodder, animalsnow graze heavily in forest land. In the area under forest about 50% have eitherclosed canopy or are inaccessible. This means that the balance of 50% of foresthas to meet 7.75 lakh tonnes of fodder. Whenever forest is logged, grazinganimals suppress all regeneration and gradually the logged forest land turns intowasteland. The grazing pressure on forests has resulted in the depletion of grass,natural regeneration and has resulted in ecological imbalance. This necessitates theneed for an integrated planning approach at the village to meet the growingdemands of fuel and fodder. Fodder demands can be met by growing suitablefodder crop as has been successfully tried in Banavasi by some progressivefarmers.
From the discussion of fuel and fodder availability, it is evident that to bringdown further degradation of the resource base and hence ecological imbalance,the following are necessary: (1) enhancement of the total natural resource base, (2)production of basic biomass needs and optimal use of biomass for various enduses like in the domestic sector and agro processing sector through fuel e�cientdevices, (3) production of fuel and fodder biomass from degraded lands.
In the next section we discuss some of the alternative devices, which help in theoptimal utilisation of bio residues and their technical and economical feasibility inthe context of the village ecosystem.
8. Techno economic analyses of bioenergy systems
The fundamental forms of bioenergy use are:
1. The traditional domestic use for household cooking, lighting and water heating(for bathing). The e�ciency of conversion of the biomass to useful energy isbetween 5±15%.
2. The rural industrial use in agro processing, bricks and tiles and pig iron wherethe biomass is considered as a free energy source. There is generally littleincentive to use the biomass e�ciently so conversion of feedstock to usefulenergy commonly occurs at an e�ciency of 15% or less.
3. Biological conversion including anaerobic digestion for biogas production andfermentation for alcohol.
The overall e�ciency of biomass utilisation depends on the moisture content ofthe fuel and the type of stoves used. Freshly cut wood contains about 25±60%moisture. The removal of a kilogram of water from wood involves an expenditureof about 620±670 kcals. It is noticed that a reduction of 25% moisture in fuelwood would cause a saving of nearly 15% of the fuel wood. The most commonmethod adopted in Uttara Kannada for the removal of moisture is solar drying.Normally wood is lopped and collected from forests in the summer season anddried in an open space for usage during the monsoon. However, over drying alsohas its own adverse e�ects such as ®re hazards etc. It is observed that dried wood
T.V. Ramachandra et al. / Renewable and Sustainable Energy Reviews 4 (2000) 375±430418

with a moisture content of 8% releases heat too fast and the whole log tends toburn, bringing the ¯ame out of the stove.
8.1. Fuel e�cient stoves
The most commonly used stoves in most households for cooking, are eithermud stoves or three stone stoves also referred as traditional stoves (TCs). Thee�ciency of these stoves is less than 10%. Applying the principles of combustionand heat transfer, fuel e�cient wood and other biomass burning designed byASTRA [33] also known as Astra stoves or improved cook stoves (ICs). In Astrastoves complete combustion of fuel wood with as little excess air as practicable,generates the highest temperature of ¯ue gases. In ICs, the combustion of fuelwood is carried out over a grate in an enclosed fuel box with ports of suitable sizefor entry of air. The grate helps in the entry of air below the fuel bed to burn thechar as well as for the separation of ash from fuel. The air required for burningthe volatile matter released as a consequence of heating the fuel (also referred toas secondary air), enters through a port at a level slightly above the grate. Heatgets transferred to pans by the mechanism of conduction convection andradiation. Fuel e�ciency studies conducted in 82 households of a cluster ofvillages in the Sirsimakki microcatchment of Sirsi Taluk have shown that the fuelneeded for cooking is about 1.92 (avg) 2 1.02 (Sd) kg per person per day forcooking in traditional stoves while in ICs about 1.1 (avg) 2 0.78 (Sd) kg perperson per day. Which, means that there is a saving of about 42% in the quantityof fuel used by switching over to ICs from TCs. The average fuel consumption forwater heating in the traditional stoves (e�ciency is about 10±16%) is about 1.68(avg)20.80 (Sd) kg/person/day. While, in improved stoves (e�ciency is about 35±60%), it is about 1.36 (avg)20.63 (Sd) kg/person/day. This result is based on asample study of 104 households, shows a potential of 19±24% saving in improveddesign. All traditional stoves in these villages are without a chimney. With thechimney, the e�ciency of the stove increases and is about 22%. In improvedstoves the fuel is allowed to burn over a cast iron grate. Air required for burningis allowed through the grate so that combustion is controlled. The rate of burningin improved stoves is about 30 min for 50 l (to a temperature of 45±508C).
8.2. Biogas technology
Biogas is a product of anaerobic fermentation of organic matters, and consistsof about 60±70% methane, 30±40% carbon-dioxide etc. The input materials forbiogas digesters are the wastes that are found locally such as animal dung,agricultural residues and leaf litter from forests. The residues are introduced into aclosed digester, where, without the presence of free oxygen, the responsible microorganisms work successively to convert complex organic matter into CH4, CO2,H2, H2S, etc. The optimum conditions for biogas production are: temperature 30±358C, Ph 6.8±7.5, carbon:nitrogen ratio 20±30, solid contents 7±9%, retentiontime 20±40 days. Among these parameters, temperature is the most di�cult or
T.V. Ramachandra et al. / Renewable and Sustainable Energy Reviews 4 (2000) 375±430 419

costly to control. The gas formation virtually stops when the temperature dropsbelow 108C. The retention time decides the rate at which the waste is digested.The longer the time, the larger the volume of gas produced from a given amountof waste and vice versa. Thus if the available amount of input materials is limited,a bigger digester can be adopted to more fully exploit the gas potential; and wherethe waste is abundant, the waste can be fed at a higher loading rate into a smalldigester to maximise the gas production per unit volume of the digester. Theoptimum retention time depends on the temperature. In practice, a longerretention time is usually adopted to cope with cool seasons. There are variousdesigns of biogas digesters such as:
1. Floating gas holder type designed by Kadhi and Village Industries Commission[34].
2. Optimised design developed by Application of Science and Technology toRural Areas (ASTRA) at our institute [35].
3. Fixed dome type designed by University of Agricultural Sciences ÐBhagyalaxmi design.
4. Raitabandu Biogas Plant Ð designed by a farmer from Sagar Taluk, ShimogaDistrict to suit the needs of the Malnad region.
8.2.1. Biogas usageBiogas can be used for many purposes, mainly for cooking and lighting in rural
area. Biogas can be burned with a gas mantle or can be converted to electricityusing a dual mode engine. The per capita requirement of gas for cooking is in therange of 0.34±0.43 m3/day (e�ciency of a standard burner is about 60%). The gasrequirement to generate one unit of electricity (kWh) is about 0.54 m3. Thecalori®c value of 1 m3 of gas is about 4713 kcals. Relative values of biogascompared with other energy sources are listed in Table 23. The potential of Biogasin hilly Taluks of the Uttara Kannada District is quite appealing. As indicated in
Table 23
Biogas value compared with other energy sourcesa
Relative calori®c value Relative monetary values
1 m3 biogas 1.00
3.6 kg fuelwood 0.88
1.5 kg charcoal 1.28
5 kWh electricity 3.00
13 kg cowdung 1.30
0.6 l kerosene 2.34
a Costs: Kerosene Rs. 3.90 per litre (through public distribution system); Fuelwood Rs. 24.60 per
quintal (price in Government Fuelwood Depot's at Kumta); Electricity Rs. 0.60 per kWh, Cowdung
Rs. 0.10 per kg.
T.V. Ramachandra et al. / Renewable and Sustainable Energy Reviews 4 (2000) 375±430420

Tables 17±19, biogas can meet the cooking requirement of at least 30% of thetotal District population.
8.2.2. Biogas as substitute for fuel woodA socio economic survey conducted in the villages of Kumta, Sirsi, Siddapur
and Ankola have shown that the per capita requirement of fuel wood is around0.7±1.1 t/year (the details of survey will be spelled out based on land holding,economic status and seasonal constraints in the next section). If 30% of thepopulation opts for biogas, then the fuelwood saved in the District would be inthe range of 2.6±4.10 lakh t/year.
By switching over to biogas, the drudgery involved in the collection andtransport of fuel wood (which takes about 5±6 h per day) gets reduced, andsavings in cooking time reduces from 4±6 h in the case of fuel wood stoves to 1.5±3 h a day.
8.2.3. Electricity generationThe decentralised electricity generation system by a community biogas plant
was tried out in 1987 in Pura village, Kunigal Taluk, Tumkur District [36] forillumination and drinking water facilities. Because of multiple advantages likebetter illumination facility than kerosene lamps, convenient method of drinkingwater supply, better fertilizer without pathogen and weeds (due to anaerobiccondition and long retention time in closed digester) in the form of sludge, thebiogas system is accepted and maintained by villagers. A 5 kW electric generationunit using a biogas-diesel engine Ð genset system, caters for the needs of thepumping of domestic water and illumination during the evening (for 4 h). Twoyouths have been trained to maintain and manage the system. This communitysystem provides revenue for the village to the extent that the total revenuereceived for outputs exceeds the expenses for diesel and dung charges (paid tovillagers). Detailed economic analyses carried out based on the life cycle costingmethod, shows that a 4.3 h/day capacity utilisation, the cost of electricity is Rs.2.75 kWh. It is noticed that as capacity utilisation increases to 15 h/day the costper kWh is about Rs. 1.40. Comparison of the decentralised biogas system with anuclear power station by Reddy and Balachandra [37] shows that in a capitalstarved situation where the real discount rates are high, the cost per kW ofinstalled capacity is lower for biogas systems compared to nuclear power plants.
This review of bioenergy production from animal residues has shown thatpotential solutions do exist but there are very few in practical operation. Theeconomics would ultimately depend on local conditions, requirements, theprovision of subsidies etc. If farmers are forced/convinced to treat the residues forbiogas prior to disposal to compost pits, it would be a valuable way to conservefuelwood and improve the cooking environment in the kitchen.
8.3. Energy plantations
Technically speaking, energy plantations mean growing select species of trees
T.V. Ramachandra et al. / Renewable and Sustainable Energy Reviews 4 (2000) 375±430 421

and shrubs which are harvestable in a comparably shorter time and are a speci®cmeans of fuel. The fuel wood may be used either directly into wood burningstoves and boilers or processed into methanol, ethanol and producer gas. Theseplantations help to provide wood for the purposes of cooking in homes and forindustrial use so as to satisfy local energy needs in a decentralised manner [38].The energy plantations provide almost inexhaustible renewable sources (has atotal time constant of 3±8 years only for each cycle) of energy which is essentiallylocal and independent of unreliable and ®nite sources of fuel. The attractivefeatures of wood are (a) its heat content is similar to that of Indian coal; (b) woodis low in sulphur and is not likely to pollute the atmosphere; (c) ash obtainablefrom burning is a valuable fertiliser; (d) utilisation of erosion prone land forraising wood plantations helps to reduce wind and water erosion, therebyminimising hazards from ¯oods, siltation, loss of nitrogen and minerals from soil;(e) helps in rural employment generation: it is estimated that an acre of energyplantation provides a job for at least three persons regularly. The selection ofmultipurpose species provides a number of by-products like oils, organiccompounds, fruits, edible leaves, forage for livestock etc. Data collected from theForest Department (plantations in Kumta and Sirsi Taluks under the SocialForestry Programme) reveals that annual woody biomass available is in the rangeof 11.9±21 t/ha/year. An energy forest raised at Hosalli village, Tumkur Districtto support wood gasi®er plant has an annual yield of 6 t/ha/year.
8.4. Biomass ®red steam power generation system
Biomass fuelled steam power systems, providing electricity as well as processheat, have been utilised for many decades in most countries of the world. Suchsystems have found widespread applications in areas such as paper and pulp,plywood and metallurgical industries. In such a system, utilising the energy in thebiomass fuel through the process of direct combustion generates steam for drivinga steam engine or turbine [39]. The e�ciency of these devices is around 35%. Inone of the studies on biomass ®re steam power systems [40], results show that forsystems utilising biomass fuels 0 and 60% (wet basis), and excess air rates between0 and 200%, boiler e�ciency ranging from 84 to 49%, steam engine e�ciencyfrom 18 to 13%, and overall plant e�ciencies from 11 to 8.4%, the electricity fuelratio between 0.7 and 0.2 kWh/kg cost per unit of electricity ranges from 24 to 39paise.
8.4.1. Land requirement for energy plantation (and hence biomass ®red thermalsystem)
Casuarina plantation with a yield of 6 t/ha/year and a growth cycle of 10 yearsis considered to compute land requirement for setting up a 1000 MW thermalpower station. Assuming the calori®c value of wood as 4670 kcals/kg, load factorof thermal plant as 0.5, thermal e�ciency 35%, we compute land requirement asfollows:
T.V. Ramachandra et al. / Renewable and Sustainable Energy Reviews 4 (2000) 375±430422

Total yield of harvested area =60 t/ha/yearHeat value/ha: =280.2� 106 kcals/year/ha
=326.43� 103 kWh (th)/year/ha=114,251.55 kWh (elec)/year/ha
Power generated/ha at 0.5 load factor =26.08 kW/haArea needed for 1000 MW =38,336.46 haTotal area =383,364.6 haArea to be harvested/day =105 ha/dayNursery area required =1918 ha
The area required for setting up a 1000 MW power station for di�erent woodspecies at di�erent yield rate have been computed and tabulated in Table 24.Casuarina species with yield of 6±11 t/ha/year and a growth cycle of 10 yearsrequires land of 3833.64±2091.07 km2 to support a 1000 MW thermal station.Similarly, A. auriculiformis with a yield of 11±36 t/ha/year requires land of 2091±638.9 km2.
8.5. Cost of wood based power station
Considering the life of thermal plants as 30 years, at 10%, capital recovery peryear is computed. Cost of thermal station's equipment and civil cost works out tobe Rs. 4.4 crores/MW. Assuming the cost of wood to be as Rs. 150 per tonne andannual O and M costs at 1% capital cost of machinery, the cost per unit ofelectricity comes to Rs. 0.98 (for yield of 6 t/ha/year), 0.69 (for 13.5 t/ha/yearyield).
8.6. Scope for wood based power generation in the Uttara Kannada District
If we convert the present waste/barren land of 20,068 ha in the District toenergy plantation, after 4±5 years the production of plantation is su�cient tosupport a 415 MW wood based power station.
8.7. Wood gasi®cation
Biomass gasi®cation is basically conversion of solid biomass (that is wood/wood waste/agricultural residues etc.) into a combustible gas mixture normallycalled producer gas or low Btu gas. The process is typically used for woodybiomass and it involves partial combustion of such biomass. Partialcombustion process occurs when the air supply is less than adequate for thecombustion of biomass to be completed. Partial combustion produces carbonmonoxide (CO) as well as hydrogen (H2) Ð both are combustible gases.Conversion to gas results in a loss of energy up to 25%. Use of gas can be highlye�cient and hence overall e�ciency could be very high. The gas can be feddirectly into internal combustion engines (IC engines) thereby it could save
T.V. Ramachandra et al. / Renewable and Sustainable Energy Reviews 4 (2000) 375±430 423

Table
24
Arearequired
fora1000MW
thermalpower
station(specieswise)
Species
Annual
yield/ha
Growth
cycle
Totalyield
t/ha/year
kWh(th)
kWh/year/ha
Elenergy
kWh/year/ha
Power
(ha)
Areareqdfor
1000MW/ha
Totalarea
(growth
Cy.)ha
Areato
be
harvestedper
day(ha)
Nursery
(ha)
Casuarina
610
60
326,433.0
114,251.6
26.08
38,336.46
383,364.60
105.03
1916.82
Casuarina
11
10
110
598,460.5
209,461.2
47.82
20,910.80
209,107.96
57.29
1045.54
Eucalptus
6.5
852
282,908.6
99,018.0
22.61
44,234.38
353,875.02
121.19
2211.72
Eucalptus
13
8104
565,817.2
198,036.0
45.21
22,117.19
176,937,51
60.60
1105.86
Eucalptus
20
8160
870,488.0
304,670.8
69.56
14,376.17
115,009.38
39.39
718.81
A.auriculiform
is11
888
478,768.4
167,568.9
38.26
26,138.50
209,107.96
71.61
1306.92
A.auriculiform
is21
8168
914,012.4
319,904.3
73.04
13,691.59
109,532.74
37.51
684.58
A.auriculiform
is36
8288
1,566,878.4
548,407.4
125.21
7986.76
63,894.10
21.88
399.34
Fuelwood
6.5
40
260
1,414,543.0
495,090.1
113.03
8846.88
358,875.02
24.24
442.34
Fuelwood
13.5
40
540
2,937,897.0
1,028,264.0
234.76
4259.61
170,384.27
11.67
212.98
Fuelwood
27
40
1080
5,875,794.0
2,056,527.9
469.53
2129.80
85,192.13
5.84
106.49
T.V. Ramachandra et al. / Renewable and Sustainable Energy Reviews 4 (2000) 375±430424
commercial fuels. Also, it can be employed at any scale (about few kilowatts), andhence is ideally suited for decentralised applications Ð shaft power, electricity orthermal energy. In case of shaft power/electricity, the gas is basically burnt insidean engine (diesel-based compression ignition engine) with a pilot diesel injection tostart combustion.
Biomass gasi®cation provides a valuable fuel for both mobile and nonmobile uses. Producer gas can replace natural gas, gasoline or fuel oils usedto make steam for generating electricity, ®re boilers and produce heat forindustries and homes fuel, and for internal combustion engines for a widearray of purposes. Gasi®cation is an e�cient way of extracting heat frombiomass. It is estimated that for each 100 kcal of potential energy in solidfuels, gasi®cation can extract about 80 kcal in hot, raw gas [41]. This is moree�cient than many devices that burn biomass directly in a hearth or ®re box.Producer gas can be piped short distances and used for industrial purposessuch as to fuel kilns Ð brick kilns, ceramics, glass pottery, etc. or for boilersin rice mills, saw mills, cashew industry or for power generation. In any casethe producer gas for heat, the burner, must be designed for operation on lowenergy gas.
The function of the gasi®er is to convert solid carbonaceous fuel, such aswood into combustible gases by a combination of oxidation, pyrolysis andreduction processes [42]. The major chemical reaction taking place are bothexothermic (C+O2ÿ> CO2, C+0.5O2ÿ> CO) and endothermic (C+H2Oÿ>CO+H2, CO2+Cÿ> 2CO). In order to e�ectively carry out these reactions, thesolid fuel passes through the following zones: drying, pyrolysis, combustion andreduction. In the drying zone the temperature is around 1508C, moisture in thebiomass is driven o�. In the pyrolysis zone, at 4008C thermal break down ofwood/bio residues take place in the absence of air resulting in the formation ofmethanol, acetic acid and heavy hydro carbon including tar. The solid materialleft after the pyrolysis process is primarily ®xed carbon in the form of charcoal.The pyrolysis material along with the gases and the organic vapors produced,passes through the combustion zone. In the combustion zone an exothermicreaction takes place and the heat released is used for sustaining both the pyrolysisand the reduction reactions. The temperature in this zone ranges from 1000±15008C. The combustion zone has controlled introduction of air.
By forcing the vapors through the narrow area directly underneath thecombustion zone, organic liquids and tar formed in the pyrolysis zone arecracked. In the cracking process the heat intensity increases. The gases thusformed are drawn to the reduction zone where an endothermic reaction takesplace. The mixture of ®nal product gases (producer gas) consisting of 18±25%CO, 13±15% H2, 3±5% methane (CH4), 0.2±0.4% heavy hydro carbon, 5±10%CO2, 45±54% N2, 10±15% H2O and particulate matter is drawn into the clean upsystem at about 2508C. In the cleanup system the gas is cooled and cleaned toremove particulate and later it is introduced into the engine. Commerciallyavailable biomass gasi®cation systems for power generation cover the range of 3±500 kW. The major relevant power generation in a decentralised manner are:
T.V. Ramachandra et al. / Renewable and Sustainable Energy Reviews 4 (2000) 375±430 425

1. Village electri®cation in remote rural terrains which have adequate biomassresources (like villages Yan, Sandolli, Malavalli, Muttolli, Kodambale, Yedtare,Chimmoli, Medine, Morshe, Mudnalli, Kurigadde, Algar, Bangane, Kalve,Hebbail etc. in Kumta and villages Mogadde, Audhal, Kodigar, Menshi etc inSirsi Taluk).
2. Energisation of number of pumpsets located in a cluster.3. Captive power for industrial units located in rural areas and having extensive
land area which can be devoted for energy plantations.4. Captive power for industries that have biomass waste process such as paper
mills, saw mills, rice mills etc.
8.8. Wood gasi®er based electricity system
Community wood gasi®er installed at Hosalli by our Institute [36] demonstratethat if managed properly, these units can be self sustaining and technically andeconomically feasible decentralised systems. The main features of this system are:
1. 5 kW wood gasi®er-diesel system is installed at Hosalli Ð a non electri®edvillage in the Tumkur District and is in operation since 1988. This system meetsthe lighting (for 4±5 h/day) and drinking water requirement of all (43)households.
2. An energy plantation in 2 ha village land has been raised (1987) consisting ofLeucaena leucocephalla, Dalbergia sisso, Eucalyptus hybrid, Cassia saimea,Acacia auriculiformis, Casuarina equisetifolia with a density of 6600 plants/haand approximate annual productivity of 6 t/ha/year.
3. The annual wood requirement for the gasi®er is 5.1 tonnes at the rate of 1.2 kgof wood/kWh. Households are provided with two electrical lighting points of40 and 25 W bulbs. Water is pumped using a 2 kW submersible pump from aborewell at a depth of 87 m for drinking and domestic use. Apart from this,energy is used for 9 street lamps for public lighting and a ¯oor mill for millinggrains. This system is being managed (technical and ®nancial management) bythree trained village youths.
4. Diesel replacement up to 85% is achieved under favorable operating condiitons.
The capital cost of gasi®er, engine, generator, accessories, wood chippingmachinery, energy forest and building is about Rs. 63,600. The life of gasi®er andengine is considered to be 50,000 and 20,000 h respectively. At an operationallevel annual maintenance cost is taken as 5% and 10% of the cost for the gasi®erand engine. Economic analysis carried out using the discounted cash ¯owtechniques (NPV) method (considering total life cost and bene®ts) show that atthe current level of operation of 4 h per day the cost per unit of electricity isabout Rs. 3.50/kWh. However analyses show that cost per kWh can be reduced toRs. 2.50 when the hours of operation is increased to 20 h per day.
T.V. Ramachandra et al. / Renewable and Sustainable Energy Reviews 4 (2000) 375±430426

8.9. Scope for energy plantation in Uttara Kannada
As per land use statistics, it is seen that about 20,068 ha of land is barren/degraded due to human pressure, grazing pressure etc. Assuming productivity of 6t/ha/year, the fuelwood available from energy plantations grown in wastelands isabout 120,408 tonnes. We have seen earlier through the wood gasi®cation modeof power generation, that we can generate 1 kWh per 1.2 kg of fuel wood. Thismeans that from wasteland plantation we can expect 100.34 million units ofelectricity annually. From this experience, it is evident that the gasi®cationprogramme can be expanded tremendously by considering the integration of largescale plantation on sub standard soil/barren wasteland with fast growing treespecies. The Kharif crop is not grown in Uttara Kannada in most of the Taluksbecause of the lack of proper irrigation facilities. Irrigation can increaseproduction manifold to that obtained under rain fed conditions. The approach ofcombining biomass production and gasi®cation will result in many bene®ts suchas wasteland utilisation, energy supply and employment generation. This wouldhelp the rural population to be energy independent from shortages of oil and the¯uctuating electricity supply from the centralised option. Realising the bene®ts ofthe integrated approach, the planning machinery of the State Government shouldtake up implementing energy plantation and power generation through nodalagencies, the voluntary sector and universities.
9. Conclusions
Based on the detailed investigation of biomass resource availability anddemand, we can categorise the Uttara Kannada District into two zones (a)Biomass surplus zone consisting of Taluks mainly from the hilly area, (b) Biomassde®cit zone, consisting of thickly populated coastal Taluks such as Bhatkal,Kumta, Ankola, Honnavar and Karwar. Fuel wood is mainly used for cookingand horticulture residues from coconut and arecanut trees are used for waterheating purposes. The present ine�cient fuel consumption could be brought downby the usage of fuel e�cient stoves. Availability of animal residues for biogasgeneration in Sirsi, Siddapur and Yellapur Taluks gives a viable alternative forcooking, lighting, fuel and a useful fertiliser. However to support the presentlivestock population, fodder from agricultural residues is insu�cient in theseTaluks. There is a need to supplement the fodder availability with fodder crops assuccessfully tried in the Banavasi village by some progressive farmers. Bioenergyexperiences all the useful kinds of problems that a�ect most economicdevelopment projects. Lack of capital, skilled labour and service backups areserious impediments to the progress of alternate devices such as fuel e�cientstoves, biogas, wood gasi®er etc. Even of serious concern is the lack ofcoordinated e�ort/approach and integrated planning approach among variousbureaucratic setups and ministries. These are the main hurdles to the successfulimplementation of biomass cultivation projects and the development of bioenergy.
T.V. Ramachandra et al. / Renewable and Sustainable Energy Reviews 4 (2000) 375±430 427

Policies are to be formulated to remove the constraints at a local/regional level.Policies must engender the communication between the di�erent institutions andgovernment sectors involved with the establishment of a signi®cant andsustainable biomass energy programme that is the agricultural, forestry, landplanning and energy sectors. Hence, the prudent management practices of biomassproduction o�ers the opportunity to address multiple environmental concernssuch as land degradation, bio diversity, CO2 emissions, acid rain pollutants andlocal and regional health problems.
Acknowledgements
We thank our colleagues Dr. D.M. Bhat and Prof. M.D. Subashchandran forproviding us useful reference materials and valuable tips on various aspects relatedto Forestry, Biomass productivity, Minor forest products etc. Our thanks to Mr.Ramesh and Mr. Bhat, Karnataka State Council for Science and Technology,Bangalore for their kind help in digitising maps and for the computation of areaunder various vegetation types. We thank the Forest Department for their positivesupport during ®eld studies. Forest Department o�cials at Bangalore, Sirsi,Kumta and Honnavar provided useful statistical information required for thisresearch. This research was funded by the Ministry of Environment and Forests,Government of India and the Indian Institute of Science.
References
[1] Hall DO. Biomass energy. Energy Policy 1991;19(8):711±37.
[2] Hall DO, Rosillo-Calle F. Why biomass matters. Biomass Newsletter (Special Issue) 1991;5(4).
[3] Hall DO, Rosillo-Calle F, Williams RH, Woods J. Biomass for energy: supply prospects. In:
Johansson TB, Kelly H, Reddy AKN, Williams RH, editors. Renewables for fuel and electricity.
Washington: Island Press, 1992 Chapter 14.
[4] Gadgil M. Eco development of selected microcatchments in the Bedthi±Aghnashini river basins of
the Uttara Kannada District. In: An operational research programme for integrated development
of microcatchments report. Bangalore, India: CES and KSCST, IISc, 1990.
[5] Buchanan FD. In: Journey through the northern parts of Kanara, vol. 1. Madras, India:
Higginbothams and Company, 1801.
[6] Talbot WA. In: Forest ¯ora of the bombay presidency and sind, vols 1 and 2. Poona, India:
Government Photozincographic Press, 1909.
[7] Aitchison PE. The Soppinahosalli High Forest working plan. Bombay, India: Government Central
Press, 1910 Block XXXVII.
[8] Mavinkurve GR. Working plan for inland coastal forests of Kanara western division. Bombay,
India: Government Central Press, 1955.
[9] Shanmukappa G. Working plan for the unorganised forests of Sirsi and Siddapur. India:
Karnataka Forest Department, Government of Karnataka, 1966.
[10] Shanmukhappa G. Working plan for the unorganised forests of Karwar and Honnavar divisions.
India: Karnataka Forest Department, Government of Karnataka, 1977.
[11] Dhareshwar SS. The denuded condition of the minor forest in Kanara coastal tract. Ind Forester
1941;67:68±81.
T.V. Ramachandra et al. / Renewable and Sustainable Energy Reviews 4 (2000) 375±430428

[12] Chandran MDS. Vegetational changes in the evergreen forest belt of the Uttara Kannada District
of Karnataka State, Ph. D. Thesis, Karnatak University, Dharwad, India 1993.
[13] Pascal JP, Shyamsundar S, Meher-Homji VM, Legris P. Vegetation map of Karnataka, Belgaum,
Shimoga. Pondicherry, India: French Institute, 1983.
[14] Pascal JP. Explanatory booklet on the forest map of South India. Institut Francais de
Pondicherry, Travaux de la section Scienti®que et Technique, Hors Serie No. 18, Pondicherry,
India 1986.
[15] Campbell JM. In: Kanara-Gazetteer of the Bombay presidency, vol. XV. Bombay, India:
Government Central Press, 1883.
[16] Kamath SU. Uttara Kannada District. Bangalore, India: Karnataka State Gazetteer, Government
of Karnataka, V.B. Soobbaiah & Sons, 1985.
[17] Pascal JP. Wet evergreen forests of the Western ghats of India. Pondicherry, India: Institut
Francais de Pondicherry, 1988.
[18] Bhat DM. Litter production and seasonality in tropical moist forest ecosystems of Uttara
Kannada District, Karnataka. Proc Indian Acad Sci (Plant Sci) 1990;100(2):139±52.
[19] Proctor J. Tropical forest litterfall I. problem of data comparison. In: Sutton SL, Whitemore TC,
Chadwick AC, editors. Tropical rain forest: ecology and management. Oxford: Blackwell, 1983. p.
267±74.
[20] Garg RK, Vyas LN. Litter production in deciduous forest near Udaipur (South Rajastan) in
India. In: Golley FB, Medina E, editors. Tropical ecological systems. Berlin: Springer-Verlag,
1975. p. 131±5.
[21] Rai SN, Proctor J. Ecological studies on four rain forests in Karnataka, India: II. Litterfall. Jour
Ecol 1986;74:455±63.
[22] Songwe NC, Fasehun FW, Okali DW. Litterfall and productivity in a tropical rain forest,
Southern Baakundu forest reserve, Cameroon. Jour Trop Ecol 1988;4:25±37.
[23] Greenland DJ, Kowal JML. Nutrient content of the moist tropical forest of Ghana. Pl Science
1960;12:154±64.
[24] Whitemore TC. Tropical rain forests of the Far East. Oxford, London: Clarendon Press, 1975.
[25] Rai SN. Above ground biomass in tropical rain forests of Western Ghats, India. Indian Forester
1984;110(8).
[26] Prasad SN, Hegde HG, Bhat DM, Hegde M. Estimates of standing biomass and productivity of
tropical moist forests of Uttara Kannada District, Karnataka, India. CES Technical Report No.
19, CES, IISc, Bangalore, India 1987.
[27] Lele SM. Degradation, sustainability or transformation? A case study of villagers' use of forest
lands in the Malnad Region of Uttara Kannada District, India. CES Technical Report No.27,
CES, IISc, Bangalore, India 1993.
[28] Thampan PK. Handbook on coconut palm. Bombay, India: Oxford and IBH Publishing Co Pvt
Ltd, 1981.
[29] Bavappa KVA, Nair MK, Kumar TP. The Arecanut palm. Kasargod, Kerala, India: Central
Plantation Crops Research Institute, 1982.
[30] Bidappa KG. Utilisation of Arecanut waste. Arecanut Jour 1960;11:106±8.
[31] Jaiswal PL, Wadhwani AM, Rajinder S, Chhabra NN, Sarma PSN. Handbook of agriculture.
New Delhi, India: Indian Council of Agricultural Research, 1980.
[32] Khandelwal KC, Mahdi SS. Biogas technology: a practical handbook. New Delhi, India: Tata
McGraw-Hill Publishing Company Limited, 1986.
[33] Lokras SS. Fuel e�cient stoves. CES Technical Report No. 65, p. 205±208. CES, IISc, Bangalore,
India 1986.
[34] Directorate of Gobar Gas Scheme. Gobar gas: retrospect and prospects. Bombay, India: Khadi
and Village Industries Commission, 1979.
[35] Subramanian DK. Energy utilisation in Karnataka. In: Saldanha CJ, editor. Karnataka state of
environment report, 1984. p. 103±23.
[36] Ravindranath NH, Ramachandra TV. Renewable energy options for decentralised electricity
generation. Encology 1996;11(2):27±32.
[37] Reddy AKN, Balachandra P. The economics of electricity generation from the Pura community
T.V. Ramachandra et al. / Renewable and Sustainable Energy Reviews 4 (2000) 375±430 429

biogas system. In: Pai BR, Prasad MSR, editors. Power generation through renewable sources of
energy. New Delhi, India: Tata McGraw-Hill Publishing Co, 1991.
[38] Vimal OP, Tyagi PD. Energy from biomass Ð an Indian experience. New Delhi, India: Gricole
Publishing Academy, 1984.
[39] Tillman DA, Rossi AJ, Kitto WD. Wood combustion: principles, processes and economics. New
York, USA: Academic Press, 1981.
[40] Prasad SB. Biomass Ð ®red steam power cogeneration system: a theoretical study. Energy
Conversion and Management 1995;36(1):65±77.
[41] Dayal M, Vimal OP, Singh KK. Biomass gasi®cation in India Ð DNES activities. Biomass
1989;18:197±204.
[42] Talib A, Gross JR, Vigil JF, Grover PD, Rao TR, Gaur S, Anuradha N. Development and ®eld
testing of small biomass gasi®er Ð engine systems in India Ð a project report. The Mitre
Corporation, Virginia 22102-3481, USA 1987.
[43] Rai SN, Proctor J. Ecological studies on four rainforests in Karnataka: 1. Environment, structure,
¯oristics and biomass. Journal of Ecology 1986;74:439±54.
T.V. Ramachandra et al. / Renewable and Sustainable Energy Reviews 4 (2000) 375±430430
Copyright © 2022 FDOKUMEN