Mesomorphic Hexabenzocoronenes Bearing Perfluorinated Chains
CONCEPTUAL DECISION SUPPORT SYSTEM TO OPTIMISE STRATEGIC DECISIONS IN
BIOMASS-FOR-BIOENERGY SUPPLY CHAINS
A. De Meyer, KU Leuven (Department of Earth and Environmental Sciences)
J. Van Orshoven, KU Leuven (Department of Earth and Environmental Sciences)
D. Cattrysse, KU Leuven (Centre for Industrial Management / Traffic & Infrastructure)

Abstract
This paper presents a conceptual decision support system (DSS) to optimise strategic decisions in the
biomass-for-bioenergy (B4B) supply chain. This DSS combines three integrated modules: (i) a generic
and flexible database, (ii) an optimisation module and (iii) a query tool. The non-spatial component of
the database covers the possible product types and the possible techniques to harvest, collect, store,
pre-treat and convert biomass to bioenergy with their attributes on the one hand, and their mutual
relationships and possible sequences on the other hand. Spatial information regarding the (multi-
modal) transportation network and the location of the (potential) biomass production sites, storage
facilities and conversion facilities are maintained in the spatial component of the database. The
optimisation module comprises a mixed integer linear programming (MILP) model to select the
optimal location, technology and capacity of operations and operation facilities. Simultaneously, the
MILP model determines the optimal allocation of raw biomass materials, intermediate products and
by-products from the biomass production site to operation facilities and between operation facilities.
These strategic decisions are optimised regarding economic, energetic or environmental objectives
and are restricted by the biomass-for-bioenergy supply chain and the transportation network defined
in the database module. The query tool (developed in a GIS software) allows the user to organise and
pre-process the source data and visualise and post-process the results. The functionalities of the
conceptual DSS are illustrated by means of a simplified B4B supply chain based on low input high
diversity (LIHD) biomass systems in the province of Limburg (Belgium).
Introduction
By 2035, the global energy consumption is expected to amount to 812 EJ (EIA, 2011). This will be a
growth by 53 % in comparison to 2008 (532 EJ) (EIA, 2011). This increase in energy use may further
boost the emission of greenhouse gases (GHG) (IPCC, 2007), the depletion of fossil resources and the
geographic energy dependency (Cherubini and StrØmman, 2011). To counteract these trends,
research initiatives rise to define the potential of alternative and renewable energy sources (Cherubini
and StrØmman, 2011). Bioenergy is anticipated to play a dominant role (IPCC, 2011) owing to the
versatility of biomass, the possibility to store and convert it to energy on-demand (Rentizelas et al.,
2009).
However, the use of biomass as an energy source is discouraged due to a variety of barriers and
uncertainties associated with the international trade and sustainable and efficient production of
biomass resources and bioenergy (Bravo et al., 2012). The high costs related to the operations for
handling and transport of biomass from the point of harvesting to the delivery of the products to the
conversion facility are among the most decisive hurdles (Rentizelas et al., 2009). These costs cannot
be avoided since they are indispensable to deal with the typical characteristics of biomass (e.g. spatial
fragmentation, seasonal and weather related availability, high moisture content, low energy content
and low bulk density) (Gold and Seuring, 2011; Rentizelas et al., 2009; Wee et al., 2012).
To overcome these barriers and to support the development of a strong bioenergy sector, sustainable
bioenergy pathways need to be assessed. Therefore, operations research (OR) is regularly applied to
define (a) the optimal biomass type to be converted, (b) the best way to transport, pre-treat and
store biomass at operational, tactical and strategic level and/or (c) the optimal use of the conversion
technologies (Wee et al., 2012). In order to identify the trade-offs between products and operations,
all impacts generated throughout a bioenergy product’s life-cycle must be taken into account (Godard
et al., 2013), a comprehensive approach is needed. However, the review of existing mathematical
models optimising the biomass-for-bioenergy (B4B) supply chain indicates that the available OR
models are case specific, consider only a definite part of the chain and/or incorporate far from all
interrelationships between products and operations and between operations mutually (De Meyer et
al., in review). Therefore, this paper presents a conceptual decision support system to optimise
strategic decisions in any B4B supply chain in a comprehensive way.
Conceptual DSS architecture
To counteract the shortcomings of the existing models (De Meyer et al., in review), this paper
presents a DSS to optimise strategic decisions in B4B supply chains which is applicable to all kinds of
biomass supply chains and considers the relationships between products and operations and between
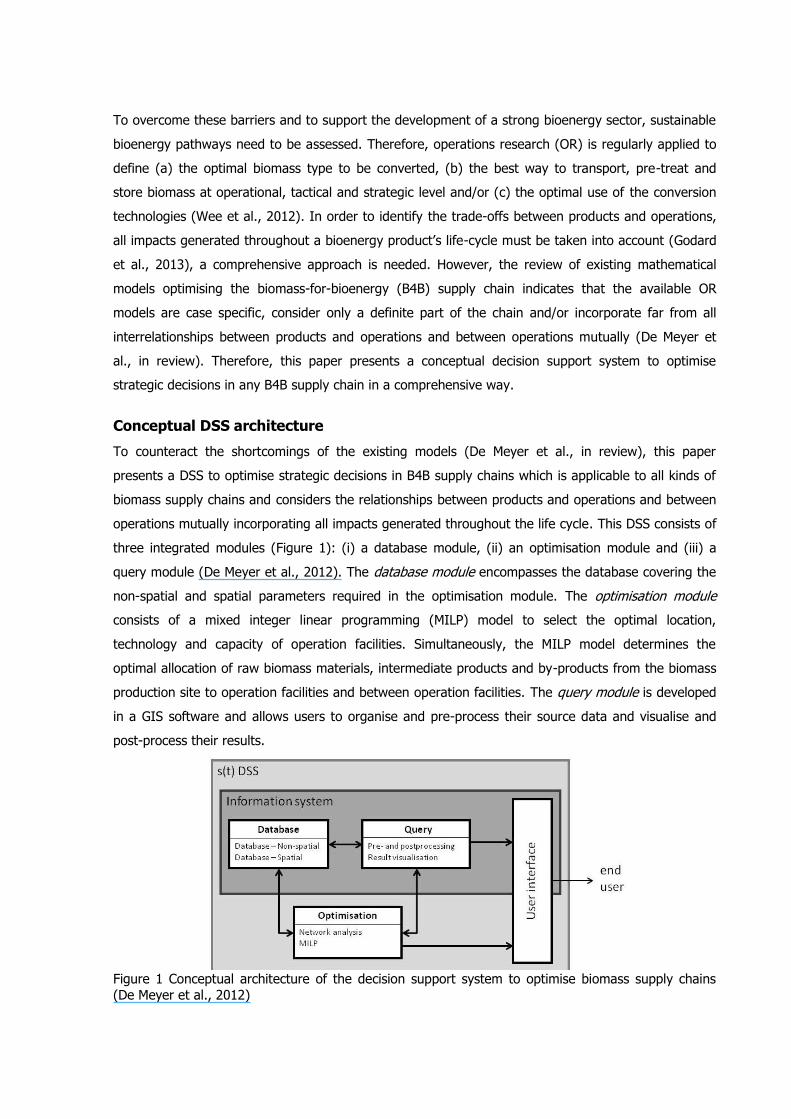
operations mutually incorporating all impacts generated throughout the life cycle. This DSS consists of
three integrated modules (Figure 1): (i) a database module, (ii) an optimisation module and (iii) a
query module (De Meyer et al., 2012). The database module encompasses the database covering the
non-spatial and spatial parameters required in the optimisation module. The optimisation module
consists of a mixed integer linear programming (MILP) model to select the optimal location,
technology and capacity of operation facilities. Simultaneously, the MILP model determines the
optimal allocation of raw biomass materials, intermediate products and by-products from the biomass
production site to operation facilities and between operation facilities. The query module is developed
in a GIS software and allows users to organise and pre-process their source data and visualise and
post-process their results.
Figure 1 Conceptual architecture of the decision support system to optimise biomass supply chains
(De Meyer et al., 2012)
Database module
Since the DSS aims to optimise all kinds of B4B supply chains, the data model is developed as a
template for a functional database covering the parameters required in the optimisation module.
Therefore, the data model needs to be generic to be able to describe all (or most) biomass supply
chains (De Meyer et al., 2012). Additionally, the data model must be flexible to enable easy addition,
deletion or change of objects, attributes and attribute values with minimal redundancy and without
compromising the validity of the associations between the various object types (De Meyer et al.,
2012).
To empower the generality and flexibility, the data model is divided into a non-spatial and a spatial
component. The non-spatial component is the core of the data model and encompasses the non-
spatial information covering the product types and the techniques to handle and transport biomass
products with their attributes on the one hand and their mutual relationships and possible sequences
on the other hand. To ensure that the data model approaches the B4B supply chain in a
comprehensive way, the development of the data model is based on the results of a generic cradle-to-
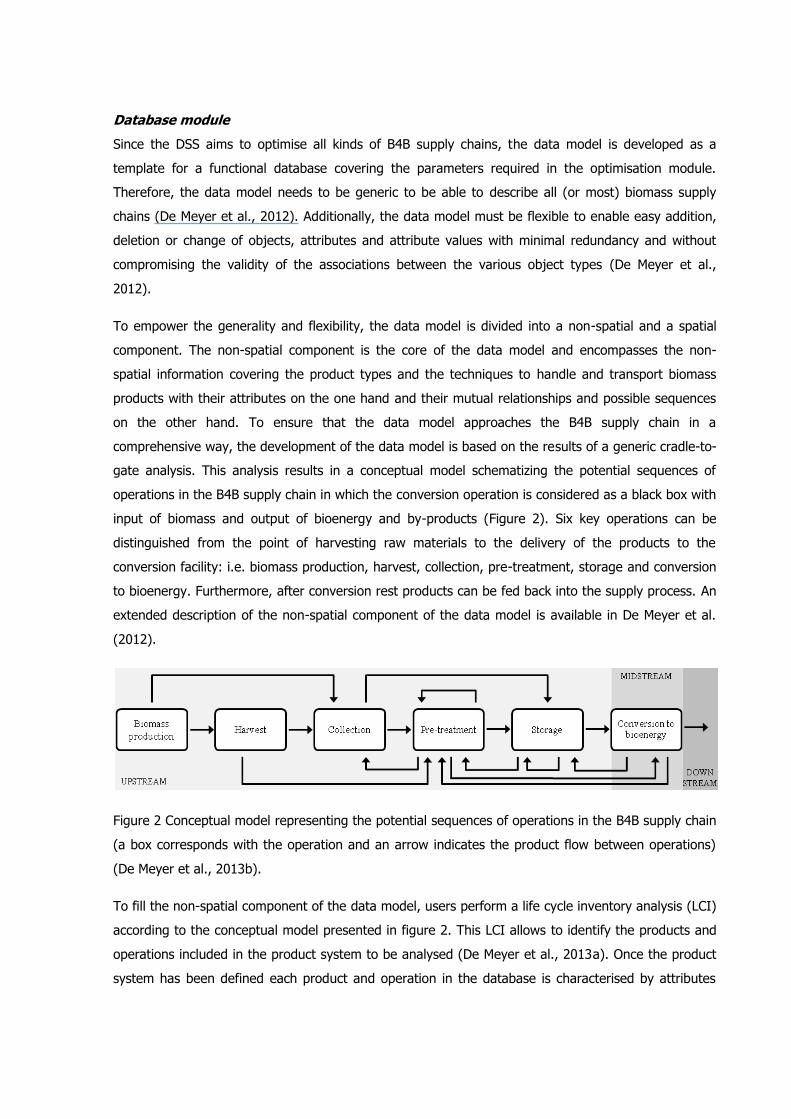
gate analysis. This analysis results in a conceptual model schematizing the potential sequences of
operations in the B4B supply chain in which the conversion operation is considered as a black box with
input of biomass and output of bioenergy and by-products (Figure 2). Six key operations can be
distinguished from the point of harvesting raw materials to the delivery of the products to the
conversion facility: i.e. biomass production, harvest, collection, pre-treatment, storage and conversion
to bioenergy. Furthermore, after conversion rest products can be fed back into the supply process. An
extended description of the non-spatial component of the data model is available in De Meyer et al.
(2012).
Figure 2 Conceptual model representing the potential sequences of operations in the B4B supply chain
(a box corresponds with the operation and an arrow indicates the product flow between operations)
(De Meyer et al., 2013b).
To fill the non-spatial component of the data model, users perform a life cycle inventory analysis (LCI)
according to the conceptual model presented in figure 2. This LCI allows to identify the products and
operations included in the product system to be analysed (De Meyer et al., 2013a). Once the product
system has been defined each product and operation in the database is characterised by attributes
related to energy use, economic cost and GHG emissions (indicated by the Global Warming Potential
(GWP) calculated with IPCC’s Fourth Assessment Report’s factor for 100 years). Data collection and
assumptions are based on databases such as ecoinvent® (Ecoinvent Centre, 2007), as well as peer-
reviewed literature and expert opinions.
The spatial component is linked to a geographic information system (GIS) and contains the geospatial
information to define the (multi-modal) transportation network. Furthermore, the spatial component
summarises the geospatial coordinates and characteristics of the (potential) biomass production sites,
storage facilities and conversion facilities.
Optimisation module
The optimisation module combines the typical GIS-based network analysis functions and a
mathematical model to determine the optimal strategic design of the defined B4B supply chain. The
GIS-based network analysis functions are mainly applied to calculate the shortest distance between
biomass production sites and operation facilities and between operation facilities mutually. The
mathematical model selects the optimal location, technology and capacity of storage, pre-treatment
and conversion facilities in combination with the optimal technology to harvest and collect the
product. Simultaneously, the mathematical model determines the optimal allocation of raw biomass
materials, intermediate products and by-products from biomass production sites to the operation
facilities and between operation facilities mutually. The goal of the proposed model is to account for
supply chain restrictions, the available multimodal transportation network and the corresponding
interrelationships between products and operations and between operations.
The mathematical model is designed as a transhipment problem (Winston, 2003) in which:
− The supply node corresponds to a biomass production site allowing harvest, collection and
pre-treatment operations;
− The transhipment node corresponds to a storage site to store (and potentially pre-treat) raw
biomass materials, intermediate products and/or by-products; and
− The demand node corresponds to a conversion site hosting pre-treatment, storage and
conversion operations.
Between nodes product flow and transportation occurs. Additionally, the mathematical model enables
by-products (e.g. digestate) to re-enter the supply chain for subsequent conversion to bio-energy or
for alternative use (e.g. soil fertilizer).
Based on these principles, a mixed integer linear programming (MILP) model has been developed.
The decision whether or not a storage or conversion facility with specified type and capacity is open at
a location, and whether or not a harvest, collection or pre-treatment operation is performed at the
biomass production site, a storage site and/or a conversion site are defined as binary and integer
variables. The product flows between the different operations and sites are defined as continuous

variables. Constraints define supply restrictions (e.g. mass balances, capacity of equipment and
facilities) and the interrelationships between operations. The MILP model allows optimisation
according to one out of three objectives; i.e. the cumulative annualized energy output, cumulative
annualized profit and annualized cumulative GWP. The economic and energetic objectives are similar
in which the “gain” depends on the amount of energy produced by the conversion facilities and the
“loss” is defined by the required inputs for handling and transporting products and managing
operation sites and equipment. The annualized cumulative GWP only considers the emissions during
handling and transporting the biomass and management of storage and conversion sites. An extended
description of the MILP model is given in De Meyer et al. (2013b).
Query module
The query module is developed in a GIS and enables users to organise and pre-process the initial
spatial information (e.g. transportation network and location of biomass production sites, storage
facilities and conversion facilities) and to visualise and post-process the optimisation results (e.g.
optimal location of operation facilities and allocation of products).
Use case
To illustrate the presented approach, the conceptual DSS is used to define the optimal strategic
design of a B4B supply chain in which the biomass is derived from low input high diversity (LIHD)
biomass systems (e.g. (semi-) natural grasslands, heath lands) in the Belgian province Limburg (2422
km²). Forty six biomass production sites have been derived from a biological value map (Vriens et al.,
2011) by selecting the sites characterised as grass or brushwood with an area of at least 50 ha
(36167 ha of grass and 2536 ha of brushwood). At these biomass production sites, biomass can be
harvested with a disc mower or a flail mower and collected by tractor with trailer or a mow-load
combination. Thirteen potential storage sites (piles or hangars) are located according to the nearness
of a highway access point, the need of a transhipment point between tractor and truck to allow
further transport or the density of biomass production sites. One industrial anaerobic digester (IAD) is
located in the north-east of Limburg, while three farm scale anaerobic digesters (FAD) are scattered
over the study area. All digesters are registered by the Flemish compost organisation (VLACO). At all
biomass production sites and at all operation facilities chopping and drying operations are allowed to
deal with the typical characteristics of grass and brushwood. For this use case, attribute values are
adopted or derived from scientific publications (o.a. Suurs et al., 2002), LCA databases and energy
statistics. A more detailed description of the use case including the attribute values is given in De
Meyer et al. (2013a and 2013b).
Two scenarios are presented to investigate the differences in strategic biomass supply due to
centralized (scenario 1) and distributed (scenario 2) production of bioenergy. Scenario 1 optimises the
strategic supply design considering the anaerobe digesters in Limburg as registered by VLACO (i.e.
one IAD and three FAD). Scenario 2 considers four FAD with an electric capacity of 8000 MWhe at the
same sites as the anaerobe digesters in scenario 1. It is hypothesised that, in scenario 2, the MILP
model will distribute the production of bioenergy between different conversion facilities instead of
centralised production in one conversion facility. Both scenarios assume a total heat production of at
least 7536 MWh (~27130 GJ) and a total electricity production of at least 15137 MWh (~54493 GJ).
This energy demand is determined according to the total heat and electricity demand in Limburg, the
obligation to produce 13% of Belgium’s final energy consumption from renewable energy sources (EU
Renewable Energy Directive) and the fact that biogas comprises 8% of the produced renewable
energy (www.energiesparen.be).
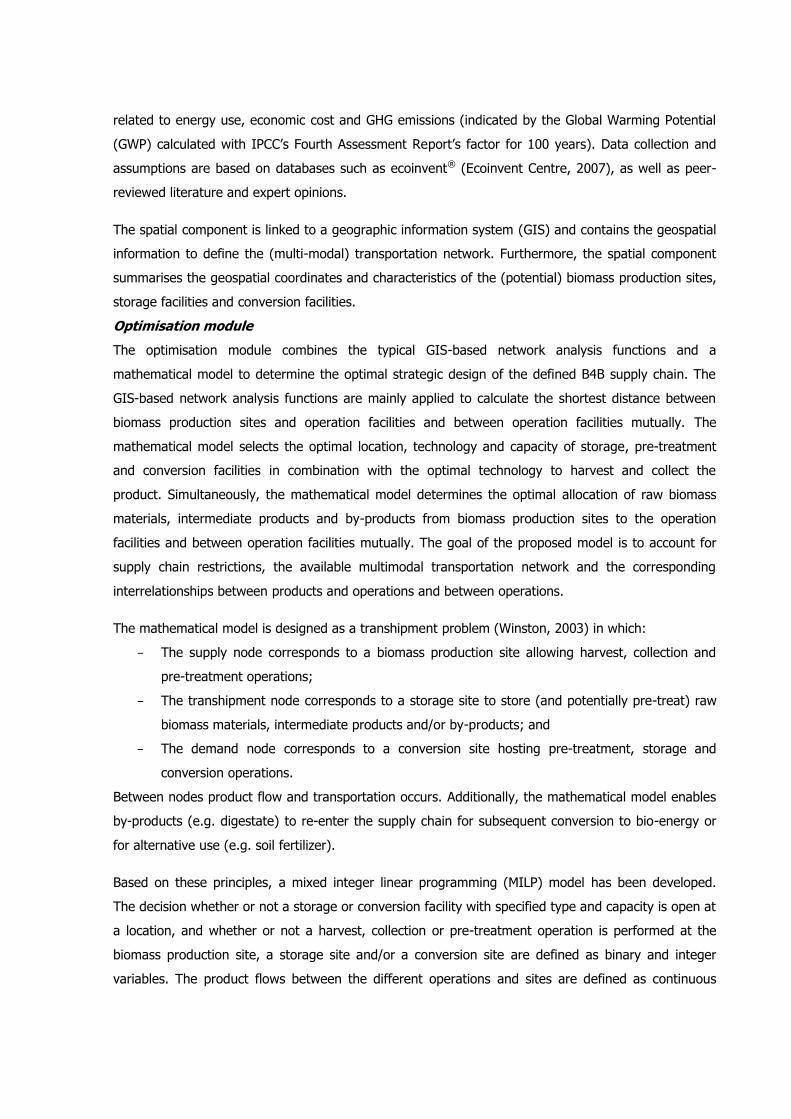
Table 1 summarises the results of scenario 1 and scenario 2 when optimised according to one out of
the three objectives; i.e. maximal energy output (A), maximal financial profit (B) and minimal GWP
(C). When the biomass supply chain is optimised for one objective (number in bold), the value for the
other two objectives is also calculated. The results (e.g. harvested biomass production sites, used
conversion facilities, allocation pathes, etc.) are visualised spatially in figure 3.
Table 1 Summary of the results of the scenario analysis (cfr. De Meyer et al., 2013a and 2013b)
(BW = brushwood, GR = grass, BPS = biomass production site, CL = conversion site)
SCENARIO 1 SCENARIO 2
Energy (A) Profit (B) GWP (C) Energy (A) Profit (B) GWP (C)
Total Eout (GJ y-1)
E generated (GJ y-1)
E used (GJ y-1)
117049
140868
23819
111624
140868
29244
106307
129062
22755
118407
140269
21862
112284
140269
27985
108885
129821
20936
Total profit (€ y-1)
Total income (€ y-1)
Total cost (€ y-1)
6022147
6920412
898265
6047466
6920412
872946
5485617
6340401
854784
6200654
6888077
687423
6259865
6888077
628212
5720363
6375026
654663
Total GWP (kg CO2 eq y-1) 1878906 1957138 1866087 1438876 1531820 1429287
Biomass BW: 2
GR: 17
BW: 2
GR: 17
BW: 2
GR: 13
BW: 2
GR: 19
BW: 2
GR: 20
BW: 2
GR: 17
Storage 0 0 0 0 0 0
Conversion 1 IAD 1 IAD 1 IAD 3 FAD 3 FAD 3 FAD
Harvest Flail BW: flail
GR: disc
Flail Flail BW: flail
GR: disc
Flail
Collection Mow-load BR: Mow-load
GR: trailer
Mow-load Mow-load BR: Mow-load
GR: trailer
Mow-load
Pre-treatment Chop at CS BR: chop at BPS
GR: chop at CS
Chop at CS Chop at CS BR: chop at BPS
GR: chop at CS
Chop at CS
Transport Truck Tractor
Truck
Truck Truck Tractor
Truck
Truck
Calculation time (s) 48 21 19 366 24 12

Figure 3 Visualization of the location – allocation result of scenario 1 and scenario 2 (adopted from De
Meyer et al., 2013a and 2013b)
In scenario 1, the capacity of the IAD (i.e. 51686 MWhth and 43072 MWhe) easily meets the assumed
heat and electricity demand. Therefore, all biomass is transported to the IAD (Figure 3a). Additionally,
this centralised energy production is induced by the constraints defining the required moisture content
of the biomass mixture in the IAD (i.e. between 60% and 80%). This higher range excludes the need
for additional drying operations in comparison with the FAD, which requires additional drying
operations to meet the maximum moisture content of 65%. These extra operations bring along
additional energy inputs, costs and emissions when the FAD is used.
In scenario 2, three out of four FAD are selected to meet the heat and electricity demand.
Furthermore, a larger number of biomass production sites are harvested to meet the required
minimum biomass input at each facility. In comparison to scenario 1, biomass from one biomass
production site is allocated to several conversion facilities. In the case of brushwood, the biomass is
divided between the FAD to meet the moisture content requirement of the digested biomass mixture.
Additionally, scenario 2 results in a higher cumulative energy output, a higher cumulative profit and a
lower GWP than scenario 1. This likely owes to the decentralized conversion of biomass, which
reduces the transport distances resulting in lower amount of energy consumed, money spent and GHG
emitted (Table 1).
Table 1 indicates that the energetic and environmental objectives result in the same supply
operations, while the economic objective distinguishes operations for grass and operations for
brushwood. This also explains that the cumulative energy output and cumulative profit in the solutions
of objectives A and B differ while the amount of energy and income generated by the conversion
facilities are equal. Figure 3 approves that in both scenarios the allocation pattern differs depending
on the objective to be optimised. This difference can be attributed to the differences between the
effects of the transport attribute values (energy input, cost and GWP). Furthermore, all harvested
biomass production sites are located in the vicinity of the selected conversion facilities. Also here, the
transport distance is the most influencing factor. Additionally it is clear from table 1 and figure 3 that
storage facilities are not included in the optimal solution because the extra cost to manage the
storage site is higher than the cost to transport the products directly to the conversion facility. This
relates to the relatively small scale of the use case.
Conclusion and future research opportunities
The development of a strong bioenergy sector and the use of biomass as an energy source is
discouraged due to a variety of barriers and uncertainties related to international trade and
sustainable and efficient production of biomass resources and bioenergy (Bravo et al., 2012). One of
the most decisive hurdles is the complexity and cost of the (upstream) B4B supply chain (Rentizelas et
al., 2009). Therefore, this paper introduces a DSS to optimise strategic decisions in B4B supply chains
which is applicable to all kinds of biomass supply chains and considers the relationships between
products and operations and between operations mutually incorporating all impacts generated
throughout the B4B life cycle. This DSS consists of a generic and flexible database to store the
required parameters, a mixed integer linear programming model to determine the optimal design of
the B4B supply chain and a query tool to organise and pre-process the source data and visualise and
post-process the results.
This scenario analysis in combination with previous experiences indicate that this conceptual DSS can
be applied to determine the most optimal strategic design of a B4B supply chain considering a range
of alternative products and operations. Moreover, the DSS can be an inspiring tool to investigate the
consequences of policy decisions and investment options, such as introducing new biomass materials
or additional conversion facilities. However, the user must be aware that the results indicate a
direction of change between scenarios, rather than presenting exact values because the attribute
values adopted or derived from literature resources are often burdened by uncertainties.
Future work entails the elaboration of the MILP model to combine multiple objectives simultaneously
in the optimisation process incorporating all elements of sustainability. Also, the MILP model will be
expanded to support the optimisation of the supply chain considering the temporal variability in supply
of biomass and demand of bioenergy. In this temporal variability the cyclicity in the production of
biomass will be considered for determining a.o. the optimal moment to harvest the biomass. This
cyclicity implies that mowing today affects the availability and composition of tomorrow’s biomass.
Probably, a simulation tool must be added to the conceptual DSS to include this time influence.
Finally, the DSS can also be further elaborated by including extra information on the life cycle of
biomass, such as land use and land use change which remain on the forefront of the debate on
sustainable bioenergy.

Acknowledgements
This research is funded by a Ph.D. grant of the Agency for Innovation by Science and Technology
(IWT) in Flanders, Belgium.
References
Bravo M.D.L, Naim M.M., Potter A. (2012): Key issues of the upstream segment of biofuels supply
chain: a qualitative analysis. Logistics Research, 5(1–2), pp. 21–31.
Cherubini F., Strømman A.H. (2011): Life cycle assessment of bioenergy systems: state of the art and
future challenges. Bioresource technology, 102(2), pp. 437–51
De Meyer A., Almeida J., Achten W., Muys B., Cattrysse D., Van Orshoven J. (2013): Incorporating life
cycle impact assessment in a mathematical model to optimize strategic decisions in biomass-for-
bioenergy supply chains. Proceedings from the LCA XIII International Conference “Fulfilling LCA’s
Promise”, Orlando, FLorida, United States, October 1-3 2013.
De Meyer A., Cattrysse D., Rasinmäki J., Van Orshoven J. (in review): Optimisation methods for the
design and logistics of biomass-for-bioenergy supply chains: A literature review. Renewable and
Sustainable Energy Reviews.
De Meyer A., Cattrysse D., Snoeck M., Van Orshoven J. (2012): Generic data model to represent the
biomass-to-bioenergy supply chain logistics. Proceedings of the International Conference of
Agricultural Engineering. Valencia, Spain, July 8-12 2012.
De Meyer A., Cattrysse D., Van Orshoven J. (2013): A mixed integer linear programming model for the
strategic optimisation of biomass-for-bioenergy supply chains. Proceedings of the 21th European
Biomass Conference & Exhibition. Copenhagen, Denmark, June 3-7 2013.
Ecoinvent Centre (2007): ecoinvent data v2.0. ecoinvent reports No. 1-25. Swiss Centre for Life Cycle
Inventories, Dübendorf, Switzerland. Retrieved from: www.ecoinvent.org.
EIA (2011): International Energy Outlook 2011. U.S. Energy Information Administration.
Godard C., Boissy J., Gabrielli B. (2013): Life-cycle assessment of local feedstock supply scenarios to
compare candidate biomass sources. GCB Bioenergy, 5, pp. 16 – 29.
Gold S., Seuring S. (2011): Supply chain and logistics issues of bio-energy production. Journal of
Cleaner Production, 19(1), pp. 32–42.
Halog A., Bortsie-Aryee N.A. (2013): The Need for Integrated Life Cycle Sustainability Analysis of
Biofuel Supply Chains. In Z. Fang (eds.): Biofuels – Economy, Environment and Sustainability. InTech,
pp. 197 – 216.

IPCC (2011): IPCC Special Report on Renewable Energy Sources and Climate Change Mitigation.
Cambridge University Press, Cambridge, United Kingdom.
Rentizelas A.A., Tolis A.J., Tatsiopoulos I.P. (2009): Logistics issues of biomass: The storage problem
and the multi-biomass supply chain. Renewable and Sustainable Energy Reviews, 13(4), pp. 887–894.
Suurs R., Faaij A., Hamelinck C., Börjesson P., Nilsson L. (2002): Long distance bioenergy logistics. An
assessment of costs and energy consumption for various biomass energy transport chains. Report
NWS-E-2002-01. Utrecht University, Department of Science, Technology and Society.
Vriens L., Bosch H., De Knijf G., De Saeger S., Guelinckx R., Oosterlynck P., Van Hove M., Paelinckx D.
(2011): De Biologische Waarderingskaart. Biotopen en hun verspreiding in Vlaanderen en het Brussels
Hoofdstedelijk Gewest. Instituut voor Natuur- en Bosonderzoek, Brussel, Belgium.
Wee H.M, Yang W.H., Chou C.W., Padilan M.V. (2012): Renewable energy supply chains,
performance, application barriers, and strategies for further development. Renewable and Sustainable
Energy Reviews, 16(8), pp. 5451–5465.
Winston W.L. (2003): Operations Research: Applications and Algorithms (4th edition). Stamford,
Cengage Learning, Inc.
Copyright © 2022 FDOKUMEN