High performance architecture of integrated protocols for encoded video application
Upload
independentCategory
view
2download
0
Two Kinesin Light Chain Genes in MiceIDENTIFICATION AND CHARACTERIZATION OF THE ENCODED PROTEINS*
(Received for publication, January 8, 1998, and in revised form, April 2, 1998)
Amena Rahman‡, Dara S. Friedman§, and Lawrence S. B. Goldstein‡¶
From the ‡Howard Hughes Medical Institute, Division of Cellular and Molecular Medicine, Program in BiomedicalSciences and Department of Pharmacology, University of California San Diego, La Jolla, California 92093-0683 and the§Department of Pharmacology and Biochemistry, University of California, San Francisco, California 94143
Native kinesin consists of two light chains and twoheavy chains in a 1:1 stoichiometric ratio. To date, onlyone gene for kinesin light chain has been characterized,while a second gene was identified in a genomic se-quencing study but not analyzed biochemically. Here wedescribe new genes encoding kinesin light chains inmouse. One of these light chains is neuronally enriched,while another shows ubiquitous expression. The pres-ence of multiple kinesin light chain genes in mice isespecially interesting, since there are two kinesin heavychain genes in humans (Niclas, J., Navone, F., Hom-Booher, N., and Vale, R. D. (1994) Neuron 12, 1059–1072).To assess the selectivity of kinesin light chain interac-tion with the heavy chains, we performed immunopre-cipitation experiments. The data suggested that thelight chains form homodimers with no specificity intheir interaction with the two heavy chains. Immunoflu-orescence and biochemical subfractionation suggesteddifferences in the subcellular localization of the twokinesin light chain gene products. Although both kine-sin light chains are distributed throughout the centraland peripheral nervous systems, there is enrichment ofone in sciatic nerve axons, while the other shows ele-vated levels in olfactory bulb glomeruli. These resultsindicate that the mammalian nervous system containsmultiple kinesin light chain gene products with poten-tially distinct functions.
Kinesin is a molecular motor that generates ATP-dependentmovements along microtubules (2, 3) of vesicles and organelles(4–8). Efficient transport is particularly important in neuronswhere vesicles and organelles move substantial distances fromsites of synthesis in the cell body to sites of activity at theaxonal termini. Loss of kinesin heavy chain expression in Dro-sophila (9), Caenorhabditis elegans (10), and mammalian cul-tured cells (11, 12) produced phenotypes consistent with a rolefor kinesin in axonal transport.
Native kinesin is a tetramer of two kinesin heavy chains(KHC)1 of approximately 120 kDa and two kinesin light chains
(KLC) of 60–70 kDa (13, 14). KHC contains three distinctdomains: an N-terminal motor containing the ATP and micro-tubule binding sites (15), an a-helical coiled-coil believed to beinvolved in dimerization (16), and a globular C-terminal tail.The tail and parts of the a-helical coiled-coil are thought to beinvolved in binding KLC (17, 18) and vesicular cargo (19, 20).KHC alone is capable of ATP-dependent movement along mi-crotubules in vitro (21). The role of KLC in the native complexis poorly understood. Notably, KLC structure is highly con-served. Sequences that are most conserved include an N-ter-minal coiled-coil region of 107 amino acids and six modularimperfect repeats of 34 amino acids known as tetra-trico pep-tide repeats (TPR) encompassing a total of 252 amino acids(22). The KLC coiled-coil domain is necessary and sufficient forthe interaction with KHC (17). The TPR domain has beenimplicated in protein-protein interaction in a large group ofstructurally and functionally diverse proteins (23). Thus, it isprobable that the KLC TPR domain is involved in either directbinding to other proteins, e.g. cargo, or in interactions withKHC. Strikingly, KLC mRNA is alternatively spliced in rat,squid, sea urchin, and worms (24–27). It has been suggestedthat functional diversity of the kinesin complex arises from theability of KLC to form various isoforms.
Although KLC genes have been cloned from several organ-isms including rat (24), Drosophila (17), squid (25), sea urchin(26), C. elegans (27), and humans (28), only one gene has beenidentified within any nonmammalian species. In this study, weuse sequence analysis and genetic mapping to demonstratethat KLC is encoded by multiple genes in mice. The data showthat the expression and behavior of two of the KLC gene prod-ucts are different. Together, our data suggest that the twocharacterized kinesin light chains and the four separate ho-loenzymes produced by the known patterns of association havedistinct functions.
EXPERIMENTAL PROCEDURES
Cloning and Sequencing—Mouse KLC genes were identified by PCRusing degenerate oligonucleotides in the TPR domain. The nucleotidesequences for the coding and noncoding primers were GGCCCGAGCT-CGT(G/A/T)GC(C/A)AC(C/T/A)ATG(C/T)TT(C/A/G)AA(C/T)AT andCGCCGGTACCTT(G/T)CC(C/T)TG(G/A)TT(C/T)TGGCA(C/A/G)AG,respectively. Flanking SacI and KpnI restriction sites allowed for direc-tional cloning of PCR products into pBluescript (SK1) plasmid (Strat-agene). The source of DNA for PCR amplification was a Balb/c neonatalmouse brain cDNA library in l Zap (Stratagene). PCR conditions wereas follows: denaturation at 94 °C for 10 min; 5 cycles of denaturation at94 °C for 45 s, annealing at 42 °C for 1 min, 1-min ramp to 72 °C, andelongation at 72 °C for 1 min; 30 cycles of denaturation at 94 °C for 1min, annealing at 55 °C for 1 min, and elongation at 72 °C for 1 min;final elongation at 72 °C for 10 min; and a final cooling to 4 °C. Twodifferent 300-bp PCR amplification products were obtained thatresembled the known rat KLC sequence (24). These 300-bp fragments of
* The costs of publication of this article were defrayed in part by thepayment of page charges. This article must therefore be hereby marked“advertisement” in accordance with 18 U.S.C. Section 1734 solely toindicate this fact.
¶ An investigator of the Howard Hughes Medical Institute. To whomcorrespondence should be addressed: HHMI/CMM Room 334, Univer-sity of California San Diego, 9500 Gilman Dr., La Jolla, CA 92093-0683.Tel.: 619-534-9702; Fax: 619-534-9701; E-mail: [email protected].
1 The abbreviations used are: KHC, kinesin heavy chain(s); KLC,kinesin light chain(s); TPR, tetra-trico peptide repeats; GST, glutathi-one S-transferase; IF, immunofluorescence; PCR, polymerase chainreaction; bp, base pair(s); RIPA, radioimmune precipitation; PBS, phos-phate-buffered saline; RACE, rapid amplification of cDNA ends; AMP-PNP, 59-adenylyl-b,g-imidodiphosphate; nKHC, neuronal kinesin heavy chain; uKHC, ubiquitous kinesin heavy chain.
THE JOURNAL OF BIOLOGICAL CHEMISTRY Vol. 273, No. 25, Issue of June 19, pp. 15395–15403, 1998© 1998 by The American Society for Biochemistry and Molecular Biology, Inc. Printed in U.S.A.
This paper is available on line at http://www.jbc.org 15395
by guest on July 13, 2016http://w
ww
.jbc.org/D
ownloaded from
by guest on July 13, 2016
http://ww
w.jbc.org/
Dow
nloaded from
by guest on July 13, 2016http://w
ww
.jbc.org/D
ownloaded from

KLC1 and KLC2 were used to probe the same cDNA library for full-length clones by standard methods (29). The longest clone from eachscreening was sequenced on both strands (Sequenase kit; U.S. Bio-chemical Corp.). Complete sequence of KLC2 was obtained by 59-RACE(59-RACE system for rapid amplification of cDNA ends, version 2.0;Gibco Life Technologies, Inc.). Sequence analysis was performed withthe Genetics Computer Group sequence analysis software package (30).
Genomic Mapping—KLC1 and KLC2 were mapped to mouse chro-mosomes using the Jackson Laboratory backcross panels (F1 3 Musspretus). Genomic DNA from 94 offspring of F1 matings with M. spretuswere obtained from Jackson Laboratory, digested with TaqI, run on a1% agarose gel, transferred to GeneScreen1 (NEN Life Science Prod-ucts) as described by the manufacturer, and probed with randomprimed KLC1 and KLC2, and the polymorphisms were noted. PstI/EagIfragments of KLC1 (453 bp) and KLC2 (501 bp) were subcloned intopBS (SK1) to generate non-cross-hybridizing probes. Prehybridizationand hybridization were in 63 SSC (13 SSC: 150 mM NaCl, 15 mM
sodium citrate dihydrate, pH 7.0), 53 Denhardt’s solution, 0.5% SDS,and 100 mg/ml salmon sperm DNA. Final washes were in 0.1 3 SSC,0.1% SDS at 65 °C. Polymorphism patterns were sent to Jackson Lab-oratory for analysis; chromosomal localization was assigned relative toother genes previously mapped by Jackson Laboratory.
Northern Analysis—Total RNA was made from mouse tissues usingTrizol (Gibco Life Technologies, Inc.) as per the manufacturer’s instruc-tions. The RNA was quantitated by absorbance at 260 nm, and 15 mgwas loaded per lane on a 1% agarose-formaldehyde gel and transferredto GeneScreen1 membrane (NEN Life Science Products) as suggestedby the manufacturer. SacI/EcoRI fragments of the PstI/EagI subclonesof KLC1 and KLC2 were random primed and used as probes for North-ern blots. Ethidium bromide staining of the 28 S and 18 S bands wereused to visualize intact RNA. Approximate loading per lane was quan-titated with an Eagle Eye apparatus (Stratagene) using integrationdensity. Prehybridization and hybridization were in 53 SSPE (13SSPE: 150 mM NaCl, 10 mM monobasic sodium phosphate, 1.25 mM
EDTA, pH 7.4), 5 3 Denhardt’s solution, 1% SDS, 50% formamide, and100 mg/ml salmon sperm DNA at 42 °C. Final wash was with 0.13SSPE at room temperature. Bands observed were quantitated on aPhosphorImager (Molecular Dynamics, Inc.) using the volume integra-tion function of the ImageQuant program.
Antibody Production—An NcoI/XhoI fragment of KLC1, which ac-counts for all but the first seven amino acids of the sequence, wassubcloned into pGEX-KG (31) to produce a glutathione S-transferase(GST)-tagged fusion protein. An XhoI/SacI (1784-bp) fragment of KLC2,which accounts for all of the coding sequence from the largest clone (591amino acids) from the cDNA library, was also subcloned into pGEX-KGto make a GST fusion protein. Recombinant KLC1 and KLC2 proteinwere overexpressed by induction of transformed BL21 (DE3) bacteria atlog phase with 0.2 mM isopropyl-1-thio-b-D-galactopyranoside for 3 h.Recombinant proteins were obtained by lysing the bacterial pellet witha French press (1000 p.s.i.) and purifying the supernatant from a 15,000rpm centrifugation (SS34 rotor, Sorvall) on a glutathione-agarose (Sig-ma) column. Recombinant KLC1 and KLC2 were eluted from the glu-tathione-agarose column with excess glutathione (15 mM) and run onSDS-polyacrylamide gel electrophoresis. Gel slices were injected intothree rabbits for each antigen (Lampire, Pipersville, PA). Initial boostswere 0.5 mg of GST-conjugated KLC1 or KLC2 followed by subsequentmonthly boosts of 0.25 mg. Serum was obtained monthly, affinity-purified, and preadsorbed against the other form of KLC to removecross-reacting antibodies. These experiments were conducted using pu-rified GST-KLC1 and GST-KLC2 linked to Affi-Gel 15 and Affi-Gel 10,respectively (Bio-Rad). Affinity purification was done by incubatingserum with the beads for 30 min at 4 °C. The column was washed twicewith 103 column volume of TBS (50 mM Tris, 150 mM NaCl, pH 7.5).Affinity-purified antibodies were eluted from the column with 0.1 M
glycine, pH 2.5, immediately neutralized with 0.13 volume of 2 M Tris,pH 8, and dialyzed in TBS overnight at 4 °C. Affinity-purified antibod-ies were preadsorbed by running the antibody solution over the otherKLC column to remove cross-reacting antibodies. Affinity-purified an-tibodies were concentrated in Ultrafree-4 Centrifugal Filter Units (Mil-lipore Corp.) to a final concentration of 1 mg/ml.
Western Blot Analysis—Mouse tissues were homogenized in PBS(140 mM NaCl, 2.5 mM KCl, 10 mM dibasic sodium phosphate, 2 mM
monobasic potassium phosphate, pH 7.4) with protease inhibitors, andthe supernatant was collected after a 3000 3 g centrifugation. Thecrude tissue homogenates were quantitated by a Bradford Assay (Bio-Rad), and 100 mg of total protein was solubilized in 23 SDS-polyacryl-amide gel electrophoresis buffer and loaded per lane. The proteins wereseparated by electrophoresis (32) on 7.5% SDS-polyacrylamide gels and
subsequently transferred to polyvinylidene difluoride membranes (Bio-Rad). Membranes were blocked with TBS, 0.1% Tween 20, and 5%nonfat milk (Carnation). Primary affinity purified/preadsorbed anti-body (anti-KLC1 or anti-KLC2) was added at a final concentration of 2mg/ml. Antibody 63-90 (33), was used at a 1:1000 dilution of ascitesfluid. Secondary antibodies were horseradish peroxidase-conjugatedgoat anti-rabbit IgG (Zymed) or goat anti-mouse IgG (Jackson Immu-noResearch, West Grove PA). Anti-KLC1 or -KLC2 antibody was de-tected by chemiluminescence using ECL (Amersham Pharmacia Bio-tech) as described in their protocols.
Immunoprecipitation—Mouse brain was homogenized in 1 ml ofRIPA buffer (150 mM NaCl, 50 mM Tris, pH 8.0, 1% Nonidet P-40, 0.5%deoxycholate, and 0.1% SDS), and the supernatant was collected (T1270rotor, 35,000 rpm). Protein A-Sepharose beads (Zymed) were preblockedwith 5% bovine serum albumin in RIPA buffer for 1 h at 4 °C andwashed with RIPA buffer prior to use. 100 ml of brain extract wasprecleared by incubating with 20 ml of protein A-Sepharose beads for 1 hat 4 °C. The solution was spun at 3000 rpm for 2 min in a microcentri-fuge, and the supernatant was collected. The precleared brain lysatewas then incubated with affinity-purified/preadsorbed anti-KLC1,-KLC2, -nKHC, or -uKHC (1) antibodies at a final concentration of 5–20mg/ml for 1 h at 4 °C prior to adding 20 ml of protein A-Sepharose for anadditional 1 h at 4 °C. The solution was centrifuged as above, and thesupernatant and pellet were saved. The pellet was washed 3 times in500 ml of RIPA buffer and finally washed 1 time in 500 ml of 50 mM Tris,pH 6.8. Equivalent amounts of the immunoprecipitate were loaded on a7.5% SDS-polyacrylamide gel electrophoresis gel (32) and subjected toWestern blotting as described above. nKHC and uKHC antibodies wereused at a dilution of 1:100 for Western analysis.
Immunohistochemistry—Adult mice were anesthetized and perfusedtranscardially with 30 ml of cold 4% paraformaldehyde in PBS. Thebrain or sciatic nerve was dissected out and postfixed for 2 h prior tocryoprotection in 30% sucrose in PBS overnight. Cryosections (14 mm)were incubated with primary antibodies diluted in buffer (13 PBS,0.6% Triton X-100, and 5% bovine serum albumin) for 14–18 h at 4 °C.Antibodies against KLC1 and KLC2 were used at a final concentrationof 100 mg/ml. HC2S2 cells were grown on glass coverslips as describedby Hoshimaru et al. (34). The cells were washed once in PBS prior to a10-min fixation with 4% paraformaldehyde at room temperature. Thecells were then washed two more times with PBS before permeabiliza-tion with 0.2% Triton-X in PBS for 2 min at room temperature. Primaryantibody was added as described above in buffer (13 PBS, 0.1% Tween,and 3% bovine serum albumin). Primary antibodies were used at thefollowing concentrations or dilutions: anti-KLC1 and anti-KLC2 (100mg/ml), 63-90 (1:250 dilution of ascites fluid), SMI31 (SternbergerMonoclonals Inc., Baltimore, MD; 1:300 dilution of ascites fluid), andS100 (Sigma; 1:500 dilution of ascites fluid). Fluorescein-conjugatedsheep anti-rabbit IgG (2 mg/ml) and Texas Red-labeled goat anti-mouseIgG (2.5 mg/ml) or fluorescein-conjugated sheep anti-mouse IgG (2 mg/ml) and Cy5-conjugated goat anti-rabbit (2 mg/ml) secondary antibodieswere used for immunofluorescence microscopy. Samples were observedusing a Bio-Rad MRC-1024 confocal laser scanning microscope.
Subcellular Fractionation of Brain Tissue—Biochemical fraction-ation of brain was conducted as described (35). Differential centrifuga-tion was used to obtain fractions S1, P1, S2, P2, S3, and P3 (P1, unlysedcells and crude nuclear pellet and corresponding supernatant S1; P2,crude mitochondrial pellet and synaptosomal fraction and correspond-ing supernatant S2; P3, crude microsomal pellet; S3, cytosolic fraction).P2 fraction was further subfractionated on a discontinuous Ficoll gra-dient into P2A (myelin fraction), P2B (synaptosomal fraction), and P2C(mitochondrial fraction). Pellets were resuspended in volumes equal tothe supernatants, and equal volumes of all subfractions were loadedonto a 10% SDS-polyacrylamide gel electrophoresis gel. Western blot-ting was done as described above. Anti-synaptophysin (BoehringerMannheim) and Suk4 (42) antibodies were used at a 1:10 dilution of themanufacturer’s stock solution and 1:10 dilution of hybridoma superna-tant, respectively.
Taxol-dependent Microtubule Sedimentation Assay—Microtubuleswere stabilized and polymerized using taxol as described (36, 37).ATP-dependent motors were induced to bind to microtubules in thepresence of the nonhydrolyzable ATP analog, AMP-PNP. These motorswere then sedimented with microtubules and released with ATP.
RESULTS
Cloning and Sequence Analysis of KLC from Mus musculus—Conserved nucleotide sequences in the TPR domain were usedto design two degenerate primers for PCR amplification from a
Kinesin Light Chains in Mice15396
by guest on July 13, 2016http://w
ww
.jbc.org/D
ownloaded from

mouse brain cDNA library. Two 300-bp products with similarbut not identical sequences were obtained. These two productswere used as probes to screen for longer clones from the samelibrary. The longest cDNA clone of each of the mouse KLCproducts was completely sequenced on both strands. One of theclones, KLC1, yielded a full-length sequence of 2289 bp (Gen-BankTM accession number AF055665) and encoded both thetranslation start site and the poly(A) tail. The other clone,KLC2, was 2682 bp in length and contained the poly(A) tail butnot the translation start site. The 59-end of KLC2 was obtainedby 59-RACE and directly sequenced to finish KLC2 full-lengthsequence (GenBankTM accession number AF055666).
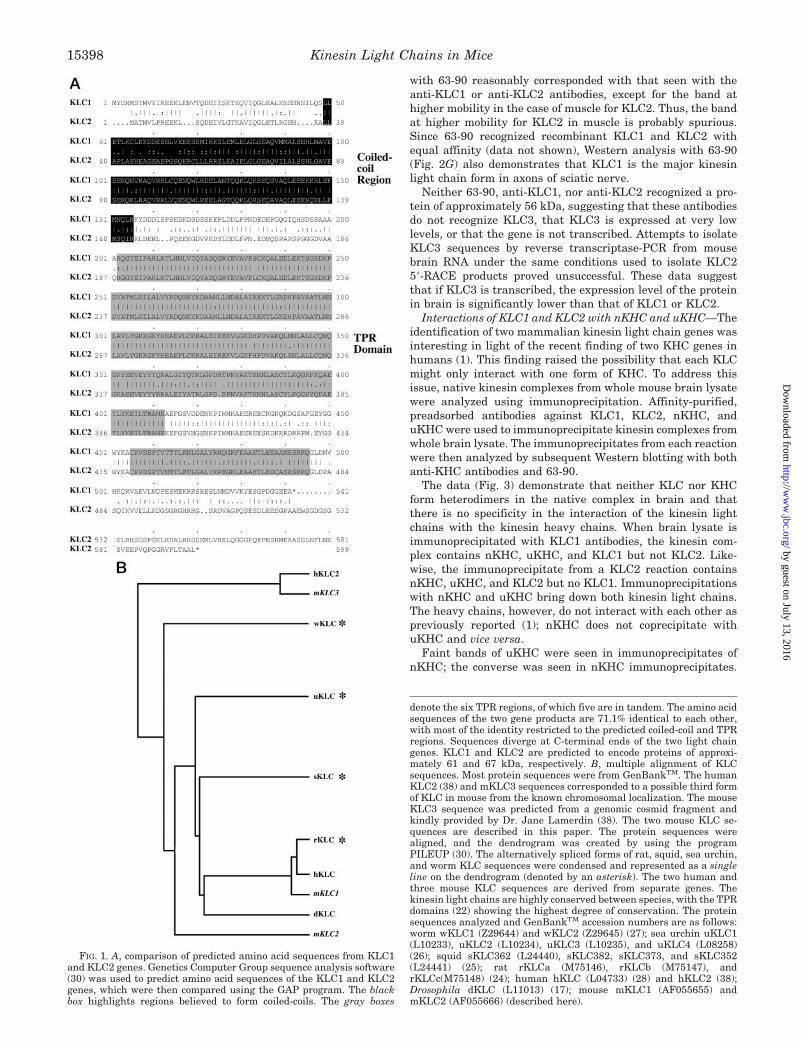
The two mouse kinesin light chain sequences were comparedwith each other using the Genetics Computer Group GAP pro-gram (30). Mouse KLC1 and KLC2 predicted polypeptide se-quences were almost identical in the 34-amino acid modularTPR domains (Fig. 1A) and also showed a high degree of sim-ilarity in the N-terminal coiled-coil region. The linker regionbetween the coiled-coil and the TPR domain and the C-terminalends diverged the most between the two mouse KLCs. KLC1and KLC2 were predicted to form protein products of 61 and 67kDa, respectively.
Multiple sequence alignments of KLC1, KLC2, and kinesinlight chains cloned from various organisms suggests that thereare three classes of KLC genes (Fig. 1B). Kinesin light chainsequences from sea urchin, squid, Drosophila, rat, and humanKLC seem to be true homologues of mouse KLC1. A thirdkinesin light chain sequence (referred to as KLC3 throughoutthis paper) in humans and mice was recently identified bysequencing regions of genomic DNA flanking the ERCC2 gene(Ref. 38).2 The predicted amino acid sequence of KLC3 suggestthat it encodes a kinesin light chain of approximately 56 kDaand is missing the sixth TPR domain. However, it remains to bedetermined if KLC3 is actually expressed or is a psuedogene.Both mouse KLC2 and mouse KLC3 are possibly in a uniqueclass to themselves and seem equally divergent from kinesinlight chains isolated from worms. Although KLCs can be clas-sified into three groups, certain domains of this modular pro-tein are highly conserved. The polypeptide sequences of theknown KLCs diverge the most at the C-terminal end and aremost highly conserved in the TPR domains. The coiled-coildomain, through which KLC appears to interact with KHC(17), is also conserved although not to the same extent as theTPR domains.
Genetic Mapping of KLC1 and KLC2—The Jackson Labora-tory developed backcross panels that utilize polymorphismsbetween two different mouse species, M. musculus and M.spretus, to map genes to within a centimorgan. Non-cross-hybridizing KLC1 and KLC2 probes were used to find TaqIpolymorphisms using Southern blots of genomic DNA from M.musculus (C57/bl6) and M. spretus. These probes were thenused for Southern analysis of 94 offspring from an F1 3 M.spretus backcross.
KLC1 mapped to the distal end of mouse chromosome 12between Yy1 and D12Bir10 in the Jackson Laboratory chromo-somal map. It was predicted to be 4.6 centimorgans distal ofYy1 and 2.2 centimorgans proximal of D12Bir10. This 6.8-centimorgan region was superimposed on a representation ofthe same region from The Encyclopedia of the Mouse Genome(56)3 using the nearest common markers in both maps (Yy1 andD12Bir10). KLC1 was in the vicinity of Tnfaip2, Tsu, Tthy,Tpre, and Tind on the mouse chromosome. This region is alsosyntenic with human chromosome 14q32. KLC2 mapped to the
proximal end of mouse chromosome 19 between D19Mit32 andLpc1 in the Jackson Laboratory chromosomal map. KLC2 waspredicted to be 1.1 centimorgan distal to D19Mit32 and 13.1centimorgan proximal to Lpc1. The representative region oflocalization of KLC2 in the mouse genome map covered 5 cen-timorgans. This region is syntenic with human chromosome11q12–11q13 and overlaps with the following mouse genes:Mr66–3, Pth, Pygm, EmK, Xmmv42, cdc20, adbk1, ly10, Pcna-ps2, and Cd5.
A human KLC gene (28) was recloned by another group byreverse transcriptase-PCR of adult human cerebral cortexRNA. This reverse transcriptase-PCR product mapped to hu-man chromosome 14q32.3 by fluorescence in situ hybridization(39), suggesting that KLC1 is the mouse counterpart of thishuman KLC gene. Sequence analysis of the ERCC2 gene re-gions in human, hamster, and mouse led to the discovery of akinesin light chain-like sequence in human chromosome19q13.2-q13.3 (38). This ERCC2 flanking gene is possibly athird KLC gene, since it mapped to mouse chromosome 7.
Expression Pattern of Mouse KLC Transcripts and Proteins—Northern analysis was conducted on tissues from adult mice.Although both KLC1 and KLC2 transcripts were enriched inneuronal tissue, KLC2 was the major kinesin light chain innonneuronal tissues. Hence, KLC2 was considered to be “ubiq-uitously” expressed. KLC1 was the minor form of kinesin lightchains in all tissues except brain, where its transcript level wasequivalent to that of KLC2, and thus it is referred to as “neu-ronally enriched.” Since the Northern blots were done withdifferent probes for KLC1 and KLC2, the intensities of bands inFig. 2A cannot be directly compared with those in Fig. 2B.However, the relative intensities in different tissues in eachblot can be directly compared after quantitation and normaliz-ing for loading (shown in Fig. 2D). Northern blots were alsodone with embryonic mouse brain from various stages of devel-opment (data not shown). Both KLC1 and KLC2 transcriptswere expressed at embryonic day 14.5 (earliest time point inthe experiment), although the expression level was lower thanadult.
Polyclonal antibodies raised against nearly full-length KLC1and KLC2 were affinity-purified on the cognate antigen andthen preadsorbed against the other mouse KLC protein toremove cross-reacting antibodies. Specificity was tested usingWestern blots of GST fusion protein expressed in Escherichiacoli. (Fig. 2, H and I). These non-cross-reacting antibodies wereused to probe Western blots of the crude cytoplasmic fraction ofvarious adult mouse tissues. The protein distribution of the twomouse light chains corresponded to their RNA transcript pat-tern; i.e. KLC1 was predominantly present in tissues of neuro-nal origin (brain, spinal cord, and sciatic nerve), whereas KLC2has a relatively ubiquitous pattern of distribution (Fig. 2, com-pare E and F). It should be noted that the relative levels ofKLC1 is more than KLC2 in the crude cytoplasmic fraction ofsciatic nerve. However, if the sciatic nerves are dissected anddirectly solubilized in SDS loading buffer, the levels of KLC1and KLC2 are comparable. These observations suggest that alarge proportion of KLC2 sediments at 3000 3 g in sciatic nervepreparations, perhaps because KLC2 either associates withlarge membranous fractions or forms aggregates. Another pos-sibility might be that tightly wrapped Schwann cells are not aseasily homogenized as axons and hence may be selectivelysedimented at 3000 3 g. Therefore, if KLC2 expression insciatic nerve is more abundant in Schwann cells compared withaxons, centrifugation of the homogenate might lead to selectiveexclusion of this fraction. The Western experiments were alsodone with a monoclonal KLC antibody, 63-90 (33), which rec-ognizes both KLC1 and KLC2 (see Fig. 2G). The pattern seen
2 J. E. Lamerdin, personal communication.3 Available on the World Wide Web at http://www.informatics.
jax.org/encyclo.html.
Kinesin Light Chains in Mice 15397
by guest on July 13, 2016http://w
ww
.jbc.org/D
ownloaded from
with 63-90 reasonably corresponded with that seen with theanti-KLC1 or anti-KLC2 antibodies, except for the band athigher mobility in the case of muscle for KLC2. Thus, the bandat higher mobility for KLC2 in muscle is probably spurious.Since 63-90 recognized recombinant KLC1 and KLC2 withequal affinity (data not shown), Western analysis with 63-90(Fig. 2G) also demonstrates that KLC1 is the major kinesinlight chain form in axons of sciatic nerve.
Neither 63-90, anti-KLC1, nor anti-KLC2 recognized a pro-tein of approximately 56 kDa, suggesting that these antibodiesdo not recognize KLC3, that KLC3 is expressed at very lowlevels, or that the gene is not transcribed. Attempts to isolateKLC3 sequences by reverse transcriptase-PCR from mousebrain RNA under the same conditions used to isolate KLC259-RACE products proved unsuccessful. These data suggestthat if KLC3 is transcribed, the expression level of the proteinin brain is significantly lower than that of KLC1 or KLC2.
Interactions of KLC1 and KLC2 with nKHC and uKHC—Theidentification of two mammalian kinesin light chain genes wasinteresting in light of the recent finding of two KHC genes inhumans (1). This finding raised the possibility that each KLCmight only interact with one form of KHC. To address thisissue, native kinesin complexes from whole mouse brain lysatewere analyzed using immunoprecipitation. Affinity-purified,preadsorbed antibodies against KLC1, KLC2, nKHC, anduKHC were used to immunoprecipitate kinesin complexes fromwhole brain lysate. The immunoprecipitates from each reactionwere then analyzed by subsequent Western blotting with bothanti-KHC antibodies and 63-90.
The data (Fig. 3) demonstrate that neither KLC nor KHCform heterodimers in the native complex in brain and thatthere is no specificity in the interaction of the kinesin lightchains with the kinesin heavy chains. When brain lysate isimmunoprecipitated with KLC1 antibodies, the kinesin com-plex contains nKHC, uKHC, and KLC1 but not KLC2. Like-wise, the immunoprecipitate from a KLC2 reaction containsnKHC, uKHC, and KLC2 but no KLC1. Immunoprecipitationswith nKHC and uKHC bring down both kinesin light chains.The heavy chains, however, do not interact with each other aspreviously reported (1); nKHC does not coprecipitate withuKHC and vice versa.
Faint bands of uKHC were seen in immunoprecipitates ofnKHC; the converse was seen in nKHC immunoprecipitates.
FIG. 1. A, comparison of predicted amino acid sequences from KLC1and KLC2 genes. Genetics Computer Group sequence analysis software(30) was used to predict amino acid sequences of the KLC1 and KLC2genes, which were then compared using the GAP program. The blackbox highlights regions believed to form coiled-coils. The gray boxes
denote the six TPR regions, of which five are in tandem. The amino acidsequences of the two gene products are 71.1% identical to each other,with most of the identity restricted to the predicted coiled-coil and TPRregions. Sequences diverge at C-terminal ends of the two light chaingenes. KLC1 and KLC2 are predicted to encode proteins of approxi-mately 61 and 67 kDa, respectively. B, multiple alignment of KLCsequences. Most protein sequences were from GenBankTM. The humanKLC2 (38) and mKLC3 sequences corresponded to a possible third formof KLC in mouse from the known chromosomal localization. The mouseKLC3 sequence was predicted from a genomic cosmid fragment andkindly provided by Dr. Jane Lamerdin (38). The two mouse KLC se-quences are described in this paper. The protein sequences werealigned, and the dendrogram was created by using the programPILEUP (30). The alternatively spliced forms of rat, squid, sea urchin,and worm KLC sequences were condensed and represented as a singleline on the dendrogram (denoted by an asterisk). The two human andthree mouse KLC sequences are derived from separate genes. Thekinesin light chains are highly conserved between species, with the TPRdomains (22) showing the highest degree of conservation. The proteinsequences analyzed and GenBankTM accession numbers are as follows:worm wKLC1 (Z29644) and wKLC2 (Z29645) (27); sea urchin uKLC1(L10233), uKLC2 (L10234), uKLC3 (L10235), and uKLC4 (L08258)(26); squid sKLC362 (L24440), sKLC382, sKLC373, and sKLC352(L24441) (25); rat rKLCa (M75146), rKLCb (M75147), andrKLCc(M75148) (24); human hKLC (L04733) (28) and hKLC2 (38);Drosophila dKLC (L11013) (17); mouse mKLC1 (AF055655) andmKLC2 (AF055666) (described here).
Kinesin Light Chains in Mice15398
by guest on July 13, 2016http://w
ww
.jbc.org/D
ownloaded from

Similarly small amounts of KLC2 were seen in KLC1 immu-noprecipitations and vice versa. These contaminants are prob-ably due to low levels of cross-reacting antibodies that were notcompletely removed by preadsorbtion. Although the antibodieswere checked for complete removal of cross-reacting epitopeson Western blots with recombinant fusion proteins, immuno-precipitation reactions were done under different conditionswith native proteins, it is thus likely that most but not all of thecross-reacting antibodies were removed. Double bands seen fornKHC (Fig. 3A) are likely to result from cross-reactivity with aclosely related protein or partial degradation. The general con-clusions, however, do not change.
These immunoprecipitation experiments also demonstratethat 63-90 recognizes both KLC1 and KLC2 in brain lysate.When complexes are immunoprecipitated with either KLC1 orKLC2, a single band is obtained when analyzed by Westernblotting with 63-90. The whole brain lysate however, containstwo bands that are recognized by 63-90. These results suggest
that the bands recognized by 63-90 in whole brain lysate arenot splice variants of a single KLC gene but rather the geneproducts of both KLC1 and KLC2.
Localization of KLC1 and KLC2—Cellular localization ofKLC1 and KLC2 were analyzed by immunofluorescence exper-iments with cells or tissues of neuronal origin. HC2S2 cells arehippocampal precursor cells that have been stably transfectedwith tetracycline-inducible myc (34). In the absence of tetracy-cline, these cells express Myc and remain in an undifferenti-ated state. Upon the addition of tetracycline, the cells discon-tinue Myc production and differentiate into cells with neuronalcharacteristics. Double label immunofluorescence experimentswere done with anti-KLC1 (Fig. 4, A–F) or anti-KLC2 andSMI31 antibodies (Fig. 4, G–L), which recognize phosphoryl-ated NF proteins enriched in axons (40, 41). The data suggestthat undifferentiated HC2S2 cells contain less KLC1 than dif-ferentiated cells (Fig. 4, compare A with B and C). The levels ofKLC2 seem to remain constant between the undifferentiatedand differentiated HC2S2 cells (Fig. 4, compare G with H andI). These data were verified by Western analysis of KLC1 andKLC2 content in whole extracts of differentiated and undiffer-entiated HC2S2 cells (Fig. 4M). HC2S2 cells can differentiateinto two major types of neurons that can be distinguishedmorphologically. One type resembles oligodendrocytes andshows no SMI31 staining, suggesting that these cells do notcontain axons (see Fig. 4, E and K). The other type of differen-tiated HC2S2 cells produce axons, as demonstrated by thepresence of phosphorylated NF proteins (see Fig. 4, F and L).The subcellular distribution of KLC1 and KLC2 appears simi-lar in both types of these differentiated cells (Fig. 4, compare Band C with H and I, respectively). SMI31 also stains the nucleiin undifferentiated HC2S2 cells (Fig. 4, D and J); however, thisresult is probably spurious and idiosyncratic to this cell line.
Since cultured cells are not bona fide representations of invivo localization, the distributions of KLC1 and KLC2 were alsoexamined in mouse brain tissue. In situ hybridization data
FIG. 2. Expression pattern of the two mouse light chain genes. A–D, non-cross-hybridizing radiolabeled probes were used for Northernanalysis of KLC1 and KLC2 transcripts. Approximately 15 mg of total RNA (as measured by A260) was loaded per lane. C shows the ethidiumbromide staining of the 28 S band. A and B show Northern blots probed with KLC1 and KLC2, respectively. D shows the comparison of relativehybridization between tissues with KLC1 and KLC2. The amount of radioactivity hybridized to each band was normalized for loading. E–I,polyclonal antibodies generated against GST-KLC1 and GST-KLC2 fusion proteins were affinity purified and preadsorbed to obtain non-cross-reacting antibodies. H and I are Western blots of 1 mg/lane of recombinant GST-KLC1 and GST-KLC2. H was probed with anti-KLC1 antibody,and I was probed with anti-KLC2 antibody. E, F, and G are Western blots of various tissues (loaded at 100 mg/lane except for sciatic nerve, whichwas loaded at 30 mg/lane) probed with KLC1, KLC2, and 63-90, respectively. 63-90 is a monoclonal antibody that recognizes both mouse KLCproteins (33). KLC1 and KLC2 migrate at approximately 61 and 67 kDa, respectively, and hence the upper band in G corresponds to KLC2, whilethe lower band is KLC1.
FIG. 3. Immunoprecipitation analysis of native kinesin. KLC1,KLC2, nKHC, or uKHC antibodies were used to immunoprecipitate thekinesin complex from whole brain lysate. Equal volumes of lysate andeach of the immunoprecipitation reactions were loaded on a 7.5% SDSgel. Western analysis was done with anti-nKHC (A), anti-uKHC (B), or63-90 (C). The upper band in C corresponds to KLC2, whereas the lowerband is KLC1. Immunoprecipitates with anti-uKHC antibody are froma duplicate experiment.
Kinesin Light Chains in Mice 15399
by guest on July 13, 2016http://w
ww
.jbc.org/D
ownloaded from

suggested that KLC1 and KLC2 transcripts were both enrichedin the olfactory bulb, hippocampus, dentate gyrus and in thegranular layer of the cerebellum (data not shown). KLC1showed uniform immunofluorescence staining throughout thebrain. Although KLC2 staining was also found throughout thebrain, it was highly enriched in the glomeruli of the olfactorybulbs (see Fig. 5, A and C), where the mitral cells and theolfactory nerves synapse. KLC2 staining was also seen in thecell bodies and axons of the mitral cells (see Fig. 5E). A mono-clonal antibody 63-90 (33) that recognizes both KLC1 andKLC2 also stained the glomeruli significantly more than thesurrounding cells (see Fig. 5G), whereas the anti KLC1 anti-body did not specifically stain these structures (see Fig. 5H).
The peripheral nervous system was examined, since it pro-vides a system with axons spatially isolated from the cell bod-ies. Double labeling experiments with 63-90 and KLC1 (Fig.
6A) clearly demonstrated that KLC1 staining is diffuse andlimited to axons within the sciatic nerve. 63-90, which sees bothKLC1 and KLC2, stained axons and Schwann cells of thesciatic nerve, suggesting that KLC2 is the major kinesin lightchain present in Schwann cells (Fig. 6, B and D). Stainingwithin the axons with 63-90 looked more diffuse than punctate(Fig. 6, B and D). Specific KLC2 staining, however, also local-izes within the axons in a punctate pattern (see Fig. 6C, inset)and is present in high levels in the Schwann cells encompass-ing the axons (Fig. 6C). Double labeling experiments were alsoperformed with KLC1 and either SMI31 or S100 (Sigma; anti-body marker against Schwann cells) to demonstrate that KLC1is expressed in the axons but not the Schwann cells of thesciatic nerve (see Fig. 7). KLC1 is present in a subset of cells inthe sciatic nerve and the staining seems to correspond withphosphorylated NF (Fig. 7, compare C and D) but not Schwanncells (Fig. 7, compare A and B). Since Schwann cells tightlywrap around the axons, the presence of KLC1 only in the axonsof the sciatic nerve was confirmed in cross-sections through thesciatic nerve (Fig. 7, compare E and F with G and H).
Biochemical Fractionation of Whole Brain Extract—Bio-chemical fractionation studies, combined with immunofluores-cence data, can give clues to the subcellular distribution of aprotein. Cell fractionation studies were carried out as described(35). Briefly, fractions corresponding to cytosol, microsomes,crude synaptosomes, and mitochondria were prepared and sub-jected to Western blotting. The 63-90 monoclonal antibody wasused to compare the distribution of the different light chainproducts within the various fractions. The majority of KLC1and KLC2 is seen in the S3 cytosolic fraction (Fig. 8A), sug-gesting that a large proportion of these proteins are soluble.This pattern corresponded to that seen with the monoclonal
FIG. 4. KLC1 levels are elevated in HC2S2 cells that have beendifferentiated into neuronal cells. A–L, immunofluorescence stud-ies with undifferentiated and differentiated HC2S2 cells (34). Cellsgrown on glass coverslips were double stained with either anti-KLC1(A–C) and SMI31 (D–F) or anti-KLC2 (G–I) and SMI31 (J–L). Panels A,D, G, and J show undifferentiated cells. Panels B, E, H, and K representone class of differentiated HC2S2 cells that resemble oligodendrocytes.Panels C, F, I, and L show a second class of differentiated HC2S2 cellsthat have axons. The scale bar of 50 mm in A is representative for A–L.M, Western analysis of kinesin light chain levels in undifferentiatedand differentiated HC2S2 cells. Whole lysates of cells were prepared asoutlined for Western analysis under “Experimental Procedures.” Eachlane was loaded with equal amounts of protein (30 mg/lane) and probedwith the 63-90 monoclonal antibody. The dots on the left side of theWestern blot mark the position of the molecular weight markers (See-Blue, Novex, San Diego, CA).
FIG. 5. KLC2 but not KLC1 is enriched in the glomeruli of theolfactory bulb. A–B, double staining of the olfactory bulb with anti-KLC2 (A) and SMI31 (B). The “sack”-like structures in A are theglomeruli. SMI31 stains phosphorylated neurofilaments and hence ax-ons but not the glomeruli. Scale bar, 100 mm. C–D, higher magnificationof the glomeruli showing KLC2 (C) and SMI31 (D) staining. Scale bar,50 mm. E–F, KLC2 is also enriched in axons and cell bodies of mitralcells (E). Double labeling with SMI31 (F) also shows staining of mitralcell axons. Mitral cells synapse at the glomeruli of the olfactory bulb.Scale bar, 50 mm. G–H, double labeling with 63-90 (G) and KLC1 (H).63-90 also recognizes the glomeruli; however, KLC1 staining is diffuse.Scale bar, 50 mm.
Kinesin Light Chains in Mice15400
by guest on July 13, 2016http://w
ww
.jbc.org/D
ownloaded from

antibody, Suk4 (42), that recognizes both uKHC and nKHC.However, when probed with an antibody against synaptophy-sin (Boehringer Mannheim), the pattern was different. As ex-pected, there is no synaptophysin in the S3 cytosolic fraction.Most of the synaptophysin was found in either P2 (synaptoso-mal fraction) or P3 (crude microsomal fraction). The synapto-physin in P3 was not eluted by a high salt wash, suggestingthat it is either tightly bound or an integral part of this mem-branous fraction. Both the kinesin light chains and kinesinheavy chains were stripped from the P3 membranous fractionin the presence of high salt concentrations, suggesting that theinteraction is ionic in nature. The significant difference seenbetween KLC1 and KLC2 in the subfractionation assay is thatthere seems to be more KLC2 in P3 (microsomal fraction) thanKLC1. These data, along with the punctate versus diffuse im-munofluorescence pattern seen for KLC2 and KLC1, respec-tively, suggest that the two mouse kinesin light chain geneproducts might play different roles within the cell.
Microtubule Binding Properties of Kinesin Containing KLC1 andKLC2—Taxol stimulated microtubule assembly and sedimentationhave been used to purify conventional kinesin from a variety ofsources. Since native kinesin is a complex of kinesin heavy chainsand kinesin light chains, kinesin light chains cosediment withstabilized microtubules. In the presence of AMP-PNP, a nonhydro-lyzable analog of ATP, both KLC1 and KLC2 cosediment withtaxol-stabilized microtubules from mouse brain homogenates (seeFig. 9A). The kinesin light chains are released from microtubules inthe presence of either high salt concentrations or ATP (Fig. 9B).Indeed, the general sedimentation profile of the kinesin heavychains is identical to that found with KLC1 (data not shown).Although the binding patterns of KLC1 and KLC2 are quite simi-lar, there are significant differences in the sedimentation profiles ofKLC1 and KLC2. KLC1 only associates with stabilized microtu-bules in the presence of AMP-PNP, and this association is easilyreversed by high salt concentrations or ATP. The sedimentation
profile seen with KLC2 suggests that a subset associates withstabilized microtubules even in the presence of high salt or ATP.However, since a subset of KLC2 also sediments in the absence ofstabilized microtubules (Fig. 9A, No GTP, No Taxol lane) thesedifferences are very likely to be microtubule-independent.
DISCUSSION
Multiple KLC Genes in Mice—Although several differentkinesin heavy chain genes were identified in M. musculus(43–45), only one gene for kinesin light chain has been clonedfrom various nonmammalian sources (25–27). In humans,Niclas et al. (1) reported two kinesin heavy chain genes; one isexpressed in a neuronal distribution, while the other was pres-ent in a ubiquitous manner. The identification of multiplemouse kinesin light chain genes, the KLC1, KLC2, and KLC3genes, of which one, the KLC1 gene, is predominantly ex-pressed in neuronal tissue, is especially interesting in light ofthese findings. Given the sequence similarities of KLC1, KLC2,and KLC3 and the high degree of conservation of the coiled-coiland TPR domains, it is likely that these genes evolved from aduplication of a common ancestral gene. Since Drosophila andC. elegans appear to have one gene for kinesin light chain, theevolution of a neuronally enriched kinesin light chain genemight be a recent event. Interestingly, native kinesin fromNeurospora crassa does not contain any copurifying lightchains (46). The need for higher organisms to generate kinesinlight chains may have resulted from initial development of arelatively simple transport system in invertebrates followedultimately by a complex nervous system in mammals. Perhapsthe complexity of the mammalian nervous system required asizable increase in amount or character of transport, which inturn necessitated the evolution of neuronally enriched kinesinlight chain. The worm kinesin light chains, mouse KLC3, andits human homologue (human KLC2) seem to be an anomaly inthis seemingly structured evolution of kinesin light chains.Thus, it will be especially interesting to examine if KLC1 playsa unique role in neuronal tissue.
KLC1 and KLC2 Exhibit Different Properties—In neurons,many cargoes are transported from the cell body to the syn-apse. Thus, an efficient cellular transport mechanism is re-quired, possibly involving several families of molecular motors,each performing a unique function. At least 10 different kine-sin-like molecules have already been identified (37, 43, 45,47–51) in mouse brain, and more remain to be discovered.Given the complex organization of the mammalian neuron, it ispossible that the two kinesin light chains in mouse performdifferent functions within the cell, although they may be func-tionally redundant.
Experiments described in this paper support the former sce-nario. In the peripheral nervous system, KLC1 is found only inaxons, whereas KLC2 is found in axons and Schwann cells.Immunofluorescence staining also shows that KLC1 distribu-tion is diffuse, whereas anti-KLC2 antibodies stain punctatestructures in the axons. More noticeably, KLC1 but not KLC2levels are elevated when HC2S2 cells (34) are induced to dif-ferentiate into neurons. Cellular fractionation studies also in-dicate that KLC2 is present at a higher level than KLC1 inmicrosomal fractions.
Unlike the neuronal heavy chain gene product, KLC1 is notrestricted to cells of neuronal origin, suggesting that complexinteractions between KLC and KHC exist in mammalian sys-tems. In fact, immunoprecipitation experiments show that al-though KLC and KHC are likely to form homodimers amongthemselves, the interactions between these two subunits arenot specific. NKHC and uKHC subcellular localization is com-partmentalized in neuronal cells; nKHC is found predomi-nantly in the cell bodies, while uKHC is found in the processes
FIG. 6. Localization of KLC1 and KLC2 in the sciatic nerve.Oblique sections through the sciatic nerve show both longitudinal andcross-sections of various neurons. KLC1 mainly stains axons, whereas63-90 stains both axons and Schwann cells. KLC2 also stains bothaxons and Schwann cells, and the staining pattern within the axons ismore punctate than that seen with KLC1. Insets show higher magnifi-cation of axons. Scale bar, 50 mm. A–B, double labeling with KLC1 (A)and 63-90 (B). The thin encircling staining pattern (denoted by whitearrowheads), most noticeable in the cross sections in B, representSchwann cells. These structures do not stain with anti-KLC1 antibodies(compare arrowheads in A and B). C–D, double labeling with KLC2 (C)and 63-90 (D). KLC2 staining is very similar to 63-90 staining. Whitearrowheads represent staining in Schwann cells (compare in C and D).White arrows show punctate staining for KLC2 (C, inset).
Kinesin Light Chains in Mice 15401
by guest on July 13, 2016http://w
ww
.jbc.org/D
ownloaded from

of the neuron (1). The differences in distribution of KLC1 andKLC2 are not as striking as that seen with nKHC and uKHC inthe central nervous system; however, there are substantialdifferences seen in the peripheral nervous system. Further-more, in cultured neurons KLC1, but not KLC2, was seen to beup-regulated upon differentiation.
Functional Diversity of Kinesins—The biochemical data sug-gest that there are at least four different forms (nKHC-KLC1,nKHC-KLC2, uKHC-KLC1, and uKHC-KLC2) in the mousenervous system. The likelihood that the two mouse KLC tran-scripts undergo alternative splicing to produce numerous otherisoforms similar to that seen in other organisms (24–27), sug-gests that various combinational associations of the kinesinsubunits may produce many functionally diverse holoenzymes.The presence of various mammalian kinesin holoenzymes of-fers the possibility of selectively associating with different car-goes or even modulating the rate of motility of the variousforms. In fact, it has been shown that kinesin travels in twopeaks in fast axonal transport (52). Furthermore, biochemicaland immunofluorescence studies show that kinesin colocalizeswith a wide variety of intracellular structures and possiblecargoes (reviewed in Refs. 53 and 54). A likely explanation forthese observations is that each of the four kinesin holoenzymesperforms slightly different functions. However, the possibilityof functional redundancy also arises, ranging from slight over-
lapping to completely redundant roles. Genetic experimentsusing homologous recombination (55) can be used to test theseideas.
Acknowledgments—We thank Drs. David Stenoien and Scott Brady(University of Texas, Southwestern Medical Center) for sharing mono-clonal anti-rat KLC antibodies including 63-90, prior to publication; Dr.Ron Vale (University of California, San Francisco) for a constant supplyof affinity-purified/preadsorbed uKHC and nKHC antibodies, and Dr.Rusty Gage (Salk Institute) for HC2S2 cells. We thank Dr. Jane Lamer-din (Lawrence Livermore National Laboratory) for providing the se-quence for mouse KLC3. Bruce Ritchings assisted with sequencing the59-RACE product of the KLC2 gene and Drs. Maura McGrail andHeiner Mattheis helped tremendously with confocal microscopy.
REFERENCES
1. Niclas, J., Navone, F., Hom-Booher, N., and Vale, R. D. (1994) Neuron 12,1059–1072
2. Vale, R. D., Reese, T. S., and Sheetz, M. P. (1985) Cell 42, 39–503. Brady, S. T. (1985) Nature 317, 73–754. Pfister, K. K., Wagner, M. C., Stenoien, D. L., Brady, S. T., and Bloom, G. S.
(1989) J. Cell Biol. 108, 1453–14635. Brady, S. T., Pfister, K. K., and Bloom, G. S. (1990) Proc. Natl. Acad. Sci.
U. S. A. 87, 1061–10656. Hollenbeck, P. J., and Swanson, J. A. (1990) Nature 346, 864–8667. Hirokawa, N., Sato-Yoshitake, R., Kobayashi, N., Pfister, K. K., Bloom, G. S.,
FIG. 7. KLC1 localizes to the axonsand not the Schwann cells in sciaticnerve. A–D represent longitudinal sec-tions, while panels E–H show cross-sec-tions of the sciatic nerve. Sections weredouble labeled with either S100 (A and E)and anti-KLC1 (corresponding panels Band F) or SMI31 (C and G) and anti-KLC1(corresponding panels D and H). S100 rec-ognizes Schwann cells. White arrowheadsrepresent Schwann cells (A and E) or neu-rofilaments (C and G). The same locationis also marked by arrowheads for KLC1staining (B, F, D, and H). Scale bar forA–D, 100 mm. Scale bar for E–F, 50 mm.Scale bar for G–H, 10 mm.
FIG. 8. Subcellular fractionation by differential centrifuga-tion. Whole brain lysate was fractionated as described (35). Equivalentvolumes of each fraction were analyzed by Western blots for the pres-ence of KLC1 and KLC2 using 63-90 (A), both forms of KHC using Suk4(B), and synaptophysin (C). Unlike synaptophysin, both KHC and KLCare predominant in the cytosol fraction (S3).
FIG. 9. Comparisons of microtubule sedimentation propertiesof KLC1 and KLC2. Microtubules from high speed supernatant frac-tions of whole brain homogenate were stabilized with taxol and sedi-mented in the presence of AMP-PNP as described (36, 37). A, microtu-bule binding in the presence of AMP-PNP. B, release from microtubulesin the presence of ATP or high salt. Centrifugation was used to separatepellet (P) and supernatant (S) fractions. Pellets were resuspended inthe same volume as the supernatants and then loaded in equal volumesfor Western analysis. 63-90 was used for detection in A. Anti-KLC1 andKLC2 were used for detection in B.
Kinesin Light Chains in Mice15402
by guest on July 13, 2016http://w
ww
.jbc.org/D
ownloaded from

and Brady, S. T. (1991) J. Cell Biol. 114, 295–3028. Rodionov, V. I., Gyoeva, F. K., and Gelfand, V. I. (1991) Proc. Natl. Acad. Sci.
U. S. A. 88, 4956–49609. Gho, M., McDonald, K., Ganetzky, B., and Saxton, W. M. (1992) Science 258,
313–31610. Hall, D. H., Plenefisch, J., and Hedgecock, E. M. (1991) J. Cell Biol. 115, 389
(abstr.)11. Ferreira, A., Niclas, J., Vale, R. D., Banker, G., and Kosik, K. S. (1992) J. Cell
Biol. 117, 595–60612. Amaratunga, A., Morin, P. J., Kosik, K. S., and Fine, R. E. (1993) J. Biol.
Chem. 268, 17427–1743013. Bloom, G. S., Wagner, M. C., Pfister, K. K., and Brady, S. T. (1988) Biochem-
istry 27, 3409–341614. Kuznetsov, S. A., Vaisberg, E. A., Shanina, N. A., Magretova, N. N., Chernyak,
V. Y., and Gelfand, V. I. (1988) EMBO J. 7, 353–35615. Yang, J. T., Laymon, R. A., and Goldstein, L. S. B. (1989) Cell 56, 879–88916. de Cuevas, M., Tao, T., and Goldstein, L. S. B. (1992) J. Cell Biol. 116, 957–96517. Gauger, A. K., and Goldstein, L. S. B. (1993) J. Biol. Chem. 268, 13657–1366618. Hirokawa, N., Pfister, K. K., Yorifuji, H., Wagner, M. C., Brady, S. T., and
Bloom, G. S. (1989) Cell 56, 867–87819. Skoufias, D. A., Cole, D. G., Wedaman, K. P., and Scholey, J. M. (1994) J. Biol.
Chem. 269, 1477–148520. Bi, G. Q., Moriss, R. L., Liao, G., Alderton, J. M., Scholey, J. M., and Stein-
hardt, R. A. (1997) J. Cell Biol. 138, 999–100821. Yang, J. T., Saxton, W. M., Stewart, R. J., Raff, E. C., and Goldstein, L. S. B.
(1990) Science 249, 42–4722. Gindhart, J. G. J., and Goldstein, L. S. B. (1996) Trends Biochem. Sci. 21,
52–5323. Lamb, J. R., Tugendreich, S., and Hieter, P. (1995) Trends Biochem. Sci. 20,
257–25924. Cyr, J. L., Pfister, K. K., Bloom, G. S., Slaughter, C. A., and Brady, S. T. (1991)
Proc. Natl. Acad. Sci. U. S. A. 88, 10114–1011825. Beushausen, S., Kladakis, A., and Jaffe, H. (1993) DNA Cell Biol. 12, 901–90926. Wedaman, K. P., Knight, A. E., Kendrick, J. J., and Scholey, J. M. (1993) J.
Mol. Biol. 231, 155–15827. Fan, J., and Amos, L. A. (1994) J. Mol. Biol. 240, 507–51228. Cabeza-Arvelaiz, Y., Shih, L. C., Hardman, N., Asselbergs, F., Bilbe, G.,
Schmitz, A., White, B., Siciliano, M. J., and Lachman, L. B. (1993) DNA CellBiol. 12, 881–892
29. Sambrook, J., Fritsch, E. F., and Maniatis, T. (1989) Molecular Cloning: ALaboratory Manual, 2nd Ed., Cold Spring Harbor Laboratory Press, Cold
Spring Harbor, NY30. Devereux, J., Haeberli, P., and Smithies, O. (1984) Nucleic Acids Res. 12,
387–39531. Guan, K. L., and Dixon, J. E. (1991) Anal. Biochem. 192, 262–26732. Laemmli, U. K. (1970) Nature 277, 680–68533. Stenoien, D. L., and Brady, S. T. (1997) Mol. Biol. Cell 8, 675–68934. Hoshimaru, M., Ray, J., Sah, D. W., and Gage, F. H. (1996) Proc. Natl. Acad.
Sci. U. S. A. 93, 1518–152335. Arai, M., and Cohen, J. A. (1994) J. Neurosci. Res. 38, 348–35736. Barton, N. R., Pereira, A. J., and Goldstein, L. S. B. (1995) Mol. Biol. Cell 6,
1563–157437. Hanlon, D. W., Yang, Z., and Goldstein, L. S. B. (1997) Neuron 18, 439–45138. Lamerdin, J. E., Stilwagen, S. A., Ramirez, M. H., Stubbs, L., and Carrano,
A. V. (1996) Genomics 34, 399–40939. Goedert, M., Marsh, S., and Carter, N. (1996) Genomics 32, 173–17540. Sternberger, L. A., and Sternberger, N. H. (1983) Proc. Natl. Acad. Sci. U. S. A.
80, 6126–613041. Matus, A. (1988) Trends Neurosci. 11, 291–29242. Ingold, A. L., Cohn, S. A., and Scholey, J. M. (1988) J. Cell Biol. 107,
2657–266743. Aizawa, H., Sekine, Y., Takemura, R., Zhang, Z., Nangaku, M., and Hirokawa,
N. (1992) J. Cell Biol. 119, 1287–129644. Gudkov, A. V., Kazarov, A. R., Thimmapaya, R., Axenovich, S. A., Mazo, I. A.,
and Roninson, I. B. (1994) Proc. Natl. Acad. Sci. U. S. A. 91, 3744–374845. Kato, K. (1991) Eur. J. Neurosci. 2, 704–71146. Steinberg, G., and Schliwa, M. (1995) Mol. Biol. Cell 6, 1605–161847. Nangaku, M., Sato-Yoshitake, R., Okada, Y., Noda, Y., Takemura, R.,
Yamazaki, H., and Hirokawa, N. (1994) Cell 79, 1209–122048. Kondo, S., Sato-Yoshitake, R., Noda, Y., Aizawa, H., Nakata, T., Matsuura, Y.,
and Hirokawa, N. (1994) J. Cell Biol. 125, 1095–110749. Yamazaki, H., Nakata, T., Okada, Y., and Hirokawa, N. (1995) J. Cell Biol.
130, 1387–139950. Yang, Z., and Goldstein, L. S. B. (1998) Mol. Biol. Cell 9, 249–26151. Okada, Y., Yamazaki, H., Sekine-Aizawa, Y., and Hirokawa, N. (1995) Cell 81,
769–78052. Elluru, R. G., Bloom, G. S. and Brady, S. T. (1995) Mol. Biol. Cell 6, 21–4053. Goldstein, L. S. B. (1993) Annu. Rev. Genet. 27, 319–35154. Bloom, G. S., and Endow, S. A. (1994) Protein Profile 1, 1059–111655. Capecchi, M. R. (1989) Science 244, 1288–129256. The Jackson Laboratory, The Encyclopedia of the Mouse Genome, Release 3.0,
The Jackson Laboratory, Bar Harbor, ME
Kinesin Light Chains in Mice 15403
by guest on July 13, 2016http://w
ww
.jbc.org/D
ownloaded from

Additions and Corrections
Vol. 273 (1998) 15395–15403
Two kinesin light chain genes in mice. Identificationand characterization of the encoded proteins.
Amena Rahman, Dara S. Friedman, and Lawrence S. B.Goldstein
Page 15398, legend to Fig. 1: The accession number formouse mKLC1 is incorrect. The correct number is AF055665.
Vol. 273 (1998) 19817–19821
Cooperation of a single lysine mutation and a C-ter-minal domain in the cytoplasmic sequestration of thep53 protein.
Shun-Hsin Liang, David Hong, and Michael F. Clarke
Pages 19819, Fig. 1: The next to the last sentence in the figurelegend is incorrect. The correct version is shown below:
MCF-7 cells were transfected with the various mutated p53DNA and GFP fusions including p53D1-300 (c), p53D1-305 (d),p53K305N (e), p53K305ND351-393 (f), p53K305ND356-393 (g),and p53K305ND326-335 (h).
We suggest that subscribers photocopy these corrections and insert the photocopies at the appropriateplaces where the article to be corrected originally appeared. Authors are urged to introduce thesecorrections into any reprints they distribute. Secondary (abstract) services are urged to carry notice ofthese corrections as prominently as they carried the original abstracts.
24280

Amena Rahman, Dara S. Friedman and Lawrence S. B. GoldsteinCHARACTERIZATION OF THE ENCODED PROTEINS
Two Kinesin Light Chain Genes in Mice: IDENTIFICATION AND
doi: 10.1074/jbc.273.25.153951998, 273:15395-15403.J. Biol. Chem.
http://www.jbc.org/content/273/25/15395Access the most updated version of this article at
Alerts:
When a correction for this article is posted•
When this article is cited•
to choose from all of JBC's e-mail alertsClick here
http://www.jbc.org/content/273/25/15395.full.html#ref-list-1
This article cites 51 references, 26 of which can be accessed free at
by guest on July 13, 2016http://w
ww
.jbc.org/D
ownloaded from
Copyright © 2022 FDOKUMEN