Two-dimensional transient model for prediction of arteriolar NO/O2 modulation by spatiotemporal...
10
Two-dimensional transient model for prediction of arteriolar NO/O 2 modulation by spatiotemporal variations in cell-free layer width Yan Cheng Ng a,1 , Bumseok Namgung a,1 , Sangho Kim a,b, ⁎ a Department of Biomedical Engineering, National University of Singapore, Singapore b Department of Surgery, National University of Singapore, Singapore abstract article info Article history: Accepted 14 August 2014 Available online 13 October 2014 Keywords: Nitric oxide Microcirculation Wall shear stress Plasma layer Gas diffusion Despite the significant roles of the cell-free layer (CFL) in balancing nitric oxide (NO) and oxygen (O 2 ) bioavail- ability in arteriolar tissue, many previous numerical approaches have relied on a one-dimensional (1-D) steady- state model for simplicity. However, these models are unable to demonstrate the influence of spatiotemporal variations in the CFL on the NO/O 2 transport under dynamic flow conditions. Therefore, the present study pro- poses a new two-dimensional (2-D) transient model capable of predicting NO/O 2 transport modulated by the spatiotemporal variations in the CFL width. Our model predicted that NO bioavailability was inversely related to the CFL width as expected. The enhancement of NO production by greater wall shear stress with a thinner CFL could dominate the diffusion barrier role of the CFL. In addition, NO/O 2 availability along the vascular wall was inhomogeneous and highly regulated by dynamic changes of local CFL width variation. The spatial variations of CFL widths on opposite sides of the arteriole exhibited a significant inverse relation. This asymmetric formation of CFL resulted in a significantly imbalanced NO/O 2 bioavailability on opposite sides of the arteriole. The novel integrative methodology presented here substantially highlighted the significance of spatiotemporal variations of the CFL in regulating the bioavailability of NO/O 2 , and provided further insight about the opposing effects of the CFL on arteriolar NO production. © 2014 Elsevier Inc. All rights reserved. Introduction Nitric oxide (NO) is an endothelium mediated vasodilator that in- duces vascular tone changes in arterioles (Ignarro et al., 1987; Radegran and Saltin, 1999), and such changes play a key role in regulating the local blood flow to maintain microcirculatory homeostasis (Popel and Johnson, 2005; Sherman et al., 1989). Thus, the bioavailability of NO in the vascular smooth muscle and its response to hemodynamic variations have become important considerations in microcirculatory studies. The synthesis of NO in the endothelium is mainly dominated by the shear stress of the blood flow. The wall shear stress (WSS) acting on the luminal surface of the vessel wall stimulates a mechano-receptor and triggers the release of NO (Baskurt et al., 2004; Boo and Jo, 2003; Kanai et al., 1995; Kavdia and Popel, 2003; Yalcin et al., 2008). Moreover, the production of NO is coupled to the bioavailability of oxygen (O 2 ) since the endothelial cells consume O 2 for the NO production (Buerk, 2001; Lamkin-Kennard et al., 2004a). In addition to the mechanical stresses that determine NO produc- tion, the cell-free layer (CFL) has also been of particular interest for con- stituting a significant factor in balancing NO between the blood stream and the surrounding tissues (Namgung et al., 2011). The formation of CFL near the vessel wall results from the axial migration of red blood cells (RBCs) towards the flow center (Goldsmith, 1986; McHedlishvili and Maeda, 2001). Hence, enhanced axial accumulation of the cells by RBC aggregation promotes the prominent formation of CFL adjacent to the endothelium (Maeda, 1996; Ong et al., 2010; Soutani et al., 1995; Tateishi et al., 1994). The CFL between the blood lumen (RBC core) and the endothelium forms a diffusion barrier to O 2 delivery from the blood stream to the tissues as well as to NO scavenging by RBCs (Butler et al., 1998; Lamkin-Kennard et al., 2004b; Vaughn et al., 1998). Consequently, the bioavailability of NO in arterioles can be altered by the contending NO scavenging between the RBCs and the smooth muscle cells. There have been a number of theoretical studies (Chen et al., 2006; Kavdia and Popel, 2003; Lamkin-Kennard et al., 2004b; Sriram et al., 2011) that proposed computational models to predict the bioavailabili- ty of NO at steady state, with the assumption of a uniform and axisym- metric CFL along the arteriole vessel. However, experimental studies (Alonso et al., 1993; Kim et al., 2007) have shown that RBCs are exposed to hemodynamic interactions resulting in their protrusions into the CFL and leading to dynamic changes in the CFL width. Moreover, time-dependent changes in the CFL width have also been reported Microvascular Research 97 (2015) 88–97 ⁎ Corresponding author at: Department of Biomedical Engineering, National University of Singapore, 9 Engineering Drive 1, Block EA #03-12, Singapore 117575, Singapore. Fax: +65 6872 3069. E-mail address: [email protected] (S. Kim). 1 Both authors contributed equally to this work. http://dx.doi.org/10.1016/j.mvr.2014.08.010 0026-2862/© 2014 Elsevier Inc. All rights reserved. Contents lists available at ScienceDirect Microvascular Research journal homepage: www.elsevier.com/locate/ymvre
-
Upload
independent -
Category
Documents
-
view
0 -
download
0
Transcript of Two-dimensional transient model for prediction of arteriolar NO/O2 modulation by spatiotemporal...

Microvascular Research 97 (2015) 88–97
Contents lists available at ScienceDirect
Microvascular Research
j ourna l homepage: www.e lsev ie r .com/ locate /ymvre
Two-dimensional transient model for prediction of arteriolar NO/O2
modulation by spatiotemporal variations in cell-free layer width
Yan Cheng Ng a,1, Bumseok Namgung a,1, Sangho Kim a,b,⁎a Department of Biomedical Engineering, National University of Singapore, Singaporeb Department of Surgery, National University of Singapore, Singapore
⁎ Corresponding author at: Department of Biomedical Eof Singapore, 9 Engineering Drive 1, Block EA #03-12, Sin+65 6872 3069.
E-mail address: [email protected] (S. Kim).1 Both authors contributed equally to this work.
http://dx.doi.org/10.1016/j.mvr.2014.08.0100026-2862/© 2014 Elsevier Inc. All rights reserved.
a b s t r a c t
a r t i c l e i n f oArticle history:Accepted 14 August 2014Available online 13 October 2014
Keywords:Nitric oxideMicrocirculationWall shear stressPlasma layerGas diffusion
Despite the significant roles of the cell-free layer (CFL) in balancing nitric oxide (NO) and oxygen (O2) bioavail-ability in arteriolar tissue, many previous numerical approaches have relied on a one-dimensional (1-D) steady-state model for simplicity. However, these models are unable to demonstrate the influence of spatiotemporalvariations in the CFL on the NO/O2 transport under dynamic flow conditions. Therefore, the present study pro-poses a new two-dimensional (2-D) transient model capable of predicting NO/O2 transport modulated by thespatiotemporal variations in the CFL width. Our model predicted that NO bioavailability was inversely relatedto the CFL width as expected. The enhancement of NO production by greater wall shear stress with a thinnerCFL could dominate the diffusion barrier role of the CFL. In addition, NO/O2 availability along the vascular wallwas inhomogeneous and highly regulated by dynamic changes of local CFLwidth variation. The spatial variationsof CFLwidths on opposite sides of the arteriole exhibited a significant inverse relation. This asymmetric formationof CFL resulted in a significantly imbalanced NO/O2 bioavailability on opposite sides of the arteriole. The novelintegrative methodology presented here substantially highlighted the significance of spatiotemporal variationsof the CFL in regulating the bioavailability of NO/O2, and provided further insight about the opposing effects ofthe CFL on arteriolar NO production.
© 2014 Elsevier Inc. All rights reserved.
Introduction
Nitric oxide (NO) is an endothelium mediated vasodilator that in-duces vascular tone changes in arterioles (Ignarro et al., 1987; Radegranand Saltin, 1999), and such changes play a key role in regulating thelocal blood flow to maintain microcirculatory homeostasis (Popel andJohnson, 2005; Sherman et al., 1989). Thus, the bioavailability of NO inthe vascular smooth muscle and its response to hemodynamic variationshave become important considerations in microcirculatory studies. Thesynthesis of NO in the endothelium is mainly dominated by the shearstress of the bloodflow. Thewall shear stress (WSS) acting on the luminalsurface of the vessel wall stimulates a mechano-receptor and triggers therelease of NO (Baskurt et al., 2004; Boo and Jo, 2003; Kanai et al., 1995;Kavdia and Popel, 2003; Yalcin et al., 2008). Moreover, the productionof NO is coupled to the bioavailability of oxygen (O2) since the endothelialcells consume O2 for the NO production (Buerk, 2001; Lamkin-Kennardet al., 2004a).
ngineering, National Universitygapore 117575, Singapore. Fax:
In addition to the mechanical stresses that determine NO produc-tion, the cell-free layer (CFL) has also been of particular interest for con-stituting a significant factor in balancing NO between the blood streamand the surrounding tissues (Namgung et al., 2011). The formation ofCFL near the vessel wall results from the axial migration of red bloodcells (RBCs) towards the flow center (Goldsmith, 1986; McHedlishviliand Maeda, 2001). Hence, enhanced axial accumulation of the cells byRBC aggregation promotes the prominent formation of CFL adjacent tothe endothelium (Maeda, 1996; Ong et al., 2010; Soutani et al., 1995;Tateishi et al., 1994). The CFL between the blood lumen (RBC core) andthe endothelium forms a diffusion barrier to O2 delivery from the bloodstream to the tissues as well as to NO scavenging by RBCs (Butler et al.,1998; Lamkin-Kennard et al., 2004b; Vaughn et al., 1998). Consequently,the bioavailability ofNO in arterioles can be altered by the contendingNOscavenging between the RBCs and the smooth muscle cells.
There have been a number of theoretical studies (Chen et al., 2006;Kavdia and Popel, 2003; Lamkin-Kennard et al., 2004b; Sriram et al.,2011) that proposed computational models to predict the bioavailabili-ty of NO at steady state, with the assumption of a uniform and axisym-metric CFL along the arteriole vessel. However, experimental studies(Alonso et al., 1993; Kim et al., 2007) have shown that RBCs are exposedto hemodynamic interactions resulting in their protrusions into theCFL and leading to dynamic changes in the CFL width. Moreover,time-dependent changes in the CFL width have also been reported

89Y.C. Ng et al. / Microvascular Research 97 (2015) 88–97
to induce transient burst-like behavior of NO release from the endo-thelium (Tsoukias et al., 2004), along with the enhancement of the bio-availability of NO in arterioles (Ong et al., 2011a). Nonetheless, allprevious studies adopting the variation in the CFL width were only per-formed by using one-dimensional (1-D) models (Ong et al., 2011a,2011b, 2012), which only account for temporal changes of NO and O2
concentrations along a single analysis line placed perpendicular to theflow direction, with no consideration of the spatial variations of thearteriolar diameter and the CFL width along the vessel wall. Therefore,potential influences of the spatial variation of the CFL width on thetransport of NO and O2 in arterioles, resulting from the non-uniformdistribution of RBCs, have not been examined.
To extend our knowledge on the role of CFL in the microcirculatorygas transport, we have developed a two-dimensional (2-D) transientdiffusionmodel capable of predicting the potential impact of temporallyand spatially varying CFL widths on the NO/O2 transport, by incorpo-rating arteriolar 2-D CFL width information obtained experimental-ly. To the best of our knowledge, our numerical model would bethe first 2-D model that utilizes in vivo microscopic images of arteriolarflow to structure the simulation domain with its spatiotemporal varia-tions. As such, our 2-Dmodel can further extend the current understand-ing on the NO/O2 bioavailability responding to local hemodynamicvariations.
Methods
Animal preparation and experimental setup
For the in vivo CFL data used in the numerical simulation in thisstudy, we utilized the same experimental procedure as our previousstudies on arteriolar blood flow in the rat cremaster muscle (Ong et al.,2010). A detailed description of the experimental setup and animalpreparation is available in that report and is briefly summarized here.All animal handling and care procedures were in accordance with theNational University of Singapore Guidelines and Ethnics on AnimalExperimentation. The cremaster muscle of the rat (BW = 195 g) wassurgically exteriorized and visualized under an intravital microscope(BX51, Olympus, Japan) with a 40× water-immersion objective(LUMPlanFL 40xW,Olympus, Japan). The femoral arterywas catheterizedfor blood withdrawals (~0.1 mL) and pressure monitoring (TSD 104A,BIOPAC Systems, Goleta, CA, USA). A blue filter (model no. B390, HOYA,Japan) with peak transmission at a wavelength of 394 nm and spectralbandpass at 310–510 nm was used to enhance the contrast betweenRBCs and the background. Blood flow was recorded at 3000 frame/swith a high-speed video camera (FASTCOM-1024PCI, Photron, USA) for1 s. Video recording in an unbranched region of an arteriole was chosenfor the study. In addition, an arteriolar flow region with the vessellength-to-diameter ratio of ~4 was recorded (ID = 71.2 ± 1.3 μm). Toobtain hemorheological relevance to humans, RBC aggregation waselevated to levels found in the healthy human blood by infusion ofDextran 500 (average molecular weight of 450–550 kDa; PharmacosmosA/S, Denmark) dissolved in saline (60 mg/mL). A total of 200 mg/kg bodyweight was infused to achieve a plasma-dextran concentration of ~0.6%.The mean arterial pressure and systemic hematocrit were ~95 mm Hgand 44% for the condition of video recording, respectively.
CFL width and cellular velocity measurement
The CFLwidthwas defined as the distance between the inner wall ofthe vessel and the edge of the RBC core, while the cell-free area (CFA)was defined as the area occupied by the CFL along the arteriole. The pro-cedures for determining the temporal CFLwidth variations can be foundin our previous studies (Kim et al., 2006; Ong et al., 2011c) and will notbe repeated here. In brief, the arteriole inner walls were detected bylocating the light pixel during the transition in light intensities overtwo pixels at the inner wall-plasma interface. The CFL width was then
determined by computing the distance between the inner vessel walland the outer edge of RBC core. The locations of the vessel walls andRBC core in a two-dimensional plane were determined from a recordedimage shown in Fig. 1. It should be noted that the location of the RBCcore edge changes as the blood flows with time, whereas the wall loca-tion is fixed. Since the diameter of the arteriole varies spatially, the CFLand CFA data were normalized by the arteriole radius and total areaof inner vessel, respectively. The spatial resolution of the CFL widthmeasurement with our current microscopic system was ~0.42 μm. Thecenterline velocity of the blood flow (Vc = 4.69 mm/s) was determinedusing an image cross-correlation method with sequential imagesextracted from the high-speed video recording (Dixon et al., 2007;Tsukada et al., 2000) by utilizing commercially available software(MATLAB; Mathworks, Natick, MA). The mean flow velocity (Vmean =2.93 mm/s) was then approximated by dividing the Vc by a correlationfactor of 1.6 (Baker and Wayland, 1974).
Constitution of the simulation domain
To structure the simulation domain from the experimentally obtain-edmicroscopic images, a five compartmental model of the arteriole wasconsidered, comprising of the blood lumen (BL), CFL, endothelial cells(ECs), vessel wall (VW) and smooth muscle tissues (SMs) (Fig. 2A).The spatiotemporal variations of the BL–CFL boundary in our modelwere represented by the RBC–CFL boundaries obtained from the imagesat different time steps (every 1/3000 s), whereas the EC–CFL boundarywas denoted by the stationary inner vessel wall (Fig. 1). The adjacent ECand VW layers were then defined in the simulation domain with theirrespective thicknesses listed in Table 1. However, as the entire simula-tion domain was maintained at an aspect ratio of 2:1 (width of simula-tion domain: vessel length), the SM layer width varied along the lengthof the vessel, corresponding to the spatial variation of the VW locationas shown in Fig. 2A.
Mathematical model
A 2-D transient model was developed to account for the time-dependent NO/O2 diffusion in the arteriole due to spatiotemporal vari-ations of the CFL. The Cartesian coordinate was used since the CFLwidth measurements were obtained from a 2-D image plane. For sim-plicity, the following assumptions were made: 1) convective transportsof NO and O2 were neglected in the axial direction of the vessel (Chenet al., 2006; Kavdia et al., 2002), 2)O2 solubilitywas the same in all com-partments (Chen et al., 2006), 3) a first order reaction rate constant wasused in all compartments except the CFL to represent the loss of NO byvarious sinks (Lamkin-Kennard et al., 2004b; Vaughn et al., 1998), and4) the auto-oxidation reaction of NO with O2 was neglected in all com-partments due to its low reaction rate (Buerk, 2001; Chen et al., 2006;Lamkin-Kennard et al., 2004a). Therefore, our computational modelcan be simplified into a systemof transient reaction–diffusion equationsand generalized in Eqs. (1) and (2).
∂CNO;C
∂t ¼ DNO;C∂2CNO;C
∂x2þ ∂2CNO;C
∂y2
!� RNO;C ð1Þ
where CNO,C and DNO,C are the concentration and diffusion coefficientsof NO respectively and RNO,C is the biochemical reaction of NO (‘−’:consumption or ‘+’: production) in the compartments depicted by thesubscript c.
αC∂PO2 ;C
∂t ¼ αCDO2 ;C∂2PO2 ;C
∂x2þ ∂2PO2 ;C
∂y2
!−RO2 ;C ð2Þ
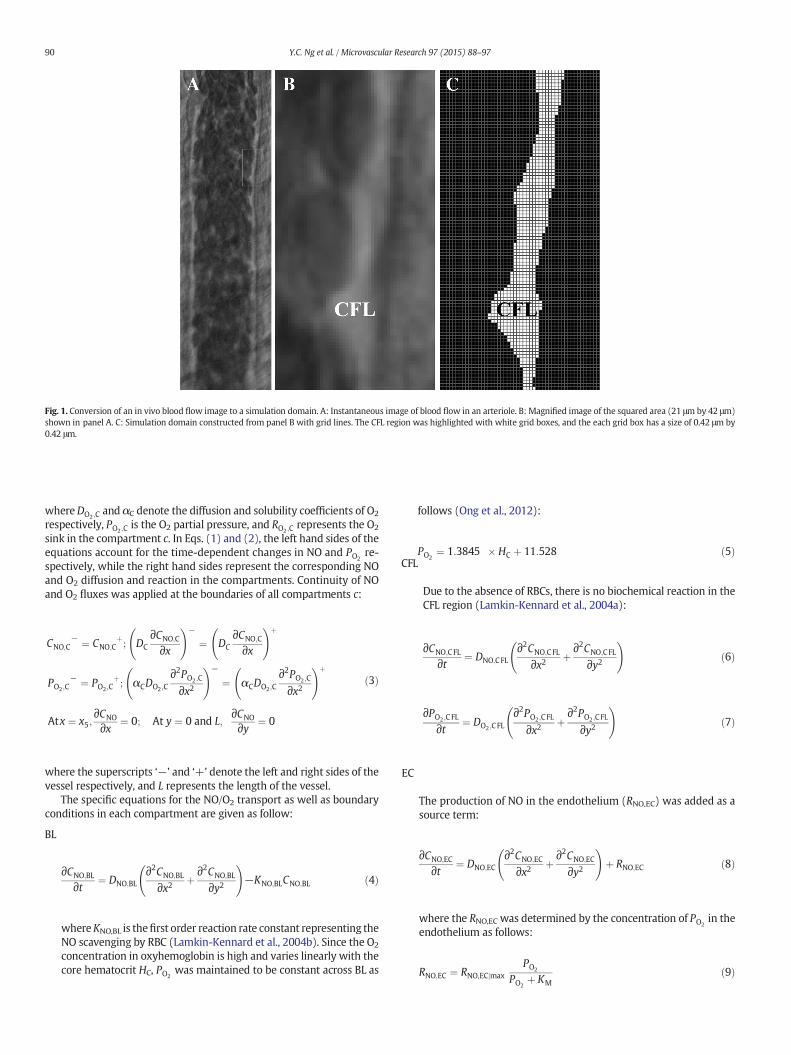
Fig. 1. Conversion of an in vivo blood flow image to a simulation domain. A: Instantaneous image of blood flow in an arteriole. B: Magnified image of the squared area (21 μm by 42 μm)shown in panel A. C: Simulation domain constructed from panel B with grid lines. The CFL region was highlighted with white grid boxes, and the each grid box has a size of 0.42 μm by0.42 μm.
90 Y.C. Ng et al. / Microvascular Research 97 (2015) 88–97
whereDO2 ;C and αC denote the diffusion and solubility coefficients of O2
respectively, PO2 ;C is the O2 partial pressure, and RO2 ;C represents the O2
sink in the compartment c. In Eqs. (1) and (2), the left hand sides of theequations account for the time-dependent changes in NO and PO2
re-spectively, while the right hand sides represent the corresponding NOand O2 diffusion and reaction in the compartments. Continuity of NOand O2 fluxes was applied at the boundaries of all compartments c:
CNO;C− ¼ CNO;C
þ; DC
∂CNO;C
∂x
!−
¼ DC∂CNO;C
∂x
!þ
PO2 ;C− ¼ PO2;C
þ; αCDO2 ;C
∂2PO2 ;C
∂x2
!−
¼ αCDO2 ;C∂2PO2 ;C
∂x2
!þ
Atx ¼ x5;∂CNO
∂x ¼ 0; At y ¼ 0 and L;∂CNO
∂y ¼ 0
ð3Þ
where the superscripts ‘−’ and ‘+’ denote the left and right sides of thevessel respectively, and L represents the length of the vessel.
The specific equations for the NO/O2 transport as well as boundaryconditions in each compartment are given as follow:
BL
∂CNO;BL
∂t ¼ DNO;BL∂2CNO;BL
∂x2þ ∂2CNO;BL
∂y2
!−KNO;BLCNO;BL ð4Þ
whereKNO,BL is thefirst order reaction rate constant representing theNO scavenging by RBC (Lamkin-Kennard et al., 2004b). Since the O2
concentration in oxyhemoglobin is high and varies linearly with thecore hematocrit HC, PO2
was maintained to be constant across BL as
follows (Ong et al., 2012):
PO2¼ 1:3845 � HC þ 11:528 ð5Þ
CFL
Due to the absence of RBCs, there is no biochemical reaction in theCFL region (Lamkin-Kennard et al., 2004a):
∂CNO;CFL
∂t ¼ DNO;CFL∂2CNO;CFL
∂x2þ ∂2CNO;CFL
∂y2
!ð6Þ
∂PO2 ;CFL
∂t ¼ DO2;CFL∂2PO2 ;CFL
∂x2þ ∂2PO2 ;CFL
∂y2
!ð7Þ
EC
The production of NO in the endothelium (RNO,EC) was added as asource term:
∂CNO;EC
∂t ¼ DNO;EC∂2CNO;EC
∂x2þ ∂2CNO;EC
∂y2
!þ RNO;EC ð8Þ
where the RNO,EC was determined by the concentration of PO2in the
endothelium as follows:
RNO;EC ¼ RNO;ECjmaxPO2
PO2þ KM
ð9Þ

Fig. 2. A: Schematic diagram of simulation domain. BL— blood lumen, CFL— cell-free layer, EC— endothelial cell, VW— vessel wall and SM— smooth muscle. B: Representative velocityprofile in the blood flow. The CFL width and vessel wall positions were spatially averaged to obtain the transient two-phase flow velocity profiles.
91Y.C. Ng et al. / Microvascular Research 97 (2015) 88–97
where RNO,EC|max is the maximum NO production rate determinedby the wall shear stress (WSS), and KM is the Michaelis–Mentenconstant which denotes the PO2
at half of themaximumNO produc-tion rate (Buerk, 2001). As the amount of O2 consumed for thesynthesis of NO is equal to the amount of NO produced, the PO2
pro-file in the endothelium can be described by:
αEC∂PO2 ;EC
∂t ¼ αECDO2;EC∂2PO2;EC
∂x2þ ∂2PO2;EC
∂y2
!−RNO;EC ð10Þ
VW and SM
∂CNO;VW
∂t ¼ DNO;VW∂2CNO;VW
∂x2þ ∂2CNO;VW
∂y2
!−KNO;VWCNO;VW ð11Þ
∂CNO;SM
∂t ¼ DNO;SM∂2CNO;SM
∂x2þ ∂2CNO;SM
∂y2
!−KNO;SMCNO;SM ð12Þ
whereKNO,VW andKNO,SM are the pseudo-first-order rate constants for
NO scavenging in the VW and SM, respectively (Lamkin-Kennard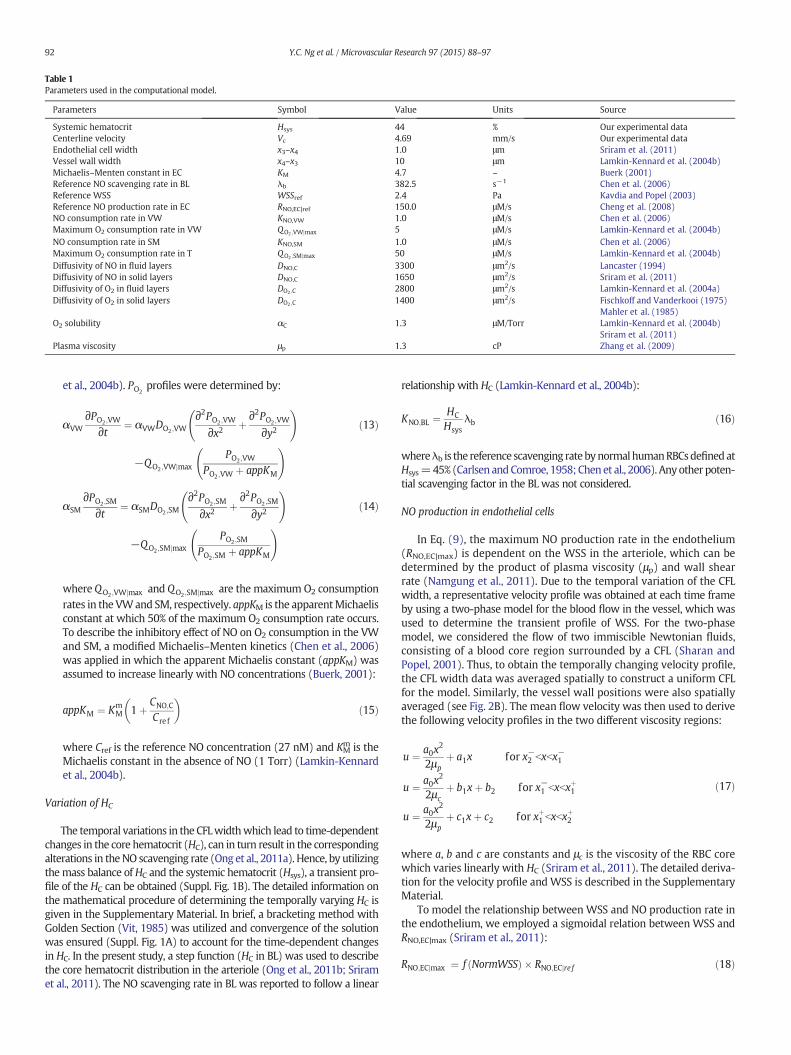
Table 1Parameters used in the computational model.
Parameters Symbol Value Units Source
Systemic hematocrit Hsys 44 % Our experimental dataCenterline velocity Vc 4.69 mm/s Our experimental dataEndothelial cell width x3–x4 1.0 μm Sriram et al. (2011)Vessel wall width x4–x3 10 μm Lamkin-Kennard et al. (2004b)Michaelis–Menten constant in EC KM 4.7 – Buerk (2001)Reference NO scavenging rate in BL λb 382.5 s−1 Chen et al. (2006)Reference WSS WSSref 2.4 Pa Kavdia and Popel (2003)Reference NO production rate in EC RNO,EC|ref 150.0 μM/s Cheng et al. (2008)NO consumption rate in VW KNO,VW 1.0 μM/s Chen et al. (2006)Maximum O2 consumption rate in VW QO2 ;VWjmax 5 μM/s Lamkin-Kennard et al. (2004b)NO consumption rate in SM KNO,SM 1.0 μM/s Chen et al. (2006)Maximum O2 consumption rate in T QO2 ;SMjmax 50 μM/s Lamkin-Kennard et al. (2004b)Diffusivity of NO in fluid layers DNO,C 3300 μm2/s Lancaster (1994)Diffusivity of NO in solid layers DNO,C 1650 μm2/s Sriram et al. (2011)Diffusivity of O2 in fluid layers DO2 ;C 2800 μm2/s Lamkin-Kennard et al. (2004a)Diffusivity of O2 in solid layers DO2 ;C 1400 μm2/s Fischkoff and Vanderkooi (1975)
Mahler et al. (1985)O2 solubility αC 1.3 μM/Torr Lamkin-Kennard et al. (2004b)
Sriram et al. (2011)Plasma viscosity μp 1.3 cP Zhang et al. (2009)
92 Y.C. Ng et al. / Microvascular Research 97 (2015) 88–97
et al., 2004b). PO2profiles were determined by:
αVW∂PO2 ;VW
∂t ¼ αVWDO2 ;VW∂2PO2 ;VW
∂x2þ ∂2PO2 ;VW
∂y2
!
−QO2;VWjmaxPO2;VW
PO2 ;VW þ appKM
!ð13Þ
αSM∂PO2 ;SM ¼ αSMDO ;SM
∂2PO2 ;SM þ ∂2PO2 ;SM
!ð14Þ
∂t 2 ∂x2 ∂y2−QO2 ;SMjmaxPO2 ;SM
PO2 ;SM þ appKM
!
whereQO2 ;VWjmax and QO2 ;SMjmax are the maximum O2 consumptionrates in the VWand SM, respectively. appKM is the apparentMichaelisconstant at which 50% of the maximum O2 consumption rate occurs.To describe the inhibitory effect of NO on O2 consumption in the VWand SM, a modified Michaelis–Menten kinetics (Chen et al., 2006)was applied in which the apparent Michaelis constant (appKM) wasassumed to increase linearly with NO concentrations (Buerk, 2001):
appKM ¼ KmM 1þ CNO;C
Cre f
� �ð15Þ
where Cref is the reference NO concentration (27 nM) and KMm is the
Michaelis constant in the absence of NO (1 Torr) (Lamkin-Kennardet al., 2004b).
Variation of HC
The temporal variations in the CFLwidthwhich lead to time-dependentchanges in the core hematocrit (HC), can in turn result in the correspondingalterations in theNO scavenging rate (Ong et al., 2011a). Hence, by utilizingthemass balance of HC and the systemic hematocrit (Hsys), a transient pro-file of the HC can be obtained (Suppl. Fig. 1B). The detailed information onthe mathematical procedure of determining the temporally varying HC isgiven in the Supplementary Material. In brief, a bracketing method withGolden Section (Vit, 1985) was utilized and convergence of the solutionwas ensured (Suppl. Fig. 1A) to account for the time-dependent changesin HC. In the present study, a step function (HC in BL) was used to describethe core hematocrit distribution in the arteriole (Ong et al., 2011b; Sriramet al., 2011). The NO scavenging rate in BL was reported to follow a linear
relationship with HC (Lamkin-Kennard et al., 2004b):
KNO;BL ¼HC
Hsysλb ð16Þ
whereλb is the reference scavenging ratebynormalhumanRBCsdefinedatHsys=45% (Carlsen andComroe, 1958; Chenet al., 2006). Anyother poten-tial scavenging factor in the BL was not considered.
NO production in endothelial cells
In Eq. (9), the maximum NO production rate in the endothelium(RNO,EC|max) is dependent on the WSS in the arteriole, which can bedetermined by the product of plasma viscosity (μp) and wall shearrate (Namgung et al., 2011). Due to the temporal variation of the CFLwidth, a representative velocity profile was obtained at each time frameby using a two-phase model for the blood flow in the vessel, which wasused to determine the transient profile of WSS. For the two-phasemodel, we considered the flow of two immiscible Newtonian fluids,consisting of a blood core region surrounded by a CFL (Sharan andPopel, 2001). Thus, to obtain the temporally changing velocity profile,the CFL width data was averaged spatially to construct a uniform CFLfor the model. Similarly, the vessel wall positions were also spatiallyaveraged (see Fig. 2B). The mean flow velocity was then used to derivethe following velocity profiles in the two different viscosity regions:
u ¼ a0x2
2μpþ a1x for x−2 bxbx−1
u ¼ a0x2
2μcþ b1xþ b2 for x−1 bxbxþ1
u ¼ a0x2
2μpþ c1xþ c2 for xþ1 bxbx
þ2
ð17Þ
where a, b and c are constants and μc is the viscosity of the RBC corewhich varies linearly with HC (Sriram et al., 2011). The detailed deriva-tion for the velocity profile andWSS is described in the SupplementaryMaterial.
To model the relationship between WSS and NO production rate inthe endothelium, we employed a sigmoidal relation between WSS andRNO,EC|max (Sriram et al., 2011):
RNO;ECjmax ¼ f NormWSSð Þ � RNO;ECjre f ð18Þ

93Y.C. Ng et al. / Microvascular Research 97 (2015) 88–97
f NormWSSð Þ ¼ tanh π � NormWSSm� � ð19Þ
where NormWSS is the WSS normalized by a reference WSS (WSSref =2.4 Pa (Kavdia and Popel, 2003)) which is capable of producing a refer-ence NO production rate (RNO,EC|ref) of 150 μM/s. f(NormWSS) is amonotonically increasing function where the beginning of the plateauregion of the curve corresponds to NormWSS = 1, hence givingf(NormWSS) = 1 and RNO,EC|max = RNO,EC|ref. The exponent m value of2 was used in this study to achieve a similar sigmoidal relation to thatobtained in a previous experimental study (Cheng et al., 2008).
Numerical solution
The set of coupled partial differential equations for the NO/O2 diffu-sion in the arteriole was solved using the finite difference method. TheFTCS (Forward in Time–Central in Space) scheme was used for the nu-merical discretization with the global iteration fixed at 1/3000 of 1 s,which is limited by the frame rate of the in vivo video recording. There-fore, the CFL–RBC boundary continuously changes at every 1/3000 s. Forthe convergence criterion at the given global iteration, the maximumrelative error of NO/O2 concentration between subsequent successivelocal iterations was set to be less than 10−4
. The maximum grid resolu-tion of 0.42 μm/node, as limited by the image spatial resolution, wasused for each compartment (Fig. 1C). An increase in the grid sizewould result in the loss of boundary information as larger grid sizesmay misrepresent the CFL data obtained from the image. For instance,when the actual CFL widthmeasured is less than the increased grid res-olution, the CFL width may either be truncated or over-estimated dueto the discretization of the domain. In contrast, the grid size could be
Fig. 3.Griddependence test. A:Dependenceof grid resolution on the solutions ofmeanNOconcentration (●) andPO2 (○) in the left vessel wall. B: Corresponding computation timesrequired for convergence.
further reduced to obtain the better-defined regions with steeper con-centration gradients by increasing the number of grid points used.
To examine the possible grid dependence of our solutions, we per-formed the NO/O2 simulations for the solutions of mean NO concentra-tion and PO2 in the left side of the arteriolar wall using five differentnumbers of grid points. As shown in Fig. 3A, themean NO concentrationand PO2 did not change significantly with increasing number of gridpoints, and only had maximum differences of 0.53% and 1.10%, respec-tively. However, the computation time for convergence of the simula-tion increased exponentially with the number of grid points (Fig. 3B).The number of grid points used to obtain the grid resolution of0.42 μm/node was 1.41 × 10⁶. Thus, the grid-independence of oursimulated results was ensured since the NO and PO2 obtained with1.41 × 106 and larger numbers of grid points did not differ significantly.The NO concentration was initialized at zero in all compartments andPO2 was maintained constant in the BL and zero in all other compart-ments. The simulation was then carried out for 1 s to obtain the initialconditions for the transient simulation with the same CFL data.
Statistical analysis
A statistical software package (Prism 6.0, GraphPad) was used forstatistical analyses. Paired t-test was used to compare the statisticalsignificance of the differences between the CFL widths as well as theNO and PO2 levels on both sides of the wall. P b 0.05 was consideredstatistically significant for all tests and regression fits.
Results and discussion
This study aimed to develop a numericalmodel capable of predictingthe influence of 2-D spatiotemporal variations of the arteriolar cell-freelayer (CFL) width on the NO/O2 transport. Since the CFL can concomi-tantly modulate the wall shear stress (WSS) (Namgung et al., 2011),the 2-D asymmetric formation of CFL could result in a significant differ-ence inWSS on both sides of the vessel, whichwould subsequently leadto a difference in endothelial NO production rates on opposite sides ofthe arteriole. Consequently, this resulted in higher concentrations ofNO in the tissues on the side of the arteriole with a narrower CFL. Thiseffect seemed to offset the modulation of NO bioavailability arisingfrom the diffusion barrier role of the CFL reported in previous numericalstudies (Chen et al., 2006; Lamkin-Kennard et al., 2004b), which dem-onstrated a significant reduction in the bioavailability of NO and O2
due to the increased diffusion distance between the BL and tissues. Assuch, the CFL along the arteriole exhibited an inverse relation with theNO and O2 concentrations in the vessel walls, hence undermining theinfluence of CFL as a diffusion barrier. In addition, the asymmetric for-mation of CFL in the arteriolarflow could produce a significant asymme-try in the bioavailability of NO and O2 on both sides of the arteriole.
Effect of CFL width
The temporal variation of the normalized cell-free area (NCFA) alongan arteriole is shown in Fig. 4A. The mean NCFA at the right arteriolarwall (8.95 ± 0.52%) was significantly larger (by ~19%; P b 0.0001)than that (10.64 ± 0.63%) at the left arteriolar wall. Consequently, byusing the temporally varying velocity profile obtained in Eq. (17), themean WSS acting on the left and right walls were 1.31 ± 0.07 and1.12± 0.06 Pa (Suppl. Fig. 2), respectively. The corresponding temporalvariations in the mean NO and O2 concentrations within the arteriolarwalls are shown in Figs. 4B and C. The mean NO concentration withinthe left wall (245.52 ± 4.49 nM) was ~25% larger (P b 0.0001) thanthat within the right wall (196.41 ± 4.42 nM). For the case of O2, themean PO2 within the left wall (66.57 ± 0.14 Torr) was ~19% larger(P b 0.0001) than that within the right wall (56.17 ± 0.21 Torr).
ThemeanWSS values obtained in this studywere in agreementwiththe range of values reported previously by Namgung et al. (2011)

Fig. 4. A: Temporal variations of normalized cell-free area (NCFA) in the arteriole. B and C:Simulation results of the corresponding changes in themeanNOconcentrations andmeanPO2 within the vessel walls, respectively.
Fig. 5.Asymmetryof normalized cell-free area (NCFA),meanNO concentrations andmeanPO2 within the vessel walls.
94 Y.C. Ng et al. / Microvascular Research 97 (2015) 88–97
(0.3–7.5 Pa), Tangelder et al. (1988) (0.6–5.4 Pa) and Smiesko et al.(1989) (0.87 ± 0.18 Pa). However, the mean NO concentrations in theleft (245.52 nM) and right wall (196.41 nM) were higher than therange of those simulated by Kavdia and Popel (2003) (101–167 nM)and Ong et al. (2011a) (159.5 nM). This discrepancy might be due tothe difference in the relation between NO production rate and WSSused in the studies. In the present study, the NO production rate wasdetermined by using a sigmoidal relation (Eq. (18)). However, previousstudies (Kavdia and Popel, 2003; Ong et al., 2011a) have used a linearrelation between theWSS and NO production rates. Although a sigmoi-dal relation was previously introduced by Sriram et al. (2011) in theirmodel, the NO production rate could be varied by choosing differentWSSref andm in Eq. (19) to determine the transitional zone between the
minimum andmaximumNO production rates. In contrast to the NO con-centrations, the simulatedmeanPO2 in the left and rightwalls was similarto that (56–70 Torr and ~61 Torr) reported by Lamkin-Kennard et al.(2004b) and Ong et al. (2012), hence affirming the validity of our model.
Since WSS is modulated by the CFL width (Namgung et al., 2011),the formation of consistently larger NCFA near the right arteriolar wallled to lower WSS, resulting in reduced NO production rates. This is inconsensus with previous studies (Baskurt et al., 2004; Yalcin et al.,2008), hence suggesting an inverse relation between the bioavailabilityof NO and the CFL width. Although this relationship could be partiallynegated by the increased diffusion distance created by a thicker CFL(Lamkin-Kennard et al., 2004b), our results indicate that the attenuationof WSS by the thicker CFL played a more dominant role in decreasingthe bioavailability of NO in the arterioles. Consequently, the concentra-tions of NO over the arteriolar wall with thinner CFL widths remainedhigher than the opposite side of the arteriole with thicker CFL widths,despite having closer proximity to the RBCs and larger degree of NOscavenging.
A similar inverse relation was found between the bioavailability ofO2 and the CFL width in which the PO2 was lower on the side of the ar-teriole with the thicker CFL. As such, our finding suggests that temporalvariations in the CFL width can limit the diffusion of O2 from the RBCcore into the tissues, hence demonstrating its diffusion barrier role(Lamkin-Kennard et al., 2004b) which was less prominent in the NOtransport. Corresponding studies (Brown, 2001; Brown and Cooper,1994; Lamkin-Kennard et al., 2004a) performed on O2 transport in thearterioles support our simulated results by suggesting that the enhance-ment of NO bioavailability in the periphery of the arteriole inhibits O2
consumption, hence potentially enhancing the bioavailability of O2 inthe arterioles.
Additionally, the changes in theNO/O2 concentrations in response tothe CFL width variation at a particular point were not proportional. Thiscould be due to contributions from the initial concentration from theprevious time as well as diffusion from the neighboring points. Thus,when the NCFA near the right arteriolar wall decreased by ~14%(18.7% at t = 0.6 s, 16.2% at t = 0.8 s), the mean NO concentrationwas attenuated by ~8%while themeanPO2 increased by ~2%. Therefore,the instantaneous change in NO/O2may not be as significant as the spa-tiotemporal change in CFL. Nevertheless, the overall cumulative chang-es in NO/O2 due to the spatiotemporal variations in the CFL widthclearly showed the inverse relation between the CFL width and NO/O2
bioavailability.
Effect of asymmetric CFL formation
Fig. 5 shows the transient asymmetry in the NCFA in the arterioleand the corresponding NO and O2 results within the vessel walls. The

Fig. 6. A: Time-averaged spatial variations of the CFL width along arteriole. B and C: Sim-ulation results of the time-averaged spatial variations of NO concentrations and PO2 alongthe arteriole, respectively. The dashed lines indicate spatiotemporally averaged values.
95Y.C. Ng et al. / Microvascular Research 97 (2015) 88–97
asymmetry of the NCFA and NO/O2 concentrations on opposite sides ofthe arteriole was quantified as follows:
Asymmetry ¼ L−RLþ R
ð20Þ
where L and R refer to the NCFA or NO/O2 concentrations at the left andright vessel walls respectively. Thus, the asymmetry can range from 1to −1, with a positive value indicating a larger NCFA or higher NO/O2
concentration at the left vesselwall. A zero asymmetry represents a per-fect symmetry in the NCFA or NO/O2 concentrations on both sides of thearteriole.
The mean asymmetry in NCFA was −0.086 ± 0.043, whereas thecorresponding mean asymmetries in NO and O2 concentrations were0.111 ± 0.018 and 0.085 ± 0.003 respectively. From these results, itcan be ascertained that the asymmetry in the NCFA contributed to theasymmetric availability of NO and O2 on both sides of vessel due tothe contrastingWSS values as well as the separation distances betweenthe RBC core and the vessel wall. The existence of the asymmetric CFAwas consistent with previous findings (Das et al., 1998; Ellsworth andPittman, 1986) which featured hematocrit distributions that werefound to be non-uniformwithinmicrovessels, potentially due to plasmaskimming and cell screening. The asymmetry of CFA was most likelydue to lateralmovements of RBC column, and partly contributed by ran-dom positioning of un-aggregated cells near the vessel wall. Nonethe-less, such asymmetric CFL (or CFA) effects on the gas transport werenot considered in any of previous 1-D computational studies (Onget al., 2011a, 2011b, 2012) or 2-D studies with a constant CFL width(Chen et al., 2006; Lamkin-Kennard et al., 2004b; Vaughn et al., 1998).This asymmetry of the NO concentrations observed in our simulated re-sults could lead to important clinical implications such as vasodilatoryeffects and other important pathophysiological interactions in arterioles(Riddell and Owen, 1999).
Effect of spatial variation of CFL
We found that the NO distribution exhibits large heterogeneitythroughout the entire simulation domain. The instantaneous spatial dis-tributions of NO/O2 in the simulation domain are given in Suppl. Fig. 3.This may be attributed to not only temporal but also spatial variationsin the CFL. Thus, to better describe the effects of the spatial variationof CFL on NO/O2 bioavailability, the time-averaged spatial variations ofthe normalized CFL width over the simulation time period of 1.0 s(Fig. 6A), and its corresponding variations in the NO/O2 concentrations(Figs. 6B and C) along the opposite sides of the vessel wall were exam-ined. The normalized spatial-mean CFL width on the left (9.0 ± 2.6%)was significantly smaller (by ~19%; P b 0.0001) than that on the right(10.6 ± 3.0%). The spatial-mean NO concentration on the left arteriolarwall (271.99 ± 24.09 nM) was ~15% larger (P b 0.0001) than that onthe right arteriolar wall (235.75 ± 24.63 nM), whereas the spatial-mean PO2 on the left (69.10 ± 1.29 Torr) and right (68.44 ± 1.58 Torr)arteriolar walls had no significant difference.
These results highlight that the dynamic spatial variations of CFLcould contribute to the large and rapid fluctuation in the NO concentra-tions which was not observed in the case of O2. This also illustrates thedifference in sensitivity to the spatial variations of the CFL width be-tween NO and O2, in spite of the two diffusivities being of the sameorder. As this study utilized a spatially averaged velocity profile foreach time frame (Eq. (17)), theWSSwas independent of the spatial var-iations of the CFL width along the arteriole at each time frame. Accord-ingly, the RNO,EC|max was also constant (spatially) along the arteriole ateach time frame, but varied temporally. As such, our model predictedthat the spatial variation of NO concentration could follow a similartrend to that of the CFLwidth (Figs. 6A and B), indicating a proportionalrelation between the CFL width and NO bioavailability. This could ex-plain the significance of the diffusion barrier role of CFL in regulating
NO concentrationswhen theNOproduction rate in the ECwas indepen-dent of the CFLwidth variations. Consequently, the diffusion barrier roleof the CFL contributed solely to the inhibition of NO scavenging by RBCs.Nonetheless, the dominance of theWSS-dependent endothelial NOpro-duction rate in regulating NO concentrations can be deduced by theinverse relation between the mean NO concentrations and the meannormalized CFL widths (Figs. 6A and B). In contrast, the difference inthe spatial variations of CFL on opposite sides of the arteriole did notlead to a significant difference in O2 concentrations over the vesselwalls (Fig. 6C). However, a local inverse relationship between the O2
concentrations and spatial variations of the CFL could still be observed,indicating the effect of the CFL as a diffusion barrier to the transport of O2.

96 Y.C. Ng et al. / Microvascular Research 97 (2015) 88–97
CFL width correlation on opposite sides of the vessel wall
In addition to the substantial difference in the CFL widths on oppo-site sides of the arteriole in Fig. 6A, a correlation analysis was used tocompare the spatial variations of the CFL width on both sides of the ves-sel. The degree of correlation between the two sides was determined bythe nonparametric Spearman correlation analysis. The Spearman coeffi-cient (Rs) ranges from 1 to−1,with Rs=1 representing a perfect directcorrelation and Rs = −1 a perfect inverse correlation. The CFL widthson opposite sides of the arteriole revealed a significant inverse relation-ship (P b 0.0001)with Rs=−0.21. Similarly, NO and O2 concentrationson opposite sides of the arteriole shown in Figs. 6B and C also exhibiteda significant inverse relationship (P b 0.0001) with Rs values of −0.54and −0.39, respectively. This inverse relation between the CFL widthson opposite sides of the arteriole is similar to that (−0.12 ± 0.06) re-ported in a previous in vivo study performedwith rat cremaster musclearterioles (ID= 10–50 μm)(Kimet al., 2007),which could be attributedto the lateral movements of the RBCs in the vessel (Enden and Popel,1994). Our simulated result indicated that this inverse relation of theCFL could have enhanced the inverse relation of NO and O2 on oppositesides of the vessel wall, thus contributing to the alterations of theNO/O2
bioavailability in arterioles.
Role of diffusion barrier vs. WSS modulator
In the present numerical model, the existence of CFL presents twoopposing effects on the bioavailability of NO/O2: 1) widening of thediffusion distance between the endothelium and the blood core (Chenet al., 2006; Lamkin-Kennard et al., 2004b) which suppresses NO scav-enging by the RBCs and O2 availability in the periphery of the arteriole,and 2) attenuation of the WSS acting on the endothelium whichdecreases the NO production rate (Namgung et al., 2011; Sriram et al.,2011). However, our simulated results showed a dominance of theWSS modulation role in regulating the concentrations of NO/O2 overthe arteriole walls, as exhibited by the spatiotemporal variations ofthe CFL width. The diffusion distance represented by the CFL widthcan only be dominant in the regulation of NO/O2 bioavailability withthe assumption of a constant NO production rate by neglecting theWSS variation corresponding to the CFL width variation. This biaseddominance could be due mainly to the following reasons. Firstly, theconsistently higher WSS (Suppl. Fig. 2) that leads to higher NO produc-tion rates in the endothelium could potentially offset and dominate theelevated amount of NO scavenging by RBCs over the thinner CFL width.Secondly, the coupled relation between NO and O2 (shown in Eqs. (8),(9) and (13)–(15)) could contribute to the greater availability of NOon the side of the arteriole with the thinner CFL width. As the produc-tion of NO in the endothelium is O2-dependent, the greater availabilityof O2 arising from the shorter diffusion distance between the bloodcore and CFL could further enhance the NO production rate. Lastly,since NO can reversibly inhibit O2 consumption in tissues (Brown andCooper, 1994), a higher endothelial NO production rate could producea transitory high concentration of NO which enhances the availabilityof O2 in the tissues, hence leading to the coupling of higher O2 availabil-ity and higher endothelial NO production rate.
Potential limitations of the current study
In this study, theWSS was estimated from the representative veloc-ity profiles obtained from Eq. (17), which were spatially constant ateach time step (1/3000 s). However, the velocity profile in arteriolesmay in fact vary along the vessel due to the spatial change in vessel di-ameter and unsteady pulsatile nature of blood flow (Popel and Johnson,2005; Tsukada et al., 2000). Since NO production is dependent onWSS,theNOproduction corresponding to the spatial variations in the velocityprofile and WSS could possibly influence the bioavailability of NO/O2.
Such potential effects of the spatial variation in velocity profile werenot considered in our model.
The decrease in the intravascular blood PO2 along the arteriolar flowwhich had been observed experimentally by Tsai et al. (2003) was notconsidered in our model. This reduction in O2 due to upstream lossescould influence the bioavailability of O2 in the arterioles as well as O2-dependent NO production in the endothelium. However, PO2 in the ratbrain arteriolar network decreased from 81.2 Torr (first-order arteri-oles, ID = 45 μm) to 61.5 Torr (fifth-order arterioles, ID = 8 μm)(Vovenko, 1999), suggesting that the longitudinal decrease in theblood PO2 in an arteriole could have an insignificant effect in our model.
In the presentmodel, all phenomena describing theNO/O2 transportwhich correspond to the CFL variability were synchronous. Thus, anypotential time delay between the onset of CFL variation and NO/O2 re-sponses was not considered. Buerk et al. (2011) previously reportedthat acute changes in the WSS over short time periods may not be suf-ficient to induce changes in the eNOS expression. In a separate study,Andrews et al. (2010) performed measurements of the shear stress-induced NO production from endothelial cells in a flow chamber.Under step changes in WSS, an initial decrease in NO transport was ob-served due to the increased removal rate by convection stemming froman increased flow. This was subsequently followed by an increase in NOconcentration due to the enhanced NO production rates. Accordingly,the NO/O2 transport may not correspond to the variation of CFL instan-taneously due to the effect of timedelay and convectionalflow in partic-ular under abnormally fast flow conditions.
Conclusion
In the present study, we have developed a 2-D transient model capa-ble of predicting the arteriolar NO/O2 bioavailability with considerationof spatiotemporal variations in the CFL width. Our model would be thefirst 2-D model that utilizes in vivo microscopic images of an arteriolarflow to structure the simulation domain with its spatiotemporal varia-tions. Our model prediction demonstrated that the 2-D NO/O2 concen-tration profiles along the downstream vessel wall could be significantlyaltered by the spatiotemporal variations of the CFL width. A significantimbalance in the NO/O2 availability was predicted on opposite sides ofthe vessel wall when the asymmetry of CFL between the both wallswas significant. Ourmodel also predicted an asymmetric NO/O2 distribu-tion that resulted from the spatiotemporal changes in the CFL width.
Abbreviations
BL Blood lumenCFL Cell-free layerDNO,C Diffusivity of NO in compartment cDO2 ;C Diffusivity of O2 in compartment cEC Endothelial cellHsys Systemic hematocritHC Core hematocritID Inner diameterKM Michaelis–Menten constant in ECKNO,VW NO consumption rate in SMKNO,VW NO consumption rate in VWNO Nitric oxideQO2 ;VWjmax
Maximum O2 consumption rate in VWQO2 ;SMjmax
Maximum O2 consumption rate in SMRBC Red blood cellRNO,EC|ref Reference NO production rate in ECSM Smooth muscle layerO2 Oxygen
97Y.C. Ng et al. / Microvascular Research 97 (2015) 88–97
PO2 ;C Partial pressure of O2 in compartment cVc Centerline velocity of blood flowVmean Mean velocity of blood flowVW Vessel wallWSSref Reference WSSx1− − x1
+ BL widthx2± − x1
± CFL widthx3± − x2
± EC widthx4± − x3
± VW widthx5± − x4
± SM widthαC O2 solubility in compartment cλb Reference NO scavenging rate in BLμp Plasma viscosityμc RBC core viscosity
Acknowledgments
This work was supported by NMRC/CBRG/0019/2012. The authorswish to thank Ms. Yacincha S Liem for her expert technical assistance.
Appendix A. Supplementary data
Supplementary data to this article can be found online at http://dx.doi.org/10.1016/j.mvr.2014.08.010.
References
Alonso, C., et al., 1993. Time-dependent rheological behavior of blood at low shear innarrow vertical tubes. Am. J. Physiol. 265, H553–H561.
Andrews, A.M., et al., 2010. Direct, real-time measurement of shear stress-induced nitricoxide produced from endothelial cells in vitro. Nitric Oxide 23, 335–342.
Baker, M., Wayland, H., 1974. On-line volume flow rate and velocity profile measurementfor blood in microvessels. Microvasc. Res. 7, 131–143.
Baskurt, O.K., et al., 2004. Modulation of endothelial nitric oxide synthase expression byred blood cell aggregation. Am. J. Physiol. Heart Circ. Physiol. 286, H222–H229.
Boo, Y.C., Jo, H., 2003. Flow-dependent regulation of endothelial nitric oxide synthase:role of protein kinases. Am. J. Physiol. Cell Physiol. 285, C499–C508.
Brown, G.C., 2001. Regulation of mitochondrial respiration by nitric oxide inhibition ofcytochrome c oxidase. Biochim. Biophys. Acta 1504, 46–57.
Brown, G.C., Cooper, C.E., 1994. Nanomolar concentrations of nitric oxide reversiblyinhibit synaptosomal respiration by competing with oxygen at cytochrome oxidase.FEBS Lett. 356, 295–298.
Buerk, D.G., 2001. Can we model nitric oxide biotransport? A survey of mathematicalmodels for a simple diatomic molecule with surprisingly complex biological activi-ties. Annu. Rev. Biomed. Eng. 3, 109–143.
Buerk, D.G., et al., 2011. Nitric oxide signaling in the microcirculation. Crit. Rev. Biomed.Eng. 39, 397–433.
Butler, A.R., et al., 1998. Diffusion of nitric oxide and scavenging by blood in the vascula-ture. Biochim. Biophys. Acta 1425, 168–176.
Carlsen, E., Comroe Jr., J.H., 1958. The rate of uptake of carbon monoxide and of nitricoxide by normal human erythrocytes and experimentally produced spherocytes. J.Gen. Physiol. 42, 83–107.
Chen, X., et al., 2006. The influence of radial RBC distribution, blood velocity profiles, andglycocalyx on coupled NO/O2 transport. J. Appl. Physiol. 100, 482–492.
Cheng, C., et al., 2008. Rapamycin modulates the eNOS vs. shear stress relationship.Cardiovasc. Res. 78, 123–129.
Das, B., et al., 1998. Effect of nonaxisymmetric hematocrit distribution on non-Newtonianblood flow in small tubes. Biorheology 35, 69–87.
Dixon, J.B., et al., 2007. Image correlation algorithm for measuring lymphocyte velocity anddiameter changes in contracting microlymphatics. Ann. Biomed. Eng. 35, 387–396.
Ellsworth, M.L., Pittman, R.N., 1986. Evaluation of photometric methods for quantifyingconvective mass transport in microvessels. Am. J. Physiol. 251, H869–H879.
Enden, G., Popel, A.S., 1994. A numerical study of plasma skimming in small vascularbifurcations. J. Biomech. Eng. 116, 79–88.
Fischkoff, S., Vanderkooi, J.M., 1975. Oxygen diffusion in biological and artificial mem-branes determined by the fluorochrome pyrene. J. Gen. Physiol. 65, 663–676.
Goldsmith, H.L., 1986. The Microcirculatory Society Eugene M. Landis Award Lecture. TheMicrorheology of Human Blood. Microvasc. Res. 31, 121–142.
Ignarro, L.J., et al., 1987. Endothelium-derived relaxing factor produced and released fromartery and vein is nitric oxide. Proc. Natl. Acad. Sci. U. S. A. 84, 9265–9269.
Kanai, A.J., et al., 1995. Shear stress induces ATP-independent transient nitric oxiderelease from vascular endothelial cells, measured directly with a porphyrinic micro-sensor. Circ. Res. 77, 284–293.
Kavdia, M., Popel, A.S., 2003. Wall shear stress differentially affects NO level in arteriolesfor volume expanders and Hb-based O2 carriers. Microvasc. Res. 66, 49–58.
Kavdia, M., et al., 2002. Model of nitric oxide diffusion in an arteriole: impact ofhemoglobin-based blood substitutes. Am. J. Physiol. Heart Circ. Physiol. 282,H2245–H2253.
Kim, S., et al., 2006. A computer-based method for determination of the cell-free layerwidth in microcirculation. Microcirculation 13, 199–207.
Kim, S., et al., 2007. Temporal and spatial variations of cell-free layer width in arterioles.Am. J. Physiol. Heart Circ. Physiol. 293, H1526–H1535.
Lamkin-Kennard, K.A., et al., 2004a. Interactions between NO and O2 in the microcircula-tion: a mathematical analysis. Microvasc. Res. 68, 38–50.
Lamkin-Kennard, K.A., et al., 2004b. Impact of the Fåhraeus effect on NO and O2
biotransport: a computer model. Microcirculation 11, 337–349.Lancaster Jr., J.R., 1994. Simulation of the diffusion and reaction of endogenously pro-
duced nitric oxide. Proc. Natl. Acad. Sci. U. S. A. 91, 8137–8141.Maeda, N., 1996. Erythrocyte rheology in microcirculation. Jpn. J. Physiol. 46, 1–14.Mahler, M., et al., 1985. Reappraisal of diffusion, solubility, and consumption of oxygen in
frog skeletal muscle, with applications to muscle energy balance. J. Gen. Physiol. 86,105–134.
McHedlishvili, G., Maeda, N., 2001. Blood flow structure related to red cell flow: a deter-minant of blood fluidity in narrow microvessels. Jpn. J. Physiol. 51, 19–30.
Namgung, B., et al., 2011. Effect of cell-free layer variation on arteriolar wall shear stress.Ann. Biomed. Eng. 39, 359–366.
Ong, P.K., et al., 2010. Effect of erythrocyte aggregation and flow rate on cell-free layerformation in arterioles. Am. J. Physiol. Heart Circ. Physiol. 298, H1870–H1878.
Ong, P.K., et al., 2011a. Modulation of NO bioavailability by temporal variation of thecell-free layer width in small arterioles. Ann. Biomed. Eng. 39, 1012–1023.
Ong, P.K., et al., 2011b. Temporal variations of the cell-free layer width may enhance NObioavailability in small arterioles: effects of erythrocyte aggregation. Microvasc. Res.81, 303–312.
Ong, P.K., et al., 2011c. An automated method for cell-free layer width determination insmall arterioles. Physiol. Meas. 32, N1–N12.
Ong, P.K., et al., 2012. Effects of cell-free layer formation on NO/O2 bioavailability in smallarterioles. Microvasc. Res. 83, 168–177.
Popel, A.S., Johnson, P.C., 2005. Microcirculation and hemorheology. Annu. Rev. FluidMech. 37, 43–69.
Radegran, G., Saltin, B., 1999. Nitric oxide in the regulation of vasomotor tone in humanskeletal muscle. Am. J. Physiol. 276, H1951–H1960.
Riddell, D.R., Owen, J.S., 1999. Nitric oxide and platelet aggregation. Vitam. Horm. 57,25–48.
Sharan, M., Popel, A.S., 2001. A two-phase model for flow of blood in narrow tubes withincreased effective viscosity near the wall. Biorheology 38, 415–428.
Sherman, T.F., et al., 1989. The cost of departure from optimal radii in microvascularnetworks. J. Theor. Biol. 136, 245–265.
Smiesko, V., et al., 1989. Dilator response of rat mesenteric arcading arterioles toincreased blood flow velocity. Am. J. Physiol. 257, H1958–H1965.
Soutani, M., et al., 1995. Quantitative evaluation of flow dynamics of erythrocytes inmicrovessels: influence of erythrocyte aggregation. Am. J. Physiol. 268, H1959–H1965.
Sriram, K., et al., 2011. The effect of small changes in hematocrit on nitric oxide transportin arterioles. Antioxid. Redox Signal. 14, 175–185.
Tangelder, G.J., et al., 1988.Wall shear rate in arterioles in vivo: least estimates fromplateletvelocity profiles. Am. J. Physiol. 254, H1059–H1064.
Tateishi, N., et al., 1994. Flow dynamics of erythrocytes in microvessels of isolated rabbitmesentery: cell-free layer and flow resistance. J. Biomech. 27, 1119–1125.
Tsai, A.G., et al., 2003. Oxygen gradients in themicrocirculation. Physiol. Rev. 83, 933–963.Tsoukias, N.M., et al., 2004. A theoretical model of nitric oxide transport in arterioles:
frequency- vs. amplitude-dependent control of cGMP formation. Am. J. Physiol.Heart Circ. Physiol. 286, H1043–H1056.
Tsukada, K., et al., 2000. Image correlation method for measuring blood flow velocity inmicrocirculation: correlation ‘window’ simulation and in vivo image analysis. Physiol.Meas. 21, 459–471.
Vaughn, M.W., et al., 1998. Effective diffusion distance of nitric oxide in the microcircula-tion. Am. J. Physiol. 274, H1705–H1714.
Vit, K., 1985. An efficient interfacing of golden-section and quadratic searches. J. Frankl.Inst. 320, 151–160.
Vovenko, E., 1999. Distribution of oxygen tension on the surface of arterioles, capillariesand venules of brain cortex and in tissue in normoxia: an experimental study onrats. Pflugers Arch. 437, 617–623.
Yalcin, O., et al., 2008. Nitric oxide generation by endothelial cells exposed to shear stressin glass tubes perfused with red blood cell suspensions: role of aggregation. Am. J.Physiol. Heart Circ. Physiol. 294, H2098–H2105.
Zhang, J., et al., 2009. Effects of erythrocyte deformability and aggregation on the cell freelayer and apparent viscosity of microscopic blood flows. Microvasc. Res. 77, 265–272.