Automated Measurement of the Arteriolar-to-Venular Width Ratio in Digital Color Fundus Photographs
10
IEEE TRANSACTIONS ON MEDICAL IMAGING, VOL. 30, NO. 11, NOVEMBER 2011 1941 Automated Measurement of the Arteriolar-to-Venular Width Ratio in Digital Color Fundus Photographs Meindert Niemeijer*, Xiayu Xu, Alina V. Dumitrescu, Priya Gupta, Bram van Ginneken, Member, IEEE, James C. Folk, and Michael D. Abrámoff, Senior Member, IEEE Abstract—A decreased ratio of the width of retinal arteries to veins [arteriolar-to-venular diameter ratio (AVR)], is well established as predictive of cerebral atrophy, stroke and other cardiovascular events in adults. Tortuous and dilated arteries and veins, as well as decreased AVR are also markers for plus disease in retinopathy of prematurity. This work presents an automated method to estimate the AVR in retinal color images by detecting the location of the optic disc, determining an appropriate region of interest (ROI), classifying vessels as arteries or veins, estimating vessel widths, and calculating the AVR. After vessel segmentation and vessel width determination, the optic disc is located and the system eliminates all vessels outside the AVR measurement ROI. A skeletonization operation is applied to the remaining vessels after which vessel crossings and bifurcation points are removed, leaving a set of vessel segments consisting of only vessel centerline pixels. Features are extracted from each centerline pixel in order to assign these a soft label indicating the likelihood that the pixel is part of a vein. As all centerline pixels in a connected vessel segment should be the same type, the median soft label is assigned to each centerline pixel in the segment. Next, artery vein pairs are matched using an iterative algorithm, and the widths of the vessels are used to calculate the AVR. We trained and tested the algorithm on a set of 65 high resolution digital color fundus photographs using a reference standard that indicates for each major vessel in the image whether it is an artery or vein. We compared the AVR values produced by our system with those determined by a semi-automated reference system. We obtained a mean unsigned error of 0.06 (SD 0.04) in 40 images with a mean AVR of 0.67. A second observer using the semi-automated system obtained the same mean unsigned error of 0.06 (SD 0.05) on the set of images with a mean AVR of 0.66. The testing data and reference standard used in this study has been made publicly available. Manuscript received May 10, 2011; accepted June 01, 2011. Date of publica- tion June 16, 2011; date of current version November 02, 2011. This work was supported in part by the National Eye Institute (R01 EY017066), in part by the Research to Prevent Blindness, and in part by the Marlene S. and Leonard A. Hadley Glaucoma Research Fund. Asterisk indicates corresponding author. *M. Niemeijer is with the University of Iowa Hospitals and Clinics, Iowa City, IA 52242 USA. He is also with the VA Center of Excellence for Prevention and Treatment of Visual Loss, Iowa City, IA 52242 USA (e-mail: meindert- [email protected]). J. C. Folk, A.V. Dumitrescu and P. Gupta are with the University of Iowa Hospitals and Clinics, Department of Opthalmology and Visual Sciences, Iowa City, IA 52242 USA. X. Xu is with the University of Iowa, Department of Biomedical Engineering, Iowa City, IA 52242 USA. B. van Ginneken is with the Radboud University Nijmegen Medical Centre, Department of Radiology, Diagnostic Image Analysis Group, 6525 GA Nijmegen, The Netherlands. M.D. Abrámoff is with the University of Iowa Hospitals and Clinics, Depart- ment of Opthalmology and Visual Sciences, Iowa City, IA 52242 USA. He is also with the University of Iowa, Department of Electrical and Computer En- gineering, and also the Department of Biomedical Engineering, Iowa City, IA 52242 USA and also with the VA Center of Excellence for Prevention and Treat- ment of Visual Loss, Iowa City, IA 52242 USA. Color versions of one or more of the figures in this paper are available online at http://ieeexplore.ieee.org. Digital Object Identifier 10.1109/TMI.2011.2159619 Index Terms—Artery, artery vein ratio, artery vein separation, retina, vasculature, vein. I. INTRODUCTION T HE accurate measurement of retinal vessel parameters is an important problem in eye research, especially in retinal image analysis. Diseases can alter the width of por- tions, or the entire length, of retinal vessels, increase their curvature or tortuosity, and/or change their reflectance of light. Cardiovascular disease can decrease the width of arteries and increase the widths of veins. Though this fact was appreciated by ophthalmologists for years, only recently, through precise and cumbersome measurements of arterial and venous widths, has it become clear that small changes in the ratio between the widths of arterioles and venules, the arteriolar-to-venular diameter ratio (AVR), are associated with increases in the risk for stroke, cerebral atrophy, cognitive decline, and myocardial infarct. [1]–[3]. Other diseases, including diabetic retinopathy and retinopathy of prematurity are also known to affect the AVR (see [4] for a comprehensive review). Unfortunately, relevant changes in AVR are too subtle to be detected by ophthalmologists during clinical examination and the process of manually or semi-automatically estimating the AVR from digital fundus photographs is too cumbersome and laborious for clinical practice. Thus, an automated method for determination of the AVR may have substantial impact on clinical practice, and may lead to an improved assessment for patients at risk for cardiovascular and brain disease. This study focuses on a fully automated de- termination of the AVR from digital color fundus photographs. The accurate estimation of AVR is challenging and requires optic disc detection, vessel segmentation, accurate vessel width measurement, vessel network analysis, and artery vein classifi- cation. Optic disc detection is necessary to determine the loca- tion of the region of interest (ROI) where the measurements are obtained. Vessel segmentation must be used to find the vessels themselves and the width of the vessels. Any AVR measurement system must identify which vessels are arteries and which are veins with high accuracy since small classification errors can have a large influence on the final AVR. Please note that while arteriolar/venular are the correct terms, we will use the terms artery/vein interchangably in this work. Methods for both AV classification as well as AVR determina- tion have been presented previously. A semi-automatic method for the analysis of retinal vascular trees in which the venous and arterial trees were analyzed separately was presented by Mar- tinez-Perez et al. [5]. More recent work by Rothaus et al. [6] 0278-0062/$26.00 © 2011 IEEE
-
Upload
independent -
Category
Documents
-
view
0 -
download
0
Transcript of Automated Measurement of the Arteriolar-to-Venular Width Ratio in Digital Color Fundus Photographs
IEEE TRANSACTIONS ON MEDICAL IMAGING, VOL. 30, NO. 11, NOVEMBER 2011 1941
Automated Measurement of the Arteriolar-to-VenularWidth Ratio in Digital Color Fundus PhotographsMeindert Niemeijer*, Xiayu Xu, Alina V. Dumitrescu, Priya Gupta, Bram van Ginneken, Member, IEEE,
James C. Folk, and Michael D. Abrámoff, Senior Member, IEEE
Abstract—A decreased ratio of the width of retinal arteriesto veins [arteriolar-to-venular diameter ratio (AVR)], is wellestablished as predictive of cerebral atrophy, stroke and othercardiovascular events in adults. Tortuous and dilated arteries andveins, as well as decreased AVR are also markers for plus diseasein retinopathy of prematurity. This work presents an automatedmethod to estimate the AVR in retinal color images by detectingthe location of the optic disc, determining an appropriate region ofinterest (ROI), classifying vessels as arteries or veins, estimatingvessel widths, and calculating the AVR. After vessel segmentationand vessel width determination, the optic disc is located and thesystem eliminates all vessels outside the AVR measurement ROI.A skeletonization operation is applied to the remaining vesselsafter which vessel crossings and bifurcation points are removed,leaving a set of vessel segments consisting of only vessel centerlinepixels. Features are extracted from each centerline pixel in orderto assign these a soft label indicating the likelihood that the pixelis part of a vein. As all centerline pixels in a connected vesselsegment should be the same type, the median soft label is assignedto each centerline pixel in the segment. Next, artery vein pairs arematched using an iterative algorithm, and the widths of the vesselsare used to calculate the AVR. We trained and tested the algorithmon a set of 65 high resolution digital color fundus photographsusing a reference standard that indicates for each major vesselin the image whether it is an artery or vein. We compared theAVR values produced by our system with those determined by asemi-automated reference system. We obtained a mean unsignederror of 0.06 (SD 0.04) in 40 images with a mean AVR of 0.67. Asecond observer using the semi-automated system obtained thesame mean unsigned error of 0.06 (SD 0.05) on the set of imageswith a mean AVR of 0.66. The testing data and reference standardused in this study has been made publicly available.
Manuscript received May 10, 2011; accepted June 01, 2011. Date of publica-tion June 16, 2011; date of current version November 02, 2011. This work wassupported in part by the National Eye Institute (R01 EY017066), in part by theResearch to Prevent Blindness, and in part by the Marlene S. and Leonard A.Hadley Glaucoma Research Fund. Asterisk indicates corresponding author.
*M. Niemeijer is with the University of Iowa Hospitals and Clinics, Iowa City,IA 52242 USA. He is also with the VA Center of Excellence for Preventionand Treatment of Visual Loss, Iowa City, IA 52242 USA (e-mail: [email protected]).
J. C. Folk, A.V. Dumitrescu and P. Gupta are with the University of IowaHospitals and Clinics, Department of Opthalmology and Visual Sciences, IowaCity, IA 52242 USA.
X. Xu is with the University of Iowa, Department of Biomedical Engineering,Iowa City, IA 52242 USA.
B. van Ginneken is with the Radboud University Nijmegen Medical Centre,Department of Radiology, Diagnostic Image Analysis Group, 6525 GANijmegen, The Netherlands.
M.D. Abrámoff is with the University of Iowa Hospitals and Clinics, Depart-ment of Opthalmology and Visual Sciences, Iowa City, IA 52242 USA. He isalso with the University of Iowa, Department of Electrical and Computer En-gineering, and also the Department of Biomedical Engineering, Iowa City, IA52242 USA and also with the VA Center of Excellence for Prevention and Treat-ment of Visual Loss, Iowa City, IA 52242 USA.
Color versions of one or more of the figures in this paper are available onlineat http://ieeexplore.ieee.org.
Digital Object Identifier 10.1109/TMI.2011.2159619
Index Terms—Artery, artery vein ratio, artery vein separation,retina, vasculature, vein.
I. INTRODUCTION
T HE accurate measurement of retinal vessel parametersis an important problem in eye research, especially in
retinal image analysis. Diseases can alter the width of por-tions, or the entire length, of retinal vessels, increase theircurvature or tortuosity, and/or change their reflectance of light.Cardiovascular disease can decrease the width of arteries andincrease the widths of veins. Though this fact was appreciatedby ophthalmologists for years, only recently, through preciseand cumbersome measurements of arterial and venous widths,has it become clear that small changes in the ratio betweenthe widths of arterioles and venules, the arteriolar-to-venulardiameter ratio (AVR), are associated with increases in the riskfor stroke, cerebral atrophy, cognitive decline, and myocardialinfarct. [1]–[3]. Other diseases, including diabetic retinopathyand retinopathy of prematurity are also known to affect theAVR (see [4] for a comprehensive review). Unfortunately,relevant changes in AVR are too subtle to be detected byophthalmologists during clinical examination and the processof manually or semi-automatically estimating the AVR fromdigital fundus photographs is too cumbersome and laboriousfor clinical practice.
Thus, an automated method for determination of the AVRmay have substantial impact on clinical practice, and may leadto an improved assessment for patients at risk for cardiovascularand brain disease. This study focuses on a fully automated de-termination of the AVR from digital color fundus photographs.
The accurate estimation of AVR is challenging and requiresoptic disc detection, vessel segmentation, accurate vessel widthmeasurement, vessel network analysis, and artery vein classifi-cation. Optic disc detection is necessary to determine the loca-tion of the region of interest (ROI) where the measurements areobtained. Vessel segmentation must be used to find the vesselsthemselves and the width of the vessels. Any AVR measurementsystem must identify which vessels are arteries and which areveins with high accuracy since small classification errors canhave a large influence on the final AVR. Please note that whilearteriolar/venular are the correct terms, we will use the termsartery/vein interchangably in this work.
Methods for both AV classification as well as AVR determina-tion have been presented previously. A semi-automatic methodfor the analysis of retinal vascular trees in which the venous andarterial trees were analyzed separately was presented by Mar-tinez-Perez et al. [5]. More recent work by Rothaus et al. [6]
0278-0062/$26.00 © 2011 IEEE

1942 IEEE TRANSACTIONS ON MEDICAL IMAGING, VOL. 30, NO. 11, NOVEMBER 2011
proposes a method to label all vessels as either artery or veinusing an existing vessel segmentation and some manually la-beled starting vessel segments. Li et al. [7] presented a methodfor automatically determining the AVR, however, that methodstill required manual user input to separate arteries from veins.Automated AV classification was first presented by Grisan etal. [8]: in this method the vasculature is segmented using avessel tracking and analysis procedure and the vessel centerlinesare detected. After defining an area of interest around the opticdisc and dividing this area into four quadrants, color based fea-tures are extracted from the vessel segments that are then clas-sified into arteries and veins using an unsupervised clusteringmethod. This method had a total error rate of 12.4% on 24 im-ages. Kondermann et al. [9] presented a method for AV classifi-cation based on features extracted from vessel profiles as well asfeatures based on the local image intensities around the vesselcenterline. The authors obtained an accuracy of 95.32% for as-signing manually segmented vessel pixels to the correct class infour images. A combined clustering and classification approachfor separating arteries and veins was presented by Vázquez et al.[10]. The authors compared different feature sets and classifica-tion approaches. They also tested the influence of the distance tothe optic disc on their measurements and achieved an accuracyrate of 86.34% for assigning vessels to the artery or vein class.However, not all vessels detected by the system were includedin the reference standard.
Ruggeri et al. [11] was the first group to present a methodwith an evaluation based on the actual AVR that was measuredmanually in the image. The authors report a correlation in 14 im-ages varying between 0.73 and 0.83 depending on how the AVRwas calculated. Tramontan et al. [12] further extended the algo-rithm with enhanced vessel tracking and structural AV discrimi-nation features obtaining a correlation of 0.88 on 20 images. Thesystem was then implemented as a webservice which allowedgraders to check and change the algorithm results [13]. An eval-uation by three graders analyzing 30 fundus images showed highreproducibility of the system’s measurements between the threegraders.
The system we propose and evaluate in this paper combinesmethods that were previously described by our group as well asnewly proposed techniques. The method automatically detectsthe optic disc, segments the vasculature, determines the vesselwidth, classifies the detected vessels into arteries and veins andcalculates the AVR in the ROI. It is completely automatic andrequires no user input. We compare the AVR output of the auto-matic, proposed algorithm to that of the IVAN semi-automatedmethod developed at the University of Wisconsin. This is theaccepted reference standard, and has been used in major studiesassociating AVR with cardiovascular disease and prognosis [4].We also validated the classification system that classifies vesselsinto arteries and veins since it is such an important subcompo-nent.
This paper is structured as follows. Section II describes thevarious components of the system. In Section III the data usedis presented. Section IV discusses the performed experimentsand shows the obtained results. Section V discusses the resultsof the automated system compared to previous systems as wellas its clinical importance.
Fig. 1. Overview of all steps in the proposed method.
Fig. 2. Image overlaid with the automatically determined ROI region. The re-gion labeled “B” is where AVR measurements are taken.
II. METHODS
Knudtson et al. [14], [15] published a protocol for the mea-surement of the AVR. The protocol precisely defines where andhow measurements should be obtained (see Section II-D). Theautomated method described herein follows this protocol when-ever possible. It starts by preprocessing an image to remove thegradient around the border of the field-of-view (FOV) as wellas to remove slow intensity variations in the image. Further pre-processing is focused on the detection of the two most importantanatomical landmarks. These are the optic disc, the landmark onthe retina around which the measurements are obtained and thevasculature, the structure that is actually being measured. Afterdetecting the location of the optic disc, we automatically placethe ROI, as defined in the protocol, in the image. Vessel widthmeasurements are obtained and the vessels within the measure-ment area are classified into arteries and veins. Finally, the AVRis determined. These steps are also shown in Fig. 1.
A. Preprocessing
We have previously described methods for the preprocessingsteps of the algorithm and will, therefore, only briefly discussthese here. The interested reader is referred to the referencesincluded with the method descriptions.
1) Field of View Mirroring and Background Removal: Dig-ital color fundus photographs have a black border around theFOV (see Fig. 2). The large gradient can disturb feature mea-surements near the FOV border. It is removed by applying a pre-viously presented mirroring technique [16]. This method mir-rors the pixel values from within the circular field of view tooutside the FOV. This operation was performed at the originalimage resolution.
NIEMEIJER et al.: AUTOMATED MEASUREMENT OF THE ARTERIOLAR-TO-VENULAR WIDTH RATIO 1943
Slow background variations were removed by blurring theimage with a Gaussian filter with a large standard deviation andsubtracting the blurred image from the original. The value ofthe standard deviation of the Gaussian filter is not a critical pa-rameter as long as it is large enough to ensure the blurred imagecontains no visible structures such as vessels. This procedurewas performed on both the red as well as the green color planesseparately. For all image processing operations the green planeis used, additionally, both the green and red planes are used inthe artery vein classification. From here, whenever the green andred plane is mentioned, it refers to the preprocessed versions.The blue color plane was not used.
2) Vessel Segmentation and Preprocessing: To segment theretinal vasculature, a previously presented method [17] basedon pixel classification was used. The filter outputs of a Gaussianfilter bank were used as features to train a kNN-classifier [18]to detect the vasculature. This method is not scale independentas the Gaussian filterbank features are extracted at particularscales. Additionally, the images with which the vessel segmen-tation method has been trained (the DRIVE database [19]) havea particular resolution and therefore a particular range of vesselwidths (measured in pixels). As the data used in this study had ahigh resolution, applying the standard method trained with thelow-resolution DRIVE data would not produce adequate results.To attain reasonable performance for the vessel segmentationstep we have downsampled the images with a factor of 4 beforeapplying the vessel segmentation.
The vessel segmentation method assigns each pixel in theimage a likelihood between 0 and 1 that the pixel is within avessel. This results in a “vesselness map” that can be thresh-olded to produce a binary vessel segmentation. Before thresh-olding, we upsampled the vesselness map back to the resolutionof the original image, using quintic spline interpolation. To ana-lyze the vessel network we then applied a skeletonization algo-rithm [20], [21] on the thresholded likelihood map, reducing allvessels to a single centerline one pixel wide. Thresholdwas used since it gave good results on the training data (thetraining data is described in Section III). After the skeletoniza-tion of the segmented vessels, cross-over and bifurcation pointswere removed by counting the number of neighbors for all cen-terline pixels and removing those with more than two neighbors.This is necessary because the vessel width and angle in bifurca-tions is not well defined and/or difficult to measure in the caseof cross-over points. This operation subdivides the vascular net-work into a collection of vessel segments that are individuallyanalyzed.
3) Optic Disc Detection and ROI Determination: A super-vised position regression method [22] was used to detect thecenterpoint of the optic disc. This method estimates how far acertain position in the image is from the optic disc center. Theestimation is based on measurements obtained in the image andfrom the vessel segmentation. The target location is found byobtaining estimates in many locations in the image, eliminatingthose locations that are estimated to be far from the optic discand searching around the locations estimated to be close to theoptic disc center. No prior assumptions about the location ofthe optic disc in the image are made. The method is first trainedusing a large set of images (both optic disc and fovea centered)
for which the location of the optic disc is known. Our methoddoes not segment the optic disc, therefore we have assumed theoptic disc in our testing data to have a constant size. This isa valid assumption due to the uniformity of the data used inthis study. All of the images have the same resolution in pixelsand cover approximately the same area of the retina. After per-forming some manual measurements in the training set we as-sumed a value of 360 pixels for the optic disc diameter (DD),at this diameter, the vast majority of optic discs is completelycovered. The optic disc detection proceeds as follows, the au-tomated method detects the center of the optic disc and a circlewith diameter of 360 pixels is placed at this location. We as-sumed this circle corresponds with the optic disk outline in theimage.
The AVR calculation protocol [15] precisely defines the re-gion of interest (ROI) in which the AVR should be measured.This ROI is centered on the optic disc (see Fig. 2). The ROIconsists of several circular regions whose size is based on theapproximate diameter of the optic disc. Region A is between 0.5and 1 DD from the optic disc center and region B, where vesselmeasurements are taken, is between 1 DD and 1.5 DD from theoptic disc center. All analyses and evaluations performed in thiswork are based on measurements within region B.
B. Vessel Width Measurement
After vessel segmentation and preprocessing, the vascula-ture was thinned and subdivided into a set of vessel segments.All vessel segments that were not (partly) inside region B (seeFig. 2) were removed as they were not used in the AVR anal-ysis. Even though the vessel segmentation algorithm we usedcan successfully localize most vessels, i.e., wide and narrowones, choosing a single threshold to produce a binary segmen-tation of the vasculature that can be used to determine the localvessel width is difficult. The values in the likelihood map, asproduced by the vessel segmentation algorithm, tend to zero asone moves away from the vessel border into the retinal back-ground. This effect is also dependent on the vessel width withnarrower vessels having an overall lower likelihood responsethan wider vessels. Consequently, relatively small variations inthe applied threshold result in substantial vessel width differ-ences and thresholds that give visually pleasing results for widervessels completely miss smaller vessels. This is further compli-cated by the fact that the vessel detection is performed at a lowerresolution resulting in larger errors after upsampling.
The semi-automated software that was used to establish thereference standard for our AV ratio measurements, IVAN, uses atechnique called “tobogganing” [23], [24] in its vessel segmen-tation algorithm. As we wanted to obtain similar vessel widthsto IVAN, we have combined tobogganing with our vessel seg-mentation. This has the added benefit that we can do the vesselwidth analysis on the original images in their original resolutioninstead of on the subsampled images on which the vessels weresegmented.
1) Combining Tobogganing and Vessel Pixel Classification:Tobogganing is a segmentation technique that subdivides theimage into areas (i.e., “splats”) that are homogeneous based ona certain criterion. The technique’s results are analogous to the“catchment basins” in watershed segmentation [25]. We used
1944 IEEE TRANSACTIONS ON MEDICAL IMAGING, VOL. 30, NO. 11, NOVEMBER 2011
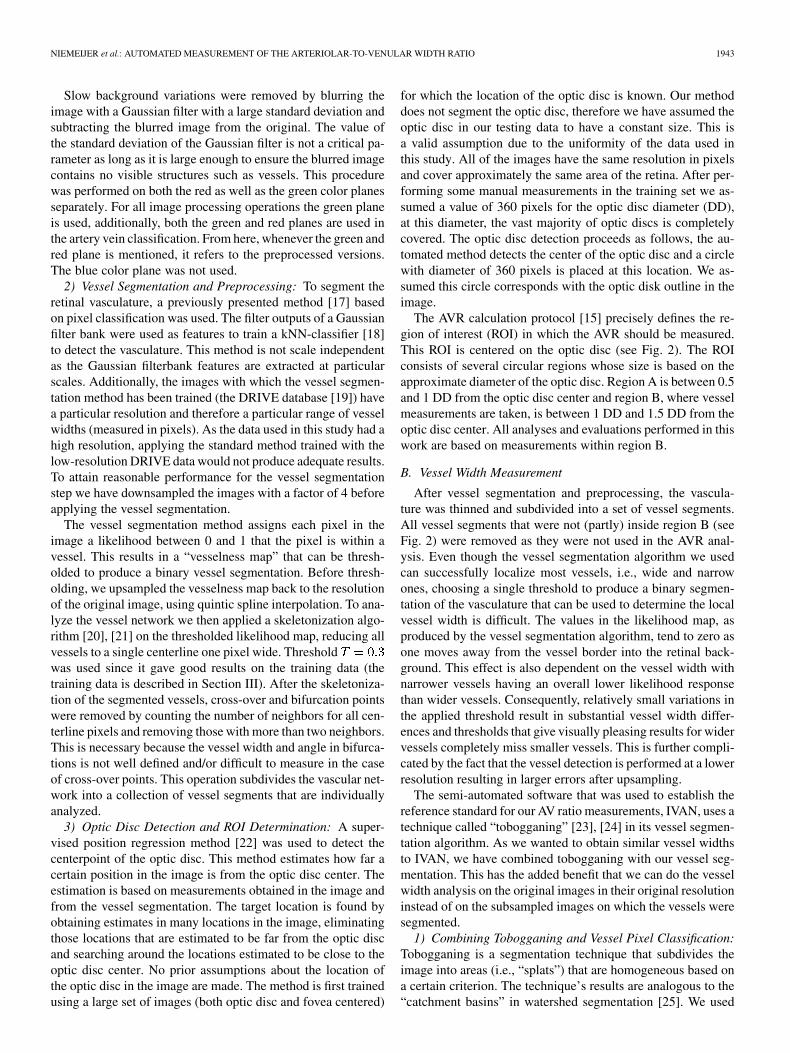
Fig. 3. Image showing the most important processing steps described in Section II-A on a small sub-image. (a) The color fundus image. (b) The vessel likelihoodmap. A higher pixel value in this image means a higher vessel likelihood. (c) The splat map, the borders of the individual splats are shown. (d) The processed vessellikelihood map. Each splat has been assigned the median vessel likelihood value under the splat. (e) The vessel centerlines where each centerline pixel has beenasigned the likelihood it is inside a vein (dilated for display). (f) The final width measures superimposed on the original image. Only every third measurement wasplotted.
the multiscale gradient magnitude image [25] to define homo-geneity. To calculate the gradient magnitude, the image is con-volved with a first derivative of Gaussian filter in both theand direction after which the magnitude of the gradient is ob-tained for each pixel. The gradient magnitude at various scales(i.e., various standard deviations ) tends to have a maximum atthe border of high contrast structures such as the vasculature. Alower scale filter will give more response at the border of smallvessels and a higher scale filter will give more response at theborder of wider vessels. To obtain the multiscale gradient mag-nitude image we calculated the scale-normalized gradient mag-nitude at scales , 2,3,4, 5, 6 and used the maximum valueover scale for each of the pixels in the image. After applying thetobogganing method, a splat map with around 150 000 splats[Fig. 3(c)] was obtained. The likelihood map produced by thevessel segmentation algorithm can now be used to determinefor each splat the likelihood it is inside a vessel. This is accom-plished by assigning to each splat the median likelihood value ofall the pixels that are part of the splat. We can assume the splatsare either inside or outside the vessel (note that this assumptiondoes not always hold in the case of low contrast, narrow vessels).Given a correct likelihood map this results in the splats insidethe vessel being assigned a higher likelihood than those outsidethe vessel. In the resulting vessel map, the borders of the ves-sels are better defined and the widths of the vessels become lessdependent on the chosen vessel segmentation threshold. Thisenhanced vessel map was used to determine the vessel width.
Fig. 3 shows the process in more detail on a small subimagetaken from one of the test images.
2) Measuring the Vessel Width: Measurement of the localvessel width must be performed perpendicular to the localvessel angle in order to minimize errors during the measure-ment process. The local vessel angle is determined for allcenterline pixels in every vessel segment. We have defined thelocal vessel angle as the direction of the largest eigenvector ofthe covariance matrix of the coordinate of the centerline pixelalong with the coordinates of its seven connected neighbors toboth sides (i.e., 15 coordinates in total). As it is unknown wherethe vessel begins or ends, the range of the angles is .Near the end of the vessel segment only centerline coordinatesinside the vessel are used, 8 for the end pixel.
For each centerline pixel the local vessel width was measuredby finding the left and right vessel edges in the enhanced vesselmap and calculating the distance between them. To determinethe locations of the edges of the vessel, the likelihood was mea-sured along a line through the centerline pixel and perpendicularto the local vessel angle. Starting from the centerline pixel thevessel border was found in both the left and right directions.The likelihood threshold at which a splat is no longer part ofa vessel is a critical parameter in this algorithm. As the likeli-hood assigned to vessel splats varies over the image and is de-pendent on local vessel contrast and vessel width, a local vesselthreshold was determined for every centerline pixel. The vessellikelihood under the centerline pixel was multiplied by a ratio
NIEMEIJER et al.: AUTOMATED MEASUREMENT OF THE ARTERIOLAR-TO-VENULAR WIDTH RATIO 1945
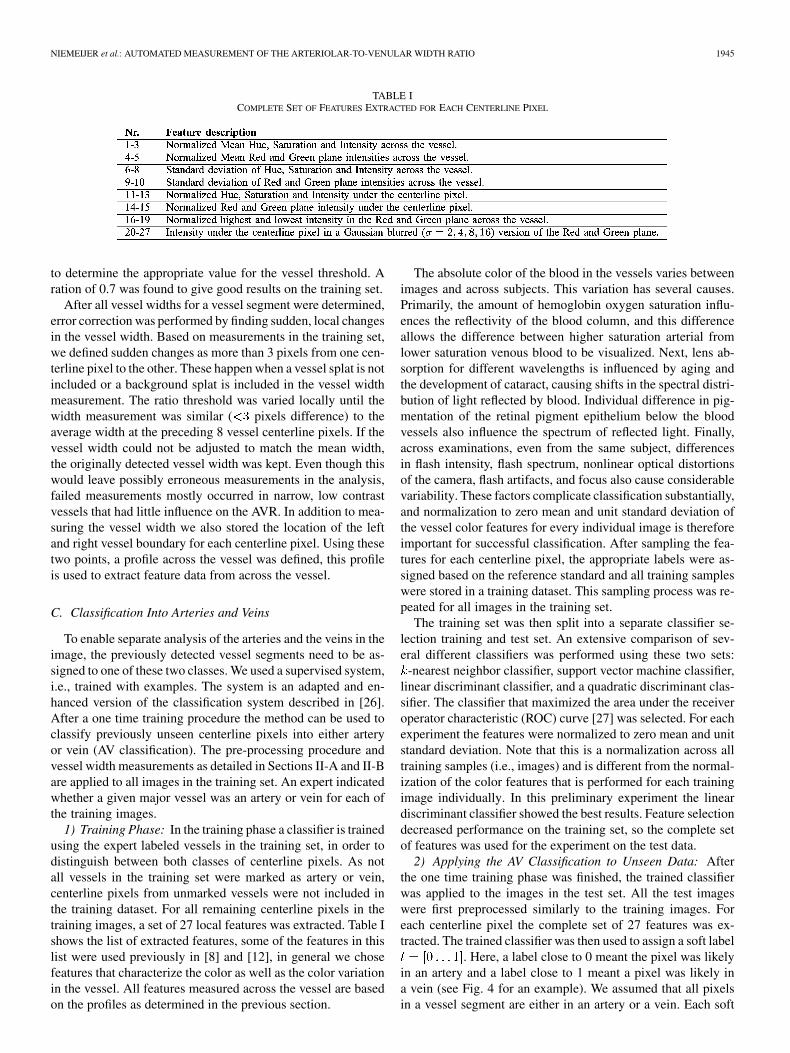
TABLE ICOMPLETE SET OF FEATURES EXTRACTED FOR EACH CENTERLINE PIXEL
to determine the appropriate value for the vessel threshold. Aration of 0.7 was found to give good results on the training set.
After all vessel widths for a vessel segment were determined,error correction was performed by finding sudden, local changesin the vessel width. Based on measurements in the training set,we defined sudden changes as more than 3 pixels from one cen-terline pixel to the other. These happen when a vessel splat is notincluded or a background splat is included in the vessel widthmeasurement. The ratio threshold was varied locally until thewidth measurement was similar ( pixels difference) to theaverage width at the preceding 8 vessel centerline pixels. If thevessel width could not be adjusted to match the mean width,the originally detected vessel width was kept. Even though thiswould leave possibly erroneous measurements in the analysis,failed measurements mostly occurred in narrow, low contrastvessels that had little influence on the AVR. In addition to mea-suring the vessel width we also stored the location of the leftand right vessel boundary for each centerline pixel. Using thesetwo points, a profile across the vessel was defined, this profileis used to extract feature data from across the vessel.
C. Classification Into Arteries and Veins
To enable separate analysis of the arteries and the veins in theimage, the previously detected vessel segments need to be as-signed to one of these two classes. We used a supervised system,i.e., trained with examples. The system is an adapted and en-hanced version of the classification system described in [26].After a one time training procedure the method can be used toclassify previously unseen centerline pixels into either arteryor vein (AV classification). The pre-processing procedure andvessel width measurements as detailed in Sections II-A and II-Bare applied to all images in the training set. An expert indicatedwhether a given major vessel was an artery or vein for each ofthe training images.
1) Training Phase: In the training phase a classifier is trainedusing the expert labeled vessels in the training set, in order todistinguish between both classes of centerline pixels. As notall vessels in the training set were marked as artery or vein,centerline pixels from unmarked vessels were not included inthe training dataset. For all remaining centerline pixels in thetraining images, a set of 27 local features was extracted. Table Ishows the list of extracted features, some of the features in thislist were used previously in [8] and [12], in general we chosefeatures that characterize the color as well as the color variationin the vessel. All features measured across the vessel are basedon the profiles as determined in the previous section.
The absolute color of the blood in the vessels varies betweenimages and across subjects. This variation has several causes.Primarily, the amount of hemoglobin oxygen saturation influ-ences the reflectivity of the blood column, and this differenceallows the difference between higher saturation arterial fromlower saturation venous blood to be visualized. Next, lens ab-sorption for different wavelengths is influenced by aging andthe development of cataract, causing shifts in the spectral distri-bution of light reflected by blood. Individual difference in pig-mentation of the retinal pigment epithelium below the bloodvessels also influence the spectrum of reflected light. Finally,across examinations, even from the same subject, differencesin flash intensity, flash spectrum, nonlinear optical distortionsof the camera, flash artifacts, and focus also cause considerablevariability. These factors complicate classification substantially,and normalization to zero mean and unit standard deviation ofthe vessel color features for every individual image is thereforeimportant for successful classification. After sampling the fea-tures for each centerline pixel, the appropriate labels were as-signed based on the reference standard and all training sampleswere stored in a training dataset. This sampling process was re-peated for all images in the training set.
The training set was then split into a separate classifier se-lection training and test set. An extensive comparison of sev-eral different classifiers was performed using these two sets:
-nearest neighbor classifier, support vector machine classifier,linear discriminant classifier, and a quadratic discriminant clas-sifier. The classifier that maximized the area under the receiveroperator characteristic (ROC) curve [27] was selected. For eachexperiment the features were normalized to zero mean and unitstandard deviation. Note that this is a normalization across alltraining samples (i.e., images) and is different from the normal-ization of the color features that is performed for each trainingimage individually. In this preliminary experiment the lineardiscriminant classifier showed the best results. Feature selectiondecreased performance on the training set, so the complete setof features was used for the experiment on the test data.
2) Applying the AV Classification to Unseen Data: Afterthe one time training phase was finished, the trained classifierwas applied to the images in the test set. All the test imageswere first preprocessed similarly to the training images. Foreach centerline pixel the complete set of 27 features was ex-tracted. The trained classifier was then used to assign a soft label
. Here, a label close to 0 meant the pixel was likelyin an artery and a label close to 1 meant a pixel was likely ina vein (see Fig. 4 for an example). We assumed that all pixelsin a vessel segment are either in an artery or a vein. Each soft
1946 IEEE TRANSACTIONS ON MEDICAL IMAGING, VOL. 30, NO. 11, NOVEMBER 2011
label assigned to a centerline pixel can be regarded as a vote forthe label of the complete segment. Combining these votes canbe done in many different ways but we have found, using pre-liminary experiments on the training set, that taking the medianlabel for the entire vessel segment works well.
Due to variation in the local image characteristics, the soft la-bels assigned to each of the segments can vary over the image.A global threshold will not always successfully separate the ar-teries from the veins within a single subject and will vary be-tween subjects. To perform the final classification we used theprior knowledge that arteries and veins usually come in pairs.This means that, when going around the optic disc in a circle inregion B of the ROI, one will generally encounter an artery afterfirst encountering a vein and vice versa. Since this rule does notalways hold and finding the matching vessel segment for a par-ticular different vessel segment is nontrivial, we propose to usea voting procedure.
During this procedure, all vessel segments intersecting witha circle of a certain diameter around the optic disc and withinregion B of the ROI were eligible for matching. Finding thenearest neighbor vessel segment on a circle is straightforward,this can be done by finding the nearest intersection point on thecircle. The soft AV labels of both points were compared and thevessel segment with the highest soft label received a vote for“vein” and the other received an “artery” vote. Then the nextnearest unpaired vessel was selected and the procedure was re-peated. It is obvious that the outcome of this procedure is de-pendent on the starting vessel segment. By picking a differentvessel segment as the starting segment, the distribution of theAV votes amongst the vessel segments will vary. All vessel seg-ments eligble for matching were therefore selected once as thestarting vessel and the matching procedure was repeated. Fi-nally, the votes were counted and each of the vessel segmentswas assigned a hard label (i.e., either artery or vein based on thereceived votes). Vessel segments with a equal number of arteryand vein votes were excluded from the analysis.
D. Calculating the AVR
The arteriolar to venular ratio is defined aswhere CRAE is the Central Retinal Artery
Equivalent and CRVE is the Central Retinal Vein Equivalent.To calculate these numbers, Knudtson et al. [15] describe aniterative process for matching up vessels and calculating theCRAE and CRVE. The widest six veins and arteries (these donot have to be paired) are entered although fewer total numberof widths can be used in case not enough measurement pointsare available. Algorithm 1 shows how we implemented thisprocedure.
The proposed automated method supplements the manualprocedure, outlined in the previous paragraph, with severalimportant steps. This is needed to deal with the fact that thefinal voting procedure as described in Section II-C2 is based onmeasurements obtained on a circle with a certain diameter. Thechance that all vessel segments in the ROI will intersect witha single circle of any particular diameter is small. Therefore,the voting procedure and AVR calculation should be repeated
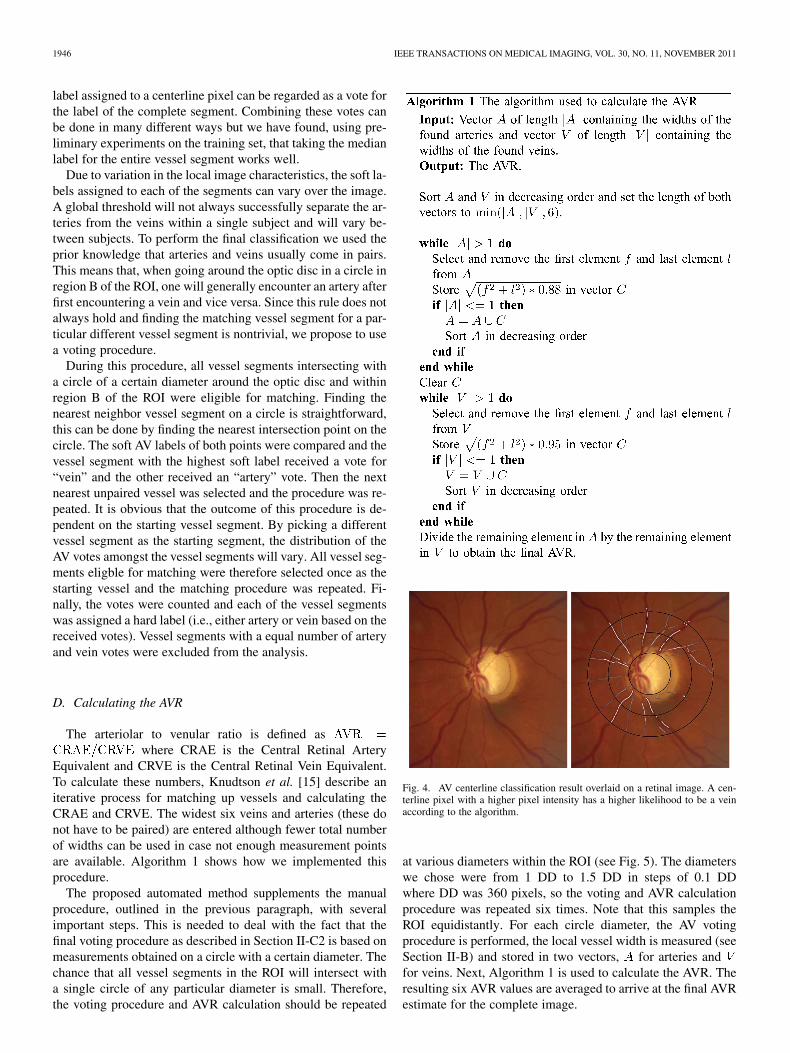
Fig. 4. AV centerline classification result overlaid on a retinal image. A cen-terline pixel with a higher pixel intensity has a higher likelihood to be a veinaccording to the algorithm.
at various diameters within the ROI (see Fig. 5). The diameterswe chose were from 1 DD to 1.5 DD in steps of 0.1 DDwhere DD was 360 pixels, so the voting and AVR calculationprocedure was repeated six times. Note that this samples theROI equidistantly. For each circle diameter, the AV votingprocedure is performed, the local vessel width is measured (seeSection II-B) and stored in two vectors, for arteries andfor veins. Next, Algorithm 1 is used to calculate the AVR. Theresulting six AVR values are averaged to arrive at the final AVRestimate for the complete image.

NIEMEIJER et al.: AUTOMATED MEASUREMENT OF THE ARTERIOLAR-TO-VENULAR WIDTH RATIO 1947
Fig. 5. Detail of a fundus photograph showing the measurement diameters andthe vessel crossings where width measurements are obtained. The white dotsindicate the points on the vessels where measurements are obtained.
III. MATERIALS
Sixty-five digital color fundus photographs were acquired fortraining and testing of the system. All images were obtainedfrom patients with primary open angle glaucoma at the Uni-versity of Iowa Hospitals and Clinics using a 30 Zeiss funduscamera (Carl Zeiss Meditec, Dublin, CA), with digital back(OIS systems, Sacramento, CA). The images were centered onthe disc. The dimensions of the images are 2392 2048 pixelswith 8-bits per pixel per color plane, and stored in JPEG formatfor export. To train the AV classification component and deter-mine the parameters for the algorithm, 25 digital color fundusphotographs were randomly selected from the set of 65. The re-maining 40 images were assigned to the test set and were onlyused to evaluate the complete system.
An ophthalmologist (AVD) labeled the major vessels in theimages of the training set as either artery or vein to train theartery vein classification method. As only the vessel center-lines needed to be labeled, precise vessel segmentation was notneeded. Labeling was done by manually drawing a line overthe major vessels using a standard painting program. The colorsblue and red were used for veins and arteries respectively.
Two components of the presented method were evaluated onthe test images: the AV classification and the AVR determina-tion. To evaluate the AV classification, the vessels in each of theimages in the test set were manually labeled as either artery orvein by an ophthalmologist (AVD). In contrast to the way themajor arteries and veins were labeled in the training set, onlythose parts of all vessels (i.e., including the small vessels) thatwere inside the ROI were labeled in the test set. We asked theexpert to label all vessels in the ROI as either an artery or a vein.
To set the AVR reference standard, a semi-automated com-puter program developed by the University of Wisconsin,Madison, was used (IVAN). We asked two ophthalmologiststo process the images in the test set using this software. Bothophthalmologists were instructed in the use of the softwareusing the protocols defined by the software developers. IVANfinds the optic disc and places the AVR measurement ROI on
Fig. 6. ROC curve of the proposed system for assigning centerline pixels toeither artery or vein class. Area under the curve is 0.84.
the image. It then finds vessels in the image and labels each ofthese as artery or vein. It also attempts to measure the vesselwidth. IVAN is semi-automated; the ROI localization, the vesselwidth measurements and the artery vein classification needmanual adjustment. On average a human observer takes around10 minutes per image to perform the analysis. The softwareis capable of producing several different AVR measures. Weselected “Big 6” as this one corresponds to the AVR describedin [15]. The ratios obtained by the first ophthalmologist (MDA)were used as the reference standard and the second ophthal-mologist’s (AVD) ratios were used to determine the variabilitybetween experts.
The 40 images in our test set have been made publicly avail-able on the internet in the Iowa Normative Set for ProcessingImages of the REtina (INSPIRE-AVR) [28]. Included with IN-SPIRE-AVR are the AVR values we measured using IVAN, ourreference standard.
IV. EXPERIMENTS AND RESULTS
The proposed system was applied to all 40 test images. Thesystem was able to find the optic disc and successfully placedthe AVR in all 40 images. This was verified by visual inspectionand the ROI was centered on the optic disc in all 40 images.
To compare the artery/vein classification with the labeling bythe human expert we performed an ROC analysis with class 0(the “negative” class) being artery and class 1 (the “positive”class) being vein. Note that this analysis was performed on thevessel centerline pixels only. The proposed classification systemassigned each centerline pixel a value indicating the likelihoodthat it was inside of a vein. That is, a value of 0 indicates a cen-terline pixel likely inside an artery and a value of 1 indicatesa centerline pixel likely in a vein. The ROC curve is shown inFig. 6. The system attained an area under the ROC curve of 0.84.
1948 IEEE TRANSACTIONS ON MEDICAL IMAGING, VOL. 30, NO. 11, NOVEMBER 2011
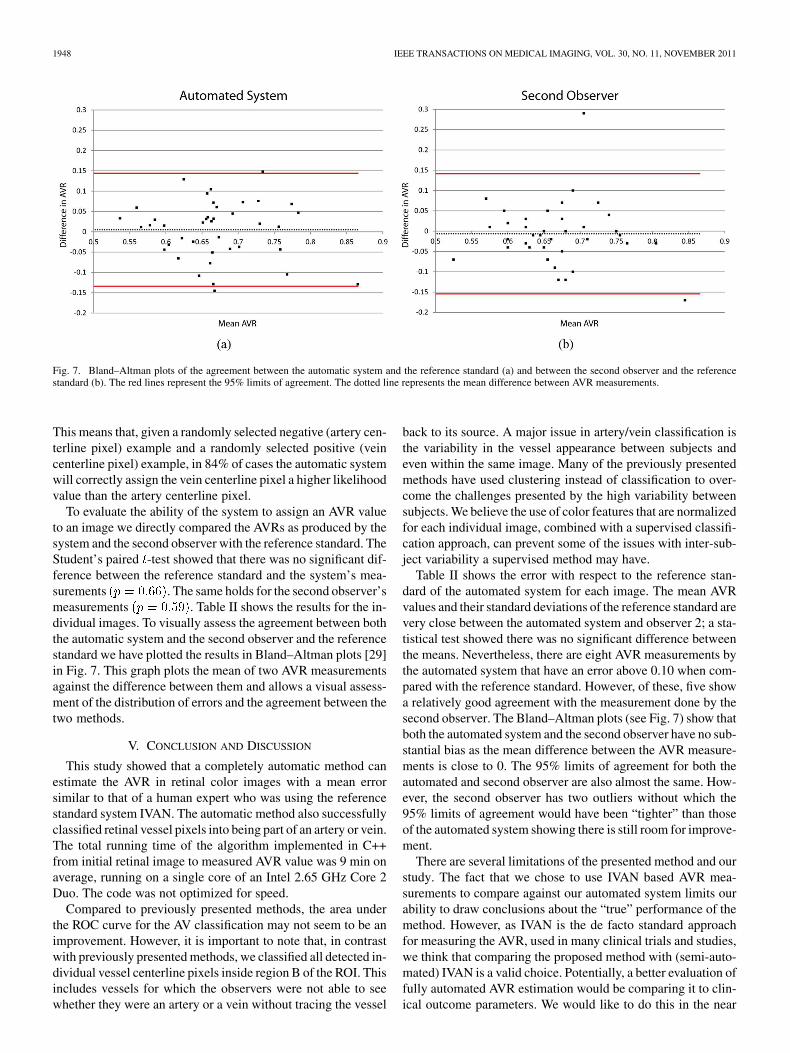
Fig. 7. Bland–Altman plots of the agreement between the automatic system and the reference standard (a) and between the second observer and the referencestandard (b). The red lines represent the 95% limits of agreement. The dotted line represents the mean difference between AVR measurements.
This means that, given a randomly selected negative (artery cen-terline pixel) example and a randomly selected positive (veincenterline pixel) example, in 84% of cases the automatic systemwill correctly assign the vein centerline pixel a higher likelihoodvalue than the artery centerline pixel.
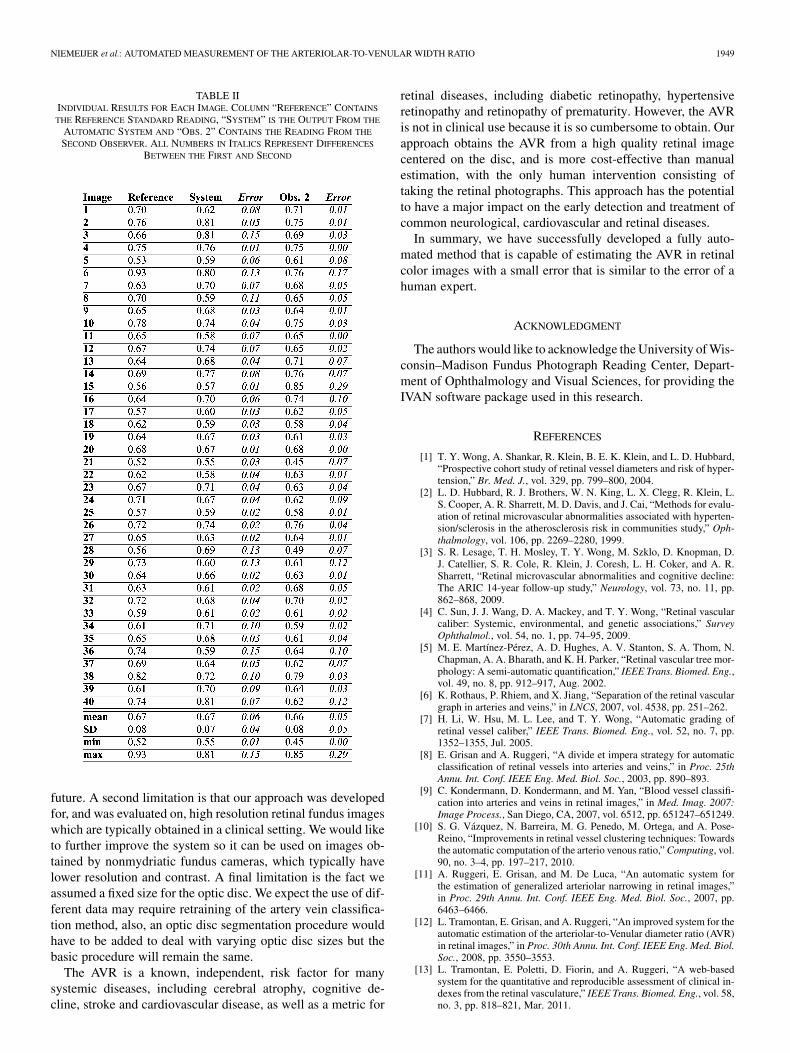
To evaluate the ability of the system to assign an AVR valueto an image we directly compared the AVRs as produced by thesystem and the second observer with the reference standard. TheStudent’s paired -test showed that there was no significant dif-ference between the reference standard and the system’s mea-surements . The same holds for the second observer’smeasurements . Table II shows the results for the in-dividual images. To visually assess the agreement between boththe automatic system and the second observer and the referencestandard we have plotted the results in Bland–Altman plots [29]in Fig. 7. This graph plots the mean of two AVR measurementsagainst the difference between them and allows a visual assess-ment of the distribution of errors and the agreement between thetwo methods.
V. CONCLUSION AND DISCUSSION
This study showed that a completely automatic method canestimate the AVR in retinal color images with a mean errorsimilar to that of a human expert who was using the referencestandard system IVAN. The automatic method also successfullyclassified retinal vessel pixels into being part of an artery or vein.The total running time of the algorithm implemented in C++from initial retinal image to measured AVR value was 9 min onaverage, running on a single core of an Intel 2.65 GHz Core 2Duo. The code was not optimized for speed.
Compared to previously presented methods, the area underthe ROC curve for the AV classification may not seem to be animprovement. However, it is important to note that, in contrastwith previously presented methods, we classified all detected in-dividual vessel centerline pixels inside region B of the ROI. Thisincludes vessels for which the observers were not able to seewhether they were an artery or a vein without tracing the vessel
back to its source. A major issue in artery/vein classification isthe variability in the vessel appearance between subjects andeven within the same image. Many of the previously presentedmethods have used clustering instead of classification to over-come the challenges presented by the high variability betweensubjects. We believe the use of color features that are normalizedfor each individual image, combined with a supervised classifi-cation approach, can prevent some of the issues with inter-sub-ject variability a supervised method may have.
Table II shows the error with respect to the reference stan-dard of the automated system for each image. The mean AVRvalues and their standard deviations of the reference standard arevery close between the automated system and observer 2; a sta-tistical test showed there was no significant difference betweenthe means. Nevertheless, there are eight AVR measurements bythe automated system that have an error above 0.10 when com-pared with the reference standard. However, of these, five showa relatively good agreement with the measurement done by thesecond observer. The Bland–Altman plots (see Fig. 7) show thatboth the automated system and the second observer have no sub-stantial bias as the mean difference between the AVR measure-ments is close to 0. The 95% limits of agreement for both theautomated and second observer are also almost the same. How-ever, the second observer has two outliers without which the95% limits of agreement would have been “tighter” than thoseof the automated system showing there is still room for improve-ment.
There are several limitations of the presented method and ourstudy. The fact that we chose to use IVAN based AVR mea-surements to compare against our automated system limits ourability to draw conclusions about the “true” performance of themethod. However, as IVAN is the de facto standard approachfor measuring the AVR, used in many clinical trials and studies,we think that comparing the proposed method with (semi-auto-mated) IVAN is a valid choice. Potentially, a better evaluation offully automated AVR estimation would be comparing it to clin-ical outcome parameters. We would like to do this in the near
NIEMEIJER et al.: AUTOMATED MEASUREMENT OF THE ARTERIOLAR-TO-VENULAR WIDTH RATIO 1949
TABLE IIINDIVIDUAL RESULTS FOR EACH IMAGE. COLUMN “REFERENCE” CONTAINS
THE REFERENCE STANDARD READING, “SYSTEM” IS THE OUTPUT FROM THE
AUTOMATIC SYSTEM AND “OBS. 2” CONTAINS THE READING FROM THE
SECOND OBSERVER. ALL NUMBERS IN ITALICS REPRESENT DIFFERENCES
BETWEEN THE FIRST AND SECOND
future. A second limitation is that our approach was developedfor, and was evaluated on, high resolution retinal fundus imageswhich are typically obtained in a clinical setting. We would liketo further improve the system so it can be used on images ob-tained by nonmydriatic fundus cameras, which typically havelower resolution and contrast. A final limitation is the fact weassumed a fixed size for the optic disc. We expect the use of dif-ferent data may require retraining of the artery vein classifica-tion method, also, an optic disc segmentation procedure wouldhave to be added to deal with varying optic disc sizes but thebasic procedure will remain the same.
The AVR is a known, independent, risk factor for manysystemic diseases, including cerebral atrophy, cognitive de-cline, stroke and cardiovascular disease, as well as a metric for
retinal diseases, including diabetic retinopathy, hypertensiveretinopathy and retinopathy of prematurity. However, the AVRis not in clinical use because it is so cumbersome to obtain. Ourapproach obtains the AVR from a high quality retinal imagecentered on the disc, and is more cost-effective than manualestimation, with the only human intervention consisting oftaking the retinal photographs. This approach has the potentialto have a major impact on the early detection and treatment ofcommon neurological, cardiovascular and retinal diseases.
In summary, we have successfully developed a fully auto-mated method that is capable of estimating the AVR in retinalcolor images with a small error that is similar to the error of ahuman expert.
ACKNOWLEDGMENT
The authors would like to acknowledge the University of Wis-consin–Madison Fundus Photograph Reading Center, Depart-ment of Ophthalmology and Visual Sciences, for providing theIVAN software package used in this research.
REFERENCES
[1] T. Y. Wong, A. Shankar, R. Klein, B. E. K. Klein, and L. D. Hubbard,“Prospective cohort study of retinal vessel diameters and risk of hyper-tension,” Br. Med. J., vol. 329, pp. 799–800, 2004.
[2] L. D. Hubbard, R. J. Brothers, W. N. King, L. X. Clegg, R. Klein, L.S. Cooper, A. R. Sharrett, M. D. Davis, and J. Cai, “Methods for evalu-ation of retinal microvascular abnormalities associated with hyperten-sion/sclerosis in the atherosclerosis risk in communities study,” Oph-thalmology, vol. 106, pp. 2269–2280, 1999.
[3] S. R. Lesage, T. H. Mosley, T. Y. Wong, M. Szklo, D. Knopman, D.J. Catellier, S. R. Cole, R. Klein, J. Coresh, L. H. Coker, and A. R.Sharrett, “Retinal microvascular abnormalities and cognitive decline:The ARIC 14-year follow-up study,” Neurology, vol. 73, no. 11, pp.862–868, 2009.
[4] C. Sun, J. J. Wang, D. A. Mackey, and T. Y. Wong, “Retinal vascularcaliber: Systemic, environmental, and genetic associations,” SurveyOphthalmol., vol. 54, no. 1, pp. 74–95, 2009.
[5] M. E. Martínez-Pérez, A. D. Hughes, A. V. Stanton, S. A. Thom, N.Chapman, A. A. Bharath, and K. H. Parker, “Retinal vascular tree mor-phology: A semi-automatic quantification,” IEEE Trans. Biomed. Eng.,vol. 49, no. 8, pp. 912–917, Aug. 2002.
[6] K. Rothaus, P. Rhiem, and X. Jiang, “Separation of the retinal vasculargraph in arteries and veins,” in LNCS, 2007, vol. 4538, pp. 251–262.
[7] H. Li, W. Hsu, M. L. Lee, and T. Y. Wong, “Automatic grading ofretinal vessel caliber,” IEEE Trans. Biomed. Eng., vol. 52, no. 7, pp.1352–1355, Jul. 2005.
[8] E. Grisan and A. Ruggeri, “A divide et impera strategy for automaticclassification of retinal vessels into arteries and veins,” in Proc. 25thAnnu. Int. Conf. IEEE Eng. Med. Biol. Soc., 2003, pp. 890–893.
[9] C. Kondermann, D. Kondermann, and M. Yan, “Blood vessel classifi-cation into arteries and veins in retinal images,” in Med. Imag. 2007:Image Process., San Diego, CA, 2007, vol. 6512, pp. 651247–651249.
[10] S. G. Vázquez, N. Barreira, M. G. Penedo, M. Ortega, and A. Pose-Reino, “Improvements in retinal vessel clustering techniques: Towardsthe automatic computation of the arterio venous ratio,” Computing, vol.90, no. 3–4, pp. 197–217, 2010.
[11] A. Ruggeri, E. Grisan, and M. De Luca, “An automatic system forthe estimation of generalized arteriolar narrowing in retinal images,”in Proc. 29th Annu. Int. Conf. IEEE Eng. Med. Biol. Soc., 2007, pp.6463–6466.
[12] L. Tramontan, E. Grisan, and A. Ruggeri, “An improved system for theautomatic estimation of the arteriolar-to-Venular diameter ratio (AVR)in retinal images,” in Proc. 30th Annu. Int. Conf. IEEE Eng. Med. Biol.Soc., 2008, pp. 3550–3553.
[13] L. Tramontan, E. Poletti, D. Fiorin, and A. Ruggeri, “A web-basedsystem for the quantitative and reproducible assessment of clinical in-dexes from the retinal vasculature,” IEEE Trans. Biomed. Eng., vol. 58,no. 3, pp. 818–821, Mar. 2011.
1950 IEEE TRANSACTIONS ON MEDICAL IMAGING, VOL. 30, NO. 11, NOVEMBER 2011
[14] L. D. Hubbard, R. J. Brothers, W. N. King, L. X. Clegg, R. Klein, L.S. Cooper, A. R. Sharrett, M. D. Davis, and J. Cai, “Methods for evalu-ation of retinal microvascular abnormalities associated with hyperten-sion/sclerosis in the atherosclerosis risk in communities study,” Oph-thalmology, vol. 106, no. 12, pp. 2269–2280, 1999.
[15] M. D. Knudtson, K. E. Lee, L. D. Hubbard, T. Y. Wong, R. Klein,and B. E. K. Klein, “Revised formulas for summarizing retinal vesseldiameters,” Curr. Eye Res, vol. 27, no. 3, pp. 143–149, 2003.
[16] M. Niemeijer, M. D. Abràmoff, and B. van Ginneken, “Informationfusion for diabetic retinopathy cad in digital color fundus photographs,”IEEE Trans. Med. Imag., vol. 28, no. 5, pp. 775–785, May 2009.
[17] M. Niemeijer, J. J. Staal, B. van Ginneken, M. Loog, and M. D. Abrà-moff, “Comparative study of retinal vessel segmentation methods ona new publicly available database,” in Proc. SPIE: Med. Imag., 2004,vol. 5370, pp. 648–656.
[18] S. Arya, D. M. Mount, N. S. Netanyahu, R. Silverman, and A. Y. Wu,“An optimal algorithm for approximate nearest neighbor searching infixed dimensions,” J. ACM, vol. 45, no. 6, pp. 891–923, 1998.
[19] J. Staal, M. Abràmoff, M. Niemeijer, M. Viergever, and B. van Gin-neken, “Ridge based vessel segmentation in color image of the retina,”IEEE Trans. Med. Imag., vol. 23, no. 4, pp. 501–509, Apr. 2004.
[20] M. Ahmed and R. Ward, “A rotation invariant rule-based thinning al-gorithm for character recognition,” IEEE Trans. Pattern Anal. Mach.Intell., vol. 24, no. 12, pp. 1672–1678, Dec. 2002.
[21] P. I. Rockett, “An improved rotation-invariant thinning algorithm,”IEEE Trans. Pattern Anal. Mach. Intell., vol. 27, no. 10, pp. 1671–1674,Oct. 2005.
[22] M. Niemeijer, M. D. Abràmoff, and B. van Ginneken, “Fast detectionof the optic disc and fovea in color fundus photographs,” Med. ImageAnal., vol. 13, no. 6, pp. 859–870, 2009.
[23] J. Fairfield, “Toboggan contrast enhancement for contrast segmenta-tion,” in Proc. Int. Conf. Pattern Recognit., 1990, pp. 712–716.
[24] X. Yao and Y. Hung, “Fast image segmentation by sliding in the deriva-tive terrain,” in Proc. SPIE Conf. Intell. Robots Computer Vision X: Al-gorithms Techn., 1991, pp. 369–379.
[25] E. Mortensen, “Simultaneous multi-frame subpixel boundary defini-tion using Toboggan-based intelligent scissors for image and movieediting,” Ph.D. dissertation, Brigham Young Univ., Provo, UT, 2000.
[26] M. Niemeijer, B. van Ginneken, and M. Abràmoff, “Automaticclassification of retinal vessels into arteries and veins,” in MedicalImaging 2009: Computer-Aided Diagnosis, 2009, vol. 7260, pp.72601F–72601F.
[27] C. E. Metz, “ROC methodology in radiologic imaging,” InvestigativeRadiol., vol. 21, no. 9, pp. 720–733, 1986.
[28] INSPIRE-AVR: Iowa normative set for processing images of the retina-artery vein ratio [Online]. Available: http://webeye.ophth.uiowa.edu/component/k2/item/270
[29] J. M. Bland and D. G. Altman, “Measuring agreement in method com-parison studies,” Stat. Methods Med. Res., vol. 8, no. 2, pp. 135–160,1999.