Twenty-five years of change in southern African passerine diversity: non-climatic factors of change
21
Accepted Article This article has been accepted for publication and undergone full peer review but has not been through the copyediting, typesetting, pagination and proofreading process, which may lead to differences between this version and the Version of Record. Please cite this article as doi: 10.1111/gcb.12909 This article is protected by copyright. All rights reserved. Received Date : 14-Nov-2014 Accepted Date : 16-Feb-2015 Article type : Primary Research Articles Twenty-five years of change in southern African passerine diversity: non- climatic factors of change Guillaume Péron (1)* Res Altwegg (1,2) (1) Department of Statistical Sciences, University of Cape Town, Rondebosch 7701, Cape Town, South Africa (2) African Climate and Development Initiative, University of Cape Town, Rondebosch 7701, South Africa * corresponding author: [email protected] Running title: Mapping change in southern African passerine diversity Key-words: Biodiversity; Occupancy models; Citizen Science; Conservation planning; Species richness; Bush Encroachment; Pesticide Accumulation; Climate Change; South Africa Abstract We analysed more than 25 years of change in passerine bird distribution in South Africa, Swaziland and Lesotho, in order to show that species distributions can be influenced by processes that are at least in part independent of the local strength and direction of climate change: land use and ecological succession. We used occupancy models that separate species’ detection from species’ occupancy probability, fitted to citizen science data from both phases of the Southern African Bird Atlas Project (1987-1996 and 2007-2013). Temporal trends in species’ occupancy probability were interpreted in terms of local
-
Upload
independent -
Category
Documents
-
view
0 -
download
0
Transcript of Twenty-five years of change in southern African passerine diversity: non-climatic factors of change

Acc
epte
d A
rtic
le
This article has been accepted for publication and undergone full peer review but has not
been through the copyediting, typesetting, pagination and proofreading process, which may
lead to differences between this version and the Version of Record. Please cite this article as
doi: 10.1111/gcb.12909
This article is protected by copyright. All rights reserved.
Received Date : 14-Nov-2014
Accepted Date : 16-Feb-2015
Article type : Primary Research Articles
Twenty-five years of change in southern African passerine diversity: non-
climatic factors of change
Guillaume Péron (1)*
Res Altwegg (1,2)
(1) Department of Statistical Sciences, University of Cape Town, Rondebosch 7701, Cape
Town, South Africa
(2) African Climate and Development Initiative, University of Cape Town, Rondebosch
7701, South Africa
* corresponding author: [email protected]
Running title: Mapping change in southern African passerine diversity
Key-words: Biodiversity; Occupancy models; Citizen Science; Conservation planning;
Species richness; Bush Encroachment; Pesticide Accumulation; Climate Change; South
Africa
Abstract
We analysed more than 25 years of change in passerine bird distribution in South Africa,
Swaziland and Lesotho, in order to show that species distributions can be influenced by
processes that are at least in part independent of the local strength and direction of climate
change: land use and ecological succession. We used occupancy models that separate
species’ detection from species’ occupancy probability, fitted to citizen science data from
both phases of the Southern African Bird Atlas Project (1987-1996 and 2007-2013).
Temporal trends in species’ occupancy probability were interpreted in terms of local
Acc
epte
d A
rtic
le
This article is protected by copyright. All rights reserved.
extinction/colonisation and temporal trends in detection probability were interpreted in terms
of change in abundance. We found for the first time at this scale that, as predicted in the
context of bush encroachment, closed savanna specialists increased where open savanna
specialists decreased. In addition, the trend in the abundance of species a priori thought to be
favoured by agricultural conversion was negatively correlated with human population
density, which is in line with hypotheses explaining the decline in farmland birds in the
Northern Hemisphere. In addition to climate, vegetation cover and the intensity and time
since agricultural conversion constitute important predictors of biodiversity changes in the
region. Their inclusion will improve the reliability of predictive models of species
distribution.
Introduction
Human encroachment upon natural landscapes imposes huge pressure on ecosystems
(Vitousek, 1997; Foley et al., 2005). Much effort is therefore currently going into predicting
the consequences of anthropogenic global change on biodiversity and particularly on species
distributions. Here we focus on factors of variation with direct effect on animal species
distribution but limited or indirect links to climate: land use and ecological succession.
Ecological succession can follow land use change (e.g., farmland abandonment; Sirami et al.,
2006), or happen in conjunction with climate change (e.g., if climate change induces an
ecological regime shift; Scheffer and Carpenter, 2003), and is known to drastically modify
vegetation cover at the continental scale and within a few decades (Chazdon et al., 2007).
Land use change can be even faster and affect large tracts of land over mere months or years
(Achard et al., 2002). By contrast, we may expect climate change and its effect on species’
distributions to be more gradual (see however Pearson & Dawson, 2003; Thuiller et al.,
Acc
epte
d A
rtic
le
This article is protected by copyright. All rights reserved.
2004). The role of land use and ecological succession may, thereby, explain discrepancies
between range shifts and climate change, such as the decoupling between the poleward shift
in the wintering range of North American birds and the concomitant increase in winter
temperatures (La Sorte & Jetz, 2012).
We analysed more than 25 years of change in passerine bird distributions in South
Africa and neighboring countries. We confronted these observed changes with three
theoretical predictions. First, due to a combination of change in farming practices and
atmospheric CO2 concentration, woody vegetation has been encroaching upon grasslands in
the region (Wigley et al., 2010; Buitenwerf et al., 2012; Parr et al., 2012). This phenomenon
is occurring both within the Grassland Biome (which is becoming more heterogeneous) and
at the transition with the Savanna Biome (which is shifting towards the centre of the
Grassland Biome). We predicted (prediction 1) that bird species adapted to mosaic
landscapes of grassland and savanna should decline locally and see their distribution shift as
such mosaics change into increasingly pure savanna, whereas in the same locations the
abundance of woodland species should increase as more habitat becomes available for them
(Harrison et al., 1997; Seymour & Dean, 2009; Sirami & Monadjem, 2012). Second, the
region underwent an accelerating anthropization in the last century (Niedertscheider et al.,
2012). Arable lands have been converted to irrigated agriculture, dams have been built and
commercial forests planted, all of which is expected to favour some bird species at the
expense of others (Hockey et al., 2011). Based on what is currently happening in the
Northern Hemisphere, pesticide accumulation in anthropized areas could also cause declines
in the species that utilize these landscapes (Donald et al., 2001; Hart et al., 2006; Mineau &
Whiteside, 2013; Hallmann et al., 2014). We translated these two mechanisms into
predictions about expected patterns of change in South African bird distribution as follows:
prediction 2: species adapted to cultivated land should increase in range overall; and

Acc
epte
d A
rtic
le
This article is protected by copyright. All rights reserved.
prediction 3: their abundance should not increase monotonically with the intensity of land
use; rather, their abundance should decrease after a threshold of land use intensity or time
since agricultural conversion. To address our three predictions, we estimated spatially-
explicit, species-specific rates of distribution change (colonization and extinction
probabilities), and population trend (change in abundance), for 191 widespread South African
passerine bird species. We used occupancy models that accommodate imperfect sampling,
i.e., the fact that sampling effort is not independent from environmental factors, and that the
observed biodiversity is a subset of the total biodiversity.
Material and Methods
Citizen-science and occupancy models
By harnessing the sampling effort of thousands of participants, citizen-science projects can
sample the spatial distribution of large suites of species at large spatial scales and fine
resolution, making it possible to study the correlation between species’ attributes and their
range dynamics. However, citizen-science databases come with inherent problems
(Dickinson et al., 2010; Bonney et al., 2014). First, sampling effort is necessarily biased
towards areas where citizen scientists live, have access to, or prefer to go. It is for example
conceivable that as awareness of climate change increased among data contributors, sampling
effort increased along purported colonisation fronts for temperature-limited species. Second,
some species always go undetected during surveys and observed species richness is a fraction
of true species richness. Species’ detection probability can in particular depend on their local
population density. Both issues (spatially-biased sampling effort and imperfect detection) are
hereafter collectively referred to as imperfect sampling.
The Southern African Bird Atlas Project or SABAP (http://sabap2.adu.org.za/;
Harrison et al., 1997) provides extensive information about bird distributions in South Africa,

Acc
epte
d A
rtic
le
This article is protected by copyright. All rights reserved.
Lesotho and Swaziland (South Africa hereafter), as well as Namibia, Botswana and
Zimbabwe. We used the data from between Jan. 1, 1987 and Dec. 31, 1991 (first phase or
SABAP1) and between June 1, 2007 and Oct. 5, 2013 (second phase or SABAP2, which is
still ongoing after our cut-off date). During the first phase, South Africa was divided into
2025 quarter degree grid cells (each cell ca. 25 × 25 km). During the second phase, each
quarter degree grid cell was further divided into 5’×5’grid cells. For this study we aggregated
the data of the second phase at the quarter degree resolution in order to be able to compare
both phases. Birders were asked to submit lists of all species that they saw or heard during
two hour or longer visits to the grid cells. By doing so, they also provided information about
the species they did not see or hear. In addition, birders were allowed to add further sightings
that they made in a grid cell up to five days after the initial list was compiled. We restricted
our analysis to the 191 passerine species reported in more than 2% of SABAP checklists
(excluding Palearctic migrants and introduced species).
To accommodate imperfect sampling in SABAP data, we designed occupancy models.
Occupancy models are state-space models that use detections / non-detection data, replicated
across space and/or time, to separate species’ occupancy probability from detection
probability (MacKenzie et al., 2006; Bled et al., 2013; Péron & Altwegg, 2015). Briefly, we
denote the probability that a given grid cell is occupied by a given species and p the
probability that this species is detected in the grid cell if it occupies it. For any given visit by
a SABAP contributor to the focal grid cell, the data for the focal species is if the
species is detected, otherwise, and in a single-season, single-species occupancy model
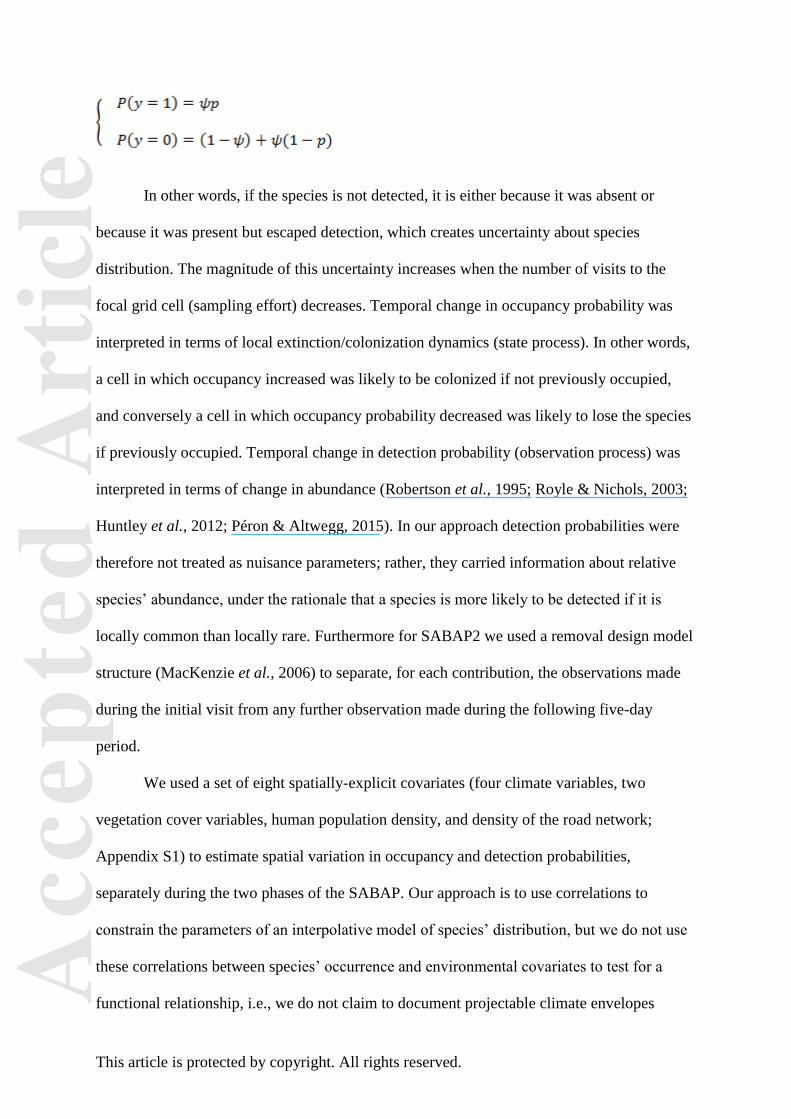
the probability of recording observation bit y is:
Acc
epte
d A
rtic
le
This article is protected by copyright. All rights reserved.
In other words, if the species is not detected, it is either because it was absent or
because it was present but escaped detection, which creates uncertainty about species
distribution. The magnitude of this uncertainty increases when the number of visits to the
focal grid cell (sampling effort) decreases. Temporal change in occupancy probability was
interpreted in terms of local extinction/colonization dynamics (state process). In other words,
a cell in which occupancy increased was likely to be colonized if not previously occupied,
and conversely a cell in which occupancy probability decreased was likely to lose the species
if previously occupied. Temporal change in detection probability (observation process) was
interpreted in terms of change in abundance (Robertson et al., 1995; Royle & Nichols, 2003;
Huntley et al., 2012; Péron & Altwegg, 2015). In our approach detection probabilities were
therefore not treated as nuisance parameters; rather, they carried information about relative
species’ abundance, under the rationale that a species is more likely to be detected if it is
locally common than locally rare. Furthermore for SABAP2 we used a removal design model
structure (MacKenzie et al., 2006) to separate, for each contribution, the observations made
during the initial visit from any further observation made during the following five-day
period.
We used a set of eight spatially-explicit covariates (four climate variables, two
vegetation cover variables, human population density, and density of the road network;
Appendix S1) to estimate spatial variation in occupancy and detection probabilities,
separately during the two phases of the SABAP. Our approach is to use correlations to
constrain the parameters of an interpolative model of species’ distribution, but we do not use
these correlations between species’ occurrence and environmental covariates to test for a
functional relationship, i.e., we do not claim to document projectable climate envelopes
Acc
epte
d A
rtic
le
This article is protected by copyright. All rights reserved.
(Beale et al., 2008). We did not use a multi-season parameterisation of occupancy models
(MacKenzie et al., 2003) because the data were sparse across large regions and with only two
“seasons” (i.e., two SABAP phases), the added complexity of the multi-season
parameterisation did not bring any clear benefits for our purpose. We used a parametric
bootstrap with 150 replicates to compute a standard error for all the spatially-explicit metrics
used in this study.
Spatial predictions with occupancy models: a few caveats
Like many other species distribution modelling efforts, we used the available detection/non-
detection data to extrapolate and interpolate to areas that were not sampled by SABAP
contributors. We did that while allowing for the fact that species can go undetected in places
where they actually occur, i.e., non-detection does not always mean absence (Altwegg et al.,
2008). Unfortunately, when detection probability is low, relatively dense non-detection data
(many non-detection events for the same set of covariate values) may be required to conclude
that a species is truly absent rather than present but not detected. This can obviously limit the
power of the inference compared to an analysis that would ignore the risk of bias associated
with imperfect sampling. Furthermore, the parameters of occupancy models have a finite
domain of definition, i.e., where a species is absent, its detection probability is not defined,
and conversely where a species has a zero detection probability it is not possible to directly
estimate whether it is present. All of the above can lead to uninformative estimates; typically,
occupancy probability can locally reach the boundary one where detection probability is
locally at boundary zero, meaning the species is estimated as occurring in the area, but
impossible to detect. Unfortunately, these boundary values do not necessarily have wide
confidence intervals (as estimated by parametric bootstrap), which could have been used to
identify problematic values. We dealt with this problem by working with the product of
occupancy and detection probabilities, which we term “recording probability”. Recording
Acc
epte
d A
rtic
le
This article is protected by copyright. All rights reserved.
probability is the probability that a species occurs in a grid cell and is recorded during any
visit by a SABAP contributor and we interpret it as an index of abundance. As an alternative
to the use of recording probability, we selected a cut-off value of 33% occupancy probability.
Below this cutoff value an area was considered as not belonging to the area of regular
presence of the species. We defined “cut-off detection probability” as the spatially-explicit
variable with value zero if the species has an occupancy probability below 33%, and equal to
the species’ detection probability otherwise. A preliminary analysis of the sensitivity to the
choice of cut-off value (between 10 and 50%) found no qualitative effect on the conclusions
in this article. Earlier studies have used reporting rates, i.e. the proportion of checklists that
report a species, as a measure of that species’ abundance (Robertson et al., 1995; Huntley et
al., 2012). Compared to this earlier approach, our two metrics (recording probability and cut-
off detection probability) present the advantage that they account for variation in sampling
effort and detection probability more naturally, and allow the separate modelling of species’
presence and abundance.
Predictions: non-climatic factors of change in passerine distribution
To test prediction 1, we categorized species into four classes of habitat preference, based on
information in Roberts Birds of Southern Africa, 7th
edition (Hockey et al., 2005). This
textbook provides habitat association information using categorical variables ranging from 0
to 4 (0: the species never uses the habitat; 4: primary habitat for the species). Category 1
represented specialists of closed savanna and woodlands (in Roberts textbook: ranked as 4 for
their use of savanna, forest or thicket, and 2 or lower for their use of grasslands). Category 4
represented specialists of open savanna never occurring in closed-canopy habitats (in Roberts
textbook: ranked as 4 for their use of grasslands and lower than 2 for their use of savanna,
woodland or thicket). Intermediate categories 2 and 3 respectively ranked higher and lower
for their use of wooded habitat than grassland habitat, without being as clear-cut as categories
Acc
epte
d A
rtic
le
This article is protected by copyright. All rights reserved.
1 and 4. We expected that Category 1 would increase throughout the Savanna Biome and at
the border with the Grassland Biome, and that Category 4 would decrease where Category 1
increased. We tested that prediction using a mixed regressive spatial autoregressive model
(MRSAR) of average recording probability in Category 1 species against average recording
probability in Category 4 species. MRSARs (Ord, 1975) estimate the fixed effect of spatially-
explicit explanatory covariates while accounting for spatial auto-correlation in the dependent
variable using a weight matrix. They provide a measure of spatial auto-correlation and of the
remaining spatial variance. We defined our weight matrix with weight 1 for grid cells that
were neighbours and weight 0 otherwise. All probabilities were logit-transformed before
analysis in the MRSAR. Sampling uncertainty in both the predicted and explanatory variables
was carried over into the MRSAR using a parametric bootstrap.
To test predictions 2 and 3 we categorized species into four classes of sensitivity to
anthropization. We used the information provided in the Roberts textbook (level of use of
agricultural areas ranked from 0: no use, to 4: intensive use), combined with ancillary
information from Hockey et al. (2011) and personal observations. The four classes went from
Category 1, species that are rarely or never recorded in anthropized areas, to Category 4,
species that thrive in cultivated areas or are otherwise positively affected by anthropization.
Although the effect of anthropization is complex, we predicted that the semi-desert Karoo
Biomes should experience increases in farmland species because of the development of
irrigation (prediction 2). By contrast, in the areas that were converted to agriculture more than
two centuries ago, we expected the same trend as in Europe and North America: a decline in
farmland birds (prediction 3). We tested that prediction using a MRSAR of cut-off detection
probability in category 4 species against log-transformed human population density. The
detail of the categories is presented in Appendix Table S1.
Acc
epte
d A
rtic
le
This article is protected by copyright. All rights reserved.
Results
Preliminary considerations
In all but a few species, occupancy probability estimates were lower throughout during
SABAP1 than SABAP2 (see “General trends” in the Discussion section). Fig. 1 illustrates
this phenomenon in two widespread species. Overall across species, the humid south-east
exhibited the most pronounced increase in occupancy probabilities, whereas the Savanna
Biome appeared as the most stable. Lastly, in the west, most species decreased in detection
probability, whereas in the east most species increased in detection probability.
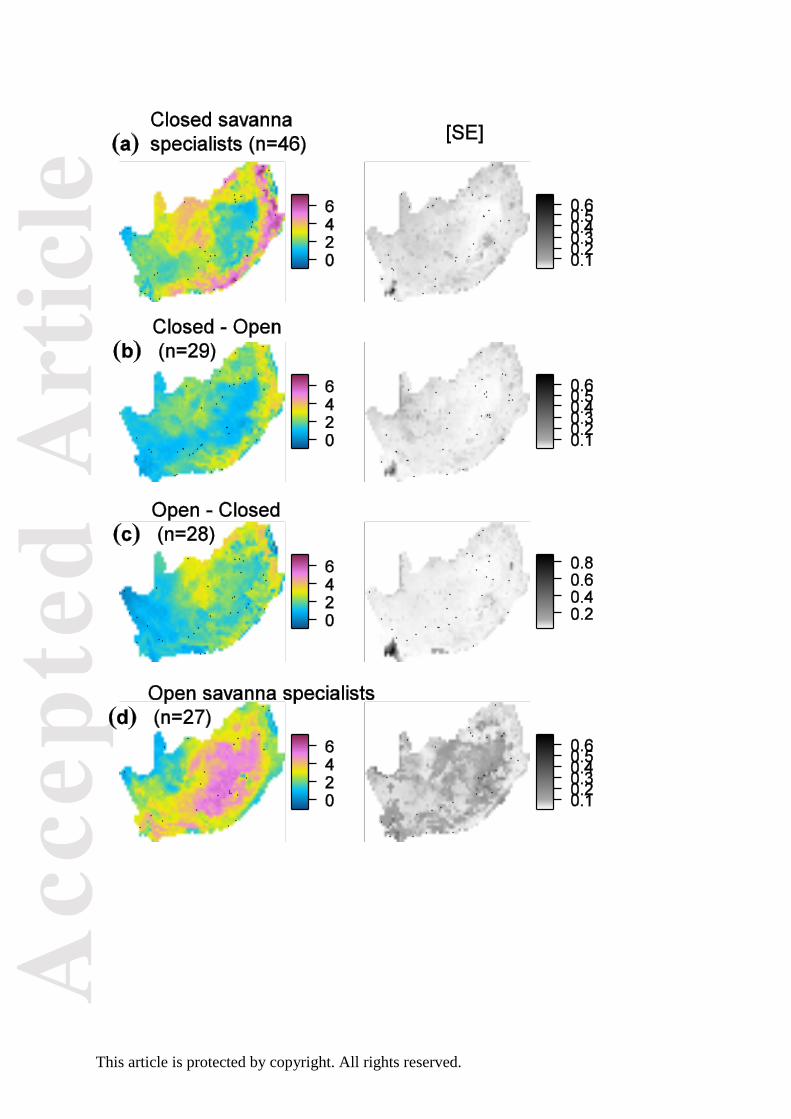
Prediction 1: Closed-savanna species take over open-savanna species
The average grid cell-specific changes in recording probability among open and closed
savanna specialists were negatively correlated with each other (MRSAR: slope parameter –
0.22 ± bootstrap SE 0.09; Fig. 2A vs. 2D). In particular, closed-savanna specialists increased
in recording probability in the cells containing the transitions between the Coastal Forest,
Savanna, and Grassland Biomes along the Indian Ocean coast and the Great Escarpment (see
Appendix Fig. S1 for geographical references). Open-savanna specialists exhibited a strong
increase in recording probability in the Grassland Biome, and comparatively little change in
the northern savannas (Limpopo province).
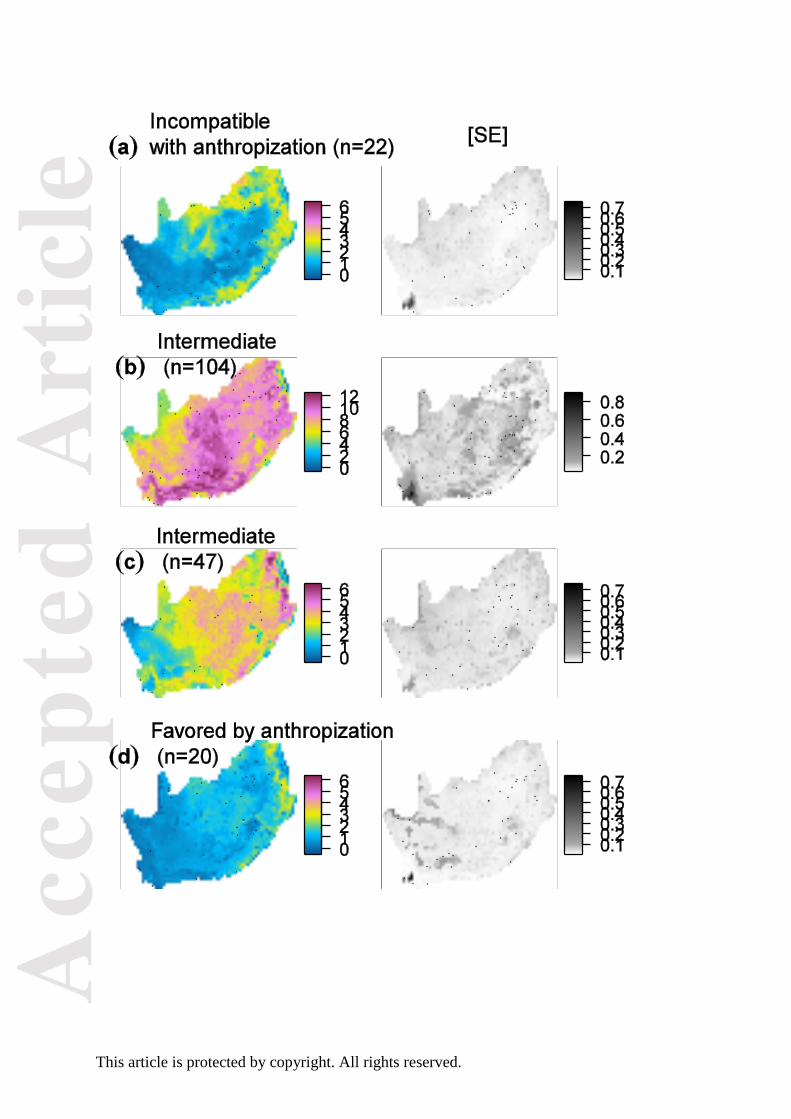
Predictions 2 and 3: Correlates of land use intensification
Given the general trend for species to increase in occupancy probability within their range,
the relative stability of species categorized as favored by anthropization (Fig. 3D) suggests
that the effects of anthropization operated before the start of the first atlas period.
Nevertheless, we observed on average an increase in cut-off detection probability in the
Grassy Karoo and Sweet Grassland Bioregions for species categorized as favored by
anthropization (Fig. S3D; see Appendix Fig. S1 for geographical references). By contrast, the

Acc
epte
d A
rtic
le
This article is protected by copyright. All rights reserved.
same species declined in the areas with most intense human population density (MRSAR:
slope parameter –0.016 ± bootstrap SE 0.008; Fig. S3D). Counter-intuitively, species
categorized as incompatible with anthropization showed moderate increase throughout (Fig.
3A & S3A).
Discussion
Using data from a large-scale citizen-science project, we documented large changes in the
distributions of passerine birds across South Africa. Our results suggest that bush
encroachment and land-use changes are two important factors affecting species range
dynamics in the region. In the following, we first discuss the methodological implications
regarding occupancy models for crowdsourced data analysis in general and SABAP data in
particular, and second the implications for our understanding of large-scale ecological
processes.
General trends and methodological experience sharing
The reported overall increase in passerine occupancy and detection probability over the study
period corroborates preliminary analyses of SABAP reporting rates for passerine birds
(Loftie-Eaton, 2014). In contrast, longer-lived taxa with heavier body mass than passerines
are often showing rapid declines in the study region (Broms et al., 2014; Hofmeyr et al.,
2014; Loftie-Eaton, 2014). Increases in occupancy probability for passerines could come
from the change in protocol between SABAP1 and SABAP2. SABAP2 data are collected at a
finer spatial resolution than SABAP1 data, and we aggregated them at the quarter degree
resolution to compare them to SABAP1 data. The finer resolution of the SABAP2 protocol
may however have enticed contributors to visit areas that they ignored during SABAP1, and
discover species in those areas that were left undetected during SABAP1. This mechanism
would not be adequately captured by occupancy models because, in these models, detection
Acc
epte
d A
rtic
le
This article is protected by copyright. All rights reserved.
probability is defined conditional on species’ occurrence in the sampled area.
Downscaling/upscaling methods (e.g., Azaele et al., 2012) could in the future prove useful to
address this change in the spatial resolution of the data collection protocol between two
sampling period.
Alternatively, the observed increase in occupancy probability could also be explained
by changes in observer behaviour and skills. It is possible that, for example via the
dissemination of ornithological knowledge, spatial heterogeneity in the probability that
observers identified and reported all the species they saw decreased between SABAP1 and 2.
Such homogenization of observers’ skill level could potentially be addressed using time-
varying observer random effects. Time-invariant observer random effects are readily fitted to
citizen science data, including to SABAP data (Bled et al., 2013). Data permitting, they could
be modified into time-varying random effects to accommodate changes in observers’ skill
levels.
On the other hand, if the reported increase in occupancy probability is not spurious
and caused by the aforementionned two sources of bias, it suggests that species have been
consolidating their range, i.e, that within ecologically-homogeneous regions, their
distribution was patchy during SABAP1 and gaps were filled between SABAP1 and
SABAP2.
Prediction 1: Closed-savanna species take over open-savanna species
The result that closed-savanna species increased where open-savanna species decreased is
robust to caveats mentioned in the previous paragraph because it comes from the comparison
of metrics affected by the same type of bias. We thus support the hypothesis that bush
encroachment is a major driver of change in bird distribution in the study region (Seymour &
Dean, 2009; Sirami & Monadjem, 2012; Hofmeyr et al., 2014). Our study is the first to find
evidence of this spatial scale for the effect of bush encroachment on avian assemblages. In a
Acc
epte
d A
rtic
le
This article is protected by copyright. All rights reserved.
species like common fiscal Lanius collaris (Fig. 1A), which requires dense shrubs
interspersed with open areas, bush encroachment meant extinction from the northernmost
cells (Fig. 1A.i against 1A.iv), probably linked to the closing of small grassy patches there,
but increased abundance over the rest the range, probably linked to the increased availability
of bush patches within agricultural landscapes and grasslands (Fig. 1A.ii against 1A.v).
Common fiscal is one of the most familiar and easy-to-detect members of the region’s
avifauna, so these elements are robust to the observer skill caveat mentioned under “General
trends” above.
Prediction 2: Correlates of land use intensification
For the same reason as for the bush encroachment effect, the results pertaining to the
correlates of land use intensification are considered robust to the caveats mentioned under
“General trends” above. As expected, the effects of land use were however less
straightforward to identify than the effect of bush encroachment because land use affects
species’ habitat and demographic performance in various ways. An example of counter-
intuitive results is the increase, within the Savanna Biome and in particular along the Great
Escarpment, in the abundance of the species that were a priori categorized as incompatible
with anthropization (Fig. S3A). This result could be explained in part by the fact that we
excluded all the rare species from the analysis. It suggests that those species that were
common enough to be included in our analysis, but still qualified as incompatible with
anthropization, have been benefiting from bush encroachment, particularly in the ecotone
areas. By contrast, the abundance of red-billed quelea Quelea quelea (Fig. 1B), a grassland
species which benefits from cereal cultivation and therefore classifies as a human
commensal, increased most markedly in the agricultural landscapes of the centre of the study
region, in the Grassy Karoo and Sweet Grassland Bioregions (Fig. 1B). Lastly, species that
were a priori considered as benefiting from anthropization were found to decline in detection
Acc
epte
d A
rtic
le
This article is protected by copyright. All rights reserved.
probability in the regions with highest human population density (i.e., heaviest human
footprint). This result supports the hypothesis of a threshold in land use intensity, after which
human commensals begin to decline. This effect has recently been reported in most countries
with intensive agricultures (e.g., Mineau and Whiteside 2013, Hallmann et al. 2014).
Conclusion
Our two main results are 1) that open-savanna specialists decreased throughout South Africa
where closed-savanna specialists increased, and 2) that species a priori classified as favoured
by anthropization decreased in abundance where human population density was highest.
These two results are robust to caveats mentioned under “General trends” above because
they compare metrics affected by the same type of bias. The first result constitutes evidence
for a major effect of bush encroachment on avian assemblages in the region, thereby
corroborating earlier evidence at the more local scale and with fewer species (Seymour &
Dean, 2009; Sirami & Monadjem, 2012). The second result suggests a threshold in land use
intensity after which even human commensals are negatively affected. We conclude that in
the Grassland and Savanna Biome, land use change and ecological succession appear as
faster, more direct drivers of animal distribution changes than climate variables themselves.
This conclusion would probably be challenged in more arid biomes, where surface water
availability (Wichmann et al., 2003) and thermic stress (Smit et al., 2013), both directly
linked to climate, are likely to play a greater role than changes in vegetation structure. With
regard to strategies for species distribution modelling, our study supports the consensus that,
at the sub-continental to regional scale, land use and vegetation structure variables cannot be
ignored, whereas at the continental scale climate differences may overrule land use
differences (Pearson & Dawson, 2003; Thuiller et al., 2004). Occupancy models represented
an investment in computer time which we deemed justified due to the variation in sampling
effort by citizen scientists across the study region (South Africa, Lesotho and Swaziland), and
Acc
epte
d A
rtic
le
This article is protected by copyright. All rights reserved.
especially since the objective was to compare the dynamics of different species and groups of
species with very different detection probabilities. Occupancy models allowed us to account
for species-specific biases. However, some specificities of the SABAP dataset remain
challenging for standard occupancy models and additional methodological development may
therefore be required in the future (see “General trends” above). Nevertheless, our two main
results already exemplify the role of factors of variation other than climate change and offer
important insight into ongoing dynamics of avian assemblage composition driven by
ecological succession and land use change.
Acknowledgements
We thank the volunteer atlasers who collected the data and the Animal Demography Unit at
University of Cape Town for making the data available to us. C. Beale, F. Bled, G.
Duckworth, D. Guo, B. Huntley, S. Mecenero, and Statistics South Africa helped with
covariate data access and formatting. This work was funded by SANBI and by the National
Research Foundation of South Africa (Grant 85802). The NRF accepts no liability for
opinions, findings and conclusions or recommendations expressed in this publication.
Literature cited
Achard F, Eva HD, Stibig H-J, Mayaux P, Gallego J, Richards T, Malingreau J-P (2002)
Determination of deforestation rates of the world’s humid tropical forests. Science, 297,
999–1002.
Altwegg R, Wheeler M, Erni B (2008) Climate and the range dynamics of species with
imperfect detection. Biology letters, 4, 581–4.
Azaele S, Cornell S, Kunin W (2012) Downscaling species occupancy from coarse spatial
scales. Ecological Applications, 22, 1004–1014.
Acc
epte
d A
rtic
le
This article is protected by copyright. All rights reserved.
Beale CM, Lennon JJ, Gimona A (2008) Opening the climate envelope reveals no macroscale
associations with climate in European birds. Proceedings of the National Academy of
Sciences of the United States of America, 105, 14908–14912.
Bled F, Nichols JD, Altwegg R (2013) Dynamic occupancy models for analyzing species’
range dynamics across large geographic scales. Ecology and evolution, 3, 4896–4909.
Bonney R, Shirk JL, Phillips TB, Wiggins A, Ballard HL, Miller-Rushing AJ, Parrish JK
(2014) Next Steps for Citizen Science. Science, 343, 1436–1437.
Broms KM, Johnson DS, Altwegg R, Conquest LL (2014) Spatial occupancy models applied
to atlas data show Southern Ground Hornbills strongly depend on protected areas.
Ecological Applications, 24, 363–374.
Buitenwerf R, Bond WJ, Stevens N, Trollope WSW (2012) Increased tree densities in South
African savannas: >50 years of data suggests CO2 as a driver. Global Change Biology,
18, 675–684.
Chazdon RL, Letcher SG, van Breugel M, Martínez-Ramos M, Bongers F, Finegan B (2007)
Rates of change in tree communities of secondary Neotropical forests following major
disturbances. Philosophical transactions of the Royal Society of London. Series B,
Biological sciences, 362, 273–89.
Dickinson JL, Zuckerberg B, Bonter DN (2010) Citizen Science as an Ecological Research
Tool: Challenges and Benefits. Annual Review of Ecology, Evolution, and Systematics,
41, 149–172.
Donald P, Green RE, Heath MF (2001) Agricultural intensification and the collapse of
Europe’s farmland bird populations. Proceedings Of The Royal Society B-Biological
Sciences, 268, 25–9.
Foley JA, Defries R, Asner GP et al. (2005) Global consequences of land use. Science, 309,
570–4.
Hallmann CA, Foppen RPB, van Turnhout CAM, de Kroon H, Jongejans E (2014) Declines
in insectivorous birds are associated with high neonicotinoid concentrations. Nature,
511, 341–343.
Harrison JA, Allan DG, Underhill LG, Herremans M, Tree AJ, Parker V, Brown CJ (eds.)
(1997) The Atlas of Southern African Birds. BirdLife South Africa, Johannesburg.
Hart JD, Milsom TP, Fisher G, Wilkins V, Moreby SJ, Murray AWA, Robertson PA (2006)
The relationship between yellowhammer breeding performance, arthropod abundance
and insecticide applications on arable farmland. Journal of Applied Ecology, 43, 81–91.
Hockey PAR, Dean WRJ, Ryan PG (2005) Roberts Birds of Southern Africa, 7th Edition, 7th
edn. The Trustees of the John Voelcker Bird Book Fund, Cape Town.
Acc
epte
d A
rtic
le
This article is protected by copyright. All rights reserved.
Hockey PAR, Sirami C, Ridley AR, Midgley GF, Babiker HA (2011) Interrogating recent
range changes in South African birds: confounding signals from land use and climate
change present a challenge for attribution. Diversity and Distributions, 17, 254–261.
Hofmeyr SD, Symes CT, Underhill LG (2014) Secretarybird Sagittarius serpentarius
Population Trends and Ecology: Insights from South African Citizen Science Data (ed
Slotow R). PloS one, 9, e96772.
Huntley B, Altwegg R, Barnard P, Collingham YC, Hole DG (2012) Modelling relationships
between species spatial abundance patterns and climate. Global Ecology and
Biogeography, 21, 668–681.
Loftie-Eaton M (2014) Geographic Range Dynamics of South Africa’s Bird Species. MSc
thesis, University of Cape Town.
MacKenzie DI, Nichols JD, Hines JE, Knutson MG, Franklin AB (2003) Estimating site
occupancy, colonization, and local extinction when a species is detected imperfectly.
Ecology, 84, 2200–2207.
MacKenzie DI, Nichols JD, Royle JA, Pollock KH, Bailey LL, Hines JE (2006) Occupancy
estimation and modelling. Academic Press, San Diego, CA.
Mineau P, Whiteside M (2013) Pesticide acute toxicity is a better correlate of U.S. grassland
bird declines than agricultural intensification. (ed Clarke RH). PloS one, 8, e57457.
Niedertscheider M, Gingrich S, Erb K-H (2012) Changes in land use in South Africa between
1961 and 2006: an integrated socio-ecological analysis based on the human
appropriation of net primary production framework. Regional Environmental Change,
12, 715–727.
Ord K (1975) Estimation methods for models of spatial interaction. Journal of the American
Statistical Association, 349, 120–126.
Parr CL, Gray EF, Bond WJ (2012) Cascading biodiversity and functional consequences of a
global change-induced biome switch. Diversity and Distributions, 18, 493–503.
Pearson RG, Dawson TP (2003) Predicting the impacts of climate change on the distribution
of species: are bioclimate envelope models useful? Global Ecology and Biogeography,
12, 361–371.
Péron G, Altwegg R (2015) The abundant centre syndrome and species distributions: insights
from closely related species pairs in southern Africa. Global Ecology and Biogeography,
24, 215–225.
Robertson A, Simmons RE, Jarvis AM, Brown CJ (1995) Can bird atlas data be used to
estimate population size? A case study using Namibian endemics. Biological
Conservation, 71, 87–95.
Royle JA, Nichols JD (2003) Estimating abundance from repeated presence-absence data or
point counts. Ecology, 84, 777–790.
Acc
epte
d A
rtic
le
This article is protected by copyright. All rights reserved.
Scheffer M, Carpenter SR (2003) Catastrophic regime shifts in ecosystems: linking theory to
observation. Trends in Ecology & Evolution, 18, 648–656.
Seymour CL, Dean WRJ (2009) The influence of changes in habitat structure on the species
composition of bird assemblages in the southern Kalahari. Austral Ecology, 35, 581–
592.
Sirami C, Monadjem A (2012) Changes in bird communities in Swaziland savannas between
1998 and 2008 owing to shrub encroachment. Diversity and Distributions, 18, 390–400.
Sirami C, Brotons L, Martin J-L (2007) Vegetation and songbird response to land
abandonment: from landscape to census plot. Diversity & Distributions, 13, 42–52.
Smit B, Harding CT, Hockey PAR, McKechnie AE (2013) Adaptive thermoregulation during
summer in two populations of an arid-zone passerine. Ecology, 94, 1142–54.
La Sorte FA, Jetz W (2012) Tracking of climatic niche boundaries under recent climate
change. The Journal of animal ecology, 81, 914–25.
Thuiller W, Araújo MB, Lavorel S (2004) Do we need land-cover data to model species
distributions in Europe? Journal of Biogeography, 31, 353–361.
Vitousek PM (1997) Human Domination of Earth’s Ecosystems. Science, 277, 494–499.
Wichmann MC, Jeltsch F, Dean WRJ, Moloney KA, Wissel C (2003) Implication of climate
change for the persistence of raptors in arid savanna. 1, 186–202.
Wigley BJ, Bond WJ, Hoffman MT (2010) Thicket expansion in a South African savanna
under divergent land use: local vs. global drivers? Global Change Biology, 16, 964–976.
Figure legends
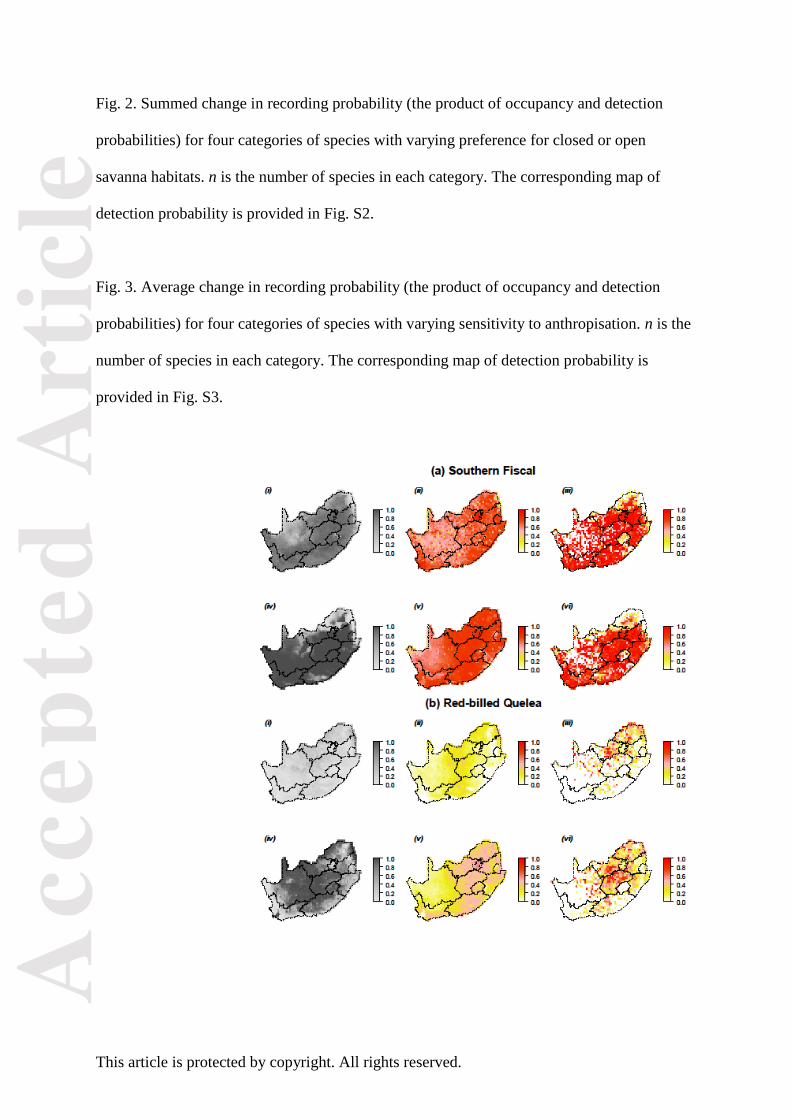
Fig. 1. Examples of occupancy models of species distribution using citizen science data, for
two widespread species with contrasting habitat requirements: (A) common fiscal (a.k.a.
fiscal shrike or Southern fiscal) Lanius collaris, and (B) red-billed quelea Quelea quelea. (i to
iii): distribution during SABAP1 (1987-1991). (iv to vi): distribution during SABAP2 (2007-
2013). (i and iv): Estimated occupancy probability. (ii and v) Estimated detection probability.
(iii and vi ) Reporting rate, i.e. the proportion of checklists contributed by citizen scientists in
which the species was reported.
Acc
epte
d A
rtic
le
This article is protected by copyright. All rights reserved.
Fig. 2. Summed change in recording probability (the product of occupancy and detection
probabilities) for four categories of species with varying preference for closed or open
savanna habitats. n is the number of species in each category. The corresponding map of
detection probability is provided in Fig. S2.
Fig. 3. Average change in recording probability (the product of occupancy and detection
probabilities) for four categories of species with varying sensitivity to anthropisation. n is the
number of species in each category. The corresponding map of detection probability is
provided in Fig. S3.
Acc
epte
d A
rtic
le
This article is protected by copyright. All rights reserved.
Acc
epte
d A
rtic
le
This article is protected by copyright. All rights reserved.