Duplication of Growth Hormone Gene and Accelerated Evolution in Passerine Birds
Published by Oxford University Press 2007. - 1 -
Duplication of growth hormone gene and accelerated evolution in passerine birds Submitted for Research Article Authors: Tamaki Yuri 1,2,4, Rebecca T. Kimball2, Edward L. Braun2, and Michael J. Braun1,3 1Department of Vertebrate Zoology, National Museum of Natural History, Smithsonian Institution, 4210 Silver Hill Road, Suitland, MD 20746, USA 2Department of Zoology, University of Florida, Gainesville, FL 32611, USA 3Behavior, Ecology, Evolution, and Systematics Program, University of Maryland, College Park, MD 20742, USA 4Author for correspondence: Tamaki Yuri Department of Zoology University of Florida P.O. Box 118525 Gainesville, FL 32611-8525 Phone: (352) 846-3737 Fax: (352) 392-3704 Email: [email protected] Key words: relaxation of selection, positive selection, subfunctionalization, Passeriformes Running head: Growth hormone gene duplication in passerines List of non-standard abbreviations: FDR: False Discovery Rate GH: Growth Hormone LRT: Likelihood Ratio Test ML: Maximum Likelihood MLE: Maximum Likelihood Estimate NS: Non-synonymous RRT: Relative Rate Test
MBE Advance Access published November 28, 2007 by guest on A
ugust 23, 2015http://m
be.oxfordjournals.org/D
ownloaded from
- 2 -
Abstract
We report the discovery of a duplication of the growth hormone gene in a major group of
birds, the passerines (Aves: Passeriformes). Phylogenetic analysis of 1.3-kb partial DNA
sequences of growth hormone genes for 24 species of passerines and numerous outgroups
indicates that the duplication occurred in the ancestral lineage of extant passerines. Both
duplicates and their open reading frames are preserved throughout the passerine clade, and both
duplicates are expressed in the Zebra Finch brain, suggesting that both are likely to be functional.
The estimated rates of amino acid evolution are more than ten fold higher in passerine growth
hormone genes than in those of their closest non-passerine relatives. In addition, although the 84
codons sequenced are generally highly conserved for both passerines and non-passerines,
comparisons of the non-synonymous/synonymous substitution ratios and the rate of predicted
amino acid changes indicate that the two gene duplicates are evolving under different selective
pressures and may be functionally divergent. The evidence of differential selection, coupled with
the preservation of both gene copies in all major lineages since the origin of passerines, suggests
the duplication may be of adaptive significance, with possible implications for the explosive
diversification of the passerine clade.
by guest on August 23, 2015
http://mbe.oxfordjournals.org/
Dow
nloaded from
- 3 -
Introduction
Growth hormone (GH) is a polypeptide hormone found in all vertebrate lineages
(Kawauchi et al. 2002). It is generally encoded by a single gene (Agellon et al. 1988;
Rentier-Delrue et al. 1989), is released from pituitary somatotrophs into the circulation, and
exerts actions that promote growth and differentiation at distant target sites (Etherton and
Bauman 1998). However, it is less well known that GH is also produced in many extrapituitary
sites (Harvey and Hull 1997) where it may participate as a local growth factor or cytokine in the
autocrine/paracrine regulation of cellular differentiation during embryonic development (Waters
et al. 1999; Sanders and Harvey 2004). In birds, it is also involved in a variety of important
secondary functions such as egg production, aging and reproduction (Aramburo et al. 2000; Ip,
Zhang and Leung 2001; Zhao et al. 2004). Because of its important functions, and perhaps the
constraints imposed by multiple functions, the evolutionary rate of GH has generally been slow.
However, bursts of rapid changes have been noted in some mammals, amphibians, and teleosts
(Wallis 1996; Wallis and Wallis 2001).
In mammals, two particularly marked episodes of rapid change have occurred, in the
Cetartiodactyla (Cetacea plus Artiodactyla, sensu Montgelard, Catzeflis and Douzery 1997;
Wallis and Wallis 2001; Maniou, Wallis and Wallis 2004) and Primates (e.g. Wallis 1981; Ohta
1993; Wallis 1994; Liu et al. 2001). Interestingly, duplications of the GH gene have been
reported within both of these mammalian groups. Some caprine ruminants appear to have two
GH-like genes (Wallis, Lioupis and Wallis 1998), and, in higher primates, a series of duplications
has given rise to a cluster of GH-related genes, several of which are expressed in the placenta
(Chen et al. 1989; Wallis and Wallis 2002). There are also several cases of duplicated GH genes
by guest on August 23, 2015
http://mbe.oxfordjournals.org/
Dow
nloaded from
- 4 -
in amphibians and teleosts, which may be associated with tetraploidy (Devlin 1993; Huang and
Brown 2000; McKay et al. 2004).
In the course of our work on Early Bird, a large scale, collaborative project to determine
the interrelationships of all major groups of birds
(http://www.fieldmuseum.org/research_collections/zoology/zoo_sites/early_bird), we discovered
a duplication of the GH gene in passerines, or perching birds. The passerines are the largest order
of birds, comprising more than half of all living avian species, and two copies of the GH gene are
present throughout the clade. Our analyses suggest that both duplicates have evolved rapidly
since the duplication event and are under different selective pressure from the original
single-copy GH gene. This is the first case of GH gene duplication reported in birds or in
Diapsida (birds and traditional reptiles).
Materials and Methods
DNA sequence data collection
Our sample includes 24 passerine species and 138 outgroup taxa that represent the
diversity of extant avian taxa (names and sources in supplementary table S1, Supplementary
Material online). Approximately 1.3-kb sequences of the GH gene, including complete intron 2,
exon 3, intron 3 and flanking regions of exons 2 and 4 (based on the Chicken Genome:
NC006114, International Chicken Genome Sequencing Consortium 2004) were collected. The
target fragment was amplified by a nested, two-step polymerase chain reaction (PCR), using the
first set of primers GH-F874 (5’-CCTTCCCWGCCATGCCCCTTTCCAACC-3’) and
GH-R3018 (5’-CCGTAGTTCTTCAGCAGGGCSTCCTCG-3’), followed by the second set of
by guest on August 23, 2015
http://mbe.oxfordjournals.org/
Dow
nloaded from
- 5 -
primers GH-F897 (5’-TGTTTGCCAACGCTGTGCTGAGG-3’) and GH-R1925
(5’-TCCCTTCTTCCAGGTCCTTTART-3’). The resulting PCR products were sequenced using
primers GH-F897, GH-R1925, GH-F1391 (5’- GATGTCTCCACAGGAACGYA-3’), and
GH-1476 (5’- GATTTCTGCTGGGCATCATCCTTCC-3’). In some cases, additional
taxon-specific primers were designed to sequence intron regions. Those primer sequences may be
obtained from the authors.
Our standard PCR amplifications were performed using MJ Research Tetrad Thermal
Cyclers as follows: (1) The first reaction using the primer pair GH-F874 and GH-R3108 was
performed in 12.5 µl final volume containing 10-20 ng genomic DNA, 0.25 µM of each primer,
0.2 mM dNTPs, 1.25 µl Ex Taq buffer, and 0.5 U of Takara Ex Taq (Takara Mirus Bio), using a
“touchdown” cycling program with 10 cycles of denaturation at 94˚C for 30 s, annealing at 70˚C
61˚C (1˚C decrease per cycle) for 30 s, and extension at 72˚C for 2-3 min, followed by 30
cycles of denaturation at 94˚C for 30 s, annealing at 60˚C for 30 s, and extension at 72˚C for 2-3
min. (2) The second reaction using the primer pair GH-F897 and GH-R1925 was performed in 50
µl final volume containing 1 µl of the diluted PCR product (1 to 1/100 in dilution) from the first
reaction, 0.25 µM of each primer, 0.2 mM dNTPs, 5 µl PCR buffer (standard 10 x buffer,
GeneChoice Inc. or Biolase NH4 Reaction Buffer, Bioline), 1.5 mM MgCl2 (only with Biolase
reaction buffer), and 1.25 U of Taq (GeneChoice, Inc or Bioline), using a cycling program of 27
cycles of denaturation at 94˚C for 30 s, annealing at 60˚C for 30 s, and extension at 72˚C for 90 s.
Sequencing reactions were performed with ABI BigDye Terminator v3.1 Cycle Sequencing Kit,
and the resulting products were analyzed on ABI 3100 or 3130xl Genetic Analyzer. DNA
sequences used in this study were deposited in GenBank under accession numbers
EF521416-EF521598.
by guest on August 23, 2015
http://mbe.oxfordjournals.org/
Dow
nloaded from
- 6 -
Phylogenetic inference of GH gene tree
Alignment of all GH sequences was performed using CLUSTAL X followed by manual
adjustment. The aligned sequences were analyzed phylogenetically to reconstruct a gene tree and
to calculate bootstrap support of its nodes using GARLI v0.951 (Zwickl 2006;
http://www.bio.utexas.edu/faculty/antisense/garli/Garli.html), which performs heuristic
phylogenetic searches under the General Time Reversible (GTR) model of nucleotide substitution.
It uses a genetic algorithm approach to simultaneously find the topology, branch lengths and
model parameters that maximize the log likelihood score (Lewis 1998). For all our analyses, the
default settings of GARLI were used (with base frequencies, four-category gamma distributed
rate heterogeneity, and a proportion of invariant sites estimated). The resulting tree topology was
confirmed by Bayesian analysis using MrBayes v3.1 (Huelsenbeck and Ronquist 2001; Ronquist
and Huelsenbeck 2003) and the same model structure as GARLI, but with model parameters
estimated separately for four partitions of the data: introns and codon positions 1, 2 and 3 of
exons. Two sets of four Markov chains were run for ten million generations sampling every 100
generations. The convergence of the two sets of analyses was confirmed by the correlation
between posterior probabilities for the two analyses and the Potential Scale Reduction Factor
(Gelman and Rubin 1992) approaching 1 for each parameter. The first 2000 samples were
discarded as burn-in. The position of Zebra Finch (Taeniopygia guttata) GH genes on the tree
was estimated by adding two 254 bp exon sequences from the Songbird EST project
(http://titan.biotec.uiuc.edu/cgi-bin/ESTWebsite/estima_start?seqSet=songbird) to the dataset and
repeating the procedures above.
by guest on August 23, 2015
http://mbe.oxfordjournals.org/
Dow
nloaded from
- 7 -
Evolutionary rate comparisons
Relative rate tests (RRTs) were performed to compare evolutionary rate between
passerines and non-passerines. To assess whether the observed rate acceleration in passerines is
specific to GH genes, we also analyzed three other genes as controls (ALDOB: Aldolase B,
fructose-bisphosphate, CRYAA: Crystallin, Alpha A, and RHO: Rhodopsin; Hackett et al,
unpublished data). These three genes were selected because they include codon sequences equal
to or longer than our GH codon sequences as well as intron regions, and their predicted amino
acid sequences include non-autapomorphic variation in ingroup taxa.
Ten passerines and ten non-passerines were used as ingroup taxa for the RRTs
(supplementary table S1, Supplementary Material online and fig. 1). The ingroup taxa were
selected because they include complete data for all the genes examined and represent the
diversity of the passerines and their closest relatives. All of the ingroup taxa belong to the
smallest well-supported clade that includes both passerines and non-passerines (Hackett et al.
unpublished data). To avoid possible anomalies associated with a particular outgroup, we used
three outgroup taxa, Eudocimus albus (White Ibis), Caprimulgus longirostris (Band-winged
Nightjar), and Aramus guarauna (Limpkin). These taxa come from widely separated lineages (fig
1) representing the rest of Neoaves (all extant birds except Galliformes, Anseriformes and
Paleognathae).
We used the package HYPHY v1.00b (Kosakovsky Pond et al. 2005;
http://www.hyphy.org) to calculate the unconstrained maximum likelihood estimate (MLE) of the
3-taxon tree (one passerine, one close relative of passerines and one outgroup), and the MLE of
the 3-taxon tree with ingroup branch lengths constrained to be equal. RRTs were performed
separately for amino acid, codon, and intron sequences, and non-synonymous and synonymous
by guest on August 23, 2015
http://mbe.oxfordjournals.org/
Dow
nloaded from
- 8 -
rates in codons were tested independently. MLEs were obtained under the following models: for
amino acids, the model using WAG matrix (Whelan and Goldman 2001) with among site rate
variation ( and I); for codons, Goldman and Yang’s (1994) model with nucleotide frequency
tabulated separately for 1st, 2nd and 3rd positions to estimate equilibrium codon frequencies; and
for introns, the GTR model with among site rate variation ( and I). A likelihood ratio test (LRT)
was performed to determine whether the alternative hypothesis of unconstrained rate variation
was significantly better than the null hypothesis that rates along two given branches are equal.
Benjamini and Yekutieli’s (2001) method of False Discovery Rate (FDR) and Hochberg’s (1988)
Bonferroni procedure were used for multiple test correction using p.adjust function of the
statistical package R (R Development Core Team 2007; http://www.R-project.org). The FDR is
the expected proportion of true null hypotheses rejected out of the total number of null
hypotheses rejected and is a less stringent correction method than Bonferroni corrections
(Bonferroni 1936; Miller 1981), which are known to be highly conservative. Benjamini and
Yekutieli’s (2001) method controls FDR consistently in multiple tests under dependency.
Analyses of selection and functional divergence
The ratio of non-synonymous to synonymous substitutions (dN/dS or ) was used to
estimate selective pressure at the protein level for the two passerine GH gene duplicates. Values
of significantly greater than 1 indicate positive selection, whereas values significantly smaller
than 1 indicate purifying selection. We performed a LRT that compares two models of selection,
the null model M7 and the alternative hypothesis M8, using the program codeml in the PAML
package v3.15 (Yang 1997). M7 assumes a beta distribution of , in which codon sites are
classified into 10 rate categories, each corresponding to a distinctive value within an interval 0
by guest on August 23, 2015
http://mbe.oxfordjournals.org/
Dow
nloaded from
- 9 -
< 1. The alternative model, M8, is constructed by adding an 11th rate category reflecting
positive selection ( > 1) to M7. A rejection of M7 by LRT indicates that the coding region
includes sites subject to positive selection. This program utilizes the codon-based evolutionary
model of Goldman and Yang (1994) and explicitly takes into account the evolutionary
relationships among the sequences. For these analyses, we used the GH gene tree estimated from
the GARLI analysis described above. When positive selection was detected, the amino acid
residues likely to be under positive selection were identified as those with high site-specific
posterior probability of greater than 1 using naïve Empirical Bayes (Nielsen and Yang 1998;
Yang et al. 2000) and Bayes Empirical Bayes Inference (Yang, Wong and Nielsen 2005).
We also estimated functional divergence between the two passerine GH gene duplicates
by calculating the coefficient of functional divergence ( , a measure of replacement rate
correlation over amino acid residues between gene duplicates) using the program DIVERGE
v1.04 (Gu 1999). The program performs a LRT to test whether is significantly greater than zero,
which would indicate that the replacement rate of the amino acid sequences differ significantly
between the duplicates and thus suggest their functional divergence since the duplication event.
When functional divergence was detected, the amino acid residues likely to be involved in
functional divergence were identified using site-specific posterior probabilities of rate differences
higher than baseline difference, with a cut-off value of 0.67 (Wang and Gu 2001).
Results
We amplified via PCR fragments of about 1.3-kb from the GH genes of 162 avian taxa,
including most major living lineages. In contrast to non-passerines, the PCR products from many
by guest on August 23, 2015
http://mbe.oxfordjournals.org/
Dow
nloaded from
- 10 -
passerine species contained two strong bands in the 1.0-1.8 kb size range when visualized after
electrophoresis. When the two bands from a passerine species were gel-isolated and sequenced,
they were found to contain non-identical GH-like DNA sequences, differing at 19-25% of
nucleotide sequence sites (p-distances for exons: 0.08-0.16, introns: 0.22-0.29). We designate the
shorter copy “S” (sequence length: 1.0-1.3 kb) and the longer copy “L” (sequence length: 1.2-1.7
kb). In some cases, the two bands were not cleanly separable on agarose gels, so we cloned and
sequenced 2-8 clones of the PCR products, allowing us to identify S and L copies by sequence
similarity. In such cases, the sequence variation among clones within either the S or L class was
low (0.0-2.3%), and attributable to either allelic differences or polymerase error. The lengths of
homologous exons are the same for all of our passerine sequences; thus, any difference in the
sequence length between S and L copies stems from length variation in introns.
Of 24 taxa chosen to represent the diversity of passerines (supplementary table S1,
Supplementary Material online), we were able to recover both S and L copies of the GH gene for
21 taxa including Acanthisitta, the earliest branching taxon among extant passerines (Sibley and
Ahlquist 1990; Barker et al. 2004). The three passerine taxa for which we have only one sequence
are Climacteris (L), Grallaria (S), and Malurus (S). The PCR products of these taxa were cloned,
and 4-8 clones of each product were sequenced to confirm that they were derived from a single
copy of GH gene. Although we cannot exclude the possibility of gene loss, we believe that the
negative results are due to PCR failure and these taxa probably have two copies of the GH gene
for two reasons. First, because the three taxa are not close relatives (fig. 1) and both S and L
copies are missing, a single loss cannot account for the missing sequences; at least 3 independent
losses would be required. Second, typical PCR failure rates were around 5-10% of taxa tested for
the "universal primers" used to amplify more than 20 nuclear genes in the Early Bird project.
by guest on August 23, 2015
http://mbe.oxfordjournals.org/
Dow
nloaded from
- 11 -
Thus, three PCR failures out of 48 attempts on passerine GH genes (6.3%) are not unusual. Only
partial sequences were recovered for the L copy of Acanthisitta and Thamnophilus
(approximately 50% and 80% of total length recovered respectively). These partial sequences
were used only for phylogenetic analyses.
Phylogenetic analyses using both GARLI and MrBayes yielded consistent relationships
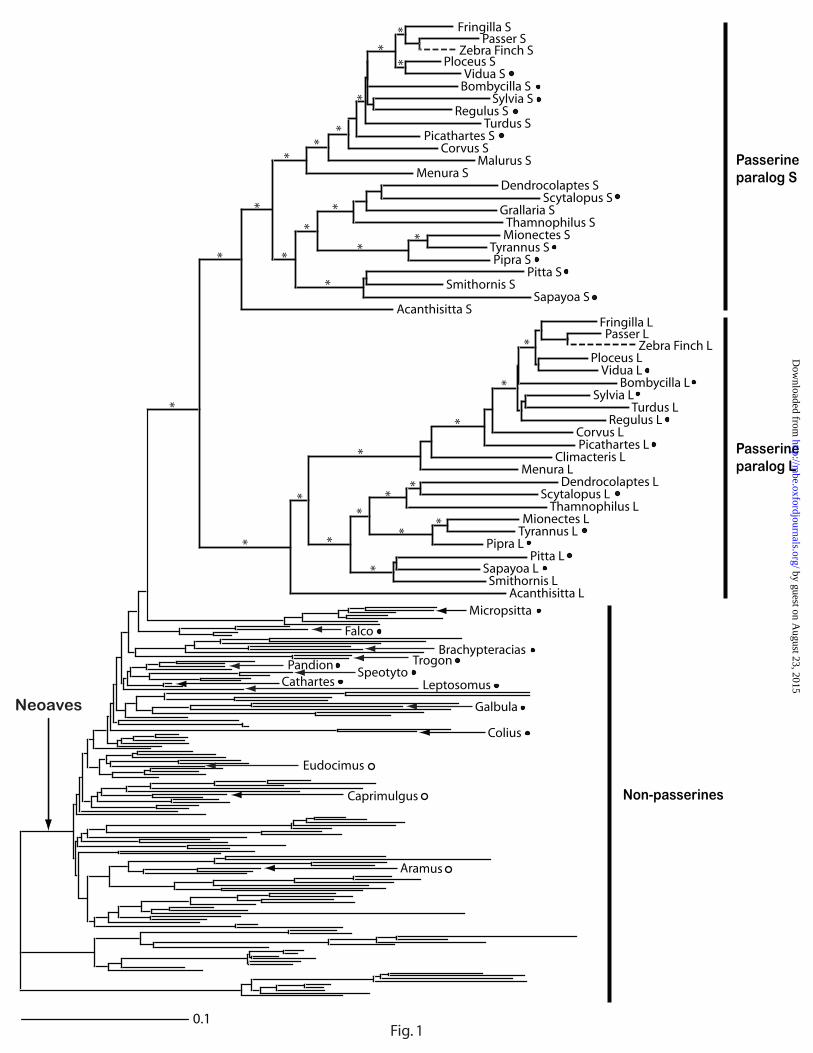
among passerine GH gene sequences. The estimated GH gene tree (fig. 1) has the following
features: (1) all passerine GH sequences are clustered in a single clade, indicating that they are
monophyletic, (2) there are two sister gene clades within passerines, corresponding to S and L
gene copies, and (3) the topologies of the two gene clades are generally consistent with each
other. Based on this analysis, we concluded that the GH gene was duplicated in the ancestral
lineage of extant passerine birds.
We believe that both passerine GH gene paralogs (the two copies of GH gene in
passerines are called paralogs hereafter) are functional for the following reasons: (1) both
paralogs are preserved throughout the passerine clade, (2) the available exon sequences of all the
paralogs in passerines contain a conserved open-reading frames totalling 84 codons in length (83
or 84 codons in non-passerines), (3) the predicted amino acid sequences are generally highly
conserved, and (4) sequences corresponding to both S and L paralogs for Zebra Finch
(Taeniopygia guttata) are present in the Songbird EST project database, a database for gene
sequences expressed in the Zebra Finch brain. Our phylogenetic analysis placed one Zebra Finch
sequence in each of the S and L paralog clades, clustered with Old World finches as expected
based on current taxonomy (fig. 1).
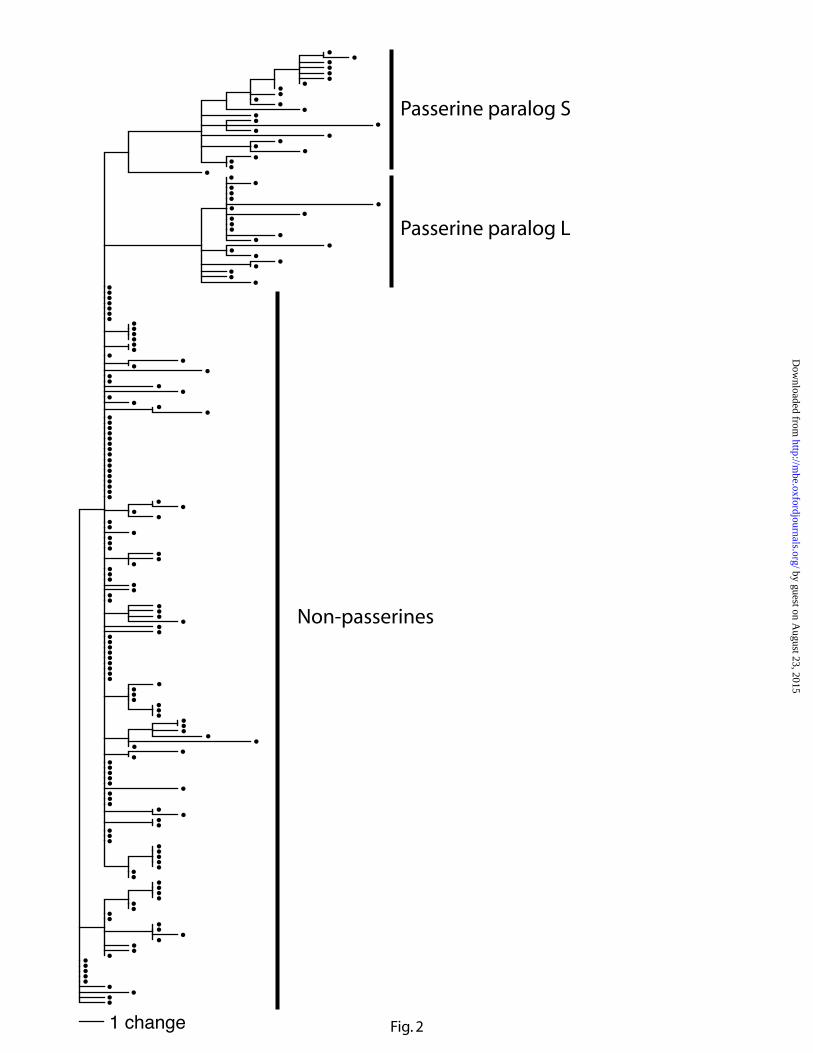
To examine the evolutionary rate of passerine GH gene paralogs, we first mapped
predicted amino acid replacements on the GH gene tree (fig. 1). The resulting phylogram
by guest on August 23, 2015
http://mbe.oxfordjournals.org/
Dow
nloaded from

- 12 -
suggests an elevated rate of amino acid replacement in both paralogs (fig. 2). Then, we performed
a series of pairwise relative rate tests (RRTs) to compare the rate of GH evolution in passerines
and non-passerines that are closely related to passerines. GH gene sequences from ten passerines
were compared to those from ten non-passerines, and virtually all (199 of 200) comparisons at the
amino acid level revealed that both passerine GH gene paralogs have evolved more rapidly than
any of the GH genes from non-passerines (table 1). The average results of the RRTs suggest that
paralog S evolved ~34-fold faster than non-passerine GH gene homologs and that paralog L
evolved ~11-fold faster than non-passerine homologs. The majority of these rate differences were
significant when tested individually, although many comparisons lose significance after multiple
test correction (table 1). This probably reflects the limited power associated with RRTs of the
short amino acid sequences available. However, it is striking that there was no case in which a
non-passerine rate significantly exceeded the passerine rate.
The nucleotide sequences of passerine GH gene introns have also generally evolved faster
than those of non-passerines, although only by about two-fold (table 1). The majority of these
rate differences retain significance, even after multiple test correction, probably due to the longer
intron sequences available for comparison. This suggests that there is a global acceleration of
molecular evolution in passerines, which could be a genome-wide phenomenon possibly due to
their small body size, high metabolic rate, and/or short generation time (Martin and Palumbi
1993). This acceleration in passerines has been noted in a number of studies (e.g., van Tuinen,
Sibley and Hedges 2000). To determine whether the observed amino acid rate acceleration for
GH genes simply reflects the general rate acceleration in passerine genomes rather than a GH
gene-specific phenomenon, we performed a series of parallel RRTs for three additional nuclear
genes (ALDOB, CRYAA, and RHO) as a control (table 1). Like the passerine GH gene paralogs,
by guest on August 23, 2015
http://mbe.oxfordjournals.org/
Dow
nloaded from
- 13 -
all three of these additional genes showed similar rate increases (1.5- to 1.8-fold) for intron
nucleotide sequences. All three additional genes also show increases in amino acid rates.
However, none of the amino acid rate increases were greater than three-fold, and none retained
significance after multiple test correction.
Similar patterns were observed when exon evolutionary rates were compared at the codon
level (supplementary table S2, Supplementary Material online). The rate of synonymous codon
change in passerines was about two-fold faster than in non-passerine close relatives in both GH
paralogs and the three control genes. In sharp contrast, the rate of non-synonymous codon
change was more than ten-fold faster for many of the passerine GH paralogs but only two-fold
faster for passerines in the three control genes. Thus, an approximately two-fold greater rate of
nucleotide sequence evolution appears to characterize many passerine nuclear genes and possibly
represent a genome-wide effect, while the higher rate of amino acid sequence evolution appears
to be GH gene specific. The RRT results were qualitatively unchanged when the outgroup used
for Table 1 (Eudocimus) was replaced with either of two other outgroups (Caprimulgus and
Aramus), both of which are distantly related to Eudocimus. There is a quantitative difference
when different outgroups are used; the rate acceleration for paralog L actually appears to be
greater than that for paralog S when Caprimulgus is used as outgroup, while the apparent
acceleration is greater for paralog S than for paralog L with either Eudocimus or Aramus used as
outgroup (supplementary table S2, Supplementary Material online).
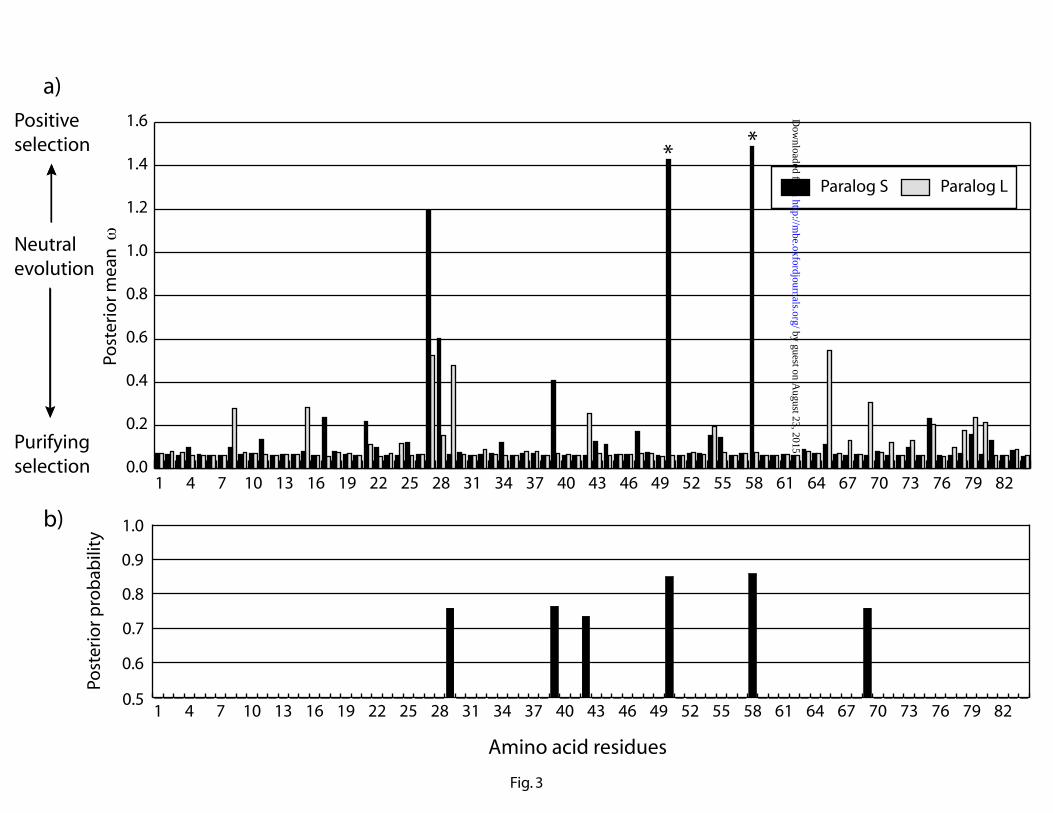
The ratio of non-synonymous to synonymous substitutions (dN/dS or ) was used to
estimate selective pressure at the protein level for the S and L paralogs. Likelihood ratio tests
indicated positive selection on paralog S (2 l = 7.8, P < 0.006), but not on paralog L (2 l = 0.0, P
> 0.995). Naïve Empirical Bayes Inference identified amino acid residues 50 and 58 (numbers
by guest on August 23, 2015
http://mbe.oxfordjournals.org/
Dow
nloaded from
- 14 -
correspond to the 84 residues predicted by our sequences) under positive selection ( > 1) in
paralog S, with posterior probabilities greater than 0.99. However, Bayes Empirical Bayes
Inference only weakly indicated positive selection on these two residues, with posterior
probabilities of 0.77 and 0.80 respectively (fig. 3a). In a simulation study, Wong et al. (2004)
showed that the false-positive rates of Naïve Empirical Bayes Inference for M8 (with positive
selection) vs. M7 (without positive selection) model comparisons using the cutoff of 0.95 were
below 5%. Because Bayes Empirical Bayes Inference is conservative, particularly for small
datasets (Yang, Wong and Nielsen 2005), we consider that these results provide good indications
of positive selection for the two amino acid residues.
We also estimated functional divergence between the two passerine GH gene paralogs by
calculating the coefficient of functional divergence ( ) using amino acid replacement rates (Gu
1999). A likelihood ratio test indicated that was significantly greater than zero (MLE of =
0.53 ± 0.24, 2 l = 5.0, P < 0.03), suggesting functional divergence between the protein products
of the two GH gene duplicates. The site-specific posterior analyses identified six amino acid
residues that are likely to be responsible for this divergence (fig. 3b). All these residues show
relatively marked differences in selective pressure (i.e. mean posterior ) between the S and L
paralogs (fig. 3a). Two of these residues, 50 and 58, were the same residues identified as being
under positive selection in paralog S by the aforementioned analysis of .
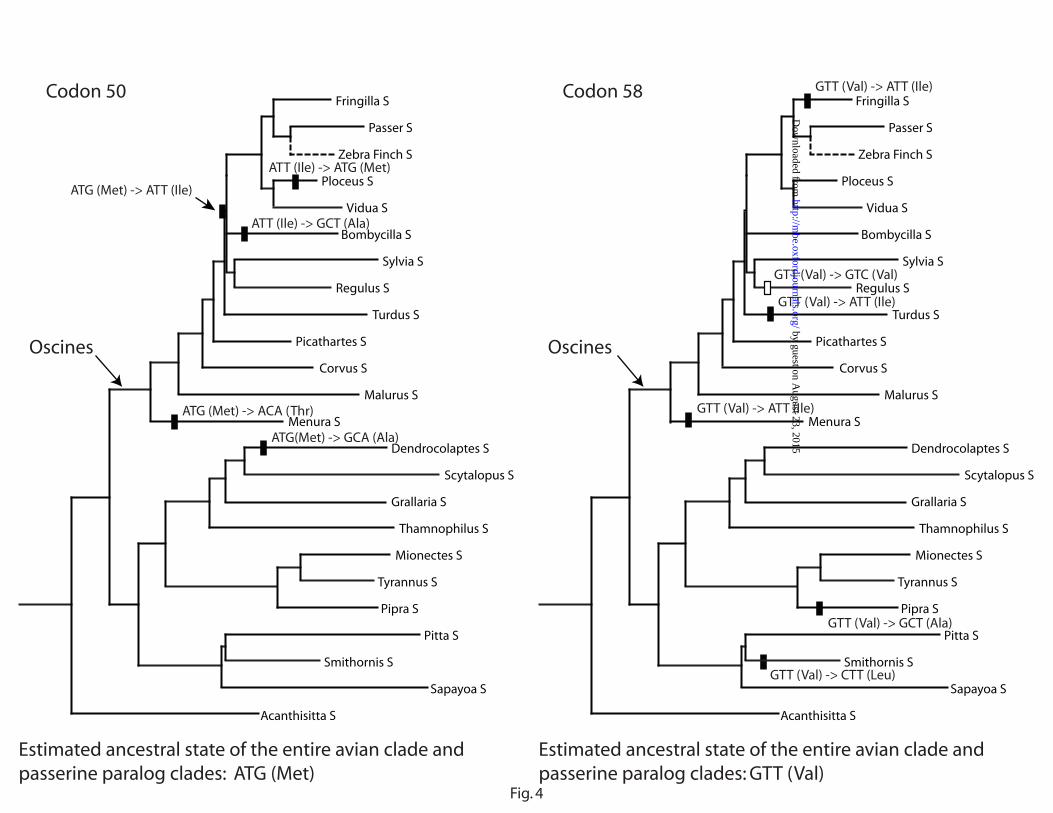
Parsimony estimation of codon changes at sites 50 and 58, each of which has the same
ancestral condition in all birds and in passerines specifically, indicates that five non-synonymous
(NS) changes occurred at each site in the clade of paralog S (fig. 4). In contrast, no NS change
occurred at either site of paralog L, and only two and four NS changes occurred at the codon sites
50 and 58, respectively, in all 142 non-passerine taxa. At codon site 50 in particular, three of the
by guest on August 23, 2015
http://mbe.oxfordjournals.org/
Dow
nloaded from
- 15 -
five NS codon changes require multiple nucleotide substitutions. In addition, the changes are
more concentrated in the oscine (songbird) clade. Although random mutations are expected to
produce mainly NS changes in these codons, the elevated rate of NS changes in particular clades
is not consistent with the pattern of random changes expected from the relaxation of purifying
selection alone.
Based on the human GH protein structure (de Vos, Ultsch and Kossiakoff 1992), sites 50
and 58 are located on helix 2 and lie close to a randomly coiled region of the polypeptide between
helices 3 and 4 (supplementary fig. S1, Supplementary Material online). The estimated ancestral
states of amino acids at sites 50 and 58 in passerines are methionine and valine respectively, both
of which are hydrophobic residues, and the observed replacement residues are also mainly
hydrophobic (fig. 4). Hydrophobic amino acids in -helices are often thought to be of functional
(mainly structural) significance (Dill 1990; O'Neil and Degrado 1990); therefore, changes in
these amino acids may contribute to changes in the function of this polypeptide hormone.
Discussion
Our results demonstrate that the growth hormone gene was duplicated in a common
ancestor of all extant passerine birds, and that both paralogs have been maintained in most or all
passerine lineages. Both paralogs are expressed in Zebra Finch brain, and both are likely to be
functional based on maintenance of open reading frames and generally conservative amino acid
evolution. Comparative analyses indicate that both passerine paralogs have evolved more rapidly
at the nucleotide and amino acid levels than the GH genes of non-passerine relatives. While the
roughly two-fold faster rate of synonymous codon or intron evolution may be a general
by guest on August 23, 2015
http://mbe.oxfordjournals.org/
Dow
nloaded from
- 16 -
phenomenon in passerines, related to their small body size, high metabolic rate, and/or short
generation time (Martin and Palumbi 1993), the ten-fold or greater rate of amino acid evolution is
likely to be specific to the passerine GH gene paralogs. The paralogs appear to have functionally
diverged, but only one of the paralogs shows evidence for positive selection.
Buggiotti and Primmer (2006) pointed out that, of the six avian taxa they studied, the
most divergent GH amino acid sequence was that of a passerine bird, European Pied Flycatcher
(Ficedula hypoleuca), which differed from the other avian GH polypeptides by 18-27 amino
acids, while divergence among the other five taxa ranged from 2 to 22 amino acids. This level of
amino acid sequence divergence is comparable to that found between the green sea turtle
(Chelonia mydas) and avian GH polypeptides (23-29 amino acid divergence). Their report on the
apparently accelerated rate of GH amino acid evolution in pied flycatcher is consistent with our
finding, although they included only GH gene paralog S for the single passerine examined.
Because newly duplicated genes are functionally redundant, selective constraints on the
duplicated genes are likely to become relaxed, allowing some mutational variation to be sustained.
This variation, in turn, may allow molecular evolution to proceed more rapidly than in
single-copy homologs. These duplicated genes are expected to have one of three possible fates
(Ohno 1970; Lynch and Conery 2000; Zhang 2003; Hurles 2004, Sassi, Braun and Benner 2007):
(1) one of the duplicates becomes a pseudogene due to degenerative mutations
(nonfunctionalization), (2) one of the duplicates gains a new function due to a new, advantageous
mutation (neofunctionalization), and (3) the original functions of the single-copy gene may be
partitioned between the duplicates (subfunctionalization). The observed patterns of evolution in
the passerine GH genes are unlikely to reflect nonfunctionalization in which only one copy is
expected to exhibit an increased rate of evolution, with a value of approaching (but not
by guest on August 23, 2015
http://mbe.oxfordjournals.org/
Dow
nloaded from
- 17 -
exceeding) unity (Sassi, Braun, and Benner 2007). Mutations that interrupt the reading frame are
also expected after some time, and neither prediction has been met for passerine GH genes. The
majority of gene duplications appear to be preserved by subfunctionalization (Lynch and Force
2000), a process that may begin with differences in gene expression reflecting small changes in
regulatory regions of the duplicated genes (Force et al. 1999). As many genes perform a
multiplicity of subtly distinct functions, selective pressures may have resulted in a compromise
between optimal sequences for each role. Once the functions of the duplicates begin to diverge,
amino acid changes related to functional specialization of each duplicate are likely to be adaptive,
and both duplicates will evolve rapidly until subfunctionalization is complete (Hughes 1994).
Therefore, subfunctionalization can explain the rapid amino acid evolution often reported in both
gene duplicates after a gene duplication event (Wallis 1996). Because subfunctionalization is
more common than neofunctionalization and consistent with the evidence for accelerated amino
acid evolution in both passerine GH gene paralogs, we believe that it is the more likely
explanation for the preservation of both paralogs. However, we cannot rigorously exclude
neofunctionalization as an alternative explanation.
The explosive radiation of passerines has intrigued many avian biologists and systematists
for more than a century (e.g. Müller 1878; Ames 1971; Raikow 1982; Edwards, Arctander and
Wilson 1991; Nee, Mooers and Harvey 1992; Barker et al. 2004). However, there are only a few
obvious "key innovations" recognized in this group, and some systematists have questioned
whether Passeriformes includes an arbitrarily large number of species (e.g. Raikow 1986; Raikow
and Bledsoe 2000). Could the growth hormone gene duplication reported here have played a
significant role in the passerine radiation? The maintenance of two growth hormone gene copies
since some time before the separation of New Zealand wrens (Acanthisittidae) from other
by guest on August 23, 2015
http://mbe.oxfordjournals.org/
Dow
nloaded from

- 18 -
passerines, between 55 and 100 million years ago (Boles 1995, Ericson et al. 2002, Barker et al.
2004, Pereira and Baker 2006), indicates that the second copy must be functional. Because of the
importance of growth hormone to development and the accelerated development observed in
passerines relative to many other groups of birds (Ricklefs 1979; Ricklefs and Starck 1998), we
speculate that this duplication may be of adaptive significance. Future work on the functions of
duplicated growth hormone genes in passerines may yield insight into the evolutionary success of
this most speciose group of birds.
Supplementary Material
Supplementary tables and figures are available at Molecular Biology and Evolution online
(http://www.mbe.oxfordjournals.org/).
Acknowledgments
For tissue samples we thank the following institutions (in alphabetical order) and
collectors (supplementary table S1, Supplementary Material online): American Museum of
Natural History, Auckland Museum, Australian National Wildlife Collection, Burke Museum of
Natural History and Culture (University of Washington), Field Museum of Natural History,
University of Kansas Natural History Museum & Biodiversity Center, Louisiana State University
Museum of Natural Science, Marjorie Barrick Museum (University of Nevada, Las Vegas),
Museum of Southwestern Biology (University of New Mexico), Museum of Vertebrate Zoology
(University of California, Berkeley), Museum Victoria, National Museum of Natural History, San
by guest on August 23, 2015
http://mbe.oxfordjournals.org/
Dow
nloaded from
- 19 -
Francisco Zoological Garden, and Zoological Museum University of Copenhagen. We are
grateful to our collaborators in the Early Bird project (in alphabetical order), Rauri Bowie, Jena
Chojnowski, Shannon Hackett, Kin-Lan Han, John Harshman, Chris Huddleston, Ben Marks,
Kathy Miglia, Bill Moore, Sushma Reddy, Fred Sheldon, Dave Steadman, and Chris Witt for
providing unpublished trees and valuable insights and comments. This work was supported by the
NSF "Assembling the Tree of Life" program (DEB-0228617, DEB-0228675, DEB-0228682, and
DEB-0228688).
by guest on August 23, 2015
http://mbe.oxfordjournals.org/
Dow
nloaded from
- 20 -
Literature cited
Agellon LB, Davies SL, Lin C-M, Chen TT, Powers DA. 1988. Rainbow trout has two genes for
growth hormone. Mol. Reprod. Dev. 1: 11-17.
Ames PL. 1971. The morphology of the syrinx in passerine birds. Bull. Peabody Mus. Nat. Hist.
37: 1-94.
Aramburo C, Luna M, Carranza M, Reyes M, Martinez-Coria H, et al. 2000. Growth hormone
size variants: Changes in the pituitary during development of the chicken. Proc. Soc. Exp.
Biol. Med. 223: 67-74.
Barker FK, Cibois A, Schikler P, Feinstein J, Cracraft J. 2004. Phylogeny and diversification of
the largest avian radiation. Proc. Natl. Acad. Sci. USA 101: 11040-11045.
Benjamini Y, Yekutieli D. 2001. The control of the false discovery rate in multiple testing under
dependency. Ann. Stat. 29: 1165-1188.
Boles WE. 1995. The world’s oldest songbird (Aves: Passeriformes). Nature 374: 21-22.
Bonferroni CE. 1936. Teoria statistica delle classi e calcolo delle probabilità. Pubblicazioni del R
Istituto Superiore di Scienze Economiche e Commerciali di Firenze 8: 3-62.
Buggiotti L, Primmer CR. 2006. Molecular evolution of the avian growth hormone gene and
comparison with its mammalian counterpart. J. Evol. Biol. 19: 844-854.
Chen EY, Liao YC, Smith DH, Barrera-Saldana HA, Gelinas RE, et al. 1989. The human growth
hormone locus: nucleotide sequence, biology, and evolution. Genomics 4: 479-497.
de Vos AM, Ultsch M, Kossiakoff AA. 1992. Human growth hormone and extracellular domain
of its receptor: Crystal structure of the complex. Science 255: 306-312.
Devlin RH. 1993. Sequence of sockeye salmon type 1 and type 2 growth hormone genes and the
by guest on August 23, 2015
http://mbe.oxfordjournals.org/
Dow
nloaded from
- 21 -
relationship of rainbow trout with Atlantic and Pacific salmon. Can. J. Fish. Aquat. Sci. 50:
1738-1748.
Dill, KA. 1990. Dominant forces in protein folding. Biochemistry, 29: 7133-7155.
Edwards SV, Arctander P, Wilson AC. 1991. Mitochondrial resolution of a deep branch in the
genealogical tree for perching birds. Proc. R. Soc. Lond. B. Biol. Sci. 243: 99-107.
Ericson PGP, Christidis L, Cooper A, Irestedt M, Jackson J, Johansson US, Norman JA. 2002. A
Gondwanan origin of passerine birds supported by DNA sequences of the endemic New
Zealand wrens. Proc. R. Soc. Lond. B 269: 235-241.
Etherton TD, Bauman DE. 1998. Biology of somatotropin in growth and lactation of domestic
animals. Physiol. Rev. 78: 745-761.
Force A, Lynch M, Pickett FB, Amores A, Yan YL, et al. 1999. Preservation of duplicate genes
by complementary, degenerative mutations. Genetics 151: 1531-1545.
Gelman A and Rubin DB. 1992. Inference from iterative simulation using multiple sequences,
Stat. Sci. 7: 457-511.
Goldman N, Yang Z. 1994. A codon-based model of nucleotide substitution for protein-coding
DNA sequences. Mol. Biol. Evol. 11: 725-736.
Gu X. 1999. Statistical methods for testing functional divergence after gene duplication. Mol.
Biol. Evol. 16: 1664-1674.
Harvey S, Hull KL. 1997. Growth hormone: a paracrine growth factor? Endocrine 7: 267-279.
Hochberg Y. 1988. A sharper bonferroni procedure for multiple tests of significance. Biometrika
75: 800-802.
Huang HC, Brown DD. 2000. Overexpression of Xenopus laevis growth hormone stimulates
growth of tadpoles and frogs. Proc. Natl. Acad. Sci. USA 97: 190-194.
by guest on August 23, 2015
http://mbe.oxfordjournals.org/
Dow
nloaded from
- 22 -
Huelsenbeck JP, Ronquist F. 2001. MRBAYES: Bayesian inference of phylogenetic trees.
Bioinformatics 17: 754-755.
Hughes AL. 1994. The evolution of functionally novel proteins after gene duplication. Proc. Biol.
Sci. 256: 119-124.
Hurles M. 2004. Gene duplication: The genomic trade in spare parts. PLoS Biol. 2: 900-904.
International Chicken Genome Sequencing Consortium. 2004. Sequence and comparative
analysis of the chicken genome provide unique perspectives on vertebrate evolution. Nature
432: 695-716.
Ip CYS, Zhang X, Leung FC. 2001. Genomic growth hormone gene polymorphisms in native
Chinese chickens. Exp. Biol. Med. 226: 458-462.
Kawauchi H, Suzuki K, Yamazaki T, Moriyama S, Nozaki M, et al. 2002. Identification of
growth hormone in the sea lamprey, an extant representative of a group of the most ancient
vertebrates. Endocrinology 143: 4916-4921.
Kosakovsky Pond SL, Frost SDW, Muse SV. 2005. HyPhy: hypothesis testing using phylogenies.
Bioinformatics 21: 676-679.
Lewis PO. 1998. A Genetic Algorithm for Maximum-Likelihood Phylogeny Inference Using
Nucleotide Sequence Data. Mol. Biol. Evol. 15:277–283.
Liu JC, Makova KD, Adkins RM, Gibson S, Li WH. 2001. Episodic evolution of growth
hormone in primates and emergence of the species specificity of human growth hormone
receptor. Mol. Biol. Evol. 18: 945-953.
Lynch M, Conery JS. 2000. The evolutionary fate and consequences of duplicate genes. Science
290: 1151-1155.
Lynch M, Force, A. 2000. The Probability of Duplicate Gene Preservation by
by guest on August 23, 2015
http://mbe.oxfordjournals.org/
Dow
nloaded from
- 23 -
Subfunctionalization. Genetics 154: 459-473
Maniou Z, Wallis OC, Wallis M. 2004. Episodic molecular evolution of pituitary growth
hormone in Cetartiodactyla. J. Mol. Evol. 58: 743-753.
Martin AP and Palumbi SR. 1993. Body size, metabolic rate, generation time, and the molecular
clock. Proc. Natl. Acad. Sci. USA 90: 4087-4091.
McKay SJ, Trautner J, Smith MJ, Koop BF, Devlin RH. 2004. Evolution of duplicated growth
hormone genes in autotetraploid salmonid fishes. Genome S 47: 714-723.
Miller RG. 1981. Simultaneous statistical inference, 2nd ed. New York: Springer-Verlag.
Montgelard C, Catzeflis FM, Douzery E. 1997. Phylogenetic relationships of artiodactyls and
cetaceans as deduced from the comparison of cytochrome b and 12S rRNA mitochondrial
sequences. Mol. Biol. Evol. 14: 550-559.
Müller JP. 1878. On certain variations in the vocal organs of the Passeres that have hitherto
escaped notice. London: Macmillan.
Nee S, Mooers AO, Harvey PH. 1992. Tempo and mode of evolution revealed from molecular
phylogenies. Proc. Nati. Acad. Sci. USA 89: 8322-8326.
Nielsen R, Yang Z. 1998. Likelihood models for detecting positively selected amino acid sites
and applications to the HIV-1 envelope gene. Genetics 148: 929–936.
Ohno S. 1970. Evolution by Gene Duplication. New York: Springer.
Ohta T. 1993. Pattern of nucleotide substitutions in growth hormone-prolactin gene family: A
paradigm for evolution by gene duplication. Genetics 134: 1271-1276.
O'Neil KT, Degrado WF. 1990. A thermodynamic scale for the helix-forming tendencies of the
commonly occurring amino acids. Science 250: 646-651.
Pereira SL, Baker AJ. 2006. A mitogenomic timescale for birds detects variable phylogenetic
by guest on August 23, 2015
http://mbe.oxfordjournals.org/
Dow
nloaded from
- 24 -
rates of molecular evolution and refutes the standard molecular clock. Mol. Biol. Evol. 23:
1731-1740
Raikow RJ. 1982. Monophyly of the Passeriformes: test of a phylogenetic hypothesis. Auk 99:
431-455.
Raikow RJ, Bledsoe AH. 2000. Phylogeny and evolution of the passerine birds. Bioscience 50:
487-499.
Raikow RJ. 1986. Why are there so many kinds of passerine birds? Syst. Zool. 35: 255-259.
R Development Core Team. 2007. R: A language and environment for statistical computing.
Vienna, Austria: R Foundation for Statistical Computing.
Rentier-Delrue F, Swennen D, Mercier L, Lion M, Benrubi O, et al. 1989. Molecular cloning and
characterization of two forms of trout growth hormone cDNA: expression and secretion of
tGH-II by Escherichia coli. DNA 8: 109-117.
Ricklefs RE. 1979. Patterns of growth in birds. V. A comparative study of development in the
Starling, Common Tern, and Japanese Quail. Auk 96: 10-30.
Ricklefs RE, Starck JM. 1998. Embryonic growth and development. In: Starck JM, Ricklefs RE,
editors. Avian Growth and Development. New York: Oxford Univ. Press. p. 31-58.
Ronquist F, Huelsenbeck JP. 2003. MrBayes 3: Bayesian phylogenetic inference under mixed
models. Bioinformatics 19: 1572-1574.
Sanders EJ, Harvey S. 2004. Growth hormone as an early embryonic growth and differentiation
factor. Anat. Embryol. 209: 1-9.
Sassi SO, Braun EL, Benner SA. 2007. The Evolution of Seminal Ribonuclease: Pseudogene
Reactivation or Multiple Gene Inactivation Events? Mol. Biol. Evol. 24:1012-1024.
Sibley CG, Ahlquist JE. 1990. Phylogeny and Classification of Birds. New Haven, CT: Yale
by guest on August 23, 2015
http://mbe.oxfordjournals.org/
Dow
nloaded from
- 25 -
University Press.
van Tuinen M, Sibley CG, Hedges SB. 2000. The early history of modern birds inferred from
DNA sequences of nuclear and mitochondrial ribosomal genes. Mol. Biol. Evol. 17:
451-457
Wallis M. 1981. The molecular evolution of pituitary growth hormone, prolactin and placental
lactogen: A protein family showing variable rates of evolution. J. Mol. Evol. 17: 10-17.
Wallis M. 1994. Variable evolutionary rates in the molecular evolution of mammalian growth
hormones. J. Mol. Evol. 38: 619-627.
Wallis M. 1996. The molecular evolution of vertebrate growth hormones: A pattern of near-stasis
interrupted by sustained bursts of rapid change. J. Mol. Evol. 43: 93-100.
Wallis M, Lioupis A, Wallis OC. 1998. Duplicate growth hormone genes in sheep and goat -
Commentary. J. Mol. Endocrinol. 21: 1-5.
Wallis OC, Wallis M. 2001. Molecular evolution of growth hormone (GH) in Cetartiodactyla:
Cloning and characterization of the gene encoding GH from a primitive ruminant, the
chevrotain (Tragulus javanicus). Gen. Comp. Endocrinol. 123: 62-72.
Wallis OC, Wallis M. 2002. Characterisation of the GH gene cluster in a new-world monkey, the
marmoset (Callithrix jacchus). J. Mol. Endocrinol. 29:
Wang YF, Gu X. 2001. Functional divergence in the caspase gene family and altered functional
constraints: Statistical analysis and prediction. Genetics 158: 1311-1320.
Waters MJ, Shang CA, Behncken SN, Tam SP, Li H, et al. 1999. Growth hormone as a cytokine.
Clin. Exp. Pharmacol. Physiol. 26: 760-764.
Whelan S, Goldman N. 2001. A general empirical model of protein evolution derived from
multiple protein families using a maximum-likelihood approach. Mol. Biol. Evol. 18:
by guest on August 23, 2015
http://mbe.oxfordjournals.org/
Dow
nloaded from
- 26 -
691-699.
Wong WSW, Yang Z, Goldman N, Nielsen R. 2004. Accuracy and power of statistical methods
for detecting adaptive evolution in protein coding sequences and for identifying positively
selected sites. Genetics 168: 1041-1051.
Yang ZH. 1997. PAML: a program package for phylogenetic analysis by maximum likelihood.
Comput. Appl. Biosci. 13: 555-556.
Yang Z, Nielsen R, Goldman, N, Pedersen AM. 2000. Codon substitution models for
heterogeneous selection pressure at amino acid sites. Genetics 155: 431–449.
Yang ZH, Wong WSW, Nielsen R. 2005. Bayes empirical Bayes inference of amino acid sites
under positive selection. Mol. Biol. Evol. 22: 1107-1118.
Zhang JZ. 2003. Evolution by gene duplication: an update. Trends Ecol. Evol. 18: 292-298.
Zhao RQ, Muehlbauer E, Decuypere E, Grossmann R. 2004. Effect of genotype-nutrition
interaction on growth and somatotropic gene expression in the chicken. Gen. Comp.
Endocrinol. 136: 2-11.
Zwickl DJ. 2006. Genetic algorithm approaches for the phylogenetic analysis of large biological
sequence datasets under the maximum likelihood criterion. Ph.D. dissertation, University of
Texas at Austin.
by guest on August 23, 2015
http://mbe.oxfordjournals.org/
Dow
nloaded from
- 27 -
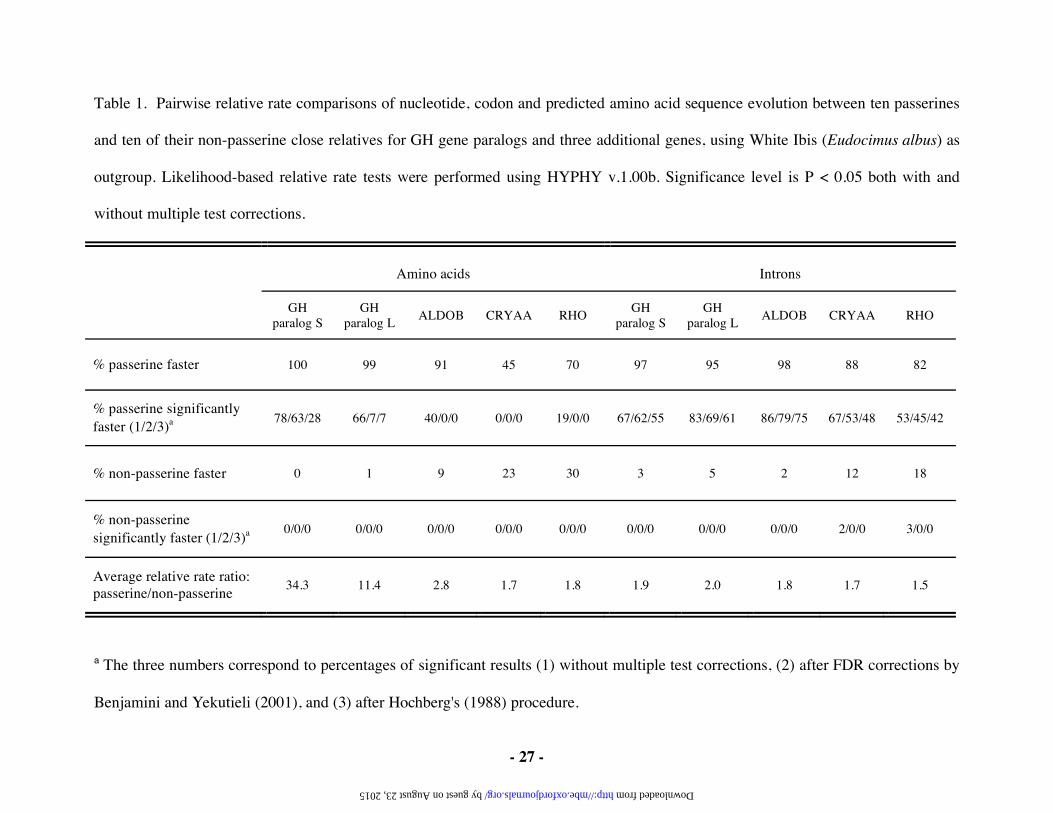
Table 1. Pairwise relative rate comparisons of nucleotide, codon and predicted amino acid sequence evolution between ten passerines
and ten of their non-passerine close relatives for GH gene paralogs and three additional genes, using White Ibis (Eudocimus albus) as
outgroup. Likelihood-based relative rate tests were performed using HYPHY v.1.00b. Significance level is P < 0.05 both with and
without multiple test corrections.
Amino acids Introns
GH paralog S
GH paralog L
ALDOB CRYAA RHO GH
paralog S GH
paralog L ALDOB CRYAA RHO
% passerine faster 100 99 91 45 70 97 95 98 88 82
% passerine significantly faster (1/2/3)a
78/63/28 66/7/7 40/0/0 0/0/0 19/0/0 67/62/55 83/69/61 86/79/75 67/53/48 53/45/42
% non-passerine faster 0 1 9 23 30 3 5 2 12 18
% non-passerine significantly faster (1/2/3)a
0/0/0 0/0/0 0/0/0 0/0/0 0/0/0 0/0/0 0/0/0 0/0/0 2/0/0 3/0/0
Average relative rate ratio: passerine/non-passerine
34.3 11.4 2.8 1.7 1.8 1.9 2.0 1.8 1.7 1.5
a The three numbers correspond to percentages of significant results (1) without multiple test corrections, (2) after FDR corrections by
Benjamini and Yekutieli (2001), and (3) after Hochberg's (1988) procedure.
by guest on August 23, 2015 http://mbe.oxfordjournals.org/ Downloaded from
- 28 -
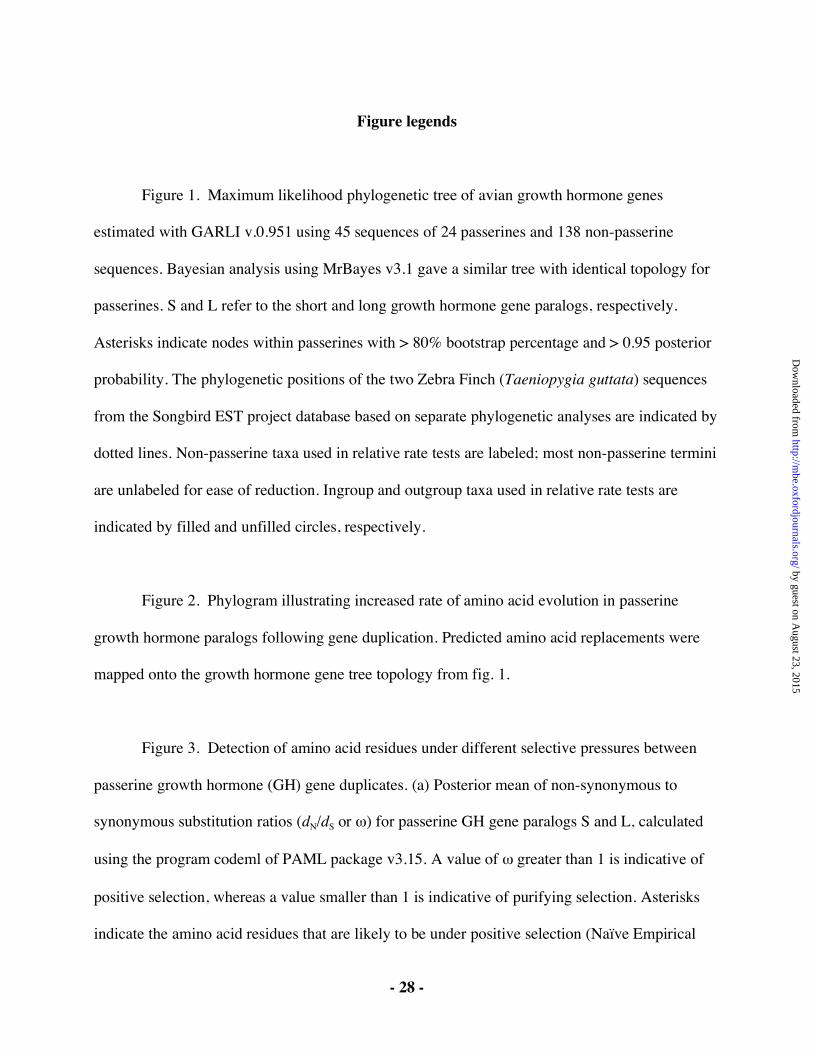
Figure legends
Figure 1. Maximum likelihood phylogenetic tree of avian growth hormone genes
estimated with GARLI v.0.951 using 45 sequences of 24 passerines and 138 non-passerine
sequences. Bayesian analysis using MrBayes v3.1 gave a similar tree with identical topology for
passerines. S and L refer to the short and long growth hormone gene paralogs, respectively.
Asterisks indicate nodes within passerines with > 80% bootstrap percentage and > 0.95 posterior
probability. The phylogenetic positions of the two Zebra Finch (Taeniopygia guttata) sequences
from the Songbird EST project database based on separate phylogenetic analyses are indicated by
dotted lines. Non-passerine taxa used in relative rate tests are labeled; most non-passerine termini
are unlabeled for ease of reduction. Ingroup and outgroup taxa used in relative rate tests are
indicated by filled and unfilled circles, respectively.
Figure 2. Phylogram illustrating increased rate of amino acid evolution in passerine
growth hormone paralogs following gene duplication. Predicted amino acid replacements were
mapped onto the growth hormone gene tree topology from fig. 1.
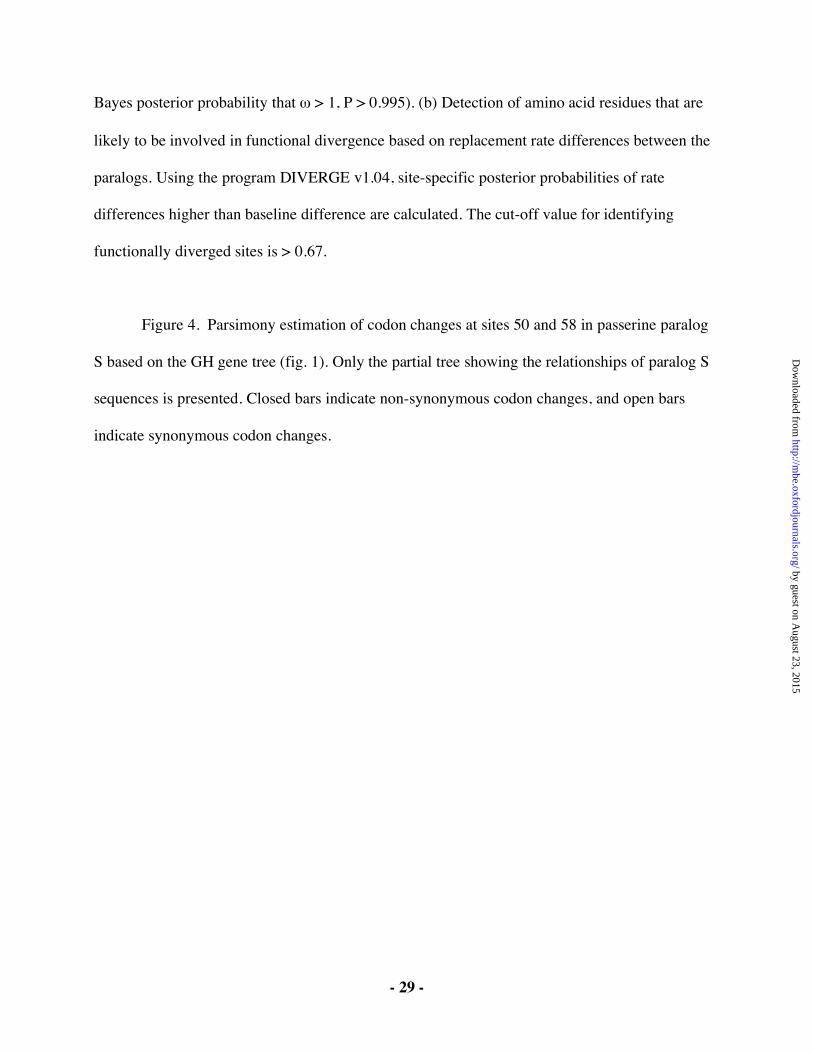
Figure 3. Detection of amino acid residues under different selective pressures between
passerine growth hormone (GH) gene duplicates. (a) Posterior mean of non-synonymous to
synonymous substitution ratios (dN/dS or ) for passerine GH gene paralogs S and L, calculated
using the program codeml of PAML package v3.15. A value of greater than 1 is indicative of
positive selection, whereas a value smaller than 1 is indicative of purifying selection. Asterisks
indicate the amino acid residues that are likely to be under positive selection (Naïve Empirical
by guest on August 23, 2015
http://mbe.oxfordjournals.org/
Dow
nloaded from
- 29 -
Bayes posterior probability that > 1, P > 0.995). (b) Detection of amino acid residues that are
likely to be involved in functional divergence based on replacement rate differences between the
paralogs. Using the program DIVERGE v1.04, site-specific posterior probabilities of rate
differences higher than baseline difference are calculated. The cut-off value for identifying
functionally diverged sites is > 0.67.
Figure 4. Parsimony estimation of codon changes at sites 50 and 58 in passerine paralog
S based on the GH gene tree (fig. 1). Only the partial tree showing the relationships of paralog S
sequences is presented. Closed bars indicate non-synonymous codon changes, and open bars
indicate synonymous codon changes.
by guest on August 23, 2015
http://mbe.oxfordjournals.org/
Dow
nloaded from
Sylvia SRegulus S
Ploceus SVidua S
Bombycilla S
Turdus SPicathartes S
Corvus SMalurus S
Menura SDendrocolaptes S
Scytalopus SGrallaria S
Thamnophilus SMionectes S
Tyrannus SPipra S
Pitta SSmithornis S
Sapayoa SAcanthisitta S
Ploceus LVidua L
Bombycilla LSylvia L
Turdus LRegulus L
Corvus LPicathartes L
Climacteris LMenura L
Dendrocolaptes LScytalopus L
Thamnophilus LMionectes L
Tyrannus LPipra L
Pitta LSapayoa L
Smithornis LAcanthisitta L
0.1
*
**
*
**
*
*
*
*
*
*
*
**
*
*
*
*
*
*
*
**
**
*
*
*
Fringilla SPasser S
Zebra Finch S
Fringilla LPasser L
Zebra Finch L
Passerineparalog S
Passerine paralog L
Non-passerines
Eudocimus
Caprimulgus
Aramus
Micropsitta
Falco
BrachypteraciasTrogonPandion
SpeotytoCathartes Leptosomus
Galbula
Colius
Neoaves
Fig. 1
by guest on August 23, 2015
http://mbe.oxfordjournals.org/
Dow
nloaded from
1 change
Non-passerines
Passerine paralog S
Passerine paralog L
Fig. 2
by guest on August 23, 2015
http://mbe.oxfordjournals.org/
Dow
nloaded from
0.0
0.2
0.4
0.6
0.8
1.0
1.2
1.4
1.6
Paralog LParalog S
82797673706764615855524946434037343128252219161310741
*
Neutralevolution
Positiveselection
Purifyingselection
Post
erio
r mea
n ω
0.5
0.6
0.7
0.8
0.9
82797673706764615855524946434037343128252219161310741
Amino acid residues
Post
erio
r pro
bab
ility
a)
b) 1.0
*
Fig. 3
by guest on August 23, 2015
http://mbe.oxfordjournals.org/
Dow
nloaded from
Sylvia S
Regulus S
Ploceus S
Vidua S
Bombycilla S
Turdus S
Picathartes S
Corvus S
Malurus S
Menura S
Dendrocolaptes S
Scytalopus S
Grallaria S
Thamnophilus S
Mionectes S
Tyrannus S
Pipra S
Pitta S
Smithornis S
Sapayoa S
Acanthisitta S
Fringilla S
Passer S
Zebra Finch S
Codon 50
ATG(Met) -> GCA (Ala)
ATG (Met) -> ACA (Thr)
ATG (Met) -> ATT (Ile)
ATT (Ile) -> GCT (Ala)
ATT (Ile) -> ATG (Met)
Estimated ancestral state of the entire avian clade and passerine paralog clades: ATG (Met)
Codon 58
GTT (Val) -> GCT (Ala)
GTT (Val) -> ATT (Ile)
GTT (Val) -> CTT (Leu)
GTT (Val) -> ATT (Ile)
GTT (Val) -> ATT (Ile)
GTT (Val) -> GTC (Val)Sylvia S
Regulus S
Ploceus S
Vidua S
Bombycilla S
Turdus S
Picathartes S
Corvus S
Malurus S
Menura S
Dendrocolaptes S
Scytalopus S
Grallaria S
Thamnophilus S
Mionectes S
Tyrannus S
Pipra S
Pitta S
Smithornis S
Sapayoa S
Acanthisitta S
Fringilla S
Passer S
Zebra Finch S
Estimated ancestral state of the entire avian clade and passerine paralog clades: GTT (Val)
Oscines Oscines
Fig. 4
by guest on August 23, 2015
http://mbe.oxfordjournals.org/
Dow
nloaded from
Copyright © 2022 FDOKUMEN