Complex life cycles of multicellular eukaryotes: New approaches based on the use of model organisms
Upload
danutahincCategory
view
0download
0
Tumor-associated Carbonic Anhydrase 9 SpatiallyCoordinates Intracellular pH in Three-dimensionalMulticellular Growths*□S
Received for publication, February 19, 2008, and in revised form, April 30, 2008 Published, JBC Papers in Press, May 15, 2008, DOI 10.1074/jbc.M801330200
Pawel Swietach‡, Simon Wigfield§, Philip Cobden‡, Claudiu T. Supuran¶, Adrian L. Harris§1,and Richard D. Vaughan-Jones‡1,2
From the ‡Department of Physiology, Anatomy, and Genetics, Burdon Sanderson Cardiac Science Centre,Oxford OX1 3PT, United Kingdom, the §Weatherall Institute of Molecular Medicine, Oxford OX3 9DS, United Kingdom, and the¶Laboratorio di Chimica Bioinorganica, Universita degli Studi di Firenze, Firenze I-50019, Italy
CA9 is a membrane-tethered, carbonic anhydrase (CA)enzyme, expressed mainly at the external surface of cells, thatcatalyzes reversible CO2 hydration. Expression is greatlyenhanced in many tumors, particularly in aggressive carcino-mas. The functional role of CA9 in tumors is not well estab-lished. Here we show that CA9, when expressed heterologouslyin cultured spheroids (0.5-mm diameter, �25,000 cells) ofRT112 cells (derived from bladder carcinoma), induces a near-uniform intracellular pH (pHi) throughout the structure.Dynamic pHi changes during displacements of superfusate CO2concentration are also spatially coincident (within 2 s). In con-trast, spheroids of wild-type RT112 cells lacking CA9 exhibit anacidic core (�0.25 pHi reduction) and significant time delays(�9 s) for pHi changes in core versus peripheral regions. pHinon-uniformity also occurs in CA9-expressing spheroids afterselective pharmacological inhibition of the enzyme. In isolatedRT112 cells, pHi regulation is unaffected by CA9 expression.The influence ofCA9onpHi is thus only evident inmulticellulartissue. Diffusion-reaction modeling indicates that CA9 coordi-nates pHi spatially by facilitating CO2 diffusion in the unstirredextracellular space of the spheroid.We suggest that pHi coordi-nation may favor survival and growth of a tumor. By disruptingspatial pHi control, inhibition of CA9 activity may offer a novelstrategy for the clinical treatment of CA9-associated tumors.
Intracellular H� ions are powerful modulators of physiolog-ical and biochemical processes, including cell growth, division,and development (1–3). Many metabolic reactions within thecell generate H� ions as end-products (4). Because of their highchemical reactivity, particularly with intracellular proteins,these ions must be removed if normal cell function is to con-tinue. Tumors display a notably high rate ofH� ion production,
partly because their growth demands a ready supply of energy,but also because much of the metabolism that supports this isanaerobic (5). Energy production via extramitochondrial routesis associated with a larger metabolic flux of acid per ATP mol-ecule (4). Indeed, growing tumors are typically hypoxic, result-ing in stabilization of hypoxia-inducible factor 1�, which up-regulates a variety of proteins, including enzymes that controlglycolytic lactic acid production (6). If intracellular H� ionsaccumulate, intracellular pH (pHi)3 falls and cellular activitybecomes compromised.One solution is for cells to express plas-malemmal ion transport proteins that extrude excess H�
equivalents (7). Extrusion is achieved either by expelling H�
ions directly (e.g. via Na�-H� exchangers, H�-lactate co trans-porters, and H�-ATPases), or by importing HCO3
� anions (e.g.via Na�-dependent HCO3
� transporters), to neutralize intra-cellular H� ions. The pHi of tumor cells, like that of most othereukaryotic cells, appears to be relatively alkaline (pHi � 7.2),indicating that they possess an efficient system for eliminatingH� ions (8, 9).Inmany cell types the enzyme carbonic anhydrase (CA) plays
an important role in the regulation of pHi. The �-CA familyexpressed in eukaryotic cells comprises at least 13 catalyticallyactive isozymes (10). These enzymes, in effect, catalyze thereversible buffering of H� by HCO3
� ions. This generates CO2,which is highly membrane-permeant, and therefore diffusesout of the cell. Despite significant contributions from anaerobicmetabolism, many growing tumors produce large quantities ofCO2, suggesting that chemical buffering by HCO3
� is an impor-tant strategy for dealing with metabolic acid production (11,12). CA can further assist pHi regulation by binding to variousHCO3
� transporters forming a protein complex, a transportmetabolon (13, 14). CA activitymay enhance theH� equivalentflux of the transporter (14, 15), thus increasing the efficiency ofpHi regulation, although this mechanism has been disputed(16). The enzyme also facilitates H� ion diffusion inside cells(17), which would otherwise be slowed considerably by thepresence of intracellular fixed buffer sites, particularly on pro-teins. In addition, CA can facilitate CO2 diffusion by reversiblyconverting the gas into diffusible HCO3
� anions (18).
* This work was supported by the British Heart Foundation (to R. D. V.-J.),Cancer Research UK (to A. L. H.), and European Framework 6 EUROXY (toA. L. H.). The costs of publication of this article were defrayed in part by thepayment of page charges. This article must therefore be hereby marked“advertisement” in accordance with 18 U.S.C. Section 1734 solely to indi-cate this fact.
□S The on-line version of this article (available at http://www.jbc.org) containssupplemental text, equations, Figs. S1 and S2, and Table S1.
1 Both authors contributed equally to this work.2 To whom correspondence should be addressed: Tel./Fax: 44-1865-272451;
E-mail: [email protected].
3 The abbreviations used are: pHi, intracellular pH; pHe, extracellular pH; CA,carbonic anhydrase; ATZ, acetazolamide; 14v, 1-[4-([5-(aminosulfonyl)-1,3,4-thiadiazol-2-yl]-aminosulfonyl)phenyl]-3,5-nonylene-2,6-dimethylpyridinium perchlorate; ROI, regions of interest; EV, empty vector.
THE JOURNAL OF BIOLOGICAL CHEMISTRY VOL. 283, NO. 29, pp. 20473–20483, July 18, 2008© 2008 by The American Society for Biochemistry and Molecular Biology, Inc. Printed in the U.S.A.
JULY 18, 2008 • VOLUME 283 • NUMBER 29 JOURNAL OF BIOLOGICAL CHEMISTRY 20473
by guest on May 18, 2016
http://ww
w.jbc.org/
Dow
nloaded from
by guest on May 18, 2016
http://ww
w.jbc.org/
Dow
nloaded from
by guest on May 18, 2016
http://ww
w.jbc.org/
Dow
nloaded from
by guest on May 18, 2016
http://ww
w.jbc.org/
Dow
nloaded from
by guest on May 18, 2016
http://ww
w.jbc.org/
Dow
nloaded from
by guest on May 18, 2016
http://ww
w.jbc.org/
Dow
nloaded from

CA9 is an isoform highly expressed by many developingtumors (19–21), including von Hippel-Lindau-defectivetumors (19, 22). CA9 expression correlates with hypoxia (21,23, 24) and is regulated by hypoxia-inducible factor 1� (25).CA9 is now an establishedmarker for several aggressive cancerssuch as breast cancer (26, 27) and non-small cell lung cancer(28). Generic inhibitors of CA activity, like acetazolamide(ATZ), have been used experimentally to attenuate tumorgrowth, suggesting an important role for the catalytic activity ofthe enzyme (29, 30). Specific targeting of CA9 by RNA interfer-ence also reduces growth and survival under hypoxic condi-tions in cell monolayers (31). Despite this evidence, the natureand mechanism of CA9 involvement are not well established.The enzyme is anchored principally to the surfacemembrane oftumor cells, with its active site oriented toward the extracellularspace. It is therefore likely to catalyze the hydration of CO2 thatemerges from a cell, producing H� and HCO3
� ions. This maythen facilitate the diffusion of more CO2 from the cell.Enhanced extracellular CO2 hydration would reduce localextracellular pH (pHe) (19, 32). Indeed, pHe in poorly vascular-ized tumors is notably acidic (�6.9), a feature that is thought toencourage host-tissue regression, thereby assisting furthertumor development (33–35). Although possible effects of CA9on pHe have been recognized, there has been less considerationof its effect on pHi. Nevertheless, recent reports suggest that, inheterologous expression systems, CA9 forms a functionaltransport metabolon with HCO3
� transporters (13), suggestinga specific role for the enzyme in pHi regulation.In the present work we have explored the contribution of
CA9 to the regulation of pHi in three-dimensionalmulticellulargrowths. We have developed a system for confocally imagingpHi spatiallywithin cultured spheroids of RT112 cells, using theintracellular pH fluorophore, carboxy-SNARF-1. These cells,derived from bladder tumor cells, do not constitutively expressCA9. Multicellular spheroids can therefore be grown that lackCA9, and these can be compared with others grown fromRT112 cells stably transfected with the enzyme. We find that,although CA9 does not enhance H� equivalent transport inisolated RT112 cells, its presence exerts a remarkable effect onthe spatial control of pHi within a multicellular spheroid. Wedevelop a three-dimensional computational model to explorethe relationship between extracellular CA9 expression and thespatial coordination of pHi. Results of both the experiments andthe model suggest a novel role for the enzyme in reducing pHinon-uniformity in multicellular structures. This role may pro-vide insight into the functional importance of CA9 in tumordevelopment.
EXPERIMENTAL PROCEDURES
Stable Transfection of RT112 Cells—RT112 cells were trans-fectedwith the cDNAof humanCA9 (a gift fromDr. J. Pastorek,Bratislava) or empty vector using a published technique (31).To grow spheroids, cells were seeded into agarose-coated96-well plates (�20,000 cells/well) and cultured for 72 h (36).Western Blotting—Cells were homogenized in lysis buffer
(6.2 M urea, 10% glycerol, 5mM dithiothreitol, 1% SDS, proteaseinhibitor), and the whole cell extract was separated on 10%SDS-PAGE and transferred to polyvinylidene difluoride mem-
brane using a semidry blotter (Wep Company, UK). Primaryantibodies used were mouse monoclonal M75 to CA9 (a giftfrom Dr. J. Pastorek), CA2 (Abcam, UK), and mouse anti-�-tubulin monoclonal antibody (Sigma). Immunoreactivity wasvisualized with horseradish peroxidase-linked goat anti-mouseor anti-rabbit serum at 1:1000 and detected with enhancedchemiluminescence.Caspase Staining—To assess apoptosis, spheroids were fixed
in liquid N2 and labeled immunohistochemically with mousecaspase-3 antibodies and rabbit polyclonal anti-mouse anti-bodies (0.1 �g/ml, R&D Systems, UK).Solutions—0% CO2/0 mM HCO3
� buffer: 135 mM NaCl, 20mM Hepes, 4.5 mM KCl, 1 mM CaCl2, 1 mM MgCl2, 11 mMglucose, pH adjusted to 7.4 with 4 M NaOH. 5% CO2/22 mMHCO3
� buffer: 115 mM NaCl, 22 mM NaHCO3, 4.5 mM KCl, 1mMCaCl2, 1 mMMgCl2, 11mM glucose, pH adjusted to 7.4 bybubbling with 5% CO2/95% air. Solutions containing NH4Clwere based on the above buffer solutions, with an appropri-ate reduction in [NaCl] to maintain osmolarity at 300 mosM/kg. For Na�-free solutions, Na� salts were replaced byN-methyl-D-glucamine.Drugs—Dimethylamiloride (50 �M, an inhibitor of Na�-H�
exchange), 4,4�-diisothiocyanatostilbene-2,2�-disulfonate (0.5mM, an inhibitor of HCO3
� transport), ATZ (100 �M, a mem-brane-permeantCA inhibitor) were obtained fromSigma. 1-[4-([5-(aminosulfonyl)-1,3,4-thiadiazol-2-yl]-aminosulfonyl)phe-nyl]-3,5-nonylene-2,6-dimethyl pyridinium perchlorate (14v,200–500 nM, a membrane-impermeant CA inhibitor) was syn-thesized in-house (37).Measuring Functional CAActivity—This wasmeasured in (i)
intact cells suspended in CO2-free, isotonic buffer (130 mMNaCl, 5 mM KCl, 20 mM Hepes) or in (ii) whole cell lysates(produced by hypotonic shock in 0.1% Triton X-100, 5-minsonication), suspended in 20 mM Hepes solution. Solution pHwas adjusted to 8.0 at 4 °C. 1.5 ml of suspension was added toa stirred reaction vessel, and pH was monitored (Biotrode,Mettler-Toledo, UK). 0.5 ml of 100% CO2-saturated waterwas added to the cell suspension/lysate, and the rate of acid-ification was analyzed to obtain the CO2 hydration constant(38). Measured rates were normalized to 1 mg of total pro-tein per ml, measured spectrophotometrically (Bradfordassay, Bio-Rad).Superfusion and pHi Imaging—A heated superfusion cham-
ber (37 °C, 1ml) wasmounted on an invertedmicroscope (DM-IRBE, Leica), its base (coverslip) was pre-treated with 0.01%poly-L-lysine to aid cell adhesion. Cells/spheroids were exposedto membrane-permeant acetoxymethyl ester of carboxy-SNARF-1 (20 �M) for 20 min (39). Intracellular pH was imagedconfocally (TCS, Leica) with a 10� lens. Carboxy-SNARF-1was excited by the 514 nm argon laser line, and fluorescenceemission was collected simultaneously at 580 � 20 nm and640 � 20 nm. Acquisition produced 512 � 512 pixel spatialmaps of fluorescence every 1.8 s. Fluorescence was offset forbackground and averaged in regions of interest (ROIs). Inexperiments involving isolated cells, ROIs were defined as dis-crete areas of fluorescence that exceeded a threshold of 10%peak fluorescence and of area between 20 and 120 �m2 (equiv-alent to a cell). In experiments performed on spheroids, the
CA9 Coordinates Tissue pHi
20474 JOURNAL OF BIOLOGICAL CHEMISTRY VOLUME 283 • NUMBER 29 • JULY 18, 2008
by guest on May 18, 2016
http://ww
w.jbc.org/
Dow
nloaded from

outer boundary of the cluster was used to define six layers ofROIs, with concentric centers. Average ROI fluorescence wasratioed (580 to 640 nm) to eliminate differences in cellular dye-loading, light-path and specimen thickness. This is of particularimportance for spheroids, inwhich peripheral cells tend to con-centrate dye more than core cells. Fluorescence ratios werethen converted into pHi (39). The pH signal was intracellular asframe-averaging showed that fluorescence was confined toround objects corresponding to cell outlines. Also, the behaviorof the pH signal was consistent with predicted intracellularevents.Measuring Cell Dimensions and Buffering Capacity—Cell
dimensions were estimated from the mean radius of carboxy-SNARF-1-loaded isolated cells. Intrinsic intracellular H� buff-ering capacity (�int) was measured in single cells superfusedwith 20 mM Hepes-buffered solution (nominally CO2-free).Buffering due to CO2/HCO3
� (�CO2) was measured as theincrease in buffering when cells were superfused with 5%CO2/22 mM HCO3
�-buffered solution. Cells were first super-fused with solution containing 30 mM NH4Cl (generating analkalosis) and then with a sequence of solutions containinglower doses of NH4Cl (20, 10, 5, and 0 mM). These solutionmaneuvers produced stepwise decreases of pHi (40). Bufferingcapacity was calculated from the quotient of the estimate
change in [NH4�]i and the measured
change in pHi (back-extrapolated tothe moment of solution change).Inhibitors of H� equivalent trans-port were included to inhibit slowpHi changes that could otherwiselead to inaccurate estimates of �. InCO2/HCO3
� buffer, allowance wasmade (1–2min) for buffer equilibra-tion (41).Measuring H� Equivalent Mem-
brane Transport—Single cells weresuperfusedwith solution containing30 mM NH4Cl for 4–6 min (“pre-pulse”). Upon returning to solutionwithout NH4Cl, pHi acidifies. ThispHi displacement stimulates H�
equivalent transport. At any givenpHi, its rate of recovery (dpHi/dt)multiplied by the appropriate buff-ering capacity gives an estimate ofthe transmembrane H� equivalentflux (Jmemb
H ) (39).Measuring pHi Changes Induced
by Changes in Superfusate CO2 Par-tial Pressure—The catalytic activityof CA can be studied by changingsuperfusate pCO2 and [HCO3
�] (at aconstant pHe of 7.4). Experimen-tally, this was done by changingsuperfusate buffer from Hepes toCO2/HCO3
�. The slope of the initialpHi change (measured over 15 s)was measured in selected ROIs fol-
lowing a rise or fall in pCO2. To obtain a measure of H� equiv-alent flux (JCO2
H ), the slope was multiplied by �int.
RESULTS
CA Expression in RT112 Cells—RT112 cells were chosen forthis study, because they do not express CA9 under hypoxia (Fig.1A). This eliminates the possibility of additional, hypoxia-in-duced CA9 expression at the core of spheroids, which wouldintroduce unwanted variability into the analysis. Instead, byusing a stably transfected clone, comparable levels ofCA9 couldbe introduced uniformly across spheroids, as described below.Western blots (Fig. 1A) indicated CA9 immunoreactivity inRT112 cells transfected with the CA9 gene (CA9 expressor).Based on a comparison with �-tubulin expression, the level ofCA9 protein expressed with transfection was of a similar orderof magnitude to that induced by hypoxia in breast cancerMDA231 and MDA468 cell lines (31). In contrast, cells trans-fectedwith empty vector (EV) displayedmoderate levels ofCA2(an intrinsic, intracellular CA isoform), but no CA9. Of theclones illustrated in Fig. 1A, EV and CA9 expressor clones #2were used for subsequent experiments.Cell surface CA9 staining was also detected in multicellular
spheroids grown from CA9 expressor but not from EV cells(Fig. 1B). Fluorescence-activated cell sorting analysis indicated
FIGURE 1. CA9 expression in RT112 cells affects apoptosis and carbonic anhydrase activity. A, top panel:absence of CA9 induction under 0.1% hypoxia in RT112 cells. Lower panel: Western blot for CA9, CA2 and�-tubulin (for normalization) protein immunoreactivity in lysates of various CA9 expressor and empty vector(EV) clones. Note the inverse relationship between CA2 and CA9 expression. EV and CA9 expressor clone 2 wereused for subsequent experiments. B, CA9 antibodies detect surface antigen in sections through CA9 expressor(but not in EV) spheroids. CA9 expressor spheroids showed a lower apoptotic index (caspase-3 staining). C, therate of acidification of medium containing CA9 expressor whole cell lysate, following addition of CO2 at 4 °C,provides an estimate of CA activity (n � 4/trace) in the absence (black) or presence of drugs (100 �M ATZ, green;200 nM 14v, blue). D, data (n � 6 –10/bar) collected from intact (left panel) and lysed (right panel) EV and CA9expressor cells, normalized to the spontaneous hydration rate (measured in cell-free experiments, 0.0035s�1)and to total protein concentration.
CA9 Coordinates Tissue pHi
JULY 18, 2008 • VOLUME 283 • NUMBER 29 JOURNAL OF BIOLOGICAL CHEMISTRY 20475
by guest on May 18, 2016
http://ww
w.jbc.org/
Dow
nloaded from

a normal distribution of membrane CA9 in the transfectants(not shown) and, therefore, as expected, some variability inindividual cell staining. Surface CA9 was detected throughouttheCA9 expressor spheroid, unlike the situation in endogenousgrowthswhere hypoxia-induced up-regulation of CA9 typicallyoccurs in the core. Absence of CA9 immunoreactivity in EVspheroids correlated with higher levels of staining forcaspase-3, a marker for apoptosis (Fig. 1B). This suggests thatCA9 expression may confer a degree of protection against celldeath, in agreement with previous studies performed onunclustered cells (31).CA activity was assayed functionally by recording the time
course of acidification of medium containing intact or lysedCA9 expressor or EV cells, following addition of CO2-saturatedsolution (38). An example of the acidification time course (n �
4) with CA9 expressor whole celllysates is shown in Fig. 1C. The acid-ification was slowed to a spontane-ous (uncatalyzed) rate (Fig. 1D) byadding the CA inhibitors, 14v orATZ, confirming the presence ofcatalytic activity.When using non-lysed CA9-ex-
pressing cells in the suspension, theacidification was still considerablyfaster (by 66%) than the spontane-ous, uncatalyzed rate, indicative ofCA9 activity at the external surfaceof the cells (Fig. 1D). The enhancedrate was inhibited by the mem-brane-impermeant CA inhibitor,14v (200 nM), whereas no effect wasseen for EV cell suspensions, con-firming that the active site of thetransfected CA9 was indeed extra-cellular. The increase in CO2 hydra-tion rate observed with CA9-ex-pressing RT112 cells (Fig. 1D) iscomparable to that reported previ-ously inMDA468breast cancer cellsexposed to hypoxia (31). Thus thefunctional activity of CA9 in trans-fected RT112 cells matches thatinduced in hypoxia-respondingtumor cells. Both CA9 proteinexpression and the resulting func-tional activity in RT112 expressorcells are therefore comparable tolevels in hypoxically responsivetumor cell lines.CA9 Effects on Cell Size and Buff-
ering Capacity—To assess effects ofCA9 on pHi regulation, we firstexamined if its expression alteredcell size or cellular H� bufferingcapacity. Analysis of fluorescence(carboxy-SNARF-1) images of cellsshowed no difference between the
radii of CA9 expressor cells (4.89� 2.14 (S.D.)�m) andEV cells(4.97 � 1.82 �m). Intracellular buffering capacity was assessedin isolated cells from the rapid fall of pHi (recorded with car-boxy-SNARF-1) in response to reductions of extracellularNH4Cl (Fig. 2A) (40). Intrinsic (non-CO2/HCO3
�) intracellularbuffering (�int) was estimated in the presence of Hepes-buff-ered superfusates. Additional buffering due to CO2/HCO3
�
(�CO2) was estimated in CO2/HCO3�-buffered superfusates
(whichmeasures�int� �CO2). Values for�int and�CO2were nodifferent in CA9 expressor and EV cells, indicating thatintracellular H�-buffering capacity was not influenced byCA9 (Fig. 2B).CA Activity in Intact Cells—In an isolated cell, switching
from Hepes-buffered to CO2/HCO3�-buffered superfusate
caused a fall of pHi, as CO2 entering the cell was hydrated toH�
FIGURE 2. No effect of CA9 expression on single cell pHi regulation. A, intracellular H� buffering capacity (�)was estimated from the size of stepwise pHi changes produced by gradual ammonium removal, as shown fora single CA9 expressor cell, superfused by a sequence of Hepes-buffered solutions containing 30 to 0 mM
NH4Cl. Possible effects on pHi of membrane H� equivalent transport were minimized by including 0.5 mM
4,4�-diisothiocyanatostilbene-2,2�-disulfonate and 50 �M dimethylamiloride in superfusates. B, bufferingcapacity (�) and its pHi dependence measured in the presence and absence of 5% CO2/22 mM HCO3
� buffer (n �20/bin). Experiments in nil CO2 provided estimates of �int (circles) and were best-fitted with a straight-line: 8.6 �pHi � 28.1 for CA9 expressor and 3.5 � pHi � 6.2 for empty vector (EV). Experiments in 5% CO2/22 mM
HCO3�-buffered media provided estimates of �int � �CO2 (triangles). Dashed lines: predicted contribution from
CO2-dependent � (� 2.303 � [HCO3�]i). C, kinetics of intracellular CO2 hydration, and the reverse reaction, as
measured by intracellular pH in single cells. Superfusate was rapidly switched from CO2-free (Hepes-buffered)to 5% CO2/22 mM HCO3
�, and back. 200 nM 14v had no effect on the kinetics of intracellular pH changes. The pHitime course was monitored in the presence and absence of 100 �M ATZ, to quantify the spontaneous andCA-catalyzed reaction. Further analysis of the time course of CO2 addition and removal (n � 100) is shown in Dand E, respectively (n � 100). F, H� equivalent membrane transport, stimulated by acid-loading RT112 cellsfollowing a 4-min, 30 mM NH4Cl prepulse. pHi recovery was negligible when superfusing cell with zero extra-cellular [Na�] (green-shaded area). On re-addition of Nao
�, pHi recovery was considerably faster in the presenceof 5% CO2/HCO3
� buffer (black trace) than in its absence (gray trace). Inclusion of 100 �M ATZ (red trace) did notaffect recovery. G, pHi dependence of H� equivalent extrusion (n � 20/bin) in EV cells. H, pHi dependence of H�
equivalent extrusion (n � 20/bin) in CA9 expressor cells.
CA9 Coordinates Tissue pHi
20476 JOURNAL OF BIOLOGICAL CHEMISTRY VOLUME 283 • NUMBER 29 • JULY 18, 2008
by guest on May 18, 2016
http://ww
w.jbc.org/
Dow
nloaded from

and HCO3� ions (Fig. 2, C and D). Switching back, after 3 min,
reversed this process, causing a rapid intracellular alkalosis (Fig.2, C and E). To assess CA catalysis, experiments were repeatedin the presence of ATZ or 14v. The initial time courses in Fig. 2(D and E) were analyzed (see supplemental material) to derivethe rate constant of intracellular hydration (kf) or dehydration(kr).WithATZ (total CA inhibition), kf was 0.18� 0.01 s�1 (n�50, hence kr was 0.24 �M�1s�1), in agreement with previouspublished values for the spontaneous reaction (41). In theabsence of drug, kf and kr were 2.09-fold larger in CA9 expres-sor cells and 2.96-fold larger in EV cells. In contrast, kf and krwere not significantly affected by 14v (catalysis of 2.05-fold and2.93-fold in CA9 expressor and EV, respectively), indicating
that, in superfused single cells,extracellular CA does not contrib-ute catalytically to the reversiblehydration of intracellular CO2.These data also confirm that 14v ismembrane-impermeant (37, 42) as,otherwise, slower pHi changeswould have been measured in itspresence, because of inhibition ofintracellular CA isoforms. Thefaster rate constants measured inthe absence of ATZ indicate thatintrinsic intracellular CA activitywas functional in both CA9 expres-sor and EV cells, although it was33% lower in the former. Thusexpressing extracellular CA9 inRT112 cells was associated with acoordinate reduction of intracellu-lar CA activity, in agreement withthe observed down regulation ofCA2 protein expression (Fig. 1A).CA9 Effects on H� Equivalent
Membrane Transport—We investi-gated H� equivalent extrusion byprepulsing isolated cells for 4 minwith extracellular NH4Cl (1). Thismaneuver induces an intracellularacid-load that stimulates plasmale-mmal H� equivalent extrusion andrecovery of pHi to resting levels.Recovery of pHi when using Hepes-buffered superfusates was acceler-ated by changing the buffer to CO2/HCO3
� (Fig. 2F), indicating that anHCO3
�-dependent transporter con-tributes to pHi regulation. Recoverywas reversibly blocked by substitut-ing extracellular Na� with N-meth-yl-D-glucamine (Fig. 2F), indicatingthat all H� equivalent extrusion isNa�-dependent and is probably acombination of Na�/H� exchange(seen in Hepes superfusate) plus aNa�-HCO3
�-dependent trans-porter (mediating HCO3
� influx, active in CO2/HCO3�-super-
fusate). H� extrusion (JmembH ) was quantified as a function of
pHi (Fig. 2, G and H), by multiplying pHi recovery rate andbuffering capacity for a range of pHi values. Comparable esti-mates for Jmemb
H in Hepes- or CO2/HCO3�-buffered conditions
were obtained in EV and CA9 expressor cells. Furthermore,inhibiting CA activity with 100 �MATZ had no effect on Jmemb
H
or on steady state pHi (�7.25). Further experiments (not illus-trated) have shown that 200 nM 14v, like ATZ, has no effect onH� equivalent extrusion (n � 15) nor on resting pHi (n � 15).Thus, an operational transportmetabolon involving theHCO3
�
transporter and CA9 was not apparent in isolated cells, despitethe fact that the CA9 enzyme was functional.
FIGURE 3. CA9 reduces pHi non-uniformity in spheroids. A, map of radial steady-state pHi, relative to periph-ery pHi, in EV spheroids in the presence of 5% CO2/22 mM HCO3
�-buffered superfusate, showing significantintracellular core-acidosis. B, similar pHi map generated from a CA9 expressor spheroid, showing a greatlyreduced core acidosis. C, incubation of the CA9 expressor spheroid with 500 nM 14v results in significant coreacidosis, similar to that observed in EV spheroids. D, radial pHi profiles across EV (gray) and CA9 expressor (red)spheroids. E, radial pHi profiles in the presence of 500 nM 14v. F, radial pHi profiles in the presence of 100 �M
ATZ. Large standing pHi gradients were recorded in EV spheroids, in the presence or absence of CA inhibitors.CA9 activity in expressor spheroids reduces standing pHi gradients 2.5-fold. However, inhibition of CA9 with14v or inhibition of global CA activity with ATZ restores pHi gradients. Asterisks denote significant differencebetween EV and CA9 expressor ROI pHi (t test at 5% level). G, core to periphery pHi gradients analyzed furtherfor CA9 expressor spheroids. 14v and ATZ increased standing pHi gradients. H, in EV spheroids, neither 14v norATZ had a significant effect on standing pHi gradients.
CA9 Coordinates Tissue pHi
JULY 18, 2008 • VOLUME 283 • NUMBER 29 JOURNAL OF BIOLOGICAL CHEMISTRY 20477
by guest on May 18, 2016
http://ww
w.jbc.org/
Dow
nloaded from
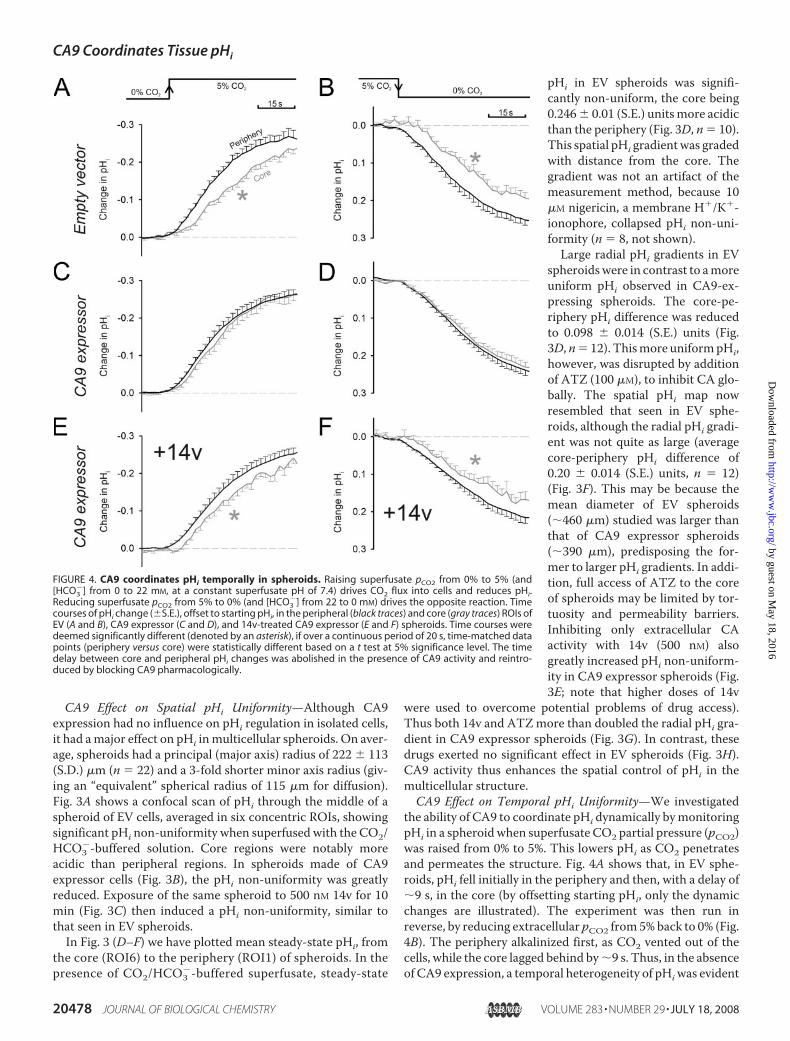
CA9 Effect on Spatial pHi Uniformity—Although CA9expression had no influence on pHi regulation in isolated cells,it had amajor effect on pHi inmulticellular spheroids. On aver-age, spheroids had a principal (major axis) radius of 222 � 113(S.D.) �m (n � 22) and a 3-fold shorter minor axis radius (giv-ing an “equivalent” spherical radius of 115 �m for diffusion).Fig. 3A shows a confocal scan of pHi through the middle of aspheroid of EV cells, averaged in six concentric ROIs, showingsignificant pHi non-uniformity when superfused with the CO2/HCO3
�-buffered solution. Core regions were notably moreacidic than peripheral regions. In spheroids made of CA9expressor cells (Fig. 3B), the pHi non-uniformity was greatlyreduced. Exposure of the same spheroid to 500 nM 14v for 10min (Fig. 3C) then induced a pHi non-uniformity, similar tothat seen in EV spheroids.In Fig. 3 (D–F) we have plotted mean steady-state pHi, from
the core (ROI6) to the periphery (ROI1) of spheroids. In thepresence of CO2/HCO3
�-buffered superfusate, steady-state
pHi in EV spheroids was signifi-cantly non-uniform, the core being0.246� 0.01 (S.E.) unitsmore acidicthan the periphery (Fig. 3D, n� 10).This spatial pHi gradientwas gradedwith distance from the core. Thegradient was not an artifact of themeasurement method, because 10�M nigericin, a membrane H�/K�-ionophore, collapsed pHi non-uni-formity (n � 8, not shown).
Large radial pHi gradients in EVspheroidswere in contrast to amoreuniform pHi observed in CA9-ex-pressing spheroids. The core-pe-riphery pHi difference was reducedto 0.098 � 0.014 (S.E.) units (Fig.3D,n� 12). Thismore uniformpHi,however, was disrupted by additionof ATZ (100 �M), to inhibit CA glo-bally. The spatial pHi map nowresembled that seen in EV sphe-roids, although the radial pHi gradi-ent was not quite as large (averagecore-periphery pHi difference of0.20 � 0.014 (S.E.) units, n � 12)(Fig. 3F). This may be because themean diameter of EV spheroids(�460 �m) studied was larger thanthat of CA9 expressor spheroids(�390 �m), predisposing the for-mer to larger pHi gradients. In addi-tion, full access of ATZ to the coreof spheroids may be limited by tor-tuosity and permeability barriers.Inhibiting only extracellular CAactivity with 14v (500 nM) alsogreatly increased pHi non-uniform-ity in CA9 expressor spheroids (Fig.3E; note that higher doses of 14v
were used to overcome potential problems of drug access).Thus both 14v and ATZmore than doubled the radial pHi gra-dient in CA9 expressor spheroids (Fig. 3G). In contrast, thesedrugs exerted no significant effect in EV spheroids (Fig. 3H).CA9 activity thus enhances the spatial control of pHi in themulticellular structure.CA9 Effect on Temporal pHi Uniformity—We investigated
the ability of CA9 to coordinate pHi dynamically bymonitoringpHi in a spheroidwhen superfusate CO2 partial pressure (pCO2)was raised from 0% to 5%. This lowers pHi as CO2 penetratesand permeates the structure. Fig. 4A shows that, in EV sphe-roids, pHi fell initially in the periphery and then, with a delay of�9 s, in the core (by offsetting starting pHi, only the dynamicchanges are illustrated). The experiment was then run inreverse, by reducing extracellular pCO2 from5%back to 0% (Fig.4B). The periphery alkalinized first, as CO2 vented out of thecells, while the core lagged behind by�9 s. Thus, in the absenceof CA9 expression, a temporal heterogeneity of pHiwas evident
FIGURE 4. CA9 coordinates pHi temporally in spheroids. Raising superfusate pCO2 from 0% to 5% (and[HCO3
�] from 0 to 22 mM, at a constant superfusate pH of 7.4) drives CO2 flux into cells and reduces pHi.Reducing superfusate pCO2 from 5% to 0% (and [HCO3
�] from 22 to 0 mM) drives the opposite reaction. Timecourses of pHi change (�S.E.), offset to starting pHi, in the peripheral (black traces) and core (gray traces) ROIs ofEV (A and B), CA9 expressor (C and D), and 14v-treated CA9 expressor (E and F) spheroids. Time courses weredeemed significantly different (denoted by an asterisk), if over a continuous period of 20 s, time-matched datapoints (periphery versus core) were statistically different based on a t test at 5% significance level. The timedelay between core and peripheral pHi changes was abolished in the presence of CA9 activity and reintro-duced by blocking CA9 pharmacologically.
CA9 Coordinates Tissue pHi
20478 JOURNAL OF BIOLOGICAL CHEMISTRY VOLUME 283 • NUMBER 29 • JULY 18, 2008
by guest on May 18, 2016
http://ww
w.jbc.org/
Dow
nloaded from
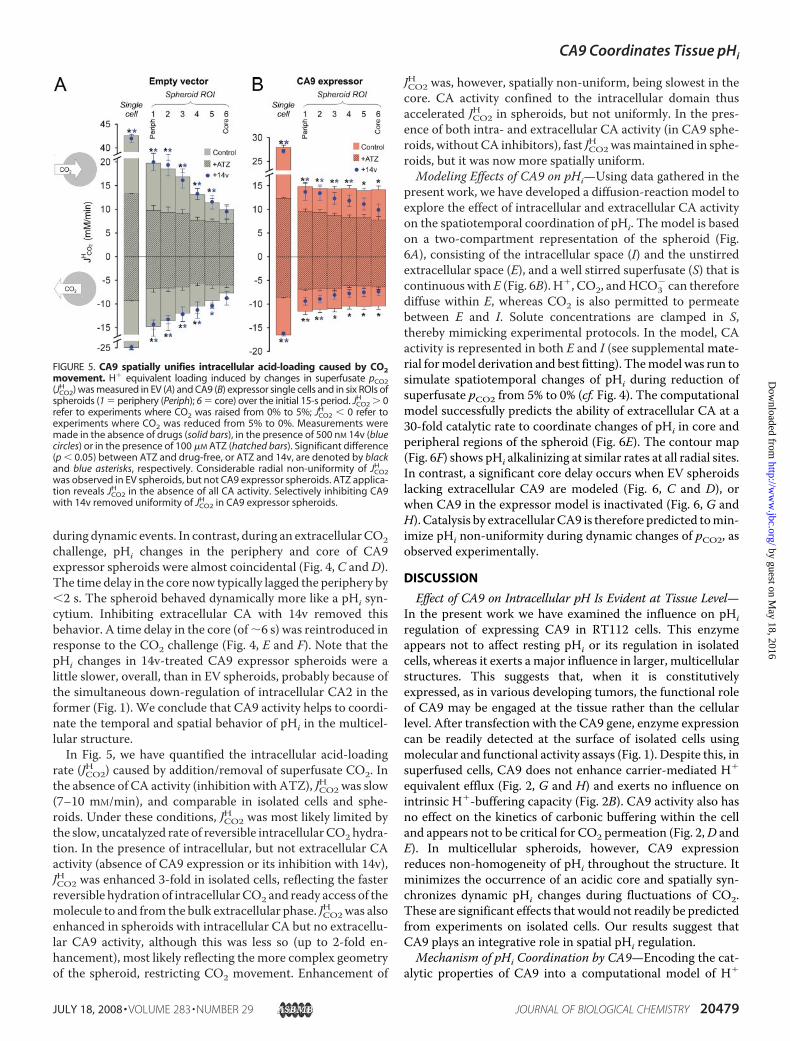
during dynamic events. In contrast, during an extracellularCO2challenge, pHi changes in the periphery and core of CA9expressor spheroids were almost coincidental (Fig. 4, C andD).The time delay in the core now typically lagged the periphery by2 s. The spheroid behaved dynamically more like a pHi syn-cytium. Inhibiting extracellular CA with 14v removed thisbehavior. A time delay in the core (of�6 s) was reintroduced inresponse to the CO2 challenge (Fig. 4, E and F). Note that thepHi changes in 14v-treated CA9 expressor spheroids were alittle slower, overall, than in EV spheroids, probably because ofthe simultaneous down-regulation of intracellular CA2 in theformer (Fig. 1). We conclude that CA9 activity helps to coordi-nate the temporal and spatial behavior of pHi in the multicel-lular structure.In Fig. 5, we have quantified the intracellular acid-loading
rate (JCO2H ) caused by addition/removal of superfusate CO2. In
the absence of CA activity (inhibition with ATZ), JCO2H was slow
(7–10 mM/min), and comparable in isolated cells and sphe-roids. Under these conditions, JCO2
H was most likely limited bythe slow, uncatalyzed rate of reversible intracellularCO2hydra-tion. In the presence of intracellular, but not extracellular CAactivity (absence of CA9 expression or its inhibition with 14v),JCO2H was enhanced 3-fold in isolated cells, reflecting the fasterreversible hydration of intracellularCO2 and ready access of themolecule to and from the bulk extracellular phase. JCO2
H was alsoenhanced in spheroids with intracellular CA but no extracellu-lar CA9 activity, although this was less so (up to 2-fold en-hancement), most likely reflecting the more complex geometryof the spheroid, restricting CO2 movement. Enhancement of
JCO2H was, however, spatially non-uniform, being slowest in thecore. CA activity confined to the intracellular domain thusaccelerated JCO2
H in spheroids, but not uniformly. In the pres-ence of both intra- and extracellular CA activity (in CA9 sphe-roids, without CA inhibitors), fast JCO2
H wasmaintained in sphe-roids, but it was now more spatially uniform.Modeling Effects of CA9 on pHi—Using data gathered in the
present work, we have developed a diffusion-reaction model toexplore the effect of intracellular and extracellular CA activityon the spatiotemporal coordination of pHi. The model is basedon a two-compartment representation of the spheroid (Fig.6A), consisting of the intracellular space (I) and the unstirredextracellular space (E), and a well stirred superfusate (S) that iscontinuous with E (Fig. 6B). H�, CO2, andHCO3
� can thereforediffuse within E, whereas CO2 is also permitted to permeatebetween E and I. Solute concentrations are clamped in S,thereby mimicking experimental protocols. In the model, CAactivity is represented in both E and I (see supplemental mate-rial formodel derivation and best fitting). Themodel was run tosimulate spatiotemporal changes of pHi during reduction ofsuperfusate pCO2 from 5% to 0% (cf. Fig. 4). The computationalmodel successfully predicts the ability of extracellular CA at a30-fold catalytic rate to coordinate changes of pHi in core andperipheral regions of the spheroid (Fig. 6E). The contour map(Fig. 6F) shows pHi alkalinizing at similar rates at all radial sites.In contrast, a significant core delay occurs when EV spheroidslacking extracellular CA9 are modeled (Fig. 6, C and D), orwhen CA9 in the expressor model is inactivated (Fig. 6, G andH). Catalysis by extracellularCA9 is therefore predicted tomin-imize pHi non-uniformity during dynamic changes of pCO2, asobserved experimentally.
DISCUSSION
Effect of CA9 on Intracellular pH Is Evident at Tissue Level—In the present work we have examined the influence on pHiregulation of expressing CA9 in RT112 cells. This enzymeappears not to affect resting pHi or its regulation in isolatedcells, whereas it exerts a major influence in larger, multicellularstructures. This suggests that, when it is constitutivelyexpressed, as in various developing tumors, the functional roleof CA9 may be engaged at the tissue rather than the cellularlevel. After transfection with the CA9 gene, enzyme expressioncan be readily detected at the surface of isolated cells usingmolecular and functional activity assays (Fig. 1). Despite this, insuperfused cells, CA9 does not enhance carrier-mediated H�
equivalent efflux (Fig. 2, G and H) and exerts no influence onintrinsic H�-buffering capacity (Fig. 2B). CA9 activity also hasno effect on the kinetics of carbonic buffering within the celland appears not to be critical for CO2 permeation (Fig. 2,D andE). In multicellular spheroids, however, CA9 expressionreduces non-homogeneity of pHi throughout the structure. Itminimizes the occurrence of an acidic core and spatially syn-chronizes dynamic pHi changes during fluctuations of CO2.These are significant effects that would not readily be predictedfrom experiments on isolated cells. Our results suggest thatCA9 plays an integrative role in spatial pHi regulation.Mechanism of pHi Coordination by CA9—Encoding the cat-
alytic properties of CA9 into a computational model of H�
FIGURE 5. CA9 spatially unifies intracellular acid-loading caused by CO2movement. H� equivalent loading induced by changes in superfusate pCO2(JCO2
H ) was measured in EV (A) and CA9 (B) expressor single cells and in six ROIs ofspheroids (1 � periphery (Periph); 6 � core) over the initial 15-s period. JCO2
H � 0refer to experiments where CO2 was raised from 0% to 5%; JCO2
H 0 refer toexperiments where CO2 was reduced from 5% to 0%. Measurements weremade in the absence of drugs (solid bars), in the presence of 500 nM 14v (bluecircles) or in the presence of 100 �M ATZ (hatched bars). Significant difference(p 0.05) between ATZ and drug-free, or ATZ and 14v, are denoted by blackand blue asterisks, respectively. Considerable radial non-uniformity of JCO2
H
was observed in EV spheroids, but not CA9 expressor spheroids. ATZ applica-tion reveals JCO2
H in the absence of all CA activity. Selectively inhibiting CA9with 14v removed uniformity of JCO2
H in CA9 expressor spheroids.
CA9 Coordinates Tissue pHi
JULY 18, 2008 • VOLUME 283 • NUMBER 29 JOURNAL OF BIOLOGICAL CHEMISTRY 20479
by guest on May 18, 2016
http://ww
w.jbc.org/
Dow
nloaded from

movement predicts a pattern of pHi response very similar tothat observed experimentally in spheroids (Fig. 4, comparewithFig. 6). In the model, this is a consequence of extracellular CAcatalysis, facilitating the venting of intracellular CO2. Themathematical scheme is important, because it confirms thatsuch facilitation, and its spatial influence on pHi, is thermody-namically and kinetically feasible.
As mentioned in the introduc-tion, whereas CO2 may be gener-ated aerobically, it can also be gen-erated through the buffering byintracellularHCO3
� of anaerobicallyproduced lactic acid. Because CO2is readily membrane-permeant, itwill pass into the extracellular space.This helps to reduce the intracellu-larH� load imposed bymetabolism.In a spheroid without a vascularsupply, the extracellular space is anunstirred compartment with adegree of spatial tortuosity, whichwould encourage local accumula-tion of CO2. This would limit fur-ther CO2 efflux from the cells, thusrestricting the rate at which CO2can be vented diffusively into thesuperfusate. CA9 activity in theextracellular space will facilitateCO2 diffusion, by locally catalyzingconversion of a fraction of CO2 intoHCO3
� and H�, which then diffusein parallel with unconverted CO2 tothe bulk phase. As confirmed quan-titatively by the predictions of thecomputational model (Fig. 6 andsupplemental material), facilitatedCO2 diffusion will thus enhancemetabolite removal from the tissue.Fig. 7 illustrates schematically
that some of the extracellularHCO3
� will be captured and recy-cled back into the intracellular com-partment via membrane HCO3
�
transport, where it will buffer moreintracellular H� ions. Indeed, suchHCO3
� re-uptakewill be necessary iffacilitated CO2 efflux is to be sus-tained over significant time periods.In the absence of CA9, the facili-
tated route for CO2 efflux will belimited by the slow spontaneousrate of extracellular CO2 hydration.Due to large diffusion distances,core regions will retain a higherpCO2 and so become more acidic.This can account for spatiotempo-ral non-uniformity of pHi within aspheroid (Figs. 3 and 4). In the pres-
ence of CA9, the enhanced extraction of CO2 will ensure thatpHi becomes more alkaline. When expressed in vivo, theenzyme will help to match CO2 efflux to the local rate of met-abolic activity. CA9 should therefore coordinate the rate ofintracellular CO2 excretion from different regions, whichwill help to synchronize pHi spatially, as well as minimizingthe formation of core intracellular acidosis.
FIGURE 6. Modeling the coordination of pHi by CA9. A, geometry and B, domains of computational diffusion-reaction model. I, intracellular; E, extracellular (within spheroid); S, superfusate; �, boundary; arrows denotemovement of solutes. Inset to A shows close-packing arrangement of cells under Kepler’s conjecture. Seesupplemental material for details. A model was used to simulate the effect of CO2 efflux (induced by CO2removal from superfusate) on spatial pHi in EV spheroids (C and D), CA9 expressor spheroids (E and F), andCA9-inactivated CA9 expressor spheroids (G and H). Data are presented as time courses of pHi in core (gray) andperipheral (black) ROIs (C, E, and G) and as contour maps (D, F, and H) showing time dependence of pHi atdifferent radial distances from core. The model outcome supports a role for CA9 in coordinating pHi spatiallyduring CO2 efflux from spheroid.
CA9 Coordinates Tissue pHi
20480 JOURNAL OF BIOLOGICAL CHEMISTRY VOLUME 283 • NUMBER 29 • JULY 18, 2008
by guest on May 18, 2016
http://ww
w.jbc.org/
Dow
nloaded from
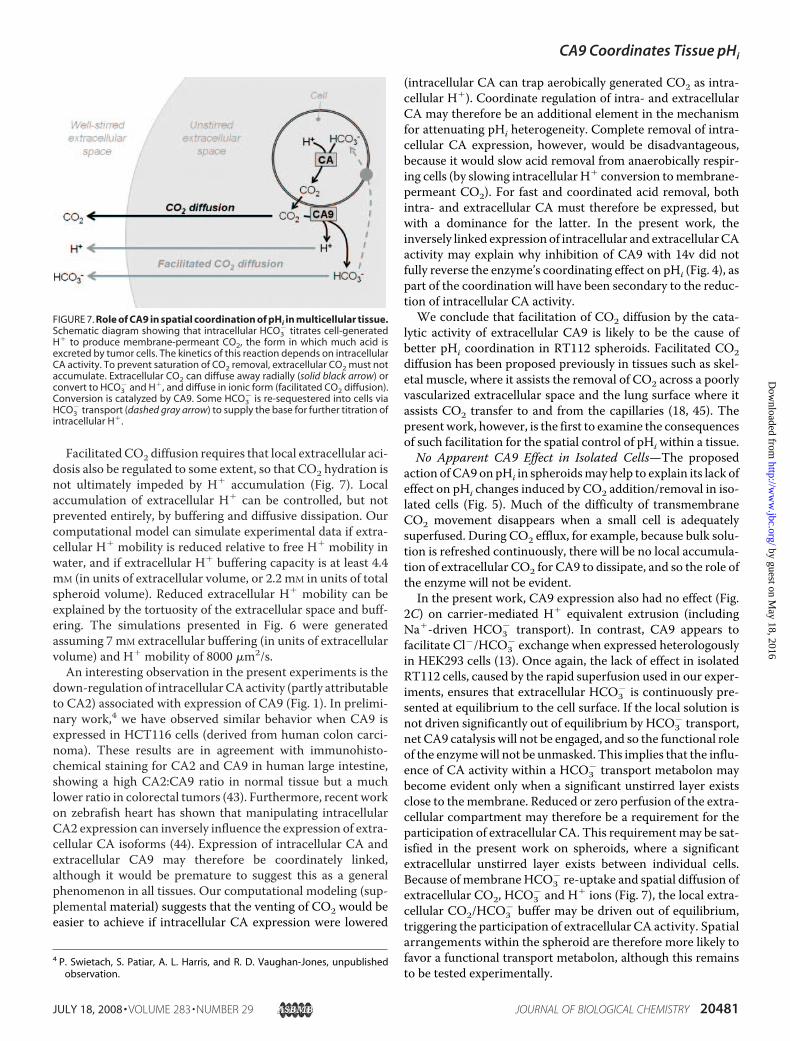
FacilitatedCO2 diffusion requires that local extracellular aci-dosis also be regulated to some extent, so that CO2 hydration isnot ultimately impeded by H� accumulation (Fig. 7). Localaccumulation of extracellular H� can be controlled, but notprevented entirely, by buffering and diffusive dissipation. Ourcomputational model can simulate experimental data if extra-cellular H� mobility is reduced relative to free H� mobility inwater, and if extracellular H� buffering capacity is at least 4.4mM (in units of extracellular volume, or 2.2 mM in units of totalspheroid volume). Reduced extracellular H� mobility can beexplained by the tortuosity of the extracellular space and buff-ering. The simulations presented in Fig. 6 were generatedassuming 7 mM extracellular buffering (in units of extracellularvolume) and H� mobility of 8000 �m2/s.An interesting observation in the present experiments is the
down-regulation of intracellularCAactivity (partly attributableto CA2) associated with expression of CA9 (Fig. 1). In prelimi-nary work,4 we have observed similar behavior when CA9 isexpressed in HCT116 cells (derived from human colon carci-noma). These results are in agreement with immunohisto-chemical staining for CA2 and CA9 in human large intestine,showing a high CA2:CA9 ratio in normal tissue but a muchlower ratio in colorectal tumors (43). Furthermore, recent workon zebrafish heart has shown that manipulating intracellularCA2 expression can inversely influence the expression of extra-cellular CA isoforms (44). Expression of intracellular CA andextracellular CA9 may therefore be coordinately linked,although it would be premature to suggest this as a generalphenomenon in all tissues. Our computational modeling (sup-plemental material) suggests that the venting of CO2 would beeasier to achieve if intracellular CA expression were lowered
(intracellular CA can trap aerobically generated CO2 as intra-cellular H�). Coordinate regulation of intra- and extracellularCA may therefore be an additional element in the mechanismfor attenuating pHi heterogeneity. Complete removal of intra-cellular CA expression, however, would be disadvantageous,because it would slow acid removal from anaerobically respir-ing cells (by slowing intracellular H� conversion tomembrane-permeant CO2). For fast and coordinated acid removal, bothintra- and extracellular CA must therefore be expressed, butwith a dominance for the latter. In the present work, theinversely linked expression of intracellular and extracellularCAactivity may explain why inhibition of CA9 with 14v did notfully reverse the enzyme’s coordinating effect on pHi (Fig. 4), aspart of the coordination will have been secondary to the reduc-tion of intracellular CA activity.We conclude that facilitation of CO2 diffusion by the cata-
lytic activity of extracellular CA9 is likely to be the cause ofbetter pHi coordination in RT112 spheroids. Facilitated CO2diffusion has been proposed previously in tissues such as skel-etal muscle, where it assists the removal of CO2 across a poorlyvascularized extracellular space and the lung surface where itassists CO2 transfer to and from the capillaries (18, 45). Thepresentwork, however, is the first to examine the consequencesof such facilitation for the spatial control of pHiwithin a tissue.No Apparent CA9 Effect in Isolated Cells—The proposed
action of CA9 on pHi in spheroidsmay help to explain its lack ofeffect on pHi changes induced by CO2 addition/removal in iso-lated cells (Fig. 5). Much of the difficulty of transmembraneCO2 movement disappears when a small cell is adequatelysuperfused. During CO2 efflux, for example, because bulk solu-tion is refreshed continuously, there will be no local accumula-tion of extracellular CO2 for CA9 to dissipate, and so the role ofthe enzyme will not be evident.In the present work, CA9 expression also had no effect (Fig.
2C) on carrier-mediated H� equivalent extrusion (includingNa�-driven HCO3
� transport). In contrast, CA9 appears tofacilitate Cl�/HCO3
� exchange when expressed heterologouslyin HEK293 cells (13). Once again, the lack of effect in isolatedRT112 cells, caused by the rapid superfusion used in our exper-iments, ensures that extracellular HCO3
� is continuously pre-sented at equilibrium to the cell surface. If the local solution isnot driven significantly out of equilibrium by HCO3
� transport,net CA9 catalysis will not be engaged, and so the functional roleof the enzymewill not be unmasked. This implies that the influ-ence of CA activity within a HCO3
� transport metabolon maybecome evident only when a significant unstirred layer existsclose to themembrane. Reduced or zero perfusion of the extra-cellular compartment may therefore be a requirement for theparticipation of extracellular CA. This requirementmay be sat-isfied in the present work on spheroids, where a significantextracellular unstirred layer exists between individual cells.Because of membraneHCO3
� re-uptake and spatial diffusion ofextracellular CO2, HCO3
� and H� ions (Fig. 7), the local extra-cellular CO2/HCO3
� buffer may be driven out of equilibrium,triggering the participation of extracellular CA activity. Spatialarrangements within the spheroid are therefore more likely tofavor a functional transport metabolon, although this remainsto be tested experimentally.
4 P. Swietach, S. Patiar, A. L. Harris, and R. D. Vaughan-Jones, unpublishedobservation.
FIGURE 7. Role of CA9 in spatial coordination of pHi in multicellular tissue.Schematic diagram showing that intracellular HCO3
� titrates cell-generatedH� to produce membrane-permeant CO2, the form in which much acid isexcreted by tumor cells. The kinetics of this reaction depends on intracellularCA activity. To prevent saturation of CO2 removal, extracellular CO2 must notaccumulate. Extracellular CO2 can diffuse away radially (solid black arrow) orconvert to HCO3
� and H�, and diffuse in ionic form (facilitated CO2 diffusion).Conversion is catalyzed by CA9. Some HCO3
� is re-sequestered into cells viaHCO3
� transport (dashed gray arrow) to supply the base for further titration ofintracellular H�.
CA9 Coordinates Tissue pHi
JULY 18, 2008 • VOLUME 283 • NUMBER 29 JOURNAL OF BIOLOGICAL CHEMISTRY 20481
by guest on May 18, 2016
http://ww
w.jbc.org/
Dow
nloaded from

Spatial pHi Coordination Will Depend on CA9 ExpressionLevel and Tissue Size—Diffusion-reaction modeling (see sup-plemental material) can be used to explore the possible effect ofCA9 expression levels and tissue size on the ability of theenzyme to coordinate pHi spatially. Coordination can be quan-tified in terms of the core-to-periphery pHi time delay duringCO2 washout (measured at a threshold pHi change of, say, 0.1unit). Our computational model suggests that, for a typicalRT112 spheroid, this time delay is likely to decrease hyperbol-ically as CA9 expression increases, halving in response to a14-fold increase in extracellular CO2 hydration rate (see sup-plemental Fig. S2). Extracellular CA activity in our stably trans-fected RT112 spheroids accelerated CO2 hydration rate by30-fold (see supplemental material for derivation of the meas-urement). This catalytic rate is predicted to facilitate CO2 effluxnear-maximally, reducing the time delay by 4-fold, thereby pro-viding optimal conditions for the spatial control of pHi.
A key question is whether spatial pHi regulation also occursin larger spheroids than used in the present work. We havecurrently examined pHi in spheroids of �500 �m in principaldiameter, to avoid the hypoxic core becoming necrotic (46),thereby failing to take up the pH dye. The spheroids comprise�25,000 cells, equivalent, for example, to a typical non-vascu-larized tumor in early development. Our computational modelsuggests that a 14-fold catalytic rate of CA9 expression shouldstill be sufficient to halve the core to periphery time delay whenspheroid diameter is doubled or even tripled. Indeed, followingsuch a size increase, a 30-fold CA9 catalytic rate as measured inRT112 spheroids, should still reduce the time delay by 3- to4-fold. This is not to say that larger spheroids would beexpected to exhibit a perfectly uniform pHi, they would not.The uncatalyzed time delay in larger spheroids would naturallyincrease, in line with the larger core to periphery diffusion dis-tance. The modeling, however, predicts that optimal CA9expression should reduce this delay by up to 75%. Spatial pHiregulation by CA9 should therefore remain prominent in largerspheroids.In summary, the extent to which CA9 can coordinate pHi
will, most likely, depend on the level of enzyme expression rel-ative to tissue size. CA9 expression may not always succeed atunifying pHi spatially in a tissue, but it will nevertheless atten-uate local pHi gradients. The predicted effect of tissue sizetends to be borne out by our recent preliminary results4 usinglarge, spherical growths (diameter � 600 �m) cultured fromHCT116 cells that do not normally express CA9. The largerspheroids show longer core to periphery time delays for pHi onCO2 washout (�20 s). Both the gradients and the time delaysare, however, still reduced in spheroids expressing CA9, sug-gesting that the enzyme’s ability to coordinate pHi spatially isnot restricted to RT112 spheroids.Relevance to Normal Tissue and Growing Tumors—The
potential of CA9 to coordinate pHi and reduce core acidosis ina tissue will be particularly important where vascular perfusionis low or absent. It would therefore be expected to influence pHispatially during pathophysiological events such as ischemia.Under such conditions, an acidic area within a tissue is likely tocoincide with regional hypoxia, a key trigger for CA9 expres-sion (25). Although the present work has focused on extracel-
lular CA9, other CA isoforms such as CA4 and CA12 are alsoexpressed externally in cells such as cardiacmyocytes, endothe-lial/epithelial cells, and neurons (10) andmay contribute to spa-tial pHi control.CA9 expression inmany tumors has raised questions regard-
ing its importance to cancer growth. Its potential for spatiallycontrolling pHi furnishes an obvious survival advantage to thetumor, particularly as CA9 has one of the highest catalytic ratesof all isoforms (47). Previous work has documented the tend-ency of tumors (33, 35) and spheroids (48) to develop an acidicextracellular core, but there has been no information on spatialpHi regulation. Our data now suggest that CA9 expression willtend to unify pHi across three-dimensional tissue structures. Amore uniformly alkaline tumor may be predisposed to furthergrowth (3). The effect ofCA9onpHimaybe particularly impor-tant before significant vascular perfusion of a tumor has beenestablished. It is notable that the CA9-transfected RT112 cellsused in the present work exhibit protein levels for the enzymeand extracellular CO2 hydration rates comparable to thoseinduced hypoxically in breast cancer cell lines (31). Further-more, Northern blotting of various hypoxically exposed cancercell lines, as well as a variety of tumor samples, has revealed thatCA9 RNA levels (calibrated to �-actin RNA) are high (19).Moreover, neoplasias arising from a defective von Hippel-Lindau gene have been shown to “overexpress” CA9 (19, 22).CA9 levels in our transfected RT112 cells are thus likely to berepresentative of those in CA9 expressing tumors.Not all tumors express CA9, but this need not invalidate the
proposal that facilitating CO2 excretion helps to reduce intra-cellular acidosis. In the absence of CA9, other extracellular CAisoforms may suffice or other, as yet unknown, strategies maybe implemented for spatially controlling pHi. Nevertheless, ourresultsmay not translate in simple fashion to tumors composedof many cell types, possibly with heterogeneous local expres-sion of CA, H� equivalent transporters, and H� buffers, all ofwhich will influence pHi. For example, endogenous CA9 intumors is typically up-regulated in the hypoxic core rather thandistributed more uniformly, as in the present CA9 expressorspheroids. Our three-dimensional diffusion model, however,suggests that such localization of CA9 would still be very effec-tive at venting core CO2 and dissipating core acidosis (seesupplemental Fig. S2). This is expected, because less CA9expression is required for removing CO2 at the periphery ofthree-dimensional tissue due to the shorter diffusion distance.It is noteworthy that recent immunohistochemical staining intumor xenografts (21) has shown that areas of CA9 expressionexceed pimonidazole staining (hypoxic) areas by a factor of two.Furthermore, many tumors have “diffuse” CA9 staining(defined as �40% cell staining over 400 �m) (19). For example,68% of cervical carcinomas tested showed strong and diffuseCA9 staining (19). This pattern is similar to that detected withantibodies in CA9-expressing RT112 spheroids (Fig. 1B). Thepresent model and results therefore point to a powerful poten-tial role for extracellular CA9 in the integrative control oftumor pHi.
One consequence of CO2 hydration by CA9 is the generationof extracellular H� ions, and hence a local fall of pHe whichdrives H� diffusion into the bulk extracellular phase (33, 35). In
CA9 Coordinates Tissue pHi
20482 JOURNAL OF BIOLOGICAL CHEMISTRY VOLUME 283 • NUMBER 29 • JULY 18, 2008
by guest on May 18, 2016
http://ww
w.jbc.org/
Dow
nloaded from
preliminary unpublished work,4 we have imaged CA9-express-ing HCT116 spheroids using an extracellular, membrane-im-permeant pH dye. The data show that these spheroids developlow pHe that can beminimized by inhibiting CA9 activity phar-macologically. Although extracellular buffering will help todampen the emerging acidity, the low pHemay be beneficial tothe tumor by promoting retraction of host tissue, permittingfurther tumor invasion. CA9may benefit the tumor, not only byraising pHi, but also by reducing pHe. Selective suppression ofCA9 activity by drugs or antibodies may therefore provide ameans for controlling tumor development, by disrupting pHicoordination and pHe acidification. Although general mem-brane-permeant CA inhibitors have been shown to attenuatetumor growth, application of membrane impermeant CAinhibitors, such as 14v, to target extracellular CA9 selectivelymay offer a novel therapeutic approach.
REFERENCES1. Boron, W. F. (2004) Adv. Physiol. Educ. 28, 160–1792. Isfort, R. J., Cody, D. B., Asquith, T. N., Ridder, G. M., Stuard, S. B., and
LeBoeuf, R. A. (1993) Eur. J. Biochem. 213, 349–3573. Musgrove, E., Seaman,M., andHedley, D. (1987)Exp. Cell Res. 172, 65–754. Hochachka, P. W., and Mommsen, T. P. (1983) Science 219, 1391–13975. Warburg, O. (1930) The Metabolism of Tumours, Arnold Constable,
London6. Semenza, G. L. (2003) Nat. Rev. Cancer 3, 721–7327. Lee, A. H., and Tannock, I. F. (1998) Cancer Res. 58, 1901–19088. Gillies, R., Martinez-Zaguilan, R., Peterson, E., and Perona, R. (1992) Cell
Physiol. Biochem. 2, 159–1799. Swietach, P., Vaughan-Jones, R. D., and Harris, A. L. (2007) Cancer Me-
tastasis Rev. 26, 299–31010. Supuran, C. T. (2008) Nature Rev. 7, 1–1411. Holm, E., Hagmuller, E., Staedt, U., Schlickeiser, G., Gunther, H. J., Lewel-
ing, H., Tokus, M., and Kollmar, H. B. (1995) Cancer Res. 55, 1373–137812. Helmlinger, G., Sckell, A., Dellian, M., Forbes, N. S., and Jain, R. K. (2002)
Clin. Cancer Res. 8, 1284–129113. Morgan, P. E., Pastorekova, S., Stuart-Tilley, A. K., Alper, S. L., and Casey,
J. R. (2007) Am. J. Physiol. 293, C738–C74814. Sterling, D., Reithmeier, R. A., and Casey, J. R. (2001) J. Biol. Chem. 276,
47886–4789415. Becker, H.M., and Deitmer, J. W. (2007) J. Biol. Chem. 282, 13508–1352116. Lu, J., Daly, C. M., Parker, M. D., Gill, H. S., Piermarini, P. M., Pelletier,
M. F., and Boron, W. F. (2006) J. Biol. Chem. 281, 19241–1925017. Stewart, A. K., Boyd, C. A., andVaughan-Jones, R. D. (1999) J. Physiol. 516,
209–21718. Geers, C., and Gros, G. (2000) Physiol. Rev. 80, 681–71519. Ivanov, S., Liao, S. Y., Ivanova, A., Danilkovitch-Miagkova, A., Tarasova,
N., Weirich, G., Merrill, M. J., Proescholdt, M. A., Oldfield, E. H., Lee, J.,Zavada, J., Waheed, A., Sly, W., Lerman, M. I., and Stanbridge, E. J. (2001)Am. J. Pathol. 158, 905–919
20. Pastorekova, S., Zavadova, Z., Kostal, M., Babusikova, O., and Zavada, J.(1992) Virology 187, 620–626
21. Olive, P. L., Aquino-Parsons, C., MacPhail, S. H., Liao, S. Y., Raleigh, J. A.,Lerman, M. I., and Stanbridge, E. J. (2001) Cancer Res. 61, 8924–8929
22. Ivanov, S. V., Kuzmin, I., Wei, M. H., Pack, S., Geil, L., Johnson, B. E.,Stanbridge, E. J., and Lerman,M. I. (1998) Proc. Natl. Acad. Sci. U. S. A. 95,12596–12601
23. Airley, R. E., Loncaster, J., Raleigh, J. A., Harris, A. L., Davidson, S. E.,Hunter, R. D., West, C. M., and Stratford, I. J. (2003) Int. J. Cancer 104,85–91
24. Loncaster, J. A., Harris, A. L., Davidson, S. E., Logue, J. P., Hunter, R. D.,Wycoff, C. C., Pastorek, J., Ratcliffe, P. J., Stratford, I. J., and West, C. M.(2001) Cancer Res. 61, 6394–6399
25. Wykoff, C. C., Beasley, N. J., Watson, P. H., Turner, K. J., Pastorek, J.,Sibtain, A., Wilson, G. D., Turley, H., Talks, K. L., Maxwell, P. H., Pugh,C. W., Ratcliffe, P. J., and Harris, A. L. (2000) Cancer Res. 60, 7075–7083
26. Generali, D., Fox, S. B., Berruti, A., Brizzi, M. P., Campo, L., Bonardi, S.,Wigfield, S. M., Bruzzi, P., Bersiga, A., Allevi, G., Milani, M., Aguggini, S.,Dogliotti, L., Bottini, A., and Harris, A. L. (2006) Endocr. Relat. Cancer 13,921–930
27. Chia, S. K., Wykoff, C. C., Watson, P. H., Han, C., Leek, R. D., Pastorek, J.,Gatter, K. C., Ratcliffe, P., and Harris, A. L. (2001) J. Clin. Oncol. 19,3660–3668
28. Giatromanolaki, A., Koukourakis, M. I., Sivridis, E., Pastorek, J., Wykoff,C. C., Gatter, K. C., and Harris, A. L. (2001) Cancer Res. 61, 7992–7998
29. Parkkila, S., Rajaniemi, H., Parkkila, A. K., Kivela, J., Waheed, A., Pas-torekova, S., Pastorek, J., and Sly,W. S. (2000) Proc. Natl. Acad. Sci. U. S. A.97, 2220–2224
30. Teicher, B. A., Liu, S. D., Liu, J. T., Holden, S. A., and Herman, T. S. (1993)Anticancer Res. 13, 1549–1556
31. Robertson, N., Potter, C., and Harris, A. L. (2004) Cancer Res. 64,6160–6165
32. Svastova, E., Hulikova, A., Rafajova,M., Zat’ovicova,M., Gibadulinova, A.,Casini, A., Cecchi, A., Scozzafava, A., Supuran, C. T., Pastorek, J., andPastorekova, S. (2004) FEBS Lett. 577, 439–445
33. Gatenby, R. A., Gawlinski, E. T., Gmitro, A. F., Kaylor, B., and Gillies, R. J.(2006) Cancer Res. 66, 5216–5223
34. Vaupel, P., Kallinowski, F., and Okunieff, P. (1989) Cancer Res. 49,6449–6465
35. Griffiths, J. R., McIntyre, D. J., Howe, F. A., and Stubbs,M. (2001)NovartisFound. Symp. 240, 46–62
36. Leek, R. D., Stratford, I., and Harris, A. L. (2005) Cancer Res. 65,4147–4152
37. Casey, J. R., Morgan, P. E., Vullo, D., Scozzafava, A., Mastrolorenzo, A.,and Supuran, C. T. (2004) J. Med. Chem. 47, 2337–2347
38. Maren, T. H. (1967) Physiol. Rev. 47, 595–78139. Leem, C. H., Lagadic-Gossmann, D., and Vaughan-Jones, R. D. (1999)
J. Physiol. 517, 159–18040. Boyarsky, G., Ganz, M. B., Sterzel, R. B., and Boron, W. F. (1988) Am. J.
Physiol. 255, C844–C85641. Leem, C. H., and Vaughan-Jones, R. D. (1998) J. Physiol. 509, 471–48542. Alvarez, B. V., Loiselle, F. B., Supuran, C. T., Schwartz, G. J., andCasey, J. R.
(2003) Biochemistry 42, 12321–1232943. Kivela, A. J., Saarnio, J., Karttunen, T. J., Kivela, J., Parkkila, A. K., Pas-
torekova, S., Pastorek, J., Waheed, A., Sly, W. S., Parkkila, T. S., and Ra-janiemi, H. (2001) Dig. Dis. Sci. 46, 2179–2186
44. Lin, T. Y., Liao, B. K., Horng, J. L., Yan, J. J., Hsiao, C. D., and Hwang, P. P.(2008) Am. J. Physiol. 294, C1250–C1260
45. Heming, T. A., Stabenau, E. K., Vanoye, C. G., Moghadasi, H., and Bidani,A. (1994) J. Appl. Physiol. 77, 697–705
46. Kunz-Schughart, L. A., Kreutz, M., and Knuechel, R. (1998) Int. J. Exp.Pathol. 79, 1–23
47. Wingo, T., Tu, C., Laipis, P. J., and Silverman, D. N. (2001) Biochem.Biophys. Res. Commun. 288, 666–669
48. Carlsson, J., and Acker, H. (1988) Int. J. Cancer 42, 715–720
CA9 Coordinates Tissue pHi
JULY 18, 2008 • VOLUME 283 • NUMBER 29 JOURNAL OF BIOLOGICAL CHEMISTRY 20483
by guest on May 18, 2016
http://ww
w.jbc.org/
Dow
nloaded from
S1
ONLINE SUPPLEMENT Mathematical framework for modelling pHi regulation in spheroids
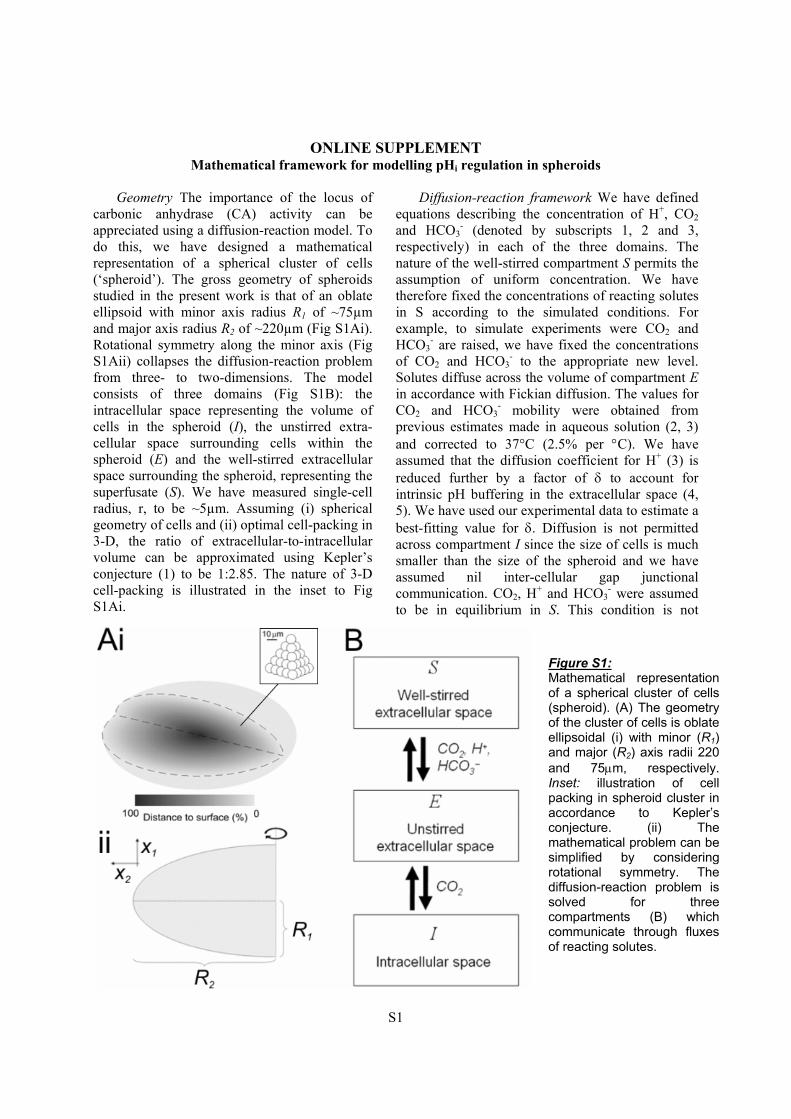
Geometry The importance of the locus of
carbonic anhydrase (CA) activity can be appreciated using a diffusion-reaction model. To do this, we have designed a mathematical representation of a spherical cluster of cells (‘spheroid’). The gross geometry of spheroids studied in the present work is that of an oblate ellipsoid with minor axis radius R1 of ~75µm and major axis radius R2 of ~220µm (Fig S1Ai). Rotational symmetry along the minor axis (Fig S1Aii) collapses the diffusion-reaction problem from three- to two-dimensions. The model consists of three domains (Fig S1B): the intracellular space representing the volume of cells in the spheroid (I), the unstirred extra-cellular space surrounding cells within the spheroid (E) and the well-stirred extracellular space surrounding the spheroid, representing the superfusate (S). We have measured single-cell radius, r, to be ~5µm. Assuming (i) spherical geometry of cells and (ii) optimal cell-packing in 3-D, the ratio of extracellular-to-intracellular volume can be approximated using Kepler’s conjecture (1) to be 1:2.85. The nature of 3-D cell-packing is illustrated in the inset to Fig S1Ai.
Diffusion-reaction framework We have defined equations describing the concentration of H+, CO2 and HCO3
- (denoted by subscripts 1, 2 and 3, respectively) in each of the three domains. The nature of the well-stirred compartment S permits the assumption of uniform concentration. We have therefore fixed the concentrations of reacting solutes in S according to the simulated conditions. For example, to simulate experiments were CO2 and HCO3
- are raised, we have fixed the concentrations of CO2 and HCO3
- to the appropriate new level. Solutes diffuse across the volume of compartment E in accordance with Fickian diffusion. The values for CO2 and HCO3
- mobility were obtained from previous estimates made in aqueous solution (2, 3) and corrected to 37°C (2.5% per °C). We have assumed that the diffusion coefficient for H+ (3) is reduced further by a factor of δ to account for intrinsic pH buffering in the extracellular space (4, 5). We have used our experimental data to estimate a best-fitting value for δ. Diffusion is not permitted across compartment I since the size of cells is much smaller than the size of the spheroid and we have assumed nil inter-cellular gap junctional communication. CO2, H+ and HCO3
- were assumed to be in equilibrium in S. This condition is not
Figure S1: Mathematical representation of a spherical cluster of cells (spheroid). (A) The geometry of the cluster of cells is oblate ellipsoidal (i) with minor (R1) and major (R2) axis radii 220 and 75µm, respectively. Inset: illustration of cell packing in spheroid cluster in accordance to Kepler’s conjecture. (ii) The mathematical problem can be simplified by considering rotational symmetry. The diffusion-reaction problem is solved for three compartments (B) which communicate through fluxes of reacting solutes.

S2
enforced in I and E. Instead, we have modelled the reaction between H+, HCO3
- and CO2:
The mathematical framework consists of
coupled differential equations for compartments E (solute concentrations u1, u2, u3) and I (solute concentrations y1, y2, y3) and a time-dependent function for concentration in compartment S (solute concentrations v1, v2, v3). Subscripts 1, 2 and 3 refer to H+, HCO3
- and CO2 concentration.
( ) ( )e
21r3fe11
1 uukukuDt
uβ
αδ
⋅⋅−⋅⋅+∇⋅⋅∇=
∂∂
( ) ( )21r3fe222 uukukuDt
u⋅⋅−⋅⋅+∇⋅∇=
∂∂
α
( ) ( )
( )33CO
21r3fe333
uyP
uukukuDt
u
2−⋅⋅ρ⋅ε+
+⋅⋅−⋅⋅α−∇⋅∇=∂∂
( )i
21r3fi1 yykykt
yβ
α ⋅⋅−⋅⋅=
∂∂
( )21r3fi2 yykykt
y⋅⋅−⋅⋅=
∂∂
α
( )
( )33CO
21r3fi3
yuP
yykykt
y
2−⋅⋅ρ+
+⋅⋅−⋅⋅α−=∂∂
See Table S1 for the definition of parameters. Parameterizing the equations Solute
exchange between compartment S and E is possible via flux of H+, CO2 and HCO3
-. For this, we have incorporated a Dirichlet boundary condition to E which equates the outer concentration of H+, CO2 and HCO3
- in E with the corresponding concentration in S. The axis of symmetry of E and the entire boundary of I, in contrast, have a reflection (zero-flux) boundary condition.
Solute exchange between compartments E and I occurs solely by means of transmembrane permeation of CO2. Over the short time-scale of our modelling (<1min) and pHi values near resting levels, we have assumed that membrane HCO3
- and H+ transport is negligible. The kinetics of transmembrane CO2 permeation are proportional to (i) the transmembrane [CO2] gradient, (ii) the surface area-volume ratio (ρ) approximated as 3/r and (iii) the permeability
constant PCO2. We adopted a value for PCO2 of 50µm/s, based on experimental data on the rate of pHi change in response to changes in CO2, in the absence of CA activity (inhibition with ATZ; see below). This value is in line with oocyte and aquaporin-blocked erythrocyte membrane data (6-8) and supports rapid CO2 permeation. This value for PCO2 is not rate-limiting for CO2-induced pHi changes in single-cells at typical levels of CA catalysis observed experimentally.
Intracellular buffering capacity (βi) has been determined experimentally in isolated cells (Fig 2B). Extracellular buffering capacity (βe) is unknown and was estimated by best-fitting experimental data. One consequence of buffering is a reduction in the effective H+ diffusion coefficient. This was incorporated into the model with coefficient δ, estimated by best-fitting spheroid data (Fig 5).
The kinetics of reversible CO2 hydration were obtained from single cell data (Fig 2D-E, 5). The forward (kf) and reverse (kr) rate constants for the intracellular reaction were derived from experiments were CA activity was blocked by ATZ (see present work). The extent of catalysis by intracellular CA was modelled as a scalar multiplier (αi) of kf and kr. The ratio kf/kr is constant (KCO2) and assumed to be 10-6.12 M. Using measurements of buffering capacity (Fig 2B), it was possible to estimate the value of the rate constants from the time courses of pHi change (Fig 2D-E). Intracellular pH traces measured experimentally in isolated cells were fitted with a simplified model which omits the extracellular compartment E. By restricting the fitting procedure to the first 15s of CO2-induced pHi change and by starting the experiments from around resting pHi, it was possible to assume that pHi changes due to membrane H+-equivalent transporters are negligible. To model the solution change from 0% CO2 to 5% CO2, extracellular CO2 ([CO2]e) in the third equation was set to 1.2mM. The initial condition was y1=10-
7.25 M, y2=y3=0. For the reverse solution manoeuvre, [CO2]e was set to zero and the initial condition was (assuming equilibrium) y1=10-7.1 M, y2= 1.2mM, y3=11mM. The values for pHi (10-y1) were taken from experimental measurements.
In the absence of CA activity (experiments performed in the presence of ATZ), we have estimated spontaneous intracellular kf to be 0.18s-1 at 37°C. Intracellular CA activity in empty vector and

S3
CA9 expressor cells was found to increase kf by a factor (αi) of 3 and 2, respectively.
We have assumed that the spontaneous kinetics of the extracellular CO2 hydration reaction are the same as for the intracellular reaction. The activity of extracellular CA (αe) cannot be measured in superfused single-cell preparations. We were able to derive an estimate for αe by best-fitting our spheroid data. We have assumed that empty vector spheroids express no extracellular CA activity (αe=1).
Simulating dynamic pHi changes The initial conditions for the PDEs were set to represent the simulated experimental conditions. Where CO2 and HCO3
- were raised from 0 to 5% and 0 to 22mM, respectively, the initial conditions were y1=10-7.35 M, u1=10-7.4 M, y2=y3=u2=u3=0. For the reverse reaction, the initial conditions were y1=10-7.1 M, u1=10-7.4 M, y2=u2=1.2mM, y3=11mM, u3=22mM. The values for pHi were taken from experimental measurements. The model output is presented in terms of the change from starting pHi.
Changes in pHi induced by addition or removal of extracellular CO2/HCO3
- buffer are more coordinated in CA9 expressing spheroids. This suggests that CO2 diffusion across the unstirred extracellular space (compartment E) is facilitated. Extracellular CA9 will increase CO2 diffusion by converting CO2 to HCO3
- and H+. The diffusion of the product ions effectively facilitates CO2 movement. For CA9 to exert its effect efficiently, local changes in extracellular H+ must be minimized, e.g. by buffering or diffusive dissipation. This phenomenon was put in use when estimating extracellular H+ buffering capacity and H+ mobility. The data in Fig 5C-D were fitted for a range of parameters (αe, βe, δ). We conclude, (i) extracellular CA catalysis of 30-fold, (ii) H+ mobility of at least 6000µm2/s, (iii) extracellular H+ buffering capacity of at
least 4.4mM. (iv) in the absence of CA9 activity (i.e. empty
vector spheroids, αe=1), the value of extracellular H+ buffering capacity and H+ mobility do not greatly affect the outcome of the model prediction.
The model outputs in the present work (Fig 6) were generated assuming H+ mobility of 8000
µm2/s and extracellular H+ buffering capacity of 7mM (expressed in units of extracellular volume rather than total spheroid volume).
Predictions made from the computational model: effect of overall CA9 expression level and distribution. The computational model was used to explore possible effects of CA9 levels, and their spatial distribution, on core versus peripheral increases of pHi following bulk extracellular CO2-removal. This was quantified as the pHi time-delay between the two regions (for a threshold pHi change of 0.1 units). In the first set of simulations (solid line), CA9 activity was distributed uniformly, and the multiplier of extracellular CO2 hydration rate (αe) was varied from 1-fold (absence of catalysis) to 100-fold. The output is shown in Fig S2. Increasing CA9 activity decreased the time-delay, so pHi rose more uniformly during CO2 washout. In a second set of simulations (Fig S2, dashed line), to simulate overexpression of CA9 in the core, its activity there was varied from αe=1 to αe=100, while peripheral CA9 activity was fixed at αe=1 (spontaneous rate). Activity between core and periphery was interpolated linearly. The model output is similar to that generated for uniformly-distributed CA9. This suggests the critical site for CA9 expression is the core, as expected from the longer diffusion distance.
Figure S2. Effect of CA9 activity on the core-to-periphery time-delay for CO2 wash-out. CA9 was distributed uniformly (αe throughout; solid curve) or non-uniformly (linearly from αe at core and 1 at periphery; dashed curve).

S4
Table S1 – list of model parameters (corrected to 37°C) Symbol Parameter Initial value Reference
v1 Surface extracellular [H+] 10-7.4 M defined v2 Surface extracellular [HCO3
-] 0 or 22 mM defined v3 Surface extracellular [CO2] 0 or 1.2 mM defined u1 Extracellular [H+] within tissue solved u2 Extracellular [HCO3
-] within tissue solved u3 Extracellular [CO2] within tissue solved y1 Intracellular [H+] solved y2 Intracellular [HCO3
-] solved y3 Intracellular [CO2] solved
PCO2 Membrane permeability to CO2 (single cells) 50 µm/s (6-8) D1 H+ diffusion coefficient in free water 1.20×104 µm2/s (3) D2 CO2 diffusion coefficient in water 2.54×103 µm2/s (2) D3 HCO3
- diffusion coefficient in water 1.59×103 µm2/s (3) δ Reduction in D1 due to buffering >0.5 estimated
KCO2 CO2/HCO3- acid dissociation constant 10-6.12 M (9)
kf Uncatalyzed CO2+H2O HCO3-+H+ rate 0.18 s-1 measured
kr Uncatalyzed HCO3-+H+ CO2+H2O rate kf/KCO2 measured
αi Catalysis by intracellular CA αi>1 measured αe Catalysis by extracellular CA αe>1 estimated βi Intracellular intrinsic buffering capacity 30 mM measured βe Extracellular intrinsic buffering capacity >4.4 mM estimated R1 Minor radius of spheroid 75 µm measured R2 Major radius of spheroid 220 µm measured r Radius of cell within spheroid 5 µm measured ρ Surface area:volume ratio 3/r estimated κ Density of close-packed spheres π/√18 (1) ε Extra-:intracellular volume ratio (1-κ)/κ (1)
Additional references 1. Hales, T. C. 1997. Sphere packings I. Discrete Computational Geom 17:1-51. 2. Mazarei, A. F., and O. C. Sandall. 1980. Diffusion coefficient for helium, hydrogen and carbon dioxide in water
at 25 deg C. AIChE 26:154-157. 3. Vanysek, P. 1999. Ionic conductivity and diffusion at infinite dilution. In Handbook of chemistry and physics.
D. R. Linde, editor. CRC Press, London. 93-95. 4. Irving, M., J. Maylie, N. L. Sizto, and W. K. Chandler. 1990. Intracellular diffusion in the presence of mobile
buffers. Application to proton movement in muscle. Biophys J 57:717-721. 5. Zaniboni, M., P. Swietach, A. Rossini, T. Yamamoto, K. W. Spitzer, and R. D. Vaughan-Jones. 2003.
Intracellular proton mobility and buffering power in cardiac ventricular myocytes from rat, rabbit, and guinea pig. Am J Physiol 285:H1236-1246.
6. Fang, X., B. Yang, M. A. Matthay, and A. S. Verkman. 2002. Evidence against aquaporin-1-dependent CO2 permeability in lung and kidney. J Physiol 542:63-69.
7. Nakhoul, N. L., B. A. Davis, M. F. Romero, and W. F. Boron. 1998. Effect of expressing the water channel aquaporin-1 on the CO2 permeability of Xenopus oocytes. Am J Physiol 274:C543-548.
8. Yang, B., N. Fukuda, A. van Hoek, M. A. Matthay, T. Ma, and A. S. Verkman. 2000. Carbon dioxide permeability of aquaporin-1 measured in erythrocytes and lung of aquaporin-1 null mice and in reconstituted proteoliposomes. JBC 275:2686-2692.
9. Leem, C. H., and R. D. Vaughan-Jones. 1998. Out-of-equilibrium pH transients in the guinea-pig ventricular myocyte. J Physiol 509 ( Pt 2):471-485.

and Richard D. Vaughan-JonesPawel Swietach, Simon Wigfield, Philip Cobden, Claudiu T. Supuran, Adrian L. Harris
Three-dimensional Multicellular GrowthsTumor-associated Carbonic Anhydrase 9 Spatially Coordinates Intracellular pH in
doi: 10.1074/jbc.M801330200 originally published online May 15, 20082008, 283:20473-20483.J. Biol. Chem.
10.1074/jbc.M801330200Access the most updated version of this article at doi:
Alerts:
When a correction for this article is posted•
When this article is cited•
to choose from all of JBC's e-mail alertsClick here
Supplemental material:
http://www.jbc.org/content/suppl/2008/05/20/M801330200.DC1.html
http://www.jbc.org/content/283/29/20473.full.html#ref-list-1
This article cites 47 references, 23 of which can be accessed free at
by guest on May 18, 2016
http://ww
w.jbc.org/
Dow
nloaded from
Copyright © 2022 FDOKUMEN