Microstructural imaging of the human spinal cord with ... - CORE
Upload
independentCategory
view
2download
0
CLINICAL STUDIES
TREATMENT OF CHRONIC PAIN WITH SPINAL CORD
STIMULATION VERSUS ALTERNATIVE THERAPIES:COST-EFFECTIVENESS ANALYSIS
Krishna Kumar,F.R.C.S.(C), F.A.C.S.Department of Surgery, Section ofNeurosurgery, Regina GeneralHospital, University ofSaskatchewan, Regina,Saskatchewan, Canada
Samaad Malik, M.D., B.Sc.Department of Surgery, Section ofNeurosurgery, Regina GeneralHospital, University ofSaskatchewan, Regina,Saskatchewan, Canada
Denny Demeria, M.D.Department of Surgery, Section ofNeurosurgery, Regina GeneralHospital, University ofSaskatchewan, Regina,Saskatchewan, Canada
Reprint requests:Krishna Kumar, F.R.C.S.(C),F.A.C.S., Medical Office Wing,Regina General Hospital, Regina,SK, S4P 0W5, Canada.Email: [email protected]
Received, August 20, 2001.
Accepted, February 19, 2002.
OBJECTIVE: There is limited available research measuring the cost-effectiveness ofspinal cord stimulation (SCS), compared with best medical treatment/conventionalpain therapy (CPT). The purpose of this study was to tabulate the actual costs (inCanadian dollars) for a consecutive series of patients treated with SCS in a constanthealth care delivery environment and to compare the costs with those for a controlgroup treated in the same controlled environment.METHODS: We present a consecutive series of 104 patients with failed back syn-drome. Within this group, 60 patients underwent SCS electrode implantation, whereas44 patients were designated as control subjects. We monitored these patients for a5-year period and tabulated the actual costs incurred in diagnostic imaging, profes-sional fees paid to physicians, implantation (including the costs for hardware), nursingvisits for maintenance of the stimulators, physiotherapy, chiropractic treatments, mas-sage therapy, and hospitalization for treatment of breakthrough pain. From these data,the cumulative costs for each group were calculated for a 5-year period. An analysisof Oswestry questionnaire results was also performed, to evaluate the effects oftreatment on the quality of life.RESULTS: The actual mean cumulative cost for SCS therapy for a 5-year period was$29,123/patient, compared with $38,029 for CPT. The cost of treatment for the SCSgroup was greater than that for the CPT group in the first 2.5 years. The costs of treatingpatients with SCS became less than those for CPT after that period and remained soduring the rest of the follow-up period. In addition, 15% of SCS-treated patients wereable to return to employment, because of superior pain control and lower drug intake.No patients in the control group were able to return to employment of any kind.CONCLUSION: SCS is cost-effective in the long term, despite the initial high costs ofthe implantable devices.
KEY WORDS: Chronic pain, Cost-effectiveness analysis, Spinal cord stimulation
Neurosurgery 51:106-116, 2002 DOI: 10.1227/01.NEU.0000017314.03296.44 www.neurosurgery-online.com
Chronic benign pain in general, and back pain in particular,has generated interest because of its persuasive natureand the high treatment costs, loss of earnings, reduced
productivity, and individual suffering involved. Spinal cordstimulation (SCS) has proven to be an effective therapeutic mo-dality for the treatment of certain chronic pain syndromes (4, 5, 7,11, 14, 19–21, 24). Our experience with SCS for the treatment ofchronic benign pain encompasses two decades (14). Commonindications for SCS include failed back syndrome, pain associ-ated with peripheral vascular disease, peripheral neuropathies,multiple sclerosis, and complex regional pain syndrome I (1, 9,12, 13, 15). Patients who received SCS in our series were all gated
through multidisciplinary pain clinics, where traditional modal-ities of pain relief had failed. Although the literature recognizesthat SCS has its place in the treatment of chronic intractable pain,there are few data to measure the cost-effectiveness of SCS inchronic pain therapy. The financial pressures on third-party pay-ers with advances in medical technology have increased the needfor physicians to include cost-effectiveness as a parameter intreatment planning.
The purpose of this study was to evaluate the costs of SCStherapy, compared with conventional pain therapy (CPT), fora consecutive series of 104 patients with failed back syndrome.In this group, 60 patients underwent SCS, whereas 44 patients
106 | VOLUME 51 | NUMBER 1 | JULY 2002 www.neurosurgery-online.com

continued treatment with conservative treatment modalities.To quantify the effects of these treatments on the quality oflife, the Oswestry questionnaire (6) was administered at thetime of patient enrollment into the study and during thefollow-up period.
Our data suggest that the cumulative costs of SCS therapyare bimodal, with an initially high component for 2.5 yearsbecause of the requirement for expensive implantable hard-ware. After that period, the costs of CPT were greater thanthose of SCS therapy through 5 years. We made no attempt toattribute monetary values to the degree of pain relief, thebenefits of a return to employment, improvements in thequality of life, or reductions in workman’s compensation ben-efits, where applicable, because of multiple variable factorsand the subjectivity that such calculations would impose. Suchconsiderations would increase the advantages of SCS overCPT.
PATIENTS AND METHODS
Patient Selection
We have a large database that includes data for 350 patientswho have undergone SCS in the past 20 years. For this study,we extracted data for consecutive patients with failed backsyndrome. One hundred twenty-two patients were includedin that category. All patients were initially gated through amultidisciplinary pain clinic, where conservative methods hadfailed. The patients were then referred for SCS therapy. Whilethese patients were awaiting trial stimulation, 18 patients ei-ther moved or refused to participate in the study and thuswere lost to follow-up monitoring. Because none of those 18patients received further treatment of any kind, they did notincur further expense to the system. Therefore, we did notfactor in anticipated costs for the purposes of this study.
These exclusions left a working group of 104 patients whowere monitored for a minimum of 5 years. The data werederived from chart reviews and follow-up appointments, sup-plemented with telephone interviews. The patients were thensubdivided into two groups, i.e., Group A (with implants, SCSgroup) and Group B (without implants, CPT/control group).The groups were matched with respect to age, sex, meannumber of operations performed before enrollment into thestudy (3.3 operations), and time away from work since injury(minimum of 1 yr), and all patients were evaluated by thesame multidisciplinary pain specialist group.
Group A consisted of 60 patients (57.7%; 28 female patients[47%] and 32 male patients [53%]), with a mean age of 52.3years. After evaluations and successful trials, these patientsunderwent permanent SCS electrode implantation, and theycontinued to achieve more than 50% pain relief throughout the5-year follow-up period. There were no explantations of thesystem because of loss of pain control; although four patientsexhibited slight decreases in efficacy during the follow-upperiod, they continued to be quite comfortable and satisfiedwith the stimulation program.
The control group design was necessarily limited by prac-tical considerations for human experimentation. An ideal con-trol group would be composed of patients who were referredfor SCS and responded favorably to trial stimulation but werethen randomly assigned to the implant-treated group (surgicaltreatment, Group A) and a control group (Group B) in whichthe functioning electrode was removed after trial stimulation.In that event, the patients in the control group would haveundergone surgical procedures specifically designed not tobenefit the patients, which is an ethically intolerable situation.To maintain consistency in as many parameters as possible,including the use of a surgical procedure, our control group(medical treatment, Group B) was defined as patients whowere referred for SCS but did not undergo electrode internal-ization. Internalization was not performed because those pa-tients did not achieve more than 50% pain relief from theirstimulators, despite stimulation-induced paresthesia coveringthe territory of the pain. The failure to achieve pain controlmay be attributable to nonspecific reasons. This control groupconstitutes a reasonable sample for comparisons betweenlong-term surgically treated and conservatively treated pa-tients with similar causes for their pain.
Group B consisted of 44 patients (42.3%; 21 female patients[48%] and 23 male patients [52%]), with a mean age of 51.4years. This group was treated with conservative/noninterventional therapies, was matched with Group A, andwas monitored every 6 months (in a manner similar to that forGroup A) during the 5-year study period.
Cost Calculations
The costs tabulated in this study are actual costs based onyear 2000 prices, in Canadian dollars. The costs incurred in thetreatment of patients who underwent SCS were calculatedunder the following headings: 1) hardware used in SCS, 2)professional fees, 3) radiological investigations, 4) hospitaladmissions, 5) drugs, 6) nursing contacts, and 7) electrode orpulse generator replacement during the 5-year follow-up pe-riod. The costs of treatment for patients who were monitoredwith medical treatment were calculated in a similar manner,using the following parameters: 1) physician and other healthcare professional fees, 2) drugs, 3) radiological investigations(computed tomographic [CT]/magnetic resonance imaging(MRI), myelographic, and x-ray studies), 4) alternative thera-pies (massage, physiotherapy, and chiropractic treatments),and 5) hospital admissions for treatment of breakthroughpain.
Effects of the Canada Health Act
To non-Canadian readers, the cost calculations presented inthis article may seem low, compared with their experience inthe United States or western European countries. The lowerfinancial costs are attributable to differences in pricing by themanufacturer of the implantable devices used and tight reg-ulation (by the provincial or federal government) of the feeschedules for various professional organizations. However,
COST-EFFECTIVENESS OF SPINAL CORD STIMULATION
NEUROSURGERY VOLUME 51 | NUMBER 1 | JULY 2002 | 107

the cost comparisons between SCS and CPT are valid on arelative basis. It is important to note that, in Canada, the healthcare system is universal, accessible, comprehensive, portable,and publicly funded and is governed by the Canada HealthAct, which was enacted in 1984 by the federal government andis administered by each province for its subjects. The CanadaHealth Act outlines necessary requirements that provincialhealth care insurance plans must fulfill. Under this act, hos-pitals are prohibited from adding any premium to the actualcost of any implantable device.
Costs of Implantable Devices
The costs for implantable devices were calculated from theyear 2000 price list provided by the manufacturer (Medtronicof Canada, Ltd., Mississauga, ON, Canada), as charged toCanadian hospitals. We used the actual prices charged tohospitals by the manufacturer, because no increases in theprices to patients are permissible under Canadian law. Theimplantable devices used in SCS treatment consisted of anelectrode, pulse generator, and connector cord. The pulsegenerator needed to be replaced after 3.5 to 4.5 years (theaverage lifespan of its battery). Some designs are externallypowered and do not require periodic battery replacement;however, those devices have poor patient acceptance becauseof the inconvenience of carrying the transmitter on the beltand the use of antennae, which frequently cause skin rashesand allergic reactions. For our calculations, we observed thatthe frequency of pulse generator replacement was, on average,once every 4 years. Our study also revealed that the electroderequired replacement once every 5 years, on average, becauseof fracture, migration, or fibrosis. The cost associated withelectrode replacement was amortized for a 5-year period, be-cause there was no identifiable average electrode lifespan.
Costs Associated with Iatrogenic Complications
The following iatrogenic complications were observed: 1) su-perficial infections that resolved with antibiotic treatment, with-out explantation; 2) infections that required explantation andtreatment with antibiotics, followed by reimplantation; and 3)respiratory complications that required antibiotic treatment andprolonged hospital stays. In the first 1 year after implantation, weobserved four infections. In two cases, the infections were super-ficial and resolved with intravenously administered antibiotics.The other two cases required explantation, followed by antibiotictherapy and reimplantation. Eight cases involved minor respira-tory complications, such as atelectasis or pneumonia. These weretreated with appropriate antibiotics as indicated, in conjunctionwith respiratory therapy.
Medical Personnel Costs
Physicians and other health care professionals in Canadaare paid on a fee-for-service basis. The fee schedules for var-ious professional bodies are controlled by the provincial gov-ernments, after negotiation with the professional licensingbodies. The fees paid to the various physicians and surgeons
in the study were derived from the year 2000 payment sched-ule for the Saskatchewan Medical Association.
Nursing and Allied Health Care Professional Costs
The costs of nursing contacts for the maintenance of pa-tients enrolled in the SCS group were derived from the hourlywages paid to the health care workers, as determined by thenursing union contract. Each patient contact was equated to 1hour of wage. A similar approach was used for social workerinvolvement. The costs of physiotherapy, chiropractic treat-ment, massage therapy, and acupuncture were determined onthe basis of the fee schedules approved by the respectiveassociations.
Costs of Investigations
The costs of various imaging procedures (CT, MRI, myelo-graphic, and x-ray studies) were provided by the financedepartment of the Regina Health District.
Hospitalization Costs
The daily hospitalization cost, as approved for the institu-tion at which the study was conducted, was $627. This was theexact amount paid to the hospital by the government ofSaskatchewan in the year 2000. No markup is chargeable topatients, according to Canadian law.
Pharmacotherapy Costs
The pharmacotherapy costs that the patients paid for painmanagement were determined by using the SaskatchewanHealth Formulary (Table 1). The drugs commonly used bypatients in our series included antidepressants, benzodiaz-epines, opioids, nonsteroidal anti-inflammatory drugs, anal-gesics, and muscle relaxants. These costs were determined ona monthly basis, allowing a prefixed, government-approved,pharmacy markup schedule (over wholesale prices) and a flatrate for dispensing (Table 1), according to the current pharma-ceutical standards of practice. In our province, the govern-ment approves the wholesale price of each drug, the allowablemarkup for each drug, and the chargeable dispensing fees.
TABLE 1. Formulae used in the calculation of costsfor pharmacotherapya
A. Wholesale cost of a particular medication/mo � wholesalecost of medication/pill � number of pills consumed/patient/d �30 d/mo
B. Pharmacy markup schedule (over wholesale cost)$0–6.31, 30% markup$6.32–15.81, 15% markup$15.81–200.00, 10% markup
C. Dispensing fee for each drug for 1-mo supply � $7.15
a Total cost/mo/medication � Cost A � Cost B � Cost C.
KUMAR ET AL.
108 | VOLUME 51 | NUMBER 1 | JULY 2002 www.neurosurgery-online.com

Cumulative Cost Calculations
Group A
The actual cumulative costs were determined via data col-lection under the following headings (Tables 2 and 3): 1) pro-fessional costs (medical consultation fees and surgical costs);
2) costs of various imaging investigations; 3) costs of implant-able equipment (electrode, pulse generator, and in-line con-nector); 4) costs of treatment of iatrogenic complications (in-fections); 5) costs of pharmacotherapy to control breakthroughpain; 6) hospital admission costs for implantation, if needed; 7)SCS maintenance costs, calculated by adding fees associatedwith physician contacts, nursing contacts, electrode changesbecause of fracture, malfunction, or shifting (with the associ-ated professional costs and hospital charges for treatment ofthe pathological condition), and pulse generator changes (withthe associated professional costs and hospital charges); and 8)physician contact costs (statistical analysis for our series re-vealed that patients with functional implants visited a familyphysician four times/yr and a neurosurgeon twice/yr). Afterwe determined the yearly costs, we extrapolated the cumula-tive costs for a period of 5 years (Tables 2–4).
Group B
The actual cumulative costs were determined via data col-lection under the following headings (Table 5): 1) costs ofevaluations by various health care professionals, includingfamily physicians, orthopedic surgeons, psychiatrists, socialworkers, neurologists, and neurosurgeons; 2) imaging costs(CT, MRI, x-ray, and myelographic studies) required initiallyand during episodes of pain flare-up (in our series, it wasobserved that patients required one CT study and one MRIstudy every 2 yr); 3) pharmacotherapy costs, calculated asoutlined for Group A; 4) costs of alternative therapies (phys-iotherapy, chiropractic treatments, massage therapy, and acu-puncture); and 5) costs of intermittent hospitalization for treat-ment of acute breakthrough pain (in this series we observedthat patients experiencing breakthrough pain required an av-erage of 3 d of hospitalization/yr). It should be noted thatsurgical costs, including the costs of hardware for trial stim-ulation and hospital charges for that time, were not includedfor Group B.
Evaluation of Quality of Life and Patient Satisfaction
To determine the effects of SCS treatment on the quality oflife and function, we administered the Oswestry disabilityquestionnaire (6) at the time of enrollment into the study andevery 1 year during the follow-up period. The results werethen averaged for a 5-year period. With a separate question-naire, patients who underwent SCS were questioned regard-ing their satisfaction with the treatment, whether they wouldundergo a repeat procedure for the same degree of benefit,and whether they would recommend this procedure to theirfriends and relatives with similar pain problems.
RESULTS
Group A
Sixty patients were included in Group A. Calculations ofthe average initial costs of implantation for the patients whoreceived permanent SCS implants are summarized in Table 2.
TABLE 2. Evaluation and implantation costa
Unitcost($)
Averageunit
frequency(d)
Averageunit
cost ($)
Averagecost/
patient($)
ConsultationPsychiatrist 108Social worker 84General practitioner 44 426Neurosurgeon 57Neurologist 85Orthopedic surgeon 48
InvestigationsCT scans 465 1.7 822MRI scans 1045 1.1 1184 2390X-rays 36 5.6 202Myelograms 135 1.4 182
SurgeryAnesthesia
Implantation 192Internalization 93
Neurosurgicalprofessional fees
1156
Implantation 593Internalization 216Assistant surgeon 62
Pulse generatorsItrel III 5825Itrel II 5675 6110X-trel 7650
ElectrodesResume 1595 1595Pisces-Quad 1595
In-line connector 625 625Complications
Explantation 236 2 472IV antibiotic treatment 56 2 112 308Reimplantation 8617 2 17,234Respiratorycomplications
153 4 612
Antibiotics forsuperficial infections
14 2 28
Hospital admission 627 6.9 4326Total 16,936
a CT, computed tomographic; MRI, magnetic resonance imaging; IV, in-travenous.
COST-EFFECTIVENESS OF SPINAL CORD STIMULATION
NEUROSURGERY VOLUME 51 | NUMBER 1 | JULY 2002 | 109

The types of pulse generators used in this study included ItrelII, Itrel III, and X-trel (Medtronic, Inc., Minneapolis, MN).Thirty-nine patients (65%) received Itrel II pulse generators, 14(23%) received Itrel III pulse generators, and 7 (12%) receivedX-trel pulse generators. The average pulse generator cost was$6110. The electrodes used in this series were either Resume orPisces-Quad electrodes (Medtronic, Inc.), with an averageprice of $1595. The average cost for the in-line connectors was$625. The initial imaging costs (before implantation) for x-rays,myelograms without CT scans, CT scans, and MRI scans of the
lumbar spine were $202, $182, $822, and $1184, respectively,totaling $2390. Professional costs, which included costs forinitial assessments by a primary care physician and consulta-tion services rendered by an orthopedic surgeon, psychiatrist,social worker, neurologist, and neurosurgeon, totaled $426.The costs of surgery and anesthesia for implantation were$1156 for each implantation procedure. The average cost fortreatment of iatrogenic complications was $308. The hospitalcharges during the study period were $627/d, with an averagehospital stay of 6.9 d/patient, totaling $4326. These costs to-taled $16,936/patient in the year of implantation (Table 2).
Maintenance costs included costs for follow-up monitoringby a family physician, a neurosurgeon, and a neuromodula-tion nurse and the costs of medications used during flare-upperiods (Table 3). Patients with functional implants visitedtheir family physicians four times/yr and a neurosurgeontwice/yr, at a total cost of $290/yr. Neuromodulation nursingcontact costs for implant maintenance (optimization of stim-ulator parameters) were $92/yr/patient; an average of 3.1contacts/yr were required. The cost of medications for thetreatment of breakthrough pain was $302/yr. Our records
TABLE 3. Costs of spinal cord stimulation maintenance
Description Unit cost ($)Unit
(frequency)Cost ($) 5-yr cost ($)
Physician contactsFamily physician 44 4 visits/yr 176Neurosurgeon 57 2 visits/yr 114Total 290 1450
Nursing contacts for stimulation parameter optimization and counseling 30 3.1 visits/yr 92 460
Pharmacotherapy for pain flare-ups 302 1510
Electrode changea 1595 1 1595 1595
Professional costs for electrode changea
Anesthesia 93Neurosurgeon 275Hospital charge 75Total 443 443
Pulse generator replacementb 6005 1 6005
Professional fees for pulse generator changeb
Anesthesia 284General practitioner consultation 44Neurosurgeon consultation 57Neurosurgeon 202Assistant surgeon 62Hospital charge 75Total 724 724
Total (5-yr cost) 12,187
a Once in every 5-year period.b Once in every 4-year period.
TABLE 4. Costs of treating a patient with chronic pain withstimulation for 5 years
Data Costs ($)
Table 2 16,936
Table 3 12,187
Total (Table 2 � Table 3) 29,123
KUMAR ET AL.
110 | VOLUME 51 | NUMBER 1 | JULY 2002 www.neurosurgery-online.com

revealed that SCS patients required, on average, one electrodechange during the 5-year study period (precipitated by frac-ture, shifting, or nonfunction); the associated costs of surgeryfor replacement were $2038 (cost of the electrode [$1595] �professional costs [$368] � hospital costs [$75]). The pulsegenerator also needed to be replaced an average of once every4 years, at a cost of $6729, because of battery power depletion.
To determine the cumulative costs, we projected these cal-culations for a 5-year period by determining the followingaverage costs per patient per year (Tables 2 and 3): Cost a, costsof the initial evaluation ($426) and investigations ($2390); Costb, cost of implantation ($13,812; hardware costs, $8330; surgi-
cal fees, $1156; hospitalization costs, $4326); Cost c, cost oftreatment of iatrogenic complications ($308); Cost d, SCSmaintenance cost ($684; physician, $290; nursing contacts, $92;drugs, $302); Cost e, cost of electrode replacement (once every5 yr) ($2038; for purposes of calculation, this was amortizedfor a 5-yr period at $408/yr); Cost f, cost of pulse generatorreplacement (once every 4 yr) ($6729; pulse generator, $6005;surgical fees, $649; hospital costs, $75). Therefore, the cumu-lative costs were as follows (Table 6): Year 1, Cost a � Cost b� Cost c � amortized Cost d; Year 2, Year 1 cost � Cost c �amortized Cost d; Year 3, Year 2 cost � Cost c � amortizedCost d; Year 4, Year 3 cost � Cost c � amortized Costs d � e;
TABLE 5. Annual medical resource use by patients who have undergone nonsurgical chronic carea
Therapy description Unit cost ($)Average unit(frequency)
Cost/yr ($) 5-yr cost ($)
Physician visits (24 visits/yr with family physician) 22 24 528 2640
Specialist consultation1 visit with neurologist 85 1 85 4251 visit with neurosurgeon 57 1 57 2851 visit with orthopedic surgeon 48 1 48 2401 visit with psychiatrist/psychologist 108 1 108 540Social worker 21 4 h 84 420
Hospitalization for breakthrough pain 627 3 d 1881 9405
Medications (antidepressants, anti-inflammatory agents, benzodiazepines, musclerelaxants, opioids)b
861 861 4305
Alternative therapiesPhysiotherapy 30 57.6 1736 8680Chiropractic treatment 22 17.2 373 1865Massage therapy 40 10.1 404 2020Acupuncture 35 10.6 371 1855
Total for alternative therapies 2884 14,420
Total maintenance cost (Cost A � Cost B � Cost C � Cost D � Cost E) 6536
Initial diagnostic proceduresc
CT scans, lumbar spine 465 1.8 825 825MRI scans, lumbar spine 1045 1.0 1071 1071X-rays, lumbar spine 36 6.8 244 244Myelograms 135 1.4 189 189
Total for diagnostic procedures 2329 2329
Total 8865 35,009
Diagnostic procedures precipitated by flare-ups during study, CT and MRI scans,lumbar spined
1510 2 3020 3020
Total (5-yr) 38,029
a CT, computed tomographic; MRI, magnetic resonance imaging.b Derived from chart review.c For establishing diagnosis and entry into the study.d Performed once every 2 years.
COST-EFFECTIVENESS OF SPINAL CORD STIMULATION
NEUROSURGERY VOLUME 51 | NUMBER 1 | JULY 2002 | 111

Year 5, Year 4 cost � Cost c � amortized Cost d. At the end ofa 5-year period, the average cumulative cost for this groupwas $29,123.
During the 5-year study period, none of these patients un-derwent lumbar spine surgery. Therefore, no extra costs wereattributable to such procedures.
Group B
The control group consisted of 44 patients. This grouprequired a greater number of physician visits per year forassessments, as well as to obtain prescriptions for pharmaco-therapy or referrals to allied health care professionals. Theaverage number of family physician visits was 24/patient/yr,with an average yearly cost of $528. In addition, each patientsought consultations with various specialists (a neurosurgeon,an orthopedic surgeon, a neurologist, a psychiatrist/psychologist, and a social worker) an average of five times/yr,with a cost of $910/yr. On average, each patient initiallyrequired 1.8 CT scans, 1.0 MRI scan, 6.8 x-rays of the lumbarspine, and 1.4 myelograms. Therefore, the average initial im-aging costs for this group were $2329. In addition, during thefollow-up period, each patient required CT/MRI studies onceevery 2 years, on average, with a cost of $1510. This group alsorequired hospitalization an average of 3 d/yr, because of acutepain exacerbations, at a cost of $1881. The cost of pharmaco-therapy for pain averaged $861/yr (Table 5). The averagenumbers of visits to physiotherapists, chiropractors, massagetherapists, and acupuncturists were 57.6, 17.2, 10.1, and 10.6visits/yr, respectively, yielding a total cost of$2884/patient/yr.
To determine the cumulative costs, we projected these cal-culations for a 5-year period by determining the followingaverage costs per patient per year (Table 5): Cost a, cost ofinvestigations ($2329); Cost b, cost of maintenance (total,$6536; pharmacotherapy, $861; physician contacts, $910; alter-native therapies, $2884; hospitalization for treatment of break-
through pain, $1881); Cost c, cost of secondary investigationsevery 2 years (costs of CT and MRI scans, $1510 � 2 � $3020,amortized for a 4-yr period as $755/yr, allocated to the sec-ond, third, fourth, and fifth years of the follow-up period).Therefore, the cumulative costs per patient for Group B wereas follows (Table 6): Year 1, Cost a � Cost b; Year 2, Year 1 cost� Cost b � amortized Cost c; Year 3, Year 2 cost � Cost b �amortized Cost c; Year 4, Year 3 cost � Cost b � amortizedCost c; Year 5, Year 4 cost � Cost b � amortized Cost c. At theend of a 5-year period, the cumulative costs for this groupwere $38,029/patient.
Figure 1 demonstrates that the costs of SCS therapy aregreater than those of CPT in the first 2.5 years, because of theinitial high costs of the implantable devices. After that period,SCS treatment becomes economically favorable for patientswho respond positively to SCS. Although the costs of pulsegenerator replacement in the fourth year tend to bring the twocurves closer, CPT remains relatively more expensive. Withprojection of these data for a 10-year period, these savings aremagnified (Fig. 2).
Quality of Life Considerations
Although the cost of therapy may dictate which methodsare used for the treatment of chronic pain, patient quality oflife is equally important, if not more important. Patient func-tioning and quality of life were measured by using the Oswe-stry disability questionnaire (6). The questionnaire indicated a27% improvement in quality of life for the SCS group, com-pared with 12% improvement for the control group.
For assessment of patient satisfaction with SCS, an addi-tional questionnaire was used. The responses were gradedinto three groups, i.e., very satisfied, satisfied, and unsure.Thirty-six patients (60%) reported being very satisfied, 17patients (28%) reported being satisfied, and 7 patients (12%)were unsure. Because SCS was the only modality that hadgiven the very satisfied and satisfied groups comfort andallowed reductions of drug usage, the patients noted that they
TABLE 6. Actual annual costs of spinal cord stimulation andconventional pain therapy for 5 yearsa
YearActual costs ($) Cumulative costs ($)
SCS CPT SCS CPT
1 18,028 8865 18,013 8865
2 1092 7291 19,120 16,156
3 1092 7291 20,212 23,447
4 7819 7291 28,013 38,738
5 1092 7291 29,123 38,029
Total 29,123 38,029
Average 5825 7606
a SCS, spinal cord stimulation; CPT, conventional pain therapy.
FIGURE 1. Graph illustrating the cumulative costs of SCS versus CPTfor a 5-year period. The 2.5-year payoff period should be noted.
KUMAR ET AL.
112 | VOLUME 51 | NUMBER 1 | JULY 2002 www.neurosurgery-online.com
would recommend this procedure to relatives or friends withsimilar pain problems.
A benefit of SCS treatment in addition to the cost savingswas that nine patients (15%) in Group A were able to return tosome form of gainful employment, compared with none inGroup B. Drug intake was also reduced with SCS. Preopera-tively, the average cost for drug therapy for pain was $78/mo(this cost was calculated from our patient records before en-rollment and is not presented in the tables); postoperatively,the cost decreased to $25/mo. The average pharmacotherapycost for the control group was higher, i.e., $861/yr ($72/mo).
Statistical Analyses
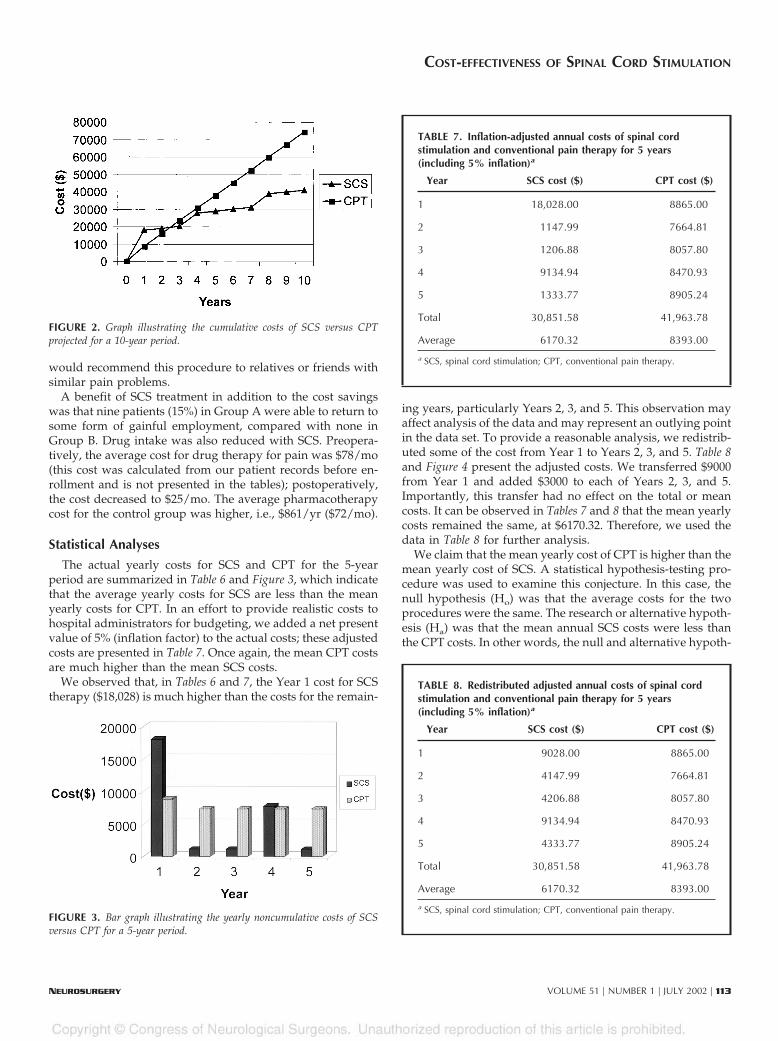
The actual yearly costs for SCS and CPT for the 5-yearperiod are summarized in Table 6 and Figure 3, which indicatethat the average yearly costs for SCS are less than the meanyearly costs for CPT. In an effort to provide realistic costs tohospital administrators for budgeting, we added a net presentvalue of 5% (inflation factor) to the actual costs; these adjustedcosts are presented in Table 7. Once again, the mean CPT costsare much higher than the mean SCS costs.
We observed that, in Tables 6 and 7, the Year 1 cost for SCStherapy ($18,028) is much higher than the costs for the remain-
ing years, particularly Years 2, 3, and 5. This observation mayaffect analysis of the data and may represent an outlying pointin the data set. To provide a reasonable analysis, we redistrib-uted some of the cost from Year 1 to Years 2, 3, and 5. Table 8and Figure 4 present the adjusted costs. We transferred $9000from Year 1 and added $3000 to each of Years 2, 3, and 5.Importantly, this transfer had no effect on the total or meancosts. It can be observed in Tables 7 and 8 that the mean yearlycosts remained the same, at $6170.32. Therefore, we used thedata in Table 8 for further analysis.
We claim that the mean yearly cost of CPT is higher than themean yearly cost of SCS. A statistical hypothesis-testing pro-cedure was used to examine this conjecture. In this case, thenull hypothesis (Ho) was that the average costs for the twoprocedures were the same. The research or alternative hypoth-esis (Ha) was that the mean annual SCS costs were less thanthe CPT costs. In other words, the null and alternative hypoth-
FIGURE 2. Graph illustrating the cumulative costs of SCS versus CPTprojected for a 10-year period.
FIGURE 3. Bar graph illustrating the yearly noncumulative costs of SCSversus CPT for a 5-year period.
TABLE 7. Inflation-adjusted annual costs of spinal cordstimulation and conventional pain therapy for 5 years(including 5% inflation)a
Year SCS cost ($) CPT cost ($)
1 18,028.00 8865.00
2 1147.99 7664.81
3 1206.88 8057.80
4 9134.94 8470.93
5 1333.77 8905.24
Total 30,851.58 41,963.78
Average 6170.32 8393.00
a SCS, spinal cord stimulation; CPT, conventional pain therapy.
TABLE 8. Redistributed adjusted annual costs of spinal cordstimulation and conventional pain therapy for 5 years(including 5% inflation)a
Year SCS cost ($) CPT cost ($)
1 9028.00 8865.00
2 4147.99 7664.81
3 4206.88 8057.80
4 9134.94 8470.93
5 4333.77 8905.24
Total 30,851.58 41,963.78
Average 6170.32 8393.00
a SCS, spinal cord stimulation; CPT, conventional pain therapy.
COST-EFFECTIVENESS OF SPINAL CORD STIMULATION
NEUROSURGERY VOLUME 51 | NUMBER 1 | JULY 2002 | 113

eses are as follows: Ho, there is no difference between themean costs of the two treatment modalities; Ha, the mean costof SCS is less than the mean cost of CPT.
The hypothesis test for comparing two population meanswas investigated with the pooled, two-sample, Student’s t test.First, we assumed that the population variances were equal.The analysis was performed by using Minitab statistical soft-ware (Minitab, Inc., State College, PA), which formulated a Pvalue of 0.04. This provided evidence of a significant differ-ence between the average treatment costs for SCS and CPTprocedures. It should be noted that the pooled t proceduresassumed that the population variances were homogeneous.We also performed analysis with unequal population vari-ances; in that situation, the P value was 0.58, and thus wereject the null hypothesis of equality of the mean costs at a5.8% level of significance. In both cases, we reject the nullhypothesis. There is sufficient evidence to conclude that themean yearly cost of SCS is less than the mean yearly cost ofCPT. SCS is thus cost-effective, compared with CPT, for the5-year period. From Tables 6 and 8, it can be safely extrapo-lated that the mean treatment cost for SCS will continue to besignificantly smaller than the average treatment cost for CPTas the number of years increases.
Sensitivity Analysis
In this study, we tabulated data from actual patient files, forpatients monitored within a constant delivery environment.There are three possible variables that must be considered, i.e.,1) the clinical efficacy rate for SCS, 2) the complication rateassociated with SCS, and 3) the lifespans of the pulse genera-tor battery and the electrode.
These variables are less applicable in our case than in otherpublished studies, in which theoretical models of medicalresource utilization were used. The clinical efficacy rate hasremained stable for the past 10 years but may improve in thefuture, with the development of more effective patient screen-ing. In our study, no operative procedures were required,except for those related to hardware complications. This inci-dence has remained constant in all published studies in thepast decade, leaving only two variables that may affect costs inthe foreseeable future, namely the lifespan of the electrode andthe battery life of the pulse generator. The manufacturers areactively pursing improvement of these items. If the manufac-turers were to improve the function of these two componentsby 25% in the future, the payoff period would decrease from2.5 years to 2.3 years.
DISCUSSION
Shealy et al. (22, 23) were the first to advocate the applica-tion of electrical current to the spinal cord to relieve pain. Thephysiological mechanism by which SCS relieves pain is par-tially explained by the gate theory proposed by Melzack andWall (18). In early years, many patients with chronic painunderwent SCS; however, because the selection criteria werepoorly defined, the results were far from satisfactory (7). In
subsequent years, indications were clarified by the work ofLazorthes et al. (16), Winkelmuller (25), Gybels et al. (8), Kimet al. (10), North et al. (20, 21), Kumar et al. (14), Meglio et al.(17), and Barolat et al. (1), and SCS has become an importantmode of treatment for failed back syndrome. We attempted tomatch the two groups with respect to the cause of their pain asmuch as possible. However, Group B could have a slightlyhigher proportion of patients with nociceptive pain andGroup A patients with lumbosacral rhizopathy. With the in-creasing costs of medical technology, it is necessary for phy-sicians to provide evidence that SCS is a cost-effective methodof treatment, compared with nonsurgical therapies.
To date, there have been only two published studies (2, 3)on the cost-effectiveness of SCS, to our knowledge. Bell et al.(3) demonstrated that, among patients who responded favor-ably to SCS, the estimated payoff period was 2.1 years. How-ever, in that study, Bell et al. (3) developed theoretical modelsof medical resource utilization for the two groups of patients(SCS and CPT). Their cost calculations were based on theanticipated use of resources, as determined from clinical liter-ature, retrospective data sets, expert opinions, and publisheddiagnostic and therapeutic protocols. The drawback of thatstudy was that all calculations were based on presumptions,rather than actual recorded costs for the treatment of the twogroups. Bel and Bauer (2) monitored 14 patients for the rela-tively short period of 2 years and concluded that the treatmentof chronic pain with SCS was cost-effective, compared withconventional therapy, because the cost of electrode implanta-tion was quickly compensated for by a drastic reduction indrug utilization and increased reentry into the workforce aftersurgery. That study was limited because of the small numberof patients and the short follow-up period, and it failed toprovide data for calculation of the recovery period for the highcosts of implantable devices used in SCS treatment, comparedwith CPT.
We designed our study to allow monitoring of a largenumber of patients in the two groups (SCS and CPT) for a5-year period and to address some of the flaws in those earlierreports. We recorded the actual costs incurred in the treatmentof both groups of patients, increasing the validity of ourresults. The absolute derived costs may not be directly com-
FIGURE 4. Bar graph illustrating the redistributed adjusted costs of SCSversus CPT for a 5-year period, including 5% inflation.
KUMAR ET AL.
114 | VOLUME 51 | NUMBER 1 | JULY 2002 www.neurosurgery-online.com

parable to those encountered and may be lower than those inthe United States or Europe. This difference is a consequenceof the nature of the medical delivery system in Canada anddifferences in pricing by the manufacturer in different coun-tries, which limit absolute costs. Because the same economicscale was applied to the various factors that modulate therapyfor both of our study groups, our conclusions remain valid ona relative basis.
The cumulative cost for the SCS group for the 5-year periodwas $29,123/patient (Table 4), compared with the controlgroup figure of $38,029/patient (Table 5). The higher costs forthe non-surgically treated group are attributable to the pa-tients’ greater utilization of health care resources for drugtherapy, rehabilitation services, and other therapies for paincontrol (Table 5). Figure 1 indicates that the costs of CPT exceedthose of SCS, on a monthly basis, at 2.5 years. In the SCSgroup, costs are higher in the first 2 years because of the highcosts of the implantable devices. After 2.5 years, the costs ofprimary treatment with SCS become less than those for thecontrol group. This cost benefit is maintained throughouttherapy, despite the periodic increases in expenses attributableto the costs associated with hardware manipulation and re-placement of the pulse generator (because of depletion of itsbattery power) (Fig. 1).
Our analysis indicates that additional cost savings couldresult from improvements in the effectiveness of SCS therapy.These improvements might be achieved via more effectivepatient selection criteria and technological advances in theequipment used. The manufacturers need to focus on methodsto improve the longevity of the pulse generator and the du-rability of the electrode.
CONCLUSIONS
Patients with chronic pain secondary to failed back syn-drome who respond to SCS therapy can achieve significantcost savings, compared with a control group. Additional ben-efits may include an increased rate of work rehabilitation,increased pain control, and a better quality of life. A coordi-nated approach to the treatment of this disabling ailment canresult in better utilization of scarce health care funds.
REFERENCES
1. Barolat G, Schwartzman R, Woo R: Epidural spinal cord stimulation in themanagement of reflex sympathetic dystrophy. Stereotact Funct Neurosurg53:29–39, 1989.
2. Bel S, Bauer BL: Dorsal column stimulation (DCS): Cost to benefit analysis.Acta Neurochir Suppl (Wien) 52:121–123, 1991.
3. Bell GK, Kidd D, North RB: Cost-effectiveness analysis of spinal cordstimulation in treatment of failed back syndrome. J Pain Symptom Manage13:286–295, 1997.
4. Cioni B, Meglio M, Pentimalli L, Visocchi M: Spinal cord stimulation in thetreatment of paraplegic pain. J Neurosurg 82:35–39, 1995.
5. Devulder J, De Laat M, Van Bastelaere M, Rolly G: Spinal cord stimulation:A valuable treatment for chronic failed back surgery patients. J Pain Symp-tom Manage 5:296–301, 1997.
6. Fairbank JC, Couper J, Davies JB, O’Brien JP: The Oswestry low back paindisability questionnaire. Physiotherapy 66:271–273, 1980.
7. Giancarlo B, Sharan AD: Future trends in spinal cord stimulation. NeurolRes 22:279–284, 2000.
8. Gybels J, Erdine S, Maeyaert J, Meyerson B, Winkelmuller W, AugustinssonL, Bonezzi C, Brasseur L, DeJongste M, Kupers R, Marchettini P, Muller-Schwefe G, Nitescu P, Plaghki L, Reig E, Spincemaille G, Thompson S,Tronnier V, Van Buyten JP: Neuromodulation of pain. Eur J Pain 2:203–209,1998.
9. Kemler MA, Barendse GA, van Kleef M, de Vet HC, Rijks CP, Furnee CA,van den Wildenberg FA: Spinal cord stimulation in patients with chronicreflex sympathetic dystrophy. N Engl J Med 343:618–624, 2000.
10. Kim SH, Tasker RR, Oh MY: Spinal cord stimulation for nonspecific limbpain versus neuropathic pain and spontaneous versus evoked pain. Neuro-surgery 48:1056–1064, 2001.
11. Kumar K, Toth C: The role of the spinal cord: Stimulation in the treatmentof chronic pain postlaminectomy. Curr Rev Pain 2:85–92, 1998.
12. Kumar K, Toth C, Nath R: Spinal cord stimulation for chronic pain inperipheral neuropathy. Surg Neurol 46:363–369, 1996.
13. Kumar K, Toth C, Nath R: Spinal cord stimulation is effective in the man-agement of reflex sympathetic dystrophy. Neurosurgery 40:503–509, 1997.
14. Kumar K, Toth C, Nath RK, Laing P: Epidural spinal cord stimulation fortreatment of chronic pain: Some predictors of success—A 15-year experi-ence. Surg Neurol 50:110–121, 1998.
15. Kumar K, Toth C, Nath R, Verma K, Burgess J: Improvement of limbcirculation in peripheral vascular disease using epidural spinal cord stimu-lation: A prospective study. J Neurosurg 86:662–669, 1997.
16. Lazorthes Y, Siegfried J, Verdie JC, Casaux J: Chronic spinal cord stimula-tion in the treatment of neurogenic pain: Cooperative and retrospectivestudy on 20 years of follow-up [in French]. Neurochirurgie 41:73–88, 1995.
17. Meglio M, Cioni B, Rossi GF: Spinal cord stimulation in management ofchronic pain: A 9-year experience. J Neurosurg 70:519–524, 1989.
18. Melzack R, Wall PD: Pain mechanisms: A new theory. Science 150:971–979,1965.
19. North RB, Roark GL: Spinal cord stimulation for chronic pain. NeurosurgClin N Am 6:45–154, 1995.
20. North RB, Ewend MG, Lawton MT, Kidd DH, Piantadosi S: Failed backsurgery syndrome: 5-year follow-up after spinal cord stimulator implanta-tion. Neurosurgery 28:692–699, 1991.
21. North RB, Kidd DH, Zahurak M, James CS, Long DM: Spinal cord stimu-lation for chronic, intractable pain: Experience over two decades. Neurosur-gery 32:384–394, 1993.
22. Shealy CN, Mortimer JT, Hagfors NR: Dorsal column electroanalgesia.J Neurosurg 32:560–564, 1970.
23. Shealy CN, Mortimer JT, Reswick JB: Electrical inhibition of pain by stim-ulation of the dorsal columns: Preliminary clinical report. Anesth Analg46:489–491, 1967.
24. Vaarwerk IA, Staal M: Spinal cord stimulation in chronic pain syndromes.Spinal Cord 36:671–682, 1998.
25. Winkelmuller W: Experience with the control of low back pain by the dorsalcolumn stimulation (DCS) system and by the peridural electrode system(Pisces), in Hosobuchi Y, Corbin T (eds): Indications for Spinal Cord Stimula-tion. Amsterdam, Excerpta Medica, 1981, pp 34–41.
AcknowledgmentNo financial support was received for the generation of this submission. We have
no personal or institutional interest in the devices described in this article.
COMMENTS
Kumar et al. presented two groups of patients treated byspinal cord stimulation (SCS) and conventional chronic
pain therapy (CPT), respectively. They compare the cost-effectiveness of both treatments. In the age of science andtechnology, these types of cooperative studies are very impor-tant in evaluating the real value of surgical methods, whichusually seem very expensive. In the presented series, SCS is
COST-EFFECTIVENESS OF SPINAL CORD STIMULATION
NEUROSURGERY VOLUME 51 | NUMBER 1 | JULY 2002 | 115

shown as not only an effective method but also a cost-effectivetreatment in comparison with CPT. The most important ben-efit of SCS was that 15% of the patients went back to workafter treatment. Improvement in quality of life was 27% in thisgroup, as compared with 12% in the control group, in whichno patient returned to work. Drug intake was also reduced inthe SCS group, which is the most important finding of thisstudy. It must be kept in mind that the results of this studyreflect the skills of an experienced medical team; another, lessexperienced group would not necessarily achieve the sameresults.
Yücel KanpolatAnkara, Turkey
Kumar et al. of the University of Saskatchewan present astudy of the cost-effectiveness of SCS as compared with
CPT. Sixty patients underwent SCS, and 44 patients in whoma trial of SCS had failed were the controls. These patients werefollowed for a 5-year period, and actual costs incurred fordiagnostic imaging; professional fees paid to physicians; im-plantation costs, including hardware; nursing visits for themaintenance of the stimulators; physiotherapy; chiropractic;massage therapy, and hospitalization costs for breakthroughpain, were all calculated. In addition, the authors analyzedoutcomes based on the Oswestry questionnaire (2) to estimatethe effect of treatment on quality of life. On the basis of thisanalysis, Kumar et al. conclude that the cumulative mean costof SCS therapy during a 5-year period was $29,122 per patient,as compared with $38,029 per patient for CPT. Extrapolatingthe cost savings for an additional 5 years on the basis of thesedata, the authors predict that the cost savings would be evengreater.
A number of aspects of this study merit comment. First, thecost of Canadian health care in comparison with that of theUnited States is a relative bargain in that fees and profits arestatutorily limited. Even taking into account the relative infla-tion of the Canadian dollar in comparison with the U.S. dollar,I think that the actual dollar savings in the United States mightbe even greater than the savings projected in this study. Nev-ertheless, the cost analysis is performed within a system that isquite scrupulous about cost accounting.
This type of study is difficult to conduct in any environ-ment. One can certainly quibble about the nature of the “con-trol group.” The study was not performed in a group ofpatients who would otherwise have gone forward with SCSon the basis of a successful trial, which would constitute theauthors’ “ideal” study, in which patients would be random-ized to either SCS or CPT. As the authors point out, this typeof randomized study would present some ethical problems.Whether these difficulties can be surmounted in a future studyremains to be seen. Nevertheless, the control group (Group B)in this study represents a group in whom an SCS trial hadfailed and, for that reason, may represent a more difficultcategory of patient. Potentially, Group B’s treatment wouldseem more expensive than that of the patients who underwentSCS (Group A), regardless of the therapy implemented.
Perhaps most striking is the similarity of the results of thisstudy to those reported by Bell et al. (1). That study also foundthat the financial breakeven point for SCS was approximately2 years, as compared with more conservative management. Italso found that at 5 years, SCS had a distinct cost-effectivenessadvantage over nonsurgical management. The difference be-tween these two studies is that the analysis of Bell et al. wasbased in part on cost projections, whereas Kumar et al.’s datarepresent actual costs. That the results of these two studies,which were performed in two different countries under dif-ferent circumstances, are in such close agreement suggests tome that there is an important principle at work: namely, thatSCS does result in health care system cost savings that arerealized only after several years. It may well be that a morerigorous Class I outcome study of SCS in comparison withconservative management will be performed. Until that time,this study by Kumar et al. should be considered the bench-mark work.
Kim J. BurchielPortland, Oregon
1. Bell GK, Kidd D, North RB: Cost-effectiveness analysis of spinal cord stim-ulation in treatment of failed back surgery syndrome. J Pain SymptomManage 13:286–295, 1997.
2. Fairbank JCT, Couper J, Davies JB, O’Brien JP: The Oswestry low back paindisability questionnaire. Physiotherapy 66:271–273, 1980.
Customer Service Contact Information
CNS Members: Call Sue Souders at: 301/223-2325.
Non-CNS Members: Call either 301/223-2300 or 1-800/638-3030.
Customer Service fax: 301/223-2400.
Customer Service email: [email protected]
KUMAR ET AL.
116 | VOLUME 51 | NUMBER 1 | JULY 2002 www.neurosurgery-online.com
Copyright © 2022 FDOKUMEN