Tratamiento electroquímico de fármacos y colorantes en ...
282
Tratamiento electroquímico de fármacos y colorantes en medio acuoso mediante procesos de oxidación avanzada Sergio Garcia Segura ADVERTIMENT. La consulta d’aquesta tesi queda condicionada a l’acceptació de les següents condicions d'ús: La difusió d’aquesta tesi per mitjà del servei TDX (www.tdx.cat) i a través del Dipòsit Digital de la UB (diposit.ub.edu) ha estat autoritzada pels titulars dels drets de propietat intel·lectual únicament per a usos privats emmarcats en activitats d’investigació i docència. No s’autoritza la seva reproducció amb finalitats de lucre ni la seva difusió i posada a disposició des d’un lloc aliè al servei TDX ni al Dipòsit Digital de la UB. No s’autoritza la presentació del seu contingut en una finestra o marc aliè a TDX o al Dipòsit Digital de la UB (framing). Aquesta reserva de drets afecta tant al resum de presentació de la tesi com als seus continguts. En la utilització o cita de parts de la tesi és obligat indicar el nom de la persona autora. ADVERTENCIA. La consulta de esta tesis queda condicionada a la aceptación de las siguientes condiciones de uso: La difusión de esta tesis por medio del servicio TDR (www.tdx.cat) y a través del Repositorio Digital de la UB (diposit.ub.edu) ha sido autorizada por los titulares de los derechos de propiedad intelectual únicamente para usos privados enmarcados en actividades de investigación y docencia. No se autoriza su reproducción con finalidades de lucro ni su difusión y puesta a disposición desde un sitio ajeno al servicio TDR o al Repositorio Digital de la UB. No se autoriza la presentación de su contenido en una ventana o marco ajeno a TDR o al Repositorio Digital de la UB (framing). Esta reserva de derechos afecta tanto al resumen de presentación de la tesis como a sus contenidos. En la utilización o cita de partes de la tesis es obligado indicar el nombre de la persona autora. WARNING. On having consulted this thesis you’re accepting the following use conditions: Spreading this thesis by the TDX (www.tdx.cat) service and by the UB Digital Repository (diposit.ub.edu) has been authorized by the titular of the intellectual property rights only for private uses placed in investigation and teaching activities. Reproduction with lucrative aims is not authorized nor its spreading and availability from a site foreign to the TDX service or to the UB Digital Repository. Introducing its content in a window or frame foreign to the TDX service or to the UB Digital Repository is not authorized (framing). Those rights affect to the presentation summary of the thesis as well as to its contents. In the using or citation of parts of the thesis it’s obliged to indicate the name of the author.
-
Upload
khangminh22 -
Category
Documents
-
view
2 -
download
0
Transcript of Tratamiento electroquímico de fármacos y colorantes en ...

Tratamiento electroquímico de fármacos y colorantes en medio acuoso mediante procesos
de oxidación avanzada Sergio Garcia Segura
ADVERTIMENT. La consulta d’aquesta tesi queda condicionada a l’acceptació de les següents condicions d'ús: La difusió d’aquesta tesi per mitjà del servei TDX (www.tdx.cat) i a través del Dipòsit Digital de la UB (diposit.ub.edu) ha estat autoritzada pels titulars dels drets de propietat intel·lectual únicament per a usos privats emmarcats en activitats d’investigació i docència. No s’autoritza la seva reproducció amb finalitats de lucre ni la seva difusió i posada a disposició des d’un lloc aliè al servei TDX ni al Dipòsit Digital de la UB. No s’autoritza la presentació del seu contingut en una finestrao marc aliè a TDX o al Dipòsit Digital de la UB (framing). Aquesta reserva de drets afecta tant al resum de presentació de la tesi com als seus continguts. En la utilització o cita de parts de la tesi és obligat indicar el nom de la persona autora.
ADVERTENCIA. La consulta de esta tesis queda condicionada a la aceptación de las siguientes condiciones de uso: La difusión de esta tesis por medio del servicio TDR (www.tdx.cat) y a través del Repositorio Digital de la UB (diposit.ub.edu) ha sido autorizada por los titulares de los derechos de propiedad intelectual únicamente para usos privados enmarcados en actividades de investigación y docencia. No se autoriza su reproducción con finalidades de lucro ni su difusión y puesta a disposición desde un sitio ajeno al servicio TDR o al Repositorio Digital de la UB. No se autoriza la presentación de su contenido en una ventana o marco ajeno a TDR o al Repositorio Digital de la UB (framing). Esta reserva de derechos afecta tanto al resumen de presentación de la tesis como a sus contenidos. En la utilización o cita de partes de la tesis es obligado indicar el nombre de la persona autora.
WARNING. On having consulted this thesis you’re accepting the following use conditions: Spreading this thesis by the TDX (www.tdx.cat) service and by the UB Digital Repository (diposit.ub.edu) has been authorized by the titular of the intellectual property rights only for private uses placed in investigation and teaching activities. Reproduction with lucrativeaims is not authorized nor its spreading and availability from a site foreign to the TDX service or to the UB Digital Repository. Introducing its content in a window or frame foreign to the TDX service or to the UB Digital Repository is not authorized (framing). Those rights affect to the presentation summary of the thesis as well as to its contents. In the using orcitation of parts of the thesis it’s obliged to indicate the name of the author.

Programa de Doctorado: Electroquímica. Ciencia y Tecnología
Tratamiento electroquímico de fármacos y colorantes
en medio acuoso mediante procesos de oxidación
avanzada
Tesis que presenta Sergio Garcia Segura
para optar al título de Doctor por la Universidad de Barcelona
Director de tesis:
Dr. Enric Brillas Coso
Departament de Química Física
Universitat de Barcelona


Agradecimientos
Todas las personas que nos rodean día a día tienen cierta influencia en nuestro desarrollo y
crecimiento en mayor o menor medida, por lo que todas ellas son participes del trabajo de
todos estos años.
Primero me gustaría agradecer a mi familia y muy en especial a mis padres, Sergio y Joana.
Siempre he recibido de vuestra parte un apoyo incondicional en todos los retos de mi vida
independientemente de la envergadura o dificultad de los mismos. Vuestro amor fraternal
siempre ha ayudado a allanar el camino por arduo que fuese. De vosotros he aprendido a
conseguir mis metas desde el esfuerzo y el sacrificio diarios, sin desfallecer nunca por
difícil que parezca. Óscar, que decirle a la persona con la que he crecido toda mi vida. Pese
que como todos los hermanos hemos tenido nuestros más y nuestros menos, siempre he
podido contar contigo en cualquier momento. Eres una de las personas más queridas y
admiradas por mí.
Una persona para la que no tengo suficientes palabras es para ti Abi, me has acompañado
hasta los confines de la tierra, infatigable durante siete años (y los que quedan). No has
dudado en ningún momento en sacrificarlo todo por estar conmigo sin importar tiempo ni
distancia. Has sido siempre mi complemento y un pilar en mi vida.
Creo que también debo dedicarles unas palabras a mis amigos:
Un verdadero amigo es capaz de tocar tu corazón desde el otro lado del mundo, y pese que
Sevilla no queda muy lejos de Barcelona, Antonio, tú has sido capaz de hacerlo. De todos,
tú eres quien mejor ha sido capaz de entender los altibajos emocionales que conlleva una
tesis doctoral. No solo eso, cuantas horas hemos dedicado a hablar de banalidades, salvar el
mundo, o apoyarnos en diferentes dificultades. Me has apoyado mucho.
Mucha gente entra y sale de tu vida, pero solo algunas personas son capaces de dejar huella.
Albert, tu risa, humor y esa aura de “buen-rollismo” han sido capaces de levantar el ánimo
en incontables ocasiones.
Alejandro, amigo tenaz donde los haya. Siempre has estado disponible para cualquier cosa
(aunque te diese un poco de mandra), los sarcasmos e ironías de los que sin duda eres un
maestro hacen reír incluso en los momentos más difíciles.
También debo agradecer a mis amigos de un grupo cuyo nombre no pienso mentar,
vosotros sabéis porqué Alejandro, Anna, Josan y Pastu. Cuantas cenas, risas y grandes

momentos (además de sus rememoraciones) hemos compartido desde hace ya muchos años.
No puedo decir nada que no sepáis ya.
Sin duda alguna todo el Laboratori d’Electroquímica de Materials i del Medi Ambient,
(LEMMA) del que he tenido el placer de formar parte durante todos estos años, merece mi
especial agradecimiento. Los investigadores que forman parte de él me han hecho sentir en
familia:
El Dr. José Antonio Garrido que fue uno de los mejores profesores de la carrera y el
primero en abrirme la puerta del grupo. La Dra. Rosa María Rodríguez siempre enérgica
y llena de alegría. Los dos sois una inseparable pareja sin igual.
Nuestro querido decano, el Dr. Pere Lluís Cabot, siempre ocupado resolviendo todos los
problemas de la facultad, pero sin nunca olvidar del grupo y sus miembros.
Del Dr. Francesc Centellas he aprendido muchísimo a nivel personal y a nivel docente,
gracias por todas las oportunidades que me has brindado tanto en el grupo de innovación
docente Química a la Interfase Secundaria Universitat (QuISU) o como profesor de
problemas. Tus opiniones, puntos de vista y las múltiples charlas que hemos podido
mantener me han enriquecido como persona.
La Dra. Conchita Arias siempre infatigable y maternal ha llenado siempre el laboratorio
de alegría. Siempre has procurado que no nos falte de nada material o emocional. Tus
indicaciones, consejos y directas indirectas han sido una parte muy notoria del “alma” del
laboratorio durante todos estos años y muy importantes para mí.
Por último y el más destacado de forma indiscutible, el boss, el Dr. Enric Brillas. Sin lugar
a dudas eres la persona de la que más he aprendido profesionalmente. Debo agradecerte el
que siempre hayas tenido a bien darme rienda suelta durante la tesis para desarrollar ideas y
trabajos que en alguna ocasión no tenían tu aprobación absoluta o que no tenían relación
directa con la tesis. Tus observaciones, indicaciones, consejos y explicaciones en lo
referido al ámbito personal y profesional basadas en tu experiencia me acompañaran
indelebles en el futuro. Contigo he comido prácticamente cada día y mantenido
conversaciones de lo más diversas (química, docencia, historia, viajes, política y un largo
etcétera) de las que he aprendido a nivel personal. También aprovecho para hacer el
agradecimiento extensible a la Dra. Rosa Mari Bastida (la jefa del jefe), cuya simpatía y
sinceridad deslumbran y de bien seguro algo ha tenido que ver.

El LEMMA es un grupo con mucho movimiento de gente que va y viene. No puedo
olvidarme de toda la gente con la que he compartido laboratorio en algún momento,
muchos de ellos ya doctores: Birame, Paco, Marcel, Isaac, Nacho, Cristina, Elena, Anna,
Isaraín, Amado, Núria, Abdo, Edgar, Lucio, Laye, Ricardo, Griselda, Serena, Alexa,
Francisca, Brenda, Eliane, Claudio, Orlando, Alejandro, Angelo, Aline, Benji,
Jennifer, Nelly, Fabio, Gabriel y Xavi. En especial Amado, Abdo y Laye. Con vosotros
tres he compartido días innumerables y horas que ya resultan incontables, tanto en el
laboratorio como fuera de él. Creo que hemos tenido siempre un ambiente genial en el
laboratorio y un apoyo mutuo que ha hecho que para mí fuera muy fácil trabajar día a día.
También quisiera destacar al Dr. Lucio C. Almeida, al Dr. Ricardo Salazar, Francisca C.
Moreria, la Dra. Eliane Bezerra Cavalcanti y Aline Sales Solano con los que he
trabajado codo con codo y a los que me une una gran amistad.
Fuera del laboratorio también hay vida en la universidad.
Me gustaría agradecer a la Dra. Elvira Gómez su ayuda en muchas gestiones que he
realizado además de sus consejos impagables.
Ramón y Lidia, creo que habéis ayudado con vuestro trabajo al desarrollo de todas las tesis
del departamento, pero sin lugar a dudas habéis ayudado en la mía. Especialmente quiero
agradecer a Ramón su buena disposición y toda la ayuda que me ha brindado en más de
una ocasión sin ser su obligación y sin ni siquiera tener que solicitarla.
No puedo dejar de agradecer a los miembros del QuISU, de los que he aprendido muchas
cosas y sigo aprendiendo. En especial al Dr. Jaume Granell, la Dra. Montserrat Cruells
y la Dra. Mónica Martínez con los que he compartido muchas horas de trabajo y que
tantas cosas me han aportado.
Al Dr. Sergi Dosta le agradezco su buena disposición durante la colaboración que hemos
establecido los dos entre el LEMMA y el CPT, que ha resultado en algunos trabajos que
seguimos desarrollando.
A la Dra. Jelena Radjenovic y al Dr. Jürg Keller les agradezco la atención dedicada y la
oportunidad de trabajar en el Advanced Water Management Centre de la Universidad de
Queensland en la otra punta del mundo, Australia.


ÍNDICE
1. INTRODUCCIÓN 1
1.1. El agua 3
1.2. Contaminantes orgánicos persistentes 4
1.3. Legislación 5
1.4. Tratamientos convencionales 6
1.5. Procesos de oxidación avanzada 7
1.6. Procesos electroquímicos de oxidación avanzada 9
1.6.1. Fotoelectrocatálisis con TiO2 9
1.6.2. Oxidación anódica 10
1.6.3. Electro-Fenton 12
1.6.4. Fotoelectro-Fenton y fotoelectro-Fenton solar 14
1.7. Reacciones parásitas del radical �OH 15
1.8. Electroquimioluminiscencia 16
1.9. Antecedentes bibliográficos 17
2. OBJETIVOS 31
3. EXPERIMENTAL 35
3.1. Reactivos 37
3.2. Reactor de tanque agitado 39
3.2.1. Electrodos 39
3.3. Escala pre-piloto 41
3.3.1. Planta pre-piloto de 10 L utilizada en tratamientos 41
basados en la reacción de Fenton
3.3.2. Planta pre-piloto de 10 L utilizada en tratamientos 44
basados en oxidación anódica
3.4. Procedimientos analíticos 45
3.4.1. Análisis voltamperométricos 45

3.4.2. Carbono orgánico total 45
3.4.3. Nitrógeno total 46
3.4.4. Análisis de haluros orgánicos adsorbibles 47
3.4.5. Decoloración 47
3.4.6. Cuantificación de la demanda química de oxígeno 48
3.4.7. Cuantificación de ClO− 48
3.4.8. Cuantificación de H2O2 48
3.4.9. Técnicas cromatográficas 49
3.4.9.1. Cromatografia de líquidos 49
3.4.9.2. Cromatografia de líquidos acoplada 51
a espectrometría de masas
3.4.9.3.Cromatografia de líquidos acoplada 52
a espectrometría de masas/masas
3.4.10. Medidas de electroquimioluminiscencia 53
3.4.11. Caracterización de los ánodos de TiO2 sintetizados 53
3.4.12. Otras medidas 54
3.5. Parámetros asociados al proceso 54
4. RESULTS AND DISCUSSION 55
4.1. Electrochemical Advanced Oxidation Processes applied to 57
the treatment of wastewaters polluted with pharmaceuticals
4.1.1. PAPER 1: Mineralization of flumequine in acidic medium 67
by electro-Fenton and photoelectro-Fenton processes
4.1.2. PAPER 2: Mineralization of the antibiotic chloramphenicol 79
by solar photoelectro-Fenton: From stirred tank reactor to
solar pre-pilot plant
4.1.3. PAPER 3: Mineralization of the recalcitrant oxalic and 93
oxamic acids by electrochemical advanced process using
a boron-doped diamond anode
4.2. Electrochemical Advanced Oxidation Processes applied 105
to the treatment of wastewaters polluted with azo dyes

4.2.1. PAPER 4: Comparative decolorization of monoazo, 117
diazo and triazo dyes by electro-Fenton process
4.2.2. PAPER 5: degradation of the diazo dye Direct Yellow 4 129
by electro-Fenton, photoelectron-Fenton and photo-assisted
electro-Fenton
4.2.3. PAPER 6: Solar photoelectrocatalytic degradation of 139
Acid Orange 7 azo dye using a highly stable TiO2
photoanode synthesized by athmospheric plasma spray
4.2.4. PAPER 7: Advances in solar photoelectron-Fenton: 151
Decolorization and mineralization of the Direct Yellow 4
azo dye using an autonomous solar pre-pilot plant
4.2.5. PAPER 8: Mineralization of phthalic acid by solar 195
photoelectro-Fenton with a stirred boron-doped
diamond/air-diffusion tank reactor:
Influence of Fe3+ and Cu2+ catalysts and identification
of oxidation products
4.3. Electrochemiluminescence of luminol 209
4.3.1. PAPER 9: Unprecedented electrochemiluminescence 213
of luminol a boron-doped diamond thin-film anode.
Enhancement by electrogenerated superoxide radical anion
4.4. Removal of residual persistent organic pollutants in a real 221
secondary effluent by anodic oxidation with BDD anodes
5. RESUMEN 231
6. CONCLUSIONS 241
7. REFERENCIAS 247


Acrónimos
A Absorbancia (Absorbance)
ADE Electrodo de difusión de aire (Air-diffusion electrode)
AO Oxidación anódica (Anodic Oxidation)
AO7 Naranja ácido 7 (Acid Orange 7)
AOPs Procesos de oxidación avanzada (Advanced Oxidation Processes)
AOX Haluros orgánicos adsorbibles (Adsorbable organohalogens)
APS Proyección térmica de plasma atmosférico (Atmospheric plasma spray)
AR151 Rojo ácido 151 (Acid Red 151)
AWMC Advanced Water Management Centre
BDD Diamante dopado con boro (Boron doped diamond)
BOD Demanda bioquímica de oxígeno (Biochemical oxygen demand)
C-PTFE Carbón-politetrafluoroetileno (Carbon-politetrafluoroethylene)
CHL Cloranfenicol (Chloramphenicol)
CL Quimioluminiscencia (Chemiluminescence)
COD Demanda química de oxígeno (Chemical oxygen demand)
CPC Colector parabólico compuesto (Compound parabolic collector)
CPT Centro de Proyección Térmica
CR Eliminación de color (Color removal)
δ0 Velocidad de decoloración inicial (Initial decoloration rate)
DB71 Azul Directo 71 (Direct blue 71)
DMA Directiva del Marco del Agua
DOC Carbono orgánico disuelto (Dissolved organic carbon)
DPD N,N-Dietil p-fenilendiamina
DSAs Ánodos dimensionalmente estables (Dimensional stable anodes)
DY4 Amarillo Directo 4 (Direct Yellow 4)
ecb− Electrón de la banda de conducción (Electron of conduction band)
EAOPs Procesos electroquímicos de oxidación avanzada

(Electrochemical advanced oxidation processes)
EC Consumo energético (Energetic consume)
ECL Electroquimioluminiscencia (Electrochemiluminescence)
EDS Espectrometría dispersión de energía de rayos X
(Energy dispersive X-ray spectroscopy)
EF Electro-Fenton
FQL Fem Química al Laboratori
FLU Flumequina (Flumequine)
hvb+ Hueco en la banda de valencia (Hole of valence band)
HFCVD Deposición química de vapor de filamento caliente
(Hot filament chemical vapour deposition)
HPLC Cromatografía líquida de alta presión (High pressure liquid chromatography)
IC Carbono inorgánico (Inorganic carbon)
ITO Óxidos de iridio y estaño (Iridium tin oxides)
LC-MS Cromatografía de líquidos acoplada a espectrometría de masas
(Liquid chromatography- mass spectroscopy)
LC-MS/MS Cromatografía de líquidos acoplada a espectrometría de masas/masas
(Liquid chromatography- mass spectroscopy/mass spectroscopy)
LEMMA Laboratori d’Electroquímica dels Materials i del Medi Ambient
MCE Eficiencia de corriente de mineralización (Mineralization current efficiency)
MS Espectrometría de masas (Mass spectroscopy)
NDIR Detector de infrarrojos no dispersivo (Non-dispersive infrared detector)
NOM Materia orgánica natural (Natural organic matter)
NPOC Carbono orgánico no purgable (Non-purgable organic carbon)
PA-EF Electro-Fenton fotoasistido (photoassisted electro-Fenton)
PC Fotocatálisis (Photocatalysis)
PEC Fotoelectrocatálisis (Photoelectrocatalysis)
PEF Fotoelectro-Fenton (Photoelectro-Fenton)

POPs Contaminantes orgánicos persistentes
QuISU Química a la Interfase Secundaria-Universitat
RIR Ratio de intensidad de referencia (Reference Intensity Ratio)
ROS Especies reactivas de oxígeno (Reactive oxygen species)
SEM Microscopio electrónico de barrido (Scanning electron microscopy)
SHE Electrodo Normal de Hidrógeno (Standard hydrogen electrode)
SIM Selección de iones concretos (Selected-ion acquisition)
SPC Solar fotocatálisis (Solar photocatalysis)
SPE Extracción en Fase Sólida (Solid phase extraction)
SPEC Solar fotoelectrocatálisis (Solar photoelectrocatalyisis)
SPEF Solar fotoelectro-Fenton (Solar photoelectro-Fenton)
TC Carbono total (Total carbon)
TIC Corriente total de iones (Total ion current)
TN Nitrógeno total (Total nitrogen)
TOC Carbono orgánico total (Total organic carbon)
UB Universitat de Barcelona
UFLC Cromatografía de líquidos ultra-rápida (Ultra fast liquid chromatography)
UQ University of Queensland
USEPA United States Environmental Protection Agency
UVA Ultravioleta de onda larga (Ultraviolet A)
XRD Difracción de Rayos X (X-ray difraction)
�


���
1.INTRODUCCIÓN

���
�

Introducción �
���
1.1. El agua
El agua es una molécula inorgánica formada por dos átomos de hidrogeno y uno de
oxígeno; pero el agua es mucho más, el agua es vida. La vida tal y como la conocemos
sólo es posible gracias a este bien natural considerado inagotable.
La consideración de que es un recurso inagotable parte de la base de que el agua en sus
tres estados (gas, líquido y sólido) se ha mantenido invariable a lo largo de la historia del
planeta desde su aparición. La circulación de agua cambiando entre los diferentes estados
purifica y redistribuye el agua en el planeta. Todo el proceso se recoge en el llamado ciclo
hidrológico.
Si bien podemos considerar dicho ciclo factible, no podemos decir lo mismo para el agua
potable o de consumo. Si analizamos detenidamente la distribución del agua en el planeta
sorprenderá apreciar que tan solo el 2,5 % del agua es dulce y tan solo un 1,3 %
potencialmente aprovechable por el hombre (USGS). El gran consumo de agua, en
ocasiones desmesurado, por parte de la población y la constante emisión de contaminantes
está generando un problema adicional a la limitación del recurso; puesto que el porcentaje
de agua aprovechable se reduce alarmantemente cada año debido a la contaminación, tal
y como se recoge en el informe anual del desarrollo mundial del agua de acceso abierto
(UNESCO- World Water Development Report).
El agua es un bien común cuya calidad se ha visto enormemente disminuida por el rápido
desarrollo del ser humano en el ámbito tecnológico, científico e industrial que ha dado
lugar a una continuada contaminación y su consiguiente impacto ambiental . La
preocupación sobre el medio ambiente ha ido en aumento durante las dos pasadas décadas
ya que el continuo desarrollo genera nuevos contaminantes y además, se evidencia el
fuerte impacto ambiental de algunos compuestos que se consideraban prácticamente
inocuos debido a sus bajas concentraciones en el medio acuático, como es el caso de los
contaminantes orgánicos persistentes (POPs).

Introducción �
���
1.2. Contaminantes orgánicos persistentes
El objetivo principal de esta tesis ha sido el desarrollo de metodologías para afrontar la
problemática que suponen los contaminantes orgánicos persistentes. Estos contaminantes
reciben el calificativo de persistentes debido a que no son eliminados o tan solo son
parcialmente degradados en las plantas de tratamiento de aguas residuales mediante
tratamientos convencionales generando otros contaminantes (Andreozzi y col., 2003;
Karthikeyan y Meyer, 2006; Homem y Santos, 2011).
Los contaminantes orgánicos persistentes más habituales son fármacos, herbicidas,
pesticidas y colorantes. Es evidente que los fármacos, herbicidas y pesticidas se han
concebido para que ejerzan una determinada actividad farmacológica o biológica, por lo
que resultan potencialmente peligrosos para el medioambiente al ser capaces de causar
respuestas metabólicas a muy bajas concentraciones.
Pese a que en el medio ambiente existe un gran número de fármacos que se encuentran
en bajas concentraciones entre ng L-1 y µg L-1 (Tamtam y col., 2008; Kümmerer, 2009),
ya se han constado algunos efectos perjudiciales como el desarrollo de cepas bacterianas
multiresistentes (Naviner y col., 2011), cambio de sexo en peces (Yeh y col., 2003) y
efectos en su diferenciación sexual (Devlin y Nagahama, 2002), influencias en los
sistemas endocrinos de peces e invertebrados (Migliore y col., 1997), fallos renales
(Triebskorn y col., 2004) o toxicidad en algas y pequeños vertebrados (Crane y col., 2006;
Pomati y col., 2008). Todos estos efectos pueden ser considerados potencialmente
adversos para la salud de los seres vivos.
Los colorantes orgánicos, de los cuales los colorantes azoicos suponen el 70 % de la
producción mundial (Forgacs y col., 2004), son descargados en grandes concentraciones
en los efluentes industriales. El problema medioambiental más fácilmente identificable
está relacionado con la tinción de las aguas, incluso a muy bajas concentraciones de
colorantes. La coloración del agua no tiene solamente un impacto visual considerable
(ríos de color rojo, verde, amarillo, etc), sino que tienen un efecto directo en los
ecosistemas acuíferos. La coloración del agua reduce al paso de radiación afectando a la
fotosíntesis de plantas y algas, así como a la vida animal. Pero normalmente el problema
de visibilidad no es el peor, ya que los colorantes azoicos son en muchos casos tóxicos,
carcinogénicos y mutagénicos para los seres vivos incluido el ser humano (Umbuzeiro y
col., 2005; Ulson de Souza y col., 2007; Sharma y col., 2007). Los colorantes azoicos

Introducción �
���
además son muy estables en el medio ambiente al ser muy resistentes a la oxidación y
reducción naturales, la biodegradación y la fotodescomposición (Robinson y col., 2001;
Martínez-Huitle y Brillas, 2009).
Todos estos problemas y riesgos medioambientales no son los únicos que suponen una
creciente preocupación. Una degradación incompleta en las plantas de tratamiento puede
en muchos casos generar intermedios todavía más nocivos y recalcitrantes que los
productos iniciales agravando los problemas medioambientales (Oh y Tuovinen, 1991).
Todo lo expuesto anteriormente evidencia la necesidad de desarrollar e implantar técnicas
de tratamientos de aguas mucho más potentes que sean capaces de eliminar
completamente los contaminantes orgánicos persistentes y los intermedios generados
durante su degradación.
1.3. Legislación
Los países de la Unión Europea se rigen por la Directiva del Marco del Agua (DMA) que
es una norma del Parlamento Europeo y del Consejo de la Unión Europea en la que se
establece un marco de actuación común para todos los países miembros de la U.E. en lo
que se refiere a política y legislación sobre aguas. El principal objetivo de la DMA es
promover un uso sostenible del recurso natural hídrico y su protección para garantizar la
disponibilidad de agua de calidad a largo plazo.
En la legislación española se recogen las directrices europeas de la DMA en la directiva
2000/60/CEE estableciendo el marco comunitario para la protección de las aguas
superficiales, costeras, subterráneas y de transición. Hay otras directrices más
relacionadas con la contaminación del agua y su calidad. Así, la directiva 98/83/CEE tiene
como objeto la protección de la salud de las personas estableciendo unos marcos de
salubridad y limpieza del agua para consumo humano; la directiva 91/676/CEE trata sobre
la contaminación producida por nitratos utilizados en la Agricultura; y la directiva
91/271/CEE modificada por la directiva 98/15/CEE relacionada con el tratamiento de las
aguas residuales urbanas, considera su tratamiento y la gestión de vertidos de aguas
residuales de determinados sectores industriales.
Estas leyes establecen unos parámetros límites de demanda bioquímica de oxígeno
(BOD), demanda química de oxígeno (COD), sólidos en suspensión, fósforo y nitrógeno.

Introducción �
���
Desgraciadamente no hacen referencia directa a los contaminantes que contengan, pero
teniendo en cuenta la preocupación que se desprende de los informes anuales del
desarrollo mundial del agua (UNESCO- World Water Development Report) sobre ciertos
contaminantes específicos entre ellos los POPs y de forma destacada sobre aguas
residuales procedentes de las industrias de tinción (colorantes azoicos) y del cuero
(taninos) y de otros contaminantes con efectos directos en los ecosistemas acuáticos
(fenoles, organoclorados aromáticos, fármacos, herbicidas, etc.) no cabe duda de que en
los próximos años la Unión Europea tomará la iniciativa en legislación ambiental sobre
este tipo de contaminantes tan perjudiciales y difíciles de tratar.
1.4. Tratamientos convencionales
Los tratamientos convencionales se clasifican en tres grandes grupos: físicos, químicos y
biológicos.
Los métodos físicos consisten en separar los contaminantes, sin degradarlos, del medio
acuoso bien por precipitación, floculación (Julien y col., 1994), coagulación (Boye y col.,
2003), sedimentación (O’Melia, 1998), adsorción sobre carbón activo (Newcombe y col.,
2002) o filtración por membranas (Ersahin y col., 2012). Si bien son métodos efectivos
para eliminar contaminantes a altas concentraciones, no son especialmente buenos para
los contaminantes orgánicos persistentes ya que éstos presentan bajas concentraciones.
Además, estos métodos conllevan un gran coste energético, generan un residuo sólido
que requiere un tratamiento posterior y, en algunos casos, precisan costosos
mantenimientos como son la recuperación de los adsorbentes (Shende y Mahajani, 2002)
o de las membranas (Ebrahim, 1994; Donose y col., 2013).
Los métodos químicos se basan en tratamientos oxidantes para tratar de eliminar los
contaminantes o modificar su estructura. Se utilizan agentes oxidantes fuertes (ver Tabla
1) como el cloro (Vaid y col., 2010), el permanganato de potasio (Zhang y col., 2009), el
peróxido de hidrógeno (Dionysiou y col. 2004) o el ozono (Freese y col., 1999; Skoumal
y col., 2006). Los problemas que presentan estas metodologías dependen del oxidante
empleado. El uso de cloro o hipoclorito puede generar intermedios organoclorados
(Ivancev-Tumbas y col., 1999) que son carcinogénicos e incluso peores que los
contaminantes de partida. El KMnO4 es mucho más caro que el cloro y genera residuos

Introducción �
��
sólidos de dióxido de manganeso (Zhang y col., 2009). Los problemas del ozono residen
en que es poco soluble en agua, tóxico, inestable y de difícil manejo.
Los métodos biológicos son los más utilizados debido a su bajo coste, sin embargo
presentan serias limitaciones. Los tratamientos requieren mucho tiempo (hasta meses) y
requieren grandes superficies (Chan y col., 2009). Además, desgraciadamente los
compuestos no biodegradables y los tóxicos para los microorganismos no pueden ser
tratados.
1.5. Procesos de oxidación avanzada
Los procesos de oxidación avanzada (AOPs) aparecen como una interesante alternativa a
los métodos anteriores al ser capaces de oxidar completamente los contaminantes
orgánicos a CO2, H2O e iones inorgánicos (Klavarioti y col., 2009). Estos procesos se
basan en la generación in situ del radical hidroxilo (�OH) con un Eº = 2,80 V vs SHE. El �OH es el segundo agente oxidante más fuerte conocido después del flúor (ver Tabla 1)
(Brillas y col., 2009). El ataque no selectivo a los contaminantes orgánicos, su alta
reactividad, la no generación de residuos adicionales y su corto tiempo de vida (menos de
70 ns) hacen del radical �OH el oxidante perfecto.
Dependiendo de la naturaleza de las especies orgánicas en disolución, se describen tres
tipos de ataques del radical hidroxilo con constantes cinéticas de segundo orden en el
rango de 106 a 1010 M−1 s−1 (Brillas y col., 2009):
(I) Abstracción de un átomo de hidrogeno para formar agua mediante la reacción
(1), principalmente con alcanos y alcoholes.
RH + �OH � R� + H2O (1)
(II) Hidroxilación del compuesto orgánico según la reacción global (2), como es
común con alquenos y compuestos aromáticos.
R + �OH � ROH (2)
(III) Reacciones de transferencia de carga (reacción (3)): �OH + H+ + e− � H2O (3)

Introducción �
��
Tabla 1. Potenciales de reducción de agentes oxidantes.
Oxidante Reacción de reducción Potencial estándar de
reducción, Eº/ V vs SHE
Flúor F2(g) + 2H+ + 2e− � 2HF
F2(g) + 2e− � 2 F−
3,05
2,87
Radical hidroxilo �OH + H+ + e− � H2O 2,80
Anión sulfato radical SO4� − + e− � SO4
2− 2,60
Ion ferrato FeO42− + 8H+ + 3e− � Fe3+ +
4H2O
2,20
Ozono O3(g) + 2H+ + 2e− � O2(g) +H2O 2,07
Ion peroxodisulfato S2O82− + 2e− � 2SO4
2− 2,01
Peróxido de
hidrogeno
H2O2 + 2H+ + 2e− � 2H2O 1,76
Ion permanganato
(I)
MnO4− + 4H+ + 3e− � MnO2(s)
+ 2H2O
1,67
Radical
hidroperoxilo (I)
HO2� + 3H+ + 3e− � 2H2O 1,65
Ion permanganato
(II)
MnO4− + 8H+ + 5e− � Mn2+ +
4H2O
1,51
Radical
hidroperoxilo (II)
HO2� + H+ + e− � H2O2 1,44
Ion dicromato Cr2O72− + 14H+ + 6e− �2Cr3+ +
7H2O
1,36
Cloro Cl2(g) + 2e− � 2Cl− 1,36
Dióxido de
manganeso
MnO2 + 4H+ + 2e− �Mn2+ +
2H2O
1,23
Oxígeno O2(g) + 4H+ + 4e− � 2H2O 1,23

Introducción �
���
1.6. Procesos electroquímicos de oxidación avanzada
Los procesos electroquímicos de oxidación avanzada (EAOPs) permiten la generación
continua de �OH mediante métodos electroquímicos (Martínez-Huitle y Brillas, 2009;
Panizza y Cerisola, 2009) y su estudio es el principal objetivo de esta tesis. Las principales
ventajas de estos sistemas residen en que no requiere la adición de productos químicos
peligrosos por lo que eliminan los riesgos de manipulación, transporte y almacenamiento
de los mismos (KMnO4, H2O2, Cl2, etc). No generan residuos que se deban retirar
posteriormente (métodos físicos o MnO2), ni precisan costosos mantenimientos como
membranas de filtración o la recuperación de adsorbentes (Brillas y col., 2009; Feng y
col., 2013). Además, el electrón, el principal reactivo, es barato y limpio siempre y cuando
la corriente eléctrica provenga de una fuente de energía renovable, por lo que
consecuentemente es amigable con el medio ambiente y con un potencial interés
industrial.
1.6.1. Fotoelectrocatálisis con TiO2
La fotocatálisis con TiO2 (PC) se basa en la irradiación de nanopartículas de TiO2
(principalmente en fase anatasa) con radiación UV de suficiente energía para promover
que un electrón de la banda de valencia llena se desplace a la banda de conducción vacía
(ecb−) generando a su vez una vacante o hueco (hvb+) tal y como se recoge en la reacción
(4) (Fujishima y col., 2008; Akpan y Hameed, 2009). Si la fuente de radiación es la luz
solar el proceso se conoce como fotocatálisis solar (SPC).
TiO2 + hν � ecb− + hvb+ (4)
En consecuencia, los compuestos orgánicos pueden reducirse por el electrón generado u
oxidarse por el hueco. Adicionalmente el hueco es capaz de generar �OH con el agua
adsorbida en la superficie o con los iones OH− :
hvb+ + H2O � �OH + H+ (5)
hvb+ + OH− � �OH (6)
Dado que el oxidante es el �OH, este proceso quedaría englobado dentro de los AOPs. El
problema de este procedimiento está relacionado con la perdida de eficiencia debida a la
recombinación de los electrones promocionados con los huecos por la reacción (7) o los

Introducción �
����
radicales hidroxilos generados por la reacción (8) (Andreozzi y col., 1999; Martínez-
Huitle y Brillas, 2009).
ecb− + hvb+ � calor (7)
ecb− +�OH � OH− (8)
Cuando se trabaja con nanopartículas en suspensión se requiere de un costoso post-
tratamiento, bien para eliminar estas nanopartículas de la disolución o para recuperarlas
para su reutilización. Una alternativa que elimina la necesidad del post-tratamiento es
recurrir a la fotocatálisis heterogénea, inmovilizando los fotocatalizadores de TiO2 sobre
una superficie sólida mediante diferentes metodologías. El principal inconveniente de la
fotocatálisis heterogénea está asociado con el problema de la recombinación que se ve
incrementada por la gran pérdida de área específica disponible para la fotorreacción (Shan
y col., 2010).
Es justo en este punto donde aparece la electroquímica. Si se emplea como sustrato del
depósito un material conductor, se puede utilizar el depósito de TiO2 como ánodo. La
aplicación de una densidad de corriente anódica al fotoánodo de TiO2 sometido a
radiación UV permite la extracción de forma contínua de los electrones fotogenerados
mediante un circuito externo (Daghrir y col., 2012). Esto permite inhibir las reacciones
(7) y (8) de recombinación favoreciendo la generación de radical �OH y aumentando así
la ratio de reacciones de oxidación de los compuestos orgánicos favoreciendo la
destrucción de los contaminantes, por lo que se mejora la eficiencia oxidativa del proceso
de fotocatálisis. Si en PC se aplica corriente eléctrica el proceso se denomina fotocatálisis
electroasistida o fotoelectrocatálisis (PEC); y en el caso de utilizar radiación solar natural,
fotoelectrocatálisis solar (SPEC).
1.6.2. Oxidación anódica
La oxidación anódica (AO) es el EAOPs más utilizado y estudiado. Se basa en la
utilización de ánodos de elevado sobrepotencial de evolución de O2. Estos ánodos
favorecen la generación de radicales �OH adsorbidos en la superficie anódica (Marselli y
col., 2003; Panizza y Cerisola, 2009; Sales y col., 2013) como resultado de la oxidación
de agua por la reacción (9):
M + H2O � M(�OH) + H+ + e− (9)

Introducción �
����
donde M es el ánodo y M(�OH) el radical adsorbido sobre la superficie anódica. Los
ánodos más utilizados son de Pt (Sirés y col., 2006; Rocha y col., 2012), PbO2 (Iniesta y
col., 2001; Flox y col., 2009; Aquino y col., 2011), ánodos dimensionalmente estables
(DSA) formados por óxidos metálicos (IrO2, SnO2, Ta2O5, etc) y mezclas de los mismos
óxidos (Martínez-Huitle y col., 2004a; 2004b; Scialdone y col., 2009; Bagastyo y col.,
2013) y capas delgadas de diamante dopado con boro (BDD) (Panniza y col., 2001; Boye
y col., 2006; Borràs y col., 2013).
Cabe destacar que además de la oxidación indirecta debida a la electrogeneración de
radicales �OH en las superficies anódicas, también pueden ocurrir reacciones de
transferencia de carga directa en el ánodo.
El grupo del Prof. Comninellis, principal impulsor del BDD en sus inicios (Panizza y col.,
2001; Bellagamba y col., 2002; Duo y col., 2003), propuso clasificar los materiales
anódicos en dos grandes grupos, activos y no activos, según que eliminaran a los
contaminantes (Comninellis, 1994) de la siguiente manera:
I) Los ánodos activos conducen a la conversión electroquímica, en la que los
compuestos orgánicos recalcitrantes son convertidos en compuestos
biodegradables.
II) Los ánodos no activos dan lugar a la combustión o incineración
electroquímica, en la que los compuestos orgánicos son completamente
mineralizados y convertidos en CO2, agua e iones inorgánicos.
Evidentemente los ánodos pueden describir simultáneamente ambos comportamientos
aun cuando puede predominar uno de los dos. El grupo del Prof. Comninellis (Kapalka y
col., 2008) también ha relacionado el poder oxidante de diferentes ánodos en función de
la entalpía de adsorción del radical �OH, estableciendo que cuanto menor es la adsorción
mayor es la reactividad del radical hidroxilo favoreciendo la mineralización de los
compuestos orgánicos (ver Tabla 2).
Las evidencias experimentales recogidas durante los últimos años señalan al BDD como
el material anódico de mayor interés para el tratamiento de contaminantes orgánicos
persistentes mediante AO (Cañizares y col., 2004; Hammami y col., 2008; Sirés y col.
2008; Brillas y col., 2010), llegando incluso a mineralizar los recalcitrantes ácidos
carboxílicos alifáticos (Cañizares y col., 2003; Martínez-Huitle y col., 2004a; Scialdone
y col., 2008).

Introducción �
����
Tabla 2. Relación del poder oxidante de distintos materiales electródicos en función de
la entalpía de adsorción del radical �OH sobre la superficie anódica y relación de
sobrepotenciales de evolución de oxígeno (Kapalka y col. (2008).
Electrodo Eº / V Sobrepotencial
de evolución
de O2 / V
Entalpia de
adsorción M-
OH
Poder
oxidante
RuO2-TiO2 1,4 – 1,7 0,18 Quimisorción
Fisisorción
Menor
Mayor
IrO2-Ta2O5 1,5 – 1,8 0,25
Ti-Pt 1,7 – 1,9 0,3
Ti-PbO2 1,8 – 2,0 0,5
Ti/SnO2-Sb2O5 1,9 – 2,2 0,7
p-Si/BDD 2,2 – 2,6 1,3
1.6.3. Electro-Fenton
El proceso electro-Fenton (EF) se basa en la reacción de Fenton. En el año 1894 se
describió que el peróxido de hidrogeno en medio ácido y en presencia de un catalizador
metálico (principalmente el catión hierro (II)) genera grandes cantidades de radical
hidroxilo en el seno de la disolución (Fenton, 1894), reacción que se conoce como la
clásica reacción de Fenton (10):
H2O2 + Fe2+ � Fe3+ + OH− + �OH (10)
El proceso Fenton es uno de los AOPs que goza actualmente de gran popularidad y ha
sido profundamente estudiado por diferentes grupos como posible proceso aplicable al
tratamiento de POPs (Rodríguez y col., 2002; Gernjak y col., 2003; Tokumura y col.,
2008).
En la reacción de Fenton el Fe2+ es un reactivo puesto que es someramente regenerado
por la reacción Fenton-like (11) que consume peróxido de hidrogeno generando radical
hidroperoxilo (HO2�) de un poder oxidante considerablemente menor. Además, los
radicales hidroxilo pueden ser simultáneamente consumidos en las reacciones parásitas
(12) y (13) que consumen ambos reactivos.
H2O2 + Fe3+� Fe2+ + HO2�+ H+ (11)

Introducción �
����
H2O2 + �OH � HO2� + H2O (12)
Fe2+ + �OH � Fe3+ + OH− (13)
El pH óptimo para el desarrollo de la reacción de Fenton es cercano a 3,0 (Sun y
Pignatello, 1993; Sirés y Brillas, 2012). A pH inferiores el protón actúa de scavenger del �OH (Pignatello, 1992) disminuyendo su disponibilidad para reacciones orgánicas,
mientras que a pH superiores la precipitación de hidróxidos de hierro decrecen
considerablemente la concentración del Fe2+ de la disolución.
Las ventajas que ofrece el proceso EF residen en la contínua electrogeneración de
peróxido de hidrogeno mediante la reducción catódica bielectrónica de oxígeno en el
cátodo por la reacción (14) y la regeneración de Fe2+ por la reacción (15) de reducción
del Fe3+ (Brillas y col., 2009). El oxígeno se reduce eficientemente a H2O2 en cátodos
carbonáceos como el fieltro de carbón (Özcan y col., 2008; Oturan y col., 2010; El-
Ghenymy y col., 2013b), fieltro de grafito (Panizza y Oturan, 2011), fibra de carbón
activada (Wang y col., 2008a), electrodos de gas de carbón-politetrafluoroetileno (C-
PTFE) (Boye y col., 2003; Flox y col., 2006, Serra y col., 2009; Cavalcanti y col., 2013),
nanotubos de C-PTFE (Khataee y col., 2010; Zarei y col., 2010) o sobre BDD (Cruz-
González y col., 2010).
O2 + 2 H+ + 2 e− � H2O2 (14)
Fe3+ + e− � Fe2+ (15)
En resumen, el proceso de EF electrogenera de forma continua el H2O2 necesario para la
reacción por lo que no se requiere transporte de una sustancia química peligrosa y el Fe2+
actúa como catalizador de la reacción al ser continuamente regenerado y no únicamente
consumido. Ambos efectos benefician notablemente el proceso de mineralización de
compuestos orgánicos al favorecer notablemente la electrogeneración del radical
hidroxilo en el seno de la disolución. El hecho de que el Fe2+ actúe de catalizador en el
proceso EF hace que tan solo se requieran bajas concentraciones de catión cercanas al
límite de 200 µg L−1 establecido por ley (real decreto 140/2003) en las aguas para
consumo humano, por lo que muchas aguas ya contienen el Fe2+ necesario y no es
necesaria su adición para llevar a cabo el tratamiento. Cabe destacar que el H2O2 sobrante
no supone ningún problema adicional al desproporcionarse rápidamente generando agua
y oxígeno mediante la reacción (16).

Introducción �
����
2 H2O2 � 2 H2O + O2 (16)
La principal limitación del proceso EF está relacionada con la generación de los
intermedios finales previos a la mineralización completa, los ácidos carboxílicos de
cadena corta. Los ácidos carboxílicos de bajo peso molecular como los ácidos oxálico,
oxámico o fórmico son recalcitrantes de per se, pero al formar complejos con el Fe(III)
son incluso más recalcitrantes (Pera-Titus y col., 2004; Garcia-Segura y Brillas, 2011).
Adicionalmente, la formación de estos complejos estables de Fe(III) tiene otro efecto
negativo: la captura y disminución del catalizador disponible en disolución, hecho que
frena o incluso inhibe irremediablemente la reacción de Fenton (10). Debido a todo lo
comentado anteriormente, mediante este proceso no se alcanza la mineralización
completa, pese a que la materia orgánica remanente se torna biodegradable.
1.6.4. Fotoelectro-Fenton y fotoelectro-Fenton solar
En el proceso fotoelectro-Fenton (PEF) la solución tratada por EF es simultáneamente
irradiada con luz ultravioleta de onda larga (UVA) de λmáx = 360 nm. La luz UVA tiene
genera radical �OH adicional como resultado de la fotoreducción de las especies de Fe3+
que regeneran simultáneamente el catalizador por la reacción (17) propagando la reacción
de Fenton (10). Si se usa luz UVC de λmáx = 254 nm se produce adicionalmente la
fotodescomposición de H2O2 por la reacción (18).
[Fe(OH)]2+ + hν � Fe2+ + �OH (17)
H2O2 + hν � 2 �OH (18)
Otro efecto relacionado con la irradiación UVA es quizás el más relevante en lo que a la
mineralización se refiere y está relacionado con la eliminación de los complejos de
Fe(III)-carboxilato. Estas especies son en muchos casos fotodescarboxiladas (Guinea y
col., 2009; Garcia-Segura y Brillas, 2011) favoreciendo la completa mineralización y la
liberación del ion Fe3+ complejado, fotorreduciéndolo simultáneamente a ion Fe2+
mediante una reacción de transferencia de carga del ligando al centro metálico (Šima y
Maká�ová, 1997), cuya expresión global se muestra en la reacción (19) (Faust y Zepp,
1993).
[Fe(OOCR)]2+ + hν � Fe2+ + CO2 + R� (19)

Introducción �
����
Pese a que los trabajos realizados por otros grupos y el nuestro han demostrado
sobradamente su eficiencia (Brillas y col., 2003; Wang y col., 2008a; Zarei y col., 2010;
Almeida y col., 2012; Anotai y col., 2011), el problema que plantea el proceso PEF está
relacionado con el alto consumo energético de las lámparas comerciales de UVA. Sin
embargo, es un problema fácilmente solventable mediante el uso de radiación solar. La
luz solar es una fuente inagotable, gratuita y de mayor intensidad de radiación que las
lámparas, por lo que reduce drásticamente el consumo energético y permite plantear un
nuevo proceso más eficiente y amigable con el medio ambiente que se denomina
fotoelectro-Fenton solar (SPEF) (Skoumal y col., 2009; Ruiz y col., 2011; Moreira y col.,
2013).
1.7. Reacciones parásitas del radical �OH
El radical hidroxilo es tan reactivo que no solo se consume en reacciones orgánicas dando
lugar a la mineralización de los contaminantes, sino que también se consume en
reacciones parásitas no oxidantes como las indicadas en las reacciones (10) y (12).
Muchas de estas reacciones involucran diferentes especies reactivas de oxígeno (ROS) en
el medio reaccional, como las reacciones (20) y (21):
2 �OH � H2O2 (20)
�OH + HO2� � O2 + 2 H+ (21)
Las reacciones parásitas también las puede producir el radical M(�OH) adsorbido en las
superficies anódicas, destacando por ejemplo:
2 M(�OH) � 2 M + O2 + 2 H+ + 2 e− (22)
2 M(�OH) � 2 M + H2O2 (23)
H2O2 + M(�OH) � H2O + M(HO2�) (24)
M(�OH) + M(HO2�) � 2 M + O2 + 2 H+ (25)
Pero en un medio altamente oxidante no sólo se favorece la generación de ROS, sino que
debido a las condiciones de trabajo es factible la generación de otras especies menos
oxidantes que el radical �OH a partir de reacciones de transferencia de carga sobre
algunos ánodos, especialmente del BDD (Velazquez-Peña y col., 2013). Estos agentes se
pueden formar a partir de otras especies en disolución como el ion peroxodisulfato a partir
de los iones sulfato por la reacción (26) (Serrano y col., 2002), el ion peroxodifosfato a

Introducción �
����
partir del ion fosfato por la reacción (27) (Sánchez y col. 2013), el ozono a partir de la
propia agua por la reacción (28) o incluso el ion ferrato por la reacción (29) (Cañizares y
col., 2007):
2 SO42− � S2O8
2− + 2e− (26)
2 PO43− � P2O8
4− + 2e− (27)
3 H2O � O3 (g) + 6 H+ + 6 e− (28)
Fe3+ + 4 H2O � FeO42− + 8 H+ + 3 e− (29)
Aunque estas reacciones dan lugar a productos de interés industrial, son consideradas
reacciones parásitas en cuanto a la oxidación de contaminantes porque generan especies
con menor capacidad reactiva que el radical �OH por lo que reducen el poder oxidante
del sistema, pese a que también puedan ser capaces en algunos casos de oxidar algunos
contaminantes de forma eficiente.
1.8. Electroquimioluminiscencia
La quimioluminiscencia (CL) es el fenómeno en que la energía de las reacciones químicas
no sólo se emite en forma de calor o energía química, sino también en forma de luz. La
emisión lumínica se debe a que la reacción química genera una molécula en estado
excitado que durante el proceso de relajación a su estado fundamental produce la emisión
de luz (Dodeigne y col., 2000).
Recientemente, la CL electrogenerada o electroquimioluminiscencia (ECL) ha recibido
un considerable y creciente interés en química analítica debido a su alta sensibilidad,
amplio rango de aplicación y simple operatividad (Knight, 1999; Wang y col., 2008b). El
proceso de ECL se suele explicar por mecanismos similares a los convencionales de CL,
aunque se involucran procesos de oxidación anódica directos junto a reacciones con ROS
electrogeneradas que permiten generar el emisor de radiación lumínica.

Introducción �
���
1.9. Antecedentes bibliográficos
Es indudable el grave problema ambiental que suponen los POPs tal y como se ha puesto
de manifiesto en los anteriores apartados. El principal inconveniente en el tratamiento de
estos contaminantes está relacionado con la escasez de procesos adecuados para su
completa eliminación y que sean asequibles económicamente.
Dentro de este contexto se enmarca el trabajo desarrollado en la presente tesis, cuyo
principal objetivo ha sido el estudio de diferentes procesos electroquímicos de oxidación
avanzada aplicados al tratamiento de aguas sintéticas y aguas reales contaminadas con
POPs tanto en reactor de tanque perfectamente agitado como en una planta pre-piloto de
recirculación de 10 L.
La viabilidad de estas metodologías también se ha estudiado cosiderando contaminantes
emergentes en aguas reales. Los compuestos estudiados durante el desarrollo de esta tesis
se presentan a continuación.
Fármacos
Flumequina
La flumequina (FLU) es un agente antimicrobiano perteneciente a la familia de las
fluoroquinolonas (ver su fórmula estructural en la Fig. 1). Este fármaco es muy utilizado
en veterinaria para el control de infecciones bacterianas principalmente en piscifactorías,
donde se administra en grandes concentraciones debido a la baja biodisponibilidad en
peces (Burridge y col., 2010).
Figura 1.- Estructura molecular de la flumequina.
La FLU ha sido detectada en ríos en concentraciones de hasta 50 ng L-1 (Tamtam y col.,
2008; Muñoz y col., 2010), lo que puede favorecer la aparición de cepas bacterianas
multiresistentes (Naviner y col., 2011).
N
F
O
OH
O

Introducción �
���
Estudios medioambientales demuestran que este contaminante presenta una alta
resistencia a la fotodegradación, requiriéndose más de 121 dias para degradar un 50%
generando otros contaminantes (Pouliquen y col., 2007), además de presentar una
completa inactividad fotoquímica durante los primeros 14 días de exposición a radiación
solar. Asimismo también se ha señalado que posee una alta resistencia a la degradación
por oxidación química con ClO2 (Wang y col., 2010), a diferencia de otras
fluoroquinolonas. En la bibliografía se ha descrito el tratamiento de FLU por diferentes
AOPs como la fotocatálisis con TiO2 o procesos de tipo Fenton. En el caso de la
fotocatálisis con TiO2, se han tratado bajas concentraciones (de 100 μg L-1 a 20 mg L-1)
de FLU (Nieto y col., 2008; Miranda-García y col., 2011) degradándose el 90 % en 40
min, pero no se discute la mineralización del compuesto ni la generación de intermedios
de degradación. En los procesos Fenton y foto-Fenton (Klamerth y col., 2011; Rodrigues-
Silva y col., 2013), se alcanza la completa eliminación de la FLU de partida sin analizar
el proceso de mineralización con profundidad. El trabajo de Rodrigues-Silva y col. (2013)
describe algunos intermedios de degradación y la pérdida del efecto antibacteriano de las
disoluciones tratadas al destruirse la FLU.
Cloranfenicol
El cloranfenicol (CHL) es un antibiótico de amplio espectro, efectivo contra una gran
variedad de bacterias Gram-positivas, Gram-negativas e incluso organismos anaeróbicos.
Es ampliamente utilizado en los países en vías de desarrollo para el tratamiento de
infecciones bacterianas en diferentes formas farmacéuticas. En cambio, en los países
desarrollados esta indicado principalmente para el tratamiento de conjuntivitis en forma
de colirio. Su propiedad antibacteriana característica hace que el tratamiento biológico no
sea aplicable al tratamiento de este contaminante. Debido a todo lo anteriormente
expuesto y a su alta fotoestabilidad en condiciones ambientales,
Figura 2. Estructura molecular del cloranfenicol.
O2NHN
O
Cl
Cl
OH OH

Introducción �
����
este compuesto se detecta como contaminante por todo el mundo en lagos, ríos y efluentes
de estaciones depuradoras (Xu y col., 2011; Zhou y col., 2013).
La imposibilidad de aplicar tratamientos biológicos a efluentes contaminados con CHL y
su efecto directo sobre microorganismos genera un indiscutible impacto ambiental. Cabe
señalar algunas publicaciones donde se ha estudiado la eliminación de este fármaco por
varios métodos descritos anteriormente. La destrucción bajo irradiación UVC y el
tratamiento con aire ionizado de 10 mg L-1 de compuesto redujeron la toxicidad sobre
bacterias aunque con grandes costes asociados (Suling y col., 2002). Los tratamientos
fotocatáliticos con TiO2 y ZnO2 eliminaron el 90% de una concentración inicial de 50 mg
L-1 de CHL en 90 min y destruyeron casi completamente los correspondientes 15 mg L-1
de DOC después de 4 h (Chatzitakis y col., 2008). La ozonización también permitió una
drástica reducción de la toxicidad de varias disoluciones de CHL después de 120 min de
tratamiento, dando lugar a una mineralización parcial (Wang y col., 2012).
Colorantes
Tal y como se describió anteriormente en el apartado sobre los POPs, los colorantes son
unos contaminantes que generan una gran preocupación debido a la alarma social que
produce la contaminación visual de las aguas. Diversas fotografías que denuncian la
contaminación muestran ríos de coloraciones diversas, desde rojo sangre a verde
fosforescente, ya que es más fácil concienciar a la gente sobre aquello que puede ver a
simple vista. El problema de la coloración de cuerpos acuosos va más allá de un problema
estético; la coloración tiene un efecto directo sobre los ecosistemas acuáticos ya que
reduce el paso de radiación afectando a plantas, algas y vida animal.
Además, los colorantes azoicos estudiados en la presente tesis presentan en muchos casos
toxicidad, carcinogénesis y efectos mutagénicos (Umbuzeiro y col., 2005; Sharma y col.,
2007).
Debido a los problemas ambientales que generan y su alto carácter biorefractario que los
hace altamente resistentes a los tratamientos convencionales (Robinson y col., 2001;
Martínez-Huitle y Brillas, 2009) se han aplicado algunos AOPs y EAOPs como posibles
vías de remediación. La fotocatálisis con TiO2 (Essawy y col., 2008; Juang y col., 2010)
ha demostrado ser efectiva para decolorar aguas con contenidos muy bajos de colorantes
(del orden del μM), siendo ineficientes para la mineralización de las mismas.

Introducción �
����
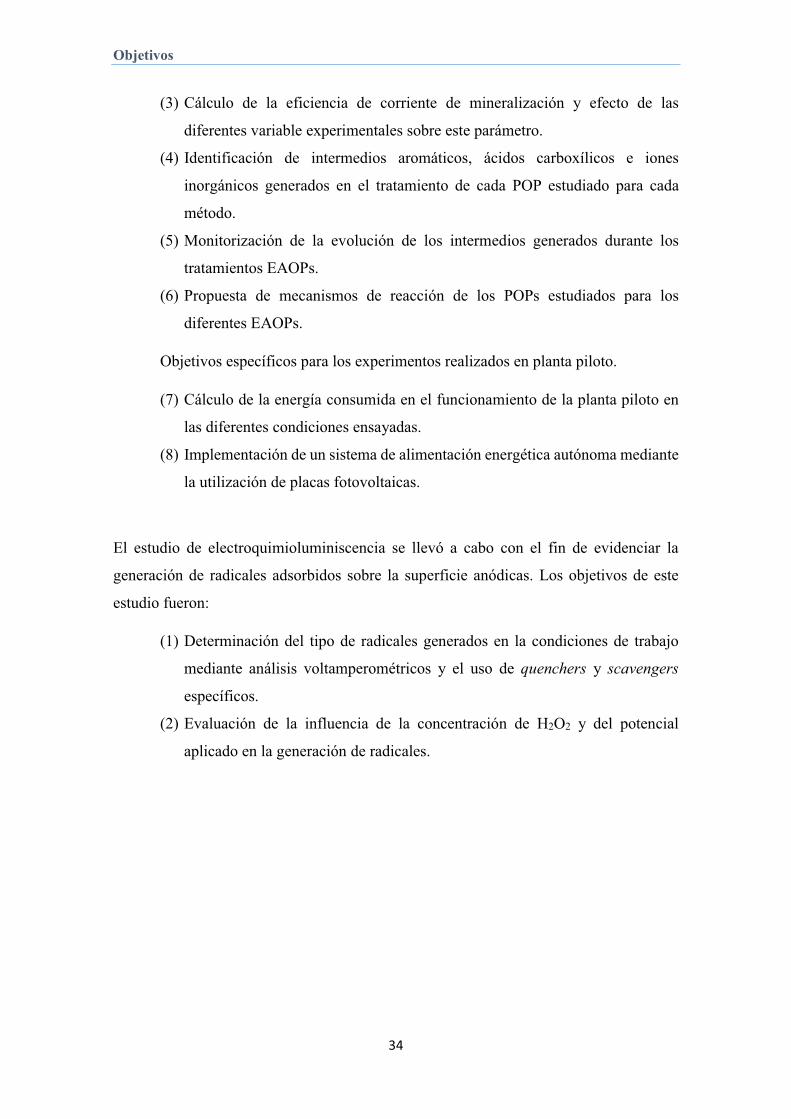
Tabla 3. Colorantes tratados por EAOPs en la presente tesis.
Nombre del
Color Índex
Número del
Color Índex
Estructura λλmáx.
(nm)
Acid Orange 7 15510 484
Acid Red 151 26900 500
Direct Blue 71 34140 584
Direct Yellow 4 24890 400
Los procesos de ozonización (Martins y col., 2006; Turhan y Turgut, 2009) al igual que
los procesos Fenton y foto-Fenton (Elmorsi y col., 2010; Soon y Hameed, 2011) han sido
ampliamente ensayados ya que han demostrado ser tecnologias prometedoras al conducir
a mineralizaciones superiores al 80% con decoloraciones completas en tiempos muy
cortos (20-30 min) para disoluciones con contenidos de mg L-1 de colorante. En los
últimos años, EAOPs como la AO con BDD (Migliorini y col., 2011; Aquino y col., 2012)
y el EF (Özcan y col., 2009; Ruiz y col., 2011) también han demostrado que son capaces
de decolorar totalmente disoluciones de colorantes. Sin embargo, al aplicar el proceso de
NN
OHSO3
- Na+
+Na-O3S
SO3-Na+
N N
N NSO3
-Na+
N
N SO3-Na+
HO
NH2
SO3- Na+N
NN
N
OH
N SO3 Na
Na O3S NN
N
HO
OH

Introducción �
����
EF sólo se precisan tiempos cortos de 20-30 min, mientras que en el caso de la AO los
tiempos son mucho más largos, casi similares a los requeridos para alcanzar la
mineralización completa. Con estas metodologías se han descrito mineralizaciones
prácticamente completas para tiempos de electrólisis < 8 h
En el presente trabajo se han tratado colorantes azoicos de la industria textil y del papel
al considerarse más perjudiciales que los alimentarios, puesto que éstos son compuestos
inocuos tal y como se requiere para su aplicación como aditivo alimentario. Además, los
colorantes utilizados en la industria textil y del papel son utilizados en mayores
cantidades, por lo que son de mayor interés. Los colorantes utilizados se encuentran
resumidos en la Tabla 3.
Productos de oxidación
Los productos que se recogen en este grupo aparecen usualmente como intermedios del
proceso degradativo de algunos o de todos los contaminantes recogidos en los grupos I y
II, por lo que han sido considerados de gran interés para completar los estudios realizados.
Ácidos oxálico y oxámico
Los ácidos oxálico y oxámico (ver estructura en Fig. 3) son contaminantes
biodegradables, pero se ha estudiado su degradación al jugar un papel fundamental en la
eficiencia de los EAOPs. Ambos ácidos son los productos finales de la degradación de
POPs (el ácido oxámico sólo en el caso de compuestos nitrogenados) previo a la
mineralización total a CO2. Dado su alto carácter recalcitrante y el de los complejos que
forman con iones metálicos (Fe2+, Fe3+, Cu2+, etc), influyen directamente en la eficiencia
de los procesos electroquímicos.
O
OHHO
O O
NH2HO
O
Figura 3. Estructuras de los ácidos oxálico y oxámico.
Pese a que la AO del ácido oxálico había sido estudiada previamente evidenciando su
completa mineralización para tiempos superiores a 5 h de tratamiento a densidades de

Introducción �
����
corriente de 30 mA cm-2 (Martinez-Huitle y col., 2004b; Scialdone y col., 2008), la
degradación de sus complejos de hierro y de los procesos fotoquímicos asociados sólo
había sido considerado parcialmente por nuestro grupo (Guinea y col., 2009). En dicho
trabajo se puso de manifiesto el carácter fotoactivo de los complejos de Fe(III)-oxalato y
su alto carácter recalcitrante, motivo por el cual eran difícilmente mineralizados en el
proceso EF. Sin embargo, no se ensayó el efecto del Fe(III) sobre el ácido oxálico en otros
EAOPs ni se consideró la influencia de otro agente complejante del Fe(III) como puede
ser el ácido oxámico durante su eliminación. Cabe señalar que no se ha descrito
previamente la acción del Fe(III) sobre el ácido oxámico.
Ácido ftálico
El ácido ftálico (ver estructura molecular en la Fig. 4) se detecta como intermedio en la
degradación de compuestos con anillos naftalénicos. Además, el ácido ftálico y los
ftalato-derivados son muy utilizados industrialmente como plastificantes en la
manufactura de productos de plástico.
El ácido ftálico es considerado un contaminante prioritario por la United States
Environmental Protection Agency (USEPA) (United States Environmental Protection
Agency 7407, 1994) debido a sus efectos perjudicioales sobre ratas que afectan al sistema
reproductor masculino produciendo atrofia (Oishi y Hiraga, 1980) y al desarrollo de fetos
(Makoto y col., 1997). Estudios medioambientales han constatado su presencia en aguas
(Bauer y Herrman, 1997; Fromme y col., 2002; Zhang y col., 2012).
�
Figura 4. Estructura del ácido ftálico.
El gran riesgo ambiental que genera el acido ftálico y sus derivados ha incentivado el
estudio del tratamiento de este contaminante por diferentes métodos. En el caso de la
OH
O
OH
O

Introducción �
����
fotocatálisis con TiO2 (Taborda y col., 2001) se obtuvieron degradaciones prácticamente
totales del ácido ftálico en una concentración milimolar, aunque se evidenció su
conversión en derivados hidroxilados más perjudiciales, sin mineralizarlo. Los métodos
convencionales de adsorción (Ayranci y Bayram, 2005) y de coagulación (Zheng y col.,
2009) permitieron retirar parcialmente del medio el ácido ftálico generando un residuo
sólido que requiere un post-tratamiento que encarece el proceso. Mediante la
biodegradación aeróbica-anaeróbica (Fang y col., 2009) se encontró que podía eliminarse
2000 mg L-1 de ftalatos en 300 dias de tratamiento. Sin embargo, no se conoce nada sobre
el mecanismo de degradación del ácido ftálico mediante EAOPs.
Tratamiento de aguas reales
Los buenos resultados obtenidos por los métodos de AO en el tratamiento de aguas
contaminadas sintéticas llevan a considerar los EAOPs como tecnologías prometedoras
para la remediación de POPs. El trabajo en aguas sintéticas facilita la aplicación de estos
métodos al eliminar serios problemas que pueden acompañar las matrices de agua real
como son altos contenidos en NOM e iones inorgánicos que pueden afectar la eficiencia
del sistema. Por ejemplo, la presencia de altas concentraciones de cloruro puede favorecer
la generación de productos organoclorados en algunos casos más perjudiciales que el
propio contaminante. El estudio de aguas reales permitirá establecer en qué contextos
podrían aplicarse estas tecnologías. Trabajos previos realizados por diferentes grupos en
efluentes industriales (Aquino y col., 2011; Martínez-Huitle y col., 2012; Sales y col.,
2013) y los trabajos realizados principalmente en el grupo del Advanced Water
Managemente Centre (AWMC) (Radjenovic y col., 2011; Bagastyo y col., 2012, 2013)
sobre tratamiento de efluentes de estaciones depuradoras han demostrado las
posibilidades de estas metodologías, pero un estudio más profundo sobre matrices de
aguas reales resulta necesario antes de decidir sobre la viabilidad y el uso definitivo de
estas técnicas en plantas de tratamiento de aguas residuales. En este contexto, se trabajó
con un efluente secundario contaminado con una mezcla compleja de 29 POPs para
estudiar la posible implantación de la AO como tratamiento terciario. La mezcla de 29
POPs está formada por los herbicidas y plaguicidas recogidos en la Tabla 4 y los
fármacos resumidos en la Tabla 5.

Introducción �
����
Tabla 4. Herbicidas y plaguicidas presentes en la matriz de 29 contaminantes.
Herbicida o plaguicida Estructura
Atrazina
2,4-D
DEET
Diazonina
Diuron
Metalocloro
Triclopir
N
HN
N
N
N
Cl
NH
NH
Cl Cl
O
O
OH
N
O
HN
O
NCl
Cl
N
O
OCl
N
Cl Cl
O
O
OHCl
Introducción �
����
Tabla 5. Fármacos presentes en la matriz de 29 contaminantes.
Fármaco Estructura
Acetaminofén (Paracetamol)
Cafeína
Carbamazepina
Citalopram
Diclofenaco
HO
HN
O
N
N N
N
O
O
N
NH2O
O
F
N
NC
NH
Cl
Cl
OH
O

Introducción �
����
Tabla 5 – Continuación
Fármaco Estructura
Ditriazoato
�
Enrofloxacina
Fenitoína
Gemfibrozil
Hidroclorotiazida
Ibuprofeno
Iopromida
�
N
O
HO
O
F
N
N
HN
NH
O
O
O O
OH
SNH
HNCl
SH2N
OO O O
OH
O
I
I I
HN
O
O
NH
O
OH
OHN
O
OH
HO
I I
NHCOCH3H3COCHN
I
COOH

Introducción �
���
Tabla 5. Continuación
Fármaco Estructura
Lincomicina
Metroprolol
Norfloxacino
Ranitidina
Roxitromicina
Sertralina
�
O
OH
OH
NH
O
N
SCH3
OH
H H
HO
H3CO
O
OH
HN
N
OH
OO
N
HN
F
ON
S
NH
NH
NO2
HN
Cl
Cl
OH
HOOH
O
O
N
O
O OOCH3
O
OCH3
OH
O
N
HO

Introducción �
���
Tabla 5. Continuación
Fármaco Estructura
Sulfadiazina
Tramadol
Trimetoprima
Venlafaxina
H2N S
HN
N
N
OO
N
N
NH2
H2N
O
O
O
O
N
HO H
N
OH
O
H

Introducción �
����
Luminol
El estudio de la ECL no es una aplicación directa de los EAOPs, pero ha permitido
profundizar en una propiedad estrechamente relacionada con ellos que es la
electrogeneración de radicales sobre ánodos de BDD.
El luminol (5-amino-2,3-dihidro-1,4-ftalazinadiona) (ver estructura en la Fig. 5) es el
reactivo más popular empleado en CL. El luminol emite una luz fluorescente azulada
característica con una �máx= 425 nm tras reaccionar químicamente. Por ejemplo, cuando
una disolución de luminol en medio alcalino y en presencia de peróxido de hidrógeno se
pone en contacto con restos de sangre, la emisión de luz característica aparece. De hecho,
durante más de 40 años se ha utilizado esta propiedad en ciencia e ingeniería forenses
para determinar la presencia de sangre en la escena del crimen (Barni y col., 2007).
NH
NH
O
O
NH2
Figura 5. Estructura del luminol.
Este fenómeno se explica porque a pH 8-12 en presencia de un oxidante como el H2O2 y
de un catalizador adecuado como un ion metálico, el luminol se oxida. La reacción de
oxidación se debe a la transferencia de carga entre especies reactivas de oxígeno (ROS).
En este proceso se forma como intermedio el dianión 3-aminoftalato en su estado excitado
que es el causante de la emisión de luminiscencia al relajarse a su estado fundamental. En
este trabajo se ha estudiado la ECL inducida por la electrogeneración de radicales sobre
el ánodo de BDD y por transferencia de carga directa.
Varios autores han reportado diferentes trabajos de ECL con luminol en medio alcalino
con ánodos de Au (Cui y col., 2004; Wang y col., 2008b), Pt (Wróblewska y col., 2005),
materiales carbonáceos (Lin y col., 2008) y óxidos de iridio y estaño (ITO) (Guo y col.,
2010). Estos trabajos habían sido realizados siempre en ausencia de H2O2 y no se había
considerado, hasta el momento, el uso de un ánodo de BDD.

Introducción �
����

����
2. OBJETIVOS

����
�

Objetivos��
����
Los objetivos de la presente tesis se encuentran focalizados en el estudio de la
degradación y eliminación de POPs de origen farmacéutico y de la industria de los
colorantes azoicos mediante la aplicación de EAOPs. La mayor parte de este trabajo fue
realizado en el Laboratori d’Electroquímica de Materials i del Medi Ambient (LEMMA)
de la Universitat de Barcelona (UB) bajo la dirección del Prof. Dr. E. Brillas. Con el fin
de completar la formación adquirida en este campo, se realizó una estancia pre-doctoral
en el Advanced Water Management Centre (AWMC) de la Universidad de Queensland
(UQ) de Australia bajo la supervisión del Prof. Dr. J. Keller y la Dra. J. Radjenovic,
donde se trabajó en el tratamiento mediante AO de un efluente secundario real
contaminado con una mezcla compleja de POPs a concentración real (100 μg L-1).
Los EAOPs ensayados en la presente tesis doctoral incluyen procesos de SPEC con
nuevos fotoánodos de TiO2, AO con ánodos de Pt y de BDD y métodos electroquímicos
basados en la reacción de Fenton (EF; PEF y SPEF). Estas tecnologías emergentes se
están desarrollando actualmente para el tratamiento de aguas contaminadas con POPs
para que sean viables tecnológica, económica e industrialmente.
Adicionalmente se estudió la generación de radicales en ánodos de BDD mediante
reacciones de electroquimioluminiscencia.
El estudio de los EAOPs aplicados se planificó con el fin de cumplir con los siguientes
objetivos:
(1) Degradación de contaminantes orgánicos evaluando su mineralización e
intermedios generados a partir de medidas de carbón orgánico disuelto (DOC)
y cromatografía líquida de alta presión (HPLC), respectivamente. En el caso
de los colorantes también se evaluó el proceso de decoloración a partir del
descenso de la absorbancia UV-Vis en los sistemas:
• Escala de laboratorio: Estudio en celdas de 100 mL por los métodos SPEC,
SPC, AO, EF, PEF y SPEF.
• Planta piloto de 10 L acoplada o no a un fotorreactor solar para escalar los
EAOPS.
(2) Evaluación de la influencia de diferentes variables en los procesos como son
la densidad de corriente aplicada, la concentración de contaminante, la
concentración de catalizador metálico, etc.
Objetivos �
����
(3) Cálculo de la eficiencia de corriente de mineralización y efecto de las
diferentes variable experimentales sobre este parámetro.
(4) Identificación de intermedios aromáticos, ácidos carboxílicos e iones
inorgánicos generados en el tratamiento de cada POP estudiado para cada
método.
(5) Monitorización de la evolución de los intermedios generados durante los
tratamientos EAOPs.
(6) Propuesta de mecanismos de reacción de los POPs estudiados para los
diferentes EAOPs.
Objetivos específicos para los experimentos realizados en planta piloto.
(7) Cálculo de la energía consumida en el funcionamiento de la planta piloto en
las diferentes condiciones ensayadas.
(8) Implementación de un sistema de alimentación energética autónoma mediante
la utilización de placas fotovoltaicas.
El estudio de electroquimioluminiscencia se llevó a cabo con el fin de evidenciar la
generación de radicales adsorbidos sobre la superficie anódicas. Los objetivos de este
estudio fueron:
(1) Determinación del tipo de radicales generados en la condiciones de trabajo
mediante análisis voltamperométricos y el uso de quenchers y scavengers
específicos.
(2) Evaluación de la influencia de la concentración de H2O2 y del potencial
aplicado en la generación de radicales.
�

�
����
3. EXPERIMENTAL

�
����
�

Experimental �
���
3.1. Reactivos
Las disoluciones de trabajo contenían Na2SO4 como electrolito soporte y en el caso de
los procesos basados en la reacción de Fenton se añadía FeSO4·H2O2, siendo ambos
productos suministrados por las casas Fluka y Sigma-Aldrich, respectivamente. La Tabla
6 recoge las características de los principales productos estudiados en la presente tesis.
Los ácidos carboxílicos de grado analítico utilizados como patrones para la identificación
y cuantificación en cromatografía HPLC de exclusión iónica se adquirieron en las casas
Avocado, Fluka y Panreac. Las casas Acros y Panreac proveyeron los ácidos y bases
utilizados de grado reactivo y de grado analítico. El H2O2 (33% w/v) de la casa Panreac
se utilizó para realizar las rectas de calibrado para determinar el H2O2 electrogenerado y
en los ensayos de electroquimioluminiscencia. Los disolventes orgánicos y demás
reactivos de grado HPLC y para uso en cromatografía de líquidos acoplada a
espectrometría de masas (LC-MS) para la preparación de fases móviles fueron
suministrados por las casas Panreac, Merck y Teknochroma. Las disoluciones de trabajo
sintéticas en celda pequeña así como las fases móviles de HPLC y LC-MS se prepararon
con agua Millipore Milli-Q, con una resistividad > 18 M� cm a 25ºC. En los ensayos
realizados con agua real las muestras de agua se obtuvieron de la planta municipal de
tratamiento de aguas residuales de Manresa (Barcelona) y en Australia de la planta de
tratamiento de Brisbane (Queensland). Las disoluciones tratadas en la planta piloto se
prepararon con agua desionizada con un contenido de DOC inferior a 0,3 mg L-1.

Experimental �
���
Tabla 6. Características de los principales compuestos estudiados en la presente tesis.
Compuesto Estructura Proveedor Pureza
Amarillo Directo 4 Sigma-Aldrich Grado
analítico
Azul Directo 71 Acros Organics Grado
analítico
Cloranfenicol Sigma-Aldrich 98 %
Flumequina Laboratorios
SYVA S.A.V.
99 %
Luminol Applichem Grado
HPLC
Naranja Acido 7 Acros Organics Grado
analítico
Rojo Ácido 151 TCI Europe Grado
analítico
NN
OHSO3
- Na+
+Na-O3S
SO3-Na+
N N
N NSO3
-Na+
N
N SO3-Na+
HO
NH2
SO3- Na+N
NN
N
OH
N SO3 Na
Na O3S NN
N
HO
OH
O2NHN
O
Cl
Cl
OH OH
N
F
O
OH
O
NH
NH
O
O
NH2

Experimental �
����
3.2. Reactor de tanque agitado
En los tratamientos a escala laboratorio de AO, EF, PEF, SPEF y con fotoánodos de TiO2
se utilizó una celda cilíndrica monocompartimental de vidrio de 150 mL con doble camisa
para termostatizar la disolución, mientras que las experiencias de EQL se realizaron en
una celda de paredes planas.
La intensidad constante a los electrodos se suministró con un potenciostato-galvanostato
Amel modelo 2053. Normalmente se determinó el voltaje de la celda cuando se trabajó
galvanostaticamente y, en algunos casos la intensidad al operar potenciostaticamente,
usando un multímetro Demestres DM 605. Las disoluciones de trabajo se mantuvieron
termostatizadas a 35 ºC y agitadas vigorosamente a 700 rpm mediante un agitador
magnético. En los experimentos de PEF las disoluciones se irradiaron simultáneamente
con luz UVA utilizando para ello un fluorescente Philips de 6 W (λ= 300 – 420 nm, λmáx=
360 nm) colocado a 7 cm sobre la disolución. Para los experimentos de SPEF la
disolución de trabajo se irradió directamente con luz solar natural.
3.2.1 Electrodos
Los electrodos empleados en los experimentos aparecen recogidos en la Tabla 7. Dadas
las características especiales del electrodo de diamante dopado con boro (BDD), del
fotoánodo de TiO2 y del electrodo de difusión de aire (ADE), se explica su preparación
más detalladamente a continuación.
La síntesis del BDD se efectúa mediante la técnica de deposición química de vapor en la
variante de filamento caliente (HFCVD) sobre obleas de silicio monocristalino puro tipo-
p cortado en el plano de índices de Miller (100) como sustrato conductor que presentan
una resistividad de 0.1 � cm. Mediante esta técnica se obtienen depósitos delgados de
BDD de 1 µm de espesor y diferentes contenidos del dopante boro que hace al diamante
conductor. Los electrodos de BDD utilizados en este trabajo contienen un dopaje de 1300
ppm de boro.

Experimental �
����
Tabla 7. Electrodos utilizados en escala laboratorio.
Electrodos Proveedor, morfología y área
electroactiva
Ánodo Diamante dopado con boro Adamant Technologies, placa 3 cm2 y 0,5
cm2
Fotoánodo de TiO2 CPT, Placa 5 cm2
Platino SEMPSA, placa 3 cm2 99,99 % pureza
Cátodo Acero Inoxidable AISI 304 Placa 3 cm2
Electrodo de difusión de
aire
E-TEK, carbón-PTFE tela de 3 cm-2
Grafito Sofacel, barra 3 cm2
Platino SEMPSA, placa 3 cm2 99,99 % pureza
Referencia Ag�AgCl, KCl (sat.) Metrohm
Los fotoánodos de TiO2 se obtuvieron por proyección térmica de plasma atmosférico
(APS) sobre un sustrato conductor de acero inoxidable 316L en el Centro de Proyección
Térmica (CPT). El recubrimiento se obtuvo utilizando micropolvo de TiO2 que se
calienta, mezcla y homogeniza durante el tiempo de residencia en la zona del jet de
plasma donde las partículas funden parcialmente (Gardon y col., 2013). Las partículas
fundidas en el plasma son aceleradas hacia el sustrato del recubrimiento sobre el que
quedan adheridas capa por capa (Dosta y col., 2008).
El ADE consiste en un tubo de PVC hueco y cerrado con una entrada de aire tal y como
se muestra en la Fig. 6. Se bombea aire al interior del cátodo para que pase a través de la
tela de C-PTFE en la parte inferior del sistema, la cuál es la parte electroactiva del
electrodo. La tela está en contacto con una malla de níquel que actúa de colector de
corriente y distribuidor eléctrico, además de mejorar la resistencia mecánica del sistema.
La malla de níquel está en contacto con un hilo de Ni-Cr cuya función es de conector o
contacto eléctrico. Cabe destacar que la tela es permeable y con el fin de evitar una
indeseada percolación del cátodo conviene que la presión que ejerce el aire sea
ligeramente superior a la del líquido, sin generar burbujas que aíslen la tela del contacto
con el líquido.

Experimental �
����
Figura 6. Esquema del electrodo de difusión de aire (ADE): (1) Tela de carbón-
politetrafluoroetileno, (2) tubos de vidrio para la entrada y salida de aire, (3) soporte de
PVC, (4) malla de níquel y (5) conector de Ni-Cr.
3.3. Escala pre-piloto
3.3.1. Planta pre-piloto de 10 L utilizada en tratamientos basados en la
reacción de Fenton
En la Fig. 7 se muestra una foto de la planta piloto de 10 L utilizada en los tratamientos
de EF y SPEF. El agua contaminada tratada recirculaba en el sistema mediante una bomba
de membranas hasta el final del tratamiento. La temperatura se mantuvo constante a 35
ºC utilizando dos intercambiadores de calor y el flujo se controló mediante un rotámetro.
Se aplicaron densidades de corriente constantes durante el trabajo galvanostático con una
fuente de alimentación Grelco GDL3020.
��
��
����
��
��
��

Experimental �
����
Figura 7. Planta pre-piloto de tratamiento electroquímico de aguas de 10 L: (1) Bomba
de aire, (2) fuente de alimentación, (3) celda electroquímica tipo filtro prensa, (4)
fotorreactor tipo colector parabólico compuesto (CPC), (5) termostato, (6)
intercambiadores de calor, (7) bomba de membranas, (8) rotámetro y (9) depósito.
Se utilizó una celda electroquímica tipo filtro prensa de un compartimento. El esquema
de la celda se muestra en la Fig. 8, donde aparecen los diferentes componentes de
dimensiones 12 cm x 18 cm separados entre ellos por vitón. El vitón favorece el sellado
entre los componentes evitando así fugas en la celda. En todos los trabajos realizados el
ánodo fue una placa de platino de 99,99 % de pureza y como cátodo un ADE de C-PTFE
con una separación entre electrodos de 1,2 cm. Ambos electrodos utilizados son de 100
cm2 de area geométrica y 90,25 cm2 de área electroactiva, puesto que la celda que tiene
una ventana central de 9,5 cm x 9,5 cm. La cara interior del cátodo es presionada contra
una malla de Ni que actúa de colector y refuerzo mecánico (como en el caso del ADE de
escala laboratorio), con una cámara de gas interna de PVC donde circula aire a un flujo
de 4,5 L min−1 regulado con una válvula de salida.
��
��
��
��
���
���
��

Experimental �
����
Figura 8. Esquema de la celda electroquímica tipo filtro prensa: (1) Circulación del
líquido en la celda, (2) circulación de aire en la cámara de gas del electrodo de difusión
de gas (ADE), (3) ánodo, (4) cátodo de C-PTFE sobre malla de Ni y (5) junta de vitón.
El fotorreactor consiste en un CPC con un área de 0,4 m2. Está compuesto por 12 tubos
de borosilicato de 50,5 cm de largo x 1,82 cm de diámetro interno (1,57 L de volumen
irradiado) ensamblados sobre una superficie de aluminio inclinada 41º para recoger mejor
la radiación en nuestro laboratorio (latitud 41º 21’ N, longitud 2º 10’ E), tal y como se
muestra en la Fig. 7. Los tubos están dispuestos sobre unos espejos cóncavos cuya función
es concentrar la radiación dispersa en el centro del tubo por lo que el CPC tiene un factor
de concentración 1.
La utilización de un panel fotovoltaico (Fig. 9) permite la generación de la energía
suficiente para que la planta trabaje de forma autónoma y eficiente reduciendo el coste
energético a cero (Valero y col., 2008).
��
����
��
����
���� ��
��

Experimental �
����
Figura 9. Planta pre-piloto autosuficiente en funcionamiento gracias a la aplicación
directa de energía solar fotovoltaica.
3.3.2. Planta pre-piloto de 10 L utilizada en tratamientos basados en
oxidación anódica
La planta pre-piloto que se utilizó en el AWMC de Australia en el estudio de viabilidad
del proceso de AO para el tratamiento de una matriz compleja de contaminantes en un
efluente secundario real consistió en un sistema similar al presentado en el apartado
anterior. A diferencia de la celda filtro prensa descrita en el apartado anterior, en el
AWMC se utilizó una celda de dos compartimentos (Fig. 10) para aislar el agua tratada
en el compartimento anódico de procesos de reducción indeseados en el cátodo.
Consecuentemente se utilizaron dos depósitos de 10 L, uno para el agua contaminada
tratada o anolito y el otro para el catolito. Los diferentes componentes de policarbonato
de la celda se mantenían sellados entre ellos por juntas de goma y los dos componentes
centrales correspondientes al volumen de anolito o catolito presentaban dimensiones
internas de 20 cm x 5 cm x 1,2 cm y estaban separados entre ellos por la membrana de
intercambio catiónico Ultrex CMI-7000. Durante todo el estudio realizado se utilizó un
ánodo de BDD y como cátodo una placa de acero inoxidable con un área de 40,8 cm2.

Experimental �
����
Figura 10. Celda filtro-prensa dividida.
3.4 Procedimientos analíticos
3.4.1. Análisis voltamperométricos
Se realizaron voltamperometrías de barrido lineal y cíclicas con una celda cilíndrica
estándar de tres electrodos utilizando un potenciostato-galvanostato Ecochemie Autolab
PGSTAT100, controlado mediante el software Autolab Nova 1.5. El electrodo de trabajo
era un electrodo de BDD de 0,50 cm2, el contraelectrodo un alambre de Pt y el electrodo
de referencia un electrodo de Ag|AgCl, KCl (sat.) (E° = 0,197 V vs Electrodo Normal de
Hidrógeno (SHE)). Todos los voltamperogramas se registraron a velocidades de barrido
de 5 a 100 mV s−1, a temperatura ambiente (25 ºC) y con la disolución en reposo, aunque
algunas veces bajo agitación constante con un núcleo magnético a 700 rpm. Los
voltamperogramas se registraron bajo atmosfera de argón tras previo burbujeo de la
disolución con este gas durante 30 min.
3.4.2. Carbono orgánico total
La técnica de análisis del carbono orgánico total (TOC) o carbono orgánico en disolución
(DOC) se basa en la conversión completa de los átomos de carbono de una disolución a
CO2 cuya concentración es posteriormente determinada por infrarrojos. Estos análisis se
realizaron utilizando un equipo TOC-VCSN de Shimadzu. Este equipo inyecta un
pequeño volumen de disolución en un horno a 680 ºC, donde en presencia de un

Experimental �
����
catalizador de Pt soportado sobre esferas de alúmina el agua se vaporiza y todo el carbono
contenido en la disolución se incinera a CO2. El CO2 generado se analiza en un detector
de infrarrojos no dispersivo (NDIR) que proporciona una señal directamente proporcional
a la concentración de carbono en disolución o el carbono total (TC).
El TC corresponde a la suma del carbono orgánico e inorgánico en disolución. Con el fin
de discernir la correspondiente concentración orgánica se pueden realizar dos tipos de
análisis:
1) El primero consiste en analizar el carbono inorgánico (IC). Para ello, la muestra
es acidificada con ácido clorhídrico para que el carbono inorgánico (en forma de
carbonatos) se descomponga en CO2 y se dirige directamente al analizador NDIR
sin pasar por el horno. Consecuentemente, el TOC corresponde a la diferencia
entre el TC y el IC.
2) El segundo consiste en acidificar las muestras y gasificar para purgar el CO2
generado a partir del carbono inorgánico. Posteriormente, la disolución remanente
se incinera en el horno y analiza dando directamente la medida del Carbono
Orgánico no Purgable (NPOC). Esta medida puede llevar asociada algunos errores
por la pérdida de compuestos orgánicos volátiles.
Cabe señalar que en el sistema electro-Fenton el contínuo burbujeo de aire y el
desprendimiento de O2 en el ánodo, sumado al pH ácido de la disolución, favorece la
constante eliminación del carbono inorgánico de la disolución dando como resultado
medidas prácticamente idénticas de TC y de TOC (o DOC).
3.4.3. Nitrógeno total
La medida del nitrógeno total permite evaluar la concentración total de nitrógeno
orgánico e inorgánico (TN) en disolución. La medida se realizó con el módulo TNM-1
acoplado al analizador TOC-VCSN descrito en el apartado anterior. El análisis se basa en
la combustión de todas las especies de nitrógeno a monóxido de nitrógeno que tiene lugar
en el mismo tubo de combustión con el mismo catalizador que el TOC. El NO generado
es posteriormente analizado en el módulo TNM-1 mediante un método basado en
quimioluminiscencia que permite la cuantificación de nitrógeno en un rango muy amplio

Experimental �
���
de 0,1 a 4000 mg L−1. Sin embargo, este procedimiento no es útil para muchos colorantes
que dan una conversión parcial de su N inicial en monóxido de nitrógeno.
3.4.4. Análisis de haluros orgánicos adsorbibles
La concentración de compuestos orgánicos halogenados se determinó mediante el método
estándar de determinación de haluros orgánicos adsorbibles (AOX) basado en la
adsorción de compuestos halogenados en carbón activo. Previamente al análisis, la
muestra se ajustó a pH 2,0 utilizando ácido nítrico al 70 %. Luego se pasó a través de
cartuchos de carbón activo utilizando el módulo de adsorción Mitsubishi TX-3AA. El
carbón activo con los compuestos adsorbidos es después incinerado en presencia de
oxígeno a 1000 ºC en un Horno Rápido Automático Mitsubishi AQF-2100H. En este
proceso se generan gases de halógenos que son absorbidos en agua Milli-Q con un 0,003
% de H2O2 y finalmente son analizados por cromatografía iónica en un HPLC iónico
Dionex ICS-2100 para cuantificar las concentraciones de cloruro, bromuro e ioduro que
están relacionadas con la concentración de organoclorados en el medio.
3.4.5. Decoloración
El proceso de decoloración de las disoluciones tratadas de colorantes se monitorizó
siguiendo el decaimiento de la absorbancia (A) a la longitud de onda máxima
característica de cada colorante (Martínez-Huitle y Brillas, 2009; Garcia-Segura y col.,
2011) con el tiempo. El porcentaje de eliminación de color (% CR) fue determinado
mediante la ecuación (30):�
% CR = × 100 (30)
donde A0 y A son la absorbancia al tiempo inicial y al tiempo t, respectivamente. La
obtención de las medidas de absorbancia y el registro de los espectros se llevó a cabo con
un espectrofotómetro Shimadzu 1800 UV-vis de doble haz termostatizado a 35 ºC.
A0-A A0

Experimental �
���
3.4.6. Cuantificación de la demanda química de oxígeno
La COD es un parámetro que permite evaluar el oxígeno (en mg O2 L−1) requerido para
oxidar todos los compuestos oxidables presentes en medio acuoso, tanto orgánicos como
inorgánicos, mediante agentes fuertemente oxidantes en medio ácido.
Para realizar estos análisis se utilizó un kit comercial de determinación de COD
Spectroquant® de Merck Millipore, que consiste en una mezcla oxidante preparada en
medio ácido compuesta por dicromato de potasio como agente oxidante, sulfato de
mercurio (II) como catalizador de la oxidación y sulfato de plata como inhibidor de las
interferencias producidas por la oxidación de halógenos. Tras añadir el volumen de
muestra a la mezcla, esta es introducida en un digestor a 150 ºC durante 2 h para favorecer
y asegurar la máxima oxidación. Tras la digestión de la muestra, se enfrió a temperatura
ambiente y se analizó el valor de la COD a partir de la absorbancia de la mezcla que
proporciona el valor de la concentración de oxígeno requerida.
3.4.7. Cuantificación de ClO−−
El hipoclorito se determinó mediante el método colorimétrico con N,N-dietil-p-
fenilendiamina (DPD), un método ampliamente utilizado en Plantas Potabilizadoras
(Radjenovic y col., 2011). Para los análisis se utiliza una mezcla comercial que contiene
DPD. Esta sal es la que reacciona con el ClO− del medio acuoso, formando un complejo
de color rosado a fucsia y consecuentemente dando una señal colorimétrica característica.
El resto de componentes de la mezcla, tienen la función de crear un medio favorable para
la reacción. La medida directa de la absorbancia permite determinar la concentración de
cloro libre expresada como mg L−1 de Cl2.
3.4.8. Cuantificación de H2O2
La cuantificación de H2O2 se realizó por el método colorimétrico basado en la medición
de la absorbancia del complejo peroxo-titanato de color amarillento-anaranjado con una
λmáx=408 nm (Welcher, 1975). La ecuación (31) describe la formación del complejo de
titanato a partir de una disolución de Ti4+.
Ti4+ + H2O2 + 2 SO42− � [TiO2(SO4)]2− + 2H+ (31)

Experimental �
����
3.4.9. Técnicas cromatográficas
La cromatografía es un método analítico que permite la separación e identificación de
substancias de una mezcla compleja. La técnica se basa en el desplazamiento de la
muestra con una fase móvil (gas, líquido o fluido supercrítico) a través de una fase
estacionaria con la que es inmiscible fijada en una superficie sólida (columna). La
selección de ambas fases se realiza de forma que los diferentes componentes de la muestra
se distribuyan de forma diferente entre las dos fases en función de su afinidad debida a
diferentes propiedades (polaridad, tamaño molecular, etc). Los compuestos que son
retenidos por la fase estacionaria se desplazan más lentamente con la fase móvil,
contrariamente a los que tienen poca afinidad con la fase estacionaria que se desplazan
con rapidez. La distinta movilidad de los componentes de la mezcla compuesta permite
por lo tanto su separación y análisis cualitativo y/o cuantitativo.
3.4.9.1. Cromatografía de líquidos
En la cromatografía líquida de alta presión (HPLC) la fase móvil que se utiliza es líquida.
En la Tabla 8 se recogen los diferentes tipos de columna y fase móvil utilizados en los
análisis de los compuestos principales, sus intermedios aromáticos y otros intermedios
comunes como son los ácidos carboxílicos o los iones inorgánicos generados durante los
tratamientos. En el caso de los ácidos carboxílicos se utilizó la técnica de HPLC de
exclusión iónica, en el de los iones inorgánicos HPLC de intercambio iónico y en el de
los compuestos aromáticos HPLC de fase inversa. Los análisis de compuestos aromáticos
y ácidos carboxílicos se realizaron en un cromatografo HPLC Waters 600 LC acoplado a
un detector de arreglo de fotodiodos Waters 996. El equipo utilizado para la
cuantificación de iones inorgánicos fue un HPLC Shimadzu CDD 10 Avp acoplado a un
detector de conductividad Shimadzu CDD 10 Avp.

Experimental �
����
Tabla 8. Columnas y fases móviles utilizadas en la determinación de los compuestos.
Compuesto Columna Fase Móvil Ácidos carboxílicos Bio-Rad Aminex HPC
87H 300 mm x 7,8 mm
4 mM H2SO4
0,6 mL min−1, 35 ºC
Cationes (NH4+) Shodex IC YK-421
125 mm X 4,6 mm 5,0 mM ácido tartárico, 1,0 mM ácido dipicolinico, 24,2 mM ácido bórico y 1,5 mM éter corona 1,0 mL min−1, 40 ºC
Aniones (Cl−, NO3−, SO4
2−, etc) Shim-Pack IC-A1S 100 mm x 4,6 mm
2,4 mM tris(hidroximetil)aminometano y 2,5 mM ácido ftálico Tampón de fosfatos pH=3,5 1,5 mL min−1, 40 ºC
Flumequina Thermo Hypersil BDS C18 5µm 250 mm x 4,6 mm
40:60 (v/v) acetonitrilo:agua Tampón de fosfatos pH=3,5 0,6 mL min−1, 35 ºC
Cloranfenicol Spherisorb ODS2 5µm 150 mm x 4,6 mm
20:80 (v/v) acetonitrilo:agua Tampón de fosfatos pH=3,5 0,4 mL min−1, 35 ºC
Naranja Acido 7 Spherisorb ODS2 5µm 150 mm x 4,6 mm
30:70 (v/v) acetonitrilo:agua 2,4 mM n-butilamina Tampón de fosfatos pH=3,5 0,6 mL min−1, 35 ºC
Rojo Ácido 151 Spherisorb ODS2 5µm 150 mm x 4,6 mm
30:70 (v/v) acetonitrilo:agua 2,4 mM n-butilamina Tampón de fosfatos pH=3,5 0,6 mL min−1, 35 ºC
Azul Directo 71 Spherisorb ODS2 5µm 150 mm x 4,6 mm
50:50 (v/v) acetonitrilo:agua 2,4 mM n-butilamina Tampón de fosfatos pH=3,5 0,6 mL min−1, 35 ºC
Amarillo Directo 4 Spherisorb ODS2 5µm 150 mm x 4,6 mm
50:50 (v/v) acetonitrilo:agua 2,4 mM n-butilamina Tampón de fosfatos pH=3,5 0,3 mL min−1, 35 ºC

Experimental �
����
3.4.9.2. Cromatografía de líquidos acoplada a espectrometría de masas
La cromatografía de líquidos acoplada a espectrometría de masas (LC-MS) tiene
esencialmente el mismo funcionamiento que la de HPLC con la diferencia de que, tras la
separación en la columna (y/o el paso tras un detector), fase móvil y compuestos
separados son nebulizados e ionizados. El proceso de ionización se produce mediante una
corriente eléctrica, generando un compuesto cargado positiva o negativamente (ganancia
o pérdida de un H+). Posteriormente el compuesto pasa a través de un cuadrupolo hasta
el detector donde se determina la masa exacta del compuesto. No todos los compuestos
son susceptibles de ser detectados por esta técnica, sólo podremos identificar aquellos
susceptibles a sufrir procesos de ionización por lo que compuestos quinónicos o
compuestos con grupos funcionales no ionizables serán completamente indetectables por
MS, pese que el cromatograma de líquidos muestre el pico correspondiente.
El equipo de LC-MS permite discriminar los valores exactos de la masa molecular. La
Fig. 11 muestra, por ejemplo, el cromatograma del cloranfenicol (Garcia-Segura y col.,
2014). Como se puede observar en la estructura se trata de un compuesto diclorado. El
cloro tiene una particularidad bien conocida y está relacionada con su distribución
isotópica 3:1 de los isótopos 35 y 37. La técnica de LC-MS permite identificar los picos
correspondientes a los compuestos de cloranfenicol con 2 35Cl, 2 37Cl y un Cl de cada
isótopo mostrando intensidades de pico correspondientes a la distribución isotópica del
Cl; por lo que podemos aseverar que no solo identificamos el compuesto sino que somos
capaces de discernir las diferencias de masa de dos unidades debidas a los isótopos de Cl.
Para la realización de los análisis de LC-MS se utilizó un cromatógrafo Shimadzu SIL-
20AC LC equipado con una columna Teknockroma Mediterranean Sea C-18 3 µm (15
mm x 0,46 mm) a 30 ºC y acoplado a un espectrómetro de masas Shimadzu LCMS-2020
MS. El equipo de MS operó en modo negativo y positivo utilizando una fuente de
ionización de electroespray (ESI) aplicando un voltaje interfacial de -4,5 y 4,5 kV,
respectivamente, además de un voltaje de 60 V en el Q-array RF. La temperatura del tubo
DL era de 250 ºC y se usó N2 puro como gas de nebulización y de secado. Los valores de
m/z se recogieron en rangos mediante el modo de análisis de la corriente total de iones
(TIC) o seleccionando valores concretos de iones (SIM).

Experimental �
����
Figura 11. Cromatograma de LC-MS del cloranfenicol y espectro de masas
correspondiente al tiempo de retención del compuesto.
3.4.9.3. Cromatografía de líquidos acoplada a espectrometría de masas/masas
La cromatografía de LC-MS/MS a diferencia del análisis de LC-MS permite la posterior
fragmentación de los compuestos inicialmente ionizados aumentando así la sensibilidad
de la medida, facilitando la identificación de compuestos y la discriminación de picos
solapados.
La utilización de esta técnica permitió la cuantificación de concentraciones del orden de
μg L-1 en una matriz compleja de 29 contaminantes orgánicos persistentes. Con el fin de
realizar estos análisis, las muestras fueron preconcentradas tras ajustarlas a pH 7,0
mediante su extracción con cartuchos Oasis HLB (200 mg, 6 mL) de Waters previamente
acondicionados con 10 mL de metanol y 10 mL de agua milliQ. Los análisis de estas
muestras se llevaron a cabo utilizando un cromatógrafo de líquidos ultra-rápido (UFLC)
acoplado a un espectrómetro de masas 4000 QTRAP de triple cuadrupolo lineal híbrido
con trampa de iones (qQlit-MS) equipado con un electroespray ionizador. Se utilizó una
columna Alltima C18 5µm (250 mm x 4,6 mm) para las separaciones cromatográficas
termostatizada a 40 ºC.
0,0 2,5 5,0 7,5 10,0 12,5 15,0 min
0
5000000
10000000
150000001:325,00(1000,00)1:323,00(1000,00)1:321,00(1000,00)2:TIC1:TIC
317,5 320,0 322,5 325,0 327,5 330,0 332,5 m/z0,0
1,0
2,0Inten.(x10,000)
321323
325 332327 329317 319
O2NHN
O
Cl
Cl
OH OH
C11H12N2O5
Cl2
M = 322 g/ mol
2 35
Cl – 56,25%35
Cl e 37
Cl – 37,5%

Experimental �
����
3.4.10. Medidas de electroquimioluminiscencia
La intensidad relativa de ECL emitida en la superficie del ánodo de BDD se determinó
con un sensor lumínico de 1 cm2 de la casa Thorlabs, modelo S120A, acoplado al equipo
Thorlabs S110 Optical Power Meter Console System. Con el fin de poder determinar la
radiación emitida, la cara electroactiva del ánodo de BDD se situó de forma paralela a la
pared plana de la celda a una distancia de 0,5 cm y el sensor se colocó en la pared externa
frente el centro del electrodo de BDD. El cátodo de Pt se dispuso tras el ánodo de BDD a
una distancia de unos 2 cm. La posición de ambos electrodos y del sensor se mantuvo
invariable durante todos los ensayos comparativos
3.4.11. Caracterización de los ánodos de TiO2 sintetizados
Las imágenes del recubrimiento y del corte transversal del electrodo se obtuvieron
utilizando un microscopio de barrido electrónico (SEM) Jeol 5510 acoplado a un
analizador de espectrometría dispersión de energía de rayos X (EDS) Röntec para analizar
las fases.
Se realizó también un análisis de fases más exacto mediante difractometría de rayos X
(XRD) utilizando un difractómetro Siemens D-500 tipo Bragg-Brentano θ/2θ aplicando
una radiación de Cu Kα1+2 (λ(α1)=0,154060 nm y λ(α2)= 0,154443 nm) a 40 kV y 30 mA
de corriente. La ratio entre las fases cristalinas determinadas se calculó a partir de su ratio
de intensidad de referencia (RIR) mediante el método de Chung (Chung, 1974) utilizando
el software X’pert Highscore Plus.
La porosidad se calculó con el software analizador de imágenes Matrox Inspector. La
microrugosidad se determinó con un equipo analizador de superficies Mitutoyo Surftest
301 y la adhesión según la normativa ASTM C633 estándar con un sistema Servosis
modelo MCH-102ME. Las mediciones de la microdureza seccional se realizaron
mediante el ensayo Vickers de microdureza con una carga de 300 g según la norma
estándar UNE 7-423/2 con un equipo Matsuzawa modelo MXT-a. Las
microindentaciones fueron analizadas con un microscopio óptico Leica modelo DMI
5000M.

Experimental �
����
3.4.12. Otras medidas
El pH de las disoluciones se determinó utilizando un pH-metro Crisom GLP 22. La
intensidad de la radiación UV (300-400 nm), emitida tanto por las lámparas como por el
sol, se midió con un radiómetro Kipp & Zonen modelo CUV 5.
3.5. Parámetros asociados al proceso
La eficiencia de corriente de mineralización (MCE) es un parámetro que proporciona
información sobre cuanta corriente aplicada es realmente empleada en las reacciones
orgánicas de interés que conducen a la completa mineralización de la materia orgánica en
disolución (Hammami y col., 2008; Isarain-Chávez y col., 2010; Almeida y col., 2011).
El parámetro queda definido y puede ser calculado a partir de la siguiente expresión:
MCE (%) = × 100 (32)
donde n es el número de electrones consumido para mineralizar completamente el
contaminante, F es la constante de Faraday (96487 C mol−1), Vs es el volumen de
disolución tratada, �(TOC)exp es el decaimiento experimental del TOC (mg L−1), 4,32 ×
107 es un factor de homogeneización de unidades (3600 s h−1 x 12000 mg mol−1), m es el
número de carbonos por molécula de contaminante, I es la corriente aplicada (A) y t es el
tiempo de electrolisis (h).
Por otro lado, también se determinó la energía consumida (EC) en los trabajos realizados
en planta piloto (Salazar y col., 2011; El-Ghenymy y col., 2012b), en kWh kg−1 TOC, a
partir de la siguiente ecuación:
EC = (33)
donde Ecell es la diferencia de potencial media entre electrodos (V), 1000 es un factor de
conversión (mg g−1) y el resto de parámetros tal y como fueron definidos para el cálculo
de la MCE según la Eq. (32).
�
nFVs�(TOC)exp
4.32 x 10⁷ mIt
Vs�(TOC)exp
1000 Ecell It

����
4. RESULTS AND DISCUSSION

����
�

Results and Discussion
���
Electrochemical Advanced Oxidation
Processes applied to the treatment of
wastewaters polluted with
pharmaceuticals

Results and Discussion �
���

Results and Discussion
����
Our research group LEMMA has investigated the efficient degradation of several widely
used pharmaceuticals such as paracetamol (Sirés et al., 2004), ibuprofen (Skoumal et al.,
2009), diclofenac (Brillas et al., 2010), atenolol (Isarain-Chávez et al., 2010) and some
antibacterial drugs such as enrofloxacin (Guinea et al., 2010) and sulfanilamida (El-
Ghenymy et al., 2013b) by different EAOPs in synthetic polluted waters. Nevertheless,
more efforts are needed to clarify the degradation behaviour of more complex molecular
structures with EAOPs, their scale-up and the viability of treating real wastewater.
In this section the treatment of two antimicrobial agents extensively used in medicine and
veterinary such as flumequine (FLU) and chloramphenicol (CHL) is reported. This kind
of pollutants suppose an environmental risk as stated for other drugs due to their toxicity,
but they have an additional undesired effect that is the possibility to promote the
emergence of multi-resistant bacterial strains. Then, it is obvious that the removal of that
POPs by efficient technologies is a relevant objective in order to protect human health
and the environment.
The degradations studied in these works cover a wide range of EAOPs such as AO with
electrochemical conversion or combustion activity and the electrochemical processes
based on Fenton’s reaction such as EF, PEF and SPEF, where different control variables
were evaluated. The SPEF process was scaled-up to a 10 L pre-pilot flow plant for CHL
polluted solutions and the viability of EAOPs for treating real wastewaters were assessed
by the effective treatment of sewage plant effluents contaminated with FLU.
Finally, the relevance of the final carboxylic acids generated in the removal of aromatics
conducted to a deeper study about oxalic and oxamic acids. Both acids are the ultimate
and more persistent by-products of the degradation of aromatic compounds (oxamic only
in the case of N-aromatics) and their degradation study was carried on in order to better
understand their behaviour during the EAOPs.
Table 9 summarizes relevant results obtained for the FLU and CHL treatment. It is clear
that the oxidation ability of the processes increases in the order AO -Pt < AO -BDD < EF
< PEF < SPEF. Besides, the effect of the anode used is easily appreciable and BDD
compared to Pt produces an enhancement on the mineralization process, as can be seen
for the AO processes of CHL. These results demonstrate the greatest

Results and Discussion �
����
Table 9. Percentage of DOC removal, maximum mineralization current efficiency and
pseudo-first order constant obtained for the treatment of 245 mg L-1 of chloramphenicol
and 62 mg L-1 of flumequine solutions by different EAOPs in stirred tank reactors
equipped with 3 cm2 electrode area at 33 mA cm-2.
Flumequine Chloramphenicol
Methods
% DOC
removal
Máx.
MCE / % k1 / s-1
% DOC
removal
Máx.
MCE / % k1 / s-1
AO-Pt --- --- --- 0 0 3.0 × 10⁻⁵
AO-BDD --- --- --- 78
(360 min)
17 1.4 x 10⁻⁴
EF-BDD 77
(360 min)
21
1.0 x 10⁻²
81
(360 min)
55
2.9 x 10⁻³
PEF-BDD
96
(360 min)
19 100
(270 min)
56
SPEF-BDD
--- --- --- 10
(90 min)
101
oxidizing power of physisorbed BDD(�OH) than Pt(�OH), since the weaker adsorption
of �OH on BDD allows a greater reactivity of this radical.
The aforementioned findings agree with the classification of the anodes given by
Comninellis (1994), where the active Pt anode leads to electrochemical conversion while
the non-active BDD favors the electrochemical combustion. As can also be seen in Table
9, the Pt anode removes CHL very slowly in AO, without mineralization, and the
corresponding pseudo-first-order rate constant (k1) is one order of magnitude lower than
that found for BDD.
When the EAOPs based on Fenton’s reaction were applied, the use of a BDD anode
instead of Pt improved and enhanced the oxidative process due to the combined action of
the �OH generated in the bulk by Fenton’s reaction (10) and BDD(�OH) radicals, which
are more powerful oxidizing agents than Pt(�OH) ones.

Results and Discussion
����
In both compounds, the faster DOC removal was found in the EAOPs under UV
irradiation. This light favours the mineralization due to the photodecarboxylation of
iron(III) complexes with carboxylic acids like oxalic and oxamic acids achieving higher
DOC removal percentages and significantly improving the MCE, even doubling it in the
case of CHL. However, the use of MCE is not completely correct when the solution is
irradiated because, as it is defined, the experimental DOC removal is expected to be only
related to the electrochemical process, without considering the mineralization
corresponding to photodegradation.
The effect of the intensity of the UV light can be assessed by comparing the PEF and
SPEF processes for CHL solutions. While in PEF 360 min are needed to completely
mineralize this drug, only 90 min are required for SPEF. This trend is explained on the
basis that the UVA lamp intensity is 5 W m-2, significantly lower than about 30 W m-2
determined in average for the solar UV radiation. This highlights the radiation intensity
as a controlling parameter of the photodecomposition kinetics. However, Table 9
evidences that the same k1 was obtained for EF, PEF and SPEF, a value one magnitude
order higher than in AO. This behaviour is explained by the fact that the initial pollutant
is not photodegradable and its removal is only due to its reaction with �OH mainly formed
from Fenton’s reaction (10) and in much lesser extent with BDD(�OH).
When the decay and mineralization of both antibiotics were compared, some differences
could be noticed. Despite FLU is degraded more quickly than CHL, comparison of the
mineralization and MCE allow conclude that CHL is the more easily electrochemically
incinerated (see Table 9). The differences of one magnitude order observed for k1 and the
differences for MCE when compared could be justified by two main reasons:
1- The different recalcitrant character and oxidability of each pollutant.
2- Their different DOC and compound initial concentration.
Let us discuss then the influence of the compound initial concentration, which is an
important control variable.
The study of the SPEF process of CHL included the effect of this parameter by treating
solutions with contents from 10 to 100 mg L-1 of DOC. It was found that the DOC
abatement required similar times to achieve full mineralization. It is therefore apparent
that a higher concentration of organic matter in solution accelerated the mineralization

Results and Discussion �
����
process and consequently, higher MCE values were obtained, rising from 12% to 100%.
This enhancement can be ascribed to the inhibition of parasitic reactions (12), (13) and
(20)-(29), favouring the organic events that mineralize these drugs or leading to the rapid
accumulation of photolyzable species.
However, as can be seen in Table 10, the drop in concentration causes an unexpected
increase of k1 value, since from a theoretical point of view a first-order rate constant is
independent of the initial concentration. This trend in k1 may be related with the short live
of �OH and BDD(�OH) radicals of about 4 × 10⁻⁹ s (Root and Okada, 1975), which are
continuously generated in the system. The higher amount of organic matter in the media
seems to limit the generation of these radicals, giving a different stationary concentration
depending on the experimental variables tested. This could explain that the pollutant
decay follows a pseudo-first order kinetics with changing k1 values. On the other hand,
Table 10 show similar k1 values for CHL and FLU at analogous concentrations. The little
difference between them is due to the different recalcitrant character and oxidability of
each pollutant, FLU being the more degradable.
Table 10. Pseudo-first-order rate constant at different initial concentrations of
flumequine and chloramphenicol determined by EAOPs based on Fenton’s reaction
chemistry in 0.05 M Na2SO4 solutions at pH 3.0 and 33.3 mA cm-2.
Compound Concentration / mg L-1
24.5 61.2-62.0 122.5 183.7 245.0
CHL 1.5 × 10⁻² s-1 8.0 × 10⁻³ s-1 7.6 × 10⁻³ s-1 3.7 × 10⁻³ s-1 2.9 × 10⁻³ s-1
FLU --- 1.0 × 10⁻² s-1 --- --- ---
The applied current density (j) is the main key factor governing the effectiveness of
EAOPs and its influence was checked. It was found that greater j gave higher removal
rate and mineralization degree at lower times. That enhancement can be ascribed to the
concomitant acceleration of reactions (9) and (14), thereby enhancing Fenton’s reaction
(10) and producing more amounts of �OH radicals. However, the MCE is simultaneously
reduced because the increase in j enhances the parasitic reactions (12), (13) and (20)-(29).
Besides, the rise in j is the responsible of a higher cell voltage, as can be deduced from
the Ohm’s law, and hence, it causes an increase of energy consumption at any scale.

Results and Discussion
����
The evolution of oxidation by-products showed a similar behaviour in both
antimicrobials. Ion chromatography evidenced the conversion of nitrogen and halogen
atoms of the molecule into inorganic ions. The general tendency for F and Cl was their
rapid release and accumulation as F− and Cl− ions, respectively, although Cl− ion was
further oxidized on BDD and released as Cl2. In regard to N species, quantification by
HPLC and TN determinations corroborated the main conversion into NO3− and oxamic,
although some NH4+ was also accumulated in lesser extent. The sum of these N-
derivatives in both cases corresponded to the expected theoretical N in solution because
the initial TN remained almost completely unchanged in solution.
The analysis of intermediates by LC-MS and HPLC allowed the identification of nine
aromatic by-products and thirteen hydroxylated derivatives for CHL. Ion-exclusion
HPLC analyses demonstrated that short-chain carboxylic acids were formed from the
cleavage of aromatic rings of FLU and CHL and they were the main remaining organic
matter at the end of treatments. Some of these acids such as oxalic, oxamic and formic
were found for both drugs, whereas malonic acid was only found for FLU and tartaric,
maleic, acetic and dichloracetic acids were identified for CHL. The differences between
the detected acids lie in the structures of the treated compounds that promote or not the
formation and accumulation of certain acids over others. What it is really important to
stand out is that in both cases oxalic and oxamic acids were accumulated in large contents
up to 60 mg L-1, as can be seen in Fig. 12. These compounds are the main components of
the remaining DOC at the end of the electrolyses due to their high recalcitrant character
and this effect is reflected in the MCE behaviour. When the change in MCE was analyzed,
the maximum efficiency was depicted at short times followed by its progressive loss with
prolonging electrolysis times. This decay in MCE can be ascribed to the gradual less
organic matter in solution as well as along with the formation of more difficultly
oxidizable products like short-chain carboxylic acids. Because of its relevance in the DOC
removal efficiency and different behaviour depending on the EAOP tested, the oxamic
and oxalic acid removal was studied deeply.
As pointed out above, oxalic and oxamic acids are the ultimate and more persistent by-
products of the degradation of aromatic compounds (oxamic only in the case of N-
aromatics). Their decay kinetics and oxidative paths were then studied for several EAOPs
using a BDD anode and a stainless steel or ADE cathode.

Results and Discussion �
����
Figure 12. Evolution of the concentration of (a) oxalic and (b) oxamic acids detected
during the treatments of flumequine (�,•) and chloramphenicol (�,�,�) by EF (�,�), PEF
(•,�) and SPEF (�).
Voltamperometric analyses for the oxidation of oxalic, oxamic and their Fe2+ and Fe3+
complexes on BDD revealed important information. Thus, the complexes of oxalic with
Fe2+ and Fe3+ are more recalcitrant than the free acid, whereas the oxamic iron complexes
are more easily oxidized than the free acid. However, both acids are oxidized in the water
discharge zone indicating that they react predominantly with BDD(�OH) at the anode
surface and not by direct charge transfer.
0
10
20
30
40
50
60
70
[Oxa
lic a
cid]
/ m
g L-1
0
5
10
15
20
0 60 120 180 240 300 360 420
time / min
[Oxa
mic
aci
d] /
mg
L-1
(a)
(b)

Results and Discussion
����
The degradative experiences showed similar behaviour for oxalic and oxamic acids. Both
compounds were not directly photolyzed by UVA light, although they were removed by
UVA light in the presence of Fe2+ and much quickly removed in presence of Fe3+. These
results highlighted that the most photoactive species were the Fe(III)-carboxylate
complexes and their photodegradative process can be explained by a ligand to metal
charge transfer that allows the photoreduction of the metallic centre and the oxidation of
the oxalate or oxamate complex up to their total mineralization to CO2.
As observed in voltammetric experiments, oxalic acid was mineralized faster than its iron-
complexes by AO with BDD, whereas iron-oxamato complexes were mineralized faster
than the free acid. In both cases, the EF treatment exhibited the same degradative
behaviour than AO in presence of Fe2+. That result indicated that the iron-carboxylate
complexes were mineralized only by the action of the BDD(�OH) radicals while the �OH
radicals generated in the bulk have no effect on their mineralization.
Also a study over the simultaneous treatment of oxalic and oxamic acids was performed.
The aim of this study was to understand their competitive reactions and their influences
on the pseudo-first-order rate constants. Solutions containing 8, 25 and 43% of oxamic
acid from the total acid concentration (oxalic + oxamic) were treated by AO, AO in the
presence of Fe2+ and AO in the presence of Fe2+ simultaneously irradiated by UVA light.
No appreciable differences were found in AO because the oxidation process is only
controlled by mass transfer. Nevertheless, that was not the case of the other two
treatments. For AO with Fe2+ greater oxamic acid concentration gradually upgraded the
k1 value. This was explained by the formation of more iron-oxamate complexes instead
of competitive oxalate ones, which are more rapidly mineralized than the free oxamic
acid. When UVA light was applied, the k1 value for oxalic acid decreased with the
increase of oxamic acid in solution as a result of the lower concentration of photoactive
iron-oxalato species available for the photodegradation process.
The increase in current density led to quicker acids removal and the loss of MCE as well
discussed above for FLU and CHL. Besides, it showed an effect on the inorganic N
released during oxamic acid treatment. As current density rose, it was found a drop in
NH4+ concentration and an increase in NO3− concentration and NOx evolution.
The initial concentration of Fe2+, the catalyst of Fenton’s reaction (10), is also a key
parameter of the degradation process. Usually, it is found an optimum content for this ion

Results and Discussion �
����
of 0.5 mM for almost all compounds. However, FLU is one exception and an optimum
catalyst concentration of 2.0 mM was found, that is, 4 times higher. This was explained
by the dual role played by Fe2+ during the FLU treatment, where acts as complexing agent
of FLU and as Fenton’s reaction catalyst to generate �OH.
The iron concentration effect was also studied for the treatment of oxamic acid, where
interestingly the [oxamic acid]/[Fe2+] ratio gave differences in the evolution of N species.
The main effect of the rise in Fe2+ concentration was the inhibition of oxamic acid
removal. This evidence was related to the competitive oxidation of free Fe2+ to Fe3+ at the
anode from reaction (34) instead of the mineralization of the iron-oxamate complexes.
The reduction of Fe3+ at the stainless steel cathode from reaction (15) regenerated Fe2+
ion and maintained the equilibrium between both ions in solution, decreasing the
oxidation ability. That fall is also reflected in the gradual drop in NO3− content ascribed
to the loss of the oxidative power of the system.
Fe2+ � Fe3+ + e− (34)
After the promising results obtained for CHL degradation, the SPEF process was scaled-
up from the stirred tank reactor to a pre-pilot flow plant of 10 L with an electrochemical
filter-press reactor of Pt/ADE coupled to a CPC photoreactor. During the SPEF treatment
at 100 mA cm-2, an 89 % of DOC removal was attained with a 49% of MCE and 0.347
kWh g-1 DOC of EC, related to 30.8 kWh m-3, yielding an estimated cost of 4.35 € m-3.
This low cost and the excellent DOC removal confirms the viability of SPEF for possible
application to industrial scale. Even more, the consideration of use of solar panels could
allow the drastic reduction of EC.
To end with the work about the application of EAOPs to the remediation of wastewaters
polluted with pharmaceuticals, the EF and PEF processes were applied to a real
wastewater matrix provided gently by the Manresa’s Sewage Treatment Plant, which was
polluted with FLU. During these assays, a complete removal of the natural organic matter
(NOM) from the real wastewater matrix was obtained. FLU was also removed at the same
rate, reaching the same degradation degree as the synthetic wastewater treated previously.
This promising result suggests the effectiveness of EAOPs in real water conditions to
remove other POPs and even achieve the complete NOM degradation by the action of
hydroxyl radicals in the electrolytic systems.
� �

Results and Discussion
���
PAPER 1
Mineralization of flumequine in
acidic medium by electro-Fenton and
photoelectro-Fenton processes

Results and Discussion �
���

Mineralization of flumequine in acidic mediumby electro-Fenton and photoelectro-Fenton processes
Sergi Garcia-Segura, Jose A. Garrido, Rosa M. Rodrıguez, Pere L. Cabot, Francesc Centellas,Conchita Arias, Enric Brillas*
Laboratori d’Electroquımica dels Materials i del Medi Ambient, Departament de Quımica Fısica, Facultat de Quımica,
Universitat de Barcelona, Martı i Franques 1-11, 08028 Barcelona, Spain
a r t i c l e i n f o
Article history:
Received 21 November 2011
Received in revised form
16 January 2012
Accepted 18 January 2012
Available online 3 February 2012
Keywords:
Flumequine
Electro-Fenton
Mineralization
Photoelectro-Fenton
Oxidation products
Water treatment
a b s t r a c t
The mineralization of flumequine, an antimicrobial agent belonging to the first generation
of synthetic fluoroquinolones which is detected in natural waters, has been studied by
electrochemical advanced oxidation processes (EAOPs) like electro-Fenton (EF) and
photoelectro-Fenton (PEF) with UVA light. The experiments were performed in a cell
containing a boron-doped diamond (BDD) anode and an air-diffusion cathode to generate
H2O2 at constant current. The Fe2þ ion added to the medium increased the solubility of the
drug by the formation of a complex of intense orange colour and also reacted with elec-
trogenerated H2O2 to form hydroxyl radical from Fenton reaction. Oxidant hydroxyl radi-
cals at the BDD surface were produced from water oxidation. A partial mineralization of
flumequine in a solution near to saturation with optimum 2.0 mM Fe2þ at pH 3.0 was
achieved by EF. The PEF process was more powerful, giving an almost total mineralization
with 94e96% total organic carbon removal. Increasing current accelerated both treatments,
but with decreasing mineralization current efficiency. Comparative treatments using a real
wastewater matrix led to similar degradation degrees. The kinetics for flumequine decay
always followed a pseudo-first-order reaction and its rate constant, similar for both EAOPs,
raised with increasing current. Generated carboxylic acids like malonic, formic, oxalic and
oxamic acids were quantified by ion-exclusion HPLC. Fe(III)eoxalate and Fe(III)eoxamate
complexes were the most persistent by-products under EF conditions and their quicker
photolysis by UVA light explains the higher oxidation power of PEF. The release of inor-
ganic ions such as F�, NO3� and in lesser extent NH4
þwas followed by ionic chromatography.
ª 2012 Elsevier Ltd. All rights reserved.
1. Introduction
Over the last two decades, a large variety of pharmaceutical
drugs including analgesics, anti-inflammatory, beta-blockers,
antimicrobials, blood lipid regulators and so on, has been
detected at low contents of micrograms per litre in soils,
surface waters, ground waters and even drinking waters
(Tamtam et al., 2008; Kummerer, 2009; Postigo et al., 2009; Li
et al., 2010; McClellan and Halden, 2010). This pollution
proceeds from production sites, excretion after drug admin-
istration to humans and animals, direct disposal of excess of
drugs in households and treatments in fish and other animal
farms (Bound and Voulvoulis, 2005). The accumulation of
drugs in the aquatic environment is mainly due to their inef-
ficient destruction in the processes currently used in sewage
treatment plants (STPs) (Andreozzi et al., 2003; Karthikeyan
* Corresponding author. Tel.: þ34 93 4021223; fax: þ34 93 4021231.E-mail address: [email protected] (E. Brillas).
Available online at www.sciencedirect.com
journal homepage: www.elsevier .com/locate/watres
wat e r r e s e a r c h 4 6 ( 2 0 1 2 ) 2 0 6 7e2 0 7 6
0043-1354/$ e see front matter ª 2012 Elsevier Ltd. All rights reserved.doi:10.1016/j.watres.2012.01.019
69

and Meyer, 2006; Vieno et al., 2007; Homem and Santos, 2011).
Despite their low content in natural waters, it has been
documented the development of multi-resistant strains of
microorganism by some drugs (Jarnheimer et al., 2004;
Naviner et al., 2011), the effects of pharmaceuticals on the
endocrine systems of fishes and invertebrates (Migliore et al.,
1997) and their toxicity on algae and small invertebrates
(Halling-Sørensen, 2000; Crane et al., 2006; Pomati et al., 2008).
To avoid the possible adverse health problems on living
beings, research efforts are needed for the development of
powerful methods for the removal of these pollutants from
the environment.
Several treatments involving ozonation and a large variety
of advanced oxidation processes (AOPs) have been recently
applied to the remediation of waters contaminatedwith drugs
(Skoumal et al., 2006; Rosal et al., 2008; Brillas et al., 2009; Kim
et al., 2009; Song et al., 2009; Rozas et al., 2010; Homem and
Santos, 2011). AOPs are chemical, photocatalytic and electro-
chemical methods based on the in situ generation of hydroxyl
radical (�OH). This species is the second strongest oxidant
known after fluorine and has so high standard reduction
potential (E�(�OH/H2O)¼ 2.80 V vs SHE) that can react non-
selectively with most organic pollutants up to their total
mineralization (conversion into CO2, water and inorganic
ions). Recently, electrochemical AOPs (EAOPs) based on Fen-
ton’s reaction chemistry such as electro-Fenton (EF) and
photoelectro-Fenton (PEF) have received great attention for
the degradation of organics in waters due to their simplicity,
great efficiency and relative low cost (Skoumal et al., 2008;
Balci et al., 2009; Brillas et al., 2009; Zarei et al., 2010;
Almeida et al., 2011). In the EF process, H2O2 is continuously
supplied to an acidicmedium from the two-electron reduction
of added O2 at the cathode by reaction (1). The addition of
a small Fe2þ concentration to the solution enhances the
oxidation power of electrogenerated H2O2 giving�OH and Fe3þ
from Fenton reaction (2), which is promoted by the catalytic
action of the Fe3þ/Fe2þ system, mainly from the regeneration
of Fe2þ by the cathodic reduction of Fe3þ from reaction (3).
O2þ 2Hþþ 2e�/H2O2 (1)
Fe2þþH2O2/ Fe3þ þ �OHþOH� (2)
Fe3þþ e�/ Fe2þ (3)
Good efficiencies for H2O2 generation from reaction (1) have
been found using cathodes such as carbon nanotubes-
polytetrafluoroethylene (PTFE) (Khataee et al., 2010; Zarei
et al., 2010), carbon nanotubes on graphite (Khataee et al.,
2011), carbon felt (Oturan et al., 2008, 2010; Balci et al., 2009;
Ozcan et al., 2010; Sires et al., 2010) and carbon-PTFE gas (O2
or air) diffusion (Sires et al., 2007; Skoumal et al., 2008, 2009;
Garcia-Segura and Brillas, 2011).
When an undivided cell is used in EF, it is possible the
combined oxidation action of �OH generated both in the bulk
by Fenton reaction (2) and at the anode surface from water
discharge (Brillas et al., 2009). For a boron-doped diamond
(BDD) thin-film anode, the formation of the physisorbed
BDD(�OH) is given by reaction (4) (Marselli et al., 2003; Panizza
and Cerisola, 2009):
BDDþH2O/ BDD(�OH)þHþþ e� (4)
The BDD electrode is currently considered the most potent
anode because it interacts very weakly with generated �OH
resulting in a much greater O2-overpotential than other
materials like Pt (Sires et al., 2006; Hamza et al., 2009; Brillas
et al., 2010) and in an enhancement of organic removal with
reactive BDD(�OH) that makes it potent enough to mineralize
aromatics and their generated carboxylic acids (Canizares
et al., 2008; Panizza and Cerisola, 2009; Garcia-Segura and
Brillas, 2011).
Because of their different experimental conditions, the
direct comparison between the mineralization efficiencies
attained from the classical chemical Fenton and EF processes
is difficult to be established (Serra et al., 2009). Nevertheless,
the additional production of hydroxyl radicals from Fe2þ
regeneration by reaction (3) and water oxidation by reaction
(4) allows predicting that EF is more potent than classical
chemical Fenton (Brillas et al., 2009).
The PEF process involves the simultaneous UV irradiation
of the solution under EF treatment. This light causes the
photolysis of [Fe(OH)]2þ, the more stable species of Fe3þ at pH
ca. 3, regenerating more catalytic Fe2þ and producing more�OH by reaction (5) (Brillas et al., 2009). Furthermore, UV light
can induce the photodegradation of some intermediates, as
the case of Fe(III)ecarboxylate complexes by reaction (6)
(Garcia-Segura and Brillas, 2011).
[Fe(OH)]2þþ hn/ Fe2þþ �OH (5)
Fe(OOCR)2þþ hn/ Fe2þ þCO2þ R� (6)
In previous work, our group has investigated the efficient
degradation of several drugs such as paracetamol (Sires et al.,
2007; Almeida et al., 2011), chloroxylenol (Skoumal et al.,
2008), ibuprofen (Skoumal et al., 2009) and enrofloxacin
(Guinea et al., 2010) by EF and PEF using electrochemical
reactors with either a BDD or Pt anode and a carbon-PTFE gas
diffusion cathode. To gain a better knowledge about the
possible viability of these EAOPs for the treatment of waste-
waters containing drugs, more research efforts are needed to
clarify the degradation behaviour of more complex molecular
structures. In this way, we have undertaken a study on the
mineralization of flumequine (C14H12FNO3, see formula in
Fig. 1). It is an antimicrobial agent belonging to the first
generation of synthetic fluoroquinolones, which has been
widely used in veterinary medicine (poultry, livestock and
aquaculture) to control bacterial infections, even in large
quantities owing its low bioavailability in fish (Burridge et al.,
2010). Flumequine has been detected in rivers at concentra-
tions up to 50 ng L�1 (Tamtam et al., 2008; Munoz et al., 2010)
and its antimicrobial resistance in bacteria (Naviner et al.,
2011) and algal toxicity have been well proven (Halling-
Sørensen, 2000; Crane et al., 2006). Flumequine is poorly
photolyzed in waters (Pouliquen et al., 2007) and is not
oxidized with chlorine dioxide (Wang et al., 2010). It has also
wat e r r e s e a r c h 4 6 ( 2 0 1 2 ) 2 0 6 7e2 0 7 62068
70

been reported that flumequine can be degraded by means of
AOPs like TiO2 photocatalysis (Nieto et al., 2008; Miranda-
Garcıa et al., 2011) and photo-Fenton (Klamerth et al., 2011).
This paper presents the results obtained for the minerali-
zation of flumequine by EF and PEF processes using a BDD/air-
diffusion cell. The influence of Fe2þ concentration and applied
current on the degradation rate and mineralization degree
was examined. The decay kinetics for the drug and the
evolution of generated carboxylic acids and inorganic ions
released were determined by chromatographic techniques to
clarify the oxidative ability of both EAOPs. Comparative
treatments of flumequine in a real wastewater matrix were
also made to study the possible influence of natural organic
matter (NOM) on their oxidation power, which has not been
previously considered for other drugs.
2. Experimental
2.1. Chemicals
Flumequine (99% purity) was supplied by the Laboratories
SYVA S.A.U. (Leon, Spain). Anhydrous sodium sulphate and
iron (II) sulphate heptahydrate were of analytical grade from
Panreac and Fluka, respectively. Oxalic, oxamic, malonic and
formic acids were of analytical grade purchased from
Avocado. All the other chemicals employed were either of
HPLC or analytical grade from Merck, Panreac and Avocado.
Solutions were prepared with high-purity water obtained
from a Millipore Milli-Q system with resistivity >18 MU cm at
25 �C. All solutions were adjusted to pH 3.0 with analytical
grade sulphuric acid from Merck.
2.2. Electrochemical system
All the electrolytic trialswere conducted in an open, undivided
and cylindrical glass cell of 150 mL capacity, with a double
jacket in which external water circulated to maintain the
solution temperature at 35 �C. This is the optimal temperature
found for the degradation of other aromatics in the cell,
without significant water evaporation from solution (Sires
et al., 2007). The anode was a BDD thin film from Adamant
Technologies (La Chaux-de-Fonds, Switzerland) and the
cathode was a carbon-PTFE air-diffusion electrode from E-TEK
(Somerset, NJ, USA). The preparation of this cathode was
described elsewhere (Brillas et al., 2004) and it was fed with air
pumped at 300 mLmin�1 to generate H2O2 from reaction (1).
The geometric area of each electrode was 3 cm2 and the
interelectrode gap was 1 cm. To remove the impurities of the
BDD surface and activate the air-diffusion cathode, they were
previously polarized in 0.05 MNa2SO4 at 300 mA for 60 min. All
experiments were carried out under vigorous stirring with
a magnetic bar at 800 rpm to ensure homogenization and the
transport of reactants towards/from the electrodes.
Comparative EF degradations of 100 mL of 62 mg L�1 flu-
mequine solutions (40 mg L�1 of total organic carbon (TOC)) in
0.05 M Na2SO4 with concentrations of Fe2þ from 0.5 to 6.0 mM
at pH 3.0were performed. This solution pHwas chosen since it
was found optimal for the similar treatment of other organics
(Oturan et al., 2008; Brillas et al., 2009). The influence of
applied current between 50 and 300 mA on the EF and PEF
treatments of the drug solution with 2.0 mM Fe2þ was also
examined. For the trials with real wastewaters, effluents of
the secondary biological treatment of the Municipal Waste-
water Treatment Plant of Manresa (Barcelona, Spain) with
TOC ca. 27 mg L�1 were taken and used the next day. In the PEF
assays, a Philips TL/6W/08 fluorescent black light blue tube of
lmax¼ 360 nm was placed at the top of the cell at 7 cm above
the solution, giving a photoionization energy input of
5 Wm�2, as detected with a Kipp&Zonen CUV5 radiometer.
2.3. Apparatus and analytical procedures
The solution pHwas determined with a Crison 2000 pHmetre.
Galvanostatic electrolyses were performed with an Amel 2051
potentiostategalvanostat. Before analysis, the aliquots were
alkalinized to stop the mineralization process and filtered
with 0.45 mm PTFE filters from Whatman. The solution TOC
was determined with a Shimadzu VCSN TOC analyzer and
reproducible valueswith an accuracy of�1%were obtained by
injecting 50 mL aliquots into it. From these data, the mineral-
ization current efficiency (MCE, in %) for the electrolyzed
solutions was then calculated by Eq. (7):
MCE ð%Þ ¼ nFVsDðTOCÞexp4:32� 107mIt
� 100 (7)
where F is the Faraday constant (96,487 Cmol�1), Vs is the
solution volume (L), D(TOC)exp is the experimental TOC
removal (mg L�1), 4.32� 107 is a conversion factor
(3600 s h�1� 12,000 mgmol�1), m is the number of carbon
atoms of the compound (14 carbons), I is the applied current
(A) and t is the electrolysis time (h). The number of electrons
(n) consumed for the total mineralization of flumequine was
taken as 66 considering that it is transformed into CO2 and
NO3� and F� ions as the final products following Eq. (8):
C14H12FNO3þ 28H2O/ 14CO2þNO3� þ F�þ 68Hþþ 66e� (8)
The evolution of total nitrogen (TN) of the solution was
determined with a TNM-1 module coupled to the above TOC
analyzer.
OO
OH
N
F
Fig. 1 e Chemical formula of flumequine.
wat e r r e s e a r c h 4 6 ( 2 0 1 2 ) 2 0 6 7e2 0 7 6 2069
71

The flumequine decay was followed by reversed-phase
HPLC of electrolyzed solutions using a Waters 600 LC fitted
with a Thermo Electron Corporation Hypersil BDS C18 5 mm
(250 mm� 4.6 mm (i.d.)) column at 35 �C, coupled with
aWaters 996 photodiode array detector selected at l¼ 233 nm.
Generated carboxylic acids were detected and quantified by
ion-exclusion HPLC using the above LC fitted with a Bio-Rad
Aminex HPX 87H (300 mm� 7.8 mm (i.d.)) column at 35 �Cand the photodiode array detector selected at l¼ 210 nm. For
these measurements, 20 mL aliquots were injected into the
chromatograph and the mobile phase was a 40:60 (v/v)
acetonitrile/water (phosphate buffer, pH 3.5) mixture at
0.6 mLmin�1 for reversed-phase HPLC and 4 mM H2SO4 at
0.6 mLmin�1 for ion-exclusion HPLC.
The inorganic ions released during the mineralization
process were quantified by ionic chromatography using
a Shimadzu 10 Avp HPLC coupled with a Shimadzu CDD 10
Avp conductivity detector. These analyses were performed by
injecting 25 mL aliquots. The NH4þ concentration was deter-
mined with a Shodex cationic column IC YK-421
(125 mm� 4.6 mm (i.d.)) at 40 �C and circulating a mobile
phase composed of 5.0 mM tartaric acid, 1.0 mM dipicolinic
acid, 24.2 mM boric acid and 1.5 mM crown ether at
1.0 mLmin�1. The F� and NO3� concentrations were obtained
with a Shim-Pack anionic column IC-A1S (100 mm� 4.6 mm
(i.d.)) at 40 �C using a solution with 2.4 mM tris(hydrox-
ymethyl)aminomethane and 2.5 mM phthalic acid of pH 4.0 at
1.5 mLmin�1 as mobile phase.
3. Results and discussion
3.1. Effect of Fe2þ concentration on EF degradation
Fig. 1 shows the complex aromatic structure of flumequine
containing a carboxylic group, with pKa¼ 6.35 (Lin et al., 2004),
which explains its different solubility in acidic and alkaline
media. Thus, it possesses a high solubility in alkalinemedium
because the anionic form predominates, but it is quite insol-
uble in acidic medium where its neutral form is the major
species. Nevertheless, when flumequine solutions were
prepared to operate under EF conditions, it was found that the
addition of Fe2þ to a saturated solution of pH 3.0 increased
strongly the solubility of the drug. The initial colourless
solution then changed to an intense orange colour, which can
be ascribed with the formation of a stable complex between
Fe(II) and flumequine. In the presence of 0.5 mM Fe2þ, the
saturated solution contained 62 mg L�1 of the drug, as
confirmed from TOC analysis, and this flumequine content at
pH 3.0 was used to assess the influence of Fe2þ concentration
up to 6.0 mM on the EF process operating with the BDD/air-
diffusion cell at 50 mA for 360 min. In all these trials, the initial
orange solutions became colourless after less than 90 min of
treatment, when all coloured intermediates and/or iron (Fe(II)
and/or Fe(III)) complexes with aromatics were destroyed.
Moreover, the solution pH decreased slightly up to a final
value close to 2.8, probably due to the generation of short-
linear aliphatic carboxylic acids (Oturan et al., 2008; Brillas
et al., 2009).
Fig. 2a depicts the slow, but gradual TOC decrease with
electrolysis time found for the above EF experiments. As can
be seen, the higher degradation rate for the flumequine
solution was attained for 2.0 and 4.0 mM Fe2þ at least up to
240 min of electrolysis, although from 0.5 to 4.0 mM Fe2þ
about 75% of mineralization was always achieved at 360 min.
For the higher 6.0 mM Fe2þ, however, the EF process was
strongly inhibited after 240 min, only reaching 58% of TOC
removal at the end of electrolysis. This behaviour suggests
that flumequine and its primary oxidation by-products are
mainly destroyed by �OH formed by Fenton reaction (2) up to
yield species, like Fe(III) complexes of short carboxylic acids,
that only react much more slowly at the anode surface with
BDD(�OH) produced by reaction (4) (Garcia-Segura and Brillas,
2011). The larger formation of the latter kind of products for
the higher Fe2þ concentration of 6.0 mM can account for by
the large inhibition of TOC removal observed at long elec-
trolysis time under these conditions (see Fig. 2a).
To clarify the behaviour of generated hydroxyl radicals, the
kinetics for the drug decay in the above assays was followed
by reversed-phase HPLC, where it displayed a well-defined
0
5
10
15
20
25
30
35
40
45
0 60 120 180 240 300 360 420
TO
C /
mg
L-1
time / min
0
10
20
30
40
50
60
70
0 20 40 60 80 100
[Flu
meq
uine
] / m
g L
-1
time / min
a
b
Fig. 2 e Abatement of (a) TOC and (b) flumequine
concentration with electrolysis time for the electro-Fenton
(EF) degradation of 100 mL of 62 mg LL1 of the drug (near to
saturation) in 0.05 M Na2SO4 at pH 3.0 and 35 �C using
a BDD/air-diffusion cell with 3.0 cm2 area of each electrode
at 50 mA. Fe2D concentration: (B) 0.5 mM, (,) 1.0 mM, (6)
2.0 mM, (>) 4.0 mM and (7) 6.0 mM.
wat e r r e s e a r c h 4 6 ( 2 0 1 2 ) 2 0 6 7e2 0 7 62070
72

peak with retention time (tr) of 13.5 min. Fig. 2b evidences
a very rapid removal of the drug in all cases, disappearing
from the medium in decreasing time from 80 min for 0.5 mM
Fe2þ to 25 min for 2.0 and 4.0 mM Fe2þ. However, a longer time
of 45 min was needed to achieve its total disappearance for
6.0 mMFe2þ. The increase in flumequine decay ratewhen Fe2þ
content rises from 0.5 to 4.0 mM can be related to the gradual
acceleration of Fenton reaction (2). The smaller destruction
rate found for 6.0 mMFe2þ can then be explained by the loss of�OH with the excess of Fe2þ added from the parasitic reaction
(9) (Brillas et al., 2009):
Fe2þþ �OH/ Fe3þþOH� (9)
The above considerations highlight the dual role of Fe2þ ion
in the EF process, as complexing agent of flumequine and as
reactant of Fenton reaction (2) to generate �OH in the bulk to
mainly oxidize the complex formed with the drug. From these
findings, 2.0 mM Fe2þ was chosen as the optimum concen-
tration to study the characteristics of both, the EF and PEF
processes on flumequine mineralization.
3.2. Comparative degradation by EF and PEF processes
The applied current is the main key factor governing the
effectiveness of EAOPs. To check the influence of this
parameter, currents ranging between 50 and 300 mA were
applied to the EF and PEF treatments of a 62 mg L�1 flume-
quine solution with the optimum 2.0 mM Fe2þ at pH 3.0. The
corresponding TOC abatements are presented in Fig. 3a and b,
respectively. These trials were performed without pH regula-
tion since it only decayed up to 2.6e2.7 as maximum after
360 min of electrolysis, as expected if final short-aliphatic
carboxylic acids are always produced (Brillas et al., 2009).
For EF, Fig. 3a shows an increasing TOC decay with rising
current, reaching 75%, 77%, 78% and 89%mineralization at the
end of the treatment at 50, 75, 100 and 300 mA respectively.
The greater degradation rate and mineralization degree ach-
ieved at higher current can then be ascribed to the concomi-
tant acceleration of reaction (1) producing more H2O2 to
enhance the generation of �OH via Fenton reaction (2), as well
as of reaction (4) giving more amount of reactive BDD(�OH).
The same behaviour can be observed in Fig. 3b for the PEF
process, although in this case a higher 94e96% TOC removal
was attained after 360 min of all electrolyses. This means that
the PEF treatment allows reaching an almost total minerali-
zation of flumequine, having a much greater oxidation power
than the EF one. The enhancement of mineralization in PEF
can be related to the rapid photodegradation by UVA light of
Fe(III) complexes with some final carboxylic acids, which are
very slowly degraded by hydroxyl radicals in EF, as will be
discussed below. Note that for the higher current of 300 mA,
a 95% mineralization was already achieved at about 240 min
of PEF (see Fig. 3b), indicating the formation of very recalci-
trant by-products that remain in the final solution because
they cannot be removed by the action of hydroxyl radicals
and/or UVA light.
The MCE values calculated from Eq. (7) for the experiments
given in Fig. 3a and b are depicted in their inset panels as
a function of the consumed specific charge (Q, in Ah L�1). Atthe same current a higher efficiency can be observed for the
PEF treatment, as a result of the greater mineralization ach-
ieved for the flumequine solution. The maximum MCE values
obtained were 21% for EF and 37% for PEF at 50 mA after the
consumption of 0.5 Ah L�1. At higher Q values, the efficiency
always decreased dramatically owing to the gradual forma-
tion of more recalcitrant by-products and the presence of less
organic matter in solution (Panizza and Cerisola, 2009).
Moreover, in both processes the efficiency dropped as current
increased, being this effect more significant when passing
from 100 to 300 mA. For example, the MCE values decayed in
13%, 12%, 11% and 8.5% for EF and 18%, 17%, 16% and 12% after
consuming 2.0 Ah L�1 at 50, 75, 100 and 300 mA, respectively.
This loss in efficiency in both treatments with rising current
can be accounted for by the production of less relative
oxidizing hydroxyl radicals due to the larger acceleration of
their parasitic reactions, thereby decreasing the organic
events. These waste reactions involve, for example, the
oxidation of BDD(�OH) to O2 at the anode by reaction (10), the
dimerization of �OH to H2O2 by reaction (11) and the reaction
0
5
10
15
20
25
30
35
40
45
TO
C /
mg
L-1
0
5
10
15
20
25
0 5 10 15 20
% M
CE
Q / Ah L-1
0
5
10
15
20
25
30
35
40
0 60 120 180 240 300 360 420time / min
0
10
20
30
40
0 5 10 15 20
% M
CE
Q / Ah L-1
a
b
Fig. 3 e TOC removal vs electrolysis time for the (a) EF and
(b) photoelectro-Fenton (PEF) processes of 100 mL of
62 mg LL1 flumequine in 0.05 M Na2SO4 with 2.0 mM Fe2D
at pH 3.0 and 35 �C using a BDD/air-diffusion cell operating
at: (B) 50 mA, (,) 75 mA, (>) 100 mA and (6) 300 mA. The
PEF treatment was carried out with a 6 W UVA irradiation
of lmax[ 360 nm. The inset panels present the
corresponding mineralization current efficiency calculated
from Eq. (7).
wat e r r e s e a r c h 4 6 ( 2 0 1 2 ) 2 0 6 7e2 0 7 6 2071
73

of this radical with H2O2 generating the hydroperoxyl radical
ðHO$2Þ of lower oxidizing power by reaction (12) (Brillas et al.,
2009; Panizza and Cerisola, 2009; Guinea et al., 2010):
2BDD(�OH)/ 2BDDþO2þ 2Hþþ 2e� (10)
2�OH/H2O2 (11)
H2O2þ �OH/HO2� þH2O (12)
The kinetic decay for flumequine under the EF conditions
of Fig. 3a is presented in Fig. 4. As expected, the drug was
completely removed and disappeared much more rapidly
with rising current due to its faster reaction with the greater
amounts of �OH generated from Fenton reaction (2) and
BDD(�OH) formed from reaction (4). Similar drug abatement
for each current tested was found operating with the PEF
process, as exemplified in Fig. 4 for the case of 100 mA. This
evidences that the complex of Fe(II) with flumequine is not
directly photolyzed by UVA irradiation and that the photolytic
reaction (5) participates very poorly to generate �OH. The
above concentration decays were further analyzed using
kinetic equations related to simple reaction orders and good
fits were only found for a pseudo-first-order reaction, as can
be seen in the inset panel of Fig. 4. From this analysis,
increasing pseudo-first-order rate constants (k1) of
3.2� 10�3 s�1 (R2¼ 0.997) for 50 mA, 6.3� 10�3 s�1 (R2¼ 0.982)
for 75 mA, 1.0� 10�2 s�1 (R2¼ 0.978) for 100 mA and
2.6� 10�2 s�1 (R2¼ 0.976) for 300 mAwere obtained for EF. This
behaviour is indicative of a constant production of oxidizing
hydroxyl radicals (�OH and BDD(�OH)) during the EF and PEF
treatments at each current, at least during the time required
to destroy the initial complex of Fe(II) with flumequine.
The possible effect of NOM on the EF and PEF degradations
of 62 mg L�1 flumequine in a real wastewater matrix was also
studied under the above optimized conditions at 300 mA.
Fig. 5 shows that TOC was reduced by 91% for EF and 97% for
PEF in 360 min, thereby reaching similar mineralization
degrees to those found in the synthetic solution (see Fig. 3). In
contrast, the real wastewater alone was degraded at quite
similar rate for both EAOPs, attaining ca. 93% mineralization
at the end of electrolysis (see Fig. 5). These findings evidence
the little influence of NOM on flumequine removal because
PEF yields an almost total mineralization and is more
powerful than EF by the synergistic action of UVA light. The
fact that both EAOPs are able to degrade the real wastewater at
similar rate, suggests that NOM is primordially destroyed by
the hydroxyl radicals generated in the electrolytic system.
3.3. Time course of generated carboxylic acids
It is well-known that the degradation of aromatics and het-
eroaromatics with hydroxyl radicals involves the generation
of short-linear aliphatic carboxylic acids coming from the
cleavage of their aromatic moieties and lateral groups (Oturan
et al., 2008; Balci et al., 2009; Brillas et al., 2009; Skoumal et al.,
2009; Almeida et al., 2011). This behaviour was confirmed for
the EF and PEF treatments of 62 mg L�1 flumequine with 2 mM
Fe2þ of pH 3.0 by analyzing the solutions electrolyzed at 50 mA
by ion-exclusion HPLC. These chromatograms exhibited well-
defined peaks corresponding to carboxylic acids like oxalic
(tr¼ 7.0 min), oxamic (tr¼ 9.4 min), malonic (tr¼ 9.8 min) and
formic (tr¼ 13.7 min). Under the EF and PEF conditions tested,
all these acids form complexes with Fe(III), which is formed in
Fenton reaction (2) and is the predominant iron species at long
electrolysis time (Brillas et al., 2009). Note that oxalic, oxamic
and formic acids are ultimate carboxylic acids because they
are directly converted into CO2 (Oturan et al., 2008; Garcia-
Segura and Brillas, 2011).
Fig. 6a shows that malonic and formic acids were accu-
mulated to near 12 and 17 mg L�1 at 30 min, respectively, and
further rapidly removed in 60e90 min of EF treatment, as ex-
pected if their Fe(III) complexes rapidly react with hydroxyl
0
10
20
30
40
50
60
70
0 5 10 15 20 25 30
[Flu
meq
uine
] / m
g L
-1
time / min
0
1
2
3
4
0 5 10 15 20
ln (
C0/C
)
time / min
Fig. 4 e Flumequine concentration decay under the same
conditions of Fig. 3. EF process at: (B) 50 mA, (,) 75 mA, (>)
100 mA and (6) 300 mA. PEF process at (A) 100 mA. The
corresponding kinetic analysis assuming a pseudo-first-
order reaction for flumequine is given in the inset panel.
0
10
20
30
40
50
60
70
0 60 120 180 240 300 360 420
TO
C /
mg
L-1
time / min
Fig. 5 e TOC decay with electrolysis time for the (B) EF and
(C) PEF degradations of 100 mL of 62 mg LL1 flumequine in
a real wastewater matrix of 27 mg LL1 TOC with 0.05 M
Na2SO4 and 2.0 mM Fe2D at pH 3.0, 300 mA and 35 �C. (6)
EF and (:) PEF treatments of the real wastewater matrix
under the same conditions.
wat e r r e s e a r c h 4 6 ( 2 0 1 2 ) 2 0 6 7e2 0 7 62072
74

radicals. In contrast, oxalic and oxamic acids weremuchmore
recalcitrant and persisted largely up to the end of electrolysis.
This evidences the stability of Fe(III)eoxalate and Fe(III)e
oxamate complexes under EF conditions, because they react
very slowly with BDD(�OH) at the anode surface while are not
destroyed by �OH in the bulk (Brillas et al., 2009; Garcia-Segura
and Brillas, 2011). Fig. 6a also shows that after 360 min of
treatment, the resulting solution still contained 35.0 and
5.7 mg L�1 of oxalic and oxamic acids, respectively, corre-
sponding to 9.3 and 1.5 mg L�1 of TOC. The addition of these
values agrees with 10.4 mg L�1 of TOC determined for the final
electrolyzed solution at 50 mA (see Fig. 3a), indicating that it is
mainly composed of such mixture of both acids.
A similar evolution for malonic and formic acids to that
found in EF can be seen in Fig. 6b when the PEF process was
applied to mineralize flumequine. This means that Fe(III)e
malonate and Fe(III)eformate are destroyed by hydroxyl
radicals in PEF as in the case of EF. In contrast, Fig. 6b
evidences a very different behaviour for oxalic acid, which
was less accumulated up to 28 mg L�1 as maximal at 90 min to
further decrease progressively to practically disappear in
360 min due to the quick photodecarboxylation of Fe(III)e
oxalate complexes via reaction (6). The same trend can be
observed in Fig. 6b for oxamic acid, although in this case it
becamemore persistent by the lower photolytic rate of Fe(III)e
oxamate complexes (Garcia-Segura and Brillas, 2011). At the
end of electrolysis, the remaining solution contained
1.8 mg L�1 of oxalic acid and 3.2 mg L�1 oxamic acid, giving
1.3 mg L�1 TOC, which only corresponds to about 50% of its
organic charge of 2.5 mg L�1 TOC (see Fig. 3b). This indicates
that in PEF the action of UVA light favours the generation of
a small proportion of some unidentified recalcitrant organics
that are neither attacked by hydroxyl radicals nor photo-
decomposed. Results of Fig. 3b suggest that the relative
proportion of such by-products becomes more significant as
the current rises up to 300 mA.
The higher oxidation power of PEF than EF to mineralize
flumequine can then be primordially related to the photolytic
ability of UVA irradiation to remove the complexes of Fe(III)
with final carboxylic acids like oxalic and oxamic. However,
the PEF process enhances the production of small amounts of
other recalcitrant by-products that avoid that flumequine can
be completely mineralized.
3.4. Evolution of inorganic ions released
The mineralization of flumequine by the EAOPs tested is
accompanied by the formation of F�, NO3� and NH4
þ ions,
which were quantified by ionic chromatography. Fig. 7a and
b shows the complete release of the initial F contained in the
drug (4.54 mg L�1) as F� ion in only 20e25 min of the EF and
PEF treatments at 50 mA, respectively. Comparison with the
kinetic results found for flumequine decay (see Fig. 4) allows
concluding that the CeF bond of the drug is broken in the
attack of hydroxyl radicals. On the other hand, Fig. 7a and
b also evidences that in both processes, the initial N of
0
10
20
30
40
50
60
0
5
10
15
20
25
0 60 120 180 240 300 360 420time / min
a
b
[Car
boxy
lic a
cid]
/ m
g L
-1
Fig. 6 e Evolution of the concentration of carboxylic acids
generated during the (a) EF and (b) PEF degradations of
100 mL of 62 mg LL1 flumequine in 0.05 M Na2SO4 and
2.0 mM Fe2D at pH 3.0, 50 mA and 35 �C. Acid: (B) oxalic, (,)
oxamic, (>) malonic and (6) formic.
0
2
4
6
8
10
12
0
2
4
6
8
10
0 60 120 180 240 300 360 420time / min
a
b
[Ino
rgan
ic io
n] /
mg
L-1
Fig. 7 e Time course of the concentration of inorganic ions
released during the (a) EF and (b) PEF treatments of the
solutions of Fig. 6. Ion: (C) FL, (>) NO3L and (7) NH4
D.
wat e r r e s e a r c h 4 6 ( 2 0 1 2 ) 2 0 6 7e2 0 7 6 2073
75

flumequine (3.35 mg L�1) is converted into NO3� ion and in
much lesser extent into NH4þ ion. A higher concentration of
NO3� ion was accumulated in the final solution for PEF
(11.55 mg L�1) than for EF (10.50 mg L�1) owing to the higher
mineralization degree attained in the former process. This
phenomenon was relatively more significant for the NH4þ ion,
since it was more largely released in PEF (0.24 mg L�1) than in
EF (0.06 mg L�1), suggesting that UVA light promotes the
deamination process of intermediates during the degradation
process.
To better analyze the evolution of N during the EF and PEF
treatments of the drug, the TN of electrolyzed solutions was
determined. As can be seen in Fig. 8a and b, no change in TN
(3.35 mg L�1) was found during both treatments indicating
that all N is always present in the solution without losing of
volatileN-compounds. Amass balance of this heteroatomwas
then made considering that the drug yields unidentified
N-derivatives, oxamic acid and NO3� and NH4
þ ions. At the end
of EF (see Fig. 8a), the solution contained 0.91, 2.37 and
0.04 mg L�1 of N coming from the three latter species,
respectively, whose addition of 3.32 mg L�1 matches with the
initial N value of the drug. The same behaviour can be
observed in Fig. 8b for the final solution of PEF with a contri-
bution of 0.51, 2.61 and 0.18 mg L�1 of N from oxamic acid and
NO3� and NH4
þ ions, respectively. Taking this into account,
a similar evolution of unidentifiedN-derivativeswas found for
both treatments, disappearing in about 210 min of
electrolysis, as shown in Fig. 8a and b. This suggests that these
by-products are mainly removed under the action of gener-
ated hydroxyl radicals, although the low participation of UVA
light promotes slightly the deamination reactions, as stated
above.
4. Conclusions
It has been demonstrated that the PEF process allowed an
almost total mineralization with 94e96% TOC removal of
a flumequine solution near to saturation at pH 3.0, whereas
the EF process yielded a partial mineralization under compa-
rable conditions. The Fe2þ ion added played a double role,
since it formed an orange complex with the drug enhancing
its solubility and it also reacted with electrogenerated H2O2 to
form �OH from Fenton reaction (2). A Fe2þ concentration of
2.0 mMwas found optimal for the removal andmineralization
of flumequine. An increase in current accelerated both EF and
PEF degradations, but leading to lower efficiency due to the
enhancement of the parasitic reactions of generated hydroxyl
radicals. Comparative treatments using a real wastewater led
to similar degradation degrees with a little influence of NOM,
which was mainly oxidized by generated hydroxyl radicals.
The kinetics for flumequine decay always followed a pseudo-
first-order reaction with increasing rate constant as the
current raised. The degradation process involved the forma-
tion of short-aliphatic carboxylic acids like malonic, formic,
oxalic and oxamic acids. The complexes of Fe(III) with the two
former acids were rapidly destroyed with hydroxyl radicals in
both treatments. In contrast, Fe(III)eoxalate and Fe(III)eoxa-
mate complexes were very persistent under EF conditions,
being themain remaining species in the final treated solution.
Their quicker photodecomposition in PEF explains its higher
oxidation power, although a small proportion of very recalci-
trant unidentified by-products promoted by UVA irradiation
was formed, thus avoiding the total mineralization of flume-
quine. The initial F of the drug was rapidly and completely
converted into F� ion. Its N content was finally split into
oxamic acid, NO3� ion and in a much lesser extent NH4
þ ion,
without release of volatile N-compounds, as confirmed from
TN measurements.
Acknowledgements
The authors acknowledge the financial support from MICINN
(Ministerio de Ciencia e Innovacion, Spain) under the project
CTQ2010-16164/BQU, co-financed with FEDER funds.
S. Garcia-Segura thanks the grant awarded from MEC (Minis-
terio de Educacion y Ciencia, Spain) to do this work.
r e f e r e n c e s
Almeida, L.C., Garcia-Segura, S., Bocchi, N., Brillas, E., 2011. Solarphotoelectro-Fenton degradation of paracetamol using a flowplant with a Pt/air-diffusion cell coupled with a compound
0.0
0.5
1.0
1.5
2.0
2.5
3.0
3.5
0 60 120 180 240 300 360 420time / min
0.0
0.5
1.0
1.5
2.0
2.5
3.0
3.5
4.0
[Nit
roge
n] /
mg
L-1
b
a
Fig. 8 e Evolution of nitrogen in solution during the (a) EF
and (b) PEF experiments of Fig. 6. (d) Theoretical total
nitrogen, (6) experimental TN and nitrogen present in: (C)
flumequine, (>) NO3L ion, (7) NH4
D ion, (,) oxamic acid
and (-) unidentified N-derivatives.
wat e r r e s e a r c h 4 6 ( 2 0 1 2 ) 2 0 6 7e2 0 7 62074
76

parabolic collector: process optimization by response surfacemethodology. Applied Catalysis B: Environmental 103, 21e30.
Andreozzi, R., Marotta, R., Nicklas, P., 2003. Pharmaceuticals inSTP effluents and their solar photodegradation in aquaticenvironment. Chemosphere 50 (10), 1319e1330.
Balci, B., Oturan, N., Cherrier, R., Oturan, M.A., 2009. Degradationof atrazine in aqueous medium by electrocatalyticallygenerated hydroxyl radicals. A kinetic and mechanistic study.Water Research 43 (7), 1924e1934.
Bound, J.P., Voulvoulis, N., 2005. Household disposal ofpharmaceuticals as a pathway for aquatic contamination inthe United Kingdom. Environmental Health Perspectives 113(12), 1705e1711.
Brillas, E., Banos, M.A., Camps, S., Arias, C., Cabot, P.L.,Garrido, J.A., Rodrıguez, R.M., 2004. Catalytic effect of Fe2þ,Cu2þ and UVA light on the electrochemical degradation ofnitrobenzene using an oxygen-diffusion cathode. New Journalof Chemistry 28 (2), 314e322.
Brillas, E., Sires, I., Oturan, M.A., 2009. Electro-Fenton process andrelated electrochemical technologies based on Fenton’sreaction chemistry. Chemical Reviews 109 (12), 6570e6631.
Brillas, E., Garcia-Segura, S., Skoumal, M., Arias, C., 2010.Electrochemical incineration of diclofenac in neutral aqueousmedium by anodic oxidation using Pt and boron-dopeddiamond anodes. Chemosphere 79 (6), 605e612.
Burridge, L., Weis, J.S., Cabello, F., Pizarro, J., Bostick, K., 2010.Chemical use in salmon aquaculture: a review of currentpractices and possible environmental effects. Aquaculture 306(1e4), 7e23.
Canizares, P., Beteta, A., Saez, C., Rodrıguez, L., Rodrigo, M.A.,2008. Use of electrochemical technology to increase thequality of the effluents of bio-oxidation processes. A casestudied. Chemosphere 72 (7), 1080e1085.
Crane, M., Watts, C., Boucard, T., 2006. Chronic aquaticenvironmental risks from exposure to humanpharmaceuticals. Science of the Total Environment 367 (1),23e41.
Garcia-Segura, S., Brillas, E., 2011. Mineralization of therecalcitrant oxalic and oxamic acids by electrochemicaladvanced oxidation processes using a boron-doped diamondanode. Water Research 45 (9), 2975e2984.
Guinea, E., Garrido, J.A., Rodrıguez, R.M., Cabot, P.L., Arias, C.,Centellas, F., Brillas, E., 2010. Degradation of thefluoroquinolone enrofloxacin by electrochemical advancedoxidation processes based on hydrogen peroxideelectrogeneration. Electrochimica Acta 55 (6), 2101e2105.
Halling-Sørensen, B., 2000. Algal toxicity of antibacterial agentsused in intensive farming. Chemosphere 40 (7), 731e739.
Hamza, M., Abdelhedi, R., Brillas, E., Sires, I., 2009. Comparativeelectrochemical degradation of the triphenylmethane dyemethyl violet with boron-doped diamond and Pt anodes.Journal of Electroanalytical Chemistry 627 (1e2), 41e50.
Homem, V., Santos, L., 2011. Degradation and removal methodsof antibiotics from aqueous matrices e a review. Journal ofEnvironmental Management 92 (10), 2304e2347.
Jarnheimer, P., Ottoson, J., Lindberg, R., Stenstrom, T.,Johansson, M., Tysklind, M., Winner, M., Olsen, B., 2004.Fluoroquinolone antibiotics in a hospital sewage line;occurrence, distribution and impact on bacterial resistance.Scandinavian Journal of Infectious Diseases 36 (10), 725e755.
Karthikeyan, K.G., Meyer, M.T., 2006. Occurrence of antibiotics inwastewater treatment facilities in Wisconsin, USA. Science ofthe Total Environment 361 (1e3), 196e207.
Khataee, A.R., Zarei, M., Asl, S.K., 2010. Photocatalytic treatmentof a dye solution using immobilized TiO2 nanoparticlescombined with photoelectro-Fenton process: optimization ofoperational parameters. Journal of ElectroanalyticalChemistry 648 (2), 143e150.
Khataee, A.R., Safarpour, M., Zarei, M., Aber, S., 2011.Electrochemical generation of H2O2 using immobilized carbonnanotubes on graphite electrode fed with air: investigation ofoperational parameters. Journal of ElectroanalyticalChemistry 659 (1), 63e68.
Kim, I., Yamashita, N., Tanaka, H., 2009. Photodegradation ofpharmaceuticals and personal care products during UV andUV/H2O2 treatments. Chemosphere 77 (4), 518e525.
Klamerth, N., Malato, S., Maldonado, M.I., Aguera, A., Fernandez-Alba, A., 2011. Modified photo-Fenton for degradation ofemerging contaminants in municipal wastewater effluents.Catalysis Today 161 (1), 241e246.
Kummerer, K., 2009. Antibiotics in the aquatic environment ea review e Part I. Chemosphere 75 (4), 417e434.
Li, H., Helm, P.A., Metcalfe, C.D., 2010. Sampling in the GreatLakes for pharmaceuticals, personal care products andendocrine-disrupting substances using the passive polarorganic chemical integrative sampler. EnvironmentalToxicology & Chemistry 29 (4), 751e762.
Lin, C.E., Deng, Y.J., Liao, W.S., Sun, S.W., Lin, W.Y., Chen, C.C.,2004. Electrophoretic behavior and pKa determination ofquinolones with a piperazinyl substituent by capillary zoneelectrophoresis. Journal of Chromatography A 1051 (1e2),283e290.
Marselli, B., Garcıa-Gomez, J., Michaud, P.A., Rodrigo, M.A.,Comninellis, Ch, 2003. Electrogeneration of hydroxyl radicalson boron-doped diamond electrodes. Journal of theElectrochemical Society 150 (3), D79eD83.
McClellan, K., Halden, R.U., 2010. Occurrence and loss over threeyears of 72 pharmaceuticals and personal care products frombiosolidsesoil mixtures in outdoor mesocosms. WaterResearch 44 (20), 6011e6020.
Migliore, L., Civitareale, C., Brambilla, G., Di Delupis, G.D., 1997.Toxicity of several important agricultural antibiotics toArtemia. Water Research 37 (7), 1801e1806.
Miranda-Garcıa, N., Suarez, S., Sanchez, B., Coronado, J.M.,Malato, S., Maldonado, M.I., 2011. Photocatalytic degradationof emerging contaminants in municipal wastewatertreatment plant effluents using immobilized TiO2 in a solarpilot plant. Applied Catalysis B: Environmental 103 (3e4),294e301.
Munoz, I., Martınez-Bueno, M.J., Aguera, A., Fernandez-Alba, A.R.,2010. Environmental and human health risk assessment oforganic micro-pollutants occurring in a Spanish marine fishfarm. Environmental Pollution 158 (5), 1809e1816.
Naviner, M., Gordon, L., Giraud, E., Denis, M., Mangion, C., LeBris, H., Ganiere, J.P., 2011. Antimicrobial resistance ofAeromonas spp. isolated from the growth pond to thecommercial product in a rainbow trout farm followinga flumequine treatment. Aquaculture 315 (3e4), 236e241.
Nieto, J., Freer, J., Contreras, D., Candal, R.J., Sileo, E.E.,Mansilla, H.D., 2008. Photocatalyzed degradation offlumequine by doped TiO2 and simulated solar light. Journal ofHazardous Materials 155 (1e2), 45e50.
Oturan, M.A., Pimentel, M., Oturan, N., Sires, I., 2008. Reactionsequence for the mineralization of the short-chain carboxylicacids usually formed upon cleavage of aromatics duringelectrochemical Fenton treatment. Electrochimica Acta 54 (2),173e182.
Oturan, N., Zhou, M., Oturan, M.A., 2010. Metomyl degradation byelectro-Fenton and electro-Fenton-like processes: a kineticsstudy of the effect of the nature and concentration of sometransition metal ions as catalyst. Journal of PhysicalChemistry A 114 (39), 10605e10611.
Ozcan, A., Oturan, N., Sahin, Y., Oturan, M.A., 2010. Electro-Fenton treatment of aqueous clopyralid solutions.International Journal of Environmental Analytical Chemistry90 (3e6), 478e486.
wat e r r e s e a r c h 4 6 ( 2 0 1 2 ) 2 0 6 7e2 0 7 6 2075
77

Panizza, M., Cerisola, G., 2009. Direct and mediated anodicoxidation of organic pollutants. Chemical Reviews 109 (12),6541e6569.
Pomati, F., Orlandi, C., Clerici, M., Luciani, F., Zuccato, E., 2008.Effects and interactions in an environmentally relevantmixture of pharmaceuticals. Toxicological Sciences 102 (1),129e137.
Postigo, C., Lopez de Alda, M.J., Barcelo, D., 2009. Drugs of abuseand their metabolites in the Ebro River basin: occurrence insewage and surface water, sewage treatment plants removalefficiency, and collective drug usage estimation. EnvironmentInternational 36 (1), 75e84.
Pouliquen, H., Delepee, R., Larhantec-Verdier, M., Morvan, M.L.,Le Bris, H., 2007. Comparative hydrolysis and photolysis offour antibacterial agents (oxytetracycline oxolinic acid,flumequine and florfenicol) in deionised water, freshwaterand seawater under abiotic conditions. Aquaculture 262 (1),23e28.
Rosal, R., Rodrıguez, A., Perdigon-Melon, J.A., Mezcua, M.,Hernando, M.D., Leton, P., Garcıa-Calvo, E., Aguera, A.,Fernandez-Alba, A.R., 2008. Removal of pharmaceuticals andkinetics of mineralization by O3/H2O2 in a biotreatedmunicipal wastewater. Water Research 42 (14), 3719e3728.
Rozas, O., Contreras, D., Mondaca, A., Perez-Moya, M.,Mansilla, H.D., 2010. Experimental design of Fenton andphoto-Fenton reactions for the treatment of ampicillinsolutions. Journal of Hazardous Materials 177 (1e3),1025e1030.
Serra, A., Domenech, X., Arias, C., Brillas, E., Peral, J., 2009.Oxidation of a-methylphenylglycine under Fenton andelectro-Fenton conditions in the dark and in the presenceof solar light. Applied Catalysis B: Environmental 89 (1e2),12e21.
Sires, I., Cabot, P.L., Centellas, F., Garrido, J.A., Rodrıguez, R.M.,Arias, C., Brillas, E., 2006. Electrochemical degradation ofclofibric acid in water by anodic oxidation. Comparative studywith platinum and boron-doped diamond electrodes.Electrochimica Acta 52 (1), 75e85.
Sires, I., Centellas, F., Garrido, J.A., Rodrıguez, R.M., Arias, C.,Cabot, P.L., Brillas, E., 2007. Mineralization of clofibric acid byelectrochemical advanced oxidation processes using a boron-
doped diamond anode and Fe2þ and UVA light as catalysts.Applied Catalysis B: Environmental 72 (3e4), 373e381.
Sires, I., Oturan, N., Oturan, M.A., 2010. Electrochemicaldegradation of b-blockers. Studies on single andmulticomponent synthetic aqueous solutions. Water Research44 (10), 3109e3120.
Skoumal, M., Cabot, P.L., Centellas, F., Arias, C., Rodrıguez, R.M.,Garrido, J.A., Brillas, E., 2006. Mineralization of paracetamol byozonation catalyzed with Fe2þ, Cu2þ and UVA light. AppliedCatalysis B: Environmental 66 (3e4), 228e240.
Skoumal, M., Arias, C., Cabot, P.L., Centellas, F., Garrido, J.A.,Rodrıguez, R.M., Brillas, E., 2008. Mineralization of the biocidechloroxylenol by electrochemical advanced oxidationprocesses. Chemosphere 71 (9), 1718e1729.
Skoumal, M., Rodrıguez, R.M., Cabot, P.L., Centellas, F.,Garrido, J.A., Arias, C., Brillas, E., 2009. Electro-Fenton, UVAphotoelectro-Fenton and solar photoelectro-Fentondegradation of the drug ibuprofen in acid aqueous mediumusing platinum and boron-doped diamond. ElectrochimicaActa 54 (7), 2077e2085.
Song, S., Liu, Z., He, Z., Li, Y., Chen, J., Li, C., 2009. Degradation ofthe biocide 4-chloro-3,5-dimethylphenol in aqueous mediumwith ozone in combination with ultraviolet irradiation:operating conditions influence andmechanism. Chemosphere77 (8), 1043e1051.
Tamtam, F., Mercier, F., Le Bot, B., Eurin, J., Dinh, Q.T.,Clement, M., Chevreuil, M., 2008. Occurrence and fate ofantibiotics in the Seine River in various hydrologicalconditions. Science of the Total Environment 393 (1), 84e95.
Vieno, N., Tuhkanen, T., Kronberg, L., 2007. Elimination ofpharmaceuticals in sewage treatment plants in Finland. WaterResearch 41 (5), 1001e1012.
Wang, P., He, Y.L., Huang, C.H., 2010. Oxidation offluoroquinolone antibiotics and structurally related amines bychlorine dioxide: reaction kinetics, product and pathwayevaluation. Water Research 44 (20), 5989e5998.
Zarei, M., Khataee, A.R., Ordijhani-Sevedlar, R., Fathinia, M., 2010.Photoelectro-Fenton combined with photocatalytic processfor degradation of an azo dye using supported TiO2
nanoparticles and carbon nanotube cathode: neural networkmodeling. Electrochimica Acta 55 (24), 7259e7265.
wat e r r e s e a r c h 4 6 ( 2 0 1 2 ) 2 0 6 7e2 0 7 62076
78

Results and Discussion
���
PAPER 2
Mineralization of the antibiotic
chloramphenicol by solar photoelectro-
Fenton: From stirred tank reactor to
solar pre-pilot plant

Results and Discussion �
���

Applied Catalysis B: Environmental 144 (2014) 588– 598
Contents lists available at ScienceDirect
Applied Catalysis B: Environmental
jo ur nal home p ag e: www.elsev ier .com/ locate /apcatb
Mineralization of the antibiotic chloramphenicol by solar
photoelectro-Fenton.
From stirred tank reactor to solar pre-pilot plant
Sergi Garcia-Seguraa, Eliane Bezerra Cavalcantib, Enric Brillasa,∗
a Laboratori d’Electroquímica dels Materials i del Medi Ambient, Departament de Química Física, Facultat de Química, Universitat de Barcelona,
Martí i Franquès 1-11, 08028 Barcelona, Spainb Instituto de Tecnologia e Pesquisa/ITP, Universidade Tiradentes/UNIT, Av. Murilo Dantas 300, CEP 49032-490 Aracaju, SE, Brazil
a r t i c l e i n f o
Article history:
Received 2 July 2013
Received in revised form 27 July 2013
Accepted 30 July 2013
Available online xxx
Keywords:
Antibiotics
Oxidation products
Solar photoelectro-Fenton
Solar photolysis
Water treatment
a b s t r a c t
Chloramphenicol is a widely used broad-spectrum antibiotic, which has been detected as emerging
pollutant in natural waters. The mineralization of this drug in a synthetic sulfate solution of pH 3.0
has been studied by anodic oxidation with electrogenerated H2O2 (AO-H2O2), electro-Fenton (EF), UVA
photoelectro-Fenton (PEF) and solar photoelectro-Fenton (SPEF). Comparative electrolyses carried out
with 100 mL stirred tank reactors equipped with a boron-doped diamond (BDD) or Pt anode and an air-
diffusion cathode at constant current density showed the superiority of the processes with BDD because of
the higher oxidation ability of •OH formed from water oxidation at the BDD surface. Total mineralization
was rapidly reached for the most potent treatment of SPEF with BDD due to the additional oxidation by•OH produced from Fenton’s reaction between added Fe2+ (0.5 mM) and H2O2 generated at the cathode,
together the synergistic photolytic action of sunlight, much more intense than the 6 W UVA lamp used
in PEF. Chloramphenicol decay always followed a pseudo-first-order kinetics. The influence of current
density and substrate concentration on SPEF with BDD was examined. Nine aromatic products, thirteen
hydroxylated derivatives and seven carboxylic acids were identified by different chromatographic tech-
niques. While the initial Cl of the drug was released as chloride ion, its initial N was lost as nitrate ion
and, in smaller proportion, as ammonium ion. From the detected products, a general reaction pathway
for chloramphenicol mineralization is proposed. The viability of SPEF was confirmed in a 10 L pre-pilot
plant with a Pt/air-diffusion filter-press reactor coupled to a solar CPCs photoreactor. After 180 min of
electrolysis at 100 mA cm−2, a 245 mg L−1 chloramphenicol solution in 0.05 M Na2SO4 with 0.5 mM Fe2+
at pH 3.0 underwent 89% mineralization with 36% current efficiency and 30.8 kWh m−3 energy cost.
© 2013 Elsevier B.V. All rights reserved.
1. Introduction
Recently, there exists an increasing attention on pharmaceut-
icals as potential bioactive chemicals in the aquatic environment.
Many pharmaceutical drugs have been detected at relatively low
contents up to �g L−1 level in soils, surface waters, ground waters
and even drinking waters [1–3]. Antibiotics are the most commonly
drugs found in the aquatic environment because their antimi-
crobial nature prevents effective removal in sewage treatment
plants [4–6]. The occurrence and fate of antibiotics as well as their
metabolites in water streams is recognized as one of the emerg-
ing issues in environmental chemistry [1,3,7,8]. Several authors
reported that these pollutants can produce multi-resistant strains
of microorganisms, can affect the endocrine systems of fishes
∗ Corresponding author. Tel.: +34 93 4021223; fax: +34 93 4021231.
E-mail address: [email protected] (E. Brillas).
and invertebrates, and are toxic on small invertebrates and algae
[9–12]. Powerful oxidation treatments then need to be developed
for the removal of antibiotics from waters and wastewaters to
avoid their potential adverse health effects on humans and ani-
mals.
Several electrochemical advanced oxidation processes (EAOPs)
are being currently developed for water prevention [12–17]. EAOPs
are based on the in situ generation of hydroxyl radical (•OH), which
is the second strongest oxidant known after fluorine since it has
so high standard reduction potential (E◦(•OH/H2O) = 2.80 V/SHE)
that can non-selectively react with organic pollutants up to their
mineralization to CO2, water and inorganic ions. The most potent
EAOPs use both, heterogeneous and homogeneous •OH formed
at the anode and in the solution bulk, respectively, as oxidiz-
ing agents. Mediated electro-oxidation with homogeneous •OH is
usually achieved by decomposition of H2O2 generated from the
two-electron cathodic reduction of injected O2 [12,16]:
O2 + 2H+ + 2e−→ H2O2 (1)
0926-3373/$ – see front matter © 2013 Elsevier B.V. All rights reserved.http://dx.doi.org/10.1016/j.apcatb.2013.07.071
81

S. Garcia-Segura et al. / Applied Catalysis B: Environmental 144 (2014) 588– 598 589
Good efficiencies for H2O2 generation from reaction (1) have
been reported for carbonaceous cathodes such as carbon sponge
[18], carbon nanotubes-polytetrafluoroethylene (PTFE) [19,20],
carbon-felt [18,21–25], graphite-felt [26], boron-doped diamond
(BDD) [27] and carbon-PTFE gas (O2 or air) diffusion electrodes
[21,22,28–32].
In our laboratory, we have checked the good oxidation
ability of EAOPs like anodic oxidation with electrogenerated
H2O2 (AO-H2O2) [28,32], electro-Fenton (EF) [21,22,28–31], UVA
photoelectro-Fenton (PEF) [28–30] and solar photoelectro-Fenton
(SPEF) [29,31] to destroy several antibiotics and other drugs in
acidic solutions using small stirred tank reactors equipped with
either a BDD or Pt anode and a gas-diffusion cathode. Our inter-
est is to show that these EAOPs can be useful for the treatment
of wastewaters contaminated with antibiotics. To do this and in
view of the large variety of these drugs, it is necessary to know
the degradative characteristics of more compounds. In this way,
the scaling-up of EAOPs to a pre-pilot plant also needs to be
assessed in order to demonstrate their possible viability at indus-
trial level.
This paper aims to investigate the mineralization of the
antibiotic chloramphenicol (2,2-dicloro-N-[1,3-dihydroxy-1-(4-
nitrophenyl)propan-2-yl] acetamide) in acidic medium by AO-
H2O2, EF, PEF and SPEF in order to clarify: (i) the role of generated•OH in the degradative processes using stirred Pt/air-diffusion and
BDD/air-diffusion tank reactors of 100 mL under comparable con-
ditions, (ii) the photolytic action of UVA and solar radiation in these
systems, (iii) the effect of experimental parameters on substrate
decay and mineralization rate, (iv) the products formed and their
evolution to propose a general reaction pathway for chloramphen-
icol mineralization and (v) the viability of SPEF in a 10 L pre-pilot
plant with a Pt/air-diffusion filter-press reactor coupled to a solar
compound parabolic collectors (CPCs) photoreactor. Note that
chloramphenicol is a broad-spectrum antibiotic, which is effective
against a wide variety of Gram-positive and Gram-negative bacte-
ria, including most anaerobic organisms. While in the developed
countries it is currently prescribed only to treat bacterial conjunc-
tivitis, chloramphenicol is widely used in developing countries.
For this reason, it has been detected worldwide in ground waters,
lakes, rivers and influents and effluents of sewage treatment
plants [3,6–8,33–36]. However, less is known about the degrada-
tion of chloramphenicol from waters and its oxidation products
formed from •OH attack have not been identified yet. It has been
reported that it can be removed by UVC radiation [37], TiO2/UV
photocatalysis [38] and ozonation [39]. The electrochemical reduc-
tion of its nitro group to hydroxylamine or amine at a graphite
cathode has also been described by means of cyclic voltammetry
[40].
2. Experimental
2.1. Chemicals
Chloramphenicol (98% purity) was of reagent grade from
Sigma–Aldrich. Carboxylic acids were of reagent grade from
Panreac and Avocado. Anhydrous sodium sulfate and heptahy-
drated ferrous sulfate were of analytical grade from Fluka.
Solutions treated in the stirred tank reactor were prepared with
ultrapure water obtained from a Millipore Milli-Q system (resis-
tivity > 18 M� cm at 25 ◦C). Solutions of 10 L to be degraded in
the solar pre-pilot plant were prepared with deionized water. All
solutions were adjusted to pH 3.0 with analytical grade sulfu-
ric acid purchased from Merck. Other chemicals employed were
of LC–MS, HPLC or analytical grade from Merck, Panreac and
Sigma–Aldrich.
2.2. Electrochemical and photoelectrochemical systems
Experiments with 100 mL solutions were conducted in an undi-
vided and cylindrical stirred tank reactor, with a double jacket in
which external water circulated to maintain the solution temper-
ature at 35 ◦C. The anode was either a BDD thin film electrode
provided by Adamant Technologies or a Pt sheet of 99.99% purity
supplied by SEMPSA. The cathode was a carbon-PTFE air-diffusion
electrode purchased from E-TEK. The preparation of this cathode
was described elsewhere [41] and was fed with air pumped at
300 mL min−1 for H2O2 generation from reaction (1). The area of
both electrodes was 3 cm2 and the interelectrode gap was ca. 1 cm.
To remove the impurities of the BDD surface and activate the air-
diffusion cathode prior use, they were polarized in 0.05 M Na2SO4 at
100 mA cm−2 for 60 min. All trials were carried out under vigorous
stirring with a magnetic bar at 800 rpm to ensure homogenization
and the transport of reactants toward/from the electrodes. For the
PEF assays, a Philips 6-W black light blue tube was placed at 7 cm
above the solution. This lamp emitted UVA light between 320 and
400 nm with �max = 360 nm, yielding a photoionization energy of
5 W m−2 as detected with a Kipp & Zonen CUV 5 global UV radiome-
ter. In the SPEF assays, the tank reactor was directly exposed to solar
radiation with a mirror placed at its bottom to better collect the sun
rays.
A scheme of the solar pre-pilot plant operating in batch circula-
tion mode was presented elsewhere [42]. For each EF or SPEF trial,
the solution was introduced in the reservoir and continuously recir-
culated by a peristaltic pump at a flow rate of 200 L h−1 adjusted by
a rotameter. The temperature was maintained at 35 ◦C by two heat
exchangers. The electrolytic cell was an undivided filter-press reac-
tor equipped with a Pt sheet anode from SEMPSA and a carbon-PTFE
air-diffusion cathode from E-TEK. A PVC liquid compartment with
a central window of 9.5 cm × 9.5 cm (90.2 cm2) was used to con-
tact the effluent with the outer faces of both electrodes, separated
1.2 cm. The inner face of the cathode was pressed to a Ni mesh as
electrical connector in contact with a PVC gas chamber where cir-
culated compressed air at a flow rate of 4.5 L min−1 regulated with
a back-pressure gauge. The solar CPCs photoreactor with an area
of 0.4 m2 and concentration factor of 1 was composed of twelve
borosilicate-glass tubes of 50.5 cm length × 1.82 cm inner diame-
ter (irradiated volume 1.57 L), with connecting tubing and valves
mounted in an aluminum frame on a platform tilted 41◦ to better
collect the direct sun rays in our laboratory of Barcelona (latitude:
41◦21′N, longitude: 2◦10′E). In EF, the solar CPCs photoreactor was
coated with a black plastic.
All solar trials were made for 240 min as maximal in sunny
and clear days during summer 2012. The average solar UV radi-
ation intensity (between 300 and 400 nm) was 30–32 W m−2, as
measured with a Kipp & Zonen CUV 5 global UV radiometer.
2.3. Apparatus and analytical procedures
The solution pH was measured with a Crison GLP 22 pH-
meter. Galvanostatic electrolyses were performed with an Amel
2051 potentiostat–galvanostat for the tank reactor experiences
and a Grelco GDL3020 power supply for the assays with the
solar pre-pilot plant. Aliquots of 1 mL were withdrawn from elec-
trolyzed solutions and filtered with 0.45 �m PTFE filters from
Whatman before analysis. The mineralization of chlorampheni-
col solutions was monitored from their dissolved organic carbon
(DOC) abatement, determined on a Shimadzu TOC-VCSN analyzer.
Reproducible DOC values with an accuracy of ±1% were obtained
by injecting 50 �L aliquots to the analyzer. Total nitrogen (TN) was
determined with a Shimadzu TNM-1 unit coupled with the TOC
analyzer.
82

590 S. Garcia-Segura et al. / Applied Catalysis B: Environmental 144 (2014) 588– 598
The chloramphenicol decay was followed by reversed-phase
HPLC using a Waters 600 LC fitted with a Spherisorb ODS2 5 �m
(150 mm × 4.6 mm) column at 35 ◦C and coupled with a Waters
996 photodiode array detector selected at � = 278.2 nm. Carboxylic
acids were detected by ion-exclusion HPLC using the above LC fit-
ted with a Bio-Rad Aminex HPX 87H (300 mm × 7.8 mm) column
at 35 ◦C and the photodiode array detector set at � = 210 nm. In
the HPLC measurements, 20 �L aliquots were injected into the
chromatograph and the mobile phase was either a 20:80 (v/v)
acetonitrile/phosphate buffer (pH = 3.5) mixture at 0.4 mL min−1
for reversed-phase HPLC or 4 mM H2SO4 at 0.6 mL min−1 for
ion-exclusion HPLC. The inorganic ions were quantified by ion
chromatography using a Shimadzu 10 Avp HPLC coupled with
a Shimadzu CDD 10 Avp conductivity detector. The NH4+ con-
tent was obtained with a Shodex IC YK-421 (125 mm × 4.6 mm)
cation column at 40 ◦C, whereas the NO3− and Cl− contents were
determined with a Shim-Pack IC-A1S (100 mm × 4.6 mm) anion
column at 40 ◦C. These analyses were made by injecting 25 �L
aliquots and using mobile phases composed of a 5.0 mM tar-
taric acid, 1.0 mM dipicolinic acid, 24.2 mM boric acid and 1.5 mM
crown ether solution at 0.8 mL min−1 for NH4+ and a 2.4 mM
tris(hydroxymethyl)aminomethane and 2.5 mM phthalic acid solu-
tion of pH 4.0 at 1.5 mL min−1 for NO3− and Cl−.
Products formed after 5–20 min of EF treatment of a 245 mg L−1
chloramphenicol solution in a BDD/air-diffusion tank reactor at
33.3 mA cm−2 were identified by LC–MS using a Shimadzu SIL-20AC
LC coupled to a Shimadzu LCMS-2020 MS. The LC was fitted with
a Teknokroma Mediterranean Sea C-18 3 �m (15 mm × 0.46 mm)
column at 30 ◦C. The MS operated in the negative and positive
modes with electrospray source ionization (ESI), by applying an
interface voltage of −4.5 and 4.5 kV, respectively, and 60 V Q-array
RF voltage. The DL temperature was 250 ◦C and pure N2 was used
as nebulising and dryer gas. Mass spectra were collected in the m/z
range 50–420 using total ion current (TIC) acquisition. For these
analyses, 15 �L aliquots were introduced into the LC, previously
filtered with a Millipore filter of 0.22 �m, and the mobile phase
was a 75:25 (v/v) acetonitrile/water (5.0 mM ammonium acetate)
mixture at 0.2 mL min−1.
3. Results and discussion
3.1. Comparative mineralization of chloramphenicol by EAOPs in
a stirred tank reactor
The relative oxidation ability of AO-H2O2, EF, PEF and SPEF to
destroy chloramphenicol was assessed by electrolyzing 100 mL of
a synthetic solution with 245 mg L−1 drug (100 mg L−1 of DOC) and
0.05 M Na2SO4 at pH 3.0 using stirred Pt/air-diffusion and BDD/air-
diffusion tank reactors at 33.3 mA cm−2 and 35 ◦C. The pH of 3.0
was chosen because it was found optimal for the treatment of other
aromatics by these EAOPs [12,28–31] and treatments were made
at 35 ◦C since this is the maximum temperature allowed in the
open tank reactor without significant water evaporation from the
solution during prolonged electrolysis [41]. For EF, PEF and SPEF,
0.5 mM Fe2+ was also added to the solution, which is the best cata-
lyst concentration found for these processes under the conditions
tested [28–31]. The chloramphenicol concentration checked was
much higher than the usually detected in wastewaters, simply to
better evaluate its mineralization behavior and identify its degra-
dation products, as will be discussed below. In all these trials, the
solution pH remained practically unchanged and decayed to val-
ues 2.7–2.8 after 360 min of the longer treatments, probably due to
the formation of acidic products like short-chain carboxylic acids
[12,16]. The cell voltage for BDD (17.0 V) was much higher than for
Pt (8.3 V).
0.0
0.2
0.4
0.6
0.8
1.0
DO
C / D
OC
0
0.0
0.2
0.4
0.6
0.8
1.0
0
20
40
60
80
100
0 60 120 180 240 300 360 420
Time / min
% M
CE
a
b
c
Fig. 1. Normalized DOC abatement with electrolysis time for the (©, �) AO-H2O2,
(�, �) EF, (�, �) PEF with a 6 W UVA light and (�, �) SPEF treatment of 100 mL of
245 mg L−1 chloramphenicol in 0.05 M Na2SO4 at pH 3.0, 33.3 mA cm−2 and 35 ◦C. In
the three latter methods, the solution also contained 0.5 mM Fe2+. (a) Pt/air-diffusion
and (b) BDD/air-diffusion tank reactor. Plot (c) presents the mineralization current
efficiency for the trials.
Fig. 1a and b depicts the change of normalized DOC for the
above trials. For each EAOP, the chloramphenicol solution was
more rapidly mineralized using a BDD than a Pt anode. In both
systems, the relative oxidation ability of processes rose following
the sequence AO-H2O2 < EF < PEF < SPEF. The lowest mineralization
was achieved for AO-H2O2 because organics can only be slowly
degraded by physisorbed Pt(•OH) or BDD(•OH) radicals formed
from water oxidation at the Pt or BDD anode surface by reactions
(2) and (3), respectively [15,28]:
Pt + H2O → Pt(•OH) + H+ + e− (2)
BDD + H2O → BDD(•OH) + H+ + e− (3)
The expected higher oxidation ability of BDD(•OH) than Pt(•OH)
[15] then explains that the solution became more largely mineral-
ized with a BDD anode. In fact, DOC was not practically removed
83

S. Garcia-Segura et al. / Applied Catalysis B: Environmental 144 (2014) 588– 598 591
in the Pt/air-diffusion tank reactor (see Fig. 1a), whereas it was
reduced by 78% at 360 min in the BDD/air-diffusion one (see Fig. 1b).
The mineralization rate of chloramphenicol increased in EF owe
to the additional oxidative action of large amounts of •OH pro-
duced in the bulk from Fenton’s reaction (4) between added Fe2+
and electrogenerated H2O2 [12,16,23,29]:
Fe2+ + H2O2→ Fe3+ + •OH + OH− (4)
This reaction is catalytic and can be continuously propagated
mainly from Fe3+ reduction to Fe2+ at the cathode. The fast reac-
tion of organics with •OH can be confirmed in Fig. 1a, showing
that DOC decayed up to 65% at the end of EF with Pt. The same
behavior can be seen in Fig. 1b for EF with BDD, although in this
case 81% of DOC was finally removed, a value very close to that of
AO-H2O2 treatment. This can be related to the formation of Fe(III)-
carboxylate complexes that are hardly destroyed by BDD(•OH) and•OH [21,28–31].
The chloramphenicol mineralization was more largely acceler-
ated under UVA radiation with a 6-W light in PEF. This synergistic
action can be related to two phenomena: (i) the photolysis of
Fe(OH)2+, the pre-eminent Fe3+ species near pH 3, regenerating Fe2+
and producing more •OH from reaction (5) and (ii) the photodecar-
boxylation of some generated Fe(III)-carboxylate species according
to the general reaction (6) [12,16].
Fe(OH)2+ + h� → Fe2+ + •OH (5)
Fe(OOCR)2+ + h� → Fe2+ + CO2 + R• (6)
The quick photolysis of Fe(III)-carboxylate species can then jus-
tify the almost total mineralization (96% DOC decay) and total
mineralization (99% DOC decay) found for PEF with Pt and BDD,
respectively. Fig. 1a and b also shows that the use of SPEF is much
more effective, attaining total mineralization (98% DOC abate-
ment) at 180 and 120 min of electrolysis using the Pt/air-diffusion
and BDD/air-diffusion tank reactors, respectively. The greater UVA
intensity of sunlight (about 30 W m−2) in SPEF than of the 6-W
lamp (5 W m−2) in PEF can justify the superiority of the former pro-
cess. The highest oxidation ability of SPEF with BDD is then due to
the quickest destruction of organics under the synergistic action of
BDD(•OH), •OH and sunlight.
For the above trials, the corresponding mineralization current
efficiency (MCE) at given electrolysis time (t, in h) was estimated
by the following equation [29]:
MCE(%) = nFVs �(DOC)exp
4.32 × 10⁷mIt100 (7)
where F is the Faraday constant (96487 C mol−1), Vs is the solu-
tion volume (L), �(DOC)exp is the experimental DOC decay
(mg L−1), 4.32 × 10⁷ is a conversion factor to homogenize units
(3600 s h−1 × 12,000 mg mol−1), m is the number of carbon atoms
of chloramphenicol (11 carbon atoms) and I is the applied cur-
rent (A). The number n of electrons consumed per chloramphenicol
molecule was taken as 54 from reaction (8) considering its mineral-
ization to CO2 with loss of NO3− and Cl− as main primary inorganic
ions, as discussed below.
C11H12N2Cl2O5 + 23H2O →11CO2 + 2NO3
− + 2Cl−+58H+ + 54e− (8)
Fig. 1c highlights the rise in MCE of the EAOPs tested in each
system according to their relative oxidation ability, as well as the
greater efficiency for all processes with BDD compared with the
corresponding treatments with Pt. As expected, SPEF with BDD led
to the highest MCE, with a maximum value near 100% between 45
and 60 min of electrolysis, further diminishing to 53% at 120 min.
0
50
100
150
200
250
0 60 120 180 240 300 360 420
Time / min
[Ch
lora
mp
he
nic
ol]
/ m
g L-1
Fig. 2. Chloramphenicol concentration decay vs electrolysis time for the (©,�) AO-
H2O2 and (�) SPEF degradations under the conditions of Fig. 1 using a (©) Pt/air-
diffusion or (�, �) BDD/air-diffusion tank reactor.
For most processes, maximum efficiency at short time, followed by
its progressive loss with prolonging electrolysis, was also found.
This decay in MCE can be accounted for by the presence of less
organic matter as well as the gradual formation of more difficultly
oxidizable products like short-chain carboxylic acids [12,15,16].
The role of Pt(•OH), BDD(•OH) and •OH was clarified by
determining the kinetics of chloramphenicol decay in the
above treatments by reversed-phase HPLC, where it displayed
a well-defined peak with retention time (tr) of 8.05 min. Blank
experiments under direct UVA radiation without electrolysis cor-
roborated that the drug was not directly photolyzed. Fig. 2
evidences a very slow removal of chloramphenicol concentration
under the action of Pt(•OH), only passing from 245 to 118 mg L−1
in 360 min, whereas at the same time it was practically completely
removed by BDD(•OH). This behavior confirms the much higher
oxidation ability of BDD(•OH) in front of Pt(•OH) to destroy chlor-
amphenicol and its oxidation products. Kinetic analysis of these
concentration decays showed that they fit well with a pseudo-
first-order reaction (data not shown), yielding an apparent rate
constant (k1) of 3.0 × 10⁻⁵ s−1 (R2 = 0.981) for AO-H2O2 with Pt,
which rose to 1.4 × 10⁻⁴ s−1 (R2 = 0.995) for AO-H2O2 with BDD.
In contrast, chloramphenicol was much more rapidly removed and
with a quite similar rate operating with EF, PEF and SPEF, regardless
of the anode used. In all these treatments, the drug disappeared in
about 27 min, as exemplified in Fig. 2 for SPEF with BDD. The k1
value obtained for the pseudo-first-order kinetics followed by this
trial was 2.9 × 10⁻³ s−1 (R2 = 0.998). All these findings demonstrate
the preponderant action of •OH formed from Fenton’s reaction (4)
to oxidize not only the substrate, but also the aromatic species that
are expected to be generated as its primary products. Besides, the
similar decay kinetics determined for EF, PEF and SPEF indicates a
low participation of photolytic reaction (5) to produce •OH in the
two latter EAOPs. The fact that chloramphenicol is always removed
following a pseudo-first-order kinetics suggests its reaction with
a constant concentration of generated hydroxyl radicals in each
treatment.
3.2. Effect of current density and chloramphenicol content on
SPEF with BDD in a stirred tank reactor
The influence of key variable parameters such as current
density (j) and substrate concentration on the SPEF process using a
stirred BDD/air-diffusion tank reactor was examined from the DOC
abatement of synthetic antibiotic solutions with 0.05 M Na2SO4
and 0.5 mM Fe2+ of pH 3.0. Fig. 3a shows the gradual quicker
84

592 S. Garcia-Segura et al. / Applied Catalysis B: Environmental 144 (2014) 588– 598
0.0
0.2
0.4
0.6
0.8
1.0
0 20 40 60 80 100 120 140
DO
C / D
OC
0
0
20
40
60
80
100
120
0 20 40 60 80 100 120 140
% M
CE
Time / min
0
50
100
150
200
250
0 6 12 18 24 30
Time / min
[Ch
lora
mp
he
nic
ol]
/ m
g L-1
0
1
2
3
4
5
0 5 10 15 20 25 30Time / mi n
ln (C
0/C )
a
b
Fig. 3. Effect of current density on (a) normalized DOC removal and (b) sub-
strate concentration decay with electrolysis time for the degradation of 100 mL of
245 mg L−1 chloramphenicol with 0.05 M Na2SO4 and 0.5 mM Fe2+ at pH 3.0 and
35 ◦C by SPEF using a BDD/air-diffusion tank reactor. Applied current density: (�)
33.3 mA cm−2, (♦) 66.6 mA cm−2 and (�) 100 mA cm−2. Inset panel: (a) mineral-
ization current efficiency vs electrolysis time and (b) kinetic analysis assuming a
pseudo-first-order reaction.
mineralization obtained for 245 mg L−1 chloramphenicol with
rising j, attaining total mineralization in 120, 105 and 90 min
for 33.3, 66.6 and 100 mA cm−2, respectively. This trend can be
associated with the concomitant increase in rate of all electrode
reactions leading to the production of higher amounts of BDD(•OH)
from reaction (3) and •OH in the bulk from reaction (4) due to the
enhancement of H2O2 generation from reaction (1) [43]. The faster
destruction of organics with greater quantities of these radicals
favors the formation of intermediates that are more rapidly pho-
tolyzed by solar radiation, thereby enhancing chloramphenicol
mineralization. However, the opposite tendency can be observed
in the inset panel of Fig. 3a for the calculated MCE from Eq. (7).
Thus, the efficiency dropped as j increased and reached maximum
values of 100%, 64% and 59% at 33.3, 66.6 and 100 mA cm−2,
respectively. This loss in efficiency can be related to a gradual loss
in the relative quantity of generated BDD(•OH) and •OH due to the
higher increase in rate of their non-oxidizing reactions, with the
consequent fall in organic events making the mineralization more
inefficient. These waste reactions involve primordially the oxida-
tion of BDD(•OH) to O2 via reaction (9), as well as the dimerization
of •OH to H2O2 from reaction (10) and its reaction either with Fe2+
from reaction (11) or with H2O2 generating the weaker oxidant
hydroperoxyl radical (HO2•) from reaction (12) [15,16,23,30]. The
relative amount of generated BDD(•OH) could also fall by the
quicker formation of other weaker oxidants at the BDD anode such
0
20
40
60
80
100
0 20 40 60 80 100 120 140
DO
C /
mg
L-1
0
20
40
60
80
100
120
0 20 40 60 80 100 120 140
%M
CE
Time / mi n
0
50
100
150
200
250
0 5 10 15 20 25 30
[Ch
lora
mp
he
nic
ol]
/ m
g L-1
Time / min
0
1
2
3
4
5
6
0 5 10 15 20 25 30Tim e / min
ln (C
0/C
)
a
b
Fig. 4. Influence of initial chloramphenicol concentration on (a) DOC abatement
and (b) substrate concentration abatement vs electrolysis time for the SPEF degra-
dation of 100 mL of drug solutions in 0.05 M Na2SO4 with 0.5 mM Fe2+ at pH 3.0,
33.3 mA cm−2 and 35 ◦C using a BDD/air-diffusion tank reactor. Initial DOC con-
tent: (�) 24.5 mg L−1, (�) 61.2 mg L−1, (�) 122.5 mg L−1, (�) 183.7 mg L−1 and (�)
245 mg L−1. Inset panel: (a) mineralization current efficiency vs electrolysis time
and (b) analysis considering a pseudo-first-order kinetics.
peroxodisulfate (S2O82−) ion by oxidation of SO4
2− ion from the
electrolyte by reaction (13) and ozone by reaction (14) [14,15].
2BDD(•OH) → 2BDD + O2 + 2H+ + 2e− (9)
2•OH → H2O2 (10)
Fe2+ + •OH → Fe3+ + OH− (11)
H2O2 + •OH → HO2• + H2O (12)
2SO42− → S2O8
2− + 2e− (13)
3H2O → O3 + 6H+ + 6e− (14)
It is important to remark that the oxidants produced in solution
can also suffer chemical activation by irradiation (photocatalysis)
and after that, other strong oxidant species can be produced by
the combination of the oxidants produced with another species
that leads to the production of very reactive species such as ozone
and sulfate ion-radical. However, the undesired effect can be also
observed because the effectiveness of the process could be reduced
with a decrease of •OH concentration due to its combination by
reaction (10).
Fig. 3b depicts that the increase in j accelerates the antibiotic
abatement, which disappears in 27, 13 and 11 min for 33.3, 66.6
and 100 mA cm−2. The inset panel of this figure presents the excel-
lent linear correlations obtained from the analysis of such substrate
decays for a pseudo-first-order kinetics, giving rise to increasing k1
85

S. Garcia-Segura et al. / Applied Catalysis B: Environmental 144 (2014) 588– 598 593
Table 1Products and hydroxylated derivatives identified by LC–MS during chloramphenicol degradation by EF in a BDD/air-diffusion tank reactor.
Product Chemical name –OH groups added m/za trb (min)
1 Chloramphenicol – 321 9.917
323
325
2 353 8.500
355
357
2 2,2-Dichloro-N-[1,3-dihydroxy-1-(4-hydroxyphenyl)propan-2-yl]acetamide 2 324 9.850
326
328
3 4-(2-Amino-1,3-dihydroxy-propanyl)-nitrobenzene – 211 –
1 227 11.250
2 243 9.500
4 4-(2-Amino-1,3-dihydroxy-propanyl)-phenol – 182 13.125
3 230 9.135
5 4-(2-Nitro-1,3-dihydroxy-propanyl)-nitrobenzene – 241 15.083
2 273 8.653
3 289 9.305
6 4-Nitro-(2R)-hydroxy(phenyl)ethanoic acid – 212 8.430
1 228 13.466
2 244 9.325
7 4-Hydroxy-(2R)-hydroxy(phenyl)ethanoic acid – 183 8.341
8 4-Nitrobenzoic acid – 166 7.020
1 182 13.041
4 230 9.033
9 4-Hydroxybenzoic acid – 137 6.500
1 153 9.625
2 169 9.157
4 201 7.475
10 4-Nitrophenol – 138 6.350
11 Dichloroacetic acid – 127 7.568
a Negative ion with z = 1.b Retention time.
values from 2.9 × 10⁻³ to 7.1 × 10⁻³ s−1 (R2 ∼ 0.995–0.998) when j
changes from 33.3 to 100 mA cm−2. This confirms the concomitant
greater generation of •OH as the main oxidant of chloramphenicol.
The effect of substrate concentration on the oxidation abil-
ity of SPEF with BDD was explored for solutions containing
24.5–245 mg L−1 of chloramphenicol at 33.3 mA cm−2. For these tri-
als, Fig. 4a evidences that total mineralization (98% DOC abatement)
was achieved at a similar time of 120 min in all cases. That means
that the mineralization rate was accelerated at higher chloram-
phenicol concentration, thereby making the process more efficient.
This behavior can be seen in the inset panel of Fig. 4a, where the
maximum MCE values gradually increased from 12% for 24.5 mg L−1
to 100% for 245 mg L−1. This suggests a progressive inhibition of
parasitic reactions (9)–(14) to favor the attack of a larger propor-
tion of BDD(•OH) and •OH on greater amounts of organics that are
more rapidly mineralized and/or more quickly photolyzed by sun-
light. The determination of substrate decay in these trials revealed
that it disappeared at longer time at greater concentration, from 4
to 27 min, as depicted in Fig. 4b. Its inset panel evidences that chlor-
amphenicol always followed a pseudo-first-order reaction, with
decreasing k1 values of 1.5 × 10⁻² s−1 (R2 = 0.985), 8.0 × 10⁻³ s−1
(R2 = 0.997), 7.6 × 10⁻³ s−1 (R2 = 0.988), 3.7 × 10⁻³ s−1 (R2 = 0.999)
and 2.9 × 10⁻³ s−1 (R2 = 0.998) for increasing contents of 24.5, 61.2,
122.5, 183.7 and 245 mg L−1. Note that the large drop in k1 as
chloramphenicol concentration rises is a surprising trend for a
pseudo-first-order kinetics, since a rate constant independent of
substrate content is theoretically expected. This may be related
to the very short lifetime of hydroxyl radicals (about 4 × 10⁻⁹ s)
[44] which need to be continuously produced from water oxida-
tion by reaction (3) and Fenton’s reaction (4) with participation of
H2O2 and Fe2+. The diffusion of all these species in the medium
and their mass transport toward/from the electrodes then seem
to limit the generation of BDD(•OH) and •OH giving a different
constant concentration of them to attack chloramphenicol in each
trial. This could explain that its decay always follows a pseudo-first-
order kinetics but with a k1 value depending on the experimental
variables tested.
The aforementioned findings highlight the great oxidation abil-
ity of BDD(•OH), •OH and sunlight in SPEF with BDD, allowing
the complete mineralization of acidic waters polluted with high
contents of chloramphenicol. The efficiency of this EAOP improves
with decreasing j and rising substrate content.
3.3. Identification and evolution of oxidation products
Since hydroxyl radicals (Pt(•OH), BDD(•OH) and •OH) are the
main oxidants in the EAOPs tested, the same products are expected
to be formed in all them. The primary intermediates were then
detected from short electrolysis times of a solution with 245 mg L−1
chloramphenicol under EF with BDD at 33.3 mA cm−2 by liquid
chromatography–mass spectrometry (LC–MS). Table 1 summa-
rizes the products identified by this technique and their main
characteristics. Apart from chloramphenicol (1), nine aromatic
products (2–10) and thirteen hydroxylated derivatives along with
dichloroacetic acid (11) were found.
The cleavage of the benzenic ring of aromatic products and
the degradation of their lateral groups are expected to form
short-chain carboxylic acids [12,16,18,28–32]. Ion-exclusion HPLC
of all treated solutions revealed the generation of tartaric (12,
tr = 8.24 min), maleic (13, tr = 8.51 min), acetic (14, tr = 14.96 min),
oxalic (15, tr = 7.00 min), oxamic (16, tr = 9.39 min) and formic (17,
tr = 13.68 min) acids. Oxidation of tartaric, maleic and acetic acids
yields oxalic and formic acids [12,16], whereas oxamic acid can
be formed from precedent amino compounds. Besides, oxalic,
oxamic and formic acids are ultimate carboxylic acids since they
are directly oxidized to CO2 [16,45].
The evolution of detected carboxylic acids was determined
for the treatment of a 245 mg L−1 chloramphenicol solution by
86

594 S. Garcia-Segura et al. / Applied Catalysis B: Environmental 144 (2014) 588– 598
0
10
20
30
40
50
60
70
[Oxa
lic a
cid
] / m
g L-1
0
5
10
15
20
[Oxa
mic
acid
] / m
g L-1
0
5
10
15
20
0 60 120 180 240 300 360 420
Time / min
[Fo
rmic
ac
id]
/ mg
L-1
a
b
c
Fig. 5. Evolution of the concentration of (a) oxalic (15), (b) oxamic (16) and (c) formic
(17) acids detected during the treatments of Fig. 1. Method: (©) AO-H2O2 with Pt,
(�) AO-H2O2 with BDD, (�) EF with BDD, (�) PEF with BDD and (�) SPEF with BDD.
AO-H2O2 with Pt and BDD as well as EF, PEF and SPEF with BDD at
33.3 mA cm−2. While only traces of 12–14 were found for the three
latter methods, up to 8 mg L−1 of 12 were formed and completely
removed at 360 min of both AO-H2O2 processes and 13 was con-
tinuously accumulated up to 2 mg L−1 in AO-H2O2 with Pt, being
totally destroyed when using BDD. A very different behavior was
obtained for the ultimate acids 15–17, as shown in Fig. 5a–c. Thus,
in AO-H2O2 with Pt, 15 and 16 were poorly produced (<0.8 mg L−1)
and up to 7.4 mg L−1 of 17 were continuously accumulated, accord-
ing to the scarce DOC decay of this EAOP (see Fig. 1a). In contrast, the
higher oxidation ability of AO-H2O2 with BDD allowed the faster
destruction of precedent intermediates with larger accumulation
of these three acids, which were also mineralized by BDD(•OH) at
long electrolysis time, primordially 15 and 16. The quicker destruc-
tion of aromatic products by •OH in EF with BDD favored the faster
generation of the ultimate acids attaining maximum contents of
58.3 mg L−1 for 15, 19.1 mg L−1 for 16 and 20.7 mg L−1 for 17. Results
of Fig. 5a–c evidence that Fe(III)-oxalate and Fe(III)-oxamate com-
plexes were slowly removed from the attack of BDD(•OH) [16,45],
0
10
20
30
40
50
60
[NO
3
−− ] / m
g L-1
0
2
4
6
8
10
[NH
4
+]
/ mg
L-1
0
5
10
15
20
25
0 60 120 180 240 300 360 420
[Cl−− ]
/ m
g L-1
Time / min
b
a
c
Fig. 6. Time-course of the concentration of: (a) nitrate, (b) ammonium and (c) chlo-
ride ions released during the degradations of Fig. 1 using a BDD/air-diffusion tank
reactor. Method: (�) AO-H2O2, (�) EF, (�) PEF and (�) SPEF.
whereas Fe(III)-formate species were more stable in solution. When
PEF with BDD was used, these three Fe(III)-carboxylate complexes
were rapidly photomineralized by UVA light from reaction (6), a
process so rapid in SPEF with BDD that they were not practically
accumulated. A simple mass balance at 120–135 min of AO-H2O2,
EF, PEF and SPEF with BDD indicated that the ultimate acids con-
tributed in 5.2, 23.2, 10.0 and 0.76 mg L−1 DOC, respectively, related
to 7.4%, 68%, 59% and 38% of the organic matter contained in the final
treated solution. All these results confirm the preponderant attack
of •OH on aromatic products to produce carboxylic acids, which can
be slowly decayed by BDD(•OH) and the potent photolytic action
of sunlight quickly mineralizes Fe(III)-carboxylate complexes. This
explains the highest oxidation ability of SPEF with BDD than the
other EAOPs.
The conversion of the initial N of chloramphenicol (21.2 mg L−1)
into NO3− and NH4
+ ions in the treatments with BDD was assessed
by ion chromatography. Fig. 6a and b shows that NO3− ion was
formed usually more rapidly and always in larger extent, as
proposed in reaction (8). At the end of electrolyses, 40 mg L−1
87

S. Garcia-Segura et al. / Applied Catalysis B: Environmental 144 (2014) 588– 598 595
O2NHN
OCl
Cl
OH OH
XNH2
OH OH
O2NNO2
OH OH
XOH
OHO
X
OH
O
OHO
OOHHO
O
OH
OH
O
OH
OHHO
O O
NH2HO
O O
OH
O
HOHN
OCl
Cl
OH OH
21
HO
O
Cl
ClX = NO2 (3)X = OH (4)
5
11
+
++
X = NO2 (6)X = OH (7)
16
CO2
2 Cl−
OH
NO2
X = NO2 (8)X = OH (9)
10
+
OH
O+ +
1213 14
+
15 17
Fe3+
Fe(III)-oxala tecomplexes
CO2
Fe3+
Fe(III)- formatecomplexes
CO2
Fe3+
Fe(III)-oxamatecomplexes
CO2NO3
−
NH4+
OH.
OH. OH.
BDD( OH).
OH. OH. OH.-NO3
−
-NH4+
-NO3−
-NH4+
OH.-NO3
−
BDD( OH).
BDD( OH).BDD( OH).
BDD( OH). BDD( OH).-Fe2+
BDD( OH).
BDD( OH).
OH.
-Fe2+
-Fe2+
OH.-NO3
−
hν
hν
hνhν
-NO3−
Fig. 7. General reaction sequence proposed for chloramphenicol mineralization by EAOPs in acidic aqueous medium.
NO3− (42% of initial N) and 4.1 mg L−1 NH4
+ (15% of initial N) for AO-
H2O2, 46 mg L−1 NO3− (49% of initial N) and 9.9 mg L−1 NH4
+ (36%
of initial N) for EF, 50 mg L−1 NO3− (53% of initial N) and 10.7 mg L−1
NH4+ (40% of initial N) for PEF and 54 mg L−1 NO3
− (59% of initial
N) and 10.7 mg L−1 NH4+ (40% of initial N) for SPEF were found. TN
analysis of the final solution treated by AO-H2O2 revealed the pres-
ence of 61% of the initial N, in good agreement with 57% of initial
N related to the sum of NO3− and NH4
+ contents. This suggests the
release of volatile N-derivatives in this process due to the smaller
oxidation ability of BDD(•OH). The quicker oxidation of intermedi-
ates with •OH then favored their mineralization with larger release
of inorganic ions, even enhanced under UVA and solar radiation.
TN measurements then confirmed the presence of the initial N as
NO3− and NH4
+ ions in the final solution of the SPEF process. On the
other hand, Fig. 6c shows that Cl− ion was lost during the same tri-
als, without reaching the initial Cl content of 53.7 mg L−1. This ion
was slowly accumulated in AO-H2O2 up to 24.7 mg L−1 since it was
slowly generated from the BDD(•OH) attack on chloro-organics and
oxidized to chlorine at the BDD anode [14,28]. This phenomenon
can be better observed for both EF and PEF processes, where Cl−
ion was much more rapidly released due to the greater oxidation
ability of •OH and practically disappeared in 360 min. That means
that Cl− ion is a primary inorganic ion formed in chloramphenicol
mineralization, as stated in reaction (8).
88

596 S. Garcia-Segura et al. / Applied Catalysis B: Environmental 144 (2014) 588– 598
3.4. Reaction sequence for chloramphenicol mineralization
Fig. 7 presents a general reaction pathway for chlorampheni-
col mineralization by the EAOPs tested. Only the detected aromatic
species have been considered, but not their hydroxylated deriva-
tives for sake of simplicity. These compounds are assumed to be
mainly oxidized by •OH in EF, PEF and SPEF, although their slower
destruction with either Pt(•OH) or BDD(•OH) takes place in the
AO-H2O2 processes.
The sequence is initiated by the hydroxylation with denitration
of 1 to give 2, along with the hydroxylation of these two compounds
yielding 3 and 4 with loss of 11, which is mineralized with release of
Cl− ions. Further oxidation of the amino group of 3 to nitro group
leads to 5, whereas deamination of the lateral group of 3 and 4gives the aromatics 6 and 7 and their parallel degradation leads
to acid 16. Subsequent oxidation of the lateral groups of 6 and 7gives compounds 8–10. The cleavage of the benzenic ring of the
above aromatics and the destruction of their lateral groups yields
the mixture of acids 12–14, which are further transformed into 15and 17. All short-chain carboxylic acids can be slowly removed
under the action of BDD(•OH) in AO-H2O2 with BDD, whereas in
EF, PEF and SPEF they form Fe(III)-carboxylate species that are also
slowly destroyed by BDD(•OH) but much more rapidly photolyzed
by UVA and solar radiation in the two latter EAOPs. These alterna-
tive reactions are indicated for the ultimate acids 15–17 that are
directly converted into CO2. Acid 16 also releases NO3− and NH4
+
ions during mineralization [45].
3.5. SPEF degradation with Pt in the solar pre-pilot plant
The most potent SPEF process was further scaled-up to a solar
pre-pilot plant in order to assess its viability at industrial scale. A
Pt anode was used to obtain a more economic process since gave a
lower potential difference of the cell than using a BDD one. The pre-
pilot plant then contained a Pt/air-diffusion filter-press cell coupled
to the solar CPCs photoreactor. 10 L of 245 mg L−1 chlorampheni-
col with 0.05 M Na2SO4 and 0.5 mM Fe2+ at pH 3.0 and 35 ◦C were
treated in batch circulation mode by applying up to 100 mA cm−2
and liquid flow rate of 200 L h−1. Comparative EF in the dark was
made to clarify the effect of irradiated sunlight.
As expected, the mineralization rate of the EF and SPEF pro-
cesses increased when j rose. Fig. 8a exemplifies the normalized
DOC decay found for 100 mA cm−2. While DOC was slowly removed
by EF only yielding 45% reduction in 360 min, it decayed much more
rapidly by SPEF, being reduced by 89% in 180 min. This evidences
the large synergistic action of sunlight using the CPCs photoreac-
tor in SPEF. Besides, maximum MCE values of 19% for EF and 49%
for SPEF were attained after 120 min of electrolysis, as can be seen
in Fig. 8b. Comparison of these results with the total mineraliza-
tion achieved at 180 min of SPEF at 33.3 mA cm−2 with maximum
efficiency of 80% using the stirred tank reactor (see Fig. 1) allows
concluding that the SPEF process is viable in the solar pre-pilot
plant, although it has lower oxidation ability to mineralize chlor-
amphenicol.
For the above trials, the energy cost per unit DOC mass removed
(ECDOC) was calculated from Eq. (15) [42,43]:
ECDOC
(kWh g−1 DOC
)= EcellIt
Vs �(DOC)exp
(15)
where Ecell is the average potential difference of the cell (11.4 V),
I is the applied current (9 A), t is the electrolysis time (h), Vs is
the solution volume (L) and �(DOC)exp is the experimental DOC
abatement (mg L−1). Fig. 8c shows that the SPEF process was much
more economic than the EF one. In both EAOPs, ECDOC dropped
from the starting of electrolysis reaching minimal of 0.676 and
0.255 kWh g−1 DOC after 2 h of EF and SPEF, respectively, just when
0.0
0.2
0.4
0.6
0.8
1.0
DO
C / D
OC
0
0
10
20
30
40
50
% M
CE
a
b
0 60 120 180 240 300 360 4200.0
0.2
0.4
0.6
0.8
1.0
1.2
1.4
Time / min
EC
DO
C/ k
Wh
g -1
DO
C
c
Fig. 8. Change of (a) normalized DOC, (b) mineralization current efficiency and (c)
energy consumption per unit DOC mass for the (�) EF (in the dark) and (�) SPEF
treatments of a 245 mg L−1 chloramphenicol solution in 0.05 M Na2SO4 with 0.5 mM
Fe2+ at pH 3.0, 100 mA cm−2 and 35 ◦C in the 10 L pre-pilot plant containing a Pt/air-
diffusion filter-press reactor coupled to a solar CPCs photoreactor at liquid flow rate
of 200 L h−1.
their best efficiencies were attained (see Fig. 8b). At the end of SPEF
(180 min), an ECDOC value of 0.347 kWh g−1 DOC related to 30.8
kWh m−3 energy cost was obtained. Taking into account that the
electrical energy cost of the Endesa, S.A., company in Spain is of
about 0.141 D kWh−1, one can estimate a cost of 4.35 D m−3 for
the SPEF process. This low cost confirms its viability for possible
application to industrial scale.
The chloramphenicol concentration decayed with similar rate
in both EF and SPEF treatments, as can be seen in Fig. 9, where
the antibiotic disappeared in about 60 min. The inset panel of this
figure shows the excellent straight lines obtained considering a
pseudo-first-order reaction, giving rise to k1 values of 1.4 × 10⁻³ s−1
(R2 = 0.994) for EF and 1.6 × 10⁻³ s−1 (R2 = 0.994) for SPEF. This evi-
dences again the small participation of photolytic reaction (5) to
produce significant amounts of the main oxidant •OH in SPEF. The
fact that a much greater k1 value of 2.9 × 10⁻³ s−1 was obtained
89

S. Garcia-Segura et al. / Applied Catalysis B: Environmental 144 (2014) 588– 598 597
0
50
100
150
200
250
0 10 20 30 40 50 60 70
Time / min
[Ch
lora
mp
he
nic
ol]
/ m
g L-1
0
1
2
3
4
0 10 20 30 40 50Time / min
ln (C
0/C
)
Fig. 9. Chloramphenicol concentration decay for the trials of Fig. 8. The inset panel
presents the kinetic analysis assuming a pseudo-first-order reaction for the drug.
Method: (�) EF and (�) SPEF.
operating at lower j of 33.3 mA cm−2 in the stirred tank reactor,
corroborates the formation of lower amounts of •OH from Fenton’s
reaction (4) in the solar pre-pilot plant, thereby making the SPEF
process with Pt less efficient.
The time course of generated carboxylic acids for SPEF with
Pt is depicted in Fig. 10a. While acids 12, 13 and 15 disappeared
completely during the 180 min of electrolysis, high amounts of 16(15 mg L−1) together only 1.8 mg L−1 of 14 and 2.6 mg L−1 of 17
0
5
10
15
20
25
30
[Carb
oxy
lic a
cid
] / m
g L-1
a
0
10
20
30
40
50
0 30 60 90 120 150 180 210
[In
org
an
ic i
on
] / m
g L-1
Time / min
b
Fig. 10. Evolution of the concentration of (a) carboxylic acids and (b) inorganic ions
formed during the experiment of Fig. 8 with a Pt/air-diffusion filter-press reactor. In
plot (a), (�) tartaric (12), (�) maleic (13), (�) acetic (14), (©) oxalic (15), (�) oxamic
(16) and (�) formic (17) acids. In plot (b), (�) nitrate, (�) ammonium and (�) chloride
ions.
remained in the solution. The amounts of these acids represent
5.5 mg L−1 DOC, i.e., a 50% of the DOC present in the final solu-
tion (see Fig. 8a), then being their main components. The greater
persistence of Fe(III)-carboxylate complexes in the solar pre-pilot
plant compared to the stirred tank reactor can be related to the
poorer capture of solar radiation by the solution volume. Thus, the
100 mL cell was totally irradiated by sunlight in contrast to the
very low irradiated volume/total volume ratio of 15.7% used in the
10 L pre-pilot plant at liquid flow rate of 200 L h−1. Nevertheless,
the latter system had a better solar radiation capture system from
CPCs, which can use efficiently direct and diffuse solar irradiation,
whereas the stirred tank reactor mostly used the direct radiation,
although a very small part of diffuse UV radiation reflected by the
mirror at the bottom of the cell reached the solution.
On the other hand, Fig. 10b confirms the release of NO3−, NH4
+
and Cl− ions during the SPEF treatment with Pt. NO3− ion was pref-
erentially formed, being accumulated up to 51 mg L−1 (54% of initial
N), whereas only 10 mg L−1 (36% of initial N) of NH4+ ion were
formed. TN analysis of the final degraded solution confirmed that
it contained all the initial N, which was distributed in the form
of NO3− and NH4
+ ions (90%) and the remaining 16 (10%). This
indicates again the high oxidation of this EAOP to mineralize all
N-compounds. In contrast, Cl− ion was continuously accumulated
up to a maximum content of 46 mg L−1 at about 150 min of elec-
trolysis. This behavior differs from that found in the stirred tank
reactor with a BDD anode (see Fig. 6c), suggesting a much slower
destruction of chloroderivatives, like 11, in the pre-pilot plant with
a much slower oxidation of Cl− ion to chlorine at the Pt anode.
4. Conclusions
It has been demonstrated that SPEF with BDD is the most
potent EAOP for chloramphenicol mineralization at pH 3.0 using
a 100 mL stirred BDD/air-diffusion tank reactor. Total mineral-
ization of antibiotic solutions with 0.05 M Na2SO4 and 0.5 mM
Fe2+ at pH 3.0 can be rapidly attained by the combined action of
BDD(•OH), •OH and sunlight. PEF with BDD was less powerful due
to the lower intensity of UVA radiation to photolyze generated
Fe(III)-carboxylate species. EF and AO-H2O2 with BDD led to partial
mineralization, the former being more potent because chloram-
phenicol and its aromatic products were more rapidly destroyed
by •OH than BDD(•OH). Comparative treatments with a Pt anode
yielded slower mineralization than using BDD because of the
smaller oxidation ability of Pt(•OH), although total mineralization
was also achieved for the SPEF process. In all these EAOPs, the
antibiotic decayed following a pseudo-first-order reaction, with
similar apparent constant rate in EF, PEF and SPEF since •OH formed
from Fenton’s reaction (4) was the main oxidant. For SPEF with BDD,
the mineralization current efficiency was enhanced with decreas-
ing j and increasing substrate concentration. The opposite trend
was found for the apparent rate constant of the antibiotic decay.
Nine aromatic products and thirteen hydroxylated derivatives
were identified by LC–MS. Tartaric, maleic and acetic acids, along
with oxalic, oxamic and formic as ultimate acids, were quantified
by ion-exclusion HPLC. While the Fe(III)-carboxylate complexes of
the three latter acids were slowly removed by BDD(•OH) in EF with
BDD, they were rapidly photolyzed by UVA light in PEF with BDD
and much more quickly photodecomposed by sunlight in SPEF with
BDD. NO3− ion and, in smaller extent, NH4
+ ion were released in all
processes. Cl− ion was also lost, but it was oxidized to chlorine at the
BDD anode surface. From the detected products, a plausible general
reaction sequence for chloramphenicol mineralization by EAOPs is
proposed. The SPEF process with Pt was viable when it was scaled-
up to a 10 L solar pre-pilot plant. This system showed less oxidation
ability than the 100 mL stirred tank reactor, leading to partial
90

598 S. Garcia-Segura et al. / Applied Catalysis B: Environmental 144 (2014) 588– 598
mineralization of a 245 mg L−1 antibiotic solution. After 180 min
of electrolysis at 100 mA cm−2 and liquid flow rate of 200 L h−1,
89% mineralization with 36% current efficiency and 30.8 kWh m−3
energy cost was obtained. Acetic, formic and primordially oxamic
acids were the main components remaining in the final solution
because of the poorer capture of solar radiation by the solution
volume.
Acknowledgments
The authors gratefully acknowledge the financial support from
MICINN (Ministerio de Ciencia e Innovación, Spain) under the
Project CTQ2010-16164/BQU, co-financed with FEDER funds. S.
Garcia-Segura thanks the grant awarded from MEC (Ministerio
de Educación y Ciencia, Spain) and E.B. Cavalcanti acknowledges
the financial support from CAPES/MEC/Brazil and Universidade
Tiradentes/UNIT.
References
[1] K. Kümmerer, Chemosphere 75 (2009) 417–434.[2] K. McClellan, R.U. Halden, Water Res. 44 (2010) 6011–6020.[3] L.-J. Zhou, G.-G. Ying, S. Liu, J.-L. Zhao, B. Yang, Z.-F. Chen, H.-J. Lai, Sci. Total
Environ. 452–453 (2013) 365–376.[4] I. Kim, N. Yamashita, H. Tanaka, J. Hazard. Mater. 166 (2009) 1134–1140.[5] V. Homem, L. Santos, J. Environ. Manage. 92 (2011) 2304–2347.[6] P. Verlicchi, A. Galletti, M. Petrovic, D. Barceló, M. Al Aukidy, E. Zambello, Sci.
Total Environ. 454–455 (2013) 411–425.[7] Y. Xu, F. Luo, A. Pal, K.Y.-H. Gin, M. Reinhard, Chemosphere 83 (2011) 963–969.[8] H.W. Leung, T.B. Minh, M.B. Murphy, J.C.W. Lam, M.K. So, M. Martin, P.K.S. Lam,
J.B. Richardson, Environ. Int. 42 (2012) 1–9.[9] R. Andreozzi, V. Caprio, C. Ciniglia, M. De Campore, R. Lo Giudice, R. Marotta, E.
Zuccato, Environ. Sci. Technol. 38 (2004) 6832–6838.[10] M. Crane, C. Watts, T. Boucard, Sci. Total Environ. 367 (2006) 23–41.[11] F. Pomati, C. Orlandi, M. Clerici, F. Luciani, E. Zuccato, Toxicol. Sci. 102 (2008)
129–137.[12] I. Sirés, E. Brillas, Environ. Int. 40 (2012) 212–229.[13] C.A. Martínez-Huitle, S. Ferro, Chem. Soc. Rev. 35 (2006) 1324–1340.[14] C.A. Martínez-Huitle, E. Brillas, Angew. Chem. Int. Ed. 47 (2008) 1998–2005.[15] M. Panizza, G. Cerisola, Chem. Rev. 109 (2009) 6541–6569.[16] E. Brillas, I. Sirés, M.A. Oturan, Chem. Rev. 109 (2009) 6570–6631.[17] M. Klavarioti, D. Mantzavinos, D. Kassinos, Environ. Int. 35 (2009) 402–417.[18] A. Özcan, Y. Sahin, A. Savas Koparal, M.A. Oturan, J. Electroanal. Chem. 616
(2008) 71–78.
[19] M. Zarei, A.R. Khataee, R. Ordikhani-Seyedlar, M. Fathinia, Electrochim. Acta 55(2010) 7259–7265.
[20] M. Zarei, A. Niaei, D. Salari, A.R. Khataee, J. Hazard. Mater. 173 (2010)544–551.
[21] I. Sirés, J.A. Garrido, R.M. Rodríguez, E. Brillas, N. Oturan, M.A. Oturan, Appl.Catal. B: Environ. 72 (2007) 382–394.
[22] I. Sirés, N. Oturan, M.A. Oturan, R.M. Rodríguez, J.A. Garrido, E. Brillas, Elec-trochim. Acta 52 (2007) 5493–5503.
[23] A. Ozcan, Y. Sahin, A.S. Koparal, M.A. Oturan, J. Hazard. Mater. 153 (2008)718–727.
[24] A. Dirany, S. Efremova-Aaron, N. Oturan, I. Sirés, M.A. Oturan, J.-J. Aaron, Anal.Bioanal. Chem. 400 (2011) 353–360.
[25] A. Dirany, I. Sirés, N. Oturan, A. Özcan, M.A. Oturan, Environ. Sci. Technol. 46(2012) 4074–4082.
[26] M. Panizza, M.A. Oturan, Electrochim. Acta 56 (2011) 7084–7087.[27] K. Cruz-González, O. Torres-López, A. García-León, J.L. Guzmán-Mar, L.H. Reyes,
A. Hernández-Ramírez, J.M. Peralta-Hernández, Chem. Eng. J. 160 (2010)199–206.
[28] I. Sirés, F. Centellas, J.A. Garrido, R.M. Rodríguez, C. Arias, P.L. Cabot, E. Brillas,Appl. Catal. B: Environ. 72 (2007) 373–381.
[29] E. Guinea, J.A. Garrido, R.M. Rodríguez, P.L. Cabot, C. Arias, F. Centellas, E. Brillas,Electrochim. Acta 55 (2010) 2101–2115.
[30] S. Garcia-Segura, J.A. Garrido, R.M. Rodríguez, P.L. Cabot, F. Centellas, C. Arias,E. Brillas, Water Res. 46 (2012) 2067–2076.
[31] A. El-Ghenymy, P.L. Cabot, F. Centellas, J.A. Garrido, R.M. Rodríguez, C. Arias, E.Brillas, Chemosphere 91 (2013) 1324–1331.
[32] E.B. Cavalcanti, S. Garcia-Segura, F. Centellas, E. Brillas, Water Res. 47 (2013)1803–1815.
[33] B. Kasprzyk-Hordern, R.M. Dinsdale, A.J. Guwy, Water Res. 42 (2008)3498–3518.
[34] L. Tong, W. Ping, Y. Wang, K. Zhu, Chemosphere 74 (2009) 1090–1097.[35] A.I. Okoh, E.O. Igbinosa, BMC Microbiol. 10 (2010) 143.[36] H. Xu, W. Chen, C. Wang, J. Yang, L. Zhao, Fres. Environ. Bull. 21 (2012)
1619–1625.[37] V. Suling, J. Wohlers, M. Reinhard, W. Thiemann, Vom Wasser 98 (2002)
145–158.[38] A. Chatzitakis, C. Berberidou, I. Paspaltsis, G. Kyriakou, T. Sklaviadis, I. Poulios,
Water Res. 42 (2008) 386–394.[39] J. Wang, W. Sun, C. Xu, W. Liu, Int. J. Environ. Technol. Manage. 15 (2012)
180–192.[40] M. Feng, D. Long, Y. Fang, Anal. Chim. Acta 363 (1998) 67–73.[41] E. Brillas, M.A. Banos, S. Camps, C. Arias, P.L. Cabot, J.A. Garrido, R.M. Rodríguez,
New J. Chem. 28 (2004) 314–322.[42] L.C. Almeida, S. Garcia-Segura, N. Bocchi, E. Brillas, Appl. Catal. B: Environ. 103
(2011) 21–30.[43] E.J. Ruiz, C. Arias, E. Brillas, A. Hernández-Ramírez, J.M. Peralta-Hernández,
Chemosphere 82 (2011) 495–501.[44] R. Roots, S. Okada, Radiat. Res. 64 (1975) 306–320.[45] S. Garcia-Segura, E. Brillas, Water Res. 45 (2011) 2975–2984.
91

Results and Discussion �
����

Results and Discussion
����
PAPER 3
Mineralization of the recalcitrant oxalic
and oxamic acids by electrochemical
advanced process using a boron-doped
diamond anode

Results and Discussion �
����

Mineralization of the recalcitrant oxalic and oxamic acids byelectrochemical advanced oxidation processes using aboron-doped diamond anode
Sergi Garcia-Segura, Enric Brillas*
Laboratori d’Electroquımica de Materials i del Medi Ambient, Departament de Quımica Fısica, Facultat de Quımica, Universitat de Barcelona,
Martı i Franques 1-11, 08028 Barcelona, Spain
a r t i c l e i n f o
Article history:
Received 22 December 2010
Received in revised form
12 February 2011
Accepted 10 March 2011
Available online 21 March 2011
Keywords:
Carboxylic acids
Iron complexes
Anodic oxidation
Electro-Fenton
UVA light
Removal kinetics
a b s t r a c t
Oxalic and oxamic acids are the ultimate and more persistent by-products of the degra-
dation of N-aromatics by electrochemical advanced oxidation processes (EAOPs). In this
paper, the kinetics and oxidative paths of these acids have been studied for several EAOPs
using a boron-doped diamond (BDD) anode and a stainless steel or an air-diffusion
cathode. Anodic oxidation (AO-BDD) in the presence of Fe2þ (AO-BDD-Fe2þ) and under UVA
irradiation (AO-BDD-Fe2þ-UVA), along with electro-Fenton (EF-BDD), was tested. The
oxidation of both acids and their iron complexes on BDD was clarified by cyclic voltam-
metry. AO-BDD allowed the overall mineralization of oxalic acid, but oxamic acid was
removed much more slowly. Each acid underwent a similar decay in AO-BDD-Fe2þ and EF-
BDD, as expected if its iron complexes were not attacked by hydroxyl radicals in the bulk.
The faster and total mineralization of both acids was achieved in AO-BDD-Fe2þ-UVA due to
the high photoactivity of their Fe(III) complexes that were continuously regenerated by
oxidation of their Fe(II) complexes. Oxamic acid always released a larger proportion of
NH4þ than NO3
� ion, as well as volatile NOx species. Both acids were independently
oxidized at the anode in AO-BDD, but in AO-BDD-Fe2þ-UVA oxamic acid was more slowly
degraded as its content decreased, without significant effect on oxalic acid decay. The
increase in current density enhanced the oxidation power of the latter method, with loss of
efficiency. High Fe2þ contents inhibited the oxidation of Fe(II) complexes by the competitive
oxidation of Fe2þ to Fe3þ. Low current densities and Fe2þ contents are preferable to remove
more efficiently these acids by the most potent AO-BDD-Fe2þ-UVA method.
ª 2011 Elsevier Ltd. All rights reserved.
1. Introduction
Recently, a large variety of advanced oxidation processes
(AOPs) have been proposed for the remediation of waste-
waters containing low contents of toxic and/or biorefractory
organic pollutants (Andreozzi et al., 1999; Pera-Titus et al.,
2004; Canizares et al., 2008). These powerful oxidation met-
hods include chemical, photochemical and electrochemical
treatments based on the in situ generation of hydroxyl radical
(�OH). This radical is the second most strong oxidizing species
known after fluorine with a high standard reduction potential
(E�(�OH/H2O)¼ 2.80 V vs. SHE) that allows its non-selectively
reaction with most organics leading to their overall minerali-
zation to CO2, water and inorganic ions. However, the effec-
tiveness of AOPs is limited by the formation of recalcitrant
carboxylic acids (Canizares et al., 2003; Oturan et al., 2008; Serra
* Corresponding author. Tel.: þ34 93 4021223; fax: þ34 93 4021231.E-mail address: [email protected] (E. Brillas).
Avai lab le a t www.sc iencedi rec t .com
journa l homepage : www.e lsev ie r . com/ loca te /wat res
wat e r r e s e a r c h 4 5 ( 2 0 1 1 ) 2 9 7 5e2 9 8 4
0043-1354/$ e see front matter ª 2011 Elsevier Ltd. All rights reserved.doi:10.1016/j.watres.2011.03.017
95

et al., 2009). The most common ultimate by-product from
aromatics is oxalic acid, which is hardly destroyed with �OH
largely prolonging themineralization timewith the consequent
efficiency loss and/or greater operation cost of the treatment
(Brillas et al., 2004; Pera-Titus et al., 2004; Diagne et al., 2007;
Ozcan et al., 2008). In the degradation of wastewaters with
N-aromatics, a mixture of oxalic and oxamic acids is finally
formed (Sires et al., 2006; Hammami et al., 2008; Hamza et al.,
2009; Brillas et al., 2010). Oxamic acid is even more recalcitrant
than oxalic acid (Faria et al., 2008). While the removal rate of
oxalic acid is strongly enhanced in photoassisted AOPs with
iron ions (Zuo and Hoigne, 1992; Faust and Zepp, 1993; Zuo
and Hoigne, 1994; �Sima and Maka�nova, 1997), less is known
about the mineralization of oxamic acid by photochemical
treatments.
The most typical electrochemical AOP (EAOP) is anodic
oxidation (AO) in which organic pollutants contained in an
electrolytic cell can be oxidized at the anode surface either by
direct charge transfer and/or with �OH generated from water
oxidation at high current. For a boron-doped diamond (BDD)
electrode, the formation of hydroxyl radical can be written as
reaction (1) (Marselli et al., 2003; Sires et al., 2008; Panizza and
Cerisola, 2009; Brillas et al., 2010):
BDDþH2O/ BDD(�OH)þHþþ e� (1)
The BDD electrode has a much higher oxidation power than
other conventional anodes and it is able to effectively
mineralize oxalic acid (Gandini et al., 2000; Martınez-Huitle
et al., 2004; Vandini et al., 2006; Weiss et al., 2007; Scialdone
et al., 2008), but no information is available on the AO treat-
ment of oxamic acid. The high oxidation power of BDD also
allows generating reactive oxygen species (ROS) like H2O2 and
ozone, as well as peroxo-derivatives coming from the oxida-
tion of the anion of the background electrolyte (Canizares
et al., 2003; Panizza and Cerisola, 2009). In previous work
(Guinea et al., 2009), we found that the presence of H2O2 in AO
accelerates the mineralization process of carboxylic acids,
although Fe(III)eoxalate complexes are quickly photolyzed by
UVA light.
EAOPs based on Fenton’s reaction chemistry have been
recently developed (Brillas et al., 2009). In electro-Fenton (EF),
H2O2 is continuously supplied to an acidic contaminated
solution from the two-electron reduction of injected O2 at
a carbonaceous cathode, mainly carbon felt (Oturan et al.,
2008; Balci et al., 2009) and carbon-PTFE gas-diffusion elec-
trodes (Sires et al., 2007; Ruiz et al., 2011), by reaction (2):
O2þ 2Hþþ 2e�/H2O2 (2)
Fe2þ ion is then added to the solution to react with H2O2
producing �OH in the bulk and Fe3þ by Fenton’s reaction (3)
(Sun and Pignatello, 1993):
Fe2þþH2O2/ Fe3þ þ �OHþOH� (3)
An advantage of EF is that Fe2þ can be regenerated from Fe3þ
reduction at the cathode, thus accelerating Fenton’s reaction
(3) and the oxidation of organics with �OH (Brillas et al., 2009).
When a one-compartment cell with a BDD anode is used, the
degradation of organic pollutants is additionally enhanced by
the attack of BDD (�OH) formed from reaction (1) (Serra et al.,
2009; Ruiz et al. 2011). The mineralization of aromatics can
also be accelerated by exposing the contaminated solution to
UVA light while is treated by EF (Brillas et al., 2004; Sires et al.,
2006; Ruiz et al., 2011). The main action of UVA irradiation is
the photodecarboxylation of Fe(III)ecarboxylate complexes.
The degradation of N-aromatics by EAOPs involves a high
number of by-products that are simultaneously formed and
destroyed by the different oxidizing species. Oxalic and oxa-
mic acids are accumulated from the beginning of the process
and their slow destruction limits the oxidation power of these
methods. However, the influence of oxidants and/or UVA light
on their removal, particularly of their iron species, is not well
known yet.
To gain a better insight on the mineralization processes of
oxalic and oxamic acids to better understand the degradation
of N-aromatics, we report a study on the kinetics and oxida-
tive paths of both acids by EAOPs with a BDD anode under
typical treatment conditions of synthetic wastewaters with
organics in sulfate medium. Special attention was taken on
the action of Fe2þ and UVA light to clarify the destruction of
their iron complexes. The oxidation of these compounds on
BDD was analyzed by cyclic voltammetry (CV). The change in
degradation rate of each acid when mixed in different
proportions was examined. The effect of current density and
Fe2þ content on oxamic acid removal was assessed. NH4þ and
NO3� ions lost during the mineralization of oxamic acid were
followed by ionic chromatography.
2. Materials and methods
2.1. Chemicals
Oxalic and oxamic acids were of analytical grade from
Avocado. Anhydrous sodium sulfate, ferrous sulfate hepta-
hydrate and ferric sulfate hydrate were of analytical grade
from Fluka and Sigma. Solutions were prepared with high-
purity water obtained from a Millipore Milli-Q system with
resistivity> 18 MU cm at 25 �C. Organic solvents and other
chemicals usedwere of HPLC or analytical grade fromAldrich,
Lancaster, Merck and Panreac.
2.2. Apparatus
The solution pH was measured with a Crison GLP 22 pH-
meter. CV was conducted with an Ecochemie Autolab
PGSTAT100 potentiostategalvanostat controlled by an Auto-
lab Nova 1.5 software. Electrolyses were performed with an
Amel 2053 potentiostategalvanostat. The concentration of
dissolved O2 was determined with a Thermo Electron Corpo-
ration Orion 4 Star pH-DO portable with a Sensor Orion
083005MD DO probe. Total organic carbon (TOC) of solutions
was measured with a Shimadzu VCSN TOC analyzer. Total
nitrogen (TN) was determined with a Shimadzu TNM-1 unit
coupled with the TOC analyzer. The concentration of oxalic
and oxamic acids was quantified by ion-exclusion HPLC using
a Waters 600 liquid chromatograph fitted with a Bio-Rad
Aminex HPX 87H, 300 mm� 7.8 mm (i.d.), column at 35 �C,
wat e r r e s e a r c h 4 5 ( 2 0 1 1 ) 2 9 7 5e2 9 8 42976
96

coupled with a Waters 996 photodiode array detector at
l¼ 210 nm. Inorganic ions lost during oxamic acid degrada-
tion were detected by ionic chromatography using a Shi-
madzu 10 Avp HPLC coupled with a Shimadzu CDD 10 Avp
conductivity detector. NH4þ concentration was obtained with
a Shodex IC YK-421, 125 mm� 4.6 mm (i.d.), cation column at
40 �C, whereas NO3� content was determined with a Shim-
Pack IC-A1S, 100 mm� 4.6 mm (i.d.), anion column at 40 �C.
2.3. Electrochemical systems
All electrolytic experiments were conducted in an open,
undivided and thermostated cylindrical cell, so that all gases
formed were directly released to the atmosphere. The anode
was a BDD thin film provided by Adamant Technologies (La-
Chaux-de-Fonds, Switzerland), while the cathode was either
a stainless steel (AISI 304 grade) sheet (SS) or a carbon-PTFE
air-diffusion electrode (ADE) from E-TEK (Somerset, NJ, USA).
The preparation of the ADE cathode was described elsewhere
(Brillas et al., 2004). It was fed with air pumped at
300 mLmin�1 to generate H2O2 by reaction (2). The area of all
electrodes was 3 cm2 and the interelectrode gap was ca. 1 cm.
To remove the impurities of the BDD surface and activate the
ADE cathode, they were previously polarized in 0.05 M Na2SO4
at 300 mA for 60 min. The same cell without electrodes was
used for the photochemical assays under UVA light.
Comparative photochemical and electrochemical degra-
dations of 100 mL of 2.08 mM (50 mg L�1 of TOC) of oxalic
(188 mg L�1) or oxamic (185 mg L�1) acid in 0.05 M Na2SO4 at
pH 3.0 were performed. The photochemical assays with direct
UVA exposition were made after addition of 0.5 mM Fe2þ
(UVA-Fe2þ) or 0.5 mM Fe3þ (UVA-Fe3þ). The electrolytic
methods were anodic oxidation with a BDD/SS cell (AO-BDD),
the same treatment after addition of 0.5 mM Fe2þ (AO-BDD-
Fe2þ) and under UVA illumination (AO-BDD-Fe2þ-UVA), and
electro-Fentonwith a BDD/ADE cell and 0.5 mMFe2þ (EF-BDD).
For the trials with UVA irradiation, a Philips TL/6W/08 fluo-
rescent black light blue tube placed at 7 cm above the solution
was employed. The tube emitted UVA light in the wavelength
region 320e420 nm with lmax¼ 360 nm, supplying a photo-
ionization energy of 5 Wm�2 as detected with a Kipp & Zonen
CUV 5 radiometer. In all experiments, the solution was kept at
35.0 �C under vigorous stirring with a magnetic bar at 800 rpm
to ensure its homogenization, as well as the transport of
reactants towards/from the electrodes in the electrolytic
assays.
CV measurements were carried out with a three-electrode
one-compartment cell thermostated at 25 �C. The working
electrode was a 0.40 cm2 BDD, the counter reference was a Pt
wire and the reference electrode was a Ag/AgCl/KCl (satu-
rated) electrode (E� ¼ 0.197 V/SHE). Cyclic voltammograms
were recorded at a scan rate of 100 mV s�1 under an Ar
atmosphere after previous bubbling of this gas through the
solution for 30 min.
2.4. Analytical procedures
Before analysis, aliquots withdrawn from treated solutions
were filtered with 0.45 mm PTFE filters from Whatman.
Reproducible TOC values with an accuracy of �1% were
found by injecting 50 mL aliquots to the TOC analyzer. The
mineralization current efficiency (MCE) for electrolyzed
solutions at time t (h) was then calculated by Eq. (4) (Hamza
et al., 2009):
MCEð%Þ ¼ nFVsDðTOCÞexp4:32� 107mIt
� 100 (4)
where F is the Faraday constant (96487 Cmol�1), Vs is the
solution volume (L), D(TOC)exp is the experimental TOC
removal (mg L�1), 4.32� 107 is a conversion factor (3600 s h�1�12,000 mgmol�1),m is thenumber of carbonatomsof eachacid
(2 C atoms) and I is the current (A). The number of electrons (n)
consumedwas takenas 2 for oxalic acid and10 for oxamic acid,
assuming that their overall mineralization corresponds to
reactions (5) and (6), respectively:
C2H2O4/ 2CO2þ 2Hþ þ 2e� (5)
C2H3NO3þ 4H2O/ 2CO2þNO3�þ 11Hþþ 10e� (6)
The ion-exclusion HPLC measurements were made after
injection of 20 mL aliquots into the liquid chromatograph and
circulation of 4 mM H2SO4 at 0.6 mLmin�1 as mobile phase.
Ionic chromatography was performed with 25 mL aliquots
using a mobile phase composed of 5.0 mM tartaric acid,
1.0 mM dipicolinic acid, 24.2 mM boric acid and 1.5 mM crown
ether at 1.0 mLmin�1 for NH4þ and 2.4 mM tris(hydrox-
ymethyl)aminomethane and 2.5 mM phthalic acid of pH 4.0 at
1.5 mLmin�1 for NO3�.
3. Results and discussion
3.1. CV behavior of oxalic and oxamic acids and theiriron complexes
Fig. 1a shows the cyclic voltammograms obtained for the
oxidation of 2.08 mM oxalic and oxamic acids in 0.05 M
Na2SO4 on a BDD electrode at pH 3.0 and 100 mV s�1. Bothcompounds display an irreversible peak, with an anodic peak
potential (Epa) of 2.10 and 2.14 V for oxalic and oxamic acids,
respectively, which partially overlap with that of water
discharge to O2 beginning at 2.2 V. The CV behaviour found
for oxalic acid agrees with that reported by other authors
(Martınez-Huitle et al., 2004; Weiss et al., 2007; Scialdone
et al., 2008), who suggested the direct anodic oxidation of
the acid at the BDD anode surface rather than its mediated
reaction with BDD(�OH) produced from reaction (1) to be
converted into CO2. This behavior can also be extended to the
case of oxamic acid, which is oxidized at slightly higher
potentials than oxalic acid and with a greater peak current
due to the additional transformation of its eNH2 group into
inorganic ions.
The comparative cyclic voltammograms recorded for the
above acids in the presence of 0.5 mM Fe2þ or 0.5 mM Fe3þ are
depicted in Fig. 1b. Fe(II)e or Fe(III)ecarboxylate complexes
formed are oxidized at much more positive potentials than
pure acids, clearly overlapping with the water discharge
wat e r r e s e a r c h 4 5 ( 2 0 1 1 ) 2 9 7 5e2 9 8 4 2977
97

region. The irreversible peak for Fe(II)eoxalate complexes
with Epa¼ 2.31 V has much higher height than that of oxalic
acid (see Fig. 1a), as a result of the more complex oxidation of
their electroactive species, predominantly FeII(C2O4)22� (Lan
et al., 2010). In contrast, the dominant FeIII(C2O4)33� and
FeIII(C2O4)2� ions in the solution of Fe(III)eoxalate complexes
(Balmer and Sulzberger, 1999; Kwan and Chu, 2007; Lan et al.,
2010) are oxidized at so high potentials that any peak is dis-
played in CV. Fe(II)e and Fe(III)eoxamate complexes exhibit
a similar irreversible peak, with high Epa of 2.54 and 2.72 V,
respectively, suggesting that their ionic structures (not
reported in literature) are analogous to those of ironeoxalate
complexes, although the Fe(III)eoxamate species are more
easily oxidizable. This is not surprising since oxamic like
oxalic acid behaves as a bidentate ligand, coordinated with
the amidic N, after ionization of one amidic H, and with the
carboxylate O (Pardo et al., 2004). The fact that the iron
complexes of oxalic and oxamic acids are destroyed in the
water discharge zone indicates that they react predominantly
with BDD(�OH) at the anode surface.
3.2. Photochemical degradation of oxalic and oxamicacids and their iron complexes
A series of trials weremade to assess the degradation effect of
the 6 W UVA light on 100 mL of the 2.08 mM acid solutions in
the absence and presence of 0.5 mM Fe2þ or 0.5 mM Fe3þ. Theevolution of each compound was monitored by ion-exclusion
chromatography, which displayed a well-defined adsorption
peak at retention time of 6.8 min for oxalic acid and 9.4 min
for oxamic acid. Fig. 2a and b shows that both acids are very
stable under UVA irradiation, as expected if they are not
directly photolyzed. In contrast, their iron complexes are
photodegraded at different rates depending on the acid and
iron ion tested. The fastest removal was found for the UVA-
Fe3þ treatment of oxalic acid, which disappears in about
150 min. Overall destruction of this acid is also feasible using
UVA-Fe2þ, although a longer time close to 360 min is required.
The kinetic analysis of these experiments showed good linear
correlations for a pseudo first-order reaction. The pseudo
first-order rate constant (koxalic) thus determined, along the
corresponding square of regression coefficient, is collected in
Table 1. The quick photodegradation of Fe(III)eoxalate
-0.6
-0.5
-0.4
-0.3
-0.2
-0.1
0.0
0.1
0.801.001.201.401.601.802.002.202.40
ElectrolyteOxalic acidOxamic acid
E / V vs. SCE
I/ m
A
-7
-6
-5
-4
-3
-2
-1
0
1
0.51.01.52.02.53.03.5
Oxalic acid + Fe2+Oxalic acid + Fe3+ ElectrolyteOxamic acid + Fe2+Oxamic acid + Fe3+
I/ m
A
E / V vs. SCE
Fe2+
Fe3+
Fe2+
Fe3+
a
b
Fig. 1 e Cyclic voltammograms recorded for the oxidation
of (a) 2.08 mM oxalic and oxamic acids and (b) their
solutions with 0.5 mM Fe2D or 0.5 mM Fe3D in 0.05 M
Na2SO4 of pH 3.0 on a 0.40 cm2 boron-doped diamond
(BDD) anode. Initial and final potentials 1.0 V, reversal
potential: (a) 2.3 V and (b) 3.3 V. Scan rate 100 mVsL1.
Temperature 25 �C.
0
50
100
150
200a
b
[Oxa
lic a
cid]
/ m
g L
-1
0
50
100
150
0 60 120 180 240 300 360 420
[Oxa
mic
aci
d] /
mg
L-1
time / min
Fig. 2 e Decay of the concentration of (a) oxalic and
(b) oxamic acids from 100 mL of 2.08 mM of each carboxylic
acid in 0.05 M Na2SO4 at pH 3.0 and 35 �C. Method: (C) 6 W
UVA irradiation (UVA), (-) 0.5 mM Fe2D solution and UVA
light (UVA-Fe2D), (A) 0.5 mM Fe3D solution and UVA light
(UVA-Fe3D), (,) AO in BDD/stainless steel (SS) cell (AO-
BDD), (6) AO-BDD with 0.5 mM Fe2D (AO-BDD-Fe2D), (:)
electro-Fenton (EF) in BDD/air-diffusion electrode (ADE) cell
with 0.5 mM Fe2D (EF-BDD) and (7) AO-BDD with 0.5 mM
Fe2D under UVA irradiation (AO-BDD-Fe2D-UVA). Current
density of 33.3 mA cmL2 in all EAOPs.
wat e r r e s e a r c h 4 5 ( 2 0 1 1 ) 2 9 7 5e2 9 8 42978
98

complexes can be accounted for by the high photoactivity of
their dominant ionic species by reactions (7) and (8) (Faust
and Zepp, 1993; Balmer and Sulzberger, 1999; Jeong and
Yoon, 2005):
FeIII(C2O4)33�þ hn/ FeII(C2O4)2
2� þC2O4�� (7)
FeIII(C2O4)2�þ hn/ FeII(C2O4)þC2O4
�� (8)
These reactions are photoredox processes with a ligand-to-
metal charge transfer leading to the homolytic break of a Fe
(III)eO coordination bond of the bidentate oxalate ligand
(�Sima and Maka�nova, 1997). The anion radical C2O4�� released
yields CO2 and the anion radical CO2�� by reaction (9), which
then reacts with dissolved O2 to produce the ion superoxide
(O2��) from reaction (10). This species originates a cascade of
other ROS like hydroperoxide radical (HO2�) from reaction (11)
and H2O2 from reaction (12). H2O2 can further oxidize the Fe(II)
to Fe(III) complexes, as exemplified for FeII(C2O4)22� in reaction
(13), at a rate about 1000 times higher than that of Fenton’s
reaction (3) (Faust and Zepp, 1993), thus closing the Fe(III)/Fe
(II) catalytic loop. The large production of �OH from the reac-
tion (13), which does not attack the ironeoxalate complexes,
has been well proven in photoassisted ferrioxalate systems
(Jeong and Yoon, 2005; Rodrıguez et al., 2007; Monteagudo
et al., 2008).
C2O4��/CO2þCO2
�� (9)
CO2�� þO2/CO2þO2
�� (10)
O2�� þHþ/HO2
� (11)
O2�� þHO2
� þHþ/H2O2þO2 (12)
FeII(C2O4)22�þH2O2/ FeIII(C2O4)2
�þ �OHþOH� (13)
The slow decay of oxalic acid in the UVA-Fe2þ system can
then be related to the much lower photoactivity of Fe(II)
complexes to be converted into Fe(III) ones, as exemplified by
reaction (14) (Faust and Zepp, 1993; Kwan and Chu, 2007):
FeII(C2O4)22�þ hn/ FeIII(C2O4)2
� (14)
Once the Fe(III)eoxalate complexes are formed, a photo-
degradation path similar to that described above for the UVA-
Fe3þ treatment takes place, although the large preponderance
of Fe(II)eoxalate complexes at the beginning of the process
makes it slower.
The aforementioned experiments for oxalic acid were
performed with 7.6 mg L�1 of dissolved O2. To clarify the
generation of ROS via reactions (10)e(12), the same trials were
repeated with 28.0 mg O2 L�1 in solution under O2 bubbling at
0.5 Lmin�1. Results of Table 1 confirm the increase in koxalic in
both systems, much more for UVA-Fe2þ (1.77-fold) than for
UVA-Fe3þ (1.06-fold). The excess of H2O2 formed under O2
bubbling strongly accelerates the oxidation of FeII(C2O4)22� by
reaction (13) in UVA-Fe2þ, while this reaction is only slightly
enhanced in UVA-Fe3þ due to the much lower concentration
of Fe(II) species.
Fig. 2b evidences that the very low photoactivity of Fe(II)e
and Fe(III)eoxamate complexes only allows a 57% and 77%
destruction of the acid after 360 min of UVA-Fe2þ and UVA-
Fe3þ treatments, respectively. This is also reflected in the low
pseudo first-order rate constant (koxamic) values obtained (see
Table 1). As can be seen in Fig. 3, a larger percentage of its
initial N is lost as NH4þ (43% for UVA-Fe2þ and 65% for UVA-
Fe3þ) at the end of these trials, although the oxidation to NO3�
is significant in both cases (9% of initial N for UVA-Fe2þ and
12% of initial N for UVA-Fe3þ). Note that for the UVA-Fe2þ
system, about 5% of initial N is released as volatile
compounds, probably NOx species.
3.3. Mineralization of oxalic acid by EAOPs
Comparative degradations of 100 mL of 2.08 mMoxalic acid by
different EAOPsweremadeat 33.3 mA cm�2. Fig. 2a shows that
Table 1 e Pseudo first-order rate constant and squareregression coefficient (in parenthesis) for the decay ofoxalic and oxamic acids during the degradation of 100 mLof 2.08 mM of each compound in 0.05 M Na2SO4 of pH 3.0at 35 �C. The solutionwas irradiatedwith a 6 WUVA lightand a current density of 33.3 mA cmL2 was applied in allEAOPs. The experiments with iron were carried out with0.5 mM Fe2D or 0.5 mM Fe3D.
Method koxalic� 104 (s�1) koxamic� 104 (s�1)
UVA-Fe2þ 0.75 (0.995) 0.40 (0.978)
UVA-Fe2þ (O2 sat.) 1.33 (0.988) ea
UVA-Fe3þ 6.43 (0.985) 1.10 (0.996)
UVA-Fe3þ (O2 sat.) 6.83 (0.984) ea
AO-BDD 1.49 (0.999) 1.01 (0.993)
AO-BDD-Fe2þ 0.61 (0.986) 1.20 (0.998)
EF-BDD 0.61 (0.989) 1.15 (0.998)
AO-BDD-Fe2þ-UVA 9.01 (0.983) 2.82 (0.995)
a Not determined.
0
20
40
60
80
100
% N
itro
gen
lost
UV
A-F
e2+
UV
A-F
e3+
AO
-BD
D
AO
-BD
D-F
e2+
EF
-BD
D
AO
-BD
D-F
e2+
-UV
A
Fig. 3 e Percentage of nitrogen released as ( ) NH4D ion,
( ) NO3L ion and ( ) NOx species at the end of the trials
of Fig. 2b for oxamic acid.
wat e r r e s e a r c h 4 5 ( 2 0 1 1 ) 2 9 7 5e2 9 8 4 2979
99

this acid is completely removed at 300 min of the AO-BDD
treatment, since it is transformed into CO2 by direct oxidation
at the anode, as stated above. When 0.5 mM Fe2þ is added to
the solution, a strong inhibition of oxalic acid decay occurs
during the AO-BDD-Fe2þ process, only being reduced by 72%
after 360 min of electrolysis. A similar tendency can be
observed in Fig. 2a for the EF-BDD system, where the large
generation of H2O2 from the ADE cathode favors the rapid
conversion of Fe(II)e into Fe(III)eoxalate complexes, e.g. via
reaction (13). This suggests that in AO-BDD-Fe2þ, the initial Fe
(II)eoxalate complexes are quickly oxidized to Fe(III)eoxalate
species by BDD(�OH) at the anode surface. This oxidation is also
feasible with H2O2 since it is produced in low amounts from
dimerization of BDD(�OH) by reaction (15) (Guinea et al., 2009):
2BDD(�OH)/ 2BDDþH2O2 (15)
The slow destruction of Fe(III)eoxalate complexes with
BDD(�OH), as confirmed by CV (see Fig. 1b), then explains the
similar and slow abatement of the acid in AO-BDD-Fe2þ and
EF-BDD, without oxidation by �OH formed from Fenton’s
reaction (3). From these results, the effect of UVA illumination
was studied for the AO-BDD-Fe2þ-UVA treatment. Fig. 2a
shows that this EAOP leads to total destruction of the acid in
only 90 min, as expected from the rapid photolysis of Fe(III)e
oxalate complexes. Since a steady concentration of 13 mg
O2 L�1 was reached in this trial, significant amounts of H2O2
are formed from reaction (12), which contribute to the oxida-
tion of Fe(II)e to Fe(III)eoxalate complexes.
The koxalic value obtained for the above EAOPs is listed in
Table 1. It increased 1.40-fold for the most potent AO-BDD-
Fe2þ-UVA system compared with UV-Fe3þ, as expected if the
photoactive Fe(III)eoxalate species are more quickly regen-
erated, involving its oxidation with H2O2 from reaction (13)
and with BDD(�OH) at the anode surface.
TOC was always removed in a similar way to oxalic acid
due to the insignificant formation of by-products. For
example, after 360 min of AO-BDD-Fe2þ and EF-BDD, TOC was
reduced to 13 mg L�1, corresponding to 49 mg L�1 oxalic acid in
good agreement with 52 mg L�1 found for the final electro-
lyzed solutions (see Fig. 2a). Total mineralization was ach-
ieved after about 300 min of AO-BDD and close to 90 min of
AO-BDD-Fe2þ-UVA, times similar to those required for the
total removal of oxalic acid, as shown in Fig. 2a. The efficiency
calculated from Eq. (4) decreased with electrolysis time by the
gradual drop in oxalic acid content. For example, the MCE
value decayed from 7.2% or 12.5% at 10 min to 1.6% or 6.7% at
the end of the AO-BDD or AO-BDD-Fe2þ-UVA treatment.
From the above results, the reaction sequence of Fig. 4 is
proposed for oxalic acidmineralization by AO-BDD-Fe2þ-UVA.
It is initiated by the oxidation of FeII(C2O4)22�with BDD(�OH) to
yield FeIII(C2O4)2�, in equilibrium with FeIII(C2O4)3
3�. These
ionic species are quickly photolyzed regenerating FeII(C2O4)
and FeII(C2O4)22�, respectively, with the loss of CO2 and CO2
��.Further reaction of CO2
��with O2 originates CO2 and ROS. The
catalytic loop between Fe(II)e and Fe(III)eoxalate complexes is
then propagated by the continuous oxidation of FeII(C2O4)22�
with BDD(�OH) and ROS (primordially H2O2). All ionic species
can also be oxidized to CO2 at the BDD anode, although
reactions with BDD(�OH) are much slower than the
photodegradation of Fe(III) species with UVA light. A slow
oxidation of oxalic acid, in equilibrium with the above
complexes, at the anode is also feasible.
3.4. Mineralization of oxamic acid by EAOPs
The degradation of 2.08 mM oxamic acid solutions by the
same EAOPs always followed a pseudo first-order abatement.
Fig. 2b evidences that AO-BDD-Fe2þ and EF-BDD processes
yield the same decay rate for this acid, as expected if its Fe(II)
complexes are oxidized by BDD(�OH) with insignificant
participation of �OH in the bulk. Both treatments are more
potent than AO-BDD because of themost effective destruction
of Fe(III)eoxamate complexes by BDD(�OH) than that of oxa-
mic acid by direct charge transfer. Comparison of Fig. 2a and
b evidences that AO-BDD-Fe2þ and EF-BDD methods are more
effective for the abatement of oxamic than oxalic acid, in
agreement with the higher oxidation ability of Fe(III)eoxa-
mate species at BDD (see Fig. 1b). Fig. 2b also shows that
oxamic acid disappears in 270 min for AO-BDD-Fe2þ-UVA.
Since koxamic for this method is 2.56 times higher than for UV-
Fe3þ (see Table 1), one can infer that Fe(III)eoxamate species
are rapidly formed from the oxidation of Fe(II)eoxamate ones
with BDD(�OH) and generated H2O2 to be photolyzed by UVA
light regenerating the Fe(II) species with loss of CO2 and
inorganic N products. Results of Table 1 indicate that
koxalic> koxamic for AO-BDD and AO-BDD-Fe2þ-UVA, while
koxalic< koxamic for AO-BDD-Fe2þ and EF-BDD. Thatmeans that
oxamic acid is more recalcitrant than oxalic acid only in the
two former methods, but not in the two latter. For the EAOPs
tested, TOC was removed similarly to oxamic acid, indicating
the formation of insignificant amounts of organic by-products
during all mineralization processes. In addition, the progres-
sive loss in oxidizable organic matter caused a continuous fall
in MCE.
Fig. 3 illustrates the predominance of N lost as NH4þ ion at
the end of all EAOPs tested to mineralize the 2.08 mM oxalic
acid solution at 33.3 mA cm�2. The larger proportion of N lost
as NO3� ion is found for AO-BDD, indicating that NH4
þ ion is
preferentially formed during the oxidation of Fe(III)eoxamate
species than oxamic acid. TN analysis of final electrolyzed
solutions confirmed the release of N as NOx species. For AO-
BDD-Fe2þ-UVA, for example, the initial 29.6 mg L�1 of N was
reduced to 23.1 mg L�1 in 270 min, i.e. when all oxamic acid is
mineralized, corresponding to a loss of 21.9% of N as NOx
species, a value close to 21.8% determined from the N
obtained for NH4þ (64%) and NO3
� (14.2%), as depicted in Fig. 3.
3.5. Mineralization of mixtures of oxalic and oxamicacids by EAOPs
Since a mixture of oxalic and oxamic acids is obtained as
ultimate by-product of the degradation of N-aromatics by
EAOPs (Sires et al., 2006; Hammami et al., 2008; Hamza et al.,
2009), the possible influence of the relative proportion of
both acids on their removal rate was investigated. To do this,
8%, 25% and 43% of oxamic acid were added to the 2.08 mM
oxalic acid solution to be treated by AO-BDD, AO-BDD-Fe2þ
and AO-BDD-Fe2þ-UVA at 33.3 mA cm�2, after adding 0.5 mM
Fe2þ in the two latter methods. The koxamic and koxalic values
wat e r r e s e a r c h 4 5 ( 2 0 1 1 ) 2 9 7 5e2 9 8 42980
100

determined simultaneously for these experiments are
summarized in Table 2.
For AO-BDD, similar koxamicw 1.1� 10�4 s�1 and koxalicw
1.5� 10�4 s�1 to that of pure solutions (see Table 1) are found,
evidencing that both acids are independently oxidized at the
BDD anode via direct charge transfer. In contrast, the compe-
tition between Fe(III)eoxamate and Fe(III)eoxalate complexes
causes a change in the removal rate of acids in the EAOPs with
Fe2þ. Thus, for AO-BDD-Fe2þ, koxalic gradually decays with
decreasing the percentage of oxamic acid, while koxamicw
1.3� 10�4 s�1 is similar to 1.2� 10�4 s�1 for pure ironeoxamate
complexes (see Table 1). This deceleration of oxalic acid
removal is due to the progressive formation of a larger propor-
tion of Fe(III)eoxalate complexes that are more difficultly
oxidizedwith BDD(�OH). Themuch faster destruction of Fe(III)e
oxamate species with this radical explains the slight change in
koxamic in all mixtures. The smaller amount of Fe(III)eoxamate
species formed and the rise in Fe(III)eoxalate ones with
decreasing the percentage of oxamic acid are also reflected in
AO-BDD-Fe2þ-UVA, where the low photoactivity of the former
accounts for the drop in koxamic, whereas the much greater
photoactivity of the latter justifies the slight increase in koxalic.
A slower removal of oxamic acid is then expected as its content
decreases, without significant effect on oxalic acid decay.
Fig. 4 e Proposed reaction sequence for themineralization of Fe(III)eoxalate complexes in acidic aqueousmedium by EAOPs
with Fe2D as catalyst under UVA irradiation using a BDD anode.
Table 2 e Pseudo first-order rate constant and square regression coefficient (in parenthesis) determined for the decay ofoxamic and oxalic acids during the degradation of 100 mL solutions of 2.08 mM oxalic acid and different percentages ofoxamic acid by several EAOPs at 33.3 mA cmL2.
% Oxamic acid AO-BDD AO-BDD-Fe2þ AO-BDD-Fe2þ-UVA
koxamic� 104 (s�1) koxalic� 104 (s�1) koxamic� 104 (s�1) koxalic� 104 (s�1) koxamic� 104 (s�1) koxalic� 104 (s�1)
43 1.05 (0.989) 1.53 (0.998) 1.33 (0.987) 1.03 (0.995) 2.27 (0.992) 7.65 (0.990)
25 1.12 (0.997) 1.54 (0.996) 1.27 (0.989) 0.97 (0.980) 2.00 (0.999) 7.62 (0.993)
8 1.12 (0.993) 1.50 (0.998) 1.36 (0.991) 0.72 (0.988) 1.61 (0.993) 7.90 (0.981)
wat e r r e s e a r c h 4 5 ( 2 0 1 1 ) 2 9 7 5e2 9 8 4 2981
101

3.6. Effect of current density and Fe2þ content on themineralization of oxamic acid by AO-BDD-Fe2þ-UVA
The abatement of TOC and oxamic acid content between
16.6 and 100 mA cm�2 for the most potent AO-BDD-Fe2þ-UVA
process is presented in Fig. 5a and b, respectively. The rise in
current density accelerates the decay of both parameters,
enhancing the oxidation power of the process. The time
required for overall mineralization (see Fig. 5a) is slightly
longer than that needed for total destruction of the acid (see
Fig. 5b), as expected if very low amounts of more recalcitrant
by-products are formed. A progressive loss in MCE as current
density increases can be observed in the inset panel of
Fig. 5a, whereas the opposite trend is found for koxamic in the
inset panel of Fig. 5b, which gradually increases from
1.48� 10�4 s�1 (R2¼ 0.999) for 16.6 mA cm�2 to 3.15� 10�4 s�1
(R2¼ 0.996) for 100 mA cm�2. This behavior agrees with the
expected production of more amounts of oxidant BDD(�OH)
from reaction (1) at greater current density (Brillas et al.,
2009; Panizza and Cerisola, 2009), accelerating the oxida-
tion of Fe(II) into Fe(III) complexes to be more quickly
photolyzed by UVA light. The loss in efficiency evidences
that the excess of generated BDD(�OH) is mainly wasted by
oxidation to O2 via reaction (16) (Marselli et al., 2003; Panizza
and Cerisola, 2009):
2BDD(�OH)/ 2 BDDþO2þ 2Hþþ 2e� (16)
The evolution of NH4þ and NO3
� ions detected during
360 min in the above experiments is shown in Fig. 6a and b,
respectively. NH4þ ion is continuously accumulated up to
33.3 mA cm�2, but it undergoes a gradual drop as electrolysis
time is prolonged at current densities� 66.6 mA cm�2. The
fast removal of NH4þ ion at 100 mA cm�2 is accompanied by
a large NO3� accumulation, while much lower contents of this
ion are found at lower current densities. Increasing percent-
ages of N lost as NOx species of 15.3%, 21.8%, 44.0% and 55.5%
were thus determined for 16.6, 33.3, 66.6 and 100 mA cm�2,
also confirmed from TN analysis of final electrolyzed
solutions. These findings suggest that high current densities
accelerate the parasite oxidation of NH4þ to NO3
� ion with the
greater amounts of BDD(�OH) produced, increasing the loss of
NOx species. This suggestion was corroborated by electro-
lyzing a (NH4)2SO4 solution with 20 mg L�1 of N under similar
conditions. For 100 mA cm�2, NH4þ ion was totally removed in
270 min generating 4.6 mg L�1 of N as NO3� ion and releasing
78% of N as NOx species. In contrast, after 360 min of elec-
trolysis at 33.3 mA cm�2, 11.3 mg L�1 of N as NH4þ ion and
1.2 mg L�1 of N as NO3� ion were found, with loss of 37% of N
as NOx species. Note that NH4þ is converted into NO3
� in larger
extent in the treatment of (NH4)2SO4 than oxamic acid,
0
50
100
150
0 60 120 180 240 300 360 420
[Oxa
mic
aci
d] /
mg
L-1
time / min
0
10
20
30
40
50
60a
b
TO
C /
mg
L-1
0
1
2
3
4
5
0 60 120 180 240 300 360 420
ln (C
0 /C)
time / min
0 60 120 180 240 300 360 4200
10
20
30
40
% M
CE
time / min
Fig. 5 e Effect of current density on (a) TOC removal and (b)
concentration decay for the AO-BDD-Fe2D-UVA treatment
of 100 mL of 2.08 mM oxamic acid in 0.05 M Na2SO4 with
0.5 mM Fe2D at pH 3.0 and 35 �C. Current density: (B)16.6 mA cmL2, (,) 33.3 mA cmL2, (>) 66.6 mA cmL2 and
(6) 100 mA cmL2. The inset panels show (a) the
mineralization current efficiency calculated from Eq. (4)
and (b) the kinetic analysis assuming a pseudo first-order
reaction for oxamic acid.
Fig. 6 e Evolution of the concentration of (a) ammonium
and (b) nitrate ions released during the experiments of
Fig. 5.
wat e r r e s e a r c h 4 5 ( 2 0 1 1 ) 2 9 7 5e2 9 8 42982
102

probably because NH4þ ion is gradually released to the
medium in the latter case and its oxidation at the BDD anode
competes with that of ironeoxamate complexes.
Fig. 7a evidences that oxamic acid removal is inhibited
with increasing Fe2þ content. This trend can be related to
a gradual decay in rate of the reaction between Fe(II)eoxamate
species and BDD(�OH), decelerating its conversion into pho-
toactive Fe(III) complexes, due to the competition of the
oxidation of larger amounts of free Fe2þ to Fe3þ ion at the
anode (Sires et al., 2007). The reduction of Fe3þ ion at the SS
cathode regenerates the Fe2þ ion and maintains the equilib-
rium between both ions in solution (Brillas et al., 2009). The
loss of oxidation ability of the system is also reflected in
Fig. 7b, where higher Fe2þ content causes a gradual decay in
the percentage of N lost as NO3� ion and a larger proportion of
N lost as NH4þ ion, with a similar percentage of N lost as NOx
species. The presence of small amounts of Fe2þ in solution
then minimizes the undesired oxidation of Fe2þ at the anode,
favouring the rapid conversion of Fe(II)eoxamate complexes
into photoactive Fe(III)eoxamate species.
4. Conclusions
Oxalic and oxamic acids were efficiently mineralized by AO-
BDD-Fe2þ-UVA, as a result of the high photoactivity of their Fe
(III) complexes that are continuously regenerated by oxidation
of their Fe(II) complexes with BDD(�OH) formed at the anode
surface and H2O2 generated from O2 reduction or BDD(�OH)
dimerization. In this method, oxamic acid was more recalci-
trant by the lower photoactivity of its Fe(III) complexes,
releasing a larger proportion of NH4þ than NO3
� ion. The loss
of volatile NOx species was confirmed from TN analysis of the
final electrolyzed solutions. Each acid underwent a similar
decay in AO-BDD-Fe2þ and EF-BDD since its iron complexes
were not attacked with �OH in the bulk. AO-BDD also allowed
the total conversion of oxalic acid into CO2 by direct charge
transfer at the anode. This process explained the slower
destruction of oxamic acid by thismethod. In contrast, oxamic
acid was less recalcitrant in AO-BDD-Fe2þ and EF-BDD, since
Fe(III)eoxamate complexes were oxidized more quickly with
BDD(�OH) than Fe(III)eoxalate ones. TOC always decayed
similarly to the corresponding acid, indicating a insignificant
formation of by-products. While both acids when mixed were
independently oxidized at the anode in AO-BDD, the propor-
tion of their Fe(III) complexes and their ability to be oxidized
and/or photolyzed affected their degradation rate in the EAOPs
with Fe2þ. For the most potent AO-BDD-Fe2þ-UVA, a lower
oxamic acid content decelerated its degradation, without
significant effect on oxalic acid decay. Greater current density
enhanced the oxidation power of this method since oxamic
acid removal was accelerated, but losing efficiency. High Fe2þ
contents inhibited the oxidation of Fe(II)eoxamate complexes
by the competitive oxidation of free Fe2þ to Fe3þ. Low current
densities and Fe2þ contents are then preferable for the more
efficient removal of these acids in AO-BDD-Fe2þ-UVA.
Acknowledgements
The authors acknowledge financial support from MICINN
(Ministerio de Ciencia e Innovacion, Spain) under the project
CTQ2010-16164/BQU, cofinanced with FEDER funds. S. G.-S.
thanks the grant awarded from MEC (Ministerio de Educacion
y Ciencia, Spain).
r e f e r e n c e s
Andreozzi, R., Caprio, V., Insola, A., Marotta, R., 1999. Advancedoxidation processes (AOP) for water purification and recovery.Catal. Today 53 (1), 51e59.
Balci, B., Oturan, N., Cherrier, R., Oturan, M.A., 2009. Degradationof atrazine in aqueous medium by electrocatalyticallygenerated hydroxyl radicals. A kinetic and mechanistic study.Water Res. 43 (7), 1924e1934.
Balmer, M.E., Sulzberger, B., 1999. Atrazine degradation inirradiated iron/oxalate systems: effects of pH and oxalate.Environ. Sci. Technol. 33 (14), 2418e2424.
Brillas, E., Banos,M.A., Camps, S., Arias, C., Cabot, P.L., Garrido, J.A.,Rodrıguez, R.M., 2004. Catalytic effect of Fe2þ, Cu2þ and UVA
0
50
100
150
200a
b
0 60 120 180 240 300 360 420
[Oxa
mic
aci
d] /
mg
L-1
time / min
0
20
40
60
80
100
4:1 2:1 1:1 1:2 1:4
% N
itro
gen
lost
[Oxamic acid]/[Fe2+] ratio
Fig. 7 e (a) Effect of Fe2D content on the decay of oxamic
acid concentration for the AO-BDD-Fe2D-UVA degradation
of 100 mL of 2.08 mM of the carboxylic acid in 0.05 M
Na2SO4 at pH 3.0, 33.3 mA cmL2 and 35 �C. [Oxamic acid]/
[Fe2D] ratio: (B) 4:1, (,) 2:1, (>) 1:1, (6) 1:2 and (7) 1:4. (b)
Percentage of nitrogen lost as ( ) NH4D ion, ( ) NO3
L ion
and ( ) NOx species vs. [oxamic acid]/[Fe2D] ratio at the
end of these experiments.
wat e r r e s e a r c h 4 5 ( 2 0 1 1 ) 2 9 7 5e2 9 8 4 2983
103

light on the electrochemical degradation of nitrobenzene usingan oxygen-diffusion cathode. New J. Chem. 28 (2), 314e322.
Brillas, E., Sires, I., Oturan, M.A., 2009. Electro-Fenton process andrelated electrochemical technologies based on Fenton’sreaction chemistry. Chem. Rev. 109 (12), 6570e6631.
Brillas, E., Garcia-Segura, S., Skoumal, M., Arias, C., 2010.Electrochemical incineration of diclofenac in neutral aqueousmedium by anodic oxidation using Pt and boron-dopeddiamond anodes. Chemosphere 79 (6), 605e612.
Canizares, P., Garcıa-Gomez, J., Lobato, J., Rodrigo, M.A., 2003.Electrochemical oxidation of aqueous carboxylic acid wastesusing diamond thin-film electrodes. Ind. Eng. Chem. Res.42 (5), 956e962.
Canizares, P., Beteta, A., Saez, C., Rodrıguez, L., Rodrigo, M.A.,2008. Use of electrochemical technology to increase thequality of the effluents of bio-oxidation processes. A casestudied. Chemosphere 72 (7), 1080e1085.
Diagne, M., Oturan, N., Oturan, M.A., 2007. Removal of methylparathion fromwater by electrochemically generated Fenton’sreagent. Chemosphere 66 (5), 841e848.
Faria, P.C.C., Orfao, J.J.M., Pereira, M.F.R., 2008. Activated carboncatalytic ozonation of oxamic and oxalic acids. Appl. Catal. B:Environ. 79 (3), 237e243.
Faust, B.C., Zepp, R.G., 1993. Photochemistry of aqueous iron(III)-polycarboxylate complexes: roles in the chemistry ofatmospheric and surface waters. Environ. Sci. Technol. 27 (12),2517e2522.
Gandini, D., Mahe, E., Michaud, P.A., Haenni, W., Perret, A.,Comninellis, Ch, 2000. Oxidation of carboxylic acids at boron-doped diamond electrodes for wastewater treatment. J. Appl.Electrochem. 30 (12), 1345e1350.
Guinea, E., Centellas, F., Garrido, J.A., Rodrıguez, R.M., Arias, C.,Cabot, P.L., Brillas, E., 2009. Solar photoassisted anodic oxidationof carboxylic acids in presence of Fe3þ using a boron-dopeddiamond electrode. Appl. Catal. B: Environ. 89 (3e4), 459e468.
Hammami, S., Bellakhal, N., Oturan, N., Oturan, M.A.,Dachraoui, M., 2008. Degradation of acid orange 7 byelectrochemically generated �OH radicals in acidic aqueousmedium using a boron-doped diamond or platinum anode. Amechanistic study. Chemosphere 73 (5), 678e684.
Hamza, M., Abdelhedi, R., Brillas, E., Sires, I., 2009. Comparativeelectrochemical degradation of the triphenylmethane dyemethyl violet with boron-doped diamond and Pt anodes.J. Electroanal. Chem. 627 (1e2), 41e50.
Jeong, J., Yoon, J., 2005. pH effect on OH radical production inphoto/ferrioxalate system. Water Res. 39 (13), 2893e2900.
Kwan, C.Y., Chu, W., 2007. The role of organic ligands in ferrous-induced photochemical degradation of 2,4-dichlorophenoxyacetic acid. Chemosphere 67 (8), 1601e1611.
Lan, Q., Li, F.B., Sun, C.X., Liu, C.S., Li, X.Z., 2010. Heterogeneousphotodegradation of pentachlorophenol and iron cycling withgoethite, hematite and oxalate under UVA illumination.J. Hazard. Mater. 174 (1e3), 64e70.
Martınez-Huitle, C.A., Ferro, S., De Battisti, A., 2004.Electrochemical incineration of oxalic acid: role of electrodematerial. Electrochim. Acta 49 (22e23), 4027e4034.
Marselli, B., Garcıa-Gomez, J., Michaud, P.A., Rodrigo, M.A.,Comninellis, Ch, 2003. Electrogeneration of hydroxyl radicalson boron-doped diamond electrodes. J. Electrochem. Soc. 150(3), D79eD83.
Monteagudo, J.M., Duran, A., Lopez-Almodovar, C., 2008.Homogeneus ferrioxalate-assisted solar photo-Fentondegradation of orange II aqueous solutions. Appl. Catal. B:Environ. 83 (1e2), 46e55.
Oturan, M.A., Pimentel, M., Oturan, N., Sires, I., 2008. Reactionsequence for the mineralization of the short-chain carboxylicacids usually formed upon cleavage of aromatics during
electrochemical Fenton treatment. Electrochim. Acta 54 (2),173e182.
Ozcan, A., S‚ ahin, Y., Koparal, A.S., Oturan, M.A., 2008. Prophammineralization in aqueous medium by anodic oxidation usingboron-doped diamond anode. Experimental parameters’influence on degradation kinetics and mineralizationefficiency. Water Res. 42 (12), 2889e2898.
Panizza, M., Cerisola, G., 2009. Direct and mediated anodicoxidation of organic pollutants. Chem. Rev. 109 (12),6541e6569.
Pardo, E., Lloret, F., Carrasco, R., Munoz, M.C., Temporal-Sanchez, T., Ruiz-Garcıa, R., 2004. Chemistry and reactivity ofdinuclear iron oxamate complexes: alkane oxidation withhydrogen peroxide catalysed by an oxo-bridged diiron(III)complex with amide and carboxylate ligation. Inorg. Chim.Acta 357 (9), 2713e2720.
Pera-Titus, M., Garcıa-Molina, V., Banos, M.A., Gimenez, J.,Esplugas, S., 2004. Degradation of chlorophenols by means ofadvanced oxidation processes: a general review. Appl. Catal. B:Environ. 47 (4), 219e256.
Rodrıguez, E., Mimbrero, M., Masa, F.J., Beltran, F.J., 2007.Homogeneous iron-catalyzed photochemical degradation ofmuconic acid in water. Water Res. 41 (6), 1325e1333.
Ruiz, E.J., Arias, C., Brillas, E., Hernandez-Ramırez, A., Peralta-Hernandez, J.M., 2011. Mineralization of acid yellow 36 azo dyeby electro-Fentonand solar photoelectro-Fentonprocesseswitha boron-doped diamond anode. Chemosphere 82 (4), 495e501.
Scialdone, O., Galia, A., Guarisco, C., Randazzo, S., Filardo, G.,2008. Electrochemical incineration of oxalic acid at borondoped diamond anodes: role of operative parameters.Electrochim. Acta 53 (5), 2095e2108.
Serra, A., Domenech, X., Arias, C., Brillas, E., Peral, J., 2009.Oxidation of a-methylphenylglycine under Fenton andelectro-Fenton conditions in the dark and in the presence ofsolar light. Appl. Catal. B: Environ. 89 (1e2), 12e21.
�Sima, J., Maka�nova, J., 1997. Photochemistry of iron(III)complexes. Coord. Chem. Rev. 160, 161e189.
Sires, I., Garrido, J.A., Rodrıguez, R.M., Cabot, P.L., Centellas, F.,Arias, C., Brillas, E., 2006. Electrochemical degradation ofparacetamol from water by catalytic action of Fe2þ, Cu2þ, andUVA light on electrogenerated hydrogen peroxide.J. Electrochem. Soc. 153 (1), D1eD9.
Sires, I., Centellas, F., Garrido, J.A., Rodrıguez, R.M., Arias, C.,Cabot, P.L., Brillas, E., 2007. Mineralization of clofibric acid byelectrochemical advanced oxidation processes using a boron-doped diamond anode and Fe2þ and UVA light as catalysts.Appl. Catal. B: Environ. 72 (3e4), 373e381.
Sires, I., Brillas, E., Cerisola, G., Panizza, M., 2008. Comparativedepollution ofmecoprop aqueous solutions by electrochemicalincineration using BDD and PbO2 as high oxidation poweranodes. J. Electroanal. Chem. 613 (2), 151e159.
Sun, Y., Pignatello, J.J., 1993. Photochemical-reactions involved inthe total mineralization of 2,4-D by Fe3þ/H2O2/UV. Environ. Sci.Technol. 27 (2), 304e310.
Vandini, T.A., Rao, T.N., Fujishima, A., Einaga, Y., 2006.Electrochemical oxidation of oxalic acid at highly boron-dopeddiamond electrodes. Anal. Chem. 78 (10), 3467e3471.
Weiss, E., Groenen-Serrano, K., Savall, A., Comninellis, Ch, 2007.A kinetic study of the electrochemical oxidation of maleic acidon boron doped diamond. J. Electroanal. Chem. 37 (1), 41e47.
Zuo, Y., Hoigne, J., 1992. Formation of hydrogen peroxide anddepletion of oxalic acid in atmospheric water by photolysis ofiron(III)-oxalato complexes. Environ. Sci. Technol. 26 (5),1014e1022.
Zuo, Y., Hoigne, J., 1994. Photochemical decomposition of oxalic,glyoxalic and pyruvic acid catalysed by iron in atmosphericwaters. Atmos. Environ. 28 (7), 1231e1239.
wat e r r e s e a r c h 4 5 ( 2 0 1 1 ) 2 9 7 5e2 9 8 42984
104

Results and Discussion
�����
Electrochemical Advanced Oxidation
Processes applied to the treatment of
wastewaters polluted with azo dyes

Results and Discussion �
�����

Results and Discussion
����
During the last years our research group LEMMA has started to investigate the
remediation of industrial effluents from dying industries (Ruiz et al., 2011; Salazar et al.,
2011; Almeida et al., 2012; Moreira et al., 2013; Ramírez et al., 2013). Large volumes of
these coloured wastewaters are discharged into water bodies such as lakes and rivers,
where they cause aesthetic problems and serious health and environmental risks because
of the toxicity, carcinogenic and mutagenic properties of dyes and its by-products
(Sharma et al., 2007; Umbuzeiro et al., 2005). Even at low concentrations, these pollutants
are able to dye completely huge water volumes.
Azo dyes, which are characterized by the presence of one or more azo bonds as
chromophore group, represent about 70 % of the world dye production. Azo dyes are
highly persistent under ambient conditions and hardly removed under biological
conventional treatments in sewage treatment plants (Robinson et al., 2001). One of the
main targets on dyes treatment is the color removal which is the most visible pollution
effect. So, powerful oxidation processes are required for the destruction of these POPs to
avoid their adverse impact and EAOPs emerge as promising technologies that allows the
decolorization and removal of these polluted water bodies.
This section reports the degradation of synthetic wastewaters polluted with four azo dyes
Acid Orange 7 (AO7), Acid Red 151 (AR151), Direct Blue 71 (DB71) and Direct Yellow
4 (DY4) by several EAOPs. The color removal process has received special attention due
to its industrial interest. The SPEF process for DY4 solutions was scaled-up to a 10 L pre-
pilot flow plant completely autonomous with electric energy provided by a 50 W solar
photovoltaic panel, evidencing the possibility of the renewable energy use and
maintenance costs reduction. Lastly, due to the identification of phthalic acid and their
derivatives during the naphthalenic rings cleavage (Isarain-Chávez et al., 2011; Moreira
et al., 2013), a genuine study on phthalic acid degradation by the EAOPs tested with a
complete characterization of by-products was carried out. Phthalic acid and phthalate
derivatives are the major industrial materials used as plasticisers to manufacture plastic
products. These products are classified as priority pollutants by USEPA (United States
Environmental Protection Agency 7407, 1994) due to their adverse effects on living
beings (Oishi and Hiraga, 1980; Makoto et al., 1997). Consequently, their removal study
is of great interest by itself as well as to better understand the degradation pathways of
azo dyes with naphthalenic groups.

Results and Discussion �
����
The decolorization process represents the first step for the remediation of waters
containing azo dyes and in some cases the generated by-products are biodegradable and
less toxic. This process was deeply studied by trying to clarify the influence of the number
of azo bonds per dye molecule. For this purpose, the destruction of the monoazo AO7,
diazo AR151 and triazo DB71 was tested by EF. These azo dyes present similar structures
with equal functional groups such as –OH and –SO3− groups.
The role of �OH generated in EF was assessed by comparison with the direct AO using
Pt/ADE, BDD/ADE, Pt/graphite and BDD/graphite cells. From these results, the
reduction of the azo bond on the graphite cathode was demonstrated, but it cannot take
place on the ADE because this cathode mainly involves the bielectronic reduction of O2
to H2O2. That fact is of extreme relevance since the reduction processes usually affect
negatively the degradation processes (El-Ghenymy et al., 2012, 2013a), which are
avoidable using an ADE cathode. The comparison of these four AO processes with the
EF treatment showed that the main oxidant of the azo dyes is the �OH produced in the
bulk from Fenton’s reaction (10), instead of the radicals formed at the anode surface.
The results obtained for the decolorization of solutions evidenced the high photostability
of azo dyes that were not discoloured by UVA radiation (Martínez-Huitle and Brillas,
2009) since they were only degraded by the action of �OH radicals generated in the
processes.
The effect of the number of azo bonds on the decolorization process was assessed from
the change of the azo dye concentration and the applied current density. For this purpose,
the color removal vs time, the kdec value calculated as the slope of the corresponding
ln(A0/A)-t plot and the real pseudo-first order rate determined from the dye concentration
decay were determined. Furthermore, a new comparative parameter so-called initial
decoloration rate (δ0) was introduced, being defined as the slope of the linear fitting
between the percentage of color removal and t at the beginning of the process, i.e. up to
20-25% of the absorbance decay when the dye is the main responsible of the solution
color because of the low content of intermediates generated.
The plot of δ0 with dye concentration revealed a gradual and quick decay when the dye
concentration increased. The initial decolorization rate decreased in the sequence
monoazo > diazo> triazo indicating that �OH reacts more slowly at higher number of azo
bonds, thereby making the decolorization process less potent. If the same δ0 results were

Results and Discussion
�����
plotted versus the azo bond concentration in solution instead of the dye concentration,
higher differences were found in the same sequence (monoazo> diazo > triazo). This was
justified by the greater activation energy needed for the electrophilic attack of •OH
radicals when the number of azo bonds per molecule increases due to the formation of
larger and more stable conjugated π systems.
Table 11 shows a similar δ0 value for the diazos DY4 and AR151 at the same azo bond
concentration in solution and applied density current, evidencing the high influence of
the number of azo bonds as a control parameter. The diazo dye AR151 contains two
benzenic and one naphthalenic ring, whereas the DY4 contains four benzenic rings. The
increase in aromatic conjugated rings is a structural effect that increases the stabilization
of the π systems decreasing the decolorization rate, although this effect is not appreciable
in this case. As far as it is known, naphthalene rings introduce higher stability than
benzenic rings, but the presence of an additional benzenic ring in the DY4 structure
compensates the additional stabilisation of the naphtalene ring in AR151 and hence, the
stabilisation of both dyes by their π systems is quite similar.
The δ0 determined for DY4 in the pre-pilot flow plant was almost the half value obtained
for the stirred tank reactor (Table 11). This difference was related to the different
electrode area/volume ratio that is appreciably lower in the pre-pilot flow plant where a
considerably higher volume is treated and consequently, a lower concentration of �OH is
active to attack the organic matter. The lower concenration of �OH and the greater
volumes treated in the pre-pilot plant make the process slower justifying the smaller δ0
values found, which would be enhanced coupling more electrochemical cells.
Table 11. Initial decolorization rate (δ0) determined for the EF treatment of 100 mL of
solutions of the azo dyes AO7, AR151, DB71and DY4 with a concentration equivalent to
0.600 mM of azo bonds in 0.05 mM Na2SO4 with 0.50 mM Fe2+ at pH 3.0, 35 ºC and 33.3
mA cm-2. Initial decolorization rate for 10 L of 0.600 mM azo bonds concentration of DY4
in the pre-pilot plant by SPEF treatment under the same conditions.
AO7 AR151 DB71 DY4 DY4 pre-pilot plant
δδ0 / s−1 0.175 0.121 0.091 0.122 0.055

Results and Discussion �
�����
In the case of the SPEC treatment, the maximum dye concentrations treatable and the
times needed to achieve a complete color removal were very far away from the highly
efficient EAOPs. For 15 mg L−1 AO7 in 0.05 M Na2SO4 of pH 7, complete color removal
was achieved in 120 min by SPEC, whereas SPC and AO showed only 21% and 41% of
color removal after 300 min. These findings confirmed that the SPEC process was
synergistic and not cumulative from the SPC and AO processes because only 45% was
attained form the sum of both treatments at 120 min.
The dye concentration affects directly the efficiency of the SPEC treatment showing that
greater concentration results in a gradual loss in color removal. This behaviour can be
associated with the increasing consumption of �OH by more amounts of organics formed
on the TiO2 surface, along with a fall in photogeneration efficiency because of the loss of
solution transparency with rising dye content (Fujishima et al., 2008). The results
evidenced good color removal rates up to 15 mg L−1 of AO7, which can be taken as the
best concentration for SPEC application.
The influence of applied current density was also evaluated for the EAOPs. The δ0-j plots
showed a linear relationship between 16.7 and 83.3 mA cm-2 for all the azo dyes, but with
lower relative increases for each dye in the sequence monoazo> diazo> triazo. This
smaller reactivity was related to an increase in rate of the parasitic reactions of �OH
because of the greater stability of the dyes with higher number of azo bonds per molecule.
The decolorization pseudo-first order rate (kdec) determined from the absorbance decay
and the pseudo-first-order rate constant (k1) found from the compound decay using HPLC
increased when j rose. Both parameters showed a similar trend to that predicted for δ0
confirming the validity of the analysis performed with this parameter on the
decolorization ability of EF. However, kdec cannot be used to predict the comparative total
decolorization of the initial dye due to the large accumulation of more recalcitrant colored
intermediates that induce an appreciable error. The difference between the concentration
decay and the absorbance abatement evidenced that the solution color was not related to
the dye concentration by the Lambert-Beer law because of the generation of some by-
products with the same or similar λmax to the treated dye. This effect was well reflected
in the UV-vis spectra of the DY4 solution registered at different times, as can be seen in
Fig. 13, where the intensity of both bands dropped rapidly during the first 20-25 min of
electrolysis, as expected if non-conjugated molecules are gradually formed. Besides, the
maximal of 400 nm of the major band was

Results and Discussion
�����
Figure 13. UV–vis spectra recorded for the DY4 solution up to 50 min of electrolysis for
the degradation of 100 mL of a 200 mg L−1 DY4 solution in 0.05 M Na2SO4 with 0.5 mM
Fe2+ at pH 3.0, 33.3 mA cm−2 and 35 ºC by EF.
progressively shifted to a lower value of 348 nm and this band was simultaneously
widened, suggesting the generation of colored by-products.
When the effect of the anodic current density on decolorization and decay kinetics was
studied for SPEC, it showed that a janod as low as 0.23 mA cm-2 enhanced strongly the
decolorization efficiency of the solution compared with SPC. The increase of janod to 1.0
mA cm-2 caused a quicker color removal owing to a faster electron-hole separation at the
photoanode. The dye concentration decay showed a similar behaviour as well as
increasing k1 values at higher janod. Even though it cannot compete with the quicker
removal of EAOPs, the remarkably lower energy consumption in comparison makes it an
interesting process to study and improve.
The evaluation of the mineralization during the EAOPs of solutions containing 200 mg
L-1 of DY4 in 0.05 M Na2SO4 with 0.5 mM Fe2+ at pH 3.0 and 35 ºC confirmed the
feasibility of these electrochemical processes for wastewater remediation. The knowledge
obtained for the EF and PEF processes in previous works with drugs and carboxylic acids
allowed us the better understanding of the photo-Fenton process and the proposal of a
new process so-called photo-assisted electro-Fenton (PA-EF). Complete color removal
0.0
0.5
1.0
1.5
2.0
200 300 400 500 600 700
A
λ / nm
t = 0 min
t = 50 min

Results and Discussion �
�����
was obtained at 40 min of treatment at j = 33.3 mA cm-2. The time required for total
decolorization decreased with rising j. The DOC evolution showed almost a complete
removal by PEF and only an 83% by EF, as expected by the accumulation of carboxylic
acids. The innovative PA-EF process consisted in stop the electrochemical process and
start the solution irradiation when all the carboxylic acids are generated and accumulated
and no aromatic compounds remain in solution. So, the PA-EF process attained a similar
mineralization degree to PEF although with a considerable lower energy consumption.
The carboxylic acid analysis sheds light on the role played by UVA irradiation. It
revealed, for example, that maleic acid is not photolyzed by UVA but it is efficiently
oxidized by �OH. In contrast, the complexes of Fe(III) and oxalic acid, accumulated in
major extent, justifies the efficiency of the PA-EF process. Unexpectedly, oxamic acid
was largely produced under UVA light, probably by photolysis of some N-intermediates
that accelerates its production helping to achieve the total mineralization.
The slower mineralization in the pre-pilot plant by SPEF facilitated the identification of
more carboxylic acids as DY4 intermediates. These acids had longer chains than the
recalcitrant oxalic acid and were quickly destroyed by the action of generated �OH. Their
fast removal justified their difficult identification in the tank reactor system. Although
longer times were required in the pre-pilot plant for the treatment of high volumes of
dying effluents, the SPEF treatment was suitable for their remediation. Furthermore, the
use of photovoltaic energy that is environmentally friendly and a renewable energy source
evidenced that SPEF could be applied without energy consumption making it really
interesting and affordable.
During the SPEC treatment of AO7, phthalic, tartaric, succinic, acetic and oxamic acids
were detected as generated carboxylic acids. The sum of the DOC of these species
represented the 86% of DOC of the final solution. Except oxamic acid, all these acids
were formed from the beginning of the SPEC treatment. These findings corroborate the
low ability of �OH produced in the SPEC process to destroy the recalcitrant carboxylic
acids, where the last carboxylic acid, oxalic acid, was not generated.
Under EF and PEF conditions, only the 30% of total N contained in DY4 remained in
solution, corresponding to a similar concentration of NH4+ and NO3−, about 6 and 7 mg
L−1, respectively. In contrast, the PA-EF process yielded a higher N concentration of 44.6
% in solution due to a higher accumulation of both NH4+ and NO3− ions (around 9 mg L−1

Results and Discussion
�����
in both cases). These findings demonstrate that the N remaining in solution is mainly
transformed into inorganic ions, although the major part of N of DY4 is lost as volatile
derivatives (such as N2 and NOx species) as it is usual in azo-compounds (Moreira et al.,
2013). The smaller accumulation of ions in EF and PEF than in PA-EF suggests that the
N-volatile derivatives proceed from the oxidation with �OH and BDD(�OH).
When the evolution of N was analyzed for the SPEF process in the pre-pilot plant, higher
percentages of N were transformed into NH4+. This phenomenon could be related to the
higher photoefficiency of the CPC photoreactor that allows a major generation of
inorganic species, like in the case of PA-EF.
The same effect as in EF and PEF occurred in SPEC, where the major part of N (80.8%)
was loss as volatile derivatives like N2 or NOx. This large loss of N as volatile species
could be explained by the main rupture of azo bond releasing highly stable N2.
LC-MS analysis of initially electrolyzed DY4 solutions by SPEF allowed the
identification of eleven aromatic compounds and twenty two hydroxylated derivatives.
By-products formed by the consecutive breaking of the two azo bonds of the dye and
from the deamination, desulfonation, hydroxylation, nitration and carboxylation of their
benzenic groups were detected and a complete degradation pathway from these results
was proposed.
The breakage of naphthalenic rings of azo dyes led to phthalic acid as by-product (Özcan
et al., 2009; Isarain-Chávez et al., 2011; Moreira et al., 2013) and due to their toxicity, a
further study of this compound was carried out for a better knowledge of its
mineralization pathway by EAOPs. The phthalic acid decay by AO, EF and SPEF was
analyzed by HPLC using iron and copper ions and their mixtures as Fenton’s catalysts.
Phthalic acid was removed at similar rates by all the methods mainly because the poor
reduction of Fe3+ and Cu2+ to the catalytic species Fe2+ and Cu+ decreasing the production
of �OH by Fenton’s reaction (10) and making the BDD(�OH) radical as the main
oxidizing species. The DOC removal evidenced higher efficiencies for SPEF due to the
quick removal of metal-carboxylate complexes by photolysis. The treatment in the
presence of Cu2+ yielded lower and slower photodegradation than with Fe3+. Surprisingly,
however, the assays realized with mixtures of both metallic ions led to

Results and Discussion �
�����
Table 12. Stability constants for carboxylic acids generated as intermediates and complexed with iron or copper ions at different ionic strengths (Smith and Martell, 1977).
Acid Metalliccenter
Complexes Log k, 25 ºC, I=0.1
Log k, 25 ºC, I=1.0
Log k, 25 ºC, I=0
Acetic Cu2+ [ML]/ [M][L] 1.83 1.71 2.22 [ML2]/ [M][L]2 3.09 2.71 3.63 [ML3]/ [M][L]3 -- 3.10 3.58 [ML4]/ [M][L]4 -- 2.90 3.30 Fe2+ [ML]/ [M][L] -- -- 1.40 Fe3+ [ML]/ [M][L] 3.38 3.20 --
Formic Cu2+ [ML]/ [M][L] 1.38 1.40 2.00 [ML2]/ [M][L]2 -- 2.30 -- [ML3]/ [M][L]3 -- 2.68 -- [ML4]/ [M][L]4 -- 1.90 -- Fe3+ [ML]/ [M][L] -- 3.10 --
Fumaric Cu+ [ML]/ [M][L] -- -- 2.51 Cu2+ [ML]/ [M][L] 3.96 -- --
Maleic Cu+ [ML]/ [M][L] 3.05 -- -- Cu2+ [ML]/ [M][L] 3.40 -- -- [ML2]/ [M][L]2 5.48 -- -- [ML3]/ [M][L]3 6.20 -- -- Malic Cu2+ [ML]/ [M][L] 3.42 -- --
Fe3+ [ML]/ [M][L] 7.10 -- -- Malonic Cu2+ [ML]/ [M][L] 5.03 4.63 5.70
Fe2+ [ML]/ [M][L] -- 2.17 -- [ML2]/ [M][L]2 -- 3.21 -- Fe3+ [ML]/ [M][L] 7.57 7.50 -- [ML2]/ [M][L]2 -- 13.04 -- [ML3]/ [M][L]3 -- 16.60 --
Oxalic Cu2+ [ML]/ [M][L] 4.85 5.53 6.23 [ML2]/ [M][L]2 9.81 9.54 10.27 Fe2+ [ML]/ [M][L] -- 3.05 -- [ML2]/ [M][L]2 -- 5.15 -- Fe3+ [ML]/ [M][L] 7.53 7.58 7.74 [ML2]/ [M][L]2 13.64 13.81 [ML3]/ [M][L]3 18.49 18.6
Pyruvic Cu2+ [ML]/ [M][L] 1.40 2.20 1.35 [ML2]/ [M][L]2 2.60 4.90 2.05 Fe2+ [ML]/ [M][L] -- 0.69 --
Tartaric Cu2+ [ML]/ [M][L] 2.5 2.65 -- [ML2]/ [M][L]2 -- 4.38 -- Fe2+ [ML]/ [M][L] 2.24 1.43 -- [ML2]/ [M][L]2 -- 2.50 -- Fe3+ [ML]/ [M][L] -- 5.73 --
Tartronic Cu2+ [ML]/ [M][L] 5.31 -- -- Succinic Cu2+ [ML]/ [M][L] 2.60 -- 3.28 Fe2+ [ML]/ [M][L] 1.40 -- -- Fe3+ [ML]/ [M][L] 6.88 -- --

Results and Discussion
�����
faster and higher removal rates due to synergistic effects involving photodecarboxylation
with Fe2+ regeneration and enhancement of �OH production which is able to mineralize
the Cu(II) complexes (Flox et al., 2006; Salazar et al., 2012). In some cases, the Cu(II)
complexes are preferentially formed compared to the iron ones (see Table 12) and are
faster mineralized by �OH and BDD(�OH) and poorly photolyzed. In contrast, the Fe(III)
complexes are slowly mineralized by BDD(�OH) and quickly photolyzed (Guinea et al.,
2009; Garcia-Segura and Brillas, 2011). Using a mixture of 0.125 mM of Cu2+ and 0.375
mM of Fe3+, DOC was reduced by 99% in 240 min while phthalic acid disappeared in
less than 60 min, illustrating the high efficiency of SPEF for this pollutant remediation.
From LC-MS, eleven aromatic by-products of phthalic acid were detected, while ion-
exclusion HPLC allowed identifying six short-linear carboxylic acids. From all these
oxidation products, a plausible degradation pathway, which will be applicable whenever
phthalic acid or phthalates would be found as by-products of azo dyes, was finally
proposed.

Results and Discussion �
�����

Results and Discussion
����
PAPER 4
Comparative decolorization of monoazo,
diazo and triazo dyes by electro-Fenton
process

Results and Discussion �
����

Electrochimica Acta 58 (2011) 303– 311
Contents lists available at SciVerse ScienceDirect
Electrochimica Acta
jou rn al hom epa ge: www.elsev ier .com/ locate /e lec tac ta
Comparative decolorization of monoazo, diazo and triazo dyes by electro-Fenton
process
Sergi Garcia-Segura, Francesc Centellas, Conchita Arias, José A. Garrido, Rosa M. Rodríguez,Pere L. Cabot1, Enric Brillas ∗,1
Laboratori d’Electroquímica dels Materials i del Medi Ambient, Departament de Química Física, Facultat de Química, Universitat de Barcelona, Martí i Franquès 1-11,
08028 Barcelona, Spain
a r t i c l e i n f o
Article history:
Received 29 July 2011
Received in revised form
17 September 2011
Accepted 19 September 2011
Available online 29 September 2011
Keywords:
Acid Orange 7
Acid Red 151
Direct Blue 71
Decolorization rate
Electro-Fenton
a b s t r a c t
The decolorization process of the monoazo Acid Orange 7, diazo Acid Red 151 and triazo Direct Blue
71, with similar aromatics and functional groups, has been comparatively studied by electro-Fenton.
Solutions of 100 cm3 of each azo dye in 0.05 mol dm−3 Na2SO4 with 0.5 mmol dm−3 Fe2+ of pH 3.0 were
electrolyzed in an undivided BDD/air-diffusion cell under galvanostatic conditions. Organics were oxi-
dized with hydroxyl radicals formed at the BDD anode from water oxidation and mainly in the bulk from
Fenton’s reaction between cathodically generated H2O2 and added Fe2+. A simple parameter so-called
initial decolorization rate was used to analyze the behaviour of the azo dyes at the beginning of the
process. This parameter decreased with increasing initial azo bonds concentration due to the oxidation
of more organic matter with similar amounts of hydroxyl radicals. It rose linearly with current density
by the greater production of these oxidants, even when similar color removal was found at long elec-
trolysis times, indicating that the process was mass-transfer controlled. The initial decolorization rate
became lower as the number of azo bonds in the molecule increased owing to their smaller reactivity
with hydroxyl radicals. Reversed-phase HPLC of electrolyzed solutions revealed the total removal of all
azo dyes following a pseudo first-order kinetics with rate constants that showed the same trends as
those predicted by initial decolorization rates. The pseudo first-order rate constants for decolorization
obtained from absorbance decay also showed similar tendencies, but they were not useful to describe
the comparative total decolorization of azo dye solutions because of the slower and parallel destruction
of colored conjugated intermediates formed during the electro-Fenton treatment.
© 2011 Elsevier Ltd. All rights reserved.
1. Introduction
Azo dyes are mainly used in textile and food industries and
represent about 70% of the world dye production. The chemical
structure of these compounds contains one or various azo groups
(–N N–) as chromophore, conjugated with aromatic systems [1].
Acid azo dyes, for example, have sulfonic groups that allow a strong
attachment to the cationic groups of fibers. Moreover, they are used
for manufacturing paints, inks, plastics and leather. The main prob-
lem of azo dyes is that they are discharged in large quantities in the
environment from industrial effluents. The entrance of these pol-
lutants in natural waters causes esthetic problems because of the
visible colorization of the water even at low concentration, as well
as serious health risks due to their toxicity to aquatic organisms and
∗ Corresponding author. Tel.: +34 93 4021223; fax: +34 93 4021231.
E-mail address: [email protected] (E. Brillas).1 ISE Active Member.
humans [2,3]. Azo dyes are very stable in the environment owing to
their persistence under natural oxidation and reduction conditions,
light exposure and biodegradation [1,4].
Different methods have been tested to remove azo dyes from
waters to avoid their environmental problems and hazardous
effects on living beings. Several studies have reported that physico-
chemical treatments like coagulation [5], adsorption [6] or filtration
by selective membranes [7] enable the decolorization of dyeing
wastewaters, but generating large volumes of sludge or requiring
regular maintenance for adsorbents or membranes regeneration.
Some biotreatments [8,9] have also been applied to decolorize
these wastewaters. However, fast and even total decolorization
of dyeing wastewaters has been found using powerful oxidation
methods like ozonation [7,8] and advanced oxidation processes
(AOPs) [1,4,10].
Recently, electrochemical AOPs (EAOPs) have received great
attention for water remediation. The most typical EAOP is anodic
oxidation (AO) in which organics are destroyed by hydroxyl radi-
cals generated at the surface of a high O2-overpotential anode like
0013-4686/$ – see front matter © 2011 Elsevier Ltd. All rights reserved.doi:10.1016/j.electacta.2011.09.049
119

304 S. Garcia-Segura et al. / Electrochimica Acta 58 (2011) 303– 311
boron-doped diamond (BDD) from water oxidation by reaction (1)
[11–15]:
BDD + H2O → BDD(•OH) + H+ + e− (1)
where BDD(•OH) denotes the in situ hydroxyl radical formed.
The •OH radical has so high standard reduction potential
(E◦(•OH/H2O) = 2.80 V vs SHE) that can non-selective react with
most organics until overall mineralization, that is, conversion into
CO2, water and inorganic ions. It has been found that BDD thin-film
electrodes are preferable for AO because they interact very weakly
with generated •OH resulting in a much greater O2-overpotential
than other conventional anodes such as PbO2 [16] or Pt [17] and in
an enhancement of organic removal with reactive BDD(•OH), thus
being potent enough to mineralize aromatic pollutants and their
generated carboxylic acids up to CO2 [1,15,18,19].
The most common EAOP based on Fenton’s reaction chemistry
is the electro-Fenton (EF) process, which enhances the degradation
of organics compared with AO [20–22]. In EF, H2O2 is continuously
supplied to a contaminated acidic solution by the two-electron
reduction of injected O2 at the cathode from reaction (2), whereas
Fe2+ ion is added to react with this species to generate Fe3+ ion and•OH in the bulk from Fenton’s reaction (3), which is mainly propa-
gated by the cathodic reduction of Fe3+ ion to Fe2+ ion from reaction
(4) [22,23]:
O2 + 2H+ + 2e− → H2O2 (2)
Fe2+ + H2O2 → Fe3+ + •OH + OH− (3)
Fe3+ + e− → Fe2+ (4)
Cathodes like carbon nanotubes-PTFE [24–26], carbon nan-
otubes on graphite [27], carbon felt [23,28–32], carbon cloth [33],
carbon fiber [34], BDD [35] and carbon-PTFE gas (O2 or air) diffusion
[36–42] have shown a good efficiency for H2O2 generation from
reaction (2). When an undivided cell with a BDD anode is used in
EF, organics can be destroyed simultaneously by BDD(•OH) formed
from reaction (1) and •OH produced in the bulk from Fenton’s reac-
tion (3) [22,30,32,36,37,41].
The effectiveness of EF to decolorize waters containing
dyes, including some monoazo dyes, has been well proven
[20,28–30,33–35,40–42]. The decolorization process represents a
first step for the remediation of such waters because by-products
with oxygenated functional are produced, which are usually
biodegradable and much less toxic than the starting dyes [1,22].
However, the EF treatment of dyes with various azo bonds has not
been reported. The clarification of these processes can be of interest
because it can offer relevant information on the oxidation power
of hydroxyl radicals on complex azo molecules. To do this, we have
undertaken a study on the decolorization of the monoazo Acid
Orange 7 (AO7), diazo Acid Red 151 (AR151) and triazo Direct Blue
71 (DB71) by EF. Note that using TiO2/UV photocatalysis, it has been
found that the reactivity of similar aromatic azo dyes with hydroxyl
radicals is affected by the number of –OH substituents, without
significant influence of the number of –SO3− groups present in
the molecule [43]. To minimize these effects, the azo dyes tested
were chosen with analogous aromatics, one –OH group and one or
various –SO3− substituents, as can be seen in Table 1 where their
characteristics are also summarized. AO7 and AR151 are widely
used for dyeing natural fibers like wool, silk and cotton, as well as
synthetic fibers like polyesters and acrylics, whereas DB71 is used in
biology for the detection of proteins by staining [44]. Contradictory
trends for their comparative decolorization have been described
by other technologies. Thus, any relationship between the num-
ber of azo bonds and degradation kinetics was found from TiO2
photocatalysis [45], while longer decolorization time with increas-
ing the number of azo bonds was obtained by applying ozonation
[46,47]. In contrast, bioremoval with brown-rot fungi decolorized
more rapidly waters with the diazo dye AR151 than the monoazo
dye AO7 [48].
In this article, we present the results obtained for the com-
parative decolorization of AO7, AR151 and DB71 by EF using an
undivided BDD/air-diffusion cell. The effect of the number of azo
bonds on the decolorization process was assessed from the change
of both, the azo dye concentration and applied current density. A
new and simple parameter so-called initial decolorization rate (ı0)
was used to analyze the behaviour of the above compounds at the
beginning of the EF process. Its predicted trends were compared
with those established from the pseudo first-order rate constant
for decolorization (kdec) and for dye decay (k1), determined from
the absorbance and concentration decays measured by UV–vis
spectroscopy and reversed-phase high-performance liquid chro-
matography (HPLC), respectively.
2. Experimental
2.1. Chemicals
Commercial pure azo dyes AO7 and DB71 supplied by Acros
Organics Espana (Madrid, Spain) and AR151 purchased from TCI
Europe (Antwerp, Belgium) were used as received. Iron (II) sul-
fate heptahydrate, used as catalyst, and anhydrous sodium sulfate,
used as background electrolyte, were of analytical grade from Fluka
(Buchs, Switzerland) and Merck (Darmstad, Germany), respec-
tively. Solutions were prepared with pure water obtained from
a Millipore Milli-Q system (Molsheim, France) with resistivity
>18 M� cm at 25 ◦C. All solutions were adjusted to pH 3.0 with
analytical grade sulfuric acid from Merck. All the other chemicals
employed were either of HPLC or analytical grade from Panreac
(Barcelona, Spain) and Acros Organics Espana.
2.2. Electrochemical system
All the electrolytic experiments were conducted in an undivided
and cylindrical cell of 150 cm3 capacity, with a double jacket in
which external water circulated to maintain the solution tempera-
ture at 35 ◦C. The anode was a BDD thin film provided by Adamant
Technologies (La Chaux-de-Fonds, Switzerland), while the cathode
was a carbon-PTFE air-diffusion electrode from E-TEK (Somerset,
NJ, USA). The preparation of this cathode was described elsewhere
[49]. It was fed with air pumped at 300 cm3 min−1 to generate
H2O2 from reaction (2). The area of both electrodes was 3 cm2 and
the interelectrode gap was ca. 1 cm. To remove the impurities of
the BDD surface and activate the air-diffusion cathode, they were
previously polarized in 0.05 mol dm−3 Na2SO4 at a current den-
sity (j) of 100 mA cm−2 for 60 min. Comparative electrochemical
degradations of 100 cm3 of 0.018–1.0 mmol dm−3 dye solutions in
0.05 mol dm−3 Na2SO4 with 0.5 mmol dm−3 Fe2+ at pH 3.0 were
performed. The influence of j from 8.3 to 100 mA cm−2 on dye
decolorization was also examined. The oxidative role of electro-
generated hydroxyl radicals was clarified from comparative trials
using a 3 cm2 Pt sheet of 99.99% purity from SEMPSA (Barcelona,
Spain) as anode and a 3 cm2 graphite rod from Sofacel (Sant Feliu,
Spain) as cathode. All experiments were carried out under vigorous
stirring with a magnetic bar at 800 rpm to ensure homogenization
and the transport of reactants towards/from the electrodes.
2.3. Apparatus and analytical procedures
The solution pH was determined with a Crison 2000 pH meter
(Alella, Spain). Galvanostatic electrolyses were performed with an
Amel 2053 potentiostat-galvanostat (Milano, Italy). Before analysis,
the aliquots were alkalinized to stop the degradation process and
filtered with 0.45 �m PTFE filters from Whatman (Maidstone, UK).
120

S.
Garcia
-Seg
ura
et
al.
/
Electro
chim
ica
Acta
58 (2011) 303– 311305
Table 1Chemical structure and characteristics of azo dyes tested.
Chemical structure Color index name Chemical name Color index number �max (nm) M/g mol−1
NN
OHSO3
- Na+
Acid Orange 7 (AO7) Sodium
4-[(2E)-2-(2-oxonaphthalen-1-
ylidene)hydrazinyl]benzenesulfonate
15510 484 350.32
SO3- Na+N
NN
N
OHAcid Red 151 (AR151) Sodium
4-(4-(2-hydroxynaphthalenylazo)
phenylazo)benzene sulphonate
26900 500 454.45
+Na-O3S
SO3-Na+
N N
N NSO3
-Na+
N
N SO3-Na+
HO
NH2
Direct Blue 71 (DB71) Tetrasodium
3-[[4-[[4-[(6-amino-1-hydroxy-3-
sulphonato-2-naphthyl)azo]-6-
sulphonato-1-naphthyl]azo]-1-
naphthyl]
azo]naphthalene-1,5-disulphonate
34140 584 1029.86

306 S. Garcia-Segura et al. / Electrochimica Acta 58 (2011) 303– 311
The decolorization process of azo dye solutions was monitored
from the decay of the absorbance (A) at the maximum wave-
length in the visible region of �max = 484 nm for AO7, �max = 500 nm
for AR151 and �max = 584 nm for DB71, measured on the spectra
recorded with a Shimadzu 1800 UV–vis spectrophotometer (Kyoto,
Japan) at 35 ◦C. The percentage of color removal for each dye was
then calculated from Eq. (5) [1]:
%Color removal = A0 − A
A0× 100 (5)
where A0 and A are the absorbance at initial time and time t at the
corresponding �max, respectively. The parameter ı0 was then deter-
mined as the slope of the linear fitting between % color removal and
t at the beginning of the process up to 20–25% of the absorbance
decay, that is, when practically the dye alone is degraded because
of the low content of intermediates generated. The kdec value was
calculated as the slope of the corresponding ln(A0/A) − t plot while
a linear correlation was verified.
The decay of dye concentration was followed by reversed-
phase HPLC using a Waters 600 liquid chromatograph (Milford,
MA, USA) fitted with a Spherisorb ODS2 5 �m (150 mm × 4.6 mm
(i.d.)) column at 35 ◦C, and coupled with a Waters 996 photodi-
ode array detector, which was selected at � = 310.2 nm for AO7,
� = 229.9 nm for AR151 and � = 289.0 nm for DB71. These wave-
lengths corresponded to the maximal of their UV bands that are
sharper and better defined than their visible bands, thereby allow-
ing more accurate measurements for dye decays. For these analyses,
20 �L aliquots were injected into the liquid chromatograph and
the mobile phase was a 30:70 (v/v) acetonitrile/water mixture
for AO7 and DB71 and a 50:50 (v/v) acetonitrile/water mixture
for AR151, both with 2.4 mmol dm−3 n-butylamine and circulating
at 0.6 cm3 min−1. The recorded chromatograms displayed well-
defined absorption peaks with a retention time of 7.6 min for AO7,
5.4 min for AR151 and 2.0 min for DB71.
3. Results and discussion
3.1. Oxidative role of electrogenerated hydroxyl radicals in
electro-Fenton
The action of hydroxyl radicals produced in the EF process
to decolorize the azo dyes was ascertained by determining the
percentage of color removal of a 0.400 mmol dm−3 AO7 in a
0.05 mol dm−3 Na2SO4 solution at pH 3.0 and 35 ◦C using differ-
ent electrolytic systems at 50 mA cm−2. Prior to these trials, it was
found that the addition of 5 mmol dm−3 H2O2 to the above AO7
solution did not cause any decolorization, indicating that H2O2 does
not react directly with the azo dye. Fig. 1 presents that the use
of BDD/air-diffusion and Pt/air-diffusion cells under AO conditions
yields a similar, but poor decolorization of the 0.400 mmol dm−3
AO7, only leading to ca. 15% color removal at 30 min. This evidences
that BDD (•OH) or Pt(•OH) radicals formed in the above systems
from the corresponding reaction (1) react very slowly with the azo
dye. When the air-diffusion cathode was replaced by a graphite one,
a larger acceleration of the decolorization process can be observed
in Fig. 1 achieving 35% and 37% of color decay after 30 min of AO
treatment in the BDD/graphite and Pt/graphite cells without H2O2
accumulation, respectively. This enhancement can be related to the
parallel reduction of the azo dye on the graphite cathode, which
does not take place on the air-diffusion cathode because it mainly
involves the bielectronic reduction of O2 to H2O2 from reaction (2)
[1,22]. However, by adding 0.5 mmol dm−3 Fe2+ to the AO7 solution,
a very quick and almost overall decolorization was attained in only
23 min working with both BDD/air-diffusion and Pt/air-diffusion
cells, as can be seen in Fig. 1. This means that in EF, the •OH radical
formed in the bulk from reaction (3) is the main oxidant of the azo
0
20
40
60
80
100
35302520151050t / min
% C
olor
rem
oval
Fig. 1. Change of the percentage of color removal with electrolysis time for
the treatment of 100 cm3 of 0.400 mmol dm−3 Acid Orange 7 (AO7) solutions in
0.05 mol dm−3 Na2SO4 at pH 3.0 and 35 ◦C by anodic oxidation (AO) with (©)
Pt/graphite, (�) BDD/graphite, (�) Pt/air-diffusion and (�) BDD/air-diffusion cells
and by electro-Fenton (EF) with 0.5 mmol dm−3 Fe2+ using (×) Pt/air-diffusion and
(�) BDD/air-diffusion cells. The area of all electrodes was 3.0 cm2 and a current
density of 50 mA cm−2 was always applied.
dyes tested since it is produced in much greater concentration than
at the anode surface. This phenomenon has been reported for the
oxidation of a high number of aromatics by this procedure [1,22].
3.2. Effect of the azo dye content on the decolorization process
Several electrolyses were performed for each azo dye to check
the influence of its concentration in a 0.05 mol dm−3 Na2SO4 and
0.5 mmol dm−3 Fe2+ solution of pH 3.0 at 35 ◦C on the decoloriza-
tion power of EF using a BDD/air-diffusion cell at 33.3 mA cm−2 for
20 min. These values of Fe2+ concentration and pH were chosen
since they were found optimal for the treatment of other dyes by
this EAOP [41,42]. In these trials, the solution pH always remained
practically constant, but large changes in the color of solutions were
observed. Thus, the strong orange color of the initial AO7 solutions
lost rapidly intensity and gradually turned in a dark brown color,
which further became clearer giving rise to a colorless solution
for azo dye contents < 0.400 mmol dm−3. The red AR151 solutions
darkened initially and further, they underwent a progressive loss
in color intensity up to yield practically colorless solutions. Simi-
larly, the color of DB71 solutions varied consecutively from intense
blue to purple blue, purple, red and clear brown, before obtaining
almost colorless solutions. All these findings evidence the forma-
tion of different colored conjugated intermediates by the attack of
hydroxyl radicals on the three azo dyes during their decolorization
process.
Fig. 2 depicts the increase in the percentage of color removal
determined from Eq. (5) with prolonging electrolysis time for the
above assays. As can be seen in Fig. 2a, the color decay for AO7
solutions is gradually decelerated when its concentration rises.
Thus, only the 0.200 mmol dm−3 solution becomes colorless after
12 min of EF treatment, whereas the most concentrated solution
with 1.0 mmol dm−3 AO7 attains 80% color removal at 20 min. The
same behaviour can be observed in Fig. 2b for AR151, although in
this case lower percentages of color removal are achieved at the
end of electrolysis decreasing from 88% for 0.100 mmol dm−3 to
76% for 0.500 mmol dm−3. The progressive loss in color removal
at long electrolysis time with rising AO7 and AR151 contents can
be explained by the decay in their reaction rate with the same
amount of generated hydroxyl radicals due to the presence of more
organic matter. In contrast, Fig. 2c shows a fluctuant change in
color removal between 68% for the lower 0.018 mmol dm−3 of DB71
122

S. Garcia-Segura et al. / Electrochimica Acta 58 (2011) 303– 311 307
0
20
40
60
80
100
0
20
40
60
80
% C
olor
rem
oval
0
20
40
60
80
2520151050
t / min
(a)
(b)
(c)
Fig. 2. Variation of the percentage of color removal with electrolysis time for
the EF degradation of 100 cm3 of azo dye solutions in 0.05 mol dm−3 Na2SO4
with 0.5 mmol dm−3 Fe2+ at pH 3.0 and 35 ◦C using a BDD/air-diffusion cell at
33.3 mA cm−2. (a) AO7 concentration: (�) 0.200 mmol dm−3, (�) 0.400 mmol dm−3,
(♦) 0.600 mmol dm−3, (�) 0.800 mmol dm−3 and (�) 1.0 mmol dm−3. (b) Acid
Red 151 (AR151) concentration: (�) 0.100 mmol dm−3, (�) 0.200 mmol dm−3,
(♦) 0.300 mmol dm−3, (�) 0.400 mmol dm−3 and (�) 0.500 mmol dm−3. (c) Direct
Blue 71 (DB71) concentration: (�) 0.018 mmol dm−3, (�) 0.036 mmol dm−3,
(♦) 0.053 mmol dm−3, (�) 0.072 mmol dm−3, (�) 0.090 mmol dm−3 and (©)
0.200 mmol dm−3.
and 80% for the higher content of 0.200 mmol dm−3 at 20 min. This
anomalous behaviour can be related to the production of colored
by-products with �max similar to that of the initial azo dye, which
are difficultly oxidized with hydroxyl radicals but are formed in
relative less extent at greater azo dye concentrations.
From the above results, the corresponding initial decolorization
rates were calculated and the values obtained are presented as a
function of the azo dye and initial azo bonds concentrations in
Fig. 3a and b, respectively. In addition, the ı0 values found for 0.133
and 0.266 mmol dm−3 DB71 solutions are also given in both figures
to better compare the behaviour of this parameter. A gradual and
quick decay in ı0 can be observed for each compound when its
0.00
0.05
0.10
0.15
0.20
0.25
0.30
0.35
0.40
0.00
0.05
0.10
0.15
0.20
0.25
0.30
0.35
1.21.00.80.60.40.20.0
c / mm ol dm-3
(a)
(b) δ 0 /
s-1
Fig. 3. Initial decolorization rate determined for the experiments of Fig. 2 vs con-
centration of (a) azo dye and (b) initial azo bonds. Compound: (©) AO7, (�) AR151
and (�) DB71. Data obtained for 0.133 and 0.266 mmol dm−3 DB71 solutions are also
included.
concentration increases, as expected if less relative quantity of
azo dye is destroyed by the same quantity of generated hydroxyl
radicals. This tendency agrees with that found for the change in per-
centage of color removal at long time for AO7 and AR151 (see Fig. 2a
and b), suggesting that the decolorization process of such azo dyes
involves mainly their disappearance from the medium. However,
it differs from the fluctuant variation of color removal obtained for
DB71 under similar conditions (see Fig. 2c), since the parameter ı0
is determined when the content of colored and refractory interme-
diates is very low and does not affect significantly the absorbance
of the solution.
Results of Fig. 3a and b also show that the initial decoloriza-
tion rate decreases in the sequence AO7 > AR151 > DB71, indicating
that hydroxyl radicals react more slowly with the azo dyes as
their number of azo bonds rises making the EF process less potent
for their decolorization. Fig. 3b shows that this trend is more
notable at lower initial azo bonds concentrations when dyes are
more rapidly decolorized. Thus, at 0.200 mmol dm−3 of initial azo
bonds, decreasing ı0 values of 0.37, 0.22 and 0.11 s−1 are found for
AO7, AR151 and DB71, respectively, whereas at 0.800 mmol dm−3
a smaller decay of this parameter in 0.13, 0.08 and 0.08 s−1 is
obtained. Note that for DB71, ı0 decreases very slowly between
both contents of initial azo bonds, making less significant the differ-
ence of this parameter between the three azo dyes as their content
rises (see Fig. 3b). These findings evidence a large influence of the
number of azo bonds on the reactivity of the molecules tested with
hydroxyl radicals and hence, on their decolorization process. When
the number of azo bonds in the dye increases, a larger and more
stable conjugated � system is formed (see Table 1) and greater
activation energy for the electrophilic attack of hydroxyl radicals
is then expected. This originates a decrease in the reaction rate
123

308 S. Garcia-Segura et al. / Electrochimica Acta 58 (2011) 303– 311
0
20
40
60
80
% C
olor
rem
oval
0
20
40
60
80
100
0
20
40
60
80
0 5 10 15 20 25 30 35
t / min
(a)
(b)
(c)
Fig. 4. Change of the percentage of color removal with electrolysis time for the EF
treatment of 100 cm3 of solutions containing 0.400 mmol dm−3 of initial azo bonds in
0.05 mol dm−3 Na2SO4 and 0.5 mmol dm−3 Fe2+ at pH 3.0 and 35 ◦C. Azo dye: (a) AO7,
(b) AR151 and (c) DB71. Applied current density: (�) 8.3 mA cm−2, (�) 16.7 mA cm−2,
(©) 33.3 mA cm−2, (�) 50 mA cm−2, (�) 66.7 mA cm−2, (♦) 83.3 mA cm−2 and (�)
100 mA cm−2.
between both species, as reflected by the lower initial decoloriza-
tion rates shown in Fig. 3b.
3.3. Effect of current density on the decolorization process of azo
dyes
To gain a better knowledge of the decolorization power of EF
for each azo dye tested, the influence of j on the process was
investigated. To do this, solutions with 0.400 mmol dm−3 of initial
azo bonds, 0.05 mol dm−3 Na2SO4 and 0.5 mmol dm−3 Fe2+ at pH
3.0 were electrolyzed between 8.3 and 100 mA cm−2 for 30 min.
Fig. 4a–c show a gradual rise in the percentage of color removal
with increasing j from 8.3 to 50 mA cm−2 for AO7, AR151 and DB71,
respectively, due to the acceleration in the production of BDD
(•OH) from reaction (1) [14–17] and •OH from Fenton’s reaction
(3) by the greater H2O2 electrogeneration from reaction (2) and
higher Fe2+ regeneration from reaction (4) [21,22,38–42], indicat-
ing that the process is mass-transfer controlled. However, similar
percentages of color removal are attained operating between 50
and 100 mA cm−2 for AO7 (see Fig. 4a) and DB71 (see Fig. 4c) and
between 50 and 83.3 mA cm−2 for AR151 (see Fig. 4b). Under these
conditions, AO7 is completely decolorized in 12 min, but only 92%
and 97% color decay are obtained as maximal for AR151 and DB71,
respectively. These findings indicate that the current density of
50 mA cm−2 is optimal to decolorize the three dyes.
The fact that the quicker color removal found for each azo dye
from 50 mA cm−2 is practically independent of j, could be related to
the enhancement of parasitic reactions of hydroxyl radicals and the
formation of colored conjugated by-products. It is expected that an
increase in j causes greater amounts of hydroxyl radicals, but also
accelerates more largely their waste reactions reducing the relative
quantity of these oxidants with the consequent decrease in organic
events [14,22]. These parasite reactions involve, for example, the
O2 evolution from the anodic oxidation of BDD(•OH) by reaction
(6) and the attack of •OH on H2O2 to yield the weaker oxidant
hydroperoxyl radical (HO2•) by reaction (7) or the dimerization of
this radical by reaction (8) [16,22,37,39]:
2BDD(•OH) → 2BDD + 2O2 + 2H+ + 2e− (6)
H2O2 + •OH → HO2• + H2O (7)
2•OH → H2O2 (8)
The relative loss of reactive hydroxyl radicals with rising j could
also be due to the larger enhancement of other anodic reactions
such as the oxidation of generated H2O2 to O2 by reaction (9) and
of Fe2+ ion to Fe3+ ion by reaction (10), as well as the formation of
peroxodisulfate ion from sulfate ion of the electrolyte by reaction
(11) and ozone from water oxidation by reaction (12) [14,22]:
H2O2 → O2 + 2H+ + 2e− (9)
Fe2+ → Fe3+ + e− (10)
2SO42− → S2O8
2− + 2e− (11)
3H2O → O3 + 6H+ + 6e− (12)
Nevertheless, it seems more reasonable to consider that the
decolorization ability of EF for j > 50 mA cm−2 is limited by the
slower oxidation with hydroxyl radicals of generated colored con-
jugated molecules with �max close to that of initial compound. This
is supported by the fact that the 92% color removal achieved for the
AR151 solution at 83.3 mA cm−2 is reduced to 77% at 100 mA cm−2
(see Fig. 4b), as expected by the formation of very recalcitrant col-
ored by-products that are produced in much lesser extent at lower
current densities. The much smaller generation of such kind of by-
products with increasing current for AO7 could explain the fast and
overall decolorization attained for the EF treatment of this com-
pound (see Fig. 4a), whereas greater amounts of such recalcitrant
by-products could be formed in the case of DB71 that are more
slowly removed from 66.7 mA cm−2 (see Fig. 4c).
A very different behaviour was found when the beginning
of the decolorization processes was analyzed by means of ı0
where practically the azo dye alone is destroyed. Fig. 5 shows
that at a given j ≥ 16.7 mA cm−2 this parameter decreases in the
sequence AO7 > AR151 > DB71, as expected by the lower reactivity
of generated oxidants hydroxyl radicals with longer conjugated �molecules, as pointed out above. Moreover, ı0 and j show a linear
relationship between 16.7 and 83.3 mA cm−2 for all the azo dyes.
For this increase in 5 times of the current density, ı0 rises 5.2, 4.0
and 3.2 times for AO7, AR151 and DB71, respectively. The fact that
ı0 and j vary in a similar way for AO7 indicates that it reacts with
a similar relative quantity of hydroxyl radicals generated at each
current density. However, the smaller reactivity as current density
124

S. Garcia-Segura et al. / Electrochimica Acta 58 (2011) 303– 311 309
0.00
0.10
0.20
0.30
0.40
0.50
0.60
0.70
0.80
120100806040200
δ 0/ s
-1
j / mA cm-2
Fig. 5. Initial decolorization rate for the trials of Fig. 4 vs applied current density.
Azo dye: (©) AO7, (�) AR151 and (�) DB71.
rises for AR151 and DB71 can be accounted for the loss of reactive
hydroxyl radicals by the acceleration of waste reactions (6)–(8),
which is more significant for a higher number of azo bonds due to
their slower reaction with hydroxyl radicals. The large enhance-
ment of these parasitic reactions can also explain the quite similar
ı0 value found at 83.3 and 100 mA cm−2 for AR151 and DB71 (see
Fig. 5).
The above considerations allow inferring that the parameter
ı0 can serve to describe the reactivity of azo dyes with hydroxyl
radicals produced in the EF process. In contrast, the decolorization
ability of this method is rather limited by the parallel destruction of
some colored conjugated by-products, which are formed in larger
extent in the diazo and triazo dyes than in the monoazo one.
3.4. Decay kinetics for the azo dyes
The kinetics for the reaction of each azo dye with generated
hydroxyl radicals in EF was studied to check the compara-
tive trends established with the parameter ı0 for their initial
decolorization. This was made by electrolyzing the solutions
with 0.400 mmol dm−3 of initial azo bonds between 16.7 and
66.7 mA cm−2 and measuring the concentration decay of each com-
pound from the reversed-phase chromatograms recorded.
Fig. 6a shows a fast and total decay of AO7 under the EF con-
ditions tested. The removal of this azo dye is strongly accelerated
with increasing j owing to the generation of greater quantities of
BDD(•OH) at the anode from reaction (1) and mainly of •OH in the
bulk from Fenton’s reaction (3). This causes that AO7 disappears
at decreasing times of about 26, 16, 6 and 4 min for increasing
current densities of 16.7, 33.3, 50 and 66.7 mA cm−2, respectively.
The above concentration decays were analyzed from kinetic equa-
tions related to simple reaction orders and excellent fits were
obtained for a pseudo first-order reaction, as can be seen in the
inset panel of Fig. 6a. The k1 value with the corresponding square
of the linear regression coefficient (R2) thus determined for the dif-
ferent current densities tested are collected in Table 2. As can be
seen, k1 varies linearly with j up to 50 mA cm−2, whereas its value
further increases two-folds at 66.7 mA cm−2. Using the BDD/air-
diffusion cell under AO conditions, it was found that the pseudo
first-order rate constant for the reaction of AO7 with BDD(•OH)
changed from 1.10 × 10⁻⁴ s−1 for 50 mA cm−2 to 1.87 × 10⁻⁴ s−1 for
66.7 mA cm−2, which are two magnitude orders lower than the k1
values found under EF conditions (see Table 2), in agreement with
results shown in Fig. 1. Note that the percentage of color removal
in EF is quite similar when j rises from 50 to 66.7 cm−2 (see Fig. 4a),
suggesting that in both cases, the colored by-products are removed
0.0
0.1
0.2
0.3
0.4
0.5
[AO
7] /
mm
ol d
m-3
0
1
2
3
4
5
2520151050
ln (c
0 / c)
t / min
0.0
0.2
0.4
0.6
0.8
1.0
403020100
A /
A 0
t / mi n
0.0
0.5
1.0
1.5
2.0
2.5
2520151050
ln (A
0 / A
)
t / min
(a)
(b)
Fig. 6. (a) Time-course of the decay of AO7 concentration determined by reversed-
phase HPLC for the EF treatment of 100 cm3 of solutions with 0.400 mmol dm−3
initial azo bonds in 0.05 mol dm−3 Na2SO4 and 0.5 mmol dm−3 Fe2+ at pH 3.0 and
35 ◦C. (b) Change of the normalized absorbance at � = 484 nm with electrolysis time
for the above trials. Applied current density: (�) 16.7 mA cm−2, (©) 33.3 mA cm−2,
(�) 50 mA cm−2 and (�) 66.7 mA cm−2. The inset panels present the corresponding
kinetic analysis assuming a pseudo first-order reaction.
by similar contents of the main oxidant •OH formed in the bulk.
So, the relative greater amounts of •OH generated at 66.7 mA cm−2
could react in much larger extent with the initial AO7 concentration
causing the large enhancement in k1 found at this current density.
The decolorization process of the above trials was also followed
from the normalized absorbance of the solution at the �max of the
Table 2Pseudo first-order rate constant for dye decay (k1) and for decolorization (kdec) and
initial decolorization rate (ı0) determined for the EF treatment of 100 cm3 of solu-
tions of the azo dyes AO7, AR151 and DB71 with a concentration equivalent to
0.400 mmol dm−3 of azo bonds in 0.05 mol dm−3 Na2SO4 with 0.50 mmol dm−3 Fe2+
at pH 3.0, 35 ◦C and different current densities. The square of the linear regression
coefficient (R2) is given in parenthesis.
j (mA cm−2) AO7 AR151 DB71
k1 × 103 (s−1)
16.7 2.90 (0.992) 0.99 (0.999) 0.80 (0.995)
33.3 4.96 (0.995) 1.78 (0.997) 1.49 (0.999)
50.0 11.1 (0.992) 2.83 (0.997) 2.64 (0.999)
66.7 22.2 (0.991) 7.94 (0.996) 6.41 (0.999)
kdec × 103 (s−1)
16.7 1.65 (0.998) 1.40 (0.998) 0.81 (0.995)
33.3 3.36 (0.996) 1.42 (0.998) 1.39 (0.996)
50.0 6.15 (0.995) 3.81 (0.989) 2.31 (0.997)
66.7 7.76 (0.996) 4.58 (0.990) 2.75 (0.998)
ı0 (s−1)
16.7 0.12 (0.993) 0.09 (0.998) 0.06 (0.990)
33.3 0.23 (0.993) 0.18 (0.986) 0.10 (0.996)
50.0 0.38 (0.997) 0.25 (0.996) 0.16 (0.993)
66.7 0.53 (0.987) 0.31 (0.987) 0.20 (0.992)
125

310 S. Garcia-Segura et al. / Electrochimica Acta 58 (2011) 303– 311
0.00
0.05
0.10
0.15
0.20
0.25
[AR
151]
/ m
mol
dm
-3
0.00.51.01.52.02.53.03.5
0 10 20 30 40t / mi n
ln (c
0 / c)
0.00
0.02
0.04
0.06
0.08
0.10
0.12
0 10 20 30 40 50 60 70
[DB7
1] /
mm
ol d
m-3
t / mi n
0.0
0.2
0.4
0.6
0.8
1.0
0 1 2 3 4 5 6 7t / min
ln (c
0 / c)
(a)
(b)
Fig. 7. Decay of the concentration of (a) AR151 and (b) DB71 with electrolysis time
obtained by reversed-phase HPLC under the same EF conditions of Fig. 6a. The kinetic
analysis considering a pseudo first-order reaction for each dye is shown in the inset
panels.
azo dye. Fig. 6b shows the decay of this parameter with electrol-
ysis time and its inset panel presents the good linear ln(A0/A) − t
plots obtained up to about the half of the time needed to attain total
decolorization. The corresponding kdec values calculated from these
plots are listed in Table 2. Comparison of Fig. 6a and 6b allows con-
cluding that the time required for the total removal of AO7 is always
much shorter than that needed for the overall decolorization of the
solution, thereby corroborating the formation of more recalcitrant
colored conjugated by-products with �max similar to that of the azo
dye during the EF process. This is also reflected by the much lower
kdec value obtained for decolorization compared with the k1 value
determined for azo dye removal at each j (see Table 2), since the
former process becomes much slower by the parallel oxidation of
such colored intermediates with hydroxyl radicals.
The same behaviour was found for the removal of the diazo
AR151 and triazo DB71, as well as the decolorization of their solu-
tions. Fig. 7a and b depict the concentration decays up to total
removal of these compounds, respectively, whereas the excellent
linear correlations considering that they follow a pseudo first-order
kinetics are shown in the inset panels. The k1 and kdec values cal-
culated from these analyses are also collected in Table 2. For each
compound, these results indicate that both, the azo dye decay and
solution decolorization are strongly enhanced with increasing j and
that the former is always much faster than the latter as a result
of the slower destruction of generated colored by-products with
�max similar to that of each azo dye. As in the case of AO7, a strong
increase in k1 for AR151 and BD71 decays when passing from 50 to
66.7 mA cm−2 can also be observed in Table 2. This can be related
to their faster reactions with greater relative amounts of •OH in the
bulk formed at 66.7 mA cm−2 because in both current densities the
colored by-products are destroyed at similar rate, as deduced from
the analogous percentages of color removal depicted in Fig. 4b and
4c.
From the k1 values given in Table 2, one can infer that the reactiv-
ity of azo dyes with generated hydroxyl radicals in EF decreases in
the order AO7 > AR151 > DB71, so prolonging the time required for
their disappearance (see Figs. 6 and 7). This is the same trend as pre-
dicted from the initial decolorization rates at the beginning of the
process, also collected in Table 2, thereby confirming the validity of
the analysis performed with this parameter on the oxidation abil-
ity of EF for increasing number of azo bonds in Sections 3.2 and 3.3.
Note that the changes in kdec of Table 2 also seem to verify the same
tendency for the decolorization process of monoazo, diazo and tri-
azo dyes. However, this rate constant cannot be used to predict
the comparative total decolorization of these compounds since it
does not describe adequately the behaviour of solutions after about
50–60% of the absorbance decay due to the large accumulation of
more recalcitrant colored intermediates, which are generated in
different extent depending on the dye, its concentration and the
applied j (see Figs. 2 and 4).
4. Conclusions
The decolorization process of azo dyes by EF showed a marked
influence of the number of azo bonds present in the molecule. The
initial decolorization rate decreased with rising initial azo bonds
concentration due to the oxidation of more organic matter with
similar amounts of generated hydroxyl radicals. A linear increase of
ı0 with applied current density was found as a result of the greater
production of these oxidants, even when similar color removal
was determined at long electrolysis times for high j values. This
parameter became lower when the number of azo bonds increased,
indicating the existence of a smaller reactivity with hydroxyl rad-
icals because larger and more stable conjugated � systems are
formed. In contrast, the decolorization ability of EF was limited
by the slower and parallel destruction of colored conjugated by-
products, formed in larger extent in the diazo and triazo dyes
than in the monoazo one, because poly-azo dyes do not decolorize
when the first azo functional group is removed. HPLC analysis of
electrolyzed solutions confirmed the total removal of all azo dyes
by EF treatment. They disappeared in shorter times as j rose and
the number of azo bonds decreased. The k1 values determined by
this technique showed the same trends as those predicted by ı0,
thereby evidencing that the latter simple parameter is suitable to
analyze the reactivity of azo dyes. The kdec values obtained from the
absorbance decay also showed similar tendencies, but they did not
describe the comparative total decolorization of azo dye solutions
because of the complex degradative behaviour of colored interme-
diates, which depends on the compound tested and experimental
conditions used. An optimum current density of 50 mA cm−2 was
found to decolorize the three dyes.
Acknowledgements
The authors acknowledge financial support from MICINN
(Ministerio de Ciencia e Innovación, Spain) under the project
CTQ2010-16164/BQU, co-financed with FEDER funds. S. Garcia-
Segura thanks the grant awarded from MEC (Ministerio de
Educación y Ciencia, Spain) to do this work.
References
[1] C.A. Martínez-Huitle, E. Brillas, Appl. Catal. B: Environ. 87 (2009) 105.[2] D. Brown, Ecotox. Environ. Safe 13 (1987) 139.[3] K.P. Sharma, S. Sharma, S.P. Sharma, K. Singh, S. Kumar, R. Grover, P.K. Sharma,
Chemosphere 69 (2007) 48.[4] E. Forgacs, T. Cserhati, G. Oros, Environ. Int. 30 (2004) 953.[5] A. Szygula, E. Guibal, M. Ruiz, A.M. Sastre, Colloids Surf. A 330 (2008) 219.
126

S. Garcia-Segura et al. / Electrochimica Acta 58 (2011) 303– 311 311
[6] M.M. Dávila-Jiménez, M.P. Elizalde-González, A.A. Pelaéz-Cid, Colloids Surf. A254 (2005) 107.
[7] J. Wu, C. Liu, K.H. Chu, S. Suen, J. Membrane Sci. 309 (2008) 239.[8] E. Franciscon, A. Zille, F. Dias, C. Ragagnin de Menezes, L.R. Durrant, A. Cavaco-
Paulo, Int. Biodeterior. Biodegrad. 63 (2009) 280.[9] G. Buitrón, M. Quezada, G. Moreno, Bioresour. Technol. 92 (2004) 143.
[10] T.A. Özbelge, F. Erol, Chem. Eng. Commun. 169 (2009) 39.[11] D. Gandini, E. Mahé, P.A. Michaud, W. Haenni, A. Perret, Ch. Comninellis, J. Appl.
Electrochem. 30 (2000) 1345.[12] P.A. Michaud, M. Panizza, L. Ouattara, T. Diaco, G. Foti, Ch. Comninellis, J. Appl.
Electrochem. 33 (2003) 151.[13] B. Marselli, J. García-Gomez, P.A. Michaud, M.A. Rodrigo, Ch. Comninellis, J.
Electrochem. Soc. 150 (2003) D79.[14] M. Panizza, G. Cerisola, Chem. Rev. 109 (2009) 6541.[15] E. Brillas, S. Garcia-Segura, M. Skoumal, C. Arias, Chemosphere 79 (2010)
605.[16] I. Sirés, E. Brillas, G. Cerisola, M. Panizza, J. Electroanal. Chem. 613 (2008) 151.[17] M. Hamza, R. Abdelhedi, E. Brillas, I. Sirés, J. Electroanal. Chem. 627 (2009) 41.[18] C. Zhang, J. Wang, T. Murakami, A. Fujishima, D. Fu, Z. Gu, J. Electroanal. Chem.
638 (2010) 91.[19] S. Garcia-Segura, E. Brillas, Water Res. 45 (2011) 2975.[20] N. Daneshvar, S. Aber, V. Vatanpour, M.H. Rasoulifard, J. Electroanal. Chem. 615
(2008) 165.[21] E. Guinea, C. Arias, P.L. Cabot, J.A. Garrido, R.M. Rodríguez, F. Centellas, E. Brillas,
Water Res. 42 (2008) 499.[22] E. Brillas, I. Sirés, M.A. Oturan, Chem. Rev. 109 (2009) 6570.[23] M. Diagne, N. Oturan, M.A. Oturan, Chemosphere 66 (2007) 841.[24] A.R. Khataee, M. Zarei, L. Moradkhannejhad, Desalination 258 (2010) 112.[25] M. Zarei, A.R. Khataee, R. Ordikhani-Seyedlar, M. Fathinia, Electrochim. Acta 55
(2010) 7259.[26] A.R. Khataee, M. Zarei, S.K. Asl, J. Electroanal. Chem. 648 (2010) 143.[27] A.R. Khataee, M. Safarpour, M. Zarei, S. Aber, J. Electroanal. Chem. 659 (2011)
63.
[28] S. Hammami, N. Bellakhal, N. Oturan, M.A. Oturan, M. Dachraoui, Chemosphere73 (2008) 678.
[29] A. Özcan, Y. Sahin, A.S. Koparal, M.A. Oturan, J. Electroanal. Chem. 616 (2008)71.
[30] A. Özcan, M.A. Oturan, N. Oturan, Y. Sahin, J. Hazard. Mater. 163 (2009) 1213.[31] B. Balci, N. Oturan, R. Cherrier, M.A. Oturan, Water Res. 43 (2009) 1924.[32] A. Dirany, I. Sirés, N. Oturan, M.A. Oturan, Chemosphere 81 (2010) 594.[33] J.M. Peralta-Hernández, Y. Meas-Vong, F.J. Rodríguez, T.W. Chapman, M.I. Mal-
donado, L.A. Godínez, Dyes Pigments 76 (2008) 656.[34] A. Wang, J. Qu, H. Liu, J. Ru, Appl. Catal. B: Environ. 84 (2008) 393.[35] K. Cruz-González, O. Torres-López, A. García-León, J.L. Guzmán-Mar, L.H. Reyes,
A. Hernández-Ramírez, J.M. Peralta-Hernández, Chem. Eng. J. 160 (2010) 199.[36] I. Sirés, F. Centellas, J.A. Garrido, R.M. Rodríguez, C. Arias, P.L. Cabot, E. Brillas,
Appl. Catal. B: Environ. 72 (2007) 373.[37] M. Skoumal, C. Arias, P.L. Cabot, F. Centellas, J.A. Garrido, R.M. Rodríguez, E.
Brillas, Chemosphere 71 (2008) 1718.[38] M. Panizza, G. Cerisola, Electrochim. Acta 54 (2008) 876.[39] M. Skoumal, R.M. Rodríguez, P.L. Cabot, F. Centellas, J.A. Garrido, C. Arias, E.
Brillas, Electrochim. Acta 54 (2009) 2077.[40] M. Panizza, G. Cerisola, Water Res. 43 (2009) 339.[41] E.J. Ruiz, C. Arias, E. Brillas, A. Hernández-Ramírez, J.M. Peralta-Hernández,
Chemosphere 82 (2011) 495.[42] R. Salazar, S. Garcia-Segura, M.S. Ureta-Zanartu, E. Brillas, Electrochim. Acta 56
(2011) 6371.[43] A.R. Khataee, M.B. Kasiri, J. Mol. Catal. A: Chem. 328 (2010) 8.[44] H.Y. Hong, G.S. Yoo, J.K. Choi, Electrophoresis 21 (2000) 841.[45] C.G. Silva, W. Wang, J.L. Faria, J. Photochem. Photobiol. A: Chem. 181 (2006)
314.[46] M. Muthukumar, D. Sargunamani, N. Selvakumar, Dyes Pigments 65 (2005) 151.[47] M. Muthukumar, N. Selvakumar, Dyes Pigments 62 (2004) 221.[48] N. Ali, A. Hameed, S. Ahmed, Braz. J. Microbiol. 41 (2010) 907.[49] E. Brillas, M.A. Banos, S. Camps, C. Arias, P.L. Cabot, J.A. Garrido, R.M. Rodríguez,
New J. Chem. 28 (2004) 314.
127

Results and Discussion �
����

Results and Discussion
�����
PAPER 5
Comparative degradation of the diazo
dye Direct Yellow 4 by electro-Fenton,
photoelectron-Fenton and photo-assisted
electro-Fenton

Results and Discussion �
�����

Comparative degradation of the diazo dye Direct Yellow 4 by electro-Fenton,photoelectro-Fenton and photo-assisted electro-Fenton
Sergi Garcia-Segura, Abdellatif El-Ghenymy, Francesc Centellas, Rosa M. Rodríguez, Conchita Arias,José A. Garrido, Pere L. Cabot, Enric Brillas ⇑Laboratori d’Electroquímica de Materials i del Medi Ambient, Departament de Química Física, Facultat de Química, Universitat de Barcelona, Martí i Franquès 1-11, 08028Barcelona, Spain
a r t i c l e i n f o
Article history:Received 8 May 2012Received in revised form 1 June 2012Accepted 6 June 2012Available online 15 June 2012
Keywords:Direct Yellow 4Electro-FentonMineralizationOxidation by-productsPhoto-assisted electro-FentonPhotoelectro-Fenton
a b s t r a c t
The degradation of 100 ml of a 200 mg l�1 Direct Yellow 4 (DY4) solution in 0.05 M Na2SO4 with 0.5 mMFe2+ of pH 3.0 has been comparatively studied by electro-Fenton (EF), photoelectro-Fenton (PEF) withUVA light and a novel photo-assisted EF (PA–EF). The latter method consists of the application of EFfor a given time, followed by UVA illumination alone. Electrolytic experiments were made with aboron-doped diamond (BDD) anode and an air-diffusion cathode generating H2O2 at constant currentdensity. In this system, oxidant �OH was produced at the BDD surface from water oxidation and in thebulk from Fenton’s reaction. The DY4 solution was rapidly decolorized in EF and PEF due to the actionof �OH. The PEF process yielded an almost total mineralization of DY4, being more powerful than EF thatonly allowed partial mineralization. The proposed PA–EF was as potent as PEF if the initial electrolysiswas prolonged until the production of intermediates that can be mineralized by UVA light. At33.3 mA cm�2, the best PA–EF was found by stopping the electrolysis and starting UVA irradiation at120 min. The PA–EF process was always more economic than PEF and even less expensive than EF at highcurrent density. Oxalic and oxamic acids were detected as ultimate by-products by ion-exclusion HPLC.The Fe(III) complexes of both acids were slowly mineralized with �OH in EF, but rapidly photolyzed byUVA light in PEF and PA–EF. In these processes, the photolysis of N-intermediates produced oxamic acid.NHþ
4 ion was released in much larger proportion than NO�3 ion, but the major part of the initial N was lostas volatile N-compounds. The photolytic removal of Fe(III)-oxalate complexes and N-intermediatesaccounts for the high effectiveness of the PEF and PA–EF processes.
� 2012 Elsevier B.V. All rights reserved.
1. Introduction
Azo dyes are characterized by one or more azo bonds (AN'NA)as chromophore group in association with aromatic structures con-taining functional groups such as AOH and ASO3H, among others[1,2]. They represent about 70% of the world dye production andare extensively used in textile industries, which produce large vol-umes of wastewater effluents with high dye contents coming fromthe dyeing processes. These colored effluents are discharged intowater bodies such as lakes and rivers, where they cause estheticproblems and serious health and environmental risks because ofthe toxicity, carcinogenic and mutagenic properties of dyes andits by-products [3,4]. Azo dyes are very stable in the environmentand persist under ambient conditions due to the difficulty of theirremoval under conventional aerobic treatments in wastewatertreatment plants [5]. Powerful oxidation processes are then needed
to be developed for the destruction of these pollutants from indus-trial wastewaters to avoid their adverse impact.
Advanced oxidation processes (AOPs) are powerful chemical,photochemical, photocatalytic and electrochemical processes thatare being applied to degrade toxic and/or biorefractory organicsin wastewaters [6–9]. The common feature of AOPs is the in situgeneration of hydroxyl radical (�OH) as strong oxidant of the organ-ic matter in waters. The high standard reduction potential of �OH(E�(�OH/H2O) = 2.80 V/SHE) makes possible its non-selective reac-tion with most organics yielding dehydrogenated or hydroxylatedderivatives, which can be in turn completely mineralized, i.e. con-verted into CO2, water and inorganic ions. Recently, electrochemi-cal AOPs (EAOPs) have received great attention by theirenvironmental compatibility, versatility, high efficiency, amenabil-ity of automation and safety because they operate at mild condi-tions [10–13].
Electro-oxidation or anodic oxidation (AO) is the most popularEAOP due to its simplicity. In this procedure, the pollutants are oxi-dized by direct electron transfer to the anode and/or mediated oxi-dation with heterogeneous �OH formed fromwater discharge at the
1572-6657/$ - see front matter � 2012 Elsevier B.V. All rights reserved.http://dx.doi.org/10.1016/j.jelechem.2012.06.002
⇑ Corresponding author. Tel.: +34 93 4021223; fax: +34 93 4021231.E-mail address: [email protected] (E. Brillas).
Journal of Electroanalytical Chemistry 681 (2012) 36–43
Contents lists available at SciVerse ScienceDirect
Journal of Electroanalytical Chemistry
journal homepage: www.elsevier .com/locate / je lechem
131

anode surface at high current [10,12,14]. Non-active boron-dopeddiamond (BDD) thin-film electrodes are the best anodic materialsfor AO because they interact very weakly with physisorbedBDD(�OH) produced from reaction (1) and promote a much greaterO2-overpotential than other conventional anodes like Pt and PbO2
[15,16], enhancing the removal of aromatics like azo dyes [17–24].
BDDþH2O ! BDDð�OHÞ þHþ þ e� ð1ÞThe efficiency of AO can be enhanced using EAOPs based on Fen-ton’s reaction chemistry like electro-Fenton (EF) and photoelectro-Fenton (PEF) [13]. These procedures involve the continuous supplyof H2O2 to an acidic contaminated solution from the two-electroncathodic reduction of injected O2 from following reaction:
O2 þ 2Hþ þ 2e� ! H2O2 ð2ÞCarbonaceous cathodes like carbon nanotubes-polytetrafluoroeth-ylene (PTFE) [25–27], carbon nanotubes on graphite [28], carbonfelt [29–33], activated carbon fiber [34], carbon sponge [35], BDD[36,37] and carbon-PTFE gas (O2 or air) diffusion [38–46] have dem-onstrated a good efficiency for H2O2 generation in the EF and PEFtreatments. In these EAOPs, Fe2+ ion is added as catalyst to reactwith H2O2 giving homogeneous �OH and Fe3+ ion from Fenton’sreaction:
Fe2þ þH2O2 ! Fe3þ þ �OHþ OH� ð3ÞEF is more efficient than the classical chemical Fenton process be-cause reaction (3) can be mainly propagated by the cathodic reduc-tion of Fe3+ to Fe2+ from following reaction [13]:
Fe3þ þ e� ! Fe2þ ð4ÞMoreover, when an undivided cell with a BDD anode is used in EF,organics can be attacked by heterogeneous BDD(�OH) formed fromreaction (1) and by �OH produced in the bulk from Fenton’s reaction(3). In previous work, our group reported that the EF treatment ofmany aromatics like azo dyes do not allow total mineralization ow-ing to the formation of very recalcitrant by-products such as severalFe(III)-carboxylate complexes that react very slowly with generated�OH [38–41,43–46]. We have also found that the PEF process involv-ing the simultaneous exposition of the treated solution to UVA lightaccelerates strongly the mineralization process of aromatics mainlydue to the photolysis of Fe(III)-carboxylate complexes by followingreaction [43–46]:
FeðOOCRÞ2þ þ hv ! Fe2þ þ CO2 þ R� ð5ÞAlthough the PEF process seems preferable to the EF one, its appli-cation to water remediation is limited by the high electrical energyrequirements of both, the electrochemical cell and the artificial UVAlamp working during all electrolysis time. A much more economic
EAOP could be designed by combining partially EF and UVA lightin the so-called photo-assisted EF (PA–EF) method. In this tech-nique, the EF process will be applied only during the time neededfor the conversion of most pollutants into intermediates such asFe(III)-carboxylate complexes that can be photolyzed under UVAillumination and mineralized, thereby strongly reducing the electri-cal energy consumed. To check the possible viability of theproposed PA–EF method for wastewater treatment, we have under-taken a study on the degradation of the diazo dye Direct Yellow 4(DY4), which has not been previously treated by EAOPs. The charac-teristics of this diazo dye are collected in Table 1.
This paper presents the comparative results obtained for thedecolorization and mineralization of a 200 mg l�1 DY4 solutionby EF, PEF and PA–EF using a BDD/air-diffusion cell. The combinedaction of applied current density and UVA irradiation was exploredto find the best experimental conditions for the PA–EF process. Theevolution of generated carboxylic acids was followed by HPLC toclarify the role of generated hydroxyl radicals and UVA light onthe mineralization process. The fate of initial N was assessed bydetermining the concentration of released nitrogen ions like NHþ
4
and NO�3 by ion chromatography.
2. Materials and methods
2.1. Chemicals
Commercial pure azo dye DY4 was supplied by Sigma–Aldrich.Anhydrous sodium sulfate and heptahydrated iron(II) sulfate wereof analytical grade from Fluka and Sigma, respectively. Oxalic, oxa-mic and maleic acids were of analytical grade from Avocado. Or-ganic solvents and other chemicals used were of HPLC oranalytical grade from Aldrich, Lancaster, Merck and Panreac. Solu-tions were prepared with high-purity water obtained from a Milli-pore Milli-Q system with resistivity >18 MX cm at 25 �C.
2.2. Electrochemical systems
All electrolytic trials were conducted in an open and undividedcylindrical cell of 150 ml capacity with a double jacket for circula-tion of external thermostated water to regulate the solution tem-perature using a Thermo Electron Corporation HAAKE DC 10thermostat. The anode was a BDD thin film provided by AdamantTechnologies (La-Chaux-de-Fonds, Switzerland). The cathode wasa carbon-PTFE air-diffusion electrode from E-TEK (Somerset, NJ,USA), mounted as described elsewhere [39]. This cathode was fedwith air pumped at 300 ml min�1 to continuously generate H2O2
by the two-electron reduction of injected O2 from reaction (2).The geometric area of all electrodes was 3 cm2 and the interelectrode
Table 1Chemical structure and characteristics of diazo dye Direct Yellow 4.
Chemical structure Chemicalformula
Colorindexname
Chemical name Colorindexnumber
kmax/nm
M/g mol�1
N SO3 Na
Na O3S NN
N
HO
OH
Na2C26H18N4O8S2 DirectYellow4 (DY4)
Disodium 5-[2-(4-oxocyclohexa-2,5-dien-1-ylidene)hydrazinyl]-2-[(E)-2-[4-[2-(4-oxocyclohexa-2,5-dien-1-ylidene) hydrazinyl]-2-sulphonatophenyl]ethenyl]benzenesulphonate
24890 400 624.55
S. Garcia-Segura et al. / Journal of Electroanalytical Chemistry 681 (2012) 36–43 37
132

gap was ca. 1 cm. All the experiments were performed at constantcurrent density (j) provided by an Amel 2053 potentiostat–galva-nostat. To remove the impurities of the BDD anode surface andactivate the air-diffusion cathode, they were previously polarizedin a 0.05 M Na2SO4 solution at 100 mA cm�2 for 60 min.
Comparative EF, PEF and PA–EF treatments were made using100 ml of solutions containing 200 mg l�1 DY4 (equivalent to100 mg l�1 of total organic carbon (TOC)) in 0.05 M Na2SO4 asbackground electrolyte and 0.5 mM Fe2+ as catalyst at pH 3.0. ThisFe2+ concentration was chosen since it was found optimal for theEF and PEF degradations of other aromatics [39–41,43]. The solu-tion was always kept at 35.0 �C, which is the maximum tempera-ture that can be used in the cell without significant waterevaporation during prolonged electrolysis [38]. The solution wasvigorously stirred with a magnetic bar at 800 rpm to ensure itsmixing and the transport of reactants towards/from the electrodes.For the PEF and PA–EF processes under UVA irradiation, a PhilipsTL/6 W/08 fluorescent black light blue tube placed at 7 cm abovethe solution was employed. The tube emitted UVA light in thewavelength region 320–400 nm with kmax = 360 nm, supplying aphotoionization energy of 5 Wm�2 as detected with a Kipp & Zo-nen CUV 5 radiometer.
2.3. Apparatus and analytical procedures
The solution pH was measured with a Crison GLP 22 pH-meter.Samples were withdrawn at regular time intervals from the treatedsolution, then alkalinized to stop the degradation process andmicrofiltered with 0.45 lm PTFE filters from Whatman beforeanalysis. The decolorization of DY4 solutions was monitored fromthe absorbance (A) decrease at the maximum visible wavelength(kmax) of 400 nm, measured from the spectra recorded on a Shima-dzu 1800 UV/Vis spectrophotometer at 35 �C. The mineralization ofsolutions was monitored from their TOC decay using a ShimadzuVCSN TOC analyzer. Reproducible TOC values with a precision of±1% were obtained by injecting 50 ll aliquots into the TOC ana-lyzer. Total nitrogen (TN) was determined with a ShimadzuTNM-1 unit coupled with the TOC analyzer.
Generated carboxylic acids were identified and quantified byion-exclusion HPLC using a Waters 600 LC fitted with a Bio-RadAminex HPX 87H, 300 mm � 7.8 mm (i.d.), column at 35 �C andcoupled with a Waters 996 photodiode array detector atk = 210 nm. These measurements were made by injecting 20 ll ali-quots into the LC under circulation of 4 mM H2SO4 at 0.6 ml min�1
as mobile phase. NHþ4 and NO�3 ions formed during dye degradationwere detected by ionic chromatography using a Shimadzu 10 AvpHPLC coupled with a Shimadzu CDD 10 Avp conductivity detector.The NHþ4 concentration was determined with a Shodex IC YK-421,125 mm � 4.6 mm (i.d.), cation column at 40 �C, whereas the NO�3content was obtained with a Shim-Pack IC-A1S, 100 mm � 4.6 mm(i.d.), anion column at 40 �C. These analyses were performed with25 ll aliquots using a mobile phase composed of 5.0 mM tartaricacid, 1.0 mM dipicolinic acid, 24.2 mM boric acid and 1.5 mM cor-ona ether at 1.0 ml min�1 for NHþ4 and 2.4 mM tris(hydroxy-methyl)aminomethane and 2.5 mM phthalic acid of pH 4.0 at1.5 ml min�1 for NO�3 .
3. Results and discussion
3.1. Color removal of the DY4 solution in EF and PEF
The 200 mg l�1 DY4 solution in 0.05 M Na2SO4 with 0.5 mM Fe2+
at pH 3.0 and 35 �C was decolorized at similar rate in EF and PEF forthe same current density. An increase in j decreased the time re-
quired for achieving total decolorization. For each trial, the per-centage of color removal was calculated from the expression [13]:
% color removal ¼ A0 � At
t0� 100 ð6Þ
where A0 and At are the absorbances at initial time and time t forkmax = 400 nm, respectively. Fig. 1a exemplifies the variation of thisparameter with electrolysis time for EF at j = 33.3 mA cm�2. As canbe seen, the initially yellow DY4 solution underwent a quick colorremoval, becoming colorless at 40 min of treatment. This behaviorcan be confirmed from the change in its UV–Vis spectrum depictedin Fig. 1b. Two broad bands centered at 252 and 400 nm can be ob-served for the initial solution. The minor band at 252 nm can be as-cribed to the aromatic rings, whereas the major one is related to thep? p� transition of the large conjugated chromophore systemwiththree benzenic rings, one AC'CA bond and two AN'NA bonds(see the formula of DY4 in Table 1). Fig. 1b also shows that theintensity of both bands falls rapidly during the first 20–25 min ofelectrolysis, as expected if non-conjugated molecules are graduallyformed [44–46]. Besides, the maximal of 400 nm of the major bandis progressively shifted to a lower value of 348 nm, suggesting thegeneration of colored by-products with shorter conjugation priorto the cleavage of the conjugated systems.
Note that the high efficiency of the air-diffusion cathode to gen-erate H2O2 from reaction (2) [13,44] avoids the significant reduc-tion of AN'NA bonds on its surface, as found for metalliccathodes [2]. The fast and similar decolorization of the DY4 solu-tion by EF and PEF can then be associated with the combined oxi-dative attack of �OH formed from Fenton’s reaction (3) and
0
20
40
60
80
100
120
0 10 20 30 40 50 60
% C
olor
rem
oval
time / min
0.0
0.5
1.0
1.5
2.0
200 300 400 500 600 700
Abs
orba
nce
λ / nm
t = 0 min
t = 50 min
a
b
Fig. 1. (a) Percentage of color removal with electrolysis time for the degradation of100 ml of a 200 mg l�1 DY4 solution in 0.05 M Na2SO4 with 0.5 mM Fe2+ at pH 3.0,33.3 mA cm�2 and 35 �C by electro-Fenton (EF). The cell contained a 3 cm2 BDDanode and a 3 cm2 air-diffusion electrode. (b) UV–vis spectra recorded for the DY4solution from 0 to 50 min of electrolysis.
38 S. Garcia-Segura et al. / Journal of Electroanalytical Chemistry 681 (2012) 36–43
133

BDD(�OH) produced from reaction (1), as well as the direct oxida-tion of DY4 and its primary by-products at the BDD anode, withoutsignificant photolysis of organics by UVA light in PEF. Higher jvalues accelerate all electrode reactions, producing more oxidanthydroxyl radicals and shorting the time required for total decolor-ization. These oxidation reactions also yield the gradual minerali-zation of intermediates to CO2 and inorganic ions, as will bediscussed in subsections below.
3.2. Comparative TOC removal of the DY4 solution by EF, PEF and PA–EF
Fig. 2a highlights that direct exposition of the above 200 mg l�1
DY4 solution to UVA light without current circulation did not yieldany TOC decay, indicating that the diazo dye is not photodecom-posed. In contrast, a gradual mineralization with prolonging elec-trolysis always took place under EF and PEF conditions. After360 min at 33.3 mA cm�2 (see Fig. 2a), TOC was only reduced by83% in EF process, whereas an almost total mineralization with97% TOC decay was achieved by the more potent PEF method. Inboth treatments, DY4 and its intermediates are destroyed by �OHin the bulk and BDD(�OH) at the anode surface, along with their di-rect oxidation on BDD, as pointed out above. The higher minerali-zation attained by PEF can then be related to the synergistic actionof UVA light that promotes the photolysis of several intermediates,like Fe(III)-carboxylate complexes [43–46], accelerating their con-version into CO2.
To check the oxidation ability of H2O2 produced in EF, a run wasmade by stopping the current density of 33.3 mA cm�2 at 60 minand further measuring the change of TOC up to 360 min. As canbe seen in Fig. 2a, the remaining TOC of 69 mg l�1 after 60 min of
EF was reduced to 55 mg l�1 at 180 min, whereupon it remainedconstant. This decay in 14 mg l�1 of TOC without pass of currentcan be accounted for by the oxidative action of �OH formed fromFenton’s reaction (3) until the consumption of H2O2 accumulatedin solution during the first hour of electrolysis. A gradual accumu-lation of H2O2 generated from a gas-diffusion electrode during EFand PEF treatments of other aromatics has been reported previ-ously [41].
From the aforementioned considerations, several trials were de-signed to assess the oxidation power of the proposed PA–EF pro-cess. The treatment of the 200 mg l�1 DY4 solution was initiatedoperating under EF conditions at 33.3 mA cm�2 for 30, 60 and120 min, being subsequently irradiated with UVA light until360 min. Fig. 2b illustrates that for these runs, TOC was finally re-duced by 41%, 82% and 97%, respectively. Note that by stopping theEF treatment at 60 min, the oxidation action of UVA light with 82%TOC decay was much more effective than that of �OH formed fromaccumulated H2O2 with only 45% TOC decay (see Fig. 2a), indicat-ing that a large proportion of intermediates is already able to bephotolyzed. When the electrolysis time of EF was prolonged to120 min reaching about 60% of TOC removal (see Fig. 2b), thePA–EF process became as potent as the PEF one, giving rise to asimilar almost total mineralization of 97% at 360 min. That meansthat once attained 60% TOC decay in EF, most of remaining inter-mediates can be easily photolyzed by UVA light and transformedinto CO2, so that, no oxidant hydroxyl radicals are needed for theirmineralization. A 60% TOC removal can then be considered the bestexperimental condition to stop the EF treatment during the PA–EFprocess.
3.3. Effect of current density on TOC decay
The current density is a key parameter of the EAOPs because itlimits the amount of generated hydroxyl radicals that can oxidizethe organic matter [13]. The influence of this variable on the deg-radation rate of DY4 in EF and PEF was studied by electrolyzing the200 mg l�1 diazo dye solution between 16.6 and 100 mA cm�2.Fig. 3a and b shows that TOC removal increased with increasing jfrom 16.6 to 66.6 mA cm�2 due to the concomitant accelerationin the production of BDD(�OH) from reaction (1) and �OH from Fen-ton’s reaction (3) as a result of the greater H2O2 electrogeneration[41,44] by reaction (2) and Fe2+ regeneration by reaction (4). How-ever, similar TOC abatements were found in both treatments for66.6 and 100 mA cm�2, indicating that at j > 66.6 mA cm�2, theelectrolytic systems achieved their maximum oxidation powerwith maximum generation of reactive hydroxyl radicals. Compari-son of Fig. 3a and b evidences that the PEF process is more potentthan the EF one for all j values because of the additional photolyticdestruction of intermediates by UVA light. For example, after240 min of electrolysis, TOC was reduced by 59%, 68%, 74%, 85%and 83% for EF and 72%, 91%, 94%, 95% and 97% for PEF at increasingj of 16.6, 25.0, 33.3, 66.6 and 100 mA cm�2.
To better clarify the role of generated hydroxyl radicals, themineralization current efficiency (MCE) for the above trials wasestimated as follows [44,45]:
MCE ð%Þ ¼ nFVsDðTOCÞexp4:32� 107 mIt
� 100 ð7Þ
where F is the Faraday constant (96487 C mol�1), Vs is the solutionvolume (l), D(TOC)exp is the experimental TOC decay (mg l�1),4.32 � 107 is an homogenization factor (3600 s h�1 � 12000mg mol�1), m is the number of carbon atoms of DY4 (26 carbonatoms), I is the applied current (A) and t is the electrolysistime (h). The number of electrons (n) consumed per molecule
0
20
40
60
80
100
120
EF up to 60 min
0
20
40
60
80
100
0 60 120 180 240 300 360 420
time / min
UVA from 30 min
UVA from 60 min
UVA from 120 min
TO
C/ m
g l-1
a
b
Fig. 2. TOC abatement vs electrolysis time for 100 ml of a 200 mg l�1 DY4 solutionin 0.05 M Na2SO4 with 0.5 mM Fe2+ at pH 3.0, 33.3 mA cm�2 and 35 �C. In plot (a),(�) UV irradiation without current and (s) EF and (d) photoelectro-Fenton (PEF)with 6 W UVA light of kmax = 360 nm. (h) EF process up to 60 min, whereupon theresulting solution remained without any treatment. In plot (b), (s) EF process andphoto-assisted EF (PA–EF) degradation where only UVA irradiation was applied tothe solution after: (.) 30 min, (N) 60 min and (j) 120 min of electrolysis.
S. Garcia-Segura et al. / Journal of Electroanalytical Chemistry 681 (2012) 36–43 39
134

mineralized was taken as 108 assuming that DY4 is converted intocarbon dioxide, and sulfate and ammonium ions from reaction (8):
C26H18N4O8S2�2 þ 52H2O! 26CO2 þ 2SO2�
4 þ 4NHþ4 þ 106Hþ
þ 108e� ð8ÞThe formation of sulfate ion is expected from the oxidation behaviorof sulfonated compounds [42], whereas the initial nitrogen ismainly mineralized to NHþ4 ion, as will be discussed below.
The inset panels of Fig. 3a and b present the MCE values calcu-lated from Eq. (7) for the corresponding EF and PEF trials. As ex-pected, greater efficiencies were comparatively obtained for thePEF process owing to its higher oxidation power. The lowerj = 16.6 mA cm�2 yielded smaller MCE values than 25.0 and33.3 mA cm�2 during the first 120 min of both treatments, suggest-ing the slower mineralization of organics by the lower productionof BDD(�OH) and �OH. Maximum efficiencies of 28–34% for EF and37–45% for PEF were found for 25.0 and 33.3 mA cm�2 up to120 min, although such efficiencies diminished gradually with
raising j. Moreover, at longer electrolysis time the MCE values un-dergo a dramatic fall, more pronounced as j increases. This phe-nomenon can be ascribed to the gradual loss in organic matterand the accumulation of low amounts of intermediates that arehardly oxidizable with hydroxyl radicals [12,13]. The fact thatmaximum and similar efficiencies were determined for each EAOPat 25.0 and 33.3 mA cm�2 up to 120 min, decreasing strongly for66.6 and 100 mA cm�2, as well as the progressive decay in MCEat longer times when j increases from 16.6 to 100 mA cm�2, seemscontradictory to the higher production of hydroxyl radicalssuggested by the concomitant acceleration of the mineralizationprocess shown in Fig. 3a and b. This behavior indicates thathydroxyls radicals are mainly consumed in parasitic non-oxidizingreactions at higher j. Such waste reactions involve the direct oxida-tion of BDD(�OH) to O2 by reaction (9), the dimerization of �OH toH2O2 by reaction (10) and its destruction with H2O2 by reaction(11) giving the weaker oxidant hydroperoxyl radical (HO2
�)[12–14]:
2BDDð�OHÞ ! 2BDDþ O2ðgÞ þ 2Hþ þ 2e� ð9Þ
2�OH ! H2O2 ð10Þ
H2O2 þ �OH! HO�2 þH2O ð11Þ
Moreover, BDD(�OH) generation can also be inhibited by the parallelproduction of weaker oxidants like S2O
2�8 ion from SO2�
4 ion oxida-tion by reaction (12) and O3 by reaction (13) [8,12]:
2SO2�4 ! S2O
2�8 þ 2e� ð12Þ
3H2O! O3ðgÞ þ 6Hþ þ 6e� ð13ÞThe production of �OH in the bulk from Fenton’s reaction (3) couldalso be decelerated at higher j by the increase in rate of H2 evolutionat the cathode taking place in parallel to H2O2 generation by reac-tion (2).
The effect of current density on the PA–EF degradation of theDY4 solution was further investigated. To do this, the initial EFtreatment was applied for each j until the optimum 60% TOC re-moval was reached, then the solution being illuminated withUVA light. For these trials, Fig. 3c depicts that the electrolysis ranfor 270, 180, 140, 80 and 80 min at 16.6, 25.0, 33.3, 66.6 and100 mA cm�2, respectively. While only 83% mineralization wasreached for 16.6 mA cm�2 at 360 min, higher TOC removals of90–93% were obtained for the j values of 33.3, 66.6 and100 mA cm�2 at 240 min, slightly lower than those determinedfor PEF (see Fig. 3b). This indicates again that the PA–EF processrapidly mineralizes the solution because the major part of remain-ing organics can be photolyzed by UVA light, being as potent asPEF. To confirm that the former method is more economic, the spe-cific energy consumption per unit TOC mass (EC) of each trial wasestimated from the expression [13]:
ECðkW h g�1TOCÞ ¼ ðIEcellt1 þ 6t2ÞDðTOCexpÞVs
ð14Þ
where Ecell is the average potential difference of the cell (V), 6 is thepower of the UVA lamp (W), t1 and t2 are the corresponding timesfor the electrolysis and UVA irradiation (h), D(TOC)exp is the exper-imental TOC decay (mg l�1) and Vs is the solution volume (l). FromEq. (14), one obtains for j = 33.3 mA cm�2 (Ecell = 12.0 V) during 4 hof treatment, a cost of 0.64 kW h g�1 TOC for EF (t1 = 4 h, t2 = 0),3.06 kW h g�1 TOC for PEF (t1 = 4 h, t2 = 4 h) and 1.39 kW h g�1
TOC for PA–EF (t1 = 2.66 h, t2 = 1.33 h). It is then apparent that thePA–EF method is much less expensive than the PEF one, but EF ismore economic although it yields lower mineralization (seeFig. 3a and c). However, at high j this trend is inverted due to the
0
20
40
60
80
100
120
0
20
40
60
80
100
TO
C /
mg
l-1
0
20
40
60
80
100
120
0 60 120 180 240 300 360 420
time / min
UVA illumination
a
b
c
0
10
20
30
40
0 60 120 180 240 300 360 420
% M
CE
time / min
0
10
20
30
40
50
0 60 120 180 240 300 360 420
% M
CE
time / min
Fig. 3. Effect of current density on TOC decay with electrolysis time for thetreatments of 100 ml of 200 mg l�1 DY4 solution in 0.05 M Na2SO4 with 0.5 mM Fe2+
at pH 3.0 and 35 �C. by means of (a) EF, (b) PEF and (c) PA–EF by stopping appliedcurrent density and starting UVA irradiation at 60% of mineralization. Currentdensity: (h) 16.6 mA cm�2, (}) 25.0 mA cm�2, (s) 33.3 mA cm�2, (4) 66.6 mA cm�2
and (5) 100 mA cm�2. In plot (c), the black symbols correspond to data obtainedunder UVA light. The inset panels present the corresponding mineralization currentefficiencies calculated from Eq. (7).
40 S. Garcia-Segura et al. / Journal of Electroanalytical Chemistry 681 (2012) 36–43
135

great increase in Ecell. For example, at 100 mA cm�2 (Ecell = 28.9 V),energy consumptions of 4.18, 6.05 and 3.55 kW h g�1 TOC are ob-tained for the above EF, PEF and PA–EF treatments, respectively.Consequently, the PA–EF process is always more economic thanPEF and can also be less expensive than EF at high j.
3.4. Evolution of generated carboxylic acids and released inorganicnitrogen ions
It is well-known that the mineralization of aromatics by EAOPsleads to short-linear carboxylic acids, which are present in thesolution as Fe(III) complexes [2,13,41,43–46]. The formation ofthese products from DY4 was corroborated for the EF, PEF andPA–EF treatments at 33.3 mA cm�2. Ion-exclusion HPLC chromato-grams of electrolyzed solutions exhibited well-defined peaks re-lated to oxalic, maleic and oxamic acids at retention times of 6.9,8.2 and 9.4 min, respectively. Maleic acid is formed from the cleav-age of the benzenic rings of aromatic intermediates, subsequently
being oxidized to oxalic acid [2,13]. This acid is largely accumu-lated because it is the final product of precedent longer linearacids, whereas oxamic acid is formed in much smaller extent fromthe breaking of the heteroaromatic moieties with a ANH2 group.Oxalic and oxamic acids are ultimate carboxylic acids because theyare directly oxidized to CO2 [47].
Fig. 4a illustrates that maleic acid was accumulated in small ex-tent, 0.36 mg l�1 as maximum, and removed at similar rate by EFand PEF, disappearing from the medium in 50–60 min. It can alsobe observed that when the electrolysis was stopped at 30 min ofthe PA–EF treatment, the concentration of maleic acid (0.16mg l�1) remained constant under UVA irradiation. This indicatesthat Fe(III)-maleate complexes are efficiently oxidized by �OH andBDD(�OH), but not directly photolyzed by UVA light. The fastdestruction of such complexes by hydroxyl radicals then explainsthe quick removal of maleic acid in these EAOPs.
A very different behavior can be seen in Fig. 4b for oxalic acid. InEF, this acid was gradually and largely accumulated up to 93 mg l�1
in 150 min, whereupon it decayed slowly to 62 mg l�1 in 360 min.This trend evidences a very slow destruction of Fe(III)-oxalate com-plexes with hydroxyl radicals, mainly with BDD(�OH) [47]. In con-trast, a maximum content of 91 mg l�1 for this acid was alreadyfound after only 80 min of PEF, practically disappearing at360 min, i.e. when the solution reached 97% mineralization (seeFig. 2a). This indicates that larger amounts of Fe(III)-oxalate com-plexes are more quickly generated from the photolysis of longercarboxylic acids, then being much more rapidly photodecarboxy-lated by UVA light than oxidized with hydroxyl radicals [43–47].Fig. 4b also shows that in PA–EF, all the oxalic acid accumulatedafter 30, 60 and 120 min of electrolysis was completely removedby applying UVA irradiation up to 360 min. A simple mass balanceof this process at 120 min reveals that the 90 mg l�1 of oxalic acidaccumulated corresponds to 24 mg l�1 TOC, that is, only 60% of the40 mg l�1 TOC of the remaining solution (see Fig. 2b). Since 97%TOC removal is attained at the end of this PA–EF treatment, onecan infer that large quantities of other undetected intermediates,different from carboxylic acids, are mineralized under the actionof UVA light.
Fig. 4c depicts a more complex behavior for oxamic acid. In EF,this acid was accumulated up to 1.8 mg l�1 in 120 min and furthervery slowly removed to a final value of 0.7 mg l�1 because of thesmall reaction rate of their Fe(III) complexes with �OH andBDD(�OH) [47]. In PEF, however, oxamic acid was much more lar-gely produced, up to 3.8 mg l�1 in 120 min, and much more rapidlyremoved at 360 min. This can be related to the synergistic action ofUVA light, which photolyzes several N-intermediates acceleratingthe production of oxamic acid, as well as the Fe(III)-oxamate com-plexes enhancing their mineralization. Surprisingly, Fig. 4c showsthat in all the PA–EF treatments, the oxamic acid concentration in-creased during the UVA illumination step. For example, the1.8 mg l�1 of this acid present in the solution after 120 min of elec-trolysis rose up to 2.6 mg l�1 at the end of the process. This suggestthe generation of large amounts of N-derivatives from DY4 that aredifficulty removed by hydroxyl radicals but easily photolyzed byUVA light accelerating their conversion into oxamic acid and/ortheir mineralization. This fact, along with the quick photodecom-position of Fe(III)-oxalate complexes (see Fig. 4b), could explainthe almost total mineralization reached by this PA–EF process.
Ionic chromatograms of electrolyzed solutions confirmed the re-lease of NHþ4 and NO�3 ions from the initial N contained in DY4(21.4 mg l�1) by the EAOPs tested. No other inorganic nitrogen ions,like NO�2 ion, were detected by this technique. Table 2 shows thatafter 360 min of electrolysis at 33.3 mA cm�2, a similar concentra-tion of each ion was found for both EF and PEF treatments, but witha much larger proportion of NHþ4 (ca. 22% of initial N) than NO�3 ion(ca. 8% of initial N), as proposed in reaction (8). In contrast, the
0.0
0.1
0.2
0.3
0.4
0 20 40 60 80 100 120
[Mal
eic
acid
] / m
g l-1
time / min
0
20
40
60
80
100
[Oxa
lic a
cid]
/ m
g l-1
0
1
2
3
0 60 120 180 240 300 360 420
time / min
[Oxa
mic
aci
d] /
mg
l-1
a
b
c
Fig. 4. Evolution of (a) maleic, (b) oxalic and (c) oxamic acids detected during thetreatment of 100 ml of a 200 mg l�1 DY4 solution in 0.05 M Na2SO4 with 0.5 mMFe2+ at pH 3.0, 33.3 mA cm�2 and 35 �C. Method: (s) EF, (d) PEF and PA–EF whereonly UVA irradiation started at: (.) 30 min, (N) 60 min and (j) 120 min ofelectrolysis.
S. Garcia-Segura et al. / Journal of Electroanalytical Chemistry 681 (2012) 36–43 41
136

PA–EF process by stopping the electrolysis at 120 min yieldedgreater contents of both inorganic ions, being accumulated about33% and 10% of initial N as NOþ4 and NO�3 ions, respectively (seeTable 2). Taking into account the concentration of oxamic acidshown in Fig. 4c, Table 2 evidences that the percentage of initialN released to the solution is near 30% for EF and PEF and 44% forPA–EF, in good agreement with the TN values determined for thecorresponding final treated solutions, as expected if they mainlycontain oxamic acid and NHþ4 and NO�3 ions as N-compounds. Thesefindings demonstrate that the initial N is mainly mineralized toNHþ4 , although its major part is loss as volatile derivatives, probablyN2 and NOx species. The smaller production of inorganic nitrogenions in the EF and PEF processes than in the PA–EF one suggeststhat volatile N-derivatives proceed from the oxidation ofN-intermediates with generated hydroxyl radicals, whereas theirphotolytic reactions favor the mineralization via NHþ
4 and NO�3production.
4. Conclusions
A solution with 200 mg l�1 DY4 was rapidly decolorized at thesame rate by EF and PEF, indicating that generated hydroxyl radi-cals are the main oxidants of the diazo dye. The PEF process wasmuch more powerful due to the synergistic action of UVA lightyielding an almost total mineralization, whereas the EF one onlyallowed a partial mineralization. The proposed PA–EF treatmentwas as potent as the PEF one if the initial electrolysis was per-formed during a sufficiently long time to produce intermediatesthat can be mineralized by photolysis with UVA light. At33.3 mA cm�2, the best PA–EF process was found by stopping theelectrolysis and starting UVA irradiation at 120 min. The increasein j from 16.6 to 100 mA cm�2 enhanced both EF and PEF treat-ments because of the larger production of hydroxyl radicals. Max-imum MCE values were obtained during the first 120 min of bothEAOPs at 25.0 and 33.3 mA cm�2, decreasing with increasing j bythe acceleration of parasitic reactions of hydroxyl radicals. ThePA–EF process was also very effective from j = 25.0 mA cm�2, al-ways being more economic than PEF and even less expensive thanEF at high j. Maleic, oxalic and oxamic acids were detected as gen-erated carboxylic acids. While Fe(III)-maleate complexes werequickly removed with hydroxyl radicals, the Fe(III) complexes ofthe two latter acids were photodecomposed by UVA light in PEFand PA–EF. In these processes, oxamic acid was formed in largerextent from the photolysis of N-intermediates. NHþ
4 ion was accu-mulated in much larger proportion than NO�3 ion, although the ma-jor part of the initial N was lost as volatile N-compounds. The higheffectiveness of PEF and PA–EF treatments can be ascribed to thephotolytic removal of Fe(III)-oxalate complexes and N-intermedi-ates. PA–EF method can then be an excellent EAOP for the remedi-ation of industrial textile wastewaters.
Acknowledgements
The authors thank the financial support from MICINN (Ministe-rio de Ciencia e Innovación, Spain) under the project CTQ2010-
16164/BQU, co-financed with FEDER funds. The grants given to S.Garcia-Segura and A. El-Ghenymy awarded from MEC (Ministeriode Educación y Ciencia, Spain) are acknowledged.
References
[1] E. Forgacs, T. Cserháti, G. Oros, Environ. Int. 30 (2004) 953–971.[2] C.A. Martínez-Huitle, E. Brillas, Appl. Catal. B: Environ. 87 (2009) 105–145.[3] S.M.A.G. Ulson de Souza, E. Forgiarini, A.A. Ulson de Souza, J. Hazard. Mater.
147 (2007) 1073–1078.[4] K.P. Sharma, S. Sharma, S. Sharma, P.K. Singh, S. Kumar, R. Grover, P.K. Sharma,
Chemosphere 69 (2007) 48–54.[5] T. Robinson, G. McMullan, R. Marchant, P. Nigam, Bioresour. Technol. 77 (2001)
241–255.[6] E. Brillas, J.C. Calpe, P.L. Cabot, Appl. Catal. B-Environ. 46 (2003) 381–391.[7] M. Pera-Titus, V. García-Molina, M.A. Baños, J. Giménez, S. Esplugas, Appl.
Catal. B-Environ. 47 (2004) 219–256.[8] C.A. Martínez-Huitle, E. Brillas, Angew. Chem. Int. Ed. 47 (2008) 1998–2005.[9] M. Klavarioti, D. Mantzavinos, D. Kassinos, Environ. Int. 35 (2009) 402–417.[10] C.A. Martínez-Huitle, S. Ferro, Chem. Soc. Rev. 35 (2006) 1324–1340.[11] A. Anglada, A. Urtiaga, I. Ortiz, J. Chem. Technol. Biotechnol. 84 (2009) 1747–
1755.[12] M. Panizza, G. Cerisola, Chem. Rev. 109 (2009) 6541–6569.[13] E. Brillas, I. Sirés, M.A. Oturan, Chem. Rev. 109 (2009) 6570–6631.[14] B. Marselli, J. Garcia-Gomez, P.A. Michaud, M.A. Rodrigo, Ch. Comninellis, J.
Electrochem. Soc. 150 (2003) D79–D83.[15] I. Sirés, E. Brillas, G. Cerisola, M. Panizza, J. Electroanal. Chem. 613 (2008) 151–
159.[16] C. Flox, C. Arias, E. Brillas, A. Savall, K. Groenen-Serrano, Chemosphere 74
(2009) 1340–1347.[17] M. Faouzi, P. Cañizares, A. Gadri, J. Lobato, B. Nasr, R. Paz, M.A. Rodrigo, C. Saez,
Electrochim. Acta 52 (2006) 325–331.[18] C. Flox, P.L. Cabot, F. Centellas, J.A. Garrido, R.M. Rodríguez, C. Arias, E. Brillas,
Chemosphere 64 (2006) 892–902.[19] L.S. Andrade, L.A.M. Ruotolo, R.C. Rocha-Filho, N. Bocchi, S.R. Biaggio, J. Iniesta,
V. García-Garcia, V. Montiel, Chemosphere 66 (2007) 2035–2043.[20] E. Butrón, M.E. Juárez, M. Solis, M. Teutli, I. González, J.L. Nava, Electrochim.
Acta 52 (2007) 6888–6894.[21] M. Panizza, G. Cerisola, J. Hazard. Mater. 153 (2008) 83–88.[22] E. Brillas, S. Garcia-Segura, M. Skoumal, C. Arias, Chemosphere 79 (2010) 605–
612.[23] J. Sun, H. Lu, L. Du, H. Lin, H. Li, Appl. Surf. Sci. 257 (2011) 6667–6671.[24] J.M. Aquino, M.A. Rodrigo, R.C. Rocha-Filho, C. Sáez, P. Cañizares, Chem. Eng. J.
184 (2012) 221–227.[25] A.R. Khataee, M. Zarei, S.K. Asl, J. Electroanal. Chem. 648 (2010) 143–150.[26] M. Zarei, A.R. Khataee, R. Ordikhani-Seyedlar, M. Fathinia, Electrochim. Acta 55
(2010) 7259–7265.[27] M. Iranifam, M. Zarei, A.R. Khataee, J. Electroanal. Chem. 659 (2011) 107–112.[28] A.R. Khataee, M. Safarpour, M. Zarei, S. Aber, J. Electroanal. Chem. 659 (2011)
63–68.[29] N. Oturan, M.A. Oturan, Agron. Sustain. Dev. 25 (2005) 267–270.[30] S. Hammami, N. Oturan, N. Bellakhal, M. Dachraoui, M.A. Oturan, J. Electroanal.
Chem. 610 (2007) 75–84.[31] A. Özcan, Y. S�ahin, A.S. Koparal, M.A. Oturan, Appl. Catal. B-Environ. 89 (2009)
620–626.[32] I. Sirés, N. Oturan, M.A. Oturan, Water Res. 44 (2010) 3109–3120.[33] M.A. Oturan, N. Oturan, M.C. Edelahi, F.I. Podvorica, K. El Kacemi, Chem. Eng. J.
171 (2011) 127–135.[34] A. Wang, J. Qu, H. Liu, J. Ru, Appl. Catal. B-Environ. 84 (2008) 393–399.[35] A. Özcan, Y. Sahin, A.S. Koparal, M.A. Oturan, J. Electroanal. Chem. 616 (2008)
71–78.[36] K. Cruz-González, O. Torres-López, A. García-León, J.L. Guzmán-Mar, L.H.
Reyes, A. Hernández-Ramírez, J.M. Peralta-Hernández, Chem. Eng. J. 160(2010) 199–206.
[37] K. Cruz-González, O. Torres-Lopez, A.M. García-León, E. Brillas, A. Hernández-Ramírez, J.M. Peralta-Hernández, Desalination 286 (2012) 63–68.
[38] B. Boye, M.M. Dieng, E. Brillas, Electrochim. Acta 48 (2003) 781–790.[39] E. Brillas, M.A. Baños, S. Camps, C. Arias, P.L. Cabot, J.A. Garrido, R.M. Rodríguez,
New J. Chem. 28 (2004) 314–322.
Table 2Concentration of N-compounds formed, percentage of initial N released to solution and total nitrogen (TN) determined after 360 min of treatment of 100 ml of a 200 mg l�1 DY4solution in 0.05 M Na2SO4 with 0.5 mM Fe2+ at pH 3.0 and 35 �C in a BDD/air-diffusion cell at 33.3 mA cm�2 by EF, PEF and PA–EF.
Process Oxamic acida (mg l�1) NHþ4 iona (mg l�1) NO�3 iona (mg l�1) % initial N released to solution TNb (mg l�1)
EF 0.74 (0.55) 5.90 (21.44) 6.82 (7.19) 29.18 6.40 (29.89)PEF 0.44 (0.33) 6.06 (22.02) 8.28 (8.73) 31.08 6.67 (31.17)PA–EFc 2.62 (1.87) 9.03 (32.80) 9.38 (9.89) 44.56 9.51 (44.39)
a In parenthesis: percentage of initial N in the N-compound.b In parenthesis: percentage of total nitrogen respect to initial N.c In parenthesis: stop of EF and start of UVA illumination at 120 min.
42 S. Garcia-Segura et al. / Journal of Electroanalytical Chemistry 681 (2012) 36–43
137

[40] S. Ammar, R. Abdelhedi, C. Flox, C. Arias, E. Brillas, Environ. Chem. Lett. 4(2006) 229–233.
[41] C. Flox, J.A. Garrido, R.M. Rodríguez, P.L. Cabot, F. Centellas, C. Arias, E. Brillas,Catal. Today 129 (2007) 29–36.
[42] M. Panizza, G. Cerisola, Water Res. 43 (2009) 339–344.[43] M. Skoumal, R.M. Rodríguez, P.L. Cabot, F. Centellas, J.A. Garrido, C. Arias, E.
Brillas, Electrochim. Acta 54 (2009) 2077–2085.
[44] E.J. Ruiz, A. Hernández-Ramírez, J.M. Peralta-Hernández, C. Arias, E. Brillas,Chem. Eng. J. 171 (2011) 385–392.
[45] R. Salazar, S. Garcia-Segura, M.S. Ureta-Zañartu, E. Brillas, Electrochim. Acta 56(2011) 6371–6379.
[46] L.C. Almeida, S. Garcia-Segura, N. Bocchi, E. Brillas, Appl. Catal. B: Environ. 103(2011) 21–30.
[47] S. Garcia-Segura, E. Brillas, Water Res. 45 (2011) 2975–2984.
S. Garcia-Segura et al. / Journal of Electroanalytical Chemistry 681 (2012) 36–43 43
138

Results and Discussion
�����
PAPER 6
Solar photoelectrocatalytic degradation
of Acid Orange 7 azo dye using a highly
stable TiO2 photoanode synthesized by
atmospheric plasma spray

Results and Discussion �
�����

Applied Catalysis B: Environmental 132– 133 (2013) 142– 150
Contents lists available at SciVerse ScienceDirect
Applied Catalysis B: Environmental
jo u r n al hom ep age: www.elsev ier .com/ locate /apcatb
Solar photoelectrocatalytic degradation of Acid Orange 7 azo dye using a highly
stable TiO2 photoanode synthesized by atmospheric plasma spray
Sergi Garcia-Seguraa, Sergi Dostab, Josep M. Guilemanyb, Enric Brillasa,∗
a Laboratori d’Electroquímica dels Materials i del Medi Ambient, Departament de Química Física, Facultat de Química, Universitat de Barcelona, Martí i Franquès 1-11,
08028 Barcelona, Spainb CPT Thermal Spray Centre, Materials Engineering, Departament d’Enginyeria Química i Metal.lúrgia, Universitat de Barcelona, Martí i Franquès 1-11,
08028 Barcelona, Spain
a r t i c l e i n f o
Article history:
Received 16 August 2012
Received in revised form
17 November 2012
Accepted 22 November 2012
Available online 1 December 2012
Keywords:
Acid Orange 7
Photocatalysis
Photoelectrocatalysis
Sunlight
Water treatment
a b s t r a c t
A TiO2 coating composed of 29% rutile, 9% anatase and 62% of Ti7O13 on stainless steel support has been
prepared by atmospheric plasma spray technology. This novel photoanode was coupled to an air-diffusion
cathode that generates H2O2 in a photoelectrochemical cell submitted to direct sunlight irradiation to
degrade 100 mL of Acid Orange 7 (AO7) azo dye solutions in 0.05 M Na2SO4 by solar photoelectrocataly-
sis (SPEC). The photoanode presented excellent mechanical properties as well as large stability and long
durability up to 2.0 mA cm−2. The decolorization process in SPEC was synergistic of the individual pro-
cesses in solar photocatalysis and anodic oxidation with generated H2O2 under comparable conditions
owing to the larger production of •OH from the higher amounts of photogenerated holes that can be
separated of photogenerated electrons. The best operating variables for SPEC were 15 mg L−1 AO7, pH
7.0 and anodic current density (janod) of 1.0 mA cm−2. Under these conditions, the azo dye disappeared in
100 min and the solution was totally decolorized in 120 min, but only 40% mineralization was attained
after 240 min of electrolysis. The AO7 decay followed a pseudo-first-order reaction as found by reversed-
phase HPLC and it was accelerated with increasing janod due to the higher amounts of •OH generated
from the production of more photogenerated holes and the enhancement of anodic oxidation of water.
Ion-exclusion HPLC allowed the identification of generated carboxylic acids like phthalic, tartaric, suc-
cinic, acetic and oxamic, which were the main components of long-time electrolysis. Their persistence
explains the low mineralization of AO7 in SPEC. The initial N of the azo dye was mineralized as NH4+ ion,
in larger proportion than NO3− ion, although it was mainly loss as volatile species.
© 2012 Elsevier B.V. All rights reserved.
1. Introduction
Azo dyes are widely used in textile and food industries in
Mt quantity and represent about 70% of the world dye produc-
tion. These colored compounds contain one or more azo bonds
( N N ) as chromophore group linked to aromatic structures
with functional groups such as OH and SO3H, among others
[1,2]. The dyeing process of textile industries produces large vol-
umes of wastewater effluents with high dye contents, which are
discharged into water bodies such as lakes and rivers. Azo dyes
are very stable in the aquatic environment and usually persist
under ambient conditions because they are difficultly removed
in conventional wastewater treatment plants due to their high
stability under sunlight and high resistance to biodegradation
in aerobic conditions [3]. This contamination is dangerous not
∗ Corresponding author. Tel.: +34 934021223; fax: +34 934021231.
E-mail address: [email protected] (E. Brillas).
only by the esthetic problems caused in waters, but also by
the potential health and environmental risks due to the toxic,
carcinogenic and mutagenic properties of azo dyes and their
by-products [4–6]. To avoid their environmental problems and
hazardous effects on living beings, physicochemical treatments
like coagulation [7], adsorption [8] or filtration by selective
membranes [9], as well as some biotreatments [10], have been
applied to decolorize dyeing wastewaters. However, faster and
even total decolorization of these effluents can be obtained
using advanced oxidation processes (AOPs) [1,2,11]. AOPs are
chemical, photochemical, photocatalytic and electrochemical tech-
niques based on the in situ production of hydroxyl radical (•OH)
as strong non-selective oxidant of organic pollutants in waters
[2,12–14].
In recent years, TiO2 photocatalysis (PC) has been widely used
for the removal of organics, including several dyes, in waters
[2,15–25]. This AOP involves the irradiation of TiO2 nanoparticles,
mainly crystallized in the anatase form, in colloidal suspension or
deposited as a thin film on Ti by UV photons of sufficient energy
0926-3373/$ – see front matter © 2012 Elsevier B.V. All rights reserved.http://dx.doi.org/10.1016/j.apcatb.2012.11.037
141

S. Garcia-Segura et al. / Applied Catalysis B: Environmental 132– 133 (2013) 142– 150 143
(� < 380 nm) to promote an electron from the filled valence band
to the empty conduction band (ecb−) with an energy gap of 3.2 eV
generating a positively charged vacancy or hole (hvb+) as follows
[2,18,19]:
TiO2 + h� → ecb− + hvb
+ (1)
Organics can then be either reduced by the generated electron
or oxidized by the hole as well as by heterogeneous •OH formed
between the photogenerated vacancy and adsorbed water or OH−:
hvb+ + H2O → •OH + H+ (2)
hvb+ + OH− → •OH (3)
In addition, other weaker reactive oxygen species (ROS) like
superoxide radical ion (O2•−), hydroperoxyl radical (HO2
•) and
H2O2, as well as more •OH, can be produced from the photoinjected
electron by the following reactions [2,19]:
ecb− + O2 → O2
•− (4)
O2•− + H+ → HO2
• (5)
2HO2• → H2O2 + O2 (6)
ecb− + H2O2 → •OH + OH− (7)
H2O2 + O2•− → •OH + OH− + O2 (8)
When sunlight is used as energy source, the procedure is so-
called solar PC (SPC) [17,23,25]. The major loss of efficiency in
PC or SPC is due to the recombination of electrons promoted to
the valence band either with unreacted holes or with adsorbed
hydroxyl radicals [2,12]:
ecb− + hvb
+ → TiO2 + heat (9)
ecb− + •OH → OH− (10)
Heterogeneous PC, where the TiO2 photocatalyst is immobilized
onto a solid support matrix mainly by sol-gel, thermal treatment,
chemical vapor deposition, electrodeposition and anodization
methods, causes a loss of specific area available for photoreaction
(1) and the enhancement of the electron-hole pair recombination
by reaction (9) that consumes the reductive and oxidant species
to destroy organics [22]. However, the efficiency of immobilized
TiO2 can be strongly improved when it acts as photoanode in a
photoelectrochemical system leading to the so-called photoelec-
trocatalysis (PEC) process under UV irradiation or solar PEC (SPEC)
process under sunlight illumination [2,26–36]. These electrochemi-
cal AOPs (EAOPs) consists of the application of either a constant bias
anodic potential or a low constant anodic current density (janod) to
the TiO2 photoanode subjected to illumination in order to continu-
ously extract the photoinduced electrons by an external electrical
circuit. This causes the inhibition of reactions (4)–(10) favoring the
production of higher amounts of holes from reaction (1) and het-
erogeneous •OH from reaction (2) or (3), thereby largely enhancing
organics oxidation compared to PC or SPC. In PEC or SPEC, the rutile
form of TiO2 immobilized onto a conductive substrate also shows
significant photocatalytic oxidative efficiency, although lower than
that of the anatase form [26,28,35].
In this paper, we report the synthesis of a novel TiO2 pho-
toanode from the deposition of a TiO2 coating on a stainless steel
substrate using the atmospheric plasma spray (APS) technology
[37–39]. This photoanode presented excellent mechanical proper-
ties and long durability to the pass of relatively high janod values in
SPEC. Its oxidation ability on azo dyes was tested in a photoelec-
trochemical reactor under direct solar irradiation by studying the
decolorization and degradation of Acid Orange 7 (AO7 or Orange II,
see formula and characteristics in Table 1) as representative model
compound, since it is non-biodegradable and commonly used in Tab
le
1C
hem
ical
stru
ctu
re
an
d
chara
cteri
stic
s
of
Aci
d
Ora
ng
e
7
azo
dy
e.
Ch
em
ical
stru
ctu
re
Ch
em
ical
form
ula
Co
lor
ind
ex
nam
e
Ch
em
ical
nam
e
Co
lor
ind
ex
nu
mb
er
�m
ax/n
m
M/g
mo
l−1
NN
OH
SO3-
Na+
NaC
16H
10N
2O
4S
Aci
d
Ora
ng
e
7
(AO
7)
So
diu
m
4-[
(2E
)-2
-(2
-ox
on
ap
hth
ale
n-1
-yli
den
e)h
yd
razin
yl]
ben
zen
esu
lfo
nate
15
51
0
48
4
35
0.3
2
142

144 S. Garcia-Segura et al. / Applied Catalysis B: Environmental 132– 133 (2013) 142– 150
textile industries. The degradation of AO7 by PC [15] and SPC [16]
with TiO2 in suspension, as well as by PEC with UVA light and
SPEC with TiO2 deposited on transparent conducting substrates
[31], has been reported. Note that azo dyes can be reduced at the
cathode of an electrochemical and photoelectrochemical system,
depending on the nature of the cathodic material [2]. For this rea-
son and to avoid the possible competitive cathodic reduction of AO7
and its intermediates, a carbon-polytetrafluoroethylene (PTFE) air-
diffusion cathode was chosen in the present work since it inhibits
organic reduction because efficiently generates H2O2 from injected
O2 as follows [40–43]:
O2 + 2H+ + 2e− → H2O2 (11)
The comparative decolorization efficiency for AO7 solutions
using SPC, electrochemical oxidation or anodic oxidation with gen-
erated H2O2 (AO-H2O2) and SPEC was examined. The best operating
variables like pH, dye content and applied janod for the decoloriza-
tion process in SPEC were determined. The decay kinetics for AO7
and the evolution of generated carboxylic acids and released inor-
ganic nitrogen ions were followed by chromatographic techniques.
2. Experimental
2.1. Chemicals
Pure AO7 azo dye was purchased from Acros Organics and used
as received. Phthalic, tartaric, succinic, oxamic and acetic acids were
of analytical grade from Panreac and Avocado. Anhydrous sodium
sulphate used as background electrolyte was of analytical grade
from Fluka. Synthetic dye solutions were prepared with high-purity
water obtained from a Millipore Milli-Q system with resistivity
>18 M� cm at 25 ◦C and their pH was adjusted with either ana-
lytical grade sulphuric acid or analytical sodium hydroxide, both
supplied by Merck. Organic solvents and other chemicals employed
were of either HPLC or analytical grade from Merck, Fluka and
Sigma-Aldrich.
2.2. Preparation of TiO2 coating onto stainless steel by APS
TiO2 powder supplied by Sulzer Metco was used as feedstock
to synthesize the final coating onto stainless steel by APS tech-
nology using an F4 plasma torch with a Sultzer Metco A-3000S
system. APS consists of heating up, mixing and homogenization
of the feedstock powder particles during their short residence
time in the hot zone of the plasma jet. The molten droplets
are then accelerated and quenched onto the substrate to pro-
duce the coating layer by layer [37–39]. A flat 316L stainless
steel (50 mm x 30 mm × 5 mm) was used as substrate, which
was previously degreased with acetone and grit blasted with
white corundum at 5.6 bar and 45◦ using a blasting distance of
250 mm. The grit blasted substrate had a mean roughness (Ra)
of about 5 �m. The spraying parameters for the TiO2 coating
were taken within the following intervals: argon flow plasma
(20–40 L min−1), hydrogen flow plasma (10–15 L min−1), applied
current (550–650 A), spray distance (80–160 mm) and feed rate
(10–30 g min−1).
2.3. SPC, AO-H2O2 and SPEC systems
Fig. 1 illustrates a sketch of the set-up used for the SPEC degrada-
tion of 100 mL of AO7 solutions. The photoelectrochemical reactor
was an undivided, open and cylindrical cell with a double jacket
in which external water circulated to maintain the solution tem-
perature at 35 ◦C using a Thermo Electron Corporation HAAKE
DC 10 thermostat. This temperature was chosen because it is the
Fig. 1. Sketch of the experimental set-up used for the degradation of 100 mL of Acid
Orange 7 (AO7) solutions by solar photoelectrocatalysis (SPEC). The photoelectro-
chemical reactor contained a TiO2 photoanode of 5 cm2 area, which was prepared
by TiO2 deposition on a stainless steel substrate by atmospheric plasma spray tech-
nology. The air-diffusion cathode of 3 cm2 area supplied continuously H2O2 to the
dye solution from O2 reduction. The solution was thermostated at 35 ◦C.
maximum value allowed in the reactor with insignificant water
evaporation during prolonged treatment. The photoanode was the
above-synthesized TiO2 electrode with 5 cm2 area, whereas the
cathode was a 3 cm2 carbon-PTFE air-diffusion electrode supplied
by E-TEK and mounted as described elsewhere [44]. This cath-
ode was fed with air pumped at 300 mL min−1 to generate H2O2
from reaction (11) and the interelectrode gap was about 1 cm. The
electrochemical assays were performed at constant janod provided
with an Amel 2053 potentiostat-galvanostat. The same system was
used for the experiments of AO-H2O2 in the dark and SPC with-
out pass of current. Prior to the electrolytic trials, the air-diffusion
cathode was activated by polarization in 0.05 M Na2SO4 using the
same reactor with a 3 cm2 Pt anode at janod = 100 mA cm−2 for
60 min. All experiments were carried out under vigorous stirring
with a magnetic bar at 800 rpm to ensure homogenization and the
transport of reactants towards/from the TiO2 electrode or photo-
catalyst.
In the SPC and SPEC trials, the immersed TiO2 photocatalyst was
tilted 41◦ from the solution surface to better collect the direct sun
rays in our laboratory of Barcelona (latitude: 41◦ 21′N, longitude:
2◦ 10′E). Solar assays were made for 300 min as maximal in sunny
and clear days during the summer of 2011, with similar average
UV irradiation intensities between 300 and 400 nm of 30.3 and
31.2 W m−2, as measured with a Kipp & Zonen CUV 5 radiometer.
All SPC, AO-H2O2 and SPEC experiments were made with solu-
tions containing 0.05 M Na2SO4 as background electrolyte. This
environmentally friendly medium was chosen because it is usually
employed in electrochemical systems to clarify the oxidation role
of generated •OH radicals [2]. The best conditions for AO7 decol-
orization in SPEC were found by studying the effect of pH between
3.0 and 11.0, azo dye concentration up to 45 mg L−1 and janod up to
2.0 mA cm−2.
143

S. Garcia-Segura et al. / Applied Catalysis B: Environmental 132– 133 (2013) 142– 150 145
2.4. Apparatus and analytical procedures
The particle size distribution of the feedstock TiO2 powder was
measured by laser scattering using a Beckman Coulter LS equip-
ment. Scanning electron microscopy (SEM) images of the initial
and deposited TiO2 were obtained using a Jeol 5510 system, which
was coupled with an energy dispersive X-ray spectrometry (EDS)
phase analyzer from Röntec. More accurate phase analysis of the
starting powder and coating was performed by X-ray diffractom-
etry (XRD) using a Siemens D500 system type Bragg-Brentano
�/2� by applying a Cu K�1+2 radiation (�(˛1) = 0.154060 nm
and �(˛2) = 0.154443 nm) at 40 kV and 30 mA current. The ratio
between the obtained crystalline phases was calculated from their
reference intensity ratio (RIR) by the Chung’s method [45] and
applying the X’pert HighScore Plus software. The porosity of the
coating was measured with a Matrox Inspector software image ana-
lyzer. Its microroughness was determined with a Mitutoyo Surftest
301 equipment and its adhesion was measured with a Servosis
MCH-102ME system through the ASTM C633 standard. Cross-
sectional microhardness measurements were performed with a
Matsuzawa MXT-� system by Vickers indentation at 300 g load
using the UNE 7-423/2 standard. Indentations were determined
with a Leica DMI 5000 M optical microscope to increase their accu-
racy.
The pH of AO7 solutions was measured with a Crison GLP 22
pH-meter. Before analysis, the aliquots were filtered with 0.45 �m
PTFE filters from Whatman. The decolorization process of azo dye
solutions in SPC, AO-H2O2 and SPEC was monitored from the decay
of the absorbance (A) at the maximum wavelength (�max = 484 nm)
of AO7 (see Table 1), measured on the spectra recorded with a Shi-
madzu 1800 UV–vis spectrophotometer at 35 ◦C. The percentage of
color removal or decolorization efficiency was then calculated from
the following equation [42,43]:
%Color removal = A0 − At
A0100 (12)
where A0 and A are the absorbance at initial time and time t at the
�max of the azo dye, respectively.
The concentration of accumulated H2O2 was determined from
the light absorption of its Ti(IV) colored complex at � = 409 nm
[46] using the above spectrophotometer thermostated at 35 ◦C.
The mineralization of azo dye solutions was determined from the
abatement of their TOC, measured on a Shimadzu VCSN analyzer.
Reproducible TOC values with an accuracy of ±1% were obtained
by injecting 50 �L aliquots to the analyzer. Total nitrogen (TN) was
determined with a Shimadzu TNM-1 unit coupled to the above TOC
analyzer.
The decay of AO7 concentration in SPEC was followed by
reversed-phase HPLC using a Waters 600 LC fitted with a Spherisorb
ODS2 5 �m (150 mm x 4.6 mm) column at 35 ◦C and coupled to
a Waters 996 photodiode array detector selected at the �max of
the azo dye. Generated carboxylic acids in SPEC were detected
by ion-exclusion HPLC using the above LC fitted with a Bio-Rad
Aminex HPX 87H (300 mm × 7.8 mm) column at 35 ◦C and the
photodiode array detector set at � = 210 nm. For these measure-
ments, 20 �L aliquots were injected into the LC and the mobile
phase was either a 30:70 (v/v) acetonitrile/water mixture with
2.4 mM n-butylamine at 0.6 mL min−1 for reversed-phase HPLC or
4 mM H2SO4 at 0.6 mL min−1 for ion-exclusion HPLC. The inor-
ganic nitrogen ions released in SPEC treatment were quantified
by ionic chromatography with a Shimadzu 10 Avp HPLC cou-
pled with a Shimadzu CDD 10 Avp conductivity detector. The
NH4+ concentration was determined with a Shodex IC YK-421
(125 mm × 4.6 mm) cation column at 40 ◦C under circulation of
a 5.0 mM tartaric acid, 1.0 mM dipicolinic acid, 24.2 mM boric
acid and 1.5 mM crown ether solution at 1.0 mL min−1 as mobile
0
1000
2000
3000
4000
5000
6000
Inte
nsity
/ a.
u.
(110
)
(101
)(2
00)
(111
)(2
10)
(211
)(2
20)
(002
)(3
10)
(221
)(3
01)
(112
)(3
11)
(320
)(2
02)
Rutile
0
200
400
600
800
1000
10 20 30 40 50 60 70 802θ / degree
(101
)
(200
)
(211
)
AnataseRutileTi
7O
13
(101
)(1
-21)
(-125
)(2
0 1
2)
(020
)
(-130
)
(1-4
1)(1
4 1
3)
(110
)
(101
)
(111
)
(211
)(2
20)
(002
)
(301
)(1
12)
a
b
Fig. 2. X-ray diffractograms of (a) the semiconductor TiO2 powder composed of
100% rutile and (b) the prepared TiO2 photoanode by atmospheric plasma spray
technology composed of 29% rutile, 9% anatase and 62% of non-stoichiometric phase
of Ti7O13. The corresponding crystallographic planes for each phase are assigned.
phase. The NO3− content was obtained with a Shim-Pack IC-A1S
(100 mm × 4.6 mm) anion column at 40 ◦C using a mobile phase
of 2.4 mM tris(hydroxymethyl)aminomethane and 2.5 mM phthalic
acid of pH 4.0 at 1.5 mL min−1.
3. Results and discussion
3.1. Characterization of the TiO2 coating prepared by APS
Figs. 2 and 3 depict the X-ray diffractograms and SEM images
obtained for both, the TiO2 feedstock powder and the resulting
coating by APS, respectively. As can be seen in Fig. 2a, the starting
powder prepared by a sintering and crushing process was only com-
posed of rutile phase [47]. The SEM image of Fig. 3a shows that the
free-surface of the initial powder exhibited an irregular blocky mor-
phology only composed of TiO2 microparticles, also corroborated
by its EDS analysis. The particle size distribution of this powder
measured by laser scattering ranged between 20 and 50 �m, with
a mean particle size of 32 �m.
Fig. 2b shows the XRD pattern for the TiO2 coating on stainless
steel. Crystallographic planes related to the rutile [47] and anatase
[48] forms, along with those ascribed to a non-stoichiometric
Ti7O13 [49], are also given in Fig. 2b to show that a part of the
initial rutile is conserved, but another part of it is transformed
into anatase and Ti7O13 under APS deposition. Moreover, the peaks
for the TiO2 coating were wider than those of pure compounds
due to formation of the non-stoichiometric phase and a grain
size reduction, as typically found for coatings obtained by APS.
Analysis of the crystallographic phases revealed that the 100%
rutile-TiO2 phase powder was converted after the APS process
into a coating containing 29% of rutile, 9% of anatase and 62%
144

146 S. Garcia-Segura et al. / Applied Catalysis B: Environmental 132– 133 (2013) 142– 150
Fig. 3. Scanning electron microscopy (SEM) images of (a) the free-surface
micrograph of the initial TiO2 powder, (b) the free-surface micrograph of the
microparticulated TiO2 coating prepared by atmospheric plasma spray and (c) the
cross section of the TiO2 coating on stainless steel substrate.
of Ti7O13. An anatase-to-rutile ratio of 0.31 was then formed at
the coating. The SEM image of Fig. 3b of its free surface also
confirms that some microparticles were fully melted during the
APS process. The excellent deposition obtained by this technique
can be observed in the SEM cross-section of Fig. 3c, showing a
homogeneous microstructure with a thickness of 211 ± 21 �m.
It was found that its porosity was of 4.0 ± 1.7%, with a micror-
oughness of 8.1 ± 1.5 �m. Moreover, the adhesion of the coating
was 39.8 ± 3.8 MPa and its HVN microhardness was 842 ± 28. The
coating failed by the substrate interface after the C633 adhesion
test.
The TiO2 coating on stainless steel synthesized by APS then
presented excellent mechanical properties and also showed large
stability and long durability to the current pass. Thus, using the
SPEC system of Fig. 1 with 100 mL of 0.05 M Na2SO4 as background
0
20
40
60
80
100
0 60 120 180 240 300 360time / min
% C
olor
rem
oval
Fig. 4. Variation of percentage of color removal with time for the treatment of
100 mL of a 15 mg L−1 AO7 solution in 0.05 M Na2SO4 at pH 7.0 and 35 ◦C. (�) Solar
photocatalysis (SPC) with the synthesized TiO2 coating, (�) anodic oxidation with
generated H2O2 (AO-H2O2) using the TiO2/air-diffusion cell at anodic current den-
sity (janod) of 1.0 mA cm−2 in the dark and (©) SPEC under the same conditions but
exposing the photoelectrochemical cell directly to sunlight.
electrolyte, no change in the characteristics of the TiO2 photoanode
was found operating up to janod = 2.0 mA cm−2, where a bias anodic
potential of about 1.75 V vs SCE was attained. This anodic current
density was chosen as maximal for the AO-H2O2 and SPEC trials
performed with this electrode. All experiments reported below
were comparatively made with the same TiO2 deposit.
3.2. Comparative color removal of AO7 solutions by SPC,
AO-H2O2 and SPEC
The comparative oxidation ability of SPC, AO-H2O2 and SPEC on
AO7 solutions was clarified from their corresponding decoloriza-
tion efficiencies, which are typically used to check the effectiveness
of an azo dye treatment. Fig. 4 illustrates the color removal obtained
for 15 mg L−1 AO7 in 0.05 M Na2SO4 of pH 7.0 under the applica-
tion of these processes using the synthesized TiO2 photocatalyst.
For AO-H2O2 and SPEC, a janod = 1.0 mA cm−2 (bias anodic potential
of about 1.35 V vs SCE) was applied. In all these trials, the solution
pH remained practically unchanged.
As can be seen in Fig. 4, the slowest decolorization took place in
SPC, where only 21% color removal was achieved in 300 min. The
low effectiveness of this procedure can be associated with the fast
recombination of the photogenerated oxidizing holes and reducing
electrons by reaction (9), then being largely inhibited the reaction
of holes with water to form •OH from reaction (2), which is the
main oxidant of organics at neutral pH [17,19]. Fig. 4 shows that
AO-H2O2 in the dark decolorized more quickly the azo dye solution,
leading to 46% color removal in 300 min. The destruction of AO7 in
this method can be ascribed to the action of heterogeneous •OH
generated at the TiO2 anode surface as intermediate of the anodic
oxidation of water to O2 by the following reaction [2,50]:
H2O → •OH + H+ + e− (13)
The slow decolorization found in AO-H2O2 can then be
accounted by the expected small production of reactive •OH on TiO2
anode from reaction (13), which is pH independent [50]. In contrast,
Fig. 4 evidences that the AO7 solution was very quickly discolored,
with total color removal in about 120 min, using SPEC. This behav-
ior indicates that the application of a current allows a very effective
separation of the electron-hole pair formed from reaction (1) on
the TiO2 photoanode subjected to sunlight illumination, being the
electrons driven to the cathode and strongly enhancing the reaction
(2) between holes and water to produce large quantities of oxidant
145

S. Garcia-Segura et al. / Applied Catalysis B: Environmental 132– 133 (2013) 142– 150 147
•OH that destroy AO7 and its by-products [35]. Results of Fig. 4 con-
firm that the SPEC process is synergistic, but not cumulative of the
individual processes, because when total color removal is attained
at 120 min of SPEC, only 45% decolorization efficiency is achieved
from the sum of both SPC and AO-H2O2 treatments.
Note that H2O2 formed at the cathode from reaction (11) was
accumulated in large extent in the solution during the AO-H2O2 and
SPEC trials. A blank experiment was performed by adding 10 mM
H2O2 to 100 mL of 15 mg L−1 AO7 in 0.05 M Na2SO4 adjusted to pH
7.0, but no significant decolorization of this solution was found after
60 min of solar illumination, indicating that H2O2 does not oxidize
the azo dye. After 180 min of SPEC at janod = 1.0 mA cm−2, 1.66 mM
of H2O2 were detected in solution, a value lower than 2.76 mM
expected from reaction (11) assuming 100% current efficiency for
H2O2 production. This decay in accumulated H2O2 may be related
to its slow reaction with photogenerated electrons from reaction
(7), but it can be more probably due to its oxidation to O2 at the
TiO2 photoanode giving rise to the weaker oxidant HO2• as follows
[2]:
H2O2 → HO2• + H+ + e− (14)
Reaction (14) is also expected in AO-H2O2, but the low decol-
orization rate found for this process (see Fig. 4) suggests a small
participation of HO2• in azo dye removal.
The above results indicate that the SPEC process with the TiO2
photoanode synthesized by APS is very effective for AO7 decoloriza-
tion. The influence of variables like pH, azo dye concentration and
janod on this EAOP was then examined to clarify the best experimen-
tal decolorization conditions, as will be discussed in subsections
below.
3.3. Effect of pH on the AO7 decolorization in SPEC process
The change of percentage of color removal with electrolysis time
for 15 mg L−1 AO7 solutions in the pH range 3.0–11.0 by using SPEC
at janod = 1.0 mA cm−2 for 180 min as maximal is depicted in Fig. 5a.
In these trials, no significant change of solution pH with electrol-
ysis time was detected. As can be seen, complete decolorization
was only feasible after 120 min of electrolysis at neutral pH 7.0,
which is the optimum pH for this treatment. A similar color removal
rate to pH 7.0 was also determined during the first 60 min at pH
9.0, reaching 96% decolorization, but prolonging the electrolysis
the absorbance at � = 484 nm rose gradually decreasing the color
decay to 68% at 180 min. The same behavior, with maximum color
removal of 80% and 40% at 60 min, was also found for pH 5.0 and
11.0, respectively. A different trend can be observed in Fig. 5a for
pH 3.0, where the solution was progressively decolorized, but only
attaining 65% color removal in 180 min.
The complex effect of pH shown in Fig. 5a is difficult to justify
from the change in the electrostatic interactions between the azo
dye and the amphoteric TiO2 surface [19,21], because the former
is always charged negatively due to its sulfonic group while the
TiO2 photocatalyst is always subjected to a positive charge in SPEC.
The variation of AO7 decolorization with pH can be rather related
to the change of the oxidation ability of the photogenerated holes
[19] and the different products formed from azo dye degradation.
Thus, the removal of AO7 followed by the progressive formation
of products that present a high residual absorbance at 484 nm can
explain the volcano shape of the decolorization curves at pH 5.0,
9.0 and 11.0 shown in Fig. 5a, as can be deduced from the UV-Vis
spectra recorded for the final treated solutions and presented in
Fig. 5b.
In aqueous solution, AO7 presents two tautomeric forms in equi-
librium, the azo form (see Table 1) and the hydrazone one, where
the hydroxyl group appears as carbonyl group being its hydro-
gen linked to the azo group [16]. The hydrazone form is the major
0.0
0.5
1.0
1.5
2.0
2.5
200 250 300 350 400 450 500 550 600
Abs
orba
nce
λ / nm
0
20
40
60
80
100
0 30 60 90 120 150 180 210time / min
% C
olor
rem
oval
b
a
Fig. 5. (a) Effect of pH on the change of percentage of color removal with time for
the SPEC treatment of 100 mL of solutions containing 15 mg L−1 of AO7 in 0.05 M
Na2SO4 at janod = 1.0 mA cm−2 and 35 ◦C. Solution pH: (♦) 3.0, (�) 5.0, (©) 7.0, (�) 9.0
and (�) 11.0. (b) UV–vis spectra of the initial solution (in black) at pH 7.0 and the
above final treated solutions after further adjustment to pH 7.0.
species giving a strong visible band with �max = 484 nm (character-
istic of AO7), whereas the azo form yields a much weaker shoulder
near 430 nm. These bands can be observed in the UV–vis spectrum
of the initial 15 mg L−1 AO7 solution of pH 7.0 depicted in Fig. 5b,
along with two other bands in the ultraviolet region centred at 230
and 305 nm due to the benzene and naphthalene groups of AO7,
respectively [16]. The same four bands with analogous intensity
were detected for all initials solutions in the pH range 3.0–11.0,
indicating the presence of the two forms of AO7 in all them and
in similar proportion. During the SPEC treatment, the bands of the
two forms of AO7 were always reduced at similar rate up to disap-
pear, except for pH 3.0 where they still persisted at 180 min (see
Fig. 5b). The slower oxidation of AO7 found at pH 3.0 suggests that in
this medium, organics are predominantly destroyed by photogen-
erated holes from reaction (1), which are weaker oxidizing agents
than •OH [19]. In contrast, at higher pH the holes produce large
amounts of •OH, from reaction (2) at pH 5.0 and 7.0 and/or from
reaction (3) at pH 9.0 and 11.0, removing much more rapidly AO7,
but giving different products depending on pH as a result of its non-
selective attack on organics. Thus, Fig. 5b shows a strong band at
300 nm, related to naphthalenic derivatives, in the final solution
of pH 7.0, without any absorbance for � > 400 nm. A similar strong
band can be observed for pH 9.0, but with residual absorbance in
the visible region probably due to the formation of low amounts
of colored aromatic intermediates, thus avoiding the total decol-
orization of solution. A significant absorbance in the visible region
was also found at pH 5.0 and 11.0, although in the latter medium
146

148 S. Garcia-Segura et al. / Applied Catalysis B: Environmental 132– 133 (2013) 142– 150
0
20
40
60
80
100
0 30 60 90 120 150 180 210time / min
% C
olor
rem
oval
Fig. 6. Influence of dye concentration on the decolorization rate for 100 mL of AO7
solutions in 0.05 M Na2SO4 at pH 7.0 by SPEC at janod = 1.0 mA cm−2 and 35 ◦C. Dye
concentration: (�) 5 mg L−1, (©) 15 mg L−1, (♦) 30 mg L−1 and (�) 45 mg L−1.
two other bands at 263 and 365 nm due to the formation of other
products were detected. The progressive increase of the residual
absorbance at 484 nm after 60 min of SPEC at pH 5.0, 9.0 and 11.0
explains the volcano shape with gradual decay in color removal
shown in Fig. 5a.
3.4. Influence of azo dye concentration on its decolorization in
SPEC process
The effect of initial AO7 concentration on color removal in
SPEC was tested at the optimum neutral pH 7.0 and apply-
ing 1.0 mA cm−2. Under these conditions, a maximum content of
45 mg L−1 was studied because of the limited oxidation ability of
this method for higher azo dye concentrations. The decolorization
efficiency-time plots thus obtained are presented in Fig. 6. A similar
decay of the percentage of color removal for 5 and 15 mg L−1 of the
azo dye can be observed giving rise to total decolorization in about
120 min. However, further increase of AO7 concentration resulted
in a gradual loss in color removal, reaching 82% and only 25%
decolorization after 180 min of electrolysis for 30 and 45 mg L−1.
Under these conditions, the disappearance of the strong band at
�max = 484 nm of the azo dye became progressively slower and a
more rapid raise of the residual absorbance in the visible region
due to colored intermediates was detected. This behavior can be
mainly associated with the increasing consumption of generated•OH to oxidize the greater amounts of organics formed on the TiO2
photoanode surface, thereby decreasing the amount of this radical
to attack the azo dye [33,34]. Moreover, the transparency of the
solution decreases at greater AO7 concentration because UV irra-
diation of sunlight is more strongly absorbed by the azo dye and its
aromatic products yielding lower photogeneration of holes with
the consequent loss of •OH production that decreases the oxida-
tion ability of SPEC [27]. Results of Fig. 6 evidence that SPEC is able
to completely decolorize solutions of pH 7.0 containing low AO7
contents up to 15 mg L−1, which can be taken as the best concen-
tration for this treatment.
3.5. Effect of anodic current density on decolorization and decay
kinetics of AO7 in SPEC process
The applied janod is a key parameter in SPEC because it limits
the separation of photogenerated holes and electrons and hence,
the oxidation action of the former on the organic matter. The
influence of this variable on AO7 decolorization was checked for a
solution containing the best content of 15 mg L−1 of azo dye at the
0
20
40
60
80
100
0 30 60 90 120 150 180 210
% C
olor
rem
oval
0
3
6
9
12
15
0 20 40 60 80 100 120 140 160[A
O7]
/ m
g L-1
0
1
2
3
0 10 20 30 40 50 60 70
ln (C
0/ C )
time / min
a
b
c
Fig. 7. Effect of anodic current density on (a) the percentage of color removal and (b)
the dye concentration decay determined by reversed-phase HPLC with time for the
treatment of 100 mL of a 15 mg L−1 AO7 solution in 0.05 M Na2SO4 at pH 7.0 and 35 ◦C.
(�) SPC and SPEC at janod: (�) 0.25 mA cm−2, (♦) 0.50 mA cm−2, (©) 1.0 mA cm−2 and
(�) 2.0 mA cm−2. In plot (c), kinetic analysis of data given in plot (b) assuming that
AO7 verifies a pseudo-first-order reaction.
optimum pH 7.0. Fig. 7a shows that a janod as low as 0.25 mA cm−2
already enhanced strongly the decolorization efficiency of the
solution compared with that of the SPC process, as expected if the
transport of photoelectrons to the cathode allows the fast gener-
ation of oxidant •OH from holes by reaction (2) [33–35]. Fig. 7a
also evidences that the increase in janod from 0.25 to 1.0 mA cm−2
caused a quicker color removal owing to a faster electron-hole
separation at the TiO2 photoanode, as well as a faster oxidation
of water from reaction (13), giving rise to higher •OH production,
which is able to completely decolorize the solution after 120 min
of electrolysis at 1.0 mA cm−2. For 2.0 mA cm−2, however, a decay
in color removal can be observed after 50 min of SPEC treatment
when 90% decolorization was already reached. This is due to the
existence of an increasing residual absorbance in the visible region
of the UV-vis spectrum of the solution, suggesting that the gen-
eration of an excess of oxidant •OH with a higher decrease of the
local pH in the vicinity of the TiO2 electrode at 2.0 mA cm−2 favors
147

S. Garcia-Segura et al. / Applied Catalysis B: Environmental 132– 133 (2013) 142– 150 149
the formation of colored aromatic intermediates. Unfortunately,
these compounds could not be identified by reversed-phase HPLC.
Consequently, 1.0 mA cm−2 is the best janod needed to decolorize
the optimized AO7 solution in SPEC.
The decay kinetics for AO7 in the above trials was followed by
reversed-phase HPLC, where it displayed a well-defined peak with
retention time (tr) of 7.6 min. Fig. 7b shows that while the azo dye
was very slowly removed by SPC, it was quickly destroyed by SPEC,
much more rapidly with increasing janod from 0.25 to 2.0 mA cm−2.
Thus, AO7 was only reduced by 36% after 150 min of SPC, but
disappeared in decreasing times of 150, 120, 100 and 80 min for
increasing current densities of 0.25, 0.50, 1.0 and 2.0 mA cm−2.
This trend agrees with the expected larger production of oxidizing
species (mainly •OH) when janod rises due to the faster separation
of photogenerated holes and electrons on the TiO2 photoanode and
the quicker anodic oxidation of water. Comparison of Figs. 7a and 7b
evidences that the decolorization process in SPEC is always slower
than AO7 decay, as expected if colored aromatic intermediates that
absorb at � = 484 nm are formed during its degradation.
The concentration decays of Fig. 7b were analyzed using
kinetic equations related to simple reaction orders and excel-
lent linear correlations were only found for a pseudo-first-order
reaction, as illustrated in Fig. 7c. From this analysis, increas-
ing pseudo rate constants (kSPEC) of 3.1 × 10⁻⁴ s−1 (R2 = 0.993)
at 0.25 mA cm−2, 4.5 × 10⁻⁴ s−1 (R2 = 0.997) at 0.50 mA cm−2,
7.4 × 10⁻⁴ s−1 (R2 = 0.993) at 1.0 mA cm−2 and 1.0 × 10⁻³ s−1
(R2 = 0.992) at 2.0 mA cm−2 were determined for the SPEC pro-
cess, which were, as expected, much greater than the pseudo
rate constant (kSPC) of 5.8 × 10⁻⁵ s−1 (R2 = 0.982) obtained for SPC.
This behavior suggests a constant production of oxidizing agents
(mainly photogenerated holes and •OH) in both SPC and SPEC treat-
ments. Taking into account the above kSPEC and kSPC values, the
extent of the electrochemical enhancement (E, in %) was estimated
from the following expression [33]:
E = kSPEC − kSPC
kSPEC100 (15)
Very high values for E were thus obtained, which increased gradu-
ally in 81%, 87%, 92% and 94% with increasing janod values of 0.25,
0.50, 1.0 and 2.0 mA cm−2. This confirms the relevant role of janod
in SPEC to accelerate the production of oxidants.
3.6. AO7 mineralization and identification and evolution of
generated carboxylic acid and released inorganic nitrogen ions
The 15 mg L−1 azo dye solution in 0.05 M Na2SO4 of pH 7.0 was
slowly mineralized in the TiO2/air-diffusion photoelectrochemical
cell under SPEC at janod = 1.0 mA cm−2. In these optimized condi-
tions, the initial TOC of 8.22 mg L−1 was only reduced to 4.93 mg L−1
in 240 min, corresponding to 40% of mineralization. That means
that although AO7 is completely removed in 100 min (see Fig. 7b),
it forms more recalcitrant by-products that react very hardly with•OH. It is expected the formation of the same kind of by-products
by SPEC and SPC because the same oxidizing agents act in both sys-
tem. However, the larger production of photogenerated holes and•OH in the former treatment accelerates strongly the destruction of
intermediates affecting their distribution in relation to the second
one.
Ion-exclusion chromatograms of the above treated solu-
tion displayed well-defined peaks ascribed to carboxylic acids
such as tartaric (tr = 8.51 min), oxamic (tr = 9.41 min), succinic
(tr = 11.7 min), acetic (tr = 14.9 min) and phthalic acid (tr = 27.7 min).
Tartaric, succinic and acetic acids can be formed from the cleav-
age of the benzene ring of aromatic intermediates [2,50], whereas
oxamic acid is expected to be produced from the degradation
of N-derivatives. Phthalic acid is an aromatic dicarboxylic acid
0
1
2
3
4
5
6
0 30 60 90 12 0 15 0 18 0 21 0 24 0 27 0
[Car
boxy
lic a
cid]
/ m
g L-1
time / min
Fig. 8. Time-course of the concentration of: (©) phthalic, (�) tartaric, (�) succinic,
(♦) acetic and (�) oxamic acids detected during the SPEC degradation of 100 mL of a
15 mg L−1 AO7 solution in 0.05 M Na2SO4 at pH 7.0 and janod = 1.0 mA cm−2 and 35 ◦C.
coming from the oxidation of the naphthalene moiety. Note that
this latter by-product and succinic acid have also been detected in
the degradation of AO7 by SPC with TiO2 in suspension [16].
Fig. 8 highlights that most carboxylic acids, except oxamic
acid, were formed from the beginning of the SPEC treatment and
attained their maximum content at about 120 min of electrolysis.
At longer times up to 240 min, tartaric acid decayed from 5.63 to
2.90 mg L−1 and phthalic acid dropped from 4.89 to 2.56 mg L−1,
whereas succinic and acetic acids remained with contents practi-
cally constants near 3.70 and 0.84 mg L−1, respectively. In contrast,
oxamic acid only reached 0.11 mg L−1 at the end of SPEC, being
detected for times > 120 min. A simple mass balance of carboxylic
acids accumulated at 240 min revealed that they account for by
4.23 mg L−1 TOC, i.e. 86% of the TOC contained in the remaining
solution (4.93 mg L−1). This indicates that the detected carboxylic
acids are the main components of the final treated solution, which
contains other minority unidentified organics only related to 14%
of its TOC. Results of Fig. 8 corroborate the low ability of •OH pro-
duced in the SPEC process to remove the recalcitrant carboxylic
acids generated, thereby explaining the low mineralization of the
AO7 solution in this treatment.
Ionic chromatograms of the electrolyzed solutions revealed the
release of NH4+ and NO3
− ions in the mineralization of the initial N
contained in AO7 (1.20 mg L−1). No other inorganic nitrogen ions,
like NO2− ion, were detected by this technique. After 240 min of
SPEC, 0.16 mg L−1 of NH4+ ion (10.4% of initial N) and 0.54 mg L−1
of NO3− ion (1.0% of initial N) were found, indicating that the
former ion was produced in larger proportion. The TN analysis
of this solution evidenced that it only contained 0.23 mg L−1 of N,
corresponding to 19.2% of initial N. This suggests that during AO7
degradation in SPEC, the major part of its N (80.8%) is loss as volatile
derivatives, probably N2 and NOx species. Taking into account that
NH4+ and NO3
− ions, as well as 0.11 mg L−1 of oxamic acid (1.4% of
initial N), are detected as N-compounds in the final solution, one can
concluded that 6.4% of initial N is retained in it in other recalcitrant
unidentified N-derivatives.
4. Conclusions
It has been demonstrated that a novel TiO2 photoanode synthe-
sized by APS can decolorize efficiently solutions with low contents
of AO7 azo dye and 0.05 M Na2SO4 using SPEC under direct sun-
light irradiation in a photoelectrochemical cell with an air-diffusion
cathode that generates H2O2. The photoanode presented excel-
lent mechanical properties and showed large stability and long
148

150 S. Garcia-Segura et al. / Applied Catalysis B: Environmental 132– 133 (2013) 142– 150
durability up to 2.0 mA cm−2. The SPEC process was synergistic of
individual SPC and AO-H2O2 ones under comparable conditions as
a result of the larger production of •OH from the higher amounts
of photogenerated holes that can be separated of photogenerated
electrons. Colored aromatic intermediates were formed in SPEC
depending on pH, azo dye content and applied janod. The best oper-
ating variables were 15 mg L−1 AO7, pH 7.0 and janod = 1.0 mA cm−2.
Under these conditions, the azo dye disappeared in 100 min and the
solution was completely decolorized in 120 min, but its TOC was
much more slowly removed only attaining 40% mineralization after
240 min of electrolysis. The AO7 decay followed a pseudo-first-
order reaction, which was accelerated with increasing janod due
to the higher •OH generation from the production of more photo-
generated holes and the faster anodic oxidation of water. Detected
carboxylic acids like phthalic, tartaric, succinic, acetic and oxamic
accounted for 86% of the TOC contained in the solution electrolyzed
for 240 min and their large persistence explains the low mineral-
ization degree achieved for the azo dye in SPEC. The initial N of AO7
was mineralized as NH4+ ion and in a smaller proportion of NO3
−
ion, although it was mainly loss as volatile species. These results
point to the use of SPEC followed by a biological treatment for the
remediation of waters containing AO7, because the latter method
can efficiently remove the large amounts of carboxylic acids formed
from the application of the former one, thereby strongly increasing
the mineralization degree of the azo dye.
Acknowledgements
The authors thank the financial support from MICINN (Mini-
sterio de Ciencia e Innovación, Spain) through project CTQ
2010-16164/BQU, co-financed with Feder funds, and from AGAUR
(Agència de Gestió d’Ajuts Universitaris i de Recerca, Generalitat
de Catalunya, Spain) through project 2009 SGR 00390. The grant
awarded to S. Garcia-Segura by MEC (Ministerio de Educación y
Ciencia, Spain) is also acknowledged.
References
[1] E. Forgacs, T. Cserháti, G. Oros, Environment International 30 (2004) 953–971.[2] C.A. Martínez-Huitle, E. Brillas, Applied Catalysis B: Environmental 87 (2009)
105–145.[3] T. Robinson, G. McMullan, R. Marchant, P. Nigam, Bioresource Technology 77
(2001) 241–255.[4] G.A. Umbuzeiro, H.S. Freeman, S.H. Waren, D.P. Oliveira, Y. Terão, T. Watanabe,
L.D. Claxton, Chemosphere 60 (2005) 55–64.[5] S.M.A.G. Ulson de Souza, E. Forgiarini, A.A. Ulson de Souza, Journal of Hazardous
Materials 147 (2007) 1073–1078.[6] K.P. Sharma, S. Sharma, S. Sharma, P.K. Singh, S. Kumar, R. Grover, P.K. Sharma,
Chemosphere 69 (2007) 48–54.[7] A. Szygula, E. Guibal, M. Ruiz, A.M. Sastre, Colloids and Surfaces A 330 (2008)
219–226.[8] M.M. Dávila-Jiménez, M.P. Elizalde-González, A.A. Pelaéz-Cid, Colloids and Sur-
faces A 254 (2005) 107–114.[9] J. Wu, C. Liu, K.H. Chu, S. Suen, Journal of Membrane Science 309 (2008)
239–245.[10] E. Franciscon, A. Zille, F. Dias Guimaro, C. Ragagnin de Menezes, L.R. Durrant,
A. Cavaco-Paulo, International Biodeterioration and Biodegradation 63 (2009)280–288.
[11] T.A. Özbelge, F. Erol, Chemical Engineering Communications 169 (2008) 39–55.
[12] R. Andreozzi, V. Caprio, A. Insola, R. Marotta, Catalysis Today 53 (1999) 51–59.[13] E. Brillas, J.C. Calpe, P.L. Cabot, Applied Catalysis B: Environmental 46 (2003)
381–391.[14] M. Pera-Titus, V. García-Molina, M.A. Banos, J. Giménez, S. Esplugas, Applied
Catalysis B: Environmental 47 (2004) 219–256.[15] F. Kiriakidou, D.I. Kondarides, X.E. Verykios, Catalysis Today 54 (1999) 119–130.[16] M. Stylidi, D.I. Kondarides, X.E. Verykios, Applied Catalysis B: Environmental
40 (2003) 271–286.[17] S. Malato, J. Blanco, D.C. Alarcón, M.I. Maldonado, P. Fernández-Ibanez, W.
Gernjak, Catalysis Today 122 (2007) 137–149.[18] A. Fujishima, X. Zhang, D.A. Tryk, Surface Science Reports 63 (2008) 515–582.[19] U.G. Akpan, B.H. Hameed, Journal of Hazardous Materials 170 (2009)
520–529.[20] R. Pourata, A.R. Khataee, S. Aber, N. Daneshvar, Desalination 249 (2009)
301–307.[21] D. Friedmann, C. Mendive, D. Bahnemann, Applied Catalysis B: Environmental
99 (2010) 398–406.[22] A.Y. Shan, T.I.M. Ghazi, S.A. Rashid, Applied Catalysis A: General 389 (2010) 1–8.[23] L.A. Ioannou, E. Hapeshi, M.I. Vasquez, D. Mantzavinos, D. Fatta-Kassinos, Solar
Energy 85 (2011) 1915–1926.[24] J.H.O.S. Pereira, V.J.P. Vilar, M.T. Borges, O. González, S. Esplugas, R.A.R. Boaven-
tura, Solar Energy 85 (2011) 2732–2740.[25] V.M. Daskalaki, Z. Frontistis, D. Mantzavinos, A. Katsounis, Catalysis Today 161
(2011) 110–114.[26] W.H. Leng, Z. Zhang, J.Q. Zhang, Journal of Molecular Catalysis A: Chemical 206
(2003) 239–252.[27] P.A. Carneiro, M.E. Osugi, J.J. Sene, M.A. Anderson, M.V.B. Zanoni, Electrochimica
Acta 49 (2004) 3807–3820.[28] M.G. Neelavannan, C.A. Basha, Separation and Purification Technology 61
(2008) 168–174.[29] K. Esquivel, L.G. Arriaga, F.J. Rodríguez, L. Martínez, L.A. Godínez, Water
Research 43 (2009) 3593–3603.[30] J. Marugán, P. Christensen, T. Egerton, H. Purnama, Applied Catalysis B: Envi-
ronmental 89 (2009) 273–283.[31] P.S. Shinde, P.S. Patil, P.N. Bhosale, A. Brueger, G. Nauer, M. Neumann-Spallart,
C.H. Bhosale, Applied Catalysis B: Environmental 89 (2009) 288–294.[32] H.G. Oliveira, D.C. Nery, C. Longo, Applied Catalysis B: Environmental 93 (2010)
205–211.[33] Z. Frontistis, V.M. Daskalaki, A. Katsaounis, I. Poulios, D. Mantzavinos, Water
Research 45 (2011) 2996–3004.[34] R. Daghrir, P. Drogui, I. Ka, M.A. El Khakani, Journal of Hazardous Materials
199–200 (2012) 15–24.[35] R. Daghrir, P. Drogui, D. Robert, Journal of Photochemistry and Photobiology A:
Chemistry 238 (2012) 41–52.[36] L. Yu, Z. Wang, L. Shi, S. Yuan, Y. Zhao, J. Fang, W. Deng, Applied Catalysis B:
Environmental 113–114 (2012) 318–325.[37] S. Dosta, I.G. Cano, J.R. Miguel, J.M. Guilemany, Journal of Thermal Spray Tech-
nology 17 (2008) 360–364.[38] J. Suffner, H. Hahn, S. Dosta, I.G. Cano, J.M. Guilemany, Surface and Coatings
Technology 204 (2009) 149–156.[39] J. Suffner, H. Sieger, H. Hahn, S. Dosta, I.G. Cano, J.M. Guilemany, P. Klimczyk, L.
Jaworska, Materials Science and Engineering A 506 (2009) 180–186.[40] S. Ammar, R. Abdelhedi, C. Flox, C. Arias, E. Brillas, Environmental Chemistry
Letters 4 (2006) 229–233.[41] L.C. Almeida, S. Garcia-Segura, N. Bocchi, E. Brillas, Applied Catalysis B: Envi-
ronmental 103 (2011) 21–30.[42] E.J. Ruiz, C. Arias, E. Brillas, A. Hernández-Ramírez, J.M. Peralta-Hernández,
Chemosphere 82 (2011) 495–501.[43] S. Garcia-Segura, F. Centellas, C. Arias, J.A. Garrido, R.M. Rodríguez, P.L. Cabot,
E. Brillas, Electrochimica Acta 58 (2011) 303–311.[44] E. Brillas, M.A. Banos, S. Camps, C. Arias, P.L. Cabot, J.A. Garrido, R.M. Rodríguez,
New Journal of Chemistry 28 (2004) 314–322.[45] F.H. Chung, Journal of Applied Crystallography 7 (1974) 519–525.[46] F.J. Welcher (Ed.), Standard Methods of Chemical Analysis, vol. 2, Part B, 6th ed,
R.E. Krieger Publishers Co., Huntington, New York, 1975, p. 1827.[47] R. Restori, D. Schwarzenbach, J.R. Schneider, Acta Crystallographica 43B (1987)
251–257.[48] E. Sánchez, T. López, R. Gómez, X. Bokhimi, A. Morales, O.J. Novaro, Journal of
Solid State Chemistry 122 (1996) 309–314.[49] Y. Le Page, P. Strobel, Journal of Solid State Chemistry 44 (1982) 273–281.[50] M. Panizza, G. Cerisola, Chemical Reviews 109 (2009) 6541–6569.
149

Results and Discussion �
�����

Results and Discussion
�����
PAPER 7
Advances in solar photoelectron-Fenton:
Decolorization and mineralization of the
Direct Yellow 4 azo dye using an
autonomous solar pre-pilot plant

Results and Discussion �
�����

Results and Discussion
�����
Advances in solar photoelectro-Fenton:
Decolorization and mineralization of the Direct
Yellow 4 diazo dye using an autonomous solar pre-
pilot plant
Sergi Garcia-Segura, Enric Brillas1,*
Laboratori d’Electroquímica dels Materials i del Medi Ambient, Departament de
Química Física, Facultat de Química, Universitat de Barcelona, Martí i Franquès 1-11,
08028-Barcelona, Spain
Article submitted to be published in Electrochimica Acta
* Corresponding author: Tel.: +34 934021223, Fax: +34 934021231
E-mail address: [email protected] (E. Brillas)
1 ISE Active Member

Results and Discussion �
�����
Abstract
Here, an overview on the advances in solar photoelectro-Fenton (SPEF) is initially
presented to show that it is the more potent electrochemical advanced oxidation process
based on Fenton’s reaction chemistry to remove organic pollutants from waters, due to
the synergistic action of generated hydroxyl radicals and solar irradiation. As a novel
advance for SPEF, an autonomous solar pre-pilot plant is proposed to make an
energetically inexpensive process that can be viable at industrial level. The plant of 10
dm3 capacity contained a Pt/air-diffusion cell with 90.2 cm2 electrode area, coupled to a
solar compound parabolic collectors (CPCs) photoreactor of 1.57 dm3 irradiation volume
and to a solar photovoltaic panel that provides a maximum average current of 5.0 A. The
oxidation ability of this plant was assessed by studying the degradation of Direct Yellow
4 (DY4) diazo dye, which involved the predominant destruction of organics by •OH
formed from Fenton’s reaction between H2O2 generated at the cathode and added Fe2+,
along with the photolysis of Fe(III) complexes with products by sunlight in the CPCs
photoreactor. The effect of Fe2+ and dye contents as well as current on decolorization rate,
substrate decay and mineralization rate was examined. About 96-97% mineralization was
rapidly attained using 0.50 mmol dm-3 Fe2+ and up to 0.32 mmol dm-3 DY4 at 5.0 A. The
DY4 decay always obeyed a pseudo-first-order kinetics. Eleven aromatic products,
twenty two hydroxylated derivatives and nine short-linear carboxylic acids were
identified as intermediates. The Fe(III) complexes of most acids were rapidly removed,
pre-eminently photolyzed by sunlight, except those of acetic and oxamic acids that were
slowly destroyed. The initial N of the dye was mainly released as NH4+ ion and its initial
S was lost as SO42− ion. A plausible reaction sequence for DY4 mineralization involving
all the detected products was finally proposed.

Results and Discussion
�����
Keywords: Autonomous solar pre-pilot plant; Direct Yellow 4; Oxidation products; Solar
photoelectro-Fenton; Water treatment
1. Introduction
Over the past fifteen years, electrochemical advanced oxidation processes (EAOPs)
have received increasing attention for the removal of toxic and non-biodegradable organic
contaminants from waters [1-6]. These treatments are based on the in situ generation of
hydroxyl radical (•OH), which has so high standard reduction potential (Eº = 2.80 V/SHE)
that reacts with most organics yielding dehydrogenated or hydroxylated derivatives,
which can be in turn mineralized. The most typical EAOP is anodic oxidation (AO),
where pollutants are oxidized by electron transfer to the anode M and/or mediated
oxidation with heterogeneous M(•OH) formed from water discharge at the anode surface
at high current [2,4,7]:
M + H2O → M(•OH) + H+ + e− (1)
Boron-doped diamond (BDD) electrodes are the best anodes for AO because they
interact very weakly with physisorbed BDD(•OH) produced from reaction (1) and
promote a much greater O2-overpotential than other conventional anodes like Pt,
enhancing the removal of organics [8-10].
Other EAOPs based on Fenton’s reaction chemistry are electro-Fenton (EF) and
photoelectro-Fenton (PEF), in which H2O2 is supplied to an acidic contaminated solution
from the two-electron reduction of injected O2, for example, at a carbon-PTFE gas (O2 or
air) diffusion cathode [5,6,11]:
O2 + 2 H+ + 2 e− → H2O2 (2)
In both EAOPs, Fe2+ ion is added as catalyst to react with H2O2 to give Fe3+ ion and
•OH from Fenton’s reaction with optimum pH 2.8 [5,12-17]:
Fe2+ + H2O2 → Fe3+ + •OH + OH− (3)

Results and Discussion �
�����
Reaction (3) is catalytic and can be mainly propagated from Fe3+ reduction to Fe2+ at the
cathode. When an undivided cell is used in EF, organics can be attacked by heterogeneous
M(•OH) formed from reaction (1) and by •OH produced in the bulk from Fenton’s
reaction (3). In PEF, the degradation rate is enhanced under the simultaneous irradiation
of the solution with UV light due to: (i) the greater Fe2+ regeneration and •OH production
by photolysis of Fe(OH)2+, the pre-eminent Fe3+ species in solution at pH near 3, by
reaction (4) and (ii) the photodecarboxylation of complexes of Fe(III) with generated
carboxylic acids, which are hardly attacked with •OH, by the global reaction (5)
[15,16,18-23].
Fe(OH)2+ + hν → Fe2+ + •OH (4)
Fe(OOCR)2+ + h� → Fe2+ + CO2 + R• (5)
An important drawback of PEF is the high electrical cost of the UV lamps used. To
solve this problem, we have proposed the alternative use of the SPEF method in which
the solution is directly irradiated with sunlight as an inexpensive and renewable energy
source with λ > 300 nm [24,25]. The higher intensity of UV radiation supplied by sunlight
and the additional absorption at λ > 400 nm, e.g. for the photolysis of Fe(III)-carboxylate
complexes, enhance the mineralization process of SPEF compared with PEF.
Despite the more cost-effective treatment by SPEF, the electrolytic systems used
spent energy from a power supply that provides the electric current to the electrolytic cell
and this still represents an economical problem for its possible application to water
remediation at industrial level. For this reason, we have designed a novel autonomous
solar pre-pilot plant in which the electrical energy needed for the electrolytic cell is
supplied by a solar photovoltaic panel, making thereby an energetically inexpensive SPEF
process. The ability of such autonomous plant for organic removal has been assessed by

Results and Discussion
����
studying the decolorization and mineralization of a typical diazo dye such as Direct
Yellow 4 (DY4), whose chemical structure and characteristics are collected in Table 1.
This paper presents, in the first place, a brief overview over the advances in SPEF to
show more clearly the interest of using the designed autonomous solar pre-pilot plant of
10 dm3 capacity containing a Pt/air-diffusion cell coupled to a compound parabolic
collectors (CPCs) photoreactor and controlled by a 50 W photovoltaic panel. The
degradation of synthetic DY4 solutions in 0.05 mol dm-3 Na2SO4 at pH 3.0 by SPEF using
such a plant is later reported to check the high effectiveness of this EAOP. The effect of
Fe2+ content, applied current and DY4 concentration on the decolorization rate, substrate
decay and mineralization rate and degree was examined. The decay kinetics for DY4 was
followed by high-performance liquid chromatography (HPLC). Aromatic intermediates
were detected by liquid chromatography-mass spectrometry (LC-MS) and generated
short-linear carboxylic acids and released inorganic ions were quantified by different
chromatographic techniques. From these results, a plausible reaction pathway for DY4
mineralization is finally proposed.
2. Advances in the solar photoelectro-Fenton process
The degradation of the drugs salicylic acid [26], ibuprofen [27], enrofloxacin [28]
and chloramphenicol [29], as well as of the pharmaceutical precursor α-
methylphenylglycine [30] and the dye Sunset Yellow CFC (SY) [31], has been
comparatively studied by SPEF and other EAOPs using a 100 cm3 stirred and
thermostated tank reactor with a BDD or Pt anode and a gas (O2 or air) diffusion cathode,
all with 3 cm2 area. In EF, PEF and SPEF, 0.05 or 0.10 mol dm-3 Na2SO4 was used as
background electrolyte and 0.5 mol dm-3 Fe2+ was usually added as catalyst. The PEF
trials were made with a 6 W UVA lamp of λmax = 360 nm and the SPEF ones under direct

Results and Discussion �
����
solar irradiation with an average UV intensity of ca. 31 W m-2. The performance of each
EAOP increased using a BDD anode instead of Pt, indicating the higher oxidizing power
of BDD(•OH) than Pt(•OH) formed from reaction (1) to remove the contaminants.
Although UV light enhanced the degradation, almost total mineralization was more
rapidly achieved in SPEF due to the higher intensity of sunlight. It was found an optimum
pH of 3.0 for EF, PEF and SPEF treatments, near the optimum pH of 2.8 for Fenton’s
reaction (3), as expected if •OH was the main oxidant of organics. Moreover, a Fe2+
content of 0.5-1.0 mM was found optimal for all processes. The amount of total organic
carbon (TOC) removed always increased at higher current density and greater pollutant
concentration, and so, the efficiency of SPEF rose when current decreased and more
contaminant was present in the solution. The decay kinetics for pollutants always
followed a pseudo-first-order reaction, with rate constants much higher for SPEF than for
EF and PEF, due to the additional production of •OH induced by reaction (4). GC-MS
and HPLC analysis of treated solutions allowed the detection of aromatic intermediates
like 2,3-, 2,5- and 2,6-dihidroxy-benzoic acids for salicylic acid, 34 products for
chloramphenicol and 48 products for SY. Oxalic acid was always the ultimate generated
carboxylic more largely accumulated, which was not removed in EF but rapidly destroyed
in PEF and much more quickly in SPEF by the fast photolysis of its Fe(III) complexes by
reaction (5). This phenomenon explained the higher mineralization ability of the SPEF
process. For enrofloxacin and α-methylphenylglycine, the initial N was mainly converted
into NH4+ ion and in smaller proportion into NO3− ion. However, the opposite trend was
found for chloramphenicol.
The SPEF treatment of organics has been scaled-up to a recirculation pre-pilot plant
of 2.5 dm3 with a BDD/O2-diffusion cell coupled to a flat solar photoreactor composed
of a polycarbonate box of 600 dm3 of irradiated volume. The electrodes of 20 cm2 area

Results and Discussion
�����
were separated about 1.2 cm. Solutions with 50-200 mg dm-3 of TOC in 0.05-0.10 mol
dm-3 Na2SO4 with 0.5 mmol dm-3 Fe2+ at pH 3.0, 50 mA cm-2 and flow rate of 180-200 L
h-1 were tested. SPEF was much more potent to mineralize organics than AO and EF, as
found for the herbicide mecoprop [24], o-, m- and p-cresol [25] and the dyes Acid Yellow
36 (AY36) [15], Acid Red 88 (AR88) [32], Acid Yellow 9 (AY9) [32], Disperse Red 1
(DR1) [33] and Disperse Red 3 (DR3) [33]. For all these compounds, the SPEF efficiency
rose at lower current density and higher pollutant content, being much more cost-effective
than the compared EF one. The performance of SPEF was slightly enhanced from the
combined use of Fe2+ and Cu2+ as co-catalysts as found for Disperse Blue 3 (DB3) [34]
since mineralization was accelerated by the attack of •OH on Cu(II)-carboxylate species,
competitively formed with Fe(III)-carboxylate ones. A drawback of this plant, however,
was the high energy consumption of the BDD/air-diffusion cell as a result of its great
potential difference between electrodes. For this reason, more recent studies with the 2.5
dm3 solar pre-pilot plant were focused to the degradation of the sulfa compounds
sulfanilic acid [35] and sulfanilamide [36] using a more economic Pt/air-diffusion cell
because of its smaller potential difference compared with the BDD/air-diffusion one. For
the SPEF process of sulfanilic acid, the application of response surface methodology
allowed obtaining 100 mA cm-2, 0.5 mmol dm-3 Fe2+ and pH 4.0 as optimum variables,
yielding 76% mineralization with 275 kWh kg-1 TOC energy cost and 52% current
efficiency at 120 min. For the SPEF treatment of 239-1195 mg dm-3 sulfanilamide
solutions of pH 3.0, 91-94% mineralization was achieved after 240 min at 100 mA cm-2
with energy consumptions < 470 kWh kg-1 TOC. All the initial compounds decayed at
similar rate in EF and SPEF following a pseudo-first-order kinetics and their rate constant
increased with raising current density and decreasing pollutant content. Consequently, the
solar photoreactor did not favored the •OH generation from reaction (4). Analysis of final

Results and Discussion �
�����
carboxylic acids confirmed the quick removal of oxalic acid by photolysis of its Fe(III)
complexes in SPEF, but the formation of other more recalcitrant carboxylic acids like
acetic and oxamic slowed the mineralization process. The initial N of all N-products was
pre-eminently transformed into NH4+ ion.
In order to reduce the energy consumption for the SPEF process, a larger solar pre-
pilot plant of 10 dm3 was built-up with an electrolytic reactor of 90.2 cm2 electrode area
coupled to a 1.57 dm3 solar compound parabolic collectors (CPCs) photoreactor, much
more efficient than the solar flat photoreactor previously used. With this plant, acidic
solutions with 100 mg dm-3 TOC of the beta-blockers atenolol, metoprolol tartrate and
propranolol hydrochloride at pH 3.0 were treated using single Pt/air-diffusion and
BDD/air-diffusion cells and also their combination with Pt/carbon-felt cell to enhance
Fe2+ regeneration from Fe3+ reduction [37]. Although the use of a BDD anode led to
quicker TOC reduction, the lowest cost of 80 kWh kg-1 TOC with 88-93% mineralization
was found for the combined Pt/air-diffusion-Pt/carbon-felt cell, but only giving a slightly
lower consumption than the single Pt/air-diffusion one. From these results, we concluded
that a Pt/air-diffusion reactor was the most viable cell for SPEF in the 10 dm3 pre-pilot
plant. The good effectiveness of this system was later confirmed by studying the treatment
of 186 mg dm-3 of the herbicide 4-chloro-2-methylphenoxyacetic acid [38] and 157 mg
dm-3 of the drug paracetamol [39] by response surface methodology. In both cases, the
optimum variables were 5.0 A, 0.4-1.0 mol dm-3 Fe2+ and pH 3.0. Under these conditions,
75% mineralization with 71% current efficiency and an energy consumption as low as 88
kWh kg-1 TOC were obtained at 120 min for 4-chloro-2-methylphenoxyacetic acid,
whereas the same mineralization degree with a current efficiency of 71% and a similar
energy cost of 93 kWh kg-1 TOC was found also at 120 min for paracetamol.

Results and Discussion
�����
In view of the excellent expectative of using the above 10 dm3 solar pre-pilot plant
for the SPEF process, we have introduced in it a new component, a solar photovoltaic
panel to provide the electric energy to the electrolytic cell in order to obtain an
energetically inexpensive treatment for waters. The assessment of this novel autonomous
solar pre-pilot plant is reported below.
3. Experimental
3.1. Chemicals
Pure DY4 diazo dye was purchased from Sigma-Aldrich. Maleic, malic, tartronic,
malonic, glycolic, acetic, formic, oxalic and oxamic acids were of analytical grade
supplied by Panreac and Avocado. Anhydrous sodium sulfate, used as background
electrolyte, and heptahydrated Fe(II) sulfate, used as catalyst, were of analytical grade
purchased from Fluka and Sigma-Aldrich, respectively. Organic solvents and other
chemicals employed were of LC-MS, HPLC or analytical grade purchased from
Teknokroma, Merck and Sigma-Aldrich. All solutions were prepared with deionized
water and their initial pH was adjusted to 3.0 with analytical grade sulfuric acid purchased
from Merck.
3.2. Autonomous solar pre-pilot plant
A scheme of the pre-pilot plant designed for the SPEF process is depicted in Fig. 1.
In each trial, a volume of 10 dm3 of a DY4 solution in 0.05 mol dm-3 Na2SO4 of pH 3.0
was introduced in the reservoir and recirculated through the plant with a magnetic drive
centrifugal pump from Iwaki at a liquid flow rate of 200 L h-1 regulated by a flowmeter.
The solution then passed through the electrochemical reactor, the solar photoreactor and
two heat exchangers to maintain the temperature at 35 ºC to finally back to the reservoir.
The electrochemical cell was a one-compartment filter-press reactor with components of

Results and Discussion �
�����
12 cm × 18 cm in dimension, separated with Viton gaskets to avoid leakages. The anode
was a Pt sheet of 99.99% purity purchased from SEMPSA and the cathode was a carbon-
PTFE air-diffusion electrode supplied by E-TEK. Both electrodes were of 10 cm × 10 cm
in dimension. A PVC liquid compartment with a central window of 9.5 cm × 9.5 cm (90.2
cm2) was used to contact the effluent with the outer faces of both electrodes separated a
distance of 1.2 cm. The inner face of the cathode was pressed onto a Ni mesh as electrical
connector and contacted with a PVC gas chamber where circulated compressed air at a
flow rate of 4.5 dm3 min-1, regulated with a back-pressure gauge, to continuously generate
H2O2 from O2 reduction. The electric energy to the cell was provided by a 50 W solar
photovoltaic panel supplied by Nousol. The applied current and potential difference
between electrodes were directly measured by an ammeter, coupled in series, and a
voltmeter, coupled in parallel. The solar CPCs photoreactor had an area of 0.4 m2 and
concentration factor of 1, being composed of 12 borosilicate-glass tubes of 50.5 cm length
× 1.82 cm inner diameter (1.57 dm3 irradiated volume), with connecting tubing and valves
mounted in an aluminium frame. Both the solar photovoltaic panel and CPCs
photoreactor were placed on separated platforms tilted 41º to better collect the sun rays.
All the SPEF experiments were run for 4 h from the noon in sunny and clear days
during the summer of 2013 in our laboratory of Barcelona, Spain (latitude: 41º 21’N;
longitude: 2º 10’E). The average solar UV radiation intensity (between 300 and 400 nm)
was about 31 W m-2, as measured with a Kipp & Zonen CUV 5 global UV radiometer.
Under these conditions, the photovoltaic panel provided average values of 5.0 A and 10.0
V. Part of this panel was covered with a black plastic to operate at average values of 3.0
A and 7.3 V. Before the degradation tests, the air-diffusion cathode was activated by
electrolyzing 10 dm3 of 0.05 mol dm-3 Na2SO4 at pH 3.0 and 5.0 A for 240 min.
3.3. Apparatus and analytical procedures

Results and Discussion
�����
The solution pH was determined with a Crison GLP 22 pH-meter. Prior to analysis,
the samples withdrawn from electrolyzed solutions were neutralized at pH 7-8 to stop the
degradation process and filtered with 0.45 m PTFE filters purchased from Whatman.
The mineralization of DY4 was monitored from the abatement of its dissolved organic
carbon (DOC), measured with a Shimadzu TOC-VCSN analyzer. Reproducible TOC
values with ±1% accuracy were found by injecting 50 l aliquots into the analyzer. Total
nitrogen (TN) was determined with a Shimadzu TNM-1 unit coupled with the TOC
analyzer. The mineralization current efficiency (MCE) for each trial at average current I
(in A) and electrolysis time t (in h) was then estimated as follows [15,24]:
MCE (%) = × 100 (6)
where F is the Faraday constant (96,487 C mol-1), Vs is the solution volume (10 dm3),
�(DOC)exp is the experimental DOC decay (in mg dm-3), 4.32×10⁷ is a conversion factor
to homogenize units (3,600 s h-1 × 12,000 mg mol-1) and m is the number of carbon atoms
of the dye (26 carbon atoms). The number of electrons consumed per each DY4 molecule
(n) was taken as 106, considering that mineralization involves its conversion into CO2
with release of NH4+ and SO4
2− as major inorganic ions, as will be discussed below,
according to reaction (7):
C26H16N4O8S22− + 52 H2O � 26 CO2 + 4 NH4
+ + 2 SO42− + 104 H+ + 106 e− (7)
The DY4 decay was followed by reversed-phase HPLC using a Waters 600 LC fitted
with a Spherisorb ODS2 5 μm, 150 mm × 4.6 mm, column at 35 ºC and coupled with a
Waters 996 photodiode array detector selected at �max = 400 nm. In these measurements,
20 μl aliquots were injected into the chromatograph and the mobile phase was a 50:50
(v/v) acetonitrile/water mixture with 2.4 mmol dm-3 n-butylamine at 0.3 cm3 min−1,
displaying the dye at a retention time of 5.15 min. The change in concentration of
n F Vs �(DOC)exp
4.32×10⁷ m I t

Results and Discussion �
�����
generated carboxylic acids was determined by ion-exclusion HPLC using a the same LC
fitted with a Bio-Rad Aminex HPX 87H, 300 mm × 7.8 mm, column at 35 °C and setting
the photodiode array detector at � = 210 nm. For these analyses, 20 l aliquots were also
injected into the LC, 4 mmol dm-3 H2SO4 at 0.6 cm3 min-1 was employed as mobile phase
and the peaks appeared at retention times of 7.0 min for oxalic acid, 7.9 min for tartronic
acid, 8.3 min for maleic acid, 9.4 min for oxamic acid, 9.5 min for malic acid, 9.8 min for
malonic acid, 12.2 min for glycolic acid, 13.4 min for formic acid and 15.1 min for acetic
acid. The released inorganic ions were quantified by ion chromatography with a
Shimadzu 10 Avp LC coupled with a Shimadzu CDD 10 Avp conductivity detector. The
NH4+ concentration was analyzed with a Shodex IC YK-421, 125 mm × 4.6 mm, cation
column at 40 ºC, whereas the NO3− and SO4
2− contents were obtained with a Shim-Pack
IC-A1S, 100 mm × 4.6 mm, anion column also at 40 ºC. These analyses were made by
injecting 25 l samples and circulating mobile phases composed of a 5.0 mmol dm-3
tartaric acid, 1.0 mmol dm-3 dipicolinic acid, 24.2 mmol dm-3 boric acid and 1.5 mmol
dm-3 crown ether solution at 1.0 cm3 min-1 for NH4+ and a 2.4 mmol dm-3
tris(hydroxymethyl)-aminomethane and 2.5 mmol dm-3 phthalic acid solution of pH 4.0
at 1.5 cm3 min-1 for NO3− and SO4
2−.
Aromatic intermediates formed after 5-30 min of SPEF treatment of a 0.16 mmol dm-
3 DY4 solution in the autonomous solar pre-pilot plant at average current of 5.0 A were
identified by LC–MS using a Shimadzu SIL-20ACLC coupled with a Shimadzu LCMS-
2020 MS. The LC was fitted with a Teknokroma Mediterranean Sea C-18 3 μm, 15 mm
× 0.46 mm, column at 30 ºC. The MS operated in the negative mode with electrospray
source ionization (ESI), by applying an interface voltage of −4.5 V and 60 V Q-array RF
oltage. The DL temperature was 250 ºC and pure N2 was used as nebulising and dryer
gas. Mass spectra were collected in the m/z range 50–820 using total ion current (TIC)

Results and Discussion
�����
acquisition. For these analyses, 30 μl aliquots were introduced into the LC, previously
filtered with a Millipore filter of 0.22 μm, and the mobile phase was a 75:25 (v/v)
acetonitrile/water (5.0 mmol dm-3 ammonium acetate) mixture at 0.2 cm3 min-1.
4. Results and discussion
4.1. Effect of Fe2+ concentration on the solar photoelectro-Fenton degradation
A first series of experiments was made by electrolyzing 10 dm3 of 0.16 mmol dm-3
DY4 (corresponding to 50 mg dm-3 DOC) in 0.05 mol dm-3 Na2SO4 with Fe2+ content
between 0.25 and 5.0 mmol dm-3 at pH 3.0 and 35 ºC using the autonomous solar pre-
pilot plant for 240 min. The system operated under steady conditions since the solar
photovoltaic panel provided to the Pt/air-diffusion cell the maximum average current of
5.0 A, within a fluctuation of 0.1 A. In these trials, the initial yellow solutions were rapidly
decolorized and their pH did not vary significantly during electrolysis time, attaining final
values near 2.7-2.8, suggesting the formation of acidic products like short-linear
carboxylic acids [5,6].
Fig. 2a evidences that the decolorization rate of the dye increased gradually with
increasing Fe2+ content from 0.25 to 5.0 mmol dm-3. Thus, 99% and 97% of color removal
were achieved at 60 min of treatment with 0.25 and 0.50 mmol dm-3 Fe2+, respectively,
whereas the use of 2.0 and 5.0 mmol dm-3 Fe2+ only yielded 92% and 84% color removal
at 120 min, respectively. This deceleration in decolorization can be related to the
concomitant loss of •OH produced from Fenton’s reaction (3) and induced by photolytic
reaction (4) due to the increase in rate of the following parasitic reaction with raising
amounts of Fe2+ [40]:
Fe2+ + •OH → Fe3+ + OH− (8)

Results and Discussion �
�����
To better clarify this behavior, the decay of DY4 concentration was followed by
reversed-phase HPLC and the results obtained are presented in Fig. 2b. In all cases, the
dye was completely removed at much higher rate than decolorized. That means that the
decolorization process involves the formation of colored conjugated products with λmax
similar to that of the dye, which are more difficultly destroyed, particularly for Fe2+
contents ≥ 2.0 mmol dm-3 when lesser amounts of oxidant •OH are available in the
medium. Surprisingly, Fig. 2b also shows that the dye disappeared more quickly from
0.25 to 0.50 mmol dm-3 Fe2+. This evidences that Fenton’s reaction (3) is accelerated,
generating more •OH up to 0.50 mmol dm-3 Fe2+, but at higher catalyst content this radical
is progressively loss under the action of reaction (8). The drop in decolorization efficiency
when dye content rises from 0.25 to 0.50 mmol dm-3 Fe2+ points to the formation of Fe(III)
complexes among the colored conjugated products formed. Analysis of the above
concentration decays revealed that the dye obeyed a pseudo-first-order kinetics, as can be
observed in the inset panel of Fig. 2b. The greater apparent rate constant (k1) of 3.5×10⁻³
s-1 (R2 = 0.999) was found for 0.50 mmol dm-3 Fe2+, dropping slightly to 3.0×10⁻³ s-1 (R2
= 0.998) for 0.25 mmol dm-3, and much more strongly to 1.9×10⁻³ s-1 (R2 = 0.998) for 2.0
mmol dm-3 and 7.3×10⁻⁴ s-1 (R2 = 0.999) for 5.0 mmol dm-3. This behavior suggests that
the dye is always attacked by a constant but different amount of •OH in all cases, as
expected if the plant operates under steady conditions.
Fig. 2c depicts that the solution DOC was also destroyed more rapidly for 0.50 mmol
dm-3 Fe2+, attaining 96% mineralization after 180 min of SPEF process. A mineralization
degree of 95% was also achieved for 0.25 mmol dm-3 Fe2+ but at 240 min, whereas the
use of 2.0 mmol dm-3 Fe2+ led to 94% DOC reduction at the end of treatment. In contrast,
the much lower oxidation ability for 5.0 mmol dm-3 Fe2+ only allowed reaching 85%
mineralization. The greater production of •OH then favors the faster destruction of

Results and Discussion
����
organics and the formation of Fe(III) complexes that can be more quickly photolyzed by
sunlight in the CPCs photoreactor.
The aforementioned findings indicate that the optimum Fe2+ concentration for the
SPEF degradation of DY4 in the autonomous pre-pilot plant is 0.50 mmol dm-3, which
was used in the next experiments. Besides, the large influence of this catalyst on the
destruction of organics evidences that •OH formed in the medium is the predominant
oxidizing agent, being much more potent than Pt(•OH) formed at the anode surface from
reaction (1), as found for other aromatic treated by EAOPs based on Fenton’s reaction
chemistry [5,6,18,19,32].
4.2. Influence of applied current on the solar photoelectro-Fenton process
The applied current is a key parameter in the EAOPs because it controls the amount
of •OH able to oxidize organic pollutants. The influence of this experimental variable on
the SPEF process using the autonomous solar pre-pilot plant was investigated for 10 dm3
of a 0.16 mmol dm-3 DY4 solution with 0.05 mol dm-3 Na2SO4 at optimum 0.50 mmol
dm-3 Fe2+ and pH 3.0 by applying average current values of 3.0 and 5.0 A.
Fig. 3a illustrates that the increase in current upgrades dye decolorization, thereby
attaining 97% color removal after 90 min of applying 3.0 A, but only after 60 min at 5.0
A. This can be accounted for by the acceleration of the electrode reactions involving the
direct and/or mediated generation of hydroxyl radical, allowing the production of more
amounts of Pt(•OH) from reaction (1) as well as of H2O2 from reaction (2) [15], which
enhances Fenton’s reaction (3) leading to greater quantities of •OH in the bulk. The
positive effect on degradation as current rises can be better observed in Fig. 3b, where the
decay kinetics for the dye is comparatively depicted. The substrate disappeared in 40 min
at 3.0 A and at a shorter time of 20 min at 5.0 A. These times were much shorter than

Results and Discussion �
����
those needed for attaining 97% decolorization efficiency, indicating the generation of
colored conjugated products that persisted largely to the attack of •OH in the bulk. As can
be seen in the inset panel of Fig. 3b, good linear correlations were obtained assuming a
pseudo-first-order reaction for the kinetic analysis of concentration decays. The k1 value
rose from 2.0×10⁻³ s-1 (R2 = 0.995) for 3.0 A to 3.5×10⁻³ s-1 (R2 = 0.999) for 5.0 A, in
agreement with the expected attack of the dye by a constant and increasing amount of
oxidizing hydroxyl radicals.
An almost complete mineralization of 96% as maximal was found for both currents,
but a longer time of 240 min was needed for 3.0 A compared to 180 min for 5.0 A, as
shown in Fig. 3c. This agrees with the greater generation of Pt(•OH) and •OH at higher
current with the concomitant acceleration of organics removal. However, the opposite
trend can be seen in the inset panel of Fig. 3c for the corresponding MCE values
calculated from. Eq. (6). For 3.0 A, the current efficiency attained its maximum value of
56% at 120 min to be further reduced to 35% at the end of the SPEF treatment, whereas
for 5.0 A, a lower current efficiency of 28% at 180 min was determined after passing by
a maximal of 41% at 90 min. The drop in MCE at long electrolysis time can be ascribed
to the presence of less organic matter along with the formation of more recalcitrant
products [4]. Besides, the gradual decay in current efficiency as current rises can be
accounted for by a progressive loss in the relative amount of •OH formed as a result of
the higher acceleration of its parasitic reactions with the consequent fall in organic events
decelerating the mineralization process. These non-oxidizing reactions involve, for
example, the destruction of •OH by Fe2+ from reaction (8) [40] and by H2O2 from reaction
(9), generating the weaker oxidant hydroperoxyl radical (HO2•) [5], as well as its
dimerization to H2O2 by reaction (10) [32]:
H2O2 + •OH → HO2• + H2O (9)

Results and Discussion
�����
2 •OH → H2O2 (10)
The above results are indicative of a good effectiveness of the SPEF process for DY4
mineralization using the autonomous solar pre-pilot plant. The treatment becomes more
efficient at smaller currents, but longer time is required for achieving the maximum
mineralization of 96%. For this reason, the maximum average current of 5.0 A provided
by the solar photovoltaic panel can be taken as the best current for SPEF under the present
experimental conditions.
4.3. Effect of dye concentration on the solar photoelectro-Fenton treatment
The substrate concentration is another important experimental variable since it can
inform about the ability of EAOPs to produce reactive oxidizing species and to treat high
pollutant concentrations. To clarify this effect for the autonomous solar pre-pilot plant,
10 dm3 of solutions with DY4 concentrations between 0.08 and 0.32 mmol dm-3 with 0.05
mol dm-3 Na2SO4 and 0.50 mmol dm-3 Fe2+ at pH 3.0 were degraded at 5.0 A.
Fig. 4a highlights that longer time, from 30 to 90 min, was needed for reaching 97-
99% color removal as dye content rises from 0.08 and 0.32 mmol dm-3. This is the
behavior expected if more organic matter is attacked by a similar amount of oxidizing
agents that are formed under steady conditions. Note that a similar decolorization
efficiency was found for 0.16 and 0.24 mmol dm-3, indicating that analogous quantities
of colored conjugated intermediates are formed in this concentration range. The longer
duration of the attack of Pt(•OH) and primordially •OH over greater DY4 concentrations
was confirmed by determining their decay kinetics. As can be seen in Fig. 4b, the dye
was completely removed at increasing times of about 15, 20, 40 and 60 min for higher
dye contents of 0.08, 0.16, 0.24 and 0.32 mmol dm-3. According to this, the k1 value
decreased gradually from 5.1×10⁻³ s-1 (R2 = 0.987) at 0.08 mmol dm-3 to 1.6×10⁻³ s-1 (R2
= 0.998) at 0.32 mmol dm-3. The large drop in k1 evidences that the reaction of the dye

Results and Discussion �
����
with hydroxyl radicals does not obey a true pseudo-first-order kinetics, since an apparent
rate constant independent of substrate content is theoretically predicted in such a case.
This complex behavior may be ascribed to the very short lifetime of hydroxyl radicals
(about 4×10⁻⁹ s [41]), which need to be continuously produced at the Pt anode from water
oxidation by reaction (1) and in the medium from reactions (3) and (4) with participation
of H2O2 and Fe2+, also continuously generated at the cathode. The diffusion of all these
species in the medium and their mass transport toward/from the electrodes then seem to
limit the generation of Pt(•OH) and •OH giving rise to a different constant concentration
to attack DY4 in each trial. This can justify the pseudo-first-order kinetics always
followed by the dye but with a k1 value that falls as substrate content rises due to the
slower diffusion and mass transport control of the species generating these oxidants by
the presence of more organic matter.
The good oxidation ability of the SPEF process to mineralize the different DY4
solutions is shown in Fig. 4c. An almost total mineralization related to 96-97% DOC
abatement was found in all cases, which was reached at longer time with increasing
substrate concentration. For the higher content of 0.32 mmol dm-3, such DOC decay was
obtained in 240 min, while only 120 min were needed for the smaller content of 0.08
mmol dm-3. However, when the corresponding MCE values were calculated, two different
relative tendencies were found depending on the electrolysis time. The inset panel of Fig.
4c evidences the existence of a maximum current efficiency in all cases, which became
greater and appeared at longer time as dye content increased. At the beginning of the
process, the MCE values dropped with raising the organic matter, suggesting the initial
generation of more amounts of products that are hardly mineralized. In contrast, after
passing the maximum MCE value, the opposite tendency occurred and the higher 0.32
mmol dm-3 dye concentration yielded the best efficiency of 41% at 240 min. This

Results and Discussion
����
enhancement in efficiency can be related to the quicker oxidation of greater quantities of
the remaining organics by larger amounts of •OH that cause a decay in rate of its parasitic
reactions (8)-(10). This leads to a faster formation of Fe(III) complexes with the resulting
products that are more rapidly photolyzed with solar radiation.
The above study evidences that the autonomous solar pre-pilot plant is able to rapidly
mineralize solutions up to 0.32 mmol dm-3 DY4 under the synergistic action of hydroxyl
radicals and sunlight in the SPEF process. This concentration (about 200 mg dm-3) is the
typical maximum value expected for dyeing industrial wastewaters [15,28].
Consequently, one can infer that this method can be viable for the industrial treatment of
waters containing DY4.
4.4. Identification of aromatic intermediates and time course of generated carboxylic
acids and released inorganic ions
Table 2 collects the eleven aromatic compounds and twenty two hydroxylated
derivatives detected by LC-MS, which are originated during the initial SPEF treatment of
the dye at 5.0 A. Apart from the starting DY4 with two azo bonds and four benzenic
moieties (1), four products with one azo bond and three benzenic groups (2-5), one
derivative with one azo bond and two benzenic moieties (6), two conjugated products
with also two benzenic groups (7 and 8) and finally, four monobenzenic derivatives (9-
12) were identified. These compounds are formed from the consecutive breaking of the
two azo bonds of the dye and from the deamination, desulfonation, hydroxylation,
nitration and carboxylation of the benzenic groups.
Ion-exclusion chromatograms of electrolyzed solutions exhibited the generation of
nine short-linear carboxylic acids like maleic (13), malic (14), tartronic (15), malonic
(16), glycolic (17), acetic (18), oxalic (19), formic (20) and oxamic (21). Acids 13-18 are
expected to be produced from the oxidative cleavage of the benzenic ring of aromatic

Results and Discussion �
����
intermediates, which are subsequently transformed into 19 and 20 [5,24,27,28]. The acid
21 should be formed from the degradation of intermediates containing a –NH2 group. The
products 19-21 are ultimate carboxylic acid since they are directly transformed into CO2
[6,42].
Fig. 5 shows the evolution of the concentration of all detected acids during the SPEF
treatment of 10 dm3 of a 0.16 mmol dm-3 DY4 solution with 0.05 mol dm-3 Na2SO4 and
0.50 mmol dm-3 Fe2+ at pH 3.0 and 5.0 A. Acids 15 and 19 were accumulated in larger
extent up to near 16-18 mg dm-3 in 60 min to practically disappear (< 0.2 mg dm-3) for
times longer than 120 min. The quick removal of these acids is due to the fast photolysis
of their Fe(III) complexes via reaction (5), because at least, Fe(III)-oxalate species cannot
be directly destroyed by hydroxyl radicals [5,6,42]. The rapid photolysis of the Fe(III)-
complexes of acids 13, 14, 16, 17 and 20 can also explain their disappearance at times
lesser than 90 min. In contrast, acids 18 and 21 persisted largely up to the end of treatment,
with final contents of 0.36 and 0.87 mg dm-3, respectively, because their complexes with
Fe(III) react very slowly with •OH and are poorly photolyzed. A simple mass balance, for
example, at 120 min reveals that all the detected acids contribute in only 0.6 mg dm-3
DOC, which is a value much smaller than 6.0 mg dm-3 DOC determined for the treated
solution. This evidences that large amounts of other undetected products are accumulated
and quickly mineralized by oxidation with hydroxyl radicals and/or photolysis by
sunlight. The removal of such compounds along with of short-linear carboxylic acids
explains the high oxidation ability of SPEF to mineralize DY4.
The mineralization of the initial N (0.64 mM, 9.0 mg dm-3) contained in 0.16 mmol
dm-3 DY4 solution in the form of NH4+ and NO3− ions was confirmed by ion
chromatography. No other inorganic nitrogen ions like NO2− were detected by this
technique. Fig. 6a highlights the much larger accumulation of NH4+ ion than NO3− ion,

Results and Discussion
����
as stated in reaction (7). Both ions were rapidly released attaining final N concentrations
of 4.7 mg dm-3 related to NH4+ (52.2% of initial N) and 1.2 mg dm-3 related to NO3−
(13.3% of initial N). Since the remaining acid 21 still contained 1.5% of the initial N, one
can infer that only 67% of the initial organic N is released to the medium, while a
proportion as high as 33% is lost, probably as volatile N2 and/or NxOy species.
On the other hand, the release of the initial organic S as SO42− ion was also assessed
during the SPEF process of the 0.16 mmol dm-3 dye solution. Fig. 6b shows a rapid
accumulation of SO42− ion in the solution up to 30.7 mg dm-3 (97.8% of initial S) after
120 min of treatment. This corroborates the practical complete conversion of the initial S
into such ion, as proposed in reaction (7).
4.5. Proposed reaction pathway for Direct Yellow 4 mineralization
Based on the above detected products, Fig. 7 presents a reaction sequence proposed
for the mineralization of DY4 by the SPEF process. In this pathway, the main oxidizing
agent •OH is only considered. Although all the acids are expected to form Fe(III)
complexes under the experimental conditions tested, this possibility is only stated for
acids 19-21 for sake of simplicity.
The process starts with the cleavage of one azo bond of 1 to yield two
aminoderivatives, the compound 2 and p-aminophenol, which is oxidized to its nitro
product 12. The compound 2 is degraded either to 3 via deamination or to 4 via
desulfonation. Subsequent deamination of 4 leads to 5, which is oxidized to the shorter
derivatives 6 and 7. The breaking of the azo bond of 3 followed by carboxylation or
hydroxylation yields the mixture of products 8-10. The compound 10 can then be either
hydroxylated to 11 or desulfonated followed by nitration to produce 12. Further cleavage
of the benzenic moiety of the above aromatic intermediates yields a mixture of acids 13-
18, which are subsequently oxidized to 19 and 20. The parallel degradation of aromatics

Results and Discussion �
����
with a –NH2 group generates the acid 21. The ultimate acids 19-21 form the
corresponding Fe(III) complexes. While the Fe(III)-formate species are destroyed by •OH
and photolyzed by sunlight to CO2, the removal of Fe(III)-oxamate species under the
action of these agents is much slower, giving CO2 and NH4+ and NO3− ions [42]. In
contrast, Fe(III)-oxalate is rapidly photocarboxylated under solar radiation.
5. Conclusions
The SPEF process is the more potent technology for the treatment of organic
pollutants by EAOPs based on Fenton’s reaction chemistry using a gas-diffusion cathode
to generate H2O2, due to the synergistic action of generated hydroxyl radicals and solar
irradiation. In this paper, it has been demonstrated that SPEF can be viable at industrial
level using an autonomous solar pre-pilot plant. It contained a Pt/air-diffusion filter-press
cell coupled to a solar CPCs photoreactor and a maximum average current of 5.0 A was
applied by a solar photovoltaic panel, thereby making the process energetically
inexpensive. The degradation of DY4 diazo dye performed with this plant showed that
0.5 mmol dm-3 Fe2+ was optimal as catalyst concentration yielding almost total
mineralization. However, greater percentage of color removal was found at lower Fe2+
contents probably because of the smaller formation of complexes of Fe(III) with colored
conjugated products that are more difficultly oxidized with •OH. The decrease in current
produced less oxidizing agents giving slower decolorization, decay of substrate
concentration and mineralization, although it increased the current efficiency as a result
of the deceleration of the parasitic reactions of •OH. The current efficiency also grew with
raising dye concentration at the end of the treatment when DOC was reduced by 96-97%.
Under all the conditions tested, the substrate decay obeyed a pseudo-first-order kinetics.
Eleven aromatic intermediates and twenty two hydroxylated derivatives coming from the

Results and Discussion
����
consecutive breaking of the two azo bonds and the deamination, desulfonation,
hydroxylation, nitration and carboxylation of the benzenic groups of DY4 were detected
by LC-MS. Nine short-linear carboxylic acids were quantified by ion-exclusion HPLC.
The Fe(III) complexes of most acids were rapidly removed by the attack of •OH and pre-
eminently photolyzed by sunlight, except those of acetic and oxamic acids that were
slowly destroyed by these agents. The initial N of the dye was mainly released as NH4+
ion, whereas its initial S was lost as SO42− ion.
Acknowledgements
The authors are grateful to the financial support from MICINN (Ministerio de Ciencia
e Innovación, Spain) under the project CTQ2010-16164/BQU, co-financed with FEDER
funds. S. Garcia-Segura thanks the grant awarded from MEC (Ministerio de Educación y
Ciencia, Spain).
References
[1] C.A. Martínez-Huitle, S. Ferro, Electrochemical oxidation of organic pollutants
for the wastewater treatment: direct and indirect processes, Chemical Society
Review 35 (2006) 1324.
[2] C.A. Martínez-Huitle, E. Brillas, Electrochemical alternatives for drinking water
disinfection, Angewandte Chemie International Edition 47 (2008) 1998.
[3] A. Anglada, A. Urtiaga, I. Ortiz, Contributions of electrochemical oxidation to
wastewater treatment: Fundamentals and review of applications, Journal of
Chemical Technology and Biotechnology 84 (2009) 1747.
[4] M. Panizza, G. Cerisola, Direct and mediated anodic oxidation of organic
pollutants, Chemical Reviews 109 (2009) 6541.

Results and Discussion �
����
[5] E. Brillas, I. Sirés, M.A. Oturan, Electro-Fenton process and related
electrochemical technologies based on Fenton’s reaction chemistry, Chemical
Reviews 109 (2009) 6570.
[6] I. Sirés, E. Brillas, Remediation of water pollution caused by pharmaceutical
residues based on electrochemical separation and degradation technologies: A
review, Environment International 40 (2012) 212.
[7] B. Marselli, J. García-Gomez, P.A. Michaud, M.A. Rodrigo, Ch. Comninellis,
Electrogeneration of hydroxyl radicals on boron-doped diamond electrodes,
Journal of The Electrochemical Society 150 (2003) D79.
[8] C. Flox, J.A. Garrido, R.M. Rodríguez, F. Centellas, P.L. Cabot, C. Arias, E.
Brillas, Degradation of 4,6-dinitro-o-cresol from water by anodic oxidation with
a boron-doped diamond electrode, Electrochimica Acta 50 (2005) 3685.
[9] S. Ammar, R. Abdelhedi, C. Flox, C. Arias, E. Brillas, Electrochemical degradation
of the dye indigo carmine at boron-doped diamond anode for wastewaters
remediation, Environmental Chemistry Letters 4 (2006) 229.
[10] J. Gao, G. Zhao, M. Liu, D. Li, Mechanism of enhanced electrochemical oxidation
of 2,4-dichlorophenoxyacetic acid with in situ microwave activated boron-doped
diamond and platinum anodes, Journal of Physical Chemistry A 113 (2009)
10466.
[11] A.R. Khataee, M. Safarpour, M. Zarei, S. Aber, Electrochemical generation of
H2O2 using immobilized carbon nanotubes on graphite electrode fed with air:
Investigation of operational parameters, Journal of Electroanalytical Chemistry
169 (2011) 63.
[12] A. Özcan, Y. Sahin, A.S. Koparal, M.A. Oturan, Carbon sponge as a new material
for the electro-Fenton process. Comparison with carbon felt cathode and application

Results and Discussion
���
to degradation of synthetic dye Basic Blue 3 in aqueous medium, Journal of
Electroanalytical Chemistry 616 (2008) 71.
[13] K. Cruz-González, O. Torres-López, A. García-León, J.L. Guzmán-Mar, L.H.
Reyes, A. Hernández-Ramírez, J.M. Peralta-Hernández, Determination of
optimum operating parameters for Acid Yellow 36 decolorization by electro-
Fenton process using BDD cathode, Chemical Engineering Journal 160 (2010)
199.
[14] M. Panizza, M.A. Oturan, Degradation of Alizarin Red by electro-Fenton process
using a graphite-felt cathode, Electrochimica Acta 56 (2011) 7084.
[15] E.J. Ruiz, C. Arias, E. Brillas, A. Hernández-Ramírez, J.M. Peralta-Hernández,
Mineralization of Acid Yellow 36 azo dye by electro-Fenton and solar
photoelectro-Fenton processes with a boron-doped diamond anode,�Chemosphere
82 (2011) 495.
[16] S. Garcia-Segura, J.A. Garrido, R.M. Rodríguez, P.L. Cabot, F. Centellas, C.
Arias, E. Brillas, Mineralization of flumequine in acidic medium by electro-
Fenton and photoelectro-Fenton processes, Water Research 46 (2012) 2067.
[17] A. Dirany, I. Sirés, N. Oturan, A. Özcan, M.A. Oturan, Electrochemical treatment
of the antibiotic sulfachloropyridazine: Kinetics, reaction pathways, and toxicity
evolution, Environmental & Science Technology 46 (2012) 4074.
[18] J.M. Peralta-Hernández, Y. Meas-Vong, F.J. Rodriguez, T.W. Chapman, M.I.
Maldonado, L.A. Godinez, Comparison of hydrogen peroxide-based processes for
treating dye-containing wastewater: Decolorization and destruction of Orange II
azo dye in dilute solution, Dyes and Pigments 76 (2007) 656.

Results and Discussion �
���
[19] A. Wang, J. Qu, H. Liu, J. Ru, Mineralization of an azo dye Acid Red 14 by
photoelectro-Fenton process using an activated carbon fiber cathode, Applied
Catalysis B: Environmental 84 (2008) 393.
[20] A. Dhaouadi, N. Adhoum, Degradation of paraquat herbicide by electrochemical
advanced oxidation methods, Journal of Electroanalytical Chemistry 637 (2009)
33.
[21] M. Zarei, A.R. Khataee, R. Ordikhani-Seyedlar, M. Fathinia, Photoelectro-Fenton
combined with photocatalytic process for degradation of an azo dye using
supported TiO2 nanoparticles and carbon nanotube cathode: Neural network
modeling, Electrochimica Acta 55 (2010) 7259.
[22] A. Babuponnusami, K. Muthukumar, Advanced oxidation of phenol: A
comparison between Fenton, electro-Fenton, sono-electro-Fenton and photo-
electro-Fenton processes, Chemical Engineering Journal 183 (2012) 1.
[23] R. Salazar, M.S. Ureta-Zañartu, Mineralization of triadimefon fungicide in water
by electro-Fenton and photoelectro-Fenton, Water Air Soil Pollution 223 (2012)
4199.
[24] C. Flox, J.A. Garrido, R.M. Rodríguez, P.L. Cabot, F. Centellas, C. Arias, E.
Brillas, Mineralization of herbicide mecoprop by photoelectro-Fenton with UVA
and solar light, Catalysis Today 129 (2007) 29.
[25] C. Flox, P.L. Cabot, F. Centellas, J.A. Garrido, R.M. Rodríguez, C. Arias, E.
Brillas, Solar photoelectro-Fenton degradation of cresols using a flow reactor with
a boron-doped diamond anode, Applied Catalysis B: Environmental 75 (2007) 17.
[26] E. Guinea, C. Arias, P.L. Cabot, J.A. Garrido, R.M. Rodríguez, F. Centellas, E.
Brillas, Mineralization of salicylic acid in acidic aqueous medium by
electrochemical advanced oxidation processes using platinum and boron-doped

Results and Discussion
����
diamond as anode and cathodically generated hydrogen peroxide, Water Research
42 (2008) 499.
[27] M. Skoumal, R.M. Rodríguez, P.L. Cabot, F. Centellas, J.A. Garrido, C. Arias, E.
Brillas, Electro-Fenton, UVA photoelectro-Fenton and solar photoelectro-Fenton
degradation of the drug ibuprofen in acid aqueous medium using platinum and
boron-doped diamond anodes, Electrochimica Acta 54 (2009) 2077.
[28] E. Guinea, J.A. Garrido, R.M. Rodríguez, P.L. Cabot, C. Arias, F. Centellas, E.
Brillas, Degradation of the fluoroquinolone enrofloxacin by electrochemical
advanced oxidation processes based on hydrogen peroxide electrogeneration,
Electrochimica Acta 55 (2010) 2101.
[29] S. Garcia-Segura, E.B. Cavalcanti, E. Brillas, Mineralization of the antibiotic
chloramphenicol by solar photoelectro-Fenton. From stirred tank reactor to solar
pre-pilot plant, Applied Catalysis B: Environmental 144 (2014) 588.
[30] A. Serra, X. Domènech, C. Arias, E. Brillas, J. Peral, Oxidation of α-
methylphenylglycine under Fenton and electro-Fenton conditions in the dark and
in the presence of solar light, Applied Catalysis B: Environmental 89 (2009) 12.
[31] F.C. Moreira, S. Garcia-Segura, V.J.P. Vilar, R.A.R. Boaventura, E. Brillas,
Decolorization and mineralization of Sunset Yellow FCF azo dye by anodic
oxidation, electro-Fenton, UVA photoelectro-Fenton and solar photoelectro-
Fenton processes, Applied Catalysis B: Environmental 142–143 (2013) 877.
[32] E.J. Ruiz, A. Hernández-Ramírez, J.M. Peralta-Hernández, C. Arias, E. Brillas,
Application of solar photoelectro-Fenton technology to azo dyes mineralization:
Effect of current density, Fe2+ and dye concentration, Chemical Engineering
Journal 171 (2011) 385.

Results and Discussion �
����
[33] R. Salazar, S. Garcia-Segura, M.S. Ureta-Zañartu, E, Brillas, Degradation of
disperse azo dyes from waters by solar photoelectro-Fenton, Electrochimica Acta
56 (2011) 6371.
[34] R. Salazar, E. Brillas, I. Sirés, Finding the best Fe2+/Cu2+ combination for the solar
photoelectro-Fenton treatment of simulated wastewater containing the industrial
textile dye Disperse Blue 3, Applied Catalysis B: Environmental 115-116 (2012)
107.
[35] A. El-Ghenymy, S. Garcia-Segura, R.M. Rodríguez, E. Brillas, M.S. El Begrani,
B.A. Abdelouahid, Optimization of the electro-Fenton and solar photoelectro-
Fenton treatments of sulfanilic acid solutions using a pre-pilot flow plant by
response surface methodology, Journal of Hazardous Materials 221–222 (2012)
288.
[36] A. El-Ghenymy, P.L. Cabot, F. Centellas, J.A. Garrido, R.M. Rodríguez, C. Arias,
E. Brillas, Mineralization of sulfanilamide by electro-Fenton and solar
photoelectro-Fenton in a pre-pilot plant with a Pt/air-diffusion cell, Chemosphere
91 (2013) 1324.
[37] E. Isarain-Chávez, R.M. Rodríguez, P.L. Cabot, F. Centellas, C. Arias, J.A.
Garrido, E. Brillas, Degradation of pharmaceutical beta-blockers by
electrochemical advanced oxidation processes using a flow plant with a solar
compound parabolic collector, Water Research 45 (2011) 4119.
[38] S. Garcia-Segura, L.C. Almeida, N. Bocchi, E. Brillas, Solar photoelectro-Fenton
degradation of the herbicide 4-chloro-2-methylphenoxyacetic acid optimized by
response surface methodology, Journal of Hazardous Materials 194 (2011) 109.
[39] L.C. Almeida, S. Garcia-Segura, N. Bocchi, E. Brillas, Solar photoelectro-Fenton
degradation of paracetamol using a flow plant with a Pt/air-diffusion cell coupled

Results and Discussion
����
with a compound parabolic collector: Process optimization by response surface
methodology, Applied Catalysis B: Environmental 103 (2011) 21.
[40] S. Hammami, N. Bellakhal, N. Oturan, M.A. Oturan, M. Dachraoui, Degradation
of Acid Orange 7 by electrochemically generated •OH radicals in acidic aqueous
medium using a boron-doped diamond or platinum anode. A mechanistic study,
Chemosphere 7 (2008) 678.
[41] R. Roots, S. Okada, Estimation of life times and diffusional distances of radical
involved X-Ray-Induced DNA strand breaks or killing of mammalian cells,
Radiation Research 64 (1975) 306.
[42] S. Garcia-Segura, E. Brillas, Mineralization of the recalcitrant oxalic and oxamic
acids by electrochemical advanced oxidation processes using a boron-doped
diamond anode, Water Research 45 (2011) 2975.

Results and Discussion �
����
Figure captions
Fig. 1. Sketch of the autonomous solar pre-pilot plant used for the solar photoelectro-
Fenton (SPEF) treatment of 10 dm3 of Direct Yellow 4 (DY4) solutions. (1) Reservoir,
(2) magnetic drive centrifugal pump, (3) flowmeter, (4) air pump, (5) electrochemical
filter-press reactor with a Pt anode and an air-diffusion cathode of 90.2 cm2 area, (6) solar
photovoltaic panel of 50 W maximum power with the corresponding ammeter and
voltmeter, (7) solar compound parabolic components (CPCs) photoreactor of 1.57 dm3
irradiation volume and (8) heat exchangers.
Fig. 2. Effect of Fe2+ concentration on (a) percentage of color removal, (b) substrate decay
and (c) DOC abatement for the SPEF degradation of 10 dm3 of a 0.16 mmol dm-3 DY4
solution in 0.05 mol dm-3 Na2SO4 at pH 3.0 and 35 ºC using the autonomous solar pre-
pilot plant at an average current of 5.0 A and liquid flow rate of 200 dm3 h-1. Fe2+
concentration: (�) 0.25 mmol dm-3, (�) 0.50 mmol dm-3, (�) 2.0 mmol dm-3 and (�) 5.0
mmol dm-3. In plot (b), the inset panel shows the kinetic analysis considering a pseudo-
first-order decay for the dye.
Fig. 3. Influence of current over (a) decolorization efficiency, (b) dye abatement and (c)
DOC removal for the treatment of 10 dm3 of a 0.16 mmol dm-3 DY4 solution in 0.05 mol
dm-3 Na2SO4 with 0.50 mmol dm-3 Fe2+ at pH 3.0 and 35 ºC by SPEF in the autonomous
solar pre-pilot plant at a liquid flow rate of 200 dm3 h-1. Average applied current: (�) 3.0
A and (�) 5.0 A. In plot (b), the inset panel presents the kinetic analysis assuming a
pseudo-first-order reaction for DY4. In plot (c), the inset panel gives the corresponding
mineralization current efficiency.
Fig. 4. Effect of dye concentration on (a) percentage of color removal, (b) dye abatement
and (c) DOC removal for the SPEF treatment of 10 dm3 of DY4 solutions in 0.05 mol

Results and Discussion
����
dm-3 Na2SO4 at pH 3.0 and 35 ºC using the autonomous solar pre-pilot plant at an average
current of 5.0 A and liquid flow rate of 200 dm3 h-1. Initial dye content: (�) 0.08 mmol
dm-3, (�) 0.16 mmol dm-3, (�) 0.24 mmol dm-3 and (�) 0.32 mmol dm-3. The inset panels
show: (b) the analysis assuming a pseudo-first-order kinetics for DY4 and (c) the
mineralization current efficiency.
Fig. 5. Time course of (�) maleic (13), (�) malic (14), (�) tartronic (15), (�) malonic
(16), (�) glycolic (17), (�) acetic (18), (�) oxalic (19), (�) formic (20) and (�) oxamic
(21) acids detected during the SPEF degradation of 10 dm3 of a 0.16 mmol dm-3 DY4
solution in 0.05 mol dm-3 Na2SO4 with 0.50 mmol dm-3 Fe2+ at pH 3.0 and 35 ºC using
the autonomous solar pre-pilot plant at an average current of 5.0 A and liquid flow rate
of 200 dm3 h-1.
Fig. 6. Evolution of inorganic ions released during the trial of Fig. 5. In plot (a), nitrogen
concentration for: (�) NH4+ and (�) NO3− ions. In plot (b), (�) SO4
2− concentration.
Fig. 7. Proposed reaction pathway for DY4 mineralization by SPEF.

Results and Discussion �
����
Fig. 1
��
��
�� ��
��
�
�
��

Results and Discussion
����
Fig. 2
0
20
40
60
80
100
120
0 30 60 90 120 150
% C
olor
rem
oval
0.00
0.05
0.10
0.15
0.20
0 30 60 90 120 150
[DY
4] /
mm
ol d
m-3
0
1
2
3
4
5
0 10 20 30 40 50
ln (c
0/c)
Time / min
0
10
20
30
40
50
60
0 60 120 180 240 300
DO
C /
mg
dm-3
Time / min
(a)
(b)
(c)

Results and Discussion �
����
Fig. 3
0
20
40
60
80
100
120
0 20 40 60 80 100 120
% C
olor
rem
oval
0.00
0.05
0.10
0.15
0.20
0 10 20 30 40 50
[DY
4] /
mm
ol d
m-3
0
1
2
3
4
5
0 10 20 30 40
ln (c
0/c)
Time / min
(a)
(b)
0
10
20
30
40
50
60
0 60 120 180 240 300
DO
C /
mg
dm-3
Time / min
(c)
0
10
20
30
40
50
60
0 60 120 180 240 300
% M
CE
Time / min

Results and Discussion
���
Fig. 4
0
20
40
60
80
100
120
0 20 40 60 80 100
% C
olor
rem
oval
(a)
0.00
0.05
0.10
0.15
0.20
0.25
0.30
0.35
0 10 20 30 40 50 60 70
[DY
4] /
mm
ol d
m-3
(b)
0
1
2
3
4
5
0 10 20 30 40
ln (c
0/c)
Time / min
0
20
40
60
80
100
120
0 60 120 180 240 300Time / min
DO
C /
mg
dm-3
0
10
20
30
40
50
60
0 60 120 180 240 300
% M
CE
Time / min
(c)

Results and Discussion �
���
Fig. 5
0
5
10
15
20
25
0
2
4
6
0 60 120 180 240 300
Time / min
� ����
������������ ������
���

Results and Discussion
����
Fig. 6
0
1
2
3
4
5
6[I
norg
anic
nitr
ogen
] / m
g dm
-3
0
5
10
15
20
25
30
0 60 120 180 240 300
[SO
42 −] /
mg
dm-3
Time / min
(a)
(b)

Results and Discussion �
�����
Fig. 7
�ν� �ν�
−�����−���
−�
−���2−�
�
−���2−�
−���2−�
−�����
−���−�
Results and Discussion
�����
Table 1.
Chemical structure and characteristics of Direct Yellow 4 (DY4) diazo dye.
Chemical structure
Chemical formula Na2C26H18N4O8S2
Chemical name Disodium 5-[2-(4-oxocyclohexa-2,5-dien-1-ylidene)hydrazinyl]-2-[(E)-2-[4-[2-(4-oxocyclohexa-2,5-dien-1-ylidene)hydrazinyl]-2-sulphonatophenyl]ethenyl]benzenesulfonate
Color index name Direct Yellow 4
Commercial names Brilliant Yellow, Paper Yellow CB, Fenamin Yellow, Tetrodirect Yellow B
Color index number 24890
λmax (nm) 400
M (g mol-1) 624.55
Applied material Cellulosa fiber, polyamide fiber, leather, paper color

Results and Discussion �
�����
Table 2.
Aromatic compounds and hydroxylated derivatives identified by LC–MS in negative
mode during the SPEF treatment of 10 dm3 of a 0.16 mmol dm-3 DY4 solution using an
autonomous solar pre-pilot plant with a Pt/air-diffusion cell coupled to a CPCs
photoreactor at average current of 5.0 A provided by a solar photovoltaic panel.
Compound Molecular formula Number of –OH added
m/z
DY4 (1) Given in Table 1 -- 1 2 5 6
289a
297a
305a
329a
337a
2 1 3 5 8
10
245a
261a
277a
301a
317a
3 4 523b
4 -- 314b
5 -- 1
299b
315b
6 -- 1 3 4
197b
213b
245b
261b
7 -- 1 2
195b
211b
227b
8 5 6 7
209a
217a
225a
��
��
��

Results and Discussion
�����
9 -- 232b
10 -- 204b
11 -- 1
189b
205b
12 -- 2 5
139b
171b
203b
Negative ions with z: a 2 or b 1.

Results and Discussion �
�����

Results and Discussion
�����
PAPER 8
Mineralization of phthalic acid by solar
photoelectro-Fenton with a stirred
boron-doped diamond/air-diffusion tank
reactor: Influence of Fe3+ and Cu2+
catalysts and identification of oxidation
products

Results and Discussion �
�����

Electrochimica Acta 113 (2013) 609– 619
Contents lists available at ScienceDirect
Electrochimica Acta
jo u r n al hom ep age: www.elsev ier .com/ locate /e lec tac ta
Mineralization of phthalic acid by solar photoelectro-Fenton with a
stirred boron-doped diamond/air-diffusion tank reactor: Influence of
Fe3+ and Cu2+ catalysts and identification of oxidation products
Sergi Garcia-Seguraa, Ricardo Salazarb,1, Enric Brillasa,∗,1
a Laboratori d’Electroquímica dels Materials i del Medi Ambient, Departament de Química Física, Facultat de Química, Universitat de Barcelona, Martí i
Franquès 1-11, 08028 Barcelona, Spainb Departamento de Ciencias del Ambiente, Facultad de Química y Biología, Universidad de Santiago de Chile, USACh, Casilla 40, Correo 33, Santiago, Chile
a r t i c l e i n f o
Article history:
Received 24 July 2013
Received in revised form
14 September 2013
Accepted 16 September 2013
Available online xxx
Keywords:
Electro-Fenton
Oxidation products
Phthalic acid
Solar photoelectro-Fenton
Water treatment
a b s t r a c t
Here, the substrate decay and mineralization rate for 100 cm3 of a 2.0 mM phthalic acid solution in 0.10 M
Na2SO4 of pH 3.0 have been studied by electro-Fenton (EF) and solar photoelectro-Fenton (SPEF). The
electrochemical cell was a stirred tank reactor containing a 3 cm2 boron-doped diamond (BDD) anode
and a 3 cm2 air-diffusion cathode that generates H2O2. Cu2+ and/or Fe3+ were added as catalysts with total
concentration of 0.50 mM and a constant current density of 33.3 mA cm−2 was applied. In EF with Cu2+ or
Fe3+ alone and SPEF with only Cu2+, phthalic acid decayed slowly and poor mineralization was reached
because the main oxidant was •OH produced at the BDD surface from water oxidation. In contrast, the
substrate destruction was largely enhanced using SPEF with 0.50 mM Fe3+ since a high quantity of oxidant•OH was produced in the bulk induced by photo-Fenton reaction. This treatment led to an almost total
mineralization by the photolysis of generated Fe(III)-carboxylate complexes. In all cases, the decay of
phthalic acid obeyed a pseudo-first-order reaction. The combination of Cu2+ and Fe3+ as catalysts accel-
erated the mineralization process in SPEF because Cu(II)-carboxylate complexes were also removed with•OH formed from photo-Fenton reaction. The best SPEF process was found for 0.125 mM Cu2+ + 0.375 mM
Fe3+, giving rise to 99% mineralization with 40% current efficiency and 0.294 kWh g−1 TOC energy con-
sumption. Eleven aromatics and six short-linear carboxylic acids were identified as oxidation products.
A plausible reaction sequence for phthalic acid mineralization involving all the detected products was
finally proposed.
© 2013 Elsevier Ltd. All rights reserved.
1. Introduction
Phthalic acid and phthalate derivatives are major industrial
materials used to manufacture plastic products like toys and
bottles, also being widely used as plasticizers, adhesives, films,
polymers, etc. However, some studies revealed that these com-
pounds could affect the male reproductive systems producing a
testicular atrophy [1] and alter the normal development of fetuses
in pregnant rats [2]. In view of these adverse effects on living
beings, the US Environmental Protection Agency (EPA) classi-
fied the phthalic acid and some industrial phthalates as priority
pollutants [3] and so, for example, the maximum admissible con-
tent in water for a common phthalic acid derivative such as the
∗ Corresponding author. Tel.: +34 934021223; fax: +34 934021231.
E-mail address: [email protected] (E. Brillas).1 ISE active member.
di(2-ethylhexyl)phthalate was established in 6 �g dm−3. Phthalic
acid has been detected in different matrices such as landfill leachate
water [4], surface water [5], sediments and even in atmospheric
aerosols and rainwater [6]. Wastewaters with high concentration
of phthalic acid and its derivatives are then produced, requiring
effective treatments before discharge to public serve.
Several authors have reported the removal of phthalic acid and
some of its esters by TiO2 photocatalysis [7], adsorption [8], coagu-
lation [9] and aerobic–anaerobic biodegradation [10,11]. However,
less is known about the destruction of these compounds by electro-
chemical technologies. Only complete degradation of 531 mg dm−3
phthalic acid solutions was recently described by means of ultra-
sound assisted electrochemical oxidation on boron-doped diamond
electrode after 10 h of treatment [12].
Over the last fifteen years, several electrochemical advanced
oxidation processes (EAOPs) based on Fenton’s reaction chem-
istry are being developed for water remediation [13,14]. These
methods are based on the continuous supply of H2O2 to an acidic
0013-4686/$ – see front matter © 2013 Elsevier Ltd. All rights reserved.http://dx.doi.org/10.1016/j.electacta.2013.09.097
197

610 S. Garcia-Segura et al. / Electrochimica Acta 113 (2013) 609– 619
contaminated solution from the two-electron cathodic reduction
of injected O2 gas by reaction (1) [13]:
O2(g) + 2H+ + 2e− → H2O2 (1)
Carbonaceous electrodes such as carbon nanotubes on graphite
[15], carbon nanotubes-polytetrafluoroethylene (PTFE) [16,17],
carbon-felt [18–22], carbon sponge [20], carbon-PTFE gas (O2
or air) diffusion electrodes [19,23–26], graphite-felt [27] and
boron-doped diamond (BDD) [28] have shown good efficiencies
for H2O2 generation from reaction (1).
The most common EAOP is electro-Fenton (EF) in which a small
catalytic amount of Fe2+ ion is added to the solution to react with
generated H2O2 producing Fe3+ ion and hydroxyl radical (•OH)
according to the classical Fenton’s reaction (2) [13]:
Fe2+ + H2O2 → Fe3+ + •OH + OH− (2)
•OH thus formed in the bulk is the second strongest oxidant known
after fluorine. The high standard reduction potential of this radical
(E◦(•OH/H2O) = 2.80 V/SHE) allows its reaction with most organ-
ics up to their mineralization to CO2, water and inorganic ions.
Reaction (2) can be propagated from the catalytic behavior of the
Fe2+/Fe3+ system, primordially involving Fe2+ regeneration from
the reduction of Fe3+ at the cathode via reaction (3) [13,19,20]:
Fe3+ + e− → Fe2+ (3)
The optimum solution pH for EF is 3.0, close to the optimum
value of 2.8 for Fenton’s reaction (1) [13], and its oxidation ability
for organic removal in waters is closely related to the rate of reac-
tion (3), which depends on the iron concentration and the kind of
cathode used. For example, optimum concentrations of 0.1–0.2 mM
Fe2+ or Fe3+ have been found using a carbon-felt cathode [18–20],
whereas either 0.5–1.0 mM Fe2+ or a much higher content of 4.0 mM
Fe3+ are optimal for O2 or air-diffusion electrodes [19,24,25] due
to their greater efficiency for H2O2 generation by reaction (1) and
smaller rate for reaction (3).
The use of an undivided cell with a high O2-overpotential anode
such as BDD in EF accelerates the degradation of organics since
they can also be slowly attacked by adsorbed hydroxyl radical
(BDD(•OH)) formed as intermediate of the anodic water discharge
[29,30]:
BDD + H2O → BDD(•OH) + H+ + e− (4)
The BDD anode is better than other typical electrodes like Pt and
PbO2 because it generates BDD(•OH) radicals with greater oxida-
tion ability due to its higher O2-overpotential [31–33], improving
the destruction of aromatics and their generated carboxylic acids
[13,34–36]. Moreover, the electrogenerated H2O2 is partly oxidized
to O2 at the anode producing the weaker oxidant hydroperoxyl
radical (HO2•) as intermediate [13].
An alternative EAOP is photoelectro-Fenton (PEF) which
includes the simultaneous irradiation of the treated solution by EF
either with a UV lamp or with inexpensive and renewable sunlight
(� > 300 nm), so-called solar PEF (SPEF). The catalytic action of UV
light from both sources can be explained by two main processes
[23–26,37–42]: (i) the photoreduction of Fe(OH)2+, the predomi-
nant Fe3+ species at pH near 3, by photo-Fenton reaction (5) with
Fe2+ regeneration and production of more •OH and (ii) the quick
photolysis of Fe(III) complexes with generated carboxylic acids
according to reaction (6):
Fe(OH)2+ + h� → Fe2+ + •OH (5)
Fe(OOCR)2+ + h� → Fe2+ + CO2 + R• (6)
It has been found that SPEF is more potent than PEF with an
artificial UVA lamp because the greater intensity of UVA and UVB
of sunlight photodecomposes more rapidly the generated Fe(III)-
carboxylate complexes by reaction (6). However, the role of photo-
Fenton reaction (5) in the degradation process is less apparent due
to the introduction of Fe2+ as catalyst that allows a large production
of •OH in the bulk from Fenton’s reaction (2).
In previous work, we have checked the synergistic action of
adding small amounts of Cu2+ ion as co-catalyst of Fe2+ ion in the
EF, PEF and SPEF processes of several aromatics [23,37,40]. This was
attributed to: (i) the contribution of the Cu2+/Cu+ couple to •OH
production and/or (ii) the formation of Cu(II)-carboxylate species
that are more easily oxidized than the corresponding Fe(III) com-
plexes. In the SPEF treatment of the dye Disperse Blue 3 by SPEF
with Fe2+ and Cu2+ as catalysts [40], phthalic acid and some phtha-
late esters were detected as intermediates of the mineralization
process, suggesting that this EAOP could be useful for the removal
of these pollutants.
This paper presents a comparative study on the mineralization
of a phthalic acid solution of pH 3.0 by EF and SPEF with Fe3+ and/or
Cu2+ as catalysts using a stirred BDD/air-diffusion tank reactor.
Small amounts of Fe3+ were directly added for obtaining a very
slow production of •OH from Fenton’s reaction (2) in EF, because
of the slow Fe2+ regeneration at the air-diffusion cathode [19]. In
this EAOP, BDD(•OH) formed from reaction (4) is expected to be the
main oxidizing agent since the rate of organic pollutants with •OH
is low. In this way and for the first time, the oxidant •OH formed
in the SPEF process is primordially induced by photo-Fenton reac-
tion (5) under the action of sunlight. The generation of increasing
oxidizing agents in these EAOPs allowed a better interpretation of
the role of Cu2+ alone or combined with Fe3+ over their perfor-
mance. Our interest in Cu2+ is the possible future use of SPEF at
industrial scale, which is economically interesting for Chile as the
leading producer of copper in the world [43]. The decay kinetics
for the substrate and its mineralization rate and degree were then
examined as a function of catalyst content. Aromatic intermedi-
ates were detected by liquid chromatography–mass spectrometry
(LC–MS) and generated short-linear carboxylic acids were quanti-
fied by HPLC. From these results, a plausible reaction pathway for
phthalic acid mineralization is proposed.
2. Experimental
2.1. Chemicals
Analytical grade phthalic acid was purchased from Lancaster.
Pyruvic, maleic, tartronic, succinic, acrylic and oxalic acids were
of analytical grade supplied by Panreac and Avocado. Anhydrous
sodium sulphate, used as background electrolyte, was of analytical
grade purchased from Fluka. Hydrated Fe(III) sulfate and pentahy-
drated Cu(II) sulfate, used as catalysts, were of analytical grade
supplied by Probus and Panreac, respectively. Organic solvents and
other chemicals employed were of LC–MS, HPLC or analytical grade
purchased from Teknokroma, Merck and Sigma–Aldrich. All solu-
tions were prepared with ultrapure water obtained from a Millipore
Milli-Q system with resistivity >18 M� cm at 25 ◦C. The solution pH
was adjusted to 3.0 with analytical grade sulfuric acid purchased
from Merck.
2.2. Electrolytic system
All the electrolytic trials were conducted in an open, undi-
vided and cylindrical cell of 150 cm3 capacity, with a double jacket
in which external water was circulated to maintain the solution
temperature at 35 ◦C. This temperature was chosen because it is
the maximum value that can be used in the cell without signifi-
cant water evaporation from the solution [44]. The anode was a
198

S. Garcia-Segura et al. / Electrochimica Acta 113 (2013) 609– 619 611
BDD thin-film electrode purchased from Adamant Technologies
and synthesized by the hot filament chemical vapor deposition
technique on single-crystal p-type Si(100) wafers. The cathode
was a carbon-PTFE air-diffusion electrode supplied by E-TEK,
mounted as described elsewhere [23] and fed with air pumped at
300 cm3 min−1 to generate H2O2 from reaction (1). The area of both
electrodes was 3 cm2 and the interelectrode gap was about 1 cm.
All the experiments were performed at constant current density
provided by an Amel 2051 potentiostat-galvanostat. The solutions
were always vigorously stirred with a magnetic bar at 800 rpm to
ensure mixing and the transport of reactants toward/from the elec-
trodes. To remove the impurity of the BDD surface and activate the
air-diffusion cathode, they were previously polarized in 100 cm3 of
a 0.05 M Na2SO4 solution at 100 mA cm−2 for 60 min.
Comparative EF (in the dark) and SPEF degradations of 100 cm3
of 2.0 mM phthalic acid solutions (corresponding to 192 mg dm−3 of
total organic carbon (TOC)) in 0.10 M Na2SO4 at pH 3.0 were made
at 33.3 mA cm−2 and 35 ◦C with a total Cu2+ + Fe3+ concentration
of 0.50 mM. Similar electrolysis under anodic oxidation with elec-
trogenerated H2O2 (AO-H2O2) without catalyst addition was also
made. In SPEF, the solution was irradiated with direct sunlight in
sunny and clear summer days in our laboratory of Barcelona, Spain
(latitude: 41◦21′ N, longitude: 2◦10′ E). The average solar UV radi-
ation intensity (between 300 and 400 nm) was about 31 W m−2, as
measured with a Kipp & Zonen CUV 5 global UV radiometer.
2.3. Apparatus and analytical procedures
The solution pH was measured with a Crison GLP 22 pH-meter.
Samples withdrawn from electrolyzed solutions were neutralized
at pH 7–8 to stop the degradation process and filtered with 0.45 �m
PTFE filters from Whatman before analysis.
The phthalic acid decay and the evolution of generated short-
linear carboxylic acids were followed by ion-exclusion HPLC
using a Waters 600 LC fitted with a Bio-Rad Aminex HPX 87H,
300 mm × 7.8 mm, column at 35 ◦C and coupled to a Waters 996
photodiode array detector selected at � = 210 nm. For these anal-
yses, 20 �L aliquots were injected into the LC and 4 mM H2SO4 at
0.6 cm3 min−1 circulated as mobile phase. The retention time was
7.0 min for oxalic acid, 7.9 min for tartronic acid, 8.2 min for maleic
acid, 9.2 min for pyruvic acid, 11.7 min for succinic acid, 18.4 min
for acrylic acid and 28.3 min for phthalic acid.
The mineralization of phthalic acid solutions was monitored
from their TOC abatement, determined on a Shimadzu TOC-VCSN
analyzer. Reproducible TOC values with an accuracy of ±1% were
obtained by injecting 50 �L aliquots into the analyzer. Taking into
account that the mineralization process for phthalic acid involves
its conversion into CO2 by reaction (7):
C8H6O4 + 12H2O → 8CO2 + 30H+ + 30 e− (7)
the mineralization current efficiency (MCE) for each trial at elec-
trolysis time t (in h) was then estimated by Eq. (8) [25]:
MCE(%) = n F Vs�(TOC)exp
4.32 × 10⁷ m I t× 100 (8)
where n is the number of electrons consumed per each phthalic
acid molecule (30, from reaction (7)), F is the Faraday constant
(96,487 C mol−1), Vs is the solution volume (0.1 dm3), �(TOC)exp is
the experimental TOC decay (in mg dm−3), 4.32 × 10⁷ is a conver-
sion factor to homogenize units (3600 s h−1 × 12,000 mg mol−1), m
is the number of carbon atoms of phthalic acid (8 carbon atoms)
and I is the applied current (0.1 A). The corresponding energy
0.0
0.5
1.0
1.5
2.0
2.5
0 30 60 90 12 0 15 0 180 21 0 24 0 270
[Pht
halic
aci
d] /
mm
ol d
m-3
Time / mi n
0
1
2
3
4
0 30 60 90 120 150 18 0
ln (c
0/c)
Time / min
Fig. 1. Decay of phthalic acid concentration with electrolysis time for the treatment
of 100 cm3 of 2.0 mM substrate solutions in 0.10 M Na2SO4 at pH 3.0 and 35 ◦C using
a stirred BDD/air-diffusion tank reactor of 3 cm2 electrode area at 33.3 mA cm−2. (�)
Anodic oxidation with electrogenerated H2O2 (AO-H2O2), (©) electro-Fenton (EF)
with 0.50 mM Fe3+, (�) EF with 0.50 mM Cu2+, (�) solar photoelectro-Fenton (SPEF)
with 0.50 mM Fe3+ and (�) SPEF with 0.50 mM Cu2+. The inset panel presents the
corresponding kinetic analysis assuming that phthalic acid follows a pseudo-first-
order reaction.
consumption per unit TOC mass removed (ECTOC) was calculated
as follows [38,39]:
ECTOC(kWh g−1TOC) = Ecell I t
Vs�(TOC)exp
(9)
where Ecell is the average potential difference of the BDD/air-
diffusion cell (13.9 V).
Aromatic derivatives produced after 10–20 min of the SPEF
treatment of a 2.0 mM phthalic acid solution with 0.125 mM
Cu2+ + 0.375 mM Fe3+ in a stirred BDD/air-diffusion tank reactor at
33.3 mA cm−2 were analyzed by LC–MS using a Shimadzu SIL-20AC
LC coupled to a Shimadzu LCMS-2020 MS. The LC was fitted with a
Teknokroma Mediterranea Sea C-18 3 �m, 15 mm × 0.46 mm, col-
umn at 30 ◦C. The MS operated in the negative and positive modes
with electrospray source ionization (ESI), using an interface volt-
age of −4.5 and 4.5 kV, respectively, and 60 V Q-array RF voltage.
The DL temperature was 250 ◦C and pure N2 was used as neb-
ulysing and dryer gas. Mass spectra were collected in the m/z range
50–420 using total ion current (TIC) acquisition and finally, they
were also recorded under selected-ion monitoring (SIM) acquisi-
tion. For these analyses, 15 �L aliquots were introduced into the
LC, previously filtered with a Millipore filter of 0.22 �m, and the
mobile phase was a 75:25 (v/v) acetonitrile/water (5.0 mM ammo-
nium acetate) mixture at 0.2 cm3 min−1.
3. Results and discussion
3.1. Degradation of phthalic acid by electro-Fenton and solar
photoelectro-Fenton with Fe3+ or Cu2+
Solutions with 2.0 mM phthalic acid and 0.10 mM Na2SO4 in the
presence of either 0.50 mM Cu2+ or 0.50 mM Fe3+ were degraded
by EF and SPEF at pH 3.0 and current density of 33.3 mA cm−2 for
240 min. It is well-known that this compound forms complexes
with both Cu2+ [45] and Fe3+ [46] ions and consequently, phthalic
acid along with its Cu(II) or Fe(III) complexes was oxidized in these
assays. Previous blank experiments confirmed that all these species
are not photolyzed under the experimental conditions tested since
direct exposition of the above solutions to solar radiation did not
caused any removal of the substrate.
Fig. 1 depicts the decay of phthalic acid concentration for
the above trials. The solution pH remained practically unchanged
199

612 S. Garcia-Segura et al. / Electrochimica Acta 113 (2013) 609– 619
Table 1Pseudo-first-order rate constant and square of the linear regression coefficient
obtained for the phthalic acid decay in the AO-H2O2, EF and SPEF treatments of
100 mL of 2.0 mM compound solutions of pH 3.0 and 35 ◦C using a BDD/air-diffusion
cell at 33.3 mA cm−2.
Method [Cu2+] (mM) [Fe3+] (mM) k1 (10−4 s−1) R2
AO-H2O2 – – 1.9 0.998
EF 0.50 – 2.7 0.993
0.375 0.125 2.1 0.994
0.25 0.25 1.9 0.995
0.125 0.375 3.0 0.996
– 0.50 2.3 0.995
SPEF 0.50 – 2.4 0.993
0.375 0.125 3.5 0.991
0.25 0.25 3.6 0.992
0.125 0.375 5.9 0.986
– 0.50 13.4 0.996
during all the electrolyses, attaining a final pH near 2.7–2.8, proba-
bly due to the formation of acidic compounds. A quite similar decay
rate can be observed not only for EF and SPEF with 0.50 mM Cu2+ but
also for EF with 0.50 mM Fe3+. In all cases, phthalic acid disappeared
in 240 min. Fig. 1 also shows an analogous removal rate for the
comparative treatment of a 2.0 mM phthalic solution by AO-H2O2
without metal ions, where BDD(•OH) formed from reaction (4) is
the main oxidizing agent [13]. When Cu2+ is added to the medium,
Cu+ can be formed from Cu2+ reduction with HO2• at the BDD sur-
face by reaction (10) and subsequently oxidized with generated
H2O2 to Cu2+ and •OH by the Fenton-like reaction (11) [37,38,47]:
Cu2+ + HO2• → Cu+ + H+ + O2 (10)
Cu+ + H2O2 → Cu2+ + •OH + OH− (11)
However, our results evidence a very poor contribution of the
Cu2+/Cu+ couple to produce •OH from reactions (10)–(11) in both
EF and SPEF processes with Cu2+. Similarly, the Fe3+/Fe2+ pair also
yielded a little generation of •OH in EF due to the low rate of Fenton’s
reaction (2) as a result of the poor Fe3+ reduction at the air-diffusion
cathode from reaction (3) [19]. In all these processes, phthalic acid
and its Cu(II) or Fe(III) complexes then react primordially with
BDD(•OH).
The above concentration decays were analyzed by kinetic equa-
tions related to simple reaction orders, and good linear correlations
were found by using a pseudo-first-order reaction, as presented in
the inset panel of Fig. 1. The apparent constant rate (k1) and the
corresponding square of the linear regression coefficient (R2) thus
obtained are summarized in Table 1. As can be seen, analogous k1
values between 2.3 × 10⁻⁴ and 2.7 × 10⁻⁴ s−1 were found for EF and
SPEF with Cu2+ and EF with Fe3+, slightly higher than 1.9 × 10⁻⁴ s−1
obtained for AO-H2O2. This behavior suggests the oxidation of the
electroactive species with a constant amount of hydroxyl radical,
mainly BDD(•OH), in all these processes.
A different behavior can be observed in Fig. 1 when SPEF with
0.50 mM Fe3+ was applied. The abatement of phthalic acid was
strongly enhanced respect to the other processes, completely being
removed in about 50 min. This decay kinetic was also well fitted to a
pseudo-first-order reaction (see the inset panel of Fig. 1) giving rise
to a higher k1 value of 1.34 × 10⁻³ s−1 (see Table 1). This enhance-
ment can be related to the additional production of great amounts
of •OH under the action of photo-Fenton reaction (5) that yield Fe2+
concentrations high enough to largely propagate Fenton’s reaction
(2). This allows concluding that in the presence of small quantities
of Fe3+ as catalyst, the SPEF process is able to generate the oxidant•OH in the bulk primordially induced by photo-Fenton reaction (5).
0
50
100
150
200
TOC
/ m
g dm
-30
10
20
30
40
50
60
% M
iner
aliz
atio
n cu
rren
t eff
icie
ncy
0.0
0.1
0.2
0.3
0.4
0 30 60 90 12 0 15 0 180 21 0 24 0 270
Time / min
Ener
gy c
onsu
mpt
ion
(TO
C) /
kW
h g-1
(a)
(b)
(c)
Fig. 2. (a) TOC removal and change of (b) mineralization current efficiency and (c)
energy consumption per unit TOC mass for the degradation of 2.0 mM phthalic acid
solutions (corresponding to 192 mg dm−3 TOC) under the conditions of Fig. 1. (�) AO-
H2O2, (©) EF with 0.50 mM Fe3+, (�) EF with 0.50 mM Cu2+, (�) SPEF with 0.50 mM
Fe3+ and (�) SPEF with 0.50 mM Cu2+.
The positive action of sunlight using 0.50 mM Fe3+ was also
corroborated from the TOC abatement of electrolyzed solutions.
As can be seen in Fig. 2a, the EF treatments led to a continu-
ous, but slow reduction of TOC at similar rate for both metal ions
up to reach 73–75% mineralization after 240 min of electrolysis,
a time in which all phthalic acid already disappeared (see Fig. 1).
A similar TOC reduction of 71% was obtained for AO-H2O2. These
findings are indicative of the formation of oxidation products like
short-linear carboxylic acids that react more hardly with hydroxyl
radicals than the substrate, prolonging its degradation process. A
slightly quicker TOC removal up to a final value of 81% was found for
SPEF with 0.50 mM Cu2+, which can be associated with the parallel
photolysis of some intermediates that enhances the mineralization
rate of phthalic acid. In contrast, the SPEF process with 0.50 mM
Fe3+ allowed a much more rapid TOC decay yielding an almost
total mineralization (96% TOC removal) at 240 min, as expected if
some Fe(III)-carboxylate complexes are quickly photodecomposed
by solar radiation [13].
200
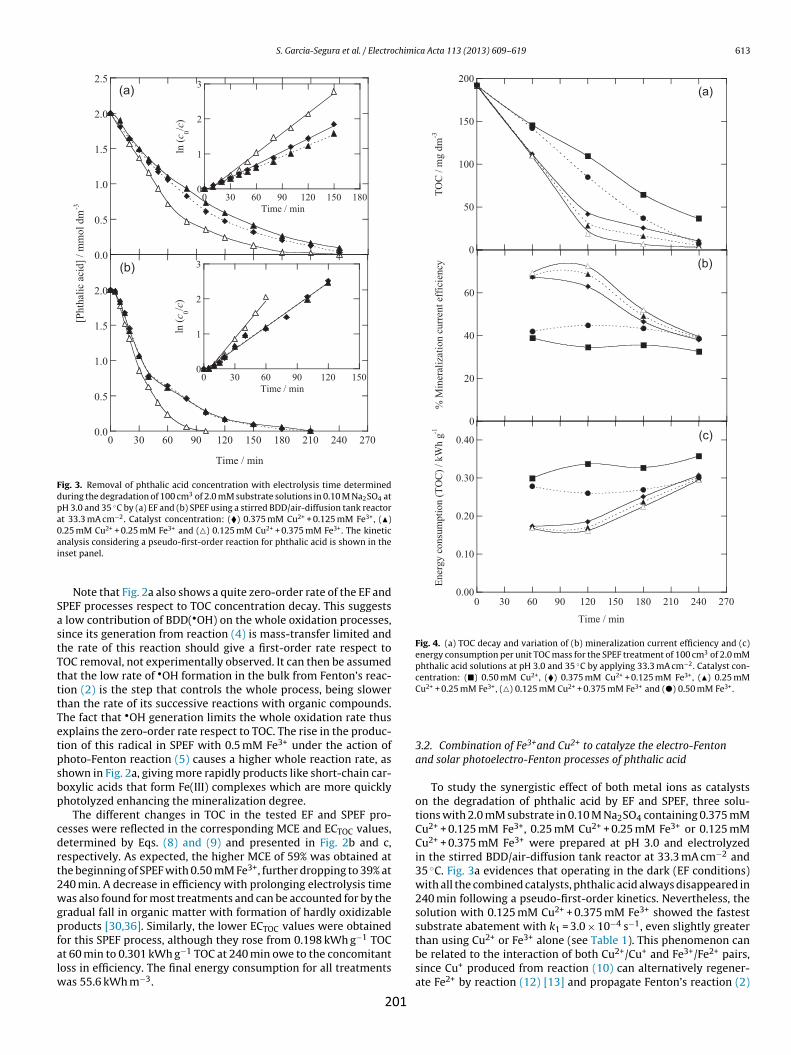
S. Garcia-Segura et al. / Electrochimica Acta 113 (2013) 609– 619 613
0.0
0.5
1.0
1.5
2.0
2.5
0
1
2
3
0 30 60 90 120 150 180Time / min
ln ( c
0/ c)
0.0
0.5
1.0
1.5
2.0
0 30 60 90 120 150 180 210 240 270
Time / mi n
0
1
2
3
0 30 60 90 12 0 15 0Time / min
ln (c
0/c)
[Pht
halic
aci
d] /
mm
ol d
m-3
(b)
(a)
Fig. 3. Removal of phthalic acid concentration with electrolysis time determined
during the degradation of 100 cm3 of 2.0 mM substrate solutions in 0.10 M Na2SO4 at
pH 3.0 and 35 ◦C by (a) EF and (b) SPEF using a stirred BDD/air-diffusion tank reactor
at 33.3 mA cm−2. Catalyst concentration: (�) 0.375 mM Cu2+ + 0.125 mM Fe3+, (�)
0.25 mM Cu2+ + 0.25 mM Fe3+ and (�) 0.125 mM Cu2+ + 0.375 mM Fe3+. The kinetic
analysis considering a pseudo-first-order reaction for phthalic acid is shown in the
inset panel.
Note that Fig. 2a also shows a quite zero-order rate of the EF and
SPEF processes respect to TOC concentration decay. This suggests
a low contribution of BDD(•OH) on the whole oxidation processes,
since its generation from reaction (4) is mass-transfer limited and
the rate of this reaction should give a first-order rate respect to
TOC removal, not experimentally observed. It can then be assumed
that the low rate of •OH formation in the bulk from Fenton’s reac-
tion (2) is the step that controls the whole process, being slower
than the rate of its successive reactions with organic compounds.
The fact that •OH generation limits the whole oxidation rate thus
explains the zero-order rate respect to TOC. The rise in the produc-
tion of this radical in SPEF with 0.5 mM Fe3+ under the action of
photo-Fenton reaction (5) causes a higher whole reaction rate, as
shown in Fig. 2a, giving more rapidly products like short-chain car-
boxylic acids that form Fe(III) complexes which are more quickly
photolyzed enhancing the mineralization degree.
The different changes in TOC in the tested EF and SPEF pro-
cesses were reflected in the corresponding MCE and ECTOC values,
determined by Eqs. (8) and (9) and presented in Fig. 2b and c,
respectively. As expected, the higher MCE of 59% was obtained at
the beginning of SPEF with 0.50 mM Fe3+, further dropping to 39% at
240 min. A decrease in efficiency with prolonging electrolysis time
was also found for most treatments and can be accounted for by the
gradual fall in organic matter with formation of hardly oxidizable
products [30,36]. Similarly, the lower ECTOC values were obtained
for this SPEF process, although they rose from 0.198 kWh g−1 TOC
at 60 min to 0.301 kWh g−1 TOC at 240 min owe to the concomitant
loss in efficiency. The final energy consumption for all treatments
was 55.6 kWh m−3.
0
50
100
150
200
TOC
/ m
g dm
-3
(a)
0
20
40
60
% M
iner
aliz
atio
n cu
rren
t eff
icie
ncy
0.00
0.10
0.20
0.30
0.40
0 30 60 90 12 0 15 0 180 21 0 24 0 270
Ener
gy c
onsu
mpt
ion
(TO
C) /
kW
h g-1
Time / mi n
(b)
(c)
Fig. 4. (a) TOC decay and variation of (b) mineralization current efficiency and (c)
energy consumption per unit TOC mass for the SPEF treatment of 100 cm3 of 2.0 mM
phthalic acid solutions at pH 3.0 and 35 ◦C by applying 33.3 mA cm−2. Catalyst con-
centration: (�) 0.50 mM Cu2+, (�) 0.375 mM Cu2+ + 0.125 mM Fe3+, (�) 0.25 mM
Cu2+ + 0.25 mM Fe3+, (�) 0.125 mM Cu2+ + 0.375 mM Fe3+ and (�) 0.50 mM Fe3+.
3.2. Combination of Fe3+and Cu2+ to catalyze the electro-Fenton
and solar photoelectro-Fenton processes of phthalic acid
To study the synergistic effect of both metal ions as catalysts
on the degradation of phthalic acid by EF and SPEF, three solu-
tions with 2.0 mM substrate in 0.10 M Na2SO4 containing 0.375 mM
Cu2+ + 0.125 mM Fe3+, 0.25 mM Cu2+ + 0.25 mM Fe3+ or 0.125 mM
Cu2+ + 0.375 mM Fe3+ were prepared at pH 3.0 and electrolyzed
in the stirred BDD/air-diffusion tank reactor at 33.3 mA cm−2 and
35 ◦C. Fig. 3a evidences that operating in the dark (EF conditions)
with all the combined catalysts, phthalic acid always disappeared in
240 min following a pseudo-first-order kinetics. Nevertheless, the
solution with 0.125 mM Cu2+ + 0.375 mM Fe3+ showed the fastest
substrate abatement with k1 = 3.0 × 10⁻⁴ s−1, even slightly greater
than using Cu2+ or Fe3+ alone (see Table 1). This phenomenon can
be related to the interaction of both Cu2+/Cu+ and Fe3+/Fe2+ pairs,
since Cu+ produced from reaction (10) can alternatively regener-
ate Fe2+ by reaction (12) [13] and propagate Fenton’s reaction (2)
201

614 S. Garcia-Segura et al. / Electrochimica Acta 113 (2013) 609– 619
Table 2Aromatic compounds detected by LC–MS during the SPEF degradation of 100 cm3 of 2.0 mM phthalic acid with 0.125 mM Cu2+ + 0.375 mM Fe3+ at pH 3.0, 33.3 mA cm−2 and
35 ◦C using a BDD/air-diffusion tank reactor.
Compound Name Molecular formula m/z a
1 Phthalic acid 165
2 3-Hydroxyphthalic acid 181
3 4-Hydroxyphthalic acid 181
4 3,4-Dihydroxyphthalic acid 197
5 3,5-Dihydroxyphthalic acid 197
6 4,5-Dihydroxyphthalic acid 197
7 Tetrahydroxyphthalic acid 229
202

S. Garcia-Segura et al. / Electrochimica Acta 113 (2013) 609– 619 615
Table 2 (Continued)
Compound Name Molecular formula m/z a
8 Benzoic acid 121
9 2-Hydroxybenzoic acid 137
10 3-Hydroxybenzoic acid 137
11 4-Hydroxybenzoic acid 137
12 Dihydroxybenzoic acid 153
a Negative ion with z = 1.
in some extent generating more •OH to favor the destruction of
phthalic acid.
Cu+ + Fe3+ → Cu2+ + Fe2+ (12)
Fig. 3b illustrates that the comparative SPEF processes
accelerated the substrate abatement. Thus, until 0.25 mM Fe3+
phthalic acid disappeared in 210 min, whereas for 0.125 mM
Cu2+ + 0.375 mM Fe3+ it was completely removed in 105 min. In
all cases, excellent linear correlations of the concentration decays
related to a pseudo-first-order reaction were found (see the inset
panel in Fig. 3b). The data of Table 1 confirm that k1 increased
with increasing Fe3+ concentration from 0.25 mM and hence, the
substrate removal was faster by using 0.50 mM Fe3+ alone. This
behavior suggests the pre-eminent role of photo-Fenton reaction
(5) to generate •OH in the bulk under the conditions tested in SPEF,
which becomes more significant as Fe3+ concentration increases
causing a faster removal of phthalic acid. Fig. 3b also shows the
existence of an induction step at the beginning of all concentration
decays, up to 5 min of electrolysis. This phenomenon is difficult to
explain and it could be related to the slow destruction of more sta-
ble complexes of phthalic acid with both Fe3+ and Cu2+ ions. When
these mixed complexes are removed, the phthalic acid abatement
is rapid and obeys a pseudo-first-order kinetics.
No notable change in TOC decay was obtained for EF when treat-
ing the 2.0 mM phthalic acid solutions with combined or alone
metal ions, giving about 75% mineralization after 240 min of all
the electrolyses at 33.3 mA cm−2. For the comparative SPEF assays,
Fig. 4a evidences that all the Cu2+–Fe3+ combinations enhance the
mineralization rate compared to single metal ions. At 180 min of
electrolysis, for example, TOC was reduced by 87% for 0.375 mM
Cu2+ + 0.125 mM Fe3+, 92% for 0.25 mM Cu2+ + 0.25 mM Fe3+ and
up to 97% for 0.125 mM Cu2+ + 0.375 mM Fe3+, whereas it attained
81% and only 66% decay for 0.50 mM Fe3+ and 0.50 mM Cu2+,
respectively. Besides, Fig. 4a shows that the increase in the whole
oxidation rate using both ions did not followed a quite zero-order
rate respect to TOC decay, as can be observed when the separated
ions are utilized. This is indicative of an increase in the rate of•OH generation via photo-Fenton reaction (5) and also of the con-
trol of the whole process by the oxidation rate of several organic
compounds, thus explaining that the whole reaction depends on
TOC concentration. The higher mineralization obtained by rising
the Fe3+ content from 0.125 to 0.375 mM cannot be attributed to
the quicker photolysis by reaction (6) of the greater quantities
of Fe(III)-carboxylate complexes that are gradually formed, since
less TOC was removed only using 0.50 mM Fe3+. This allows infer-
ring that smaller Cu2+ contents with increasing Fe3+ concentrations
203

616 S. Garcia-Segura et al. / Electrochimica Acta 113 (2013) 609– 619
0
5
10
15
20
25
30
0.0
0.2
0.4
0.6
0.8
0.00
0.05
0.10
0.15
0.0
0.5
1.0
1.5
2.0
0 30 60 90 120 150 180 210 240 270
(b)
(a)
0
10
20
30
40
0
10
20
30
40
0 30 60 90 120 150 180 210 240 270Time /min
(d)
(e)
)f( )c(
[Car
boxy
lic a
cid]
/ m
g dm
-3
Fig. 5. Time course of the concentration of carboxylic acids detected during the (©) EF and (�) SPEF degradation of 100 cm3 of a 2.0 mM phthalic acid solution in 0.10 M
Na2SO4 and 0.125 mM Cu2+ + 0.375 mM Fe3+ at pH 3.0, 33.3 mA cm−2 and 35 ◦C in a stirred BDD/air-diffusion tank reactor. (a) Pyruvic (13), (b) maleic (14), (c) tartronic (15),
(d) succinic (16), (e) acrylic (17) and (f) oxalic (18) acids.
improve the mineralization of phthalic acid, since competitively
formed Cu(II) complexes are more rapidly destroyed with •OH in
the bulk, involving, for example, the oxidation of Cu(II)-carboxylate
species, as will be discussed below. These reactions could control
the whole oxidation process.
The synergistic oxidation effect for all combinations of Fe3+ and
Cu2+ in SPEF can then be explained by (i) the production of oxi-
dizing •OH induced from photo-Fenton reaction (5) and (ii) the
oxidation of the competitively formed Cu(II) species with this radi-
cal. The best conditions tested for phthalic acid degradation, that is,
when producing the higher •OH concentration to yield the quicker
removal of Cu(II) complexes formed, are found using 0.125 mM
Cu2+ + 0.375 mM Fe3+, with an almost total mineralization of 97%
at 180 min and 99% at 240 min (see Fig. 4a). This treatment yielded
the higher efficiencies and the lower energy consumptions per unit
TOC mass of all processes tested, as illustrated in Fig. 4b and c,
respectively. A maximum MCE of 72% can be observed at 120 min,
which decayed to 40% at the end of the trial. The minimum ECTOC
of 0.160 kWh g−1 TOC was also found at 120 min, further increasing
up to 0.294 kWh g−1 TOC toward the end of the electrolysis.
3.3. Identification of aromatic intermediates and time course of
generated carboxylic acids
Table 2 collects the eleven aromatic intermediates detected dur-
ing the SPEF treatment with 0.125 mM Cu2+ + 0.375 mM Fe3+ by
LC–MS. Apart from the starting phthalic acid (1), two monohy-
droxylated (2 and 3) and three dihydroxylated (4–6) derivatives
along with its tetrahydroxylated compound (7) were identified.
Besides, benzoic acid (8) and three monohydroxylated (9–11) and
one dihydroxylated (12) derivatives were detected as decarboxy-
lated products, as well.
On the other hand, ion-exclusion chromatograms of elec-
trolyzed solutions exhibited the generation of six short-linear
carboxylic acids such as pyruvic (13), maleic (14), tartronic (15),
succinic (16), acrylic (17) and oxalic (18). The acids 13–17 are
expected to be formed from the oxidative cleavage of the benzenic
ring of aromatic intermediates [13,23,24,37]. The oxidation of all
these products yields 18, which is the ultimate carboxylic acid since
it is directly transformed into CO2 [36].
Fig. 5a–f shows the evolution of the concentrations of acids
13–18, respectively, during the most efficient SPEF process of the
2.0 mM phthalic acid solution using 0.125 mM Cu2+ + 0.375 mM
Fe3+, together the comparable results obtained by EF. As expected,
all the acids were completely and rapidly removed after 240 min
of SPEF, whereas they were more difficultly destroyed under EF
treatment. Acids 13–15 were accumulated in low quantities (see
Fig. 5a–c), not exceeding the 2 mg dm−3 during both treatments,
although their disappearance in SPEF was only slightly more rapid
than in EF. This suggests that the Cu(II) and Fe(III) complexes of
these acids are mainly destroyed by BDD(•OH) in both cases and
that in SPEF, they are additionally oxidized by •OH induced from
photo-Fenton reaction (5), mainly the corresponding Cu(II) com-
plexes, as stated above. However, the photolysis of their Fe(III)
complexes by UV light of solar radiation via reaction (6) seems
much less relevant. Fig. 5d and e shows a much more large accu-
mulation of acids 16 and 17 in the solution, respectively. The acid
16 attained about 26 mg dm−3 at 50 min and the acid 17 reached
near 37 mg dm−3 at 30–40 min, further being completely removed
in both processes, more quickly in SPEF. This behavior is similar to
that observed for acids 13–15, suggesting again the destruction of
the Cu(II) and Fe(III) complexes of 16 and 17 mainly by BDD(•OH) in
EF and SPEF and the pre-eminent additional oxidation of their Cu(II)
species by •OH induced from photo-Fenton reaction (5) in SPEF. In
contrast, very different trends were found for 18 in both processes
204

S. Garcia-Segura et al. / Electrochimica Acta 113 (2013) 609– 619 617
Fig. 6. Proposed reaction pathway for phthalic acid mineralization by EF and SPEF processes with Fe3+ and/or Cu2+ catalysts.
(see Fig. 5f). This acid was gradually accumulated up to a quasi-
steady content of 38 mg dm−3 in EF indicating that Cu(II)-oxalate
and Fe(III)-oxalate complexes are hardly destroyed by BDD(•OH).
In SPEF, however, it was so rapidly removed that it disappeared
in 180 min after reaching near 7 mg dm−3 as maximal. This can be
related to the quick photolysis of generated Fe(III)-oxalate species
by reaction (6) [36].
A simple mass balance, for example, at 180 min of electrolysis
reveals that all the detected acids contribute in 16 mg dm−3 TOC
in EF and 2.4 mg dm−3 TOC in SPEF, which are smaller than 75
and 6.2 mg dm−3 TOC determined for the electrolyzed solutions.
This evidences that large amounts of other undetected products
are largely accumulated in EF that are quickly mineralized by oxi-
dation with •OH and/or photolysis by sunlight in SPEF. The fast
removal of such compounds, along with the higher destruction rate
of detected short-linear carboxylic acids, explain the superiority of
SPEF to mineralize phthalic acid.
It is noteworthy that the Fe(III) and Cu(II) complexes of the final
carboxylic acids are destroyed mainly with BDD(•OH) and also with•OH in EF. Since the former radical can only act at the BDD anode
surface, its production from reaction (4) is limited by mass transfer
and the destruction of such complexes should obey a first-order
rate, which cannot justify the quite zero-order rate obtained for
its whole reaction respect to TOC concentration decay. The quite
205

618 S. Garcia-Segura et al. / Electrochimica Acta 113 (2013) 609– 619
zero-order behavior in EF can then be explained if the whole pro-
cess rate is controlled by the slow •OH generation from Fenton’s
reaction (2), as stated above. In contrast, the enhancement of the
whole oxidation process in SPEF by the acceleration of the reaction
of Cu(II)-carboxylate complexes with the greater •OH production
via photo-Fenton reaction (5) can account for by the dependence
of the whole rate on TOC concentration shown in Fig. 4a.
3.4. Proposed reaction pathway for phthalic acid mineralization
Fig. 6 presents a reaction sequence proposed for the mineraliza-
tion of phthalic acid by the EAOPs tested taking into account all the
oxidation products detected. In this pathway, two oxidizing agents,
BDD(•OH) and •OH, are considered. The former is the main oxidant
in EF, regardless of the presence of Cu2+ and/or Fe3+, whereas the
latter is originated in large extent in SPEF using Fe3+. Although all
the acids are expected to form Cu(II) and Fe(III) complexes, this
possibility is only stated for acid 18 for sake of simplicity.
The process is initiated either by the hydroxylation of 1 to yield 2and 3 or its decarboxylation to produce 8. Consecutive oxidation of
the monohydroxylated derivatives 2 and 3 gives the dihydroxylated
compounds 4–6, which are further degraded to the tetrahydroxy-
lated one 7. Parallel destruction of 8 leads to its monohydroxylated
products 9–11, followed by its oxidation to the dihydroxylated
derivative 12. Compounds 9–11 could also be formed from the
decarboxylation of 2 and 3. Further cleavage of the benzenic moi-
ety of the above aromatic intermediates yields a mixture of acids
13–17, which are subsequently oxidized to 18. This ultimate car-
boxylic acid forms Cu(II)-oxalate and/or Fe(III)-oxalate complexes,
which are very slowly attacked by BDD(•OH) in EF and SPEF with
0.50 mM Cu2+. In contrast, in SPEF with Cu2+–Fe3+ combination,
the Cu(II)-oxalate species can also be removed by •OH, but the
Fe(III)-oxalate ones are much more quickly photolyzed to CO2 by
sunlight. For the other short-linear carboxylic acids, our results
using 0.125 mM Cu2+ + 0.375 mM Fe3+ suggest that the oxidation
of its Cu(II) complexes with •OH predominates over the removal of
its Fe(III)-complexes under the action of •OH and sunlight.
4. Conclusions
It has been demonstrated that photo-Fenton reaction (5) is
able to induce the generation of •OH in concentration enough to
largely accelerate phthalic acid removal in SPEF with 0.50 mM Fe3+
compared to EF. Almost total mineralization was achieved under
these SPEF conditions due to the photolysis of generated Fe(III)-
carboxylate complexes. However, the comparable EF processes
with 0.50 mM Cu2+ or 0.50 mM Fe3+ led to slower substrate decay
and poorer mineralization because the main oxidant is BDD(•OH).
A slightly faster TOC decay was found for SPEF with 0.50 mM Cu2+
by the photodecomposition of several intermediates. In all cases,
phthalic acid decayed following a pseudo-first-order kinetics. The
combination of Cu2+ and Fe3+ as catalysts enhanced the mineraliza-
tion process in SPEF as a result of the oxidation of Cu(II) complexes
with •OH formed by photo-Fenton reaction (5), whereas the sub-
strate removal was accelerated by addition of more Fe3+ owe to
the larger production of •OH. The best SPEF degradation resulted
for a 2.0 mM phthalic solution with 0.125 mM Cu2+ + 0.375 mM
Fe3+ at pH 3.0 and 33.3 mA cm−2, attaining 99% mineralization
in 240 min with 40% current efficiency and 0.294 kWh g−1 TOC
energy consumption. Eleven aromatic intermediates coming from
the hydroxylation/decarboxylation of phthalic acid were detected
by LC–MS. Six short-linear carboxylic acids formed from the cleav-
age of the benzenic ring of aromatic products were quantified by
ion-exclusion HPLC. The Cu(II) and/or Fe(III) complexes of most of
these acids were destroyed by BDD(•OH), although in SPEF their
Cu(II)-carboxylate complexes were also oxidized by •OH. A differ-
ent behavior was found for the ultimate acid, oxalic acid, which
was quickly removed in SPEF due to the efficient photolysis of the
Fe(III)-oxalate complexes.
Acknowledgements
The authors are grateful to the financial support from MICINN
(Ministerio de Ciencia e Innovación, Spain) under the project
CTQ2010-16164/BQU, co-financed with FEDER funds. S. Garcia-
Segura thanks the grant awarded from MEC (Ministerio de
Educación y Ciencia, Spain) and R. Salazar acknowledges the finan-
cial support from FONDECYT (Chile) with grant 1130391 and
DICYT-USACh. The authors acknowledge to Reviewer 1 the pro-
posal of the control of the oxidation reaction by the generation of
the hydroxyl radical in the bulk and the deriving discussion in order
to point out the non-coherence of authors’ discussion.
References
[1] S. Oishi, K. Hiraga, Testicular atrophy induced by phthalic acid esters: Effect ontestosterone and zinc concentrations, Toxicology and Applied Pharmacology53 (1980) 35.
[2] E. Makoto, M. Emiko, H. Akira, K. Kunio, Developmental toxicity evaluation ofphthalic acid, one of the metabolites of phthalic acid esters, in rats, ToxicologyLetters 93 (1997) 109.
[3] United States Environmental Protection Agency (7407), Pollution Preventionand Toxics, EPA 749-F-95-016a, 1994.
[4] J.M. Bauer, R. Herrman, Estimation of the environmental contamination byphthalic acid esters leaching from household wastes, Science of the Total Envi-ronment 208 (1997) 49.
[5] L. Zhang, L. Dong, L. Ren, S. Shi, L. Zhou, T. Zhang, Y. Huang, Concentrationand source identification of polycyclic aromatic hydrocarbons and phthalicacid esters in the surface water of the Yangtze River Delta, China, Journal ofEnvironmental Sciences 24 (2012) 335.
[6] H. Fromme, T. Kuchler, T. Otto, K. Pilz, J. Muller, A. Wenzel, Occurrence of phtha-lates and bisphenol A and F in the environment, Water Research 36 (2002)1429.
[7] A.V. Taborda, M.A. Brusa, M.A. Grela, Photocatalytic degradation of phthalic acidon TiO2 nanoparticles, Applied Catalysis A: General. 208 (2001) 419.
[8] E. Ayranci, E. Bayram, Adsorption of phthalic acid and its esters onto high-area activated carbon-cloth studied by in situ UV-spectroscopy, Journal ofHazardous Materials B122 (2005) 147.
[9] Z. Zheng, H. Zhang, P.J. He, L.M. Shao, Y. Chen, L. Pang, Co-removal of phthalicacid esters with dissolved organic matter from landfill leachate by coagulationand flocculation process, Chemosphere 75 (2009) 180.
[10] C. Fang, Y. Long, D. Shen, Comparison on the removal of phthalic acid diestersin a bioreactor landfill and a conventional landfill, Bioresource Technology 100(2009) 5664.
[11] R. Lertsirisopon, S. Soda, K. Sei, M. Ike, Abiotic degradation of four phthalic acidesters in aqueous phase under natural sunlight irradiation, Journal of Environ-mental Sciences 21 (2009) 285.
[12] G. Zhao, J. Gao, S. Shen, M. Liu, D. Li, M. Wu, Y. Lei, Ultrasound enhanced elec-trochemical oxidation of phenol and phthalic acid on boron-doped diamondelectrode, Journal of Hazardous Materials 172 (2009) 1076.
[13] E. Brillas, I. Sirés, M.A. Oturan, Electro-Fenton process and related electrochem-ical technologies based on Fenton’s reaction chemistry, Chemical Reviews 109(2009) 6570.
[14] I. Sirés, E. Brillas, Remediation of water pollution caused by pharmaceuticalresidues based on electrochemical separation and degradation technologies: areview, Environment International 40 (2012) 212.
[15] A.R. Khataee, M. Safarpour, M. Zarei, S. Aber, Electrochemical generation ofH2O2 using immobilized carbon nanotubes on graphite electrode fed with air:Investigation of operational parameters, Journal of Electroanalytical Chemistry169 (2011) 63.
[16] M. Zarei, A.R. Khataee, R. Ordikhani-Seyedlar, M. Fathinia, Photoelectro-Fentoncombined with photocatalytic process for degradation of an azo dye usingsupported TiO2 nanoparticles and carbon nanotube cathode: Neural networkmodeling, Electrochimica Acta 55 (2010) 7259.
[17] M. Zarei, A. Niaei, D. Salari, A.R. Khataee, Application of response surfacemethodology for optimization of peroxi-coagulation of textile dye solutionusing carbon nanotube-PTFE cathode, Journal of Hazardous Materials 173(2010) 544.
[18] N. Oturan, M.A. Oturan, Degradation of three pesticides used in viticulture byelectrogenerated Fenton’s reagent, Agronomy for Sustainable Development 25(2005) 267.
[19] I. Sirés, J.A. Garrido, R.M. Rodríguez, E. Brillas, N. Oturan, M.A. Oturan, Cat-alytic behavior of the Fe3+/Fe2+ system in the electro-Fenton degradation ofthe antimicrobial chlorophene, Applied Catalysis B: Environmental 72 (2007)382.
206

S. Garcia-Segura et al. / Electrochimica Acta 113 (2013) 609– 619 619
[20] A. Özcan, Y. Sahin, A. Savas Koparal, M.A. Oturan, Carbon sponge as a new mate-rial for the electro-Fenton process. Comparison with carbon felt cathode andapplication to degradation of synthetic dye Basic Blue 3 in aqueous medium,Journal of Electroanalytical Chemistry 616 (2008) 71.
[21] A. Dirany, S. Efremova-Aaron, N. Oturan, I. Sirés, M.A. Oturan, J.-J. Aaron, Studyof the toxicity of sulfamethoxazole and its degradation products in water by abioluminescence method during application of the electro-Fenton treatment,Analytical and Bioanalytical Chemistry 400 (2011) 353.
[22] A. Dirany, I. Sirés, N. Oturan, A. Özcan, M.A. Oturan, Electrochemical treat-ment of the antibiotic sulfachloropyridazine: kinetics, reaction pathways,and toxicity evolution, Environmental & Science Technology 46 (2012)4074.
[23] E. Brillas, M.A. Banos, S. Camps, C. Arias, P.L. Cabot, J.A. Garrido, R.M. Rodríguez,Catalytic effect of Fe2+, Cu2+ and UVA light on the electrochemical degradationof nitrobenzene using an oxygen-diffusion cathode, New Journal of Chemistry28 (2004) 314.
[24] E. Isarain-Chávez, C. Arias, P.L. Cabot, F. Centellas, R.M. Rodríguez, J.A. Garrido, E.Brillas, Mineralization of the drug beta-blocker atenolol by electro-Fenton andphotoelectro-Fenton using an air-diffusion cathode for H2O2 electrogenerationcombined with a carbon-felt cathode for Fe2+ regeneration, Applied CatalysisB: Environmental 96 (2010) 361.
[25] E.J. Ruiz, C. Arias, E. Brillas, A. Hernández-Ramírez, J.M. Peralta-Hernández,Mineralization of Acid Yellow 36 azo dye by electro-Fenton and solarphotoelectro-Fenton processes with a boron-doped diamond anode, Chemo-sphere 82 (2011) 495.
[26] S. Garcia-Segura, J.A. Garrido, R.M. Rodríguez, P.L. Cabot, F. Centellas, C. Arias, E.Brillas, Mineralization of flumequine in acidic medium by electro-Fenton andphotoelectro-Fenton processes, Water Research 46 (2012) 2067.
[27] M. Panizza, M.A. Oturan, Degradation of alizarin red by electro-Fenton processusing a graphite-felt cathode, Electrochimica Acta 56 (2011) 7084.
[28] K. Cruz-González, O. Torres-López, A. García-León, J.L. Guzmán-Mar, L.H. Reyes,A. Hernández-Ramírez, J.M. Peralta-Hernández, Determination of optimumoperating parameters for Acid Yellow 36 decolorization by electro-Fenton pro-cess using BDD cathode, Chemical Engineering Journal 160 (2010) 199.
[29] C. Flox, P.L. Cabot, F. Centellas, J.A. Garrido, R.M. Rodríguez, C. Arias, E. Brillas,Electrochemical combustion of herbicide mecoprop in aqueous medium usinga flow reactor with a boron-doped diamond anode, Chemosphere 64 (2006)892.
[30] M. Panizza, G. Cerisola, Direct and mediated anodic oxidation of organic pollu-tants, Chemical Reviews 109 (2009) 6541.
[31] C. Flox, C. Arias, E. Brillas, A. Savall, K. Groenen-Serrano, Electrochemicalincineration of cresols: a comparative study between PbO2 and boron-dopeddiamond anodes, Chemosphere 74 (2009) 1340.
[32] M. Hamza, R. Abdelhedi, E. Brillas, I. Sirés, Comparative electrochemical degra-dation of the triphenylmethane dye methyl violet with boron-doped diamondand Pt anodes, Journal of Electroanalytical Chemistry 627 (2009) 41.
[33] E. Brillas, S. Garcia-Segura, M. Skoumal, C. Arias, Electrochemical incinerationof diclofenac in neutral aqueous medium by anodic oxidation using Pt andboron-doped diamond anodes, Chemosphere 79 (2010) 605.
[34] P. Canizares, J. García-Gómez, J. Lobato, M.A. Rodrigo, Electrochemical oxida-tion of aqueous carboxylic acid wastes using diamond thin-film electrodes,Industrial & Engineering Chemical Research 42 (2003) 956.
[35] P. Canizares, R. Paz, C. Sáez, M.A. Rodrigo, Electrochemical oxidation of alcoholsand carboxylic acids with diamond anodes: a comparison with other advancedoxidation processes, Electrochimica Acta 53 (2008) 2144.
[36] S. Garcia-Segura, E. Brillas, Mineralization of the recalcitrant oxalic and oxamicacids by electrochemical advanced oxidation processes using a boron-dopeddiamond anode, Water Research 45 (2011) 2975.
[37] I. Sirés, J.A. Garrido, R.M. Rodríguez, P.L. Cabot, F. Centellas, C. Arias, E. Brillas,Electrochemical degradation of paracetamol from water by catalytic action ofFe2+, Cu2+ and UVA light on electrogenerated hydrogen peroxide, Journal of theElectrochemical Society 153 (2006) D1.
[38] R. Salazar, S. Garcia-Segura, M.S. Ureta-Zanartu, E. Brillas, Degradation of dis-perse azo dyes from waters by solar photoelectro-Fenton, Electrochimica Acta56 (2011) 6371.
[39] L.C. Almeida, S. Garcia-Segura, N. Bocchi, E. Brillas, Solar photoelectro-Fentondegradation of paracetamol using a flow plant with a Pt/air-diffusion cell cou-pled with a compound parabolic collector: Process optimization by responsesurface methodology, Applied Catalysis B: Environmental 103 (2011) 21.
[40] R. Salazar, E. Brillas, I. Sirés, Finding the best Fe2+/Cu2+ combination for the solarphotoelectro-Fenton treatment of simulated wastewater containing the indus-trial textile dye Disperse Blue 3, Applied Catalysis B: Environmental 115–116(2012) 107.
[41] A. Babuponnusami, K. Muthukumar, Advanced oxidation of phenol: acomparison between Fenton, electro-Fenton, sono-electro-Fenton and photo-electro-Fenton processes, Chemical Engineering Journal 183 (2012) 1.
[42] R. Salazar, M.S. Ureta-Zanartu, Mineralization of triadimefon fungicide in waterby electro-Fenton and photoelectro-Fenton, Water Air Soil Pollution 223 (2012)4199.
[43] Corporación Nacional del Cobre de Chile, CODELCO, Plan de InversionesCodelco, 2012.
[44] B. Boye, M.M. Dieng, E. Brillas, Electrochemical degradation of 2,4,5-trichlorophenoxyacetic acid in aqueous medium by peroxi-coagulation. Effectof pH and UV light, Electrochimica Acta 48 (2003) 781.
[45] S. Parthasarathy, V.S.K. Nair, Enthalpy of complex formation by calorimetry:phthalates of manganese, nickel, and copper, Thermochimica Acta 2 (1971) 69.
[46] V. Vancina, T.A. Himdan, H. Bilinski, M. Miljak, I. Kos, D. Hanzel, D. Hanzel,Thermal behavior and characterization of some novel Fe(III)-o-phthalates,Thermochimica Acta 246 (1994) 199.
[47] H. Gallard, J. De Laat, B. Legube, Comparative study of the rate of decompositionof H2O2 and atrazine by Fe(III)/H2O2, Cu(II)/H2O2, Fe(III)/Cu(II)/H2O2, Revue desSciences de l’Eau 12 (1999) 713.
207

Results and Discussion �
����

Results and Discussion
�����
Electrochemiluminescence of luminol

Results and Discussion �
�����

Results and Discussion
�����
During these years that I have made my PhD thesis in LEMMA, I have also been an active
member of the teaching innovation group “Química a la Interfase Secundaria-Universitat”
(QuISU). “Fem Química al Laboratori” (FQL) is one of the most popular activities
developed by QuISU. In FQL, high school students do 4 practises in 4 h from different
chemistry fields with one professor of the University of Barcelona. The last three years
one biochemical practise related with the forensic science using luminol was performed
in FQL.
Luminol is from far the most popular reagent used in CL. The emission of a characteristic
fluorescent light of �max = 425 nm when a solution of luminol and hydrogen peroxide in
alkaline medium is sprayed on dried blood stains has been widely utilized by forensic
scientists for more than 40 years. Luminol is oxidized at pH 8−12 in the presence of H2O2
and a suitable catalyst such the hemo group. The most important fact that could be noticed
is that the Fe2+ from the hemo group catalyses the oxidation of luminol when reacts with
H2O2, thereby showing certain similitudes with the Fenton’s reaction (10).
Based on the hypothesis that the generation of hydroxyl radicals would be the main
responsible of the CL reaction due to the luminol oxidation, we decided to test if the
radicals electrogenerated on the BDD surface could be able to generate ECL. The results
showed a novel characteristic property of BDD not previously described, the light
emission in a wide potential range of 0.5-5.0V vs Ag|AgCl, KCl(sat.) by an ECL reaction
with luminol, which has not been observed for other anodes.
The linear sweep voltammetry study of the system explained the electrochemical
behaviour of luminol, H2O2 and their mixture in an alkaline pH media. The onset
potentials evidenced that �OH was not generated under these pH conditions where
superoxide ion radical (O2�−) was formed instead. Also the results allowed us to conclude
that O2�− generation was enhanced when hydroperoxyl radical (HO2
�) was formed as the
predominant species at pH 12.0, coming from the oxidation of added H2O2. The light
emission measurements also evidenced the enhancement effect of H2O2 addition. Thus,
the maximum light emission of 1.65 μW cm-2 without H2O2 increased up to 104 μW cm-
2 (63 times higher) in 0.05 M of H2O2. An inhibition of light emission with increasing
H2O2 concentration was also observed and ascribed to the higher rise in rate of parasitic
reactions that consume the radical species.

Results and Discussion �
�����
Additionally the use of specific scavengers and quenchers of �OH and O2�− such as
DMSO and p-benzoquinone, respectively, allowed ascertaining which radical was the
responsible of the ECL reaction. The insignificant influence of DMSO and the high effect
of p-benzoquinone on light emission corroborated that the large enhancement of ECL of
luminol in presence of H2O2 on BDD was related with O2�− electrogeneration. These
results allowed us to propose a double via for the ECL of luminol in alkaline medium
related with the direct charge transfer and the indirect electrochemical oxidation by O2�−.
The ECL process showed a strongly relationship with the electrogeneration of
physisorbed O2�− anion radicals at the BDD surface. This finding can contribute to a better
characterization of the properties of conductive-diamond electrodes, the understanding of
the oxidation mechanisms of organics by ROS and the development of BDD sensors for
biomolecules. Furthermore, the corroboration of the no generation of �OH radicals at pH
over 12.0 explains the lower oxidation ability of these anodes in alkaline media than in
neutral and acidic pH.

Results and Discussion
�����
PAPER 9
Unprecedented
electrochemiluminescence of luminol on
a boron-doped diamond thin-film anode.
Enhancement by electrogenerated
superoxide radical anion

Results and Discussion �
�����

Unprecedented Electrochemiluminescence of Luminol on a Boron-Doped Diamond Thin-Film Anode. Enhancement byElectrogenerated Superoxide Radical AnionSergi Garcia-Segura, Francesc Centellas,* and Enric Brillas
Laboratori d’Electroquímica dels Materials i del Medi Ambient, Departament de Química Física, Facultat de Química, Universitat deBarcelona, Martí i Franques 1-11, 08028 Barcelona, Spain
ABSTRACT: Electrochemiluminescence (ECL) of 0.01 M luminol in NaOH medium of pH12.0 on a boron-doped diamond (BDD) thin-film anode was studied in the absence andpresence of H2O2. Here we show a new characteristic property of BDD allowing light emissionin a wide potential range of 0.5−5.0 V vs Ag|AgCl, KCl(sat.), a behavior not observed for otheranodes. Maximum ECL intensity was found at 2.2−2.8 V without H2O2, which became 63 timesmore intense after adding 0.05 M H2O2. The strong enhancement of ECL in the presence ofH2O2 is attributed to the larger production of emitter 3-aminophthalate dianion, formed byselective nucleophilic attack of superoxide radical anion (O2
•−) to the radical electrogeneratedfrom one-electron oxidation of the monoanionic form of luminol. Linear sweep voltammetryshowed that •OH was not generated from OH− oxidation, whereas O2
•− can be produced fromHO2
− oxidation. The performance of O2•− in ECL was confirmed by p-benzoquinone
quenching.
1. INTRODUCTION
Luminol (5-amino-2,3-dihydro-1,4-phthalazinedione) is themost popular reagent used in chemiluminescence (CL). Theemission of characteristic fluorescent light of λmax = 425 nmwhen a solution of luminol and hydrogen peroxide in alkalinemedium is sprayed on dried blood stains has been widelyutilized by forensic scientists for more than 40 years.1 It isknown that luminol is oxidized at pH 8−12 in the presence of amild−strong oxidant such as H2O2 and a suitable catalyst suchas a metal ion. This oxidation is caused via charge-transferreactions between reactive oxygen species (ROS) and theexcited form of the 3-aminophthalate dianion. CL is emittedwhen this dianion decays to the ground state.2
Recently, electrogenerated CL or electrochemiluminescence(ECL) has received considerable interest in analytical chemistrydue to its high sensitivity, low background, wide dynamic range,and simple formats.3 Several authors have reported the ECL ofluminol in alkaline medium, but in the absence of H2O2, onanodes of Au,3,4 Pt,5 carbonaceous materials,5−7 and indium tinoxide.8,9 In these works, ECL is conventionally initiated bycyclic voltammetry and linear sweep voltammetry, yielding lightemission at defined low potential ranges only. ECL processesare usually explained by similar pathways to the CL onesinvolving direct anodic oxidation of luminol and electro-generated ROS as oxidant to obtain the emitter 3-amino-phthalate dianion, but disregarding the potential positive actionof added H2O2.
Boron-doped diamond (BDD) thin-film electrodes are themost potent anodes known for anodic oxidation. This is due totheir technological features, such as an inert surface with lowadsorption properties, remarkable corrosion stability, and awide potential window in acidic medium.10−12 Compared with
conventional anodes such as Pt, the BDD anode has higher O2-overvoltage, generating more amount of •OH from wateroxidation, resulting in a quicker destruction of a large variety oforganics. However, less known are the ECL properties oforganics on a BDD anode. As far as we know, light emission ofthe Ru-tris(2,2′)bipyridyl dication promoted by oxidation ofcoreactants such as ascorbic acid13 and tripropylamine14 usingBDD has only been described in the literature. Thus, the aim ofthe present work is to study the ECL of luminol on BDD in aNaOH solution of pH 12.0 in order to clarify the characteristicsof this process and the mechanism of the oxidation of luminolin the absence and presence of H2O2.
2. EXPERIMENTAL SECTION2.1. Chemicals. Luminol was of HPLC grade, purchased
from AppliChem, and used as received. DMSO (>99.9%) andp-benzoquinone (>99%) were of analytical grade, supplied bySigma-Aldrich. Sodium hydroxide (98−100%) and hydrogenperoxide (33% w/v) were of analytical grade from Acros andPanreac, respectively. All solutions were prepared with high-purity water obtained from a Millipore Milli-Q system withresistivity >18 MΩ cm at 25 °C. To adjust the solution pH at12.0, increasing amounts of NaOH with increasing H2O2concentration were needed to be added due to the conversionof H2O2 into HO2
−. The H2O2 concentration was determinedby standard permanganometric titration before luminoladdition.
2.2. Electrodes. All BDD thin-film electrodes were 1 μmthick, and 1300 ppm of boron content was supplied by
Received: June 5, 2012Published: July 2, 2012
Article
pubs.acs.org/JPCC
© 2012 American Chemical Society 15500 dx.doi.org/10.1021/jp305493g | J. Phys. Chem. C 2012, 116, 15500−15504
215
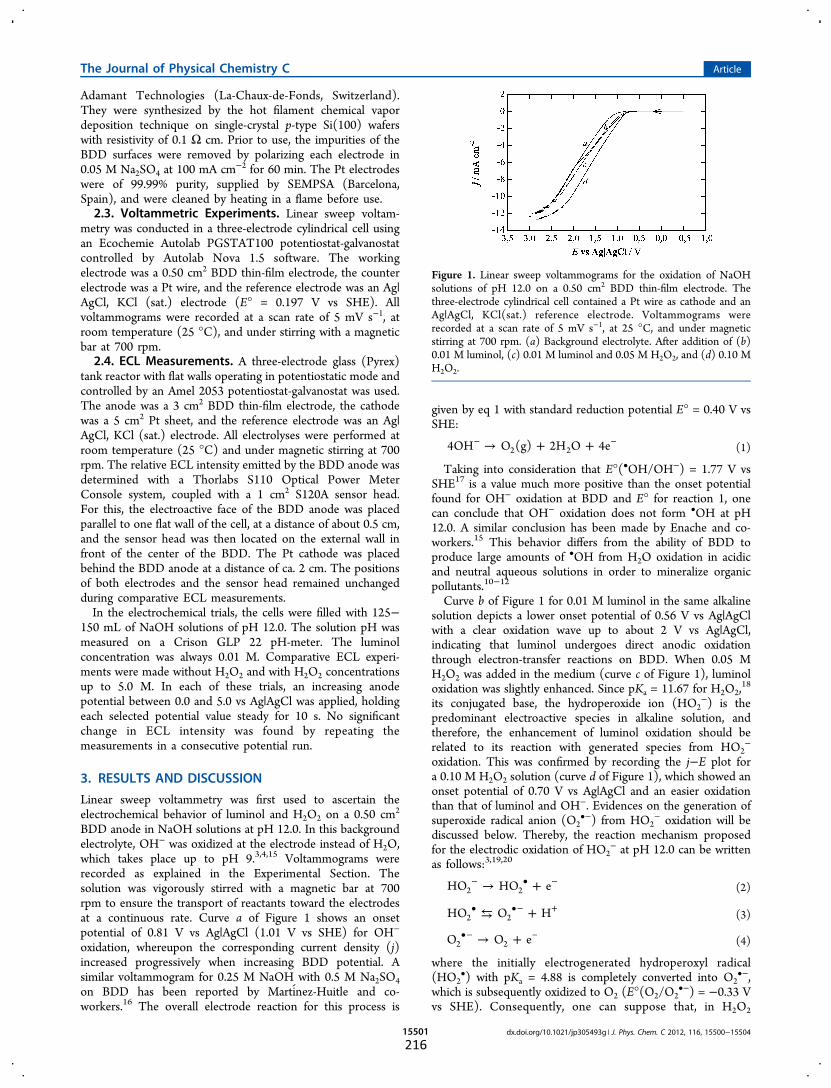
Adamant Technologies (La-Chaux-de-Fonds, Switzerland).They were synthesized by the hot filament chemical vapordeposition technique on single-crystal p-type Si(100) waferswith resistivity of 0.1 Ω cm. Prior to use, the impurities of theBDD surfaces were removed by polarizing each electrode in0.05 M Na2SO4 at 100 mA cm−2 for 60 min. The Pt electrodeswere of 99.99% purity, supplied by SEMPSA (Barcelona,Spain), and were cleaned by heating in a flame before use.2.3. Voltammetric Experiments. Linear sweep voltam-
metry was conducted in a three-electrode cylindrical cell usingan Ecochemie Autolab PGSTAT100 potentiostat-galvanostatcontrolled by Autolab Nova 1.5 software. The workingelectrode was a 0.50 cm2 BDD thin-film electrode, the counterelectrode was a Pt wire, and the reference electrode was an Ag|AgCl, KCl (sat.) electrode (E° = 0.197 V vs SHE). Allvoltammograms were recorded at a scan rate of 5 mV s−1, atroom temperature (25 °C), and under stirring with a magneticbar at 700 rpm.2.4. ECL Measurements. A three-electrode glass (Pyrex)
tank reactor with flat walls operating in potentiostatic mode andcontrolled by an Amel 2053 potentiostat-galvanostat was used.The anode was a 3 cm2 BDD thin-film electrode, the cathodewas a 5 cm2 Pt sheet, and the reference electrode was an Ag|AgCl, KCl (sat.) electrode. All electrolyses were performed atroom temperature (25 °C) and under magnetic stirring at 700rpm. The relative ECL intensity emitted by the BDD anode wasdetermined with a Thorlabs S110 Optical Power MeterConsole system, coupled with a 1 cm2 S120A sensor head.For this, the electroactive face of the BDD anode was placedparallel to one flat wall of the cell, at a distance of about 0.5 cm,and the sensor head was then located on the external wall infront of the center of the BDD. The Pt cathode was placedbehind the BDD anode at a distance of ca. 2 cm. The positionsof both electrodes and the sensor head remained unchangedduring comparative ECL measurements.
In the electrochemical trials, the cells were filled with 125−150 mL of NaOH solutions of pH 12.0. The solution pH wasmeasured on a Crison GLP 22 pH-meter. The luminolconcentration was always 0.01 M. Comparative ECL experi-ments were made without H2O2 and with H2O2 concentrationsup to 5.0 M. In each of these trials, an increasing anodepotential between 0.0 and 5.0 vs Ag|AgCl was applied, holdingeach selected potential value steady for 10 s. No significantchange in ECL intensity was found by repeating themeasurements in a consecutive potential run.
3. RESULTS AND DISCUSSION
Linear sweep voltammetry was first used to ascertain theelectrochemical behavior of luminol and H2O2 on a 0.50 cm2
BDD anode in NaOH solutions at pH 12.0. In this backgroundelectrolyte, OH− was oxidized at the electrode instead of H2O,which takes place up to pH 9.3,4,15 Voltammograms wererecorded as explained in the Experimental Section. Thesolution was vigorously stirred with a magnetic bar at 700rpm to ensure the transport of reactants toward the electrodesat a continuous rate. Curve a of Figure 1 shows an onsetpotential of 0.81 V vs Ag|AgCl (1.01 V vs SHE) for OH−
oxidation, whereupon the corresponding current density (j)increased progressively when increasing BDD potential. Asimilar voltammogram for 0.25 M NaOH with 0.5 M Na2SO4on BDD has been reported by Martinez-Huitle and co-workers.16 The overall electrode reaction for this process is
given by eq 1 with standard reduction potential E° = 0.40 V vsSHE:
→ + +− −4OH O (g) 2H O 4e2 2 (1)
Taking into consideration that E°(•OH/OH−) = 1.77 V vsSHE17 is a value much more positive than the onset potentialfound for OH− oxidation at BDD and E° for reaction 1, onecan conclude that OH− oxidation does not form •OH at pH12.0. A similar conclusion has been made by Enache and co-workers.15 This behavior differs from the ability of BDD toproduce large amounts of •OH from H2O oxidation in acidicand neutral aqueous solutions in order to mineralize organicpollutants.10−12
Curve b of Figure 1 for 0.01 M luminol in the same alkalinesolution depicts a lower onset potential of 0.56 V vs Ag|AgClwith a clear oxidation wave up to about 2 V vs Ag|AgCl,indicating that luminol undergoes direct anodic oxidationthrough electron-transfer reactions on BDD. When 0.05 MH2O2 was added in the medium (curve c of Figure 1), luminoloxidation was slightly enhanced. Since pKa = 11.67 for H2O2,
18
its conjugated base, the hydroperoxide ion (HO2−) is the
predominant electroactive species in alkaline solution, andtherefore, the enhancement of luminol oxidation should berelated to its reaction with generated species from HO2
−
oxidation. This was confirmed by recording the j−E plot fora 0.10 M H2O2 solution (curve d of Figure 1), which showed anonset potential of 0.70 V vs Ag|AgCl and an easier oxidationthan that of luminol and OH−. Evidences on the generation ofsuperoxide radical anion (O2
•−) from HO2− oxidation will be
discussed below. Thereby, the reaction mechanism proposedfor the electrodic oxidation of HO2
− at pH 12.0 can be writtenas follows:3,19,20
→ +− • −HO HO e2 2 (2)
⇆ +• •− +HO O H2 2 (3)
→ +•− −O O e2 2 (4)
where the initially electrogenerated hydroperoxyl radical(HO2
•) with pKa = 4.88 is completely converted into O2•−,
which is subsequently oxidized to O2 (E°(O2/O2•−) = −0.33 V
vs SHE). Consequently, one can suppose that, in H2O2
Figure 1. Linear sweep voltammograms for the oxidation of NaOHsolutions of pH 12.0 on a 0.50 cm2 BDD thin-film electrode. Thethree-electrode cylindrical cell contained a Pt wire as cathode and anAg|AgCl, KCl(sat.) reference electrode. Voltammograms wererecorded at a scan rate of 5 mV s−1, at 25 °C, and under magneticstirring at 700 rpm. (a) Background electrolyte. After addition of (b)0.01 M luminol, (c) 0.01 M luminol and 0.05 M H2O2, and (d) 0.10 MH2O2.
The Journal of Physical Chemistry C Article
dx.doi.org/10.1021/jp305493g | J. Phys. Chem. C 2012, 116, 15500−1550415501
216

solutions at pH = 12.0, O2•− is the species that enhances
luminol oxidation on BDD (curve c of Figure 1). Only underthese conditions in linear sweep voltammetry did the BDDsurface emit the characteristic light of luminol of λmax = 425 nm.
The ECL intensity produced by the potentiostatic oxidationof 0.01 M luminol in stirred NaOH solutions at pH 12.0 in theabsence and presence of H2O2 was measured. For this purpose,a three-electrode cell with flat walls equipped with a 3 cm2
BDD anode and a 5 cm2 sheet cathode was used following theprocedure described in the Experimental Section. Weak lightemission was observed for a luminol solution without H2O2,which became much more intense by adding H2O2. ConstantECL intensity was determined for all selected potentials whenthe reactants were transported to the BDD anode at constantrate by magnetic stirring at 700 rpm.
Figure 2a highlights that ECL started at a BDD potential ofabout 0.5 V vs Ag|AgCl and attained a maximum intensity of
1.65 μW cm−2 between 2.2 and 2.8 V vs Ag|AgCl. The increasein ECL intensity from 0.5 to 2.2 V vs Ag|AgCl can be ascribedto the concomitant increase in rate of electron-transferreactions that convert luminol into the emitter 3-amino-phthalate dianion. The gradual inhibition of ECL from 2.8 to5.0 V vs Ag|AgCl shown in Figure 2a suggests a largeracceleration of other oxidation reactions of luminol at highBDD potentials decreasing the proportion of 3-aminophthalatedianion produced. It is worth noting that the continuous ECLemitted by luminol at potentials from 0.5 to 5.0 V vs Ag|AgCl isa characteristic property of BDD, since other anodes only showthis phenomenon at defined intervals of potential, usually <1 Vvs Ag|AgCl.3−9
Addition of H2O2 to the luminol solution caused a largeenhancement of ECL, which reached maximum intensities for0.05 M H2O2. Figure 2b shows that a solution with 0.01 Mluminol and 0.05 M H2O2 yielded increasing light emission inthe BDD potential range from 0.5 to 5.0 V vs Ag|AgCl, whichcan be accounted for by the action of the progressive largerproduction of O2
•− from reactions 2 and 3. The maximum ECLintensity reached at the highest BDD potential was 104 μWcm−2, i.e. 63 times higher than the 1.65 μW cm−2 found as themaximum for luminol without H2O2 under comparableconditions (Figure 2a). However, Figure 2b also shows thatthe presence of greater H2O2 concentrations caused a gradualloss in ECL intensity. Thus, for 5.0 M H2O2 only 15 μW cm−2
was obtained as maximal at 5.0 V vs Ag|AgCl. The progressivefall in light emission for H2O2 concentrations >0.05 M can berelated to the loss of generated O2
•− by enhancement of itsparasitic reactions, e.g. reaction 521 with second-order rateconstant k = 9.7 × 10⁷ M−1 s−1:
+ → +•− • −O HO HO O2 2 2 2 (5)
Photographs of Figure 3 illustrate the light emitted by BDDfrom oxidation of 0.01 M luminol at pH 12.0 in the cylindrical
cell. As can be seen in Figure 3a, a uniform blue color over the3 cm2 anode surface is achieved when the higher ECL intensityis obtained in the absence of H2O2 at 2.5 V vs Ag|AgCl. A muchmore intense ECL can be observed in Figure 3b by applying thesame potential after addition of 0.10 M H2O2. Note that BDDnot only emitted a much more brilliant blue color, but also thesolution was illuminated by light reflection on the cell glass.
Figure 2. Variation of ECL intensity with potential applied to a 3 cm2
BDD thin-film anode. The three-electrode cell with flat wallscontained a 5 cm2 Pt sheet as cathode and an Ag|AgCl, KCl(sat.)reference electrode. Solutions of 0.01 M luminol in NaOH at pH 12.0,at 25 °C, and under magnetic stirring at 700 rpm were oxidized. (a)Without H2O2. (b) H2O2 concentration: (□) 0.05 M, (■) 0.10 M,(◇) 0.50 M, (▲) 1.0 M, (▽) 2.5 M, and (▼) 5.0 M.
Figure 3. Photographs of the ECL emitted by a 3 cm2 BDD thin-filmanode during luminol oxidation. The three-electrode cylindrical cellcontained a 5 cm2 Pt sheet as cathode and an Ag|AgCl, KCl(sat.)reference electrode. (a) Solution of 0.01 M luminol in NaOH of pH12.0 oxidized at E = 2.5 V vs Ag|AgCl and 25 °C under magneticstirring at 700 rpm. (b) Solution with 0.10 M H2O2.
The Journal of Physical Chemistry C Article
dx.doi.org/10.1021/jp305493g | J. Phys. Chem. C 2012, 116, 15500−1550415502
217

The role of ROS generated from OH− and HO2− oxidation
on the ECL process of luminol was analyzed from the influenceof radical scavengers such as DMSO and p-benzoquinone onlight emission. DMSO is a well-known scavenger of •OH andwas chosen due to the second-order rate constant for itsreaction with this radical (k = 5.4 × 10⁹ M−1 s−1)22 beinggreater than that of luminol with •OH (k = 4.8 × 10⁹ M−1
s−1).23 On the other hand, the action of p-benzoquinone waschecked since it is a specific quencher24 of O2
•− via fast electrontransfer reaction with k = 9.6 × 10⁸ M−1 s−1.25
Figure 4a evidences the existence of 9.5% reduction for theECL intensity of luminol with 0.10 M H2O2 when 0.01 M
DMSO was also present in solution. This little effect on lightemission can be explained by the competence of the anodicoxidation of DMSO by electron transfer, thereby confirming•OH is not produced during OH− and HO2
− oxidation, assuggested above from results of linear sweep voltammetry. Incontrast, Figure 4b shows a dramatic decay of ECL intensityfrom the same luminol solution by increasing p-benzoquinoneconcentration up to 0.01 M. The inhibition was alreadysignificant for 10−3 M p-benzoquinone, while at 0.01 M amaximum intensity as low as 1.2 μW cm−2 at 5.0 V vs Ag|AgClwas determined. These findings corroborate that the largeenhancement of ECL of luminol in the presence of H2O2 onBDD is due to the participation of O2
•− formed from HO2−
oxidation.From the above results, a reaction mechanism for the ECL of
luminol on BDD in alkaline solution is proposed in Scheme 1.Since pKa1 = 6.7 and pKa2 = 15.1 for luminol,1 its monoanionic
form is the prevalent species at pH = 12.0. The mechanism isthen initiated by the one-electron oxidation of this mono-anionic form with deprotonation to obtain a phthalazinequi-none radical that follows pathway I in the absence of H2O2 ormainly pathway II in the presence of H2O2. Direct oxidation ofthe monoanionic form of luminol with O2
•− via electrontransfer can be discarded due to its small second-order rateconstant (k = 1 × 10⁴ M−1 s−1).26 In pathway I, thephthalazinequinone radical undergoes a one-electron oxidationto 5-aminophthalazine-1,4-dione. This species is subsequentlytransformed into 3-aminophthalate dianion in the excited tripletstate via nucleophilic attack of OH− followed by denitrogena-tion, one-electron oxidation of the radical anion formed, andfinally deprotonation.5 3-Aminophthalate dianion is alsogenerated in pathway II via nucleophilic attack of O2
•− onthe less poorly charged carbonyl group of phthalazinequinoneradical, followed by cyclic addition of oxygen from the addedsuperoxide to the other carbonyl carbon forming a cyclic-antiaromatic endoperoxide and loss of N2.
1 The 3-amino-phthalate dianion in the excited triplet state formed in pathwaysI and II then undergoes a slow spin-flip process to an excitedsingle state, which in turn falls to the ground state with lightemission.1 The weak intensity obtained in pathway I canaccount for the disappearance of intermediates by alternativeoxidation reactions, as evidenced by the ECL decay found atBDD potentials >2.8 V vs Ag|AgCl (Figure 2a). In contrast, theselective nucleophilic attack of O2
•− on the phthalazinequinoneradical can justify a larger formation of the 3-aminophthalate
Figure 4. Effect of radical scavengers on ECL intensity vs potentialapplied to a 3 cm2 BDD thin-film anode. The same three-electrode cellas in Figure 2 was used. (a and b) (□) 0.01 M luminol with 0.10 MH2O2 in NaOH of pH 12.0 at 25 °C under stirring at 700 rpm. (a)(●) With 0.01 M DMSO. (b) p-Benzoquinone concentration: (■)10−5 M, (◇) 10−4 M, (◆) 10−3 M, (Δ) 2.5 × 10⁻³ M, (▲) 5.0 × 10⁻³
M, and (▼) 0.01 M.
Scheme 1. Reaction Mechanism Proposed for the ECL ofLuminol in Alkaline Medium on a BDD Thin-Film Anode in(I) the Absence and (II) Presence of H2O2
The Journal of Physical Chemistry C Article
dx.doi.org/10.1021/jp305493g | J. Phys. Chem. C 2012, 116, 15500−1550415503
218

dianion in the excited triplet state giving rise to the strongenhancement of ECL.
When the polarity of the electrodes in the potentiostaticexperiments was reversed and the Pt sheet acted as anode, noECL at potentials up to 5.0 V vs Ag|AgCl was observed. Thisbehavior could seem surprising because similar electron-transferand chemical reactions for luminol could be postulated, inprinciple, for both Pt and BDD anodes. However, BDD differsfrom other anodes by its ability of adsorbing very weakly ROSand organics.10−12 This suggests that luminol is able tocontinuously emit ECL at BDD potentials from 0.5 to 5.0 Vvs Ag|AgCl due to chemical reactions of intermediates takingplace in the vicinity of the BDD surface, whereas such reactionsare not produced when reactants remain adsorbed on the Ptsurface.
4. CONCLUSIONSIn summary, it has been found that luminol in alkaline mediumof pH 12.0 emits ECL when it is oxidized on a BDD thin-filmsurface at potentials higher than 0.5 V vs Ag|AgCl, reachingmaximum intensity at about 2.5 V vs Ag|AgCl. The formationof the emitter 3-aminophthalate dianion can be accounted forby direct electron-transfer reactions of luminol and its oxidationproducts, combined with chemical reactions involving thenucleophilic attack of OH− and loss of N2, withoutparticipation of •OH. In the presence of H2O2, O2
•− is alsoproduced from direct oxidation of HO2
− on BDD. This radicalanion is able to react very rapidly with the initiallyelectrogenerated radical from the monoanionic form ofluminol, leading to a much greater generation of the emitter,strongly enhancing the ECL process. The oxidant role of O2
•−
was confirmed by the dramatic inhibition of light emission afteraddition of the scavenger p-benzoquinone. This behavior ischaracteristic of luminol on BDD, since it is not observed forconventional anodes such as Pt. It can then be associated withthe reactions of intermediates with OH− and/or O2
•− near theBDD vicinity due to the low adsorption of these species on theanode surface. These findings can contribute to a betterproperties characterization of the conductive-diamond electro-des, the understanding of the oxidation mechanisms of organicsby ROS, and the development of BDD sensors forbiomolecules.27−29
■ AUTHOR INFORMATIONCorresponding Author*E-mail: [email protected].
NotesThe authors declare no competing financial interest.
■ ACKNOWLEDGMENTSWe acknowledge financial support from MICINN (Ministeriode Ciencia e Innovacion, Spain) through Project CTQ 2010-16164/BQU, cofinanced with FEDER funds. The grantawarded to S.G.-S. by MEC (Ministerio de Educacion yCiencia, Spain) is also acknowledged.
■ REFERENCES(1) Barni, F.; Lewis, S. W.; Berti, A.; Miskelly, G. M.; Lago, G.Talanta 2007, 72, 896−913.(2) Barnett, N. W.; Francis, P. S. In Encyclopedia of Analytical Science;
Worsfold, P., Townshend, A., Poole, C., Eds.; Elsevier Academic Press:London, 2005; pp 506−511.
(3) Wang, W.; Cui, H.; Deng, Z.-X.; Dong, Y.-P.; Guo, J.-Z. J.Electroanal. Chem. 2008, 612, 277−287.(4) Cui, H.; Zhang, Z. F.; Zou, G. Z.; Lin, X. Q. J. Electroanal. Chem.2004, 566, 305−313.(5) Wro blewska, A.; Reshetnyak, O. V.; Koval’chuk, E. P.;
Pasichnyuk, R. I.; Błazejowski, J. J. Electroanal. Chem. 2005, 580,41−49.(6) Janiak, D. S.; Kofinas, J. P. Anal. Bioanal. Chem. 2007, 389, 399−
404.(7) Lin, Y.; Chen, J. H.; Chen, G. N. Electrochim. Acta 2008, 53,
2396−2401.(8) Guo, W. Y.; Li, J. J.; Chu, H. H.; Yan, J. L.; Tu, Y. F. J. Lumin.2010, 130, 2022−2025.(9) Chen, M.; Wei, X. H.; Tu, Y. F. Talanta 2011, 85, 1304−1309.(10) Martínez-Huitle, C..A.; Ferro, S. Chem. Soc. Rev. 2006, 35,
1324−1340.(11) Martínez-Huitle, C..A.; Brillas, E. Angew. Chem., Int. Ed. 2008,47, 1998−2005.(12) Panizza, M.; Cerisola, G. Chem. Rev. 2009, 109, 6541−6569.(13) Honda, K.; Yamaguchi, Y.; Yamanaka, Y.; Yoshimatsu, M.;
Fukuda, Y.; Fujishima, A. Electrochim. Acta 2005, 51, 588−597.(14) Yang, Y.; Oh, J.-W.; Kim, Y.-R.; Terashima, C.; Fujishima, A.;
Kim, J. S.; Kim, H. Chem. Commun. 2010, 46, 5793−5795.(15) Enache, T. A.; Chiorcea-Paquim, A.-M.; Fatibello-Filho, O.;
Oliveira-Brett, A. M. Electrochem. Commun. 2009, 11, 1342−1345.(16) Martínez-Huitle, C. A.; Ferro, S.; Reyna, S.; Cerro-Lopez, M.;
De Battisti, A.; Quiroz, M. A. J. Braz. Chem. Soc. 2008, 19, 150−156.(17) Koppenol, W. H.; Liebman, J. F. J. Phys. Chem. 1984, 88, 99−
101.(18) Brillas, E.; Maestro, A.; Moratalla, M.; Casado, J. J. Appl.Electrochem. 1997, 27, 83−92.(19) Chan, P. C.; Bielski, B. H. J. J. Biol. Chem. 1974, 249, 1317−
1319.(20) Wood, P. M. Biochem. J. 1988, 253, 287−289.(21) Bielski, B. H. J.; Cabelli, D. E.; Arudi, R. L.; Ross, A. B. J. Phys.Chem. Ref. Data 1985, 14, 1041−1100.(22) Bardouki, H.; Barcellos da Rosa, M.; Mihalopoulos, N.; Palm,
W.; Zetzsch, C. Atmos. Environ. 2002, 36, 4627−4634.(23) Schiller, J.; Arnhold, J.; Schwinn, J.; Sprinz, H.; Brede, O.;
Arnold, K. Free Radical Res. 1999, 30, 45−57.(24) Stylidi, M.; Kondarides, D. I.; Verykios, X. E. Appl. Catal. B:Environ. 2004, 47, 189−201.(25) Bandara, J.; Kiwi, J. New J. Chem. 1999, 23, 717−724.(26) Nosaka, Y.; Yamashita, Y.; Fukuyama, H. J. Phys. Chem. B 1997,101, 5822−5827.(27) Guinea, E.; Centellas, F.; Brillas, E.; Canizares, P.; Saez, C.;
Rodrigo, M. A. Appl. Catal. B: Environ. 2009, 89, 645−650.(28) Patel, B. A. In Synthetic Diamond Films: Preparation, Electro-chemistry, Characterization, and Applications; Brillas, E., Martínez-Huitle, C. A., Eds.; John Wiley & Sons, Inc.: Hoboken, NJ, 2011; pp513−550.(29) Yang, N.; Nebel, C. E. In Synthetic Diamond Films: Preparation,Electrochemistry, Characterization, and Applications; Brillas, E.,Martínez-Huitle, C. A., Eds.; John Wiley & Sons, Inc.: Hoboken, NJ,2011; pp 551−619.
The Journal of Physical Chemistry C Article
dx.doi.org/10.1021/jp305493g | J. Phys. Chem. C 2012, 116, 15500−1550415504
219

Results and Discussion �
�����
Results and Discussion
�����
Removal of residual persistant organic
pollutants in a real secondary effluent by
anodic oxidation with BDD anodes

Results and Discussion �
�����

Results and Discussion
�����
The work developed during my pre-doctoral stay in the AWMC of Australia consisted of
the application of the AO with BDD to remove pollutants from a real matrix of
wastewater. This work allowed deepening on the EAOPs processes in order to assess their
viability. The removal of 29 POPs (see Table 13) including pharmaceuticals and
herbicides in real concentration of 100 μg L-1 was studied for a real secondary effluent
from a sewage treatment plant. Experiments with 10 L of this complex pollutant matrix
were conducted in a pre-pilot flow plant containing a divided electrochemical filter-press
reactor separated by a cation exchange membrane with a BDD anode and a stainless steel
cathode of 40.8 cm2 of electroactive area and a constant liquid flow rate of 162 mL min−1.
The assays were made during 24 or 48 h. In order to evaluate the mineralization and the
reduction of oxidisable matter, the change in DOC and COD was monitored. The LC-
MS/MS analysis after samples extraction with pre-concentration with solid phase
extraction (SPE) carridges allowed following the pollutants decay during the process. The
influence of experimental variables such as applied density current and pH was checked.
The evolution of Cl− ion present in the real wastewater was determined by measuring the
contents of Cl−, ClO3−, ClO4− , free Cl2, and organohalogenated compounds generated
during the treatment.
As can be seen in Fig. 14, pollutants 1-20 were completely removed in 24 h under all the
conditions tested. Nevertheless, working at pH 3.0 and 800 mA almost all them
disappeared. The last pollutants hardly degraded due to their recalcitrant character were
mainly herbicides. This recalcitrant character favours the quicker competitive destruction
of other compounds with oxidizing BDD(�OH) formed at the anode from reaction (9).
Furthermore, Fig. 15 highlights that operating at pH 3.0 and applying 800 mA it is
possible to reach the same removal than applying 400 mA, but only in 2 h of treatment.
This can be ascribed to the larger generation of BDD(�OH) at greater current that
accelerates the destruction of pollutants.

Results and Discussion �
�����
Table 13. Persistent organic pollutants treated in the secondary effluent complex water
matrix.
Number Name Type and Usage 1 Sulfadiazone Sulfonamide antibiotic 2 Diazonin Organophosphate insecticide 3 Trimethoprim Bacteriostatic antibiotic 4 Ranitidine hydrochloride Pharmaceutical for gastric diseases 5 Norfloxacin Fluoroquinolone antibiotic 6 Lincomycin Lincosamide antibiotic 7 Gemfibrozil Lipid regulating agent 8 Acetominophen Analgesic and anti-inflammatory 9 Tramadol hydrochloride Opioid analgesic
10 Metoprolol β-blocker 11 Diclofenac Non-steroidal anti-inflammatory and
analgesic 12 Carbamazepine Anticonvulsive 13 Caffeine Metabolic stimulant 14 Enrofloxacin Fluoroquinolone antibiotic 15 Venlafaxine hydrochloride Anti-depressive 16 Citalopram Anti-depressive 17 Roxithromycin Macrolide antibiotic 18 Sertraline hydrochloride Anti-depressive 19 Diuron Herbicide 20 Hydrochlorothiazide Thiazide diuretic 21 Ibuprophen Non-steroidal anti-inflammatory and
antipyretic 22 Metalochlor Aniline derivative herbicide 23 Ditriazoate Radiocontrast 24 Phenytoin Antiepileptic 25 Iopromide Contrast for intravascular use 26 Atrazine Herbicide 27 DEET Insect repellent 28 2,4-D Herbicide 29 Trichlopyr Herbicide

Results and Discussion
�����
Figure 14. Percentage of pollutant removal listed on Table 13 in a real wastewater matrix
after 24 h of AO treatment with BDD in a pre-pilot flow plant of 10 L.
Figure 15. Percentage of pollutants removal in a pre-pilot flow plant of 10 L after 2h of
AO with BDD.
% R
emov
al
% R
emov
al

Results and Discussion �
�����
The COD and DOC evolution depicted in Fig. 16a and b, respectively, also showed
higher effectiveness for organic matter removal at the higher current of 800 mA instead
of applying 400 mA. The pH of the reaction medium was also important for the
destruction of organics, and so, the removal of COD and DOC was strongly enhanced at
pH 3 in front of neutral pH. Note that the main DOC content was due to the presence of
recalcitrant natural organic matter (NOM) contained in the real water sample, which is
Figure 16. (a) Chemical oxygen demand and (b) dissolved organic carbon decay during
the AO treatment with BDD of a real water matrix of 29 persistent organic pollutants in
a secondary effluent from a sewage water treatment plant.
0
0.2
0.4
0.6
0.8
1.0
1.2400 mA pH=3400 mA pH=7800 mA pH=7800 mA pH=3
CO
D /
CO
D0
0.0
0.2
0.4
0.6
0.8
1.0
0 4 8 12 16 20 24 28
400 mA pH=3400 mA pH=7800 mA pH=7800 mA pH=3
DO
C /
DO
C0
time / h
(a)
(b)

Results and Discussion
����
also completely removed during the treatment. Results of Fig. 16 then demonstrate that
the AO process with BDD is able to destroy the POPs, their by-products (sometimes even
worse than the POPs) and even the NOM.
A content of 305.5 mg L−1 of Cl− ion in the secondary effluent was determined. In fact,
the presence of Cl− and other inert inorganic ions in solutions are the responsible of the
water conductivity and enable direct treatment without adding any salt as supporting
electrolyte. It is well known that the oxidation of Cl− ion at the BDD anode yields Cl2,
and ClO−/HClO depending on pH, which can attack the organic matter generating
organochlorinated compounds that are even more toxic and hazardous than the treated
pollutants. Besides, these chlorinated species con also evolve to other ions like chlorate
(ClO3−) or perchlorate (ClO4−) that are considered noxious. For all these reasons, the
knowledge of the evolution of chloride ion and chlorinated species is of great interest to
evaluate the viability of AO with BDD for POPs remediation.
As expected, Fig. 17a highlights that the Cl− concentration underwent a slow, but
progressive, decay during the treatment. A continuous generation and accumulation of
ClO3− and ClO4− ions can be observed in Figs. 17 band c, respectively. At higher current
more amount of ClO4− was produced due to the quicker oxidation of ClO3−. ClO4− ion
was always accumulated in larger extent at pH 7.0. The AOX measurements allowed
evaluating the organochlorates generated during the treatments (see Fig. 18), which
showed a low accumulation (< 20 μM), considerably under the limits by law.
The ClO− ion and chloroamines generation were also determined in order to perform a
complete mass balance. The final results after 24 h of treatment are summarized in Table
14, were the concentrations of all species are expressed as mg L−1 of Cl. The sum of all
the determined species disagree with the initial concentration of Cl− ion due to the loss of
Cl2 gas. From the chlorine mass balance, one can conclude that the method is viable due
to the lower concentration of chlorine species generated and accumulated in the different
media, always lower than the recommended concentrations by law. Furthermore the
generation of ClO− and chloramines stimulate water disinfection processes.

Results and Discussion �
����
Figure 17. Change of concentration of (a) Cl−, (b) ClO3− and (c) ClO4− ions during the
AO treatment with BDD of 29 POPs in a pre-pilot flow plant of 10 L using a divided
electrochemical filter-press cell.
0
25
50
75
100
125
[ClO
3− ] / m
g L-1
0
25
50
75
100
0 4 8 12 16 20 24 28
[ClO
4− ] / m
g L-1
time / h
0
50
100
150
200
250
300
350
400 mA pH=3400 mA pH=7800 mA pH=7800 mA pH=3
[Cl− ] /
mg
L-1
(a)
(b)
(c)

Results and Discussion
�����
Figure 18. Generated organochlorinated species during the same treatments of Fig. 17.
Table 14. Concentration of chlorinated species accumulated after 24 h of AO with BDD
at 800 mA expressed as mg L−1 of Cl. Initial Cl− concentration in the secondary effluent
of 305.5 mg L−1.
Cl−− ClO− ClO3 − ClO4 − Chloramines Total Initial-total
400 mA pH= 3 172.0 11.71 17.71 3.53 68.0 273.09 32.40
400 mA pH= 7 171.0 17.24 50.60 7.07 56.8 302.71 2.79
800 mA pH= 7 196.0 0.21 13.92 35.35 2.2 247.44 57.82
800 mA pH= 3 224.0 0.20 19.82 14.14 6.3 264.44 41.06
0
5
10
15
20
25
0 4 8 12 16 20 24 28
400 mA pH=3400 mA pH=7800 mA pH=7800 mA pH=3
[Org
anoc
hlor
ates
] / μ
M
time / h

Results and Discussion �
�����
The main conclusion of this work developed is that it has been demonstrated the
effectiveness of AO with BDD to decontaminate a real complex matrix of pollutants at
real concentration in secundary effluents from sewage treatment plants. The study has
shown not only the complete removal of the organic matter associated to these pollutants
and NOM, but also their viability by the quantification of the low amounts of chlorinated
species generated during the treatment.

�����
RESUMEN

�����
�

Resumen �
�����
El principal objetivo de esta tesis ha sido el estudio de la aplicabilidad de metodologías
electroquímicas de oxidación avanzada al tratamiento de aguas contaminadas con
contaminantes orgánicos persistentes. En este sentido, los resultados de la investigación
se presentan agrupados en cuatro bloques referente al tratamiento de fármacos, colorantes
azoicos, un efluente real contaminado con 29 POPs en concentración real (trabajo
desarrollado durante mi estancia pre-doctoral en el AWMC de la UQ de Australia) y,
finalmente, el estudio de ECL sobre ánodo de BDD como método de estudio de la
electrogeneración de radicales fisisorbidos.
El tratamiento de aguas sintéticas contaminadas con los fármacos antibacterianos FLU y
CHL mediante los EAOPs conocidos como AO, EF, PEF y SPEF puso de manifiesto la
gran eficiencia de estos procesos de descontaminación. La comparación entre los cuatro
procesos evidenció una más rápida eliminación del contaminante de partida en el orden
AO -Pt < AO -BDD < EF < PEF < SPEF. La utilización de un ánodo de BDD en lugar de
uno de Pt tanto en AO como en los EAOPs basados en la reacción de Fenton favoreció
los procesos degradativos de forma apreciable. Al comparar los procesos de AO se pudo
comprobar que mientras que con el ánodo Pt el fármaco no se mineralizaba, con el BDD
alcanzaba un 78% de eliminación del DOC en 6 h. Estos resultados suponen una prueba
fehaciente de la mayor reactividad de los radicales BDD(•OH) frente a los de Pt(•OH).
Por otro lado, los análisis de HPLC permitieron constatar que si bien el ánodo de Pt es
incapaz de mineralizar, sí que favorece los procesos de conversión del contaminante de
partida disminuyendo su concentración en disolución, aunque más lentamente que el
ánodo de BDD.
La mayor eficiencia de los EAOPs basados en la reacción de Fenton se relaciona con la
doble vía de generación de radicales, los BDD(�OH) fisisorbidos en el ánodo que son los
generados en AO y los �OH en el seno de la disolución generados mediante la reacción
de Fenton. Los radicales �OH generados en el seno de la disolución presentan una mayor
reactividad debido a que no están controlados por el transporte de materia hacia/desde los
electrodos, eliminando los compuestos aromáticos en tiempos muy cortos. El proceso de
EF presenta, sin embargo, cierta limitación al alcanzar un porcentaje de mineralización
en el que se mantiene prácticamente estacionario que fue de un 77% para la FLU y de
81% para el CHL. Este comportamiento se debe a la formación de complejos de hierro
(III) con algunos ácidos carboxílicos generados como intermedios finales, por ejemplo el
ácido oxálico, que son aún más recalcitrantes que el ácido libre. Afortunadamente,

Resumen �
�����
muchos de estos complejos son rápidamente fotodegradados por la luz UVA en el proceso
PEF, donde se alcanzan mineralizaciones prácticamente completas en 360 min y 270 min
de tratamiento para la FLU y el CHL, respectivamente. Cuando se utilizó radiación solar
como fuente gratuita de radiación en lugar de la lámpara UVA, se obtuvieron
mineralizaciones completas para el CHL en tan solo 90 min de tratamiento. Este hecho
pone de manifiesto la influencia de la intensidad de radiación en la cinética de fotólisis
de los complejos, donde la radiación UV de la luz solar de 30 W m-2 es hasta seis veces
superior a la de 5 W m-2 emitida por la lámpara.
Se estudiaron diferentes variables como parámetros de control de los procesos EAOPs,
tales como la concentración inicial de contaminante, la densidad de corriente aplicada y
la concentración del catalizador de Fenton o sea el Fe2+. La influencia de la concentración
inicial de contaminante se evaluó tratando disoluciones de CHL con contenidos de 10 a
100 mg L-1 de DOC iniciales por SPEF, donde las disoluciones tratadas se mineralizaron
totalmente a tiempos similares independientemente de su concentración inicial. Estos
resultados indican que un aumento de la concentración inicial incrementa la eficiencia del
proceso con diferencias que van del 12% al 100% de la MCE, que se justifica por la
inhibición de las reacciones parásitas con el aumento de la concentración del DOC. Los
análisis de HPLC para la degradación de CHL permitieron la determinación de k1, que
sorprendentemente resultó ser mayor para menores concentraciones iniciales de CHL.
Este hecho experimental se explica por la corta vida de los radicales hidroxilos generados,
de 4 × 10⁻⁹ s, que deben ser continuamente generados y presentan una concentración
constante en el medio que queda englobada dentro de la constante cinética k1, cuyo valor
depende de cada condición experimental. Con el aumento de la DOC en solución
disminuye la acumulación de radicales y en consecuencia decrece el valor de k1.
Un parámetro de control electroquímico indiscutible es la j. La influencia de esta variable
en el tratamiento de ambos antibióticos era similar. El incremento de j produjo un
aumento gradual pero no proporcional de la velocidad de mineralización, alcanzándose
mayores porcentajes de eliminación a menores tiempos de tratamiento. En contrapartida,
el incremento de j causó un descenso de la MCE debido al enaltecimiento de las
reacciones parasitas. La pérdida de eficiencia es la causa directa por la que la velocidad
de degradación no aumenta proporcional con j. A partir de estos resultados se puede
concluir que una mayor j no siempre mejora las condiciones de tratamiento, puesto que
disminuye la MCE y además aumenta el consumo energético.

Resumen �
�����
La concentración inicial de Fe2+ es un parámetro que ha sido ampliamente estudiado en
nuestro grupo, donde se había determinado que un valor de 0,05 mM era óptima en una
amplia mayoría de casos. Se observó que mayores concentraciones inhibían los procesos
degradativos ya que el aumento de concentración de Fe2+ en disolución favorecía a su vez
el aumento de la reacción de oxidación del catalizador a Fe3+ con el radical �OH,
inhibiendo consecuentemente la reacción de Fenton y consumiendo radicales perdiendo
así capacidad oxidativa del sistema. Sin embargo, la FLU es una excepción pues se
determinó que la concentración óptima de Fe2+ de 2,0 mM. Ello se debe a que el Fe2+
juega un doble papel, el ya conocido de catalizador y como agente complejante de la FLU.
La formación del complejo anaranjado de Fe2+ con FLU aumenta la solubilidad del
contaminante e inhibe la reacción de Fenton al “capturar” el catalizador por la formación
del complejo.
Los análisis de LC-MS, de HPLC de fase inversa y de exclusión iónica y la cromatografía
iónica permitieron la identificación y cuantificación de diferentes intermedios de
mineralización de los contaminantes. Al contener los antibióticos en sus estructuras
moleculares N y F (en el caso de la FLU) o Cl (en el caso de CHL) el proceso de
mineralización conlleva la generación de iones inorgánicos como NO3−, NH4+, Cl− y F−
tal y como se detectó y cuantificó por cromatografía iónica. En ambos casos, se liberó y
acumuló en el medio rápidamente el ion Cl−, el cual fue posteriormente oxidado a Cl2.
Por otro lado, el N contenido tanto en la FLU como en el CHL se mantuvo invariable en
disolución y fue principalmente transformado y acumulado en forma de ion NO3− y ácido
oxámico, aunque también se detectaron pequeñas concentraciones de ion NH4+.
Los análisis de muestras de disoluciones de CHL tratadas por EAOPS analizadas por LC-
MS, permitieron la identificación de diferentes intermedios aromáticos de degradación y
de sus derivados hidroxilados. Los análisis de HPLC por exclusión iónica detectaron
ácidos carboxílicos de cadena corta procedentes de la rotura y apertura de los anillos
aromáticos de la FLU y del CHL. A partir de todos los intermedios detectados para la
FLU y el CHL se propusieron las correspondientes secuencias de reacción para su
mineralización por los distintos procesos ensayados.
Cabe destacar que en los tratamientos de la FLU y del CHL se detectaron como
intermedios de degradación los ácidos oxálico y oxámico, ambos acumulados en gran
concentración. El DOC correspondiente a la suma de ambos intermedios suponía en

Resumen �
�����
ambos casos la práctica totalidad del DOC en disolución en los tiempos finales de las
electrólisis. Este hecho puso de manifiesto el alto carácter recalcitrante de estos
compuestos y su relevancia e influencia en la eficiencia de los EAOPs, por lo que se
realizó un estudio más profundo sobre ellos.
Se realizaron ensayos de fotólisis de los ácidos oxálico y oxámico en ausencia y en
presencia de iones hierro (II) y (III). Los análisis de las cinéticas de degradación de ambos
compuestos demostraron que los complejos de los ácidos con el Fe(III) son las especies
fotoactivas, conduciendo a una rápida mineralización de las disoluciones, tal y como se
había observado en PEF. Se consideró así que el proceso de oxidación por fotólisis es
debido a una reacción de transferencia de carga del ligando al metal. Por otro lado, los
ensayos con EAOPs demostraron que la oxidación del acido oxálico libre es mucho más
rápida que la de sus complejos con Fe(II) y Fe(III). Sin embargo, ocurre todo lo contrario
en el caso del ácido oxámico. Este comportamiento fue corroborado a través del análisis
por voltamperometría cíclica. También se pudo comprobar que la curvas de de descensos
del DOC correspondientes al tratamiento con celdas de BDD/SS y de BDD/ADE ambos
en presencia de Fe2+ eran superponibles. Estos resultados indican que la oxidación de
estos ácidos está solamente relacionada con el ánodo de BDD y los radicales BDD(�OH)
y no con los �OH generados en las condiciones electro-Fenton (BDD/ADE en presencia
de Fe2+). El tratamiento de AO en presencia de Fe2+ e irradiación con luz UVA permitió
alcanzar en ambos casos una mineralización completa en menores tiempos de tratamiento.
El tratamiento de mezclas de oxálico-oxámico por los diferentes tratamientos evidenció
cambios en las constantes k1 de cada compuesto en función de la relación de
concentración oxálico/oxámico, debido no sólo a que las reacciones de oxidación son
competitivas sino a que también lo son la formación de sus complejos con los iones hierro.
Los prometedores resultados obtenidos en el tratamiento de disoluciones con CHL por
SPEF desembocó en el escalado del proceso a una planta pre-piloto de 10 L conteniendo
una celda filtro prensa de Pt/ADE acoplada a un CPC como fotorreactor solar. Para el
tratamiento de 10 L aplicando 100 mA cm−2 se obtuvieron eliminaciones del 89% de DOC
en 180 min con un coste energético total de 0,347 kWh g−1 DOC (30,8 kWh m−3) y un
coste estimado de 4,35 € m-3.
Dentro del estudio del tratamiento de aguas contaminadas con fármacos mediante
EAOPs, se consideró el tratamiento de un agua real contaminada con FLU. En este

Resumen �
����
estudio se demostró que tanto los tratamientos EF como PEF eran capaces de eliminar la
NOM del efluente real así como el contaminante FLU con la misma eficiencia y
prácticamente velocidad en que era eliminado en el tratamiento del agua sintética.
El tratamiento de aguas sintéticas contaminadas con los colorantes azoicos AO7, AR151,
DB71 y DY4 mediante SPEC, AO, EF, PEF, PA-EF y SPEF puso de manifiesto la
viabilidad de los mismos en el tratamiento de estos contaminantes.
El proceso de decoloración se estudió en profundidad dado el elevado interés industrial
como principal objetivo en el tratamiento de este tipo de aguas. Se consideró la
decoloración de tres colorantes con una estructura similar e idénticos grupos funcionales
(-OH, -SO3−) pero con número creciente de enlaces azo. Estos colorantes fueron el
monoazo AO7, el diazo RA151 y el triazo DB71. La decoloración mediante EF demostró
ser mucho más rápida (entre 30-60 min) que por AO donde se requiere más de 6 h.
También se comprobó que otros cátodos diferentes del ADE como el grafito propiciaban
procesos de reducción del enlace azo aumentando la velocidad de decoloración debido a
una vía alternativa de degradación del compuesto. Es por ello que se aconseja utilizar el
ADE o trabajar en celdas separadas para estudiar exclusivamente el proceso de oxidación.
Para el estudio comparativo se introdujo un parámetro experimental denominado
velocidad de decoloración inicial (δ0), se define como la pendiente de la curva del
porcentaje de de eliminación de color con el tiempo al inicio del proceso (20-25% de
decoloración) donde el responsable del color es primordialmente el colorante de partida
debido a la baja concentración de intermedios coloreados en ese estadio La representación
de este parámetro versus la concentración de enlaces azoicos totales en disolución
evidenció que la velocidad de decoloración estaba estrechamente ligada con el número
de enlaces azo por molécula. La disminución de la velocidad de decoloración se justificó
por la mayor estabilización de los sistemas π conjugados que hace que se precise de una
mayor energía de activación para el ataque electrofilico de los radicales hidroxilo. El
incremento de la j se traduce en un aumento de la δ0 hasta un valor máximo, relacionado
con el enaltecimiento de las reacciones parásitas como ya se comentó anteriormente. El
aumento de la velocidad de decoloración con j era menor al aumentar el número de
enlaces azo por molécula. Este hecho empírico se puede relacionar nuevamente con la
estabilización de los sistemas π. Los valores determinados de k1 y kdec son diferentes entre
sí aún cuando muestran las mismas tendencias, por lo que se puede concluir que la
consideración de que la kdec describe la cinética de decoloración del compuesto es errónea.

Resumen �
����
La diferencia entre ambas constantes se debe a la generación de intermedios de oxidación
del colorante que presentan unos valores de λmáx de absorción similares o cercanas a las
del contaminante de partida. Este hecho es fácilmente constatable en los espectros de
absorción de UV-vis registrados en los que se aprecia un desplazamiento del valor de λmáx
y de un ensanchamiento de la banda con el tiempo de tratamiento.
El estudio del comportamiento de los ácidos oxálico y oxámico propició el desarrollo de
un método derivado que denominamos PA-EF. Esta técnica consiste en aplicar el
tratamiento de EF hasta la máxima acumulación de los ácidos carboxílicos, parar la
electrólisis y posteriormente irradiar la disolución con luz UVA para fotolizar los
complejos de Fe(III)-carboxilato generados y acumulados en el medio. El resultado
obtenido en el tratamiento de disoluciones de DY4 demostró que se podía alcanzar
mineralizaciones completas por esta técnica en tiempos de tratamiento similares a los
utilizados en PEF pero con un consumo de energía apreciablemente menor.
Se realizó el escalado del proceso PEF a una planta pre-piloto de 10 L para tratar las
disoluciones contaminadas mediante SPEF, obteniéndose mineralizaciones
prácticamente completas en 240 min. Como diferencia sustancial respecto al escalado
anteriormente realizado en el tratamiento de CHL, se utilizó como fuente renovable de
energía para el funcionamiento de la planta la proporcionada por una placa fotovoltaica
acoplada al sistema, con lo que el consumo energético se redujo en su totalidad.
Se estudiaron los efectos de variables clave sobre el tratamiento de colorantes como son
la concentración inicial de substrato y del catalizador Fe2+ o de j, encontrándose
comportamientos similares a los de los fármacos. Los análisis de HPLC y de LC-MS
permitieron identificar diferentes compuestos aromáticos y sus hidroxilados, ácidos
carboxílicos e iones inorgánicos generados en el tratamiento de DY4 por SPEF,
permitiendo proponer su secuencia de reacción. Además, los análisis de iones realizados
junto con las medidas de TN permitieron comprobar que durante el tratamiento de los
colorantes azoicos el N inicial se pierde primordialmente en forma de especies volátiles
de N, como N2 o NOx, y que el remanente en disolución (~20-40%) está en forma de
NH4+ y NO3− en cantidades similares.
En colaboración con el CPT de la UB se sintetizaron y caracterizaron fotoánodos de TiO2
que se aplicaron al tratamiento de colorantes por SPEC. Los resultados experimentales
evidenciaron que aguas contaminadas con bajas concentraciones del colorante AO7 (15

Resumen �
�����
mg L−1) pueden ser completamente decoloradas en 180 min de tratamiento. Se estudió la
influencia de j en el tratamiento por SPEC hasta 2 mA cm−2. Se observó que la aplicación
de una corriente anodica tan baja como 0,25 mA cm−2 incrementaba notablemente la
decoloración en comparación con el proceso SPC (sin corriente). Se determinó que la j
óptima para el tratamiento SPEF era de 1 mA cm−2. El pH demostró afectar de forma
directa el proceso de degradación del colorante AO7 ya que los espectros registrados tras
el tratamiento indicaban la formación de intermedios diferentes. Además, sólo a pH 7,0
se alcanzó la decoloración completa, por lo que se consideró como el pH óptimo. Los
análisis de HPLC por exclusión iónica de las disoluciones de AO7 tratadas por SPEC
pusieron de manifiesto que el 86% del DOC remanente al final del proceso correspondía
a ácidos carboxílicos de cadena corta y bajas concentraciones de ácido ftálico que
provenían de la rotura de los anillos aromáticos del colorante.
Dado que el ácido ftálico es un intermedio comúnmente identificado en el tratamiento de
colorantes y otros contaminantes con anillos naftalénicos en su estructura, se estudió este
intermedio para clarificar de forma más completa su mecanismo de degradación. En este
estudio se evaluó la actividad de los iones de Cu(II) y de Fe(III) como catalizadores de la
reacción de Fenton y de sus mezclas como co-catalizadores. Se pudo comprobar que las
mezclas de ambos catalizadores permitían obtener mineralizaciones más rápidas ya que
los complejos de los ácidos carboxílicos con Cu(II) se degradaban por la acción del
radical �OH, cosa que no tiene lugar con los complejos que se forman competitivamente
con Fe(III). Se propuso como composición óptima de catalizador la mezcla de 0,125 mM
de Cu2+ y 0,375 mM of Fe3+. Los análisis por cromatografía de HPLC y de LC-MS
permitieron detectar 11 derivados aromáticos y seis ácidos carboxílicos de cadena corta,
a partir de los cuales se planteó una secuencia de degradación que puede ser aplicable
siempre que aparezca el ácido ftálico o sus derivados como intermedios de reacción.
Durante la estancia pre-doctoral realizada en el AWMC de la UQ en Australia se
descontaminó un efluente secundario de una depuradora municipal que contenía una
mezcla compleja de 29 POPs en concentraciones de 100 μg L−1 por AO en una planta
pre-piloto de 10 L con una celda tipo filtro prensa de dos compartimentos. Se encontró
que todos los contaminantes eran completamente eliminados a pH 3,0 y 20 mA cm−2 tras
24 h de tratamiento, excepto para el fármaco fenitoína y los herbicidas DEET y atrazina
que fueron eliminados en un 90%. Los análisis de COD y DOC demostraron que la NOM

Resumen �
�����
presente en el agua tratada también se mineralizaba completamente. Asimismo, se llevó
a cabo un profundo estudio sobre la evolución de los 305 mg L-1 de ion cloruro presentes
en el efluente secundario. Después de 24 h de AO, este ión generó ClO3− (13,92 mg L−1
de Cl), ClO4− (35,35 mg L−1 de Cl) y concentraciones muy bajas de organoclorados (5
μM). El contenido de ion Cl− remanente fue de 196 mg L−1. El estudio de la evolución
del Cl− demostró la posibilidad de eliminar los POPs de aguas reales con una baja
producción de organoclorados durante el tratamiento.
La investigación sobre la ECL con ánodos de BDD permitió aportar evidencias que
demuestran que los radicales �OH no son generados en condiciones de pH muy básicas
(12,0), donde se electrogenera en su lugar el anión radical superóxido O2�−. La oxidación
directa de luminol en ánodos de BDD emitía luminiscencia en un rango definido de
potencial, pero tras la adición de H2O2 se observó la emisión de luz en un amplio rango
de potenciales (de 0.5 a 5.0 V vs Ag|AgCl, KCl(sat.)). Se demostró que la presencia del
anión hidroperóxido HO2− propiciaba la electrogeneración de O2�− que resultó ser, tal y
como probó la utilización de scavengers específicos, el responsable directo del
incremento de emisión de luz en ECL con una intensidad hasta 63 veces superior en
presencia de H2O2 que en su ausencia. Los resultados obtenidos abren la puerta al
desarrollo de nuevos biosensores de BDD, a la mejor comprensión de los mecanismos de
oxidación de compuestos orgánicos por ROS y a la caracterización de ánodos de BDD.

�����
CONCLUSIONS

�����
�

Conclusions �
�����
This work has led to the following conclusions:
1. Acidic aqueous solutions of 62 mg L−1 of flumequine can be completely mineralized
by PEF in 360 min using a stirred BDD/ADE tank reactor. Solutions with 245 mg L−1
chloramphenicol were completely mineralized by SPEF in 90 min in the 100 mL tank
reactor and in 180 min when the process was scaled-up to a 10 L pre-pilot flow plant,
with an energy cost of 0.347 kWh g−1 DOC corresponding to 0.141 € kWh−1.
2. In the flumequine treatment by EF and PEF, the Fe2+ ion played a double role, since it
formed an orange complex with the drug enhancing its solubility and acted as catalyst of
the Fenton’s reaction.
3. The decay kinetics for both antibiotics always followed a pseudo-first-order reaction
with increasing rate constant as the current rose. Similar drug abatement for EF and PEF
at each current tested was found. This evidenced that the complex of Fe(II) with
flumequine was not directly photolyzed by UVA irradiation, that chloramphenicol was
not photodegradable and that the photo-Fenton reaction (17) participates very poorly to
generate �OH.
4. The increase in drug concentration enhanced the efficiency of the mineralization
process due to the inhibition of parasitic reactions, but decreasing the pseudo-first order
rate constant because the �OH generation was affected by the concentration of other
compounds in solution.
5. The degradation of flumequine and chloramphenicol involved the formation of short-
linear aliphatic carboxylic acids due to the rupture of the aromatic ring. Oxalic and oxamic
acids are the ultimate and more recalcitrant compounds generated.
6. The improvement of the DOC removal in the PEF process was related to the UVA
irradiation, mainly due to the rapid photodecarboxylation of some Fe(III)-carboxylate
complexes such as formed by oxalic and oxamic acids.
7. The F of flumequine was lost as F− ion, whereas the Cl of chloramphenicol was released
as Cl− ion to be further oxidised to Cl2. In both cases, the fate of the initial N was NO3−
ion and oxamic acid, although NH4+ ion was also produced in lesser extent.
8. The treatment of flumequine in real wastewater led to similar degradation degree to
that of synthetic solution. The NOM influenced poorly the mineralization process and it

������������
�����
was removed under the main oxidation action of �OH. The PEF treatment could then be
applicable to the treatment of flumequine in real wastewater.
9. The treatment of 2.08 mM of oxalic and oxamic acids showed that they were efficiently
removed by AO with BDD in the presence of Fe2+ and simultaneously irradiated with
UVA light due to the high photoactivity of their Fe(III) complexes and their oxidation by
BDD(�OH). Fe(III)-maleate complexes were not photodecomposed, but they were
quickly destroyed with �OH.
10. Fe(III)-oxamato complexes presented a lower photoactivity than Fe(III)-oxalato ones.
The photodegradation of Fe(III)- oxamate complexes favoured the release of NH4+ ion.
Also, it was well proven that these Fe(III) complexes were not attacked with �OH in the
bulk generated by Fenton’s reaction, although they were slowly mineralized by
BDD(�OH) and also by direct charge transfer at the BDD anode.
11. Voltammetric analysis showed that Fe(III)-oxamato complexes were oxidized more
quickly with BDD(�OH) than the free acid, whereas the opposite trend happened for
oxalic acid which was easily removed than its Fe(III) complexes.
12. The DOC content in solution was directly related with the oxalic or oxamic acid
concentration at each time, indicating an insignificant formation of by-products.
13. The treatment of oxalic and oxamic acids mixtures evidenced that both acids were
independently oxidized by AO with BDD. However, remarkable influences of their
concentration ratio on their degradation rate were found in the presence of Fe2+ and when
the solutions were simultaneously irradiated with UVA light. The effect was associated
with the different distribution of iron complexes in solution.
14. The increase in Fe2+ concentration inhibited the oxidation process of oxamic acid
because of the enhancement of the oxidation of Fe2+ to Fe3+ The loss of oxidation power
was also observed in the distribution of NH4+, NO3− and NOx since greater amounts of
Fe2+ ion caused a lower accumulation of NO3− ion.
15. The decolorization process of azo dyes by EF showed a marked influence of the
number of azo bonds per molecule, dropping the initial decoloration rate with increasing
the number of azo bonds. This phenomenon was explained by the generation of more
stable conjugated π systems when the number of azo bonds per molecule increased.

Conclusions �
�����
16. The decolorization rate was limited by the slower parallel destruction of colored
conjugated by-products that are formed in larger extent in diazo and triazo dyes than in
monoazo ones.
17. The initial decoloration rate increased with rising j due to the greater generation of �OH that accelerated the solution color removal. HPLC analysis confirmed the complete
removal of azo dyes by EF which disappeared in shorter times at higher applied current
density and lower number of azo dyes per molecule.
18. The pseudo-first-order rate constants for azo dyes removal and their respective initial
decoloration rate showed the same trends. Consequently, the initial decoloration rate is a
simple and suitable parameter to analyze the azo dyes decolorization process. Although
the pseudo-first-order kinetics determined by the absorbance decay showed the same
trends than the rate constants found by HPLC, their values were very different as a result
of the formation of colored by-products during decolorization.
19. The PEF and PA-EF processes of DY4 solutions yielded almost total mineralization
in 4 h. The PA-EF method was always more economic than PEF and at higher j even less
expensive than EF.
20. The major part of N of the azo bonds was lost as N-products volatiles such as N2 and
NOx. The remaining N in solution was mainly present as NH4+ ion.
21. The scale-up to an autonomous 10 L pre-pilot flow plant demonstrated the viability
of SPEF to mineralize azo dyes in short times and treat polluted effluents without energy
consumption. The cost of the process only corresponded to the initial investment.
22. The degradation of a real secondary effluent of a wastewater treatment plant, polluted
with a complex pollutant matrix in an pre-pilot flow plant with a divided reactor by AO
with BDD, evidenced the viability to mineralize and remove completely all the pollutants
apart from phenitoin, atrazine and DEET, which were only removed up to 80-90 % in 24
h.
23. Low amounts of chlorate and perchlorate ions as well as of organochlorinated species
were formed during the AO treatment with BDD of the polluted secondary effluent as a
result of the oxidation of its content of 305 mg L−1 of chloride ion. These promising results
allow us to consider this method as a viable treatment for POPs removal under real
conditions.

������������
�����
24. The study of the electrochemiluminiscence of luminol demonstrated the
electrogeneration of physisorbed radicalary species at the BDD anode. Voltammetric
analyses and the use of specific quenchers and scavengers proved the generation of radical
anion superoxide O2�− and the inhibition of �OH generation at alkaline pH.
25. The findings on the electrochemiluminiscence of luminol can contribute to develop
better techniques to characterize the conductive-diamond electrodes properties, to
improve the understanding of the oxidation mechanisms of organics by ROS and the
design of new BDD sensors for biomolecules.

�
����
REFERENCES

�
����
�

References
�����
Akpan, U.G., Hameed, B.H., 2009. Parameters affecting the photocatalytic degradation
of dyes using TiO2-based photocatalysts: A review. J. Hazard. Mater. 170, 520-529.
Almeida, L.C., Garcia-Segura, S., Bocchi, N., Brillas, E., 2011. Solar photoelectro-
Fenton degradation of paracetamol using a flow-plant with a Pt/air-diffusion cell
coupled with a compound parabolic collector: Process optimization by response
Surface methodology. Appl. Catal. B: Environ. 103, 21-30.
Almeida, L.C., Garcia-Segura, S., Arias, C., Bocchi, N., Brillas, E., 2012.
Electrochemical mineralization of the azo dye Acid Red 29 (Chromotrope 2R) by
photoelectro-Fenton process. Chemosphere 89, 751-758.
Andreozzi, R., Caprio, V., Insola, A., Marotta, R., 1999. Advanced oxidation processes
(AOP) for water purification and recovery. Catal. Today 53, 51-59.
Andreozzi, R., Marotta, R., Nicklas, P., 2003. Pharmaceuticals in STP effluents and their
solar photodegradation in aquatic environment. Chemosphere 50, 1319-1330.
Anotai, J., Singhadech, S., Su, C.C., Lu, M.C., 2011. Comparison of o-toluidine
degradation by Fenton, electro-Fenton and photoelectro-Fenton processes. J.
Hazard. Mater. 196, 395-401.
Aquino, J.M., Pereira, G.F., Rocha-Filho, R.C., Bocchi, N., Biaggio, S., 2011.
Electrochemical degradation of a real textile effluent using boron-doped diamond
or �-PbO2 as anode. J. Hazard. Mater. 192, 1275-1282.
Aquino, J.M., Rodrigo, M.A., Rocha-Filho, R.C., Sáez, C., Cañizares, P., 2012. Influence
of the supporting electrolyte on the electrolyses of dyes with conductive-diamond
anodes. Chem. Eng. J. 184, 221-227.
Ayranci, E., Bayram, E., 2005. Adsorption of phthalic acid and its esters onto high-area
activated carbon-cloth studied by in situ UV-spectroscopy. J. Hazard. Mater. B122,
147-153.
Bagastyo, A.Y., Batstone, D.J., Kristiana, I., Gernjak, W., Joll, C., Radjenovic, J., 2012.
Electrochemical oxidation of reverse osmosis concentrate on boron-doped
diamond anodes at circumneutral and acidic pH. Water Res. 46, 6104-6112.

References �
� ����
Bagastyo, A.Y., Batstone, D.J., Rabaey, K., Radjenovic, J., 2013. Electrochemical
oxidation of electrodialysed reverse osmosis concentrate on Ti/Pt–IrO2, Ti/SnO2–
Sb and boron-doped diamond electrodes. Water Res. 47, 242-250.
Barni, F., Lewis, S.W., Berti, A., Miskelly, G.M., Lago, G., 2007. Forensic application
of the luminol reaction as a presumptive test for latent blood detection. Talanta 72,
896-913.
Bauer, J.M., Herrman, R., 1997. Estimation of the environmental contamination by
phthalic acid esters leaching from household wastes. Sci. Total Environ. 208, 49-
57.
Bellagamba, R., Michaud, P.A., Comninellis, Ch., Vatistas, N., 2002. Electro-combustion
of polyacrylates with boron-doped diamond anodes. Electrochem. Commun. 4,
171-176.
Borràs, N., Arias, C., Oliver, R., Brillas, E., 2013. Anodic oxidation, electro-Fenton and
photoelectro-Fenton degradation of cyanazine using a boron-doped diamond
anode and an oxygen-diffusion cathode. J. Electroanal. Chem. 689, 158-167.
Boye, B., Dieng, M.M., Brillas, E., 2003. Electrochemical degradation of 2,4,5-
trichlorophenoxyacetic acid in aqueous medium by peroxi-coagulation. Effect of
pH and UV light. Electrochim. Acta 48, 781-790.
Boye, B., Brillas, E., Marselli, B., Michaud, P.A., Comninellis, CH., Farnia, G., Sandonà,
G., 2006. Electrochemical incineration of chloromethylphenoxy herbicides in acid
medium by anodic oxidation with boron-doped diamond electrode. Electrochim.
Acta 51, 2872-2880.
Brillas, E., Baños, M.A., Garrido, J.A., 2003. Mineralization of herbicide 3,6-dichloro-
2-methoxybenzoic acid in aqueous medium by anodic oxidation, electro-Fenton and
photoelectro-Fenton. Electrochim Acta 48, 1697-1705.
Brillas, E., Sirés, I., Oturan, M.A., 2009. Electro-Fenton process and related
electrochemical technologies based on Fenton’s reaction chemistry. Chem. Rev.
109, 6570-6631.

References
�����
Brillas, E., Garcia-Segura, S., Skoumal, M., Arias, C., 2010. Electrochemical
incineration of diclofenac in neutral aqueous médium by anodic oxidation using Pt
and boron-doped diamond anodes. Chemosphere 79, 605-612.
Burridge, L., Weis, J.S., Cabello, F., Pizarro, J., Bostick, K., 2010. Chemical use in
salmon aquaculture: a review of current practices and possible environmental
effects. Aquaculture 306, 7-23.
Cavalcanti, E.B., Garcia-Segura, S., Centellas, F., Brillas, E., 2013. Electrochemical
incineration of omeprazole in neutral aqueous médium using a platinum or boron-
doped diamond anode: Degradation kinetics and oxidation products. Water Res.
47, 1803-1815.
Cañizares, P., García-Gómez, J., Lobato, J., Rodrigo, M.A., 2003. Electrochemical
oxidation of aqueous carboxylic acid wastes using diamond thin-film electrodes.
Ind. Eng. Chem. Res. 42, 956-962.
Cañizares, P., Sáez, C., Lobato, J., Rodrigo, M.A., 2004. Electrochemical treatment of
2,4-dinitrophenol aqueous wastes using boron-doped diamond anodes.
Electrochim. Acta 49, 4641-4650.
Cañizares, P., Arcís, M., Sáez, C., Rodrigo, M.A., 2007. Electrochemical synthesis of
ferrate using boron doped diamond anodes. Electrochem. Commun. 9, 2286-2290.
Chan, Y.J., Chong, M.F., Law, C.L., Hassell, D.G., 2009. A review on anaerobic–aerobic
treatment of industrial and municipal wastewater. Chem. Eng. J.155, 1-18.
Chatzitakis, A., Berberidou, C., Paspaltsis, I., Kyriakou, G., Sklaviadis, T., Poulios, I.,
2008. Photocatalytic degradation and drug activity reduction of chloramphenicol.
Water Res. 42, 386-394.
Chung, F.H., 1974. Quantitative interpretation of X-ray diffraction patterns of mixtures.
I. Matrix-flushing method for quantitative multicomponent analysis. J. Appl. Crist.
7, 519-525.
Comninellis, Ch., 1994. Electrocatalysis in the electrochemical conversion/combustion
of organic pollutants for waste water treatment. Electrochim. Acta 39, 1857-1862.
Crane, M., Watts, C., Boucard, T., 2006. Chronic aquatic environmental risks from
exposure to human pharmaceuticals. Sci. Total Environ. 367, 23-41.

References �
� ����
Cruz-González, K., Torres-López, O., García-León, A., Guzmán-Mar, J.L., Reyes, L.H.,
Hernández-Ramírez, A., Peralta-Hernández, J.M., 2010. Determination of optimum
operating parameters for Acid Yellow 36 decolorization by electro-Fenton process
using BDD cathode. Chem. Eng. J. 160, 199-206.
Cui, H.; Zhang, Z. F.; Zou, G. Z.; Lin, X. Q. J., 2004. Potential-dependent
electrochemiluminescence of luminol in alkaline solution at a goldelectrode. J.
Electroanal. Chem. 556, 305−313.
Daghrir, R., Drogui, P., Robert, D., 2012. Photoelectrocatalytic technologies for
environmental applications. J. Photochem. Photobiol. A: Chem. 238, 41-52.
Devlin, R.H., Nagahama, Y., 2002. Sex determination and sex differentiation in fish: an
overview of genetic, physiological, and environmental influences. Aquaculture 208,
191-364.
Dionysiou, D.D., Suidan, M.T., Baudin, I., Laîné, J.M., 2004. Effect of hydrogen peroxide
on the destruction of organic contaminants-synergism and inhibition in a
continuous-mode photocatalytic reactor. Appl. Catal. B: Environ. 50, 259-269.
Dodeigne, C., Thunus, L., Lejeune, R., 2000. Chemiluminescence as diagnostic tool. A
review. Talanta 51, 415-439.
Donose, B.C., Sukumar, S., Pidou, M., Poussade, Y., Keller, J., Gernjak, W., 2013. Effect
of pH on the ageing of reverse osmosis membranes upon exposure to hypochlorite.
Desalination 309, 97-105.
Dosta, S., Cano, I.G., Miguel, J.R., Guilemany, J.M., 2008. Production and
characterization of metastable ZrO2-Al2O3 coatings bbtained by APS + quench. J.
Therm. Spray Technol. 17, 360-364.
Duo, I., Fujishima, A., Comninellis, Ch., 2003. Electron transfer kinetics on composite
diamond (sp3)-graphite (sp2) electrodes. Electrochem. Commun. 5, 695-700.
Ebrahim, S., 1994. Cleaning and regeneration of membranes in desalination and
wastewater applications: State-of-the-art. Desalination 96, 225-238.
El-Ghenymy, A., Arias, C., Cabot, P.L., Centellas, F., Garrido, J.A., Rodríguez, R.M.,
Brillas, E., 2012a. Electrochemical incineration of sulfanilic acid at boron-doped
diamond anode. Chemosphere 87, 1126-1133.

References
�����
El-Ghenymy, A., Garcia-Segura, S., Rodríguez, R.M., Brillas, E., El Begrani, M.S.,
Abdelouahid, B.A., 2012b. Optimization of the electro-Fenton and solar
photoelectro-Fenton treatments of sulfanilic acid solutions using a pre-pilot flow
plant by response surface methodology. J. Hazard. Mater. 221-222, 288-297.
El-Ghenymy, A., Garrido, J.A., Rodríguez, R.M., Cabot, P.L., Centellas, F., Arias, C.,
Brillas, E., 2013a. Degradation of sulphanilamide in acidic medium by anodic
oxidation with a boron-doped diamond anode. J. Electroanal. Chem. 689, 149-157.
El-Ghenymy, A., Oturan, N., Oturan, M.A., Garrido, J.A., Cabot, P.L., Centellas, F.,
Rodríguez, R.M., Brillas, E., 2013b. Comparative electro-Fenton and UVA
photoelectro-Fenton degradation of the antibiotic sulfanilamide using a stirred
BDD/air-diffusion tank reactor. Chem. Eng. J. 234, 115-123.
Elmorsi, T.M., Riyad, Y.M., Mohamed, Z.H., Abd El Bary, H.M.H., 2010.
Decolorization of Mordant red 73 azo dye in water using H2O2/UV and photo-
Fenton treatment. J. Hazard. Mater.174, 352-358.
Ersahin, M.E., Ozgun, H., Dereli, R.K., Ozturk, I., Roest, K., van Lier, J.B., 2012. A
review on dynamic membrane filtration: Materials, applications and future
perspectives. Bioresour. Technol. 122, 196-206.
Essawy, A.A., El-Hag Ali, A., Abdel-Mottaleb, M.S.A., 2008. Application of novel
copolymer-TiO2 membranes for some textile dyes adsorptive removal from aqueous
solution and photocatalytic decolorization. J. Hazard. Mater. 157, 547-552.
Fang, C., Long, Y., Shen, D., 2009. Comparison on the removal of phthalic acid
diestersin a bioreactor landfill and a conventional landfill, Bioresource Technol.
100, 5664-5670.
Faust, B.C., Zepp, R.G., 1993. Photochemistry of aqueous iron(III)-polucarboxylate
complexes: roles in the chemistry of atmospheric and Surface waters. Environ. Sci.
Technol. 27, 2517-2522.
Feng, L., van Hullebusch, E.D., Rodrigo, M.A., Esposito, G., Oturan, M.A., 2013.
Removal of residual anti-inflammatory and analgesic pharmaceuticals from
aqueous systems by electrochemical advanced oxidation processes. Chem. Eng. J.
228, 944-964.

References �
� ����
Fenton, H.J.H., 1894. Oxidation of tartaric acid in the presence of iron. J. Chem. Soc. 65,
899-910.
Flox, C., Ammar, S., Arias, C., Brillas, E., Vargas-Zavala, A., Abdelhedi, R., 2006
Electro-Fenton and photoelectro-Fenton degradation of indigo carmine in acidic
aqueous médium. Appl. Catal. B: Environ. 67, 93-104.
Flox, C., Arias, C., Brillas, E., Savall, A., Groenen-Serrano, K., 2009. Electrochemical
incineration of cresols: A comparative study between PbO2 and boron-doped
diamond anodes. Chemosphere 74, 1340-1347.
Forgacs, E., Cserháti, T., Oros, G., 2004. Removal of synthetic dyes from wastewaters: a
review. Environ. Int. 30, 953-971.
Freese, S.D., Nozaic, D., Pryor, M.J., Trollip, D.L., Smith, R.A., 1999. Comparison of
ozone and hydrogen peroxide/ozone for the treatment of eutrophic water. Water
Sci. Technol. 39, 325-328.
Fromme, H. Kuchler, T. Otto, T. Pilz, K. Muller, J. Wenzel, A., 2002. Occurrence of
phtha-lates and bisphenol A and F in the environment. Water Res.36, 1429-1438.
Fujishima, A., Zhang, X., Tryk, D.A., 2008. TiO2 photocatalysis and related surface
phenomena. Surf. Sci. Rep. 63, 515-582.
Garcia-Segura, S., Brillas, E., 2011. Mineralization of the recalcitrant oxalic and oxamic
acids by electrochemical advanced oxidation processes using a boron-doped
diamond anode. Water Res. 45, 2975-2984.
Garcia-Segura, S., Centellas, F., Arias, C., Garrido, J.A., Rodríguez, R.M., Cabot, P.L.,
Brillas, E., 2011. Comparative decolorization of monoazo, diazo and triazo dyes by
electro-Fenton process. Electrochim. Acta 58, 303-311.
Garcia-Segura, S., Cavalcanti, E.B., Brillas, E., 2014. Mineralization of the antibiotic
chloroamphenicol by solar photoelectro-Fenton. From stirred tank reactor to solar
pre-pilot plant. Appl. Catal. B: Environ. 144, 588-598.
Gardon, M., Dosta, S., Guilemany, J.M., Kourasi, M., Mellor, B., Wills, R., 2013.
Improved, high conductivity titanium sub-oxide coated electrodes obtained by
Atmospheric Plasma Spray. J. Power Sources 238, 430-434.

References
�����
Gernjak, W., Krutzler, T., Glaser, A., Malato, S., Caceres, J., Bauer, R., Fernández-Alba,
A.R., 2003. Photo-Fenton treatment of water containing natural phenolic
pollutants. Chemosphere 50, 71-78.
Guinea, E., Centellas, F., Garrido, J.A., Rodríguez, R.M., Arias, C., Cabot, P.L., Brillas,
E., 2009. Solar photoassisted anodic oxidation of carboxylic acids in presence of
Fe3+ using a boron-doped diamond electrode. Appl. Catal. B: Environ. 89, 459-
468.
Guinea, E., Garrido, J.A., Rodríguez, R.M., Cabot, P.L., Arias, C., Centellas, F., Brillas,
E., 2010. Degradation of the fluoroquinolone enrofloxacin by electrochemical
advanced oxidation processes based on hydrogen peroxide electrogeneration.
Electrochim. Acta 55, 2101-2115.
Guo, W.Y., Li, J.J., Chu, H.H., Yan, J.L., Tu, Y.F.J., 2010. Studies on the
electrochemiluminescent behavior of luminol on indium tin oxide (ITO) glass. J.
Lumin. 130, 2022-2025.
Hammami, S., Bellakhal, N., Oturan, N., Oturan, M.A., Dachraoui, M., 2008.
Degradation of Acid Orange 7 by electrochemically generated OH radicals in
acidic aqueous médium using a boron-doped diamon or platinum anode. A
mechanistic study. Chemosphere 73, 678-684.
Hamza, M., Abdelhedi, R., Brillas, E., Sirés, I., 2009. Comparative electrochemical
degradation of the triphenylmethane dye Methyl Violet with boron-doped diamon
and Pt anodes. J. Electroanal. Chem. 627, 41-50.
Homem, V., Santos, L., 2011. Degradation and removal methods of antibiotics from
aqueous matrices- a review. J. Environ. Manage. 92, 2304-2347.
Iniesta, J., González-García, J., Expósito, E., Montiel, V., Aldaz, A., 2001. Influence of
chloride ion on electrochemical degradation of phenol in alkaline medium using
bismuth doped and pure PbO2 anodes. Water Res. 35, 3291-3300.
Isarain-Chávez, E., Arias, C., Cabot, P.L., Centellas, F., Rodríguez, R.M., Garrido, J.A.,
Brillas, E., 2010. Mineralization of the drug �-blocker atenolol by electro-Fenton
and photoelectro-Fenton using an air-diffusion cathode for H2O2 electrogeneration
combined with a carbon-felt cathode for Fe2+ regeneration. Appl. Catal. B:
Environ. 96, 361-369.

References �
� ����
Isarain-Chávez, E., Cabot, P.L., Centellas, F., Rodríguez, R.M., Arias, C., Garrido, J. A.,
Brillas, E., 2011. Electro-Fenton and photoelectro-Fenton degradations of the drug
beta-blocker propranolol using a Pt anode: Identification and evolution of
oxidation products. J. Hazard. Mater. 185, 1228-1235.
Ivancev-Tumbas, I., Dalmacija, B., Tamas, Z., Karlovic, E., 1999. The effect of different
drinking water treatment processes on the rate of chloroform formation in the
reactions of natural organic matter with hypochlorite. Water Res. 33, 3715-3722.
Juang, R.-S., Lin, S.-H., Hsueh, P.-Y., 2010. Removal of binary azo dyes from water by
UV-irradiated degradation in TiO2 suspensions. J. Hazard. Mater. 182, 820-826.
Julien, F., Güeroux, B., Mazet, M., 1994. Comparison de l’elimination de molecules
organiques par coagulation-floculation et par adsorption sur flocs d’hydroxyde
metallique preformes. Water Res. 28, 2567-2574.
Kapalka, A., Fóti, G., Comninellis, Ch., 2008. Kinetic modelling of the electrochemical
mineralization of organic pollutants for wastewater treatment. J. Appl.
Electrochem. 38, 7-16.
Karthikeyan, K.G., Meyer, M.T., 2006. Occurrence of antibiotics in wastewater
treatment facilities in Wisconsin, USA. Sci. Total Environ. 361, 196-207.
Khataee, A.R., Zarei, M., Asl, S.K., 2010. Photocatalytic treatment of a dye solution
using immobilized TiO2 nanoparticles combined with photoelectro-Fenton process:
optimization of operational parameters. J. Electroanal. Chem. 648, 143-150.
Klamerth, N., Malato, S., Maldonado, M.I., Agüera, A., Fernández- Alba, A.R., 2011.
Modified photo-Fenton for degradation of emerging contaminants in municipal
wastewater effluents. Catal. Today 161, 241-246.
Klavarioti, M., Mantzavinos, D., Kassinos, D., 2009. Removal of residual
pharmaceuticals from aqueous systems by advanced oxidation processes. Environ.
Int. 35, 402-417.
Knight, A.W., 1999. A review of recent trends in analytical applications of
electrogenerated chemiluminescence. Trends Anal. Chem. 18, 47-62.
Kümmerer, K., 2009. The presence of pharmaceuticals in the environment due to human
use – present knowledge and future challenges. J. Environ. Manage. 90, 2354-2366.

References
����
Lin, Y., Chen, J.H., Chen, G.N., 2008.�Electrochemiluminescent behavior of luminol on
the glassy carbon electrode modified with CoTPP/MWNT composite film.
Electrochim. Acta 53, 2396−2401.
Makoto, E., Emiko, M., Akira, H., Kunio, K., 1997. Developmental toxicity evaluation
ofphthalic acid, one of the metabolites of phthalic acid esters, in rats. Toxicol. Lett.
93, 109-115.
Marselli, B., García-Gómez, J., Michaud, P.A., Rodrigo, M.A., Comninellis, Ch., 2003.
Electrogeneration of hydroxyl radicals on boron-doped diamond electrodes. J.
Electrochem. Soc. 150, D79-D83.
Martínez-Huitle, C.A., Ferro, S., De Battisti, A., 2004a. Electrochemical incineration of
oxalic acid: role of electrode material. Electrochim. Acta 49, 4027-4034.
Martínez-Huitle, C.A., Quiroz, M.A., Comninellis, Ch., Ferro, S., Battisti, A., 2004b.
Electrochemical incineration of chloranilic acid using Ti/IrO2, Pb/PbO2 and
Si/BDD electrodes. Electrochim. Acta 50, 949-956.
Martínez-Huitle, C.A., Brillas, E. 2009. Decontamination of wastewaters containing
syntheticorganic dyes by electrochemical methods. A general review. Appl Catal.
B: Environ. 87, 105-145.
Martínez-Huitle, C.A., Viera dos Santos, E., Medeiros de Araújo, D., Panizza, M., 2012.
Applicability of diamond electrode/anode to the electrochemical treatment of a real
textile effluent. J. Electroanal. Chem. 674, 103-107.
Martins, A.O., Canalli, V.M., Azevedo, C.M.N., Pires, M., 2006. Degradation of
pararosaniline (C.I. Basic Red 9 monohydrochloride) dye by ozonation and
sonolysis. Dyes Pigments 68, 227-234.
Migliore, L., Civitareale, C., Brambilla, G., Di Delupis, G.D., 1997. Toxicity of several
important agricultural antibiotics to Artemia. Water Res. 37, 1801-1806.
Migliorini, F.L., Braga, N.A., Alves, S.A., Lanza, M.R.V., Baldan, M.R., Ferreira, N.G.,
2011. Anodic oxidation of wastewater containing the Reactive Orange 16 dye using
heavily boron-doped diamond electrodes. J. Hazard. Mater. 192, 1683-1689.
Miranda-García, N., Suárez, S., Sánchez, B., Coronado, J.M., Malato, S., Maldonado,
M.I., 2011. Photocatalytic degradation of emerging contaminants in municipal

References �
� ���
wastewater treatment plant effluents using immobilized TiO2 in a solar pilot plant.
Appl. Catal. B: Environ. 103, 294-301.
Moreira, F.C., Garcia-Segura, S., Vilar, V.J.P., Boaventura, R.A.R., Brillas, E., 2013.
Decolorization and mineralization of Sunset Yellow FCF azo dye by anodic
oxidation, electro-Fenton, UVA photoelectro-Fenton and solar photoelectro-
Fenton processes. Appl. Catal. B: Environ. 142–143, 877-890.
Muñoz, I., Martínez-Bueno, M.J., Agüera, A., Fernández-Alba, A.R., 2010.
Environmental and human health risk assessment of organic micro-pollutants
occurring in a Spanish marine fish farm. Environ. Pollut. 158, 1809-1816.
Naviner, M., Gordon, L., Giraud, E., Denis, M., Mangion, C., Le Bris, H., Ganière, J.P.,
2011. Antimicrobial resistance of Aeromonas spp. Isolated from the growth pond
to the comercial product in a rainbow trout farm following a flumequine treatment.
Aquaculture 315, 236-241.
Newcombe, G., Morrison, J., Hepplewhite, C., Knappe, D.R.U., 2002. Simultaneous
adsorption of MIB and NOM onto activated carbon: II. Competitive effects. Carbon
40, 2147-2156.
Nieto, J., Freer, J., Contreras, D., Candal, R.J., Sileo, E.E., Mansilla, H.D., 2008.
Photocatalyzed degradation of flumequine by doped TiO2 and simulated solar light.
J. Hazard. Mater. 155, 45-50.
O’Melia, C.R., 1998. Coagulation and sedimentation in lakes, reservoirs and water
treatment plants. Water Sci. Technol. 37, 129-135.
Oh, K.H., Tuovinen, O.H., 1991. Detection and identification of substituted phenols as
intermediates of concurrent bacterial degradation of the phenoxy herbicides MCPP
and 2,4-D. Microbiol. Lett. 79, 141-146.
Oishi, S., Hiraga, K., 1980. Testicular atrophy induced by phthalic acid esters: Effect
ontestosterone and zinc concentrations. Toxicol. Appl. Pharm. 53, 35-41.
Oturan, M.A., Edelahi, M.C., Oturan, N., El Kacemi, K., Aaron, J.J., 2010. Kinetics of
oxidative degradation/mineralization pathways of the phenylurea herbicides
diuron, monuron and fenuron in water during application of the electro-Fenton
process. Appl. Catal. B: Environ. 97, 82-89.

References
�����
Özcan, A., Oturan, M.A., Nihal, O., Sahin, Y., 2009. Removal of Acid Orange 7 from
water by electrochemically generated Fenton's reagent. J. Hazard. Mater.163,
1213-1220.
Özcan, A., Sahin, Y., Koparal, S., Oturan, M.A., 2008. Propham mineralization in
aqueous medium by anodic oxidation using boron-doped diamond anode: Influence
of experimental parameters on degradation kinetics and mineralization efficiency.
Water Res. 42, 2889-2898.
Panizza, M, Michaud, P.A., Cerisola, G., Comninellis, Ch., 2001. Electrochemical
treatment of wastewaters containing organic pollutants on boron-doped diamond
electrodes: Prediction of specific energy consumption and required electrode área.
Electrochem. Commun. 3, 336-339.
Panizza, M., Cerisola, G., 2009. Direct and mediated anodic oxidation of organic
pollutants. Chem. Rev. 109, 6541-6569.
Panizza, M., Oturan, M.A., 2011. Degradation of alizarin red by electro-Fenton process
using a graphite-felt cathode. Electrochim. Acta 56, 7084-7087.
Pera-Titus, M, García-Molina, V., Baños, M.A., Giménez, J., Esplugas, S., 2004.
Degradation of chlorophenols by means of advanced oxidation processes: a
general review. Appl. Catal. B: Environ. 47, 219-256.
Pignatello, J.J., 1992. Dark and photoassisted Fe3+-catalyzed degradation of
chlorophenoxy herbicides by hydrogen peroxide. Environ. Sci. Technol. 26, 944-
951.
Pomati, F., Orlandi, C., Clerici, M., Luciani, F., Zuccato, E., 2008. Effects and
interactions in an environmentally relevant mixture of pharmaceuticals. Toxicol.
Sci. 102, 129-137.
Pouliquen, H., Delépée, R., Larhantec-Verdier, M., Morvan, M.L., Le Bris, H., 2007.
Comparative hydrolysis and photolysis of four antibacterial agents (oxytetracycline
oxolinic acid, flumequine and florfenicol) in deionised water, freshwater and
seawater under abiotic conditions. Aquaculture 262, 23-28.

References �
� ����
Radjenovic, J., Bagastyo, A., Rozendal, R.A., Mu, Y., Keller, J., Rabaey, K., 2011.
Electrochemical oxidation of trace organic contaminants in reverse osmosis
concentrate using RuO2/IrO2-coated titanium anodes. Water Res. 45, 1579-1586.
Ramírez, C., Saldaña, A., Hernández, B., Acero, R., Guerra, R., Garcia-Segura, S.,
Brillas, E., Peralta-Hernández, J.M., 2013. Electrochemical oxidation of methyl
orange azo dye at pilot flow plant using BDD technology. J. Ind. Eng. Chem. 19,
571-579.
Robinson, T., McMullan, G., Marchant, R., Nigam, P., 2001. Remediation of dyes in
textile effluent: a critical review on current treatment technologies with a proposed
alternative. Bioresour. Technol. 77, 241-255.
Rocha, J.H.B., Soares-Gomes, M.M., Fernandes, N.S., Ribeiro da Silva, D., Martínez-
Huitle, C.A., 2012. Application of electrochemical oxidation as alternative
treatment of produced water generated by Brazilian petrochemical industry. Fuel
Proces. Technol. 96, 80-87.
Rodríguez, M., Sarria, V., Esplugas, S., Pulgarín, C., 2002. Photo-Fenton treatment of a
biorecalcitrant wastewater generated in textile activities: biodegradability of the
photo-treated solution. J. Photochem. Photobiol. A: Chem 151, 129-135.
Rodrigues-Silva, C., Maniero, M.G., Rath, S., Guimarães, J.R., 2013. Degradation of
flumequine by the Fenton and photo-Fenton processes: Evaluation of residual
antimicrobial activity. Sci. Total Environ. 445-446, 337-346.
Root, R., Okada, S., 1975. Estimation of life times and diffusion distances of radicals
involved in X-Ray-induced DNA strand breaks or killing of mammalian cells.
Radiat. Res. 64, 2975-2984.
Ruiz, E.J., Arias, C., Brillas, E., Hernández-Ramírez, A., Peralta-Hernández, J.M., 2011.
Mineralization of Acid Yellow 36 azo dye by electro-Fenton and solar photoelectro-
Fenton processes with a boron-doped diamond anode. Chemosphere 82, 495-501.
Salazar, R., Garcia-Segura, S., Ureta-Zañartu, M.S., Brillas, E., 2011. Degradation of
disperse azo dyes from wastewaters by solar photoelectro-Fenton. Electrochim.
Acta 56, 6371-6379.

References
�����
Salazar, R., Sirés, I., Brillas, E., 2012. Finding the best Fe2+/Cu2+ combination for the
solar photoelectro-Fenton treatment of simulated wastewater containing the
industrial textile dye Disperse Blue 3. Appl. Catal. B: Environ. 115-116, 107-116.
Sales, A.S., Costa de Araújo, C.K, Viera de Melo, J., Peralta-Hernández, J.M., Ribeiro da
Silva, D., Martínez-Huitle, C.A., 2013. Decontamination of a real textile industrial
effluent by strong oxidant species electrogenerated on diamond electrode: viability
and disadvantages of this electrochemical technology. Appl. Catal. B: Environ.
130-131, 112-120.
Sánchez, A., Llanos, J., Sáez, C., Cañizares, P., Rodrigo, M.A., 2013. On the applications
of peroxodiphosphate produced by BDD-electrolyses. Chem. Eng. J. 233, 8-13.
Scialdone, O., Galia, A., Guarisco, C., Randazzo, S., Filardo, G., 2008. Electrochemical
incineration of oxalic acid at boron-doped diamond anodes: role of operative
parameters. Electrochim. Acta 53, 2095-2108.
Scialdone, O., Randazzo, S., Galia, A., Filardo, G., 2009. Electrochemical oxidation of
organics at metal oxide electrodes: The incineration of oxalic acid at IrO2–Ta2O5
(DSA-O2) anode. Electrochim. Acta 54, 1210-1217.
Serra, A., Domènech, X., Arias, C., Brillas, E., Peral, J., 2009. Oxidation of -
methylphenylglycine under Fenton and electro-Fenton conditions in the dark and
in the presence of solar light. Appl. Catal. B: Environ. 89, 12-21.
Serrano, K., Michaud. P.A., Comninellis, Ch, Savall, A., 2002. Electrochemical
preparation of peroxodisulfuric acid using boron doped diamond thin film
electrodes. Electrochim. Acta 48, 431-436.
Shan, A.Y., Ghazi, T.M.I., Rashid, S.A., 2010. Immobilisation of titanium dioxide onto
supporting materials in heterogeneous photocatalysis: A review. Appl. Catal. A:
Gen. 389, 1-8.
Sharma, K.P., Sharma, S., Sharma, S., Singh, P.K., Kumar, S., Grover, R., Sharma, P.K.,
2007. A comparative study on characterization of textile wastewaters (untreated
and treated) toxicity by chemical and biological tests. Chemosphere 69, 48-54.
Shende, R.V., Mahajani, V.V., 2002. Wet oxidative regeneration of activated carbon
loaded with reactive dye. Waste Manage. 22, 73-83.

References �
� ����
Šima, J., Maká�ová, J. 1997. Photochemistry of iron (III) complexes. Coord. Chem. Rev.
160, 161-189.
Sirés, I., Arias, C., Cabot, P.L., Centellas, F., Rodrígues, R.M., Garrido, J.A., Brillas, E.,
2004. Paracetamol mineralization by advanced electrochemical oxidation
processes for wastewater treatment. Environ. Chem. 1, 26-28.
Sirés, I., Cabot, P.L., Centellas, F., Garrido, J.A., Rodrígues, R.M., Arias, C., Brillas, E.,
2006. Electrochemical degradation of clofibric acid in water by anodic oxidation:
Comparative study with platinum and boron-doped diamond electrodes.
Electrochim. Acta 52, 75-85.
Sirés, I., Brillas, E., Cerisola, G., Panizza, M., 2008. Comparative depollution of
mecoprop aqueous solutions by electrochemical incineration using BDD and PbO2
as high oxidation power anodes. J. Electroanal. Chem. 613, 151-159.
Sirés, I., Brillas, E., 2012. Remediation of water pollution caused by pharmaceutical
residues based on electrochemical separation and degradation technologies: A
review. Environ. Int. 40, 212-229.
Skoumal, M., Cabot, P.L., Centellas, F., Arias, C., Rodríguez, R.M., Garrido, J.A.,
Brillas, E., 2006. Mineralization of paracetamol by ozonation caralyzed with Fe2+,
Cu2+ and UVA light. Appl. Catal. B: Environ 66, 228-240.
Skoumal, M., Rodríguez, R.M., Cabot, P.L., Centellas, F., Garrido, J.A., Arias, C.,
Brillas, E., 2009. Electro-Fenton, UVA photoelectro-Fenton and solar
photoelectro-Fenton degradation of the drug ibuprofen in acid aqueous medium
using platinum and boron-doped diamond anodes. Electrochim. Acta 54, 2077-
2085.
Smith, R.M., Martell., A.E., 1997. Critical stability constants. Volume 3: Organic
ligands. Ed. Plenum Press, New York.
Soon, A.N., Hameed, B.H., 2011. Heterogeneous catalytic treatment of synthetic dyes in
aqueous media using Fenton and photo-assisted Fenton process. Desalination 269,
1-16.

References
�����
Suling, V., Wohlers, J., Reinhard, M., Thiemann, W., 2002. Photooxidation by Utraviolet
Irradiation and Treatment with Ionized Air of Selected Antibiotics. Vom Wasser
98, 145–158.
Sun, Y., Pignatello, J.J., 1993. Photochemical reactions involved in the total
mineralization of 2,4-D by Fe3+/H2O2/UV. Environ. Sci. Technol. 27, 304-310.
Taborda, A.V., Brusa, M.A., Grela, M.A., 2001. Photocatalytic degradation of phthalic
acidon TiO2 nanoparticles. Appl. Catal. A: Gen. 208, 419-426.
Tamtam, F., Mercier, F., Le Bot, B., Eurin, J., Dinh, Q.T., Clément, M., Chevreuil, M.,
2008. Ocurrence and fate of antibiotics in the Seine River in various hydrological
conditions. Sci. Total Environ. 393, 84-95.
Tokumura, M., Znad, H.T., Kawase, Y., 2008. Decolorization of dark brown colored
coffee effluent by solar photo-Fenton reaction: Effect of solar light dose on
decolorization kinetics. Water Res. 42, 4665-4673.
Triebskor, R., Casper, H., Heyda, A., Eikemper. R., Köhler, H.R., Sgwaiger, J., 2004.
Toxic effects of the non-steroidal anti-inflammatory drug diclofenac. Part II:
Cytological effects in liver, kidney, gills and intestine of rainbow trout
(Oncorhynchus mykiss). Aquat. Toxicol. 68, 151-166.
Turhan, K., Turgut, Z., 2009. Decolorization of direct dye in textile wastewater by
ozonization in a semi-batch bubble column reactor. Desalination 242, 256-263.
Ulson de Souza, S.M.A.G., Forgiarini, E., Ulson de Souza, A.A., 2007. Toxicity of textile
dyes and their degradation by the enzime horseradish peroxidase (HRP). J. Hazard.
Mater. 147, 1073-1078.
Umbuzeiro, G.A., Freeman, H.S., Warren, S.H., Oliveira, D.P., Terão, Y., Watanabe, T.,
Claxton, L.D., 2005. The contribution of azo dyes to the mutagenic activity of the
Cristais river. Chemosphere 60, 55-64.
UNESCO, 2012. Managing Water Report under Uncertainty and Risk. THE UNITED
NATIONS WORLD WATER DEVELOPMENT REPORT 4. Web:
http://unesdoc.unesco.org/images/0021/002156/215644e.pdf#page=812�
United States Environmental Protection Agency (7407), 1994. Pollution Prevention and
Toxics, EPA 749-F-95-016a.

References �
� ����
USGS – United States Geological Survey. Web:
http://ga.water.usgs.gov/edu/earthwherewater.html
Vaid, R., Linton, R.H., Morgan, M.T., 2010. Comparison of inactivation of Listeria
monocytogenes within a biofilm matrix using chlorine dioxide gas, aqueous
chlorine dioxide and sodium hypochlorite treatments. Food Mricrobiol. 27, 979-
984.
Valero, D., Ortiz, J.M., Expósito, E., Montiel, V., Aldaz, A., 2008. Electrocoagulation of
a synthetic textile effluent powered by photovoltaic energy without batteries: Direct
connection behaviour. Sol. Ener. Mat. Sol. C. 92, 291-297.
Velazquez-Peña, S., Sáez, C., Cañizares, P., Linares-Hernández. I., Martínez-Miranda,
V., Barrera-Díaz, C., Rodrigo, M.A., 2013. Production of oxidants via electrolysis
of carbonate solutions with conductive-diamond anodes. Chem. Eng. J. 230, 272-
278.
Wang, A., Qu, J., Liu, H., Ru, J., 2008a. Mineralization of an azo dye acid red 14 by
photoelectro-Fenton process using an activated carbón fiber cathode. Appl. Catal.
B: Environ. 84, 393-399.
Wang, W., Cui, H., Deng, Z.X., Dong, Y.P., Guo, J.Z., 2008b. A general E-E/C
mechanism for the counter-peak in luminol electrochemiluminescence. J.
Electroanal. Chem. 612, 277-287.
Wang, P., He, Y.L., Huang, C.H., 2010. Oxidation of fluoroquinolone antibiotics and
structurally related amines by chlorine dioxide: Reaction kinetics, product and
pathway evaluation. Water Res. 44, 5989-5998.
Wang, J., Sun, W., Xu, C., Liu, W., 2012. Ozone degradation of chloramphenicol:
Efficacy, products and toxicity. Int. J. Environ. Technol. Manage. 15, 180–192.
Welcher, F.J. (Ed.). Standard Methods of Chemical Analysis, vol.2, Part B, 6th ed., R.E.
Krieger Publishers Co., Huntington, New York, 1975, p. 1827.
Wróblewska, A., Reshetnyak, O.V., Koval’chuk, E.P., Pasichnyuk, R.I., Błazejowski,
J.J., 2005. Origin and features of the electrochemiluminescence of luminol –
Experimental and theoretical investigations. J. Electroanal. Chem. 580, 41−49.

References
�����
Xu, Y., Luo, F., Pal, A., Gin, K.Y.-H., Reinhard, M., 2011. Occurrence of emerging
organic contaminants in a tropical urban catchment in Singapore. Chemosphere
83, 963–969.
Yeh, S.L., Kuo, C.M., Ting, Y.Y., Chang, C.F., 2003. Androgens stimulate sex change in
protogynous grouper, Epinephelus coioides: spawning performance in sex-
changed males. Comp. Biochem. Phys. C. 135, 375-382.
Zarei, M., Khataee, A.R., Ordijhani-Sevedlar, R., Fathinia, M., 2010. Photoelectro-
Fenton combined with photoatalytic process for degradation of an azo dye using
supported TiO2 nanoparticles and carbón nanotube cathode: neural network
modeling. Electrochim. Acta 55, 7250-7265.
Zhang, L., Dong, L., Ren, L., Shi, S., Zhou, L., Zhang, T., Huang, Y., 2012.
Concentration and source identification of polycyclic aromatic hydrocarbons and
phthalic acid esters in the surface water of the Yangtze River Delta, J. Environ. Sci.
24, 335-342.
Zhang, L., Ma, J., Li, X., Wang. S., 2009. Enhanced removal of organic by permanganate
peroxidation using tannic acid as a model compound – Role of in situ formed
manganese dioxide. J. Environ. Sci. 21, 872-876.
Zheng, Z., Zhang, H., He, P.J., Shao, L.M., Chen, Y., Pang, L., 2009. Co-removal of
phthalic acid esters with dissolved organic matter from landfill leachate by
coagulationand flocculation process. Chemosphere 75, 180-186.
Zhou, L.-J., Ying, G.-G., Liu, S., Zhao, J.-L., Yang,, B. Chen, Z.-F., Lai, H.-J., 2013.
Occurrence and fate of eleven classes of antibiotics in two typical wastewater
treatment plants in South China. Sci. Total. Environ. 452–453, 365–376.
�