Putative mechanisms of drought tolerance in maize (Zea mays ...
Tb
Ea
b
c
d
e
a
ARRA
KBCDMTW
1
tcbppsbl2scrbW
h0
Scientia Horticulturae 185 (2015) 175–182
Contents lists available at ScienceDirect
Scientia Horticulturae
journa l h om epage: www.elsev ier .com/ locate /sc ihor t i
ranspiration efficiency versus growth: Exploring the bananaiodiversity for drought tolerance
. Kissela,b, P. van Astenb, R. Swennena,c,e, J. Lorenzenb,d, S.C. Carpentiera,∗
Laboratory of Tropical Crop Improvement, KU Leuven, Willem de Croylaan 42, 3001 Heverlee, BelgiumInternational Institute of Tropical Agriculture (IITA), P.O. Box 7878, Kampala, UgandaInternational Institute of Tropical Agriculture (IITA), P.O. Box 10, Duluti, Arusha, TanzaniaBill & Melinda Gates Foundation, P.O. Box 23350, Seattle, WA 98102, USABioversity International, Willem de Croylaan 42, 3001 Heverlee, Belgium
r t i c l e i n f o
rticle history:eceived 21 October 2014eceived in revised form 26 January 2015ccepted 29 January 2015
eywords:iodiversityarbon isotope discrimination (�13C)
a b s t r a c t
Water shortage is the largest limiting abiotic factor in agriculture and will aggravate in the future. Becauseof the complexity there is not one conclusive definition of drought. Therefore it is challenging to identifythe right parameter and stress intensity for drought tolerance evaluation. This paper contributes to tacklethis challenge by exploring the effect of water deficit on transpiration efficiency (TE). In total, six triploidbanana (Musa spp.) cultivars were characterized during well-watered and two different water deficitconditions. We developed a concept to evaluate both TE and growth, since selection for high TE is oftenassociated with slow growth. TE increased for all cultivars when stressed and a clear genotypic variation
rought toleranceusa spp.
ranspiration efficiency (TE)ater deficit
in TE during water deficit could be discerned. ‘Kayinja’ (ABB) and ‘Sukali Ndizi’ (AAB) were ranked asthe most efficient cultivars and the East African highland cultivar ‘Mpologoma’ (AAA) exhibited the leasttranspiration efficient phenotype. Selection for high TE did not lead to selection of slow growers duringwell-watered and mild stress conditions. High TE varieties are thus projected to bring forth good yieldunder well-watered and water deficit conditions.
© 2015 Elsevier B.V. All rights reserved.
. Introduction
Water shortage is the largest limiting abiotic factor in agricul-ure (Pennisi, 2008). This problem will be aggravated by climatehange causing more frequent and severe droughts in manyanana-growing areas. Additionally, the rapidly growing worldopulation, especially in developing countries, puts an even greaterressure on water availability and use efficiency. According to con-ervative estimates, the world population will reach the peak of 9illion by 2050. Within 15 years, already half of the world’s popu-
ation, 8 billion at that time, will live in drought-prone areas (IPCC,007). The limited available water will increasingly have to behared over more households, industry and agriculture. Since agri-ulture is the major water consumer (71% of the available water),esearch in this area is essential, so that the available water will
e used in an efficient, sustainable and considerate manner (2030RG, 2009).∗ Corresponding author. Tel.: +32 16 379311.E-mail address: [email protected] (S.C. Carpentier).
ttp://dx.doi.org/10.1016/j.scienta.2015.01.035304-4238/© 2015 Elsevier B.V. All rights reserved.
The aforementioned challenges on water availability threatenglobal food production in general and food security of poor ruralpopulations of the tropical areas in particular. An important crop,grown in these areas is banana (Musa spp.). It is the most cul-tivated fruit in the world (144.8 MT), and is used daily by tensof millions as a staple food (FAOSTAT, 2011). For optimal pro-duction banana needs vast amounts of water (Lu et al., 2002;Robinson and Saúco, 2010). However, most production systemswhere banana is grown are small-scale and rain fed. Dependenton the region where banana is grown, minimal precipitation figuresrange from 1200 mm to 2690 mm for optimal production (Robinsonand Alberts, 1986). Water requirements for maximum productionare highly dependent on potential evaporation and therefore varysignificantly depending on the climate where the crop is grown. Inthe East African highlands water requirements are situated in thelower range since temperatures are lower. Nonetheless, drought isone of the biggest constraints to banana production in East Africa(Taulya et al., 2006; van Asten et al., 2011). Banana production also
moves into drier climates as there the fungal disease Black Sigatoka,economically the most threatening disease for banana production,is less or not prevalent (de Bellaire et al., 2010; Robinson and Saúco,2010). The most important cultivated Musa cultivars are mainly
1 rticult
tagwcId1eiAf
wcnp
tqicitpstps(tsdtgtSC2ditsIt
B
wrfTs
TCde
76 E. Kissel et al. / Scientia Ho
riploid hybrids from one or both major diploid ancestors, Musacuminata (AA genome) and Musa balbisiana (BB genome). Theenome of each triploid cultivar is illustrated as a three-letter code,ith each letter being A or B thereby referring to the origin of the
orresponding chromosome set (Simmonds and Shepherd, 1955).t is assumed that the contribution of the B genome leads to greaterrought tolerance (Stover and Simmonds, 1987; Ekanayake et al.,994; Thomas et al., 1998; Robinson and Saúco, 2010; Vanhovet al., 2012). This is attributed to the fact that M. balbisiana orig-nated from more drought-prone monsoon regions in South Eastsia as compared to M. acuminata that originated from Asia’s humid
orest zones.Drought is a complex phenomenon and is often intertwined
ith other constraints. Because of the complexity there is not oneonclusive definition of drought, neither at soil/atmosphere level,or at plant level. Therefore it is challenging to identify the rightarameter and intensity for drought tolerance evaluation.
In agriculture, growth of harvestable organs is the most impor-ant parameter and is thus a direct measure for tolerance. Harvestuantity is the cumulative result of the plant’s growth during
ts vegetative and reproductive stage. When comparing differentultivars, better vegetative growth during drought might be anndication of better tolerance to drought. However, plant growth ashe sole parameter is not satisfactory since a well-growing plant orlantation will extract more water from the soil and will sometimesacrifice its inner water balance to drive growth, finally leadingo more severe stress and jeopardizing ultimate growth of finalroduct (Passioura, 2012). Therefore one approach is to take tran-piration into account. In this perspective transpiration efficiencyTE) becomes a suitable parameter to rapidly screen for droughtolerance because it is directly influenced by both growth and tran-piration (Condon et al., 2004; Wallace, 2000). TE at plant level isefined by the units of dry matter accumulated per unit of waterranspired, i.e. how efficient water was used by the plant to driverowth. TE has been assessed and found to approximate droughtolerance for important crop species like barley, wheat, rice, andorghum, but not to our knowledge for banana (Anyia et al., 2007;abrera-Bosquet et al., 2007; Haefele et al., 2009; Zhanguo et al.,009). It should be noted however, that a cultivar with a high TEuring drought does not guarantee drought tolerance. Jones (2013)
llustrated that TE tends to rise when stomata close. A higher TE ishereby correlated with higher stomatal closure, which is mainlyeen as a survival strategy and is inversely related to productivity.ndeed, Blum (2009) pointed out that growth is intrinsically linkedo transpiration following de Wit’s equation (Eq. (1)).
= c × Tr
E0(1)
ith B the biomass or fresh weight accumulated, Tr the transpi-
ation, c a transpiration independent crop constant and E0 theree water evaporation. Decreasing transpiration will thus increaseE but further decrease biomass accumulation. Therefore, thistudy proposes a methodology where growth is added as an extraable 1ultivars that are used by their cultivar name, the genomic constitution and main use.
ifferent treatments (treatment 0, 1 and 2) separated by a slash symbol. A hyphen symxperiment.
Cultivar Genomic constitution Main use for Eas
‘Yangambi Km5’ AAA Juice banana
‘Mpologoma’ AAA Highland cookin‘Mbwazirume’ AAA Highland cookin‘Sukali Ndizi’ AAB Dessert banana
‘Kayinja’ ABB Juice banana
‘Cachaco’ ABB Cooking banana
urae 185 (2015) 175–182
criterion for drought tolerance, i.e. a cultivar is considered tolerantif it exhibits an efficient use of water combined with a good sus-tained growth. Since TE is difficult to measure in the field, carbonisotope discrimination (�13C) is often proposed as a good proxy andwill also be evaluated in this study.
The objective of this study is to discover drought tolerant culti-vars. Therefore TE and its proxy �13C have been assessed as suitableparameters for drought tolerance evaluation. As indicated above, acultivar with a high TE during drought does not guarantee droughttolerance for a crop. Therefore an extra research question is for-mulated: does selection for high TE varieties inevitably lead to theselection of slow growing varieties? To tackle this issue, TE has beenassessed in correlation with growth.
2. Materials and methods
2.1. Growing conditions
Three different experiments with each a different set of plantswere conducted at the IITA research station of Namulonge,Uganda (00◦31′30′′ N, 32◦36′54′′ E). The first experiment started inNovember 2008 lasting 133 days, the second experiment started inAugust 2009 lasting 157 days and the third experiment started inSeptember 2010 lasting 135 days. Those experiments will hereafterbe referenced to as experiment 2008, 2009 and 2010, respectively.Plants were grown in 30 L buckets that were sealed in a polyethyl-ene bag to limit evaporation from the soil surface and placed in ascreen house. The soil was classified as a sandy loamy clay, with apH 6.4 as determined in a soil/water suspension (1/2.5). Both tem-perature and humidity were logged every day between 2:00 p.m.and 4:00 p.m. From these data the vapour pressure deficit was cal-culated which temporal change during every experiment is shownin Fig. S1.
Supplementary material related to this article can befound, in the online version, at http://dx.doi.org/10.1016/j.scienta.2015.01.035.
2.2. Plant material
Four (2008) and six (2009, 2010) cultivars were selected thatcover the diversity at the triploid level, ranging from cultivars with-out the B genome to cultivars with two thirds of their genomecomposed by the B genome. The cultivars and sample size for everytreatment–cultivar combination are listed in Table 1.
2.3. Water conditions
In 2008 and 2009 all cultivars were subjected to three differentwater treatments, but plants in 2010 were only subjected to twowater treatments. Every treatment was defined by a range of soilwater potential (� s) defined in Table 2.
For every experiment (2008, 2009 or 2010) the sample size (n) was given for thebol indicates the absence of the corresponding cultivar × treatment group in the
t Africa n (treatment 0/1/2)
2008 2009 2010
13/12/10 8/8/8 10/10/–g banana 13/12/11 8/8/7 10/10/–g banana –/–/– 7/8/7 10/10/–
12/13/12 8/8/8 10/10/–12/12/12 8/8/8 10/10/–
–/–/– 7/8/8 10/10/–

E. Kissel et al. / Scientia Horticult
Table 2The different treatments given as an interval of soil water potential (� s) and of itslogarithmic scale. The volumetric water content (�) for every � s value is given asdefined by the water retention curve (Eq. (2)).
Level � s (kPa) log(−� s) (pF) � (cm3/cm−3)
2
ttercsffo
dwbwi
m
w(
2
pr(wucmtcrmo
wcwdop
0 [−63, −126] [1.8, 2.1] [0.33, 0.30]1 [−316, −501] [2.5, 2.7] [0.28, 0.27]2 [−631, −1259] [2.8, 3.1] [0.25, 0.19]
.3.1. Water retention curveIn order to monitor � s during the experiment, it was estimated
hrough its correlation with the volumetric water content (�), i.e.he volume of water per volume of soil. For the soil used in thexperiments this relation was determined by means of a wateretention curve of which the equation is given by Eq. (2). In order toonstruct the water retention curve for the soil that was used, sixoil samples were analyzed. The obtained volumetric water contentor a range of water potentials were fitted using two equations, oneor � greater than 0.2627 cm3/cm3 (R2 = 0.77), and one for � lowerr equal to 0.2627 cm3/cm3 (R2 = 0.79) (Eq. (2)).
log(−�s) = 69.12�2 − 55.06� + 12.47 for � ≥ 0.2627 cm3/cm3 [pF]
log(−�s) = 1.775�−0.33 for � < 0.2627 cm3/cm3 [pF](2)
Throughout the experiment the volumetric water content wasetermined by measuring the initial soil volume and calculating theater volume through dividing the water mass in the soil (mwater)
y the water density. This mwater could be assessed using Eq. (3),here all the masses can be determined easily at any given point
n time except for the changing mass of the plant.
water = mtotal − (mpl + mpot + msoil) [kg] (3)
ith m, mass of the whole system (mtotal), soil water (mwater), plantmpl), pot (mpot), dry soil (msoil) [kg].
.3.2. Fresh biomass estimationFor plant mass determination throughout the experiment, a
lant model was developed whereby the fresh biomass was cor-elated to morphological measurements on leaf and pseudostemR2 = 0.88, n = 112) (Eq. (4)). During the experiment the fresh planteight was estimated every two weeks using Eq. (4). With thepdated plant weight, the goal weight for every experimental unitould be recalculated following Eq. (3). Every other day the experi-ental units were weighed and water was given until they reached
his goal weight which corresponds to the target volumetric waterontent given by the highest � s of the corresponding treatmentange. At times of high water use, water was provided on non-easurement days (e.g. weekends) according to a running average
f water used over the preceding week.
ml =n∑
i=1
0.028liwi with n : number of leaves [g]
mpe =n∑
i=1
0.395�hpe,i
[(gbpe,i + gtpe,i)/2
2�
]2
with n : number of petioles [g]
mps = 0.667�hps
[(gbps + gtps)/2
2�
]2
[g]
mr = 0.233(ml + mpe + mps) [g]
mpl = 1.031(ml + mpe + mps + mr ) [g]
(4)
ith m, mass of the leaves (ml), petioles (mpe), pseudostem andorm (mps), roots (mr) or plant (m ) [g]; l, leaf length [cm]; w, leaf
plidth [cm]; gb, girth at the base of either the petiole (gbpe) or pseu-ostem (gbps) [cm]; gt, girth at the top of either the petiole (gtpe)r pseudostem (gtps) [cm]; h, height of either the petiole (hpe) orseudostem (hps) [cm].urae 185 (2015) 175–182 177
2.4. Measurements
2.4.1. Transpiration efficiencyTranspiration efficiency (TE) was evaluated on all the plants. TE
is calculated as the dry matter accumulation during the experimentper unit of water transpired (Eq. (5)).
TE = �mdry
transpT[g/l] (5)
with �mdry, total dry matter accumulation [g]; transpT, total tran-spiration [l].
Since the dry mass cannot be measured at the start of theexperiment, it is estimated by the average water content (WC)per cultivar-treatment group and the fresh mass at the start ofthe experiment that is determined by the plant model. Using thismethod the dry mass accumulation (�mdry) can be calculated bymeans of the fresh mass gain (�mfresh) and the average WC, asshown in Eq. (6).
TE = �mfresh(1 − WCavg)transpT
[g/l] (6)
with �mfresh, total fresh mass accumulation [g]; WCavg, average WC(g water/g fresh matter); transpT, total transpiration [l].
2.4.2. Carbon isotopeFor carbon isotope measurements, leaf samples of four cultivars
(‘Mpologoma’, ‘Sukali Ndizi’, ‘Cachaco’ and ‘Mbwazirume’) weretaken in 2009 and of all cultivars in 2010. The leaf samples weredried at 105 ◦C, milled, homogenized and burned. The resulting andseparated CO2 gasses were passed through the elementary analyser(EuroEA 3028 HT) and a mass spectrometer (IRMS Isoprime). Thedata were analyzed using Masslinx software calculating the isotopecomposition.
2.5. Statistics
Statistical analysis was performed in R v3.0.0 using the Agricolaepackage for non-parametrical analysis since no normal distributionor homogeneity between the groups could be proven. Therefore theKruskal–Wallis test was used for multiple pairwise comparisonswith different sample sizes using the false discovery rate proce-dure and a significance level ̨ of 0.05. Correlation between TE and�13C was performed using Spearman’s rank correlation with a sig-nificance level ̨ of 0.05. All medians in the article are accompaniedby the standard error of measurements in the group. Plots weremade with the Ggplot2 package. In all the following boxplots thebold middle line is the median. The box is confined by the first andthird quartile and the whiskers extend to 1.5 times the interquar-tile distance from the box. Data points that fall outside the whiskersare considered as outliers.
3. Results
3.1. Transpiration efficiency
The result of three different experiments and six different culti-vars shed a light on the most likely TE of banana under non-stressedconditions and shows no significant difference between the threeexperiments. The overall median TE ranges from 4.15 g/l (±1.25) to4.54 g/l (±0.77). For further information about dry matter accumu-lation and transpiration during the experiment we refer the reader
to Table S1.Supplementary material related to this article can be found,in the online version, at http://dx.doi.org/10.1016/j.scienta.2015.01.035.

178 E. Kissel et al. / Scientia Horticulturae 185 (2015) 175–182
F threec Table
vdicdd
i2
aT‘(K‘wh
3
wifTov
in each experiment, only a poor correlation was found in these
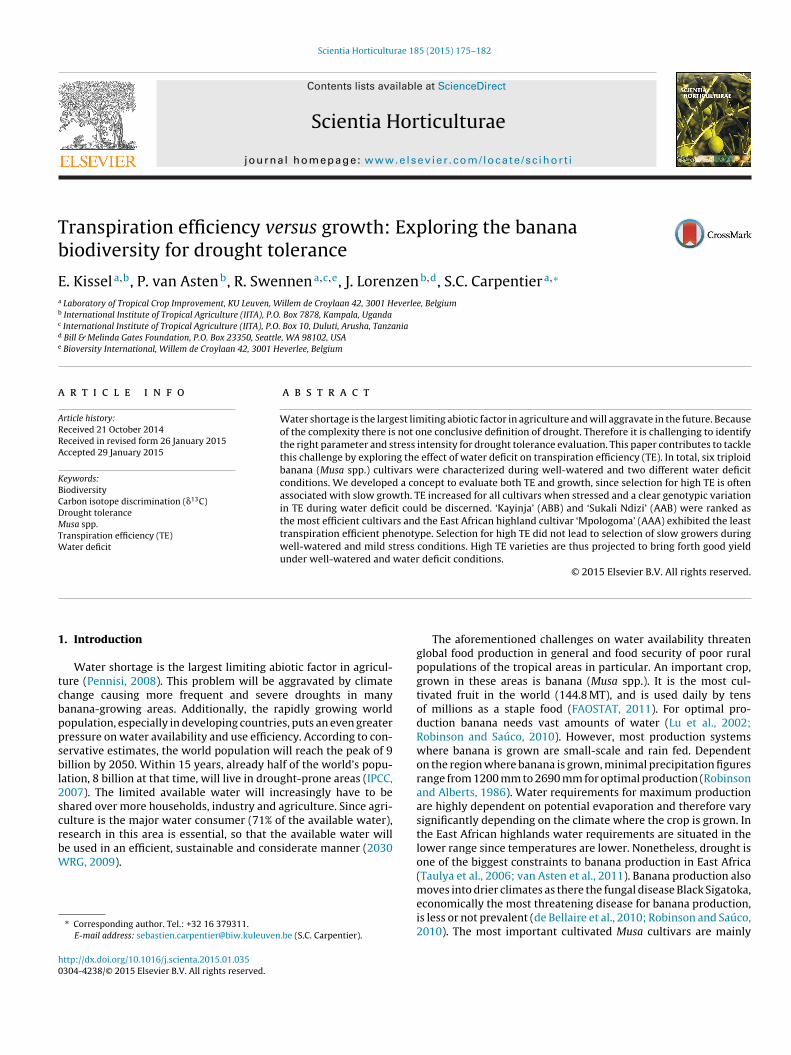
ig. 1. Variation of transpiration efficiency (TE) between six cultivars subjected toombination). Water deficit levels are defined by water potential ranges defined in
A major goal of the experiments was to assess the genotypicariation of TE present in banana. Over the 3 experiments con-ucted in 2008, 2009 and 2010, all cultivars showed a significant
ncrease in TE at both water deficit levels (1, 2) compared to theirontrol (0), except for ‘Mpologoma’ and ‘Cachaco’ in the 2009ataset, where the observed difference was not significant for watereficit level 1 (Figs. 1, S2 and S3).
Supplementary material related to this article can be found,n the online version, at http://dx.doi.org/10.1016/j.scienta.015.01.035.
In 2008, the TE of ‘Kayinja’ was significantly different fromll the others at water deficit level 2 (Fig. S2). In 2009, theE of ‘Kayinja’ and ‘Sukali Ndizi’ was significantly higher than
Mpologoma’, ‘Mbwazirume’ and ‘Cachaco’ at water deficit level 1Fig. 1). At level 2, the TE of ‘Kayinja’, ‘Sukali Ndizi’ and ‘Yangambim5’ and ‘Cachaco’ was significantly higher than ‘Mpologoma’ and
Mbwazirume’ (Fig. 1). A similar tendency was observed in 2010,hereby ‘Kayinja’ showed the highest TE which was significantlyigher than the other cultivars except for ‘Sukali Ndizi’ (Fig. S3).
.2. TE versus growth
In Fig. 2, dry matter accumulation and TE under water deficitere plotted to verify whether cultivars selected for high TE dur-
ng water deficit like ‘Kayinja’ and ‘Sukali Ndizi’ were rather slow or
ast growers. Every individual measurement from each variable (i.e.E and dry matter accumulation) was subtracted from the medianf the corresponding variable, therefore a cultivar with variablealues greater than zero can be interpreted as better than thedifferent water regimes in the 2009 experiment (n = 7–8 per cultivar–treatment 2. Different letters (a–g) indicate significant differences at ̨ = 0.05.
median banana plant for this variable and vice versa. Subsequently,cultivars in quadrants I and II can be described as fast growers rela-tive to the whole dataset, with cultivars in quadrant I having a highTE and those in quadrant II having a low TE under water deficit.Similarly, cultivars in quadrant III & IV can be described as rela-tive slow growers, where the third quadrant holds cultivars with alow TE and quadrant IV holds the ones with a high TE during waterdeficit.
In all our experiments fast growers during water deficit tendto have a high TE whereas slower growers tend to have a low TE(Fig. 2). Not only good growth during water deficit but also goodgrowth during normal conditions is an important factor to take intoaccount during selection for drought tolerance. Therefore for everycultivar, normalized median growth under control was also plottedagainst TE under water deficit (Fig. 3). Comparable to the growthunder water deficit, there were no cultivars located in quadrant IVfor any experiment.
3.3. Carbon isotope discrimination
As with TE, water deficit had an influence on carbon isotope dis-crimination compared to normal conditions with a higher presenceof the 13C isotope in water deficit plants (Fig. 4).
However, when TE was correlated to �13C for every treatment
datasets (Fig. 5). Spearman correlation coefficients between TEand �13C across the experiments range from −0.36 to 0.38 andshowed only a significant correlation for the control treatmentin 2010.

E. Kissel et al. / Scientia Horticulturae 185 (2015) 175–182 179
Fig. 2. Does selection for transpiration efficiency (TE) during water deficit result in slow growing cultivars in dry years? A cross experimental view. Four to six cultivars wereevaluated over three experiments for TE and dry matter (DM) accumulation during water deficit. Every individual measurement from these variables were subtracted fromthe median of the corresponding variable. The intensity of the water deficit that was applied corresponds to the water deficit level 1 in Table 2. Dashed lines indicate thestandard error. Three letter codes in the graph indicate the genome constitution of the corresponding cultivar. || n = 12–13 (2008); 8 (2009); 10 (2010).
Fig. 3. Does selection for transpiration efficiency (TE) during water deficit result in slow growing cultivars in normal years? A cross experimental view. Four to six cultivarswere evaluated over three experiments for TE and dry matter (DM) accumulation during water deficit. Every individual measurement from these variables were subtractedfrom the median of the corresponding variable. The intensity of the water deficit that was applied corresponds to the water deficit level 1 in Table 2. Dashed lines indicatethe standard error. Three letter codes in the graph indicate the genome constitution of the corresponding cultivar. || n = 12–13 (2008); 8 (2009); 10 (2010).

180 E. Kissel et al. / Scientia Horticult
Fig. 4. Influence of three different water regimes on carbon isotope discrimination(bl
4
iwwHt
4
ota1mhc2el1hifcFsR
4
mt
�13C) for four to six cultivars over two experiments. Water deficit levels are definedy water potential ranges defined in Table 2. n = 22–23 (2009); 30 (2010). Different
etters (a–c) indicate significant differences at ̨ = 0.05.
. Discussion
We hypothesize that TE increases during water deficit, that theres a cultivar dependent response and that selection for cultivars
ith high TE does not lead to the selection of slow growing cultivars,hich makes it a good parameter for drought tolerance evaluation.owever, since TE is difficult to assess in the field, we hypothesize
hat �13C can be used as a proxy.
.1. Banana: a water efficient C3 crop?
Across three experiments the median dry matter productionf all tested Musa cultivars ranged from 4.15 to 4.54 g/l of waterranspired. This is comparable to the highest average TE in rice,nother monocotyledon C3 crop, which is reported to range from.8 to 3.9 g/l as observed in comparable screen house pot experi-ents by Haefele et al. (2009). The lowest TE found in Musa is 30%
igher than the highest average TE reported in other C3 crops likeowpea (2.50 g/l), barley (1.9–3.2 g/l) and wheat (3.2 g/l) (Anyia,004; Anyia et al., 2007; Cabrera-Bosquet et al., 2007; Hubickt al., 1986). TE of banana is rather low compared to C4 speciesike sorghum (4.7–7.1 g/l) and maize (4.2–5.7 g/l) (Ray and Sinclair,998; Zhanguo et al., 2009). This places Musa in the medium toigh TE ranges in the field of crops and in between the TE seen
n C3 and C4 species. However, a designated experiment using dif-erent species would be necessary to confirm these interspeciesomparisons, so that growth conditions and stages are similar.inally, it must be noted that Musa, seemingly a water efficient crop,till needs a lot of water for optimal production (Lu et al., 2002;obinson and Saúco, 2010; Turner et al., 2007a; Turner, 2013).
.2. Water deficit affects TE
It was clear that water deficit had a positive effect on the dryatter accumulated per unit of water transpired (Fig. 1). One of
he main water saving strategies is the closure of stomata as can
urae 185 (2015) 175–182
be seen by the 13C isotope that was more abundant in stressedplants (Fig. 4). During the Calvin cycle Rubisco prefers CO2 consist-ing of the 12C isotope over the 13C isotope as a substrate. Whenstomata close the exchange of CO2 is affected, internal 12C concen-trations are depleted and more of the 13C isotope CO2 serves as asubstrate and will ultimately be built in the plants carbon skeletonat higher concentrations. Water deficit will increase the resistancefor gas exchange and this will mainly affect the exchange of H2Oand to a lesser extend the exchange of CO2 since both have a differ-ent diffusion coefficient, because of the higher internal mesophyllresistance for CO2 compared to water. This implicates that underthe low intensity of water deficit, TE increases by a reduced waterloss while the accumulation of dry matter is not so much affected.
4.3. Genotypic variation of TE during water deficit
During water deficit different cultivars showed a different TEwith a high TE for ‘Kayinja’ (ABB) and ‘Sukali Ndizi’ (AAB) indicat-ing a higher drought tolerance while ‘Mpologoma’ (AAA) was foundrepeatedly in the lower TE ranges (Figs. 2, S2 and S3). The variationobserved in the experiments is another, rather cautious, indicationfor the positive link between the presence of the B genome andincreased drought tolerance as already reported (Ekanayake et al.,1994; Robinson and Saúco, 2010; Stover and Simmonds, 1987;Vanhove et al., 2012). The trial results do not exclude the existenceof other AAA cultivars with a tolerant phenotype and other ABBcultivars with a more sensitive phenotype.
4.4. Selection for high TE results does not lead to selection of slowgrowing cultivars
TE is suggested as a suitable proxy for drought tolerancescreening in Musa because selection for high TE under water deficitdid not result in selection of slow growers under water deficit(Fig. 2). This is an important quality since an increase in TE duringwater deficit does not a priori mean a more tolerant crop. Select-ing for cultivars with a high TE might lead to the selection of lowtranspiring cultivars which might be slow growing as well (Blum,2009). Accordingly, tolerance on farmer level is defined as the mostoptimal production during suboptimal conditions, wherein slowgrowers that direct their available resources too early into sur-vival instead of growth do not fit in this picture. Additionally, noslow growers would have been selected under normal conditionswhen selecting for a high TE during drought (Fig. 3). This is equallyimportant, since most farmers will mainly cultivate crops in regionswhere water availability is ample or at least sufficient for a pre-dictable yield in most years. Therefore it is essential for tolerantcultivars to grow well in normal periods/years too.
4.5. ı13C cannot be used as a proxy for TE to discover tolerantvarieties
TE is difficult to measure in the field, since transpiration mea-surements necessitate expensive facilities like lysimeters, which isparticularly challenging for large crops like banana. Therefore TE isestimated by other proxy variables like carbon isotope discrimina-tion (�13C), which is an indication of stomatal closure throughouta plant’s life and is thereby closely related to transpiration and car-bon uptake for growth (Cabrera-Bosquet et al., 2007; Farquhar andRichards, 1984; Hubick et al., 1986; Kondo et al., 2004). A good cor-relation between TE and �13C was observed in this study as well
(Fig. 4). This is mainly attributed to the pronounced effect of waterdeficit on both �13C and TE resulting in a good correlation. How-ever, the resolution of the method is not high enough for furtherassessment of the correlation between �13C and TE during water
E. Kissel et al. / Scientia Horticulturae 185 (2015) 175–182 181
F iminaW he sp(
dtlmtrbsfTgdtdd
5
epstgtit
ig. 5. Correlation between transpiration efficiency (TE) and carbon isotope discrater deficit levels are defined by water potential ranges defined in Table 2. � is t
p < 0.05) is indicated by one asterisk.
eficit, where selection takes place (Fig. 5). Consequently, selec-ion for high �13C plants during water deficit would not necessarilyead to the selection of high TE plants. The 13C levels are only deter-
ined by the possibility of CO2 exchange with the atmosphere andhus opening and closing of stomata while TE takes into account theeal dry matter accumulation and thereby growth. Another possi-le explanation for the lack of correlation between TE and �13C asuggested by Turner et al. (2007b). It can be explained by the dif-erence in dry matter allocation between leaves and corm. SinceE was determined by the dry matter accumulated in the above-round parts of the plant and �13C was only measured at leaf level,ifferences in dry matter allocation could influence the correla-ion between both variables (Turner et al., 2007b). Furthermore,ry matter allocation is known to be a strategy for coping withrought and can differ among cultivars.
. Conclusions and perspectives
We have successfully developed a workflow to screen differ-nt genotypes for drought tolerance. TE was shown to be a usefularameter to screen for drought tolerant genotypes in the Musapecies when coupled to growth. Drought triggered a reaction uponhe plant that caused TE to raise significantly and this response was
enotype dependent. Selection for the highest TE did not result inhe selection of slow growers in normal nor stress treatments. ‘Kay-nja’ (ABB) and ‘Sukali Ndizi’ (AAB) both showed the best droughtolerance, whereas the East African highland cultivar ‘Mpologoma’tion (�13C) for four to six cultivars in three water regimes over two experiments.earman rank correlation coefficient; a significant spearman correlation coefficient
(AAA) was most sensitive to water deficit, as could be observed inall three experimental years. This endorses the hypothesis that thepresence of the B genome contributes to a better drought tolerance.Although there was a general correlation between carbon isotopediscrimination and TE, the correlation was not strong enough todetect the small genotypic differences in TE under drought. In thefuture other variables that can be tested in the field, like leaf tem-perature, leaf area and specific leaf weight should be assessed aswell. Although fast vegetative growth is of utmost important for aperennial that can be grown the whole year round, this experimentwas hindered by the inability to take plants through to floweringand fruit harvest. It will also be important to assess relevant vari-ables in the field in order to relate to harvest in well-watered andwater deficit treatments in order to verify whether selection for TEwould also lead to the highest yielding cultivars.
Acknowledgements
The authors would like to thank the team in Namulonge andthe MSc students Fanny Collard, Tim Declercq and Aaike Cnops(KU Leuven) for their work in the screen house. The IITA-Ugandaresearch staff is greatly acknowledged for assisting the studentswith their trials, in particular Michael Batte, Festo Sentamu, Milly
Namusoke and Godfrey Taulya. Also Dr. Jiri Zamecnik from theCrop Research Institute (Prague, Czech) is acknowledged for thecarbon isotope measurements. Finally, Valentijn Tuts is acknowl-edged for his expertise and help for creating water retention curves
1 rticult
f(m
R
2
A
A
B
C
C
d
E
F
F
H
H
I
J
82 E. Kissel et al. / Scientia Ho
or the soil used in the experiments. Financial support from CIALCAa research project of the Belgian Directorate-General for Develop-
ent Cooperation (DGDC)) is gratefully acknowledged.
eferences
030 WRG (2030 Water Resources Group), 2009. Charting Our Water Future:Economic Frameworks to Inform Decision-Making, Available online at:www.2030wrg.org
nyia, A., 2004. Water-use efficiency, leaf area and leaf gas exchange of cowpeasunder mid-season drought. Eur. J. Agron. 20, 327–339.
nyia, A.O., Slaski, J.J., Nyachiro, J.M., Archambault, D.J., Juskiw, P., 2007. Relation-ship of carbon isotope discrimination to water use efficiency and productivity ofbarley under field and greenhouse conditions. J. Agron. Crop Sci. 193, 313–323.
lum, A., 2009. Effective use of water (EUW) and not water-use efficiency (WUE) isthe target of crop yield improvement under drought stress. Field Crops Res. 112,119–123.
abrera-Bosquet, L., Molero, G., Bort, J., Nogués, S., Araus, J.L., 2007. The combinedeffect of constant water deficit and nitrogen supply on WUE, NUE and �13C indurum wheat potted plants. Ann. Appl. Biol. 151, 277–289.
ondon, A.G., Richards, R.A., Rebetzke, G.J., Farquhar, G.D., 2004. Breeding for highwater-use efficiency. J. Exp. Bot. 55, 2447–2460.
e Bellaire, L.L., Fouré, E., Abadie, C., Carlier, J., 2010. Black Leaf Streak Disease ischallenging the banana industry. Fruits 65, 327–342.
kanayake, I.J., Ortiz, R., Vuylsteke, D.R., 1994. Influence of leaf age, soil moisture,VPD and time of Day on leaf conductance of various Musa genotypes in a humidforest-moist savanna transition site. Ann. Bot. 74, 173–178.
AOSTAT (Food and Agriculture Organization of the United Nations, Rome, Italy),2011. Available online at: http://faostat3.fao.org/
arquhar, G.D., Richards, R.A., 1984. Isotopic composition of plant carbon correlateswith water-use efficiency of wheat genotypes. Aust. J. Plant Physiol. 11, 539–552.
aefele, S.M., Siopongco, J.D.L.C., Boling, A.A., Bouman, B.A.M., Tuong, T.P., 2009.Transpiration efficiency of rice (Oryza sativa L.). Field Crops Res. 111, 1–10.
ubick, K.T., Farquhar, G.D., Shorter, R., 1986. Correlation between water-use effi-ciency and carbon isotope discrimination in diverse peanut (Arachis) germplasm.Aust. J. Plant Physiol. 13, 803–816.
PCC, 2007. Climate Change, 2007: The Physical Science Basis. Contribution of Work-
ing Group I to the Fourth Assessment Report of the Intergovernmental Panel onClimate Change. Intergovernmental Panel on Climate Change, Available onlineat: http://www.ipcc.ch/ones, H.G., 2013. Plants and Microclimate: A Quantitative Approach to Environmen-tal Plant Physiology. Cambridge University Press.
urae 185 (2015) 175–182
Kondo, M., Pablico, P.P., Aragones, D.V., Agbisit, R., 2004. Genotypic variationsin carbon isotope discrimination, transpiration efficiency, and biomass pro-duction in rice as affected by soil water conditions and N. Plant Soil 267,165–177.
Lu, P., Woo, K.C., Liu, Z.T., 2002. Estimation of whole-plant transpiration of bananasusing sap flow measurements. J. Exp. Bot. 53, 1771–1779.
Passioura, J.B., 2012. Phenotyping for drought tolerance in grain crops: when is ituseful to breeders? Funct. Plant Biol. 39, 377–412.
Pennisi, E., 2008. The blue revolution, drop by drop, gene by gene. Science 320,171–173.
Ray, J., Sinclair, T., 1998. The effect of pot size on growth and transpiration of maizeand soybean during water deficit stress. J. Exp. Bot. 49, 1381–1386.
Robinson, J.C., Alberts, A.J., 1986. Growth and yield responses of banana (cultivar‘Williams’) to drip irrigation under drought and normal rainfall conditions inthe subtropics. J. Sci. Hort. 30, 187–202.
Robinson, J.C., Saúco, V.G., 2010. Bananas and Plantains, 2nd ed. CAB International.Simmonds, N.W., Shepherd, K., 1955. The taxonomy and origins of the cultivated
bananas. J. Proc. Linn. Soc. Bot. 55, 302–312.Stover, R.H., Simmonds, N.W., 1987. Bananas, 2nd ed. Longman Scientific & Techni-
cal.Taulya, G., van Asten, P.J.A., Okech, S., Gold, C., 2006. Effect of drought on the yields
of an East African highland banana (cv. ‘Kisansa’) in Uganda. In: Paper Presentedat the Soil Science Society of East Africa Conference, Masaka, Uganda.
Thomas, D.S., Turner, D.W., Eamus, D., 1998. Independent effects of the environmenton the leaf gas exchange of three banana (Musa sp.) cultivars of different genomicconstitution. J. Sci. Hort. 75, 41–57.
Turner, D.W., Fortescue, J.A., Thomas, D.S., 2007a. Environmental physiology of thebananas (Musa spp.). Braz. J. Plant Physiol. 19, 463–484.
Turner, N.C., Palta, J.A., Shrestha, R., Ludwig, C., Siddique, K.H.M., Turner, D.W.,2007b. Carbon isotope discrimination is not correlated with transpiration effi-ciency in three cool-season grain legumes (pulses). J. Integr. Plant Biol. 49,1478–1483.
Turner, D.W., 2013. Crop physiology and cultural practices – a synergy in bananaand plantain (Musa spp.). Acta Hort. 986, 41–49.
van Asten, P.J.A., Fermont, A.M., Taulya, G., 2011. Drought is a major yield loss factorfor rainfed East African highland banana. Agric. Water Manage. 98, 541–552.
Vanhove, A.-C., Vermaelen, W., Panis, B., Swennen, R., Carpentier, S.C., 2012.Screening the banana biodiversity for drought tolerance: can an in vitro growthmodel and proteomics be used as a tool to discover tolerant varieties and under-
stand homeostasis. Front. Plant Sci., http://dx.doi.org/10.3389/fpls.2012.00176.Wallace, J.S., 2000. Increasing agricultural water use efficiency to meet future foodproduction. Agric. Ecosyst. Environ. 82, 105–119.
Zhanguo, X., Rob, A., John, B., 2009. Genetic diversity of transpiration efficiency inSorghum. Field Crops Res. 111, 74–80.
Copyright © 2022 FDOKUMEN