TRANSPIRATION AND CROP YIELDS - WUR eDepot
90
I NSTITUUT VOOR BIOLOGISCH EN SCI!EIKU.NDIG ONDERZOEK VAN LANDBQUWGEWASSEN INSTITUTE OF BIQLOGIGAL AND ClfEMICAL R,ESEARCH ON FIELD CROPS AND HERBAGE WAGENlNGEN THE NE'rHERLANDS TRANSPIRATION AND CROP YIELDS DR. IR. C. T. DE WIT HOOFDAFDELING POCUMENTATIE EN PUBLIKATIES VAN DE DIRECTlE VAN LANDBOUW VERSL. LANDBOUWK.ONDERZ. NO. 64.6 's-ORAVENHAOE ..,..J958
-
Upload
khangminh22 -
Category
Documents
-
view
0 -
download
0
Transcript of TRANSPIRATION AND CROP YIELDS - WUR eDepot
I NSTITUUT VOOR BIOLOGISCH EN SCI!EIKU.NDIG ONDERZOEK VAN LANDBQUWGEWASSEN
INSTITUTE OF BIQLOGIGAL AND ClfEMICAL R,ESEARCH ON FIELD CROPS AND HERBAGE
WAGENlNGEN
THE NE'rHERLANDS
TRANSPIRATION AND CROP YIELDS
DR. IR. C. T. DE WIT
HOOFDAFDELING POCUMENTATIE EN PUBLIKATIES VAN DE DIRECTlE VAN D~ LANDBOUW
VERSL. LANDBOUWK.ONDERZ. NO. 64.6 ~ 's-ORAVENHAOE ..,..J958


CONTENTS
Section 0.0, INTRODUCTION . . . . . . 0.1. SUMMARY . . . . . . . . . 0.2. LIST OF REOC'CURING SYMBOLS 1. BASIC CONSIDERATIONS . . .
1.1. Transpiration of leaves, plants and crops . l. 1.1. The evaporation from a small wet surface . 1.1.2. The transpiration of a leaf . . . . . . . 1.1.3. Effects of morphological differences . , . 1. 1 .4. Transpiration of crop surfaces and plants . 1.1.5. Water shortage . . . . . . . .
1.2. Assimilation of leaves, plants and crops 1.2.1. Assimilation and light intensity 1.2.2. The effect of temperature . 1.2.3. The age of the leaves . 1.2.4. Mineral nutrition . . . . 1.2.5. Water shortage . . . . . 1.2.6. Assimilation of crop surfaces 1.2.6.1. A theoretical approach . . 1 .2.6.2. The value of R in arid and temperate climates .
1.3. The ratio between transpiration and assimilation 1.3.1. Radiation intensity. 1.3.2. Temperature . . . . . . 1.3.3. Water shortage . . . . . 1.3.4. Mutual shading of leaves . 1.3.5. The horizontal extension of the crop surface
1.4. Summary. . . . . . . . . . . . . . . . . . .
2. TRANSPIRATION AND PRODUCTION OF PLANTS IN CONTAINERS .
Page
5 7 8 9 9 9
10 12 13 16 17 17 20 21 22 23 23 23 27 28 28 29 29 32 33 34
35
2.0. Introduction . . . . . . . . . . . . . . . . . . 35 2.1. Transpiration and production in arid climates . . . . 36
2.1.1. The classical experiments of BRIGGS, SHANTZ et. al. 36 2.1.1.1. Experimental conditions . . . . . . . . . . . 36 2.1.1.2. A new interpretation of the experimental results . 37 2.1.1.3. The constant m and its value for sorghum, wheat ~nd alfalfa 42 2.1.2. Varietal differences . . . . . . . . . . . . 42 2.1.3. The influence of climate on the value of m. . 43
2.2. Transpiration and production in temperate climates 44 2.2.1. Some experiments in the Netherlands. 44 2.2.1.1. Peas . 44 2.2.1.2. Beets . . . . . . . . . . . . . . 47

2.3.
2.4.
4
2.2.1.3. Oats . . . . . . . 2.2.1.4. The constant n and its value for peas, beets and oats . 2.2.2. The influence of climate on the value of n . . . . . . . The transpiration and production of differently treated plants . 2.3.0. Introduction . . . . . 2.3.1. Nutrient level of the soil 2.3.2. Availability of water . 2.3.3. The age of the plant 2.3.4. Mutual shading . Summary ....... .
48 49 49 50 50 50 52 54 55 58
3. TRANSPIRATION AND PRODUCTION IN THE FIELD . 59
3.1. Mainly theoretical considerations . . .. . 59 3.1.1. Production and transpiration, limited by the availability of water 59 3.1.2. A simple, but necessary field experiment . . . . . . . . . 60 3.1.3. The relation between transpiration and production in the field 61 3.1.4. The horizontal extension of the crop surface . . . . . . . 61 3.1.5. The distribution of water during growth . . . . . . . . . 62
3.2. Field experiments with alfalfa in the West of the United States of America . . . . . . . . . . . . . . . 63 3.2.1. The value of m for alfalfa . . . . . 63 3.2.2. The treatment of field experiments . 63 3.2.3. The results of irrigation experiments 64
3.3. Field experiments with Kubanka wheat in the Great Plains of the United States of America . . . . . 68 3.3.0. Introduction . . . . . . . . . . . . 68 3.3.1. The results of field experiments . . . . 69 3.3.2. The distribution of water during growth 72 3.3.2.1. Seed production of wheat in containers . 72 3.3.2.2. The relation between seed and total yield of Kubanka wheat
in the field . . . . . . . . . . . . . . . . . . . . . . 73 3.4. Additional experiments on the American continent . . . . . . . . 76 3.5. Some field experiments with small grains and beets in the Netherlands 79 3.6. Transpiration during growth and free water evaporation 83 3.7. Summary. 84
LITERATURE . . . . 85

0.0. INTRODUCTION
At present it is generally accepted that transpiration of field crops is· limited by either (a) the supply of water to be evaporated or (b) a supply of energy to provide the heat of vaporization of the water. The ~xtreme of high energy supply and low water supply introduces great difficulties in a <;ompletely physical approach. At the other extreme of plentiful water it is possible to apply known physical principles which lead to the concept of "potential transpiration". This is the rate of evaporation from an extended surface of a short green crop, actively growing, completely shading the soil and never short of water.
Starting from a known moisture content of the soil and keeping account of rainfall and calculated potential transpiration, it should be possible to estimate at any time the amount of water necessary to replenish transpiration losses. This should enable one to avoid growth checks, either due to water shortage or to excess of water. The potential transpiration should be independent of the growth rate of the crop and this seems to prove that the older concept of the transpiration ratio (i.e. the ratio between transpiration and production) is of no use. In PENMAN's (1956) words (page 25):
"ln thinking of the relationship of growth and transpiration there is little value in the concept of 'transpiration ratio', for there is no reason to suppose that a plant must transpire a fixed quantity of water to produce a given quantity of dry matter. The transpiration rate is dominated by weather; the growth rate admittedly depends on the same weath~r (but we are only groping for the solution of this fundamental problem in agricultural meteorology) but can show enormous variations because of differences in soil fertility or incidence of disease".
However, when water is limiting, it cannot be maintained that there is no relation between transpiration and production. Under such conditions production does not show enormous variations due to differences in fertility.
In the Union of Burma, where one of the main problems is the second crop growing during the dry season, the author wondered why so little use is made of transpiration ratio measurements (DE WIT, 1956). He suppose<;i that a reasonable interpretation was not pos~ible at the time these measurements were made, because too little was known about the effect of weather on transpiration and assimilation by leaves, plants and crop surfaces. A preliminary survey of literature showed not only the correctness of this opinion, but also that the effect of growing conditions on the transpiration ratio has been overestimated because of an incorr~ct statistical treatment of the measurements. These findings made it desirably to study relevant experiments and theories in detail with the aim to clarify which factors determine the relation between transpiration and produ<;tion under field conditions. The results of this study are presented in this paper.
In order to avoid conclusions which might be at variance with the results of physiological experiments, it has been found necessary to summarize in the first place what is known about transpiration and assimilation of single leaves. The results of this work are given in section 1. Experiments on the relation between transpiration and production in containers are critically studied in section 2., whereas the results of field experiments are interpreted in section 3.

6
It is not necessary to study section 1., for readers who are mainly interested in the practical applications. They may start reading at page 34.
The author is particularly indebted to his colleagues G. F. MAKKINK and dr. TH. ALBERDA (I.B.S., Wageningen) for their critical advise, and to dr. L. D. BAVER (Exp. Station H.S.P.A., Honolulu) and dr. P. J. ZWERMAN (Cornell University, New York) for their useful remarks on a draft of this paper.
0. 1. S U M MARY
It is shown in this paper that the relation between transpiration and total dry matter production of plants in containers is much less affected by the growing conditions than supposed.
In the semi-arid and arid regions of the U.S.A. this relation appears to depend mainly on plant species and free water evaporation. In cloudy regions as found in the Netherlands it depends mainly on plant species, only. The effect of factors like soil fertility and availability of water appears to be of secondary importance, except in extreme conditions.
This difference between these two climatic regions is due to light intensity. In cloudy climates, assimilation is much more limited by light intensity than in climates with a large percentage of bright sunshine.
It is shown that the relation between transpiration and total dry matter production of plants under field conditions must be often the same as for plants in containers provided the dry matter production of the plants in the field is limited by the availability of water. Where this latter is not the case, transpiration tends to be higher.
Difficulties were met in dealing with the interrelation between drought resistance and transpiration-production relations and with the contribution of advective energy to transpiration.
As for drought resistance, it is shown that the relation between transpiration and total dry matter production is not affected by the ability of the plant to withstand periods of drought. Instead, the amount of marketable products and the total amount of water which is transpired during the growing period, may depend to a large extent on this ability.
Even when transpiration was considerably larger than free water evaporation, it appeared that the relation between transpiration and production in the field was often the same as in containers. It is concluded that also on farmers' fields advective energy may supply a considerable amount of the heat necessary to vaporize the water which is transpired.
On the other hand, it appeared that there must be and are fields where this is not the case. On those fields, transpiration may be lower than the transpiration calculated with production-transpiration equations in containers. A quantitative treatment of the relation between transpiration and production under these conditions is not attempted, because of the complexity of the aerodynamic approach.
The reader is referred to the sections 1.4., 2.4. and 3. 7. at the end of the three main sections for detailed summaries.

0.2. LIST OF· REOCCURING SYMBOLS
SYMBOL A apparent or net assimilation rate . Ee evaporation from an evaporation pan Ez transpiration of a leaf . . . . . . E0 evaporation from a free water surface . ET potential transpiration . . . . . . . Ew evaporation from a small wet surface . H radiation intensity (for meaning of indices, see
text) . . . . . . . . . . . . . . . . . . h heat exchange coefficient (for meaning of in
dices, see text) . . . . . . . . . . . . . . k vapour exchange coefficient (for meaning of
indices, see text) . . . . . . . . La diffusion length of boundary layer L 8 diffusion length of stomata m constant in the relation
n
P =--= m WE0 - 1
constant in the relation P=nW
P total dry matter production of plants per container . . . . . . . . . . . or per surface unit . . . . . . . . .
R part of the radiation from the sun, which contributes to photosynthesis (for meaning of indices, see text . . . . . . . . . .
s stomatal coefficient (La+ Ls) La-1 .
ta temperature of the air td dewpoint temperature of the air u wind velocity . . . . . . . . V heat of vaporization of water . W transpiration during the whole growing period
of plants per container . . . . . . . . . . . . . . or per surface unit . . . . . . . . . . . . slope of the saturation vapour pressure versus temperature curve at air temperature psychrometric constant . . . . . . . . . .
UNIT
g C02 cm-2 hr-1 or similar units mm day-1 g water cm-2 min-1
mm day-1 or inches day-1 mm day-·1 g water cm-2 min-1
cal cm-2 min-1orcalcm-2day-1
cal cm-2 min-1 °C-1
g water cm-2 min-1 mm Hg-1 em em (g dry matter mm) (kg water day)-1 or kg ha--1 day-1 or bu. acre-1 day-1 or similar units (g dry matter) (kg water) or kg ha-l mm-1 or similar units
g dry matter/cont. kg ha-l or similar units
cal cm-2 min-1 or cal cm-2 day- 1
oc oc
m sec-1 cal g-1
kg water/cont. mm or inches
mm Hg oc-1
mm Hg oc-1

1. BASIC CONSIDERATIONS
l.l. TRANSPIRATION OF LEAVES, PLANTS AND CROPS
l. I. I. The evaporation from a small wet surface
PENMAN ( 1948, 1956) arrived at an expression for the evaporation from a wet surface which does not contain surface parameters, by combining: a. The equations for heat and vapour transfer of a wet surface; b. Bo·wEN's ratio
kw = ~~ l.l yV
in which y is the psychrometric constant (0.49 mm Hg °C-1 ), V the heat of vaporization ( ~ 590 cal (g water) -l) of water, kw the vapour exchange coefficient (gem ·2 min-1 mm Hg-1) and hw the heat exchange coefficient (cal cm-2 min-1 oc. 1) of the surface;
c. the equation for the heat balance of the surface, and introducing: d. the slope .1 of the saturation vapour pressure versus temperature curve at air
temperature (table 1) as a new variable.
TABU 1. Values of ,j = defdt for different temperatures of the air.
Ia ('C) 10 12 14 16 18 20 22 24 26 28 30 .I (mm Hg ·c- 1). 0.61 0.68 0.76 0.86 0.96 1.07 1.19 1.33 1.48 1.64 1.81
DE VRIES and VENEMA ( 1954) treated the evaporation from a filter-paper in an analogous way and arrived at the following expression
Ew = -- -~--- (lfw(n) + 2hw(ta- I d)) (,j -t- )')
1.2
in which En: is the evaporation from both sides of a wet filter-paper (g water cm-2 or mm min 1), lfw(n) is the net radiation gain of the filter-paper (cal cm-2 min-1), hw is the heat exchange coefficient of one side of the paper (cal cm-2 min-1 °C-1 ), t0
and fcJ are the temperature and dewpoint temperature of the air (°C). The net gain of radiation - H w(n) - is the difference between incoming short wave radiation and outgoing long wave radiation and may be estimated from meteorological data, reflection and transmission of the filter-paper being known.
For a filter-paper placed horizontally and with a diameter of 3 em DE VRIES and VENEMA (op. cit.) determined the following relation between hw and the windvelocity - u0 --·at the height of the filter-paper:
hw "'..:. 0.0324 u0 -0.70 cal cm-2 min-1 oc-1 1.3 with u0 in m sec-1.
The value of hw depends also on the size of the evaporating surface and the position with respect to wind direction, but the effect of these factors is not large (compare PEN!viAN and SCHOFIELD(l951), DE VRIES and VENEMA(op.cit.) and RASCHKE(1956)).
10
For instance, MARTIN's (see RASCHKE op. cit.) coefficients of heat transfer of a model of an Helianthus annuus leaf (12.6 X 9.8 em) at wind velocities between 0.20 and 2.59 m sec. -1 are only slightly below those calculated with equation 1.3. Since in the open Hw(n) is in general not small compared with hwCta- td), it is in first approximation safe to suppose that evaporation per surface unit of, both, small filter-papers and plant leaves does not depend on size and position with respect to wind velocity.
The heat transfer coefficient can be expressed by an equivalent diffusion length in the following way. Transfer of heat and vapour is supposed to take place by diffusion through a laminar air layer surrounding the evaporating surface. The diffusion equation (compare PENMAN and SCHOFIELD, 1951) is
eo- ed Ew =--= Dw ---
pLa 1.4
Ew is the evaporation (in cc water vapour cm-2 sec-1 at normal temperature and pressure), Dw the coefficient of diffusion of water vapour in air (about 0.24 cm2
sec-1), p the atmospheric pressure (760 mm Hg) and (e 0 - ed) the vapour pressure difference between the surface and the surroundings. La, the thickness of the air layer on the evaporating surface in em, is called "the diffusion length". From equations 1.1, 1.3 and 1.4 it follows that
em 1.5
an equation which will be used in the following section.
1.1.2. The transpiration of a leaf
The treatment of the transpiration of a leaf is more complicated since the supply of water to the leaf may be limiting, and the resistance to exchange of vapour is greater than to that of heat. This is due to the presence of stomata.
BANGE ( 1953) proved that the difference between transpiration of a leaf not short of water and a free water surface (wet filter-paper) of the same size can be explained quantitatively by the effect of shape, aperture, and number of stomata on the resistance against vapour exchange.
The diffusion length in case of transpiration is (La + L 8 ); La is the diffusion length in air (compare section 1.1.1.) and Ls the diffusion length in the stomata. BANGE ( 1953) developed necessarily tedious methods to calculate Ls from number, size and aperture of the stomata. To avoid these calculations PENMAN and ScHOFIELD (1951) and PENMAN ( 1952) represented stomata by cylindrical tubes with an "effective" length of I em and an "effective" surface of o cm2 and calculated the diffusion length with
I Ls =
no 1.6
where n is the number of stomata per crn2• It is of course very difficult to obtain reasonable values for I and o. Order of magnitudes in case of open stomata are:
n = 104 cm-2, I= 2.10-3 em, o = I0-6 cm2

11
......... ,., ...... ,,~ ... area of open space = 1 %), giving for Ls an order of magnitude of 0.2 em (compare 1952). This value depends of course on plant species and stomatal
For open stmpata La (eq. 1.5) and L 8 are of the same order of magnitude and neither one nor the other can be neglected.
Hence the coefficient of vapour transfer for a leaf not short of water - kz - is
La (La+ Ls)-1 = s-l times
this coefficient for a wet filter-paper - kw -, so that, assuming temperature inside and outside the leaf being the same, BoWEN's ratio (eq. 1.1) can be transformed in
hw skz = kw =-
yV
hw or kz = -
sy V 1.7
This results in the following expression for the transpiration from both sides of one unit of a leaf not short of water
Ez = L1 (sz<n> + 2 hw(ta- ta)) (Ll + sy) V
1.8
in which H/n) is the net gain of radiation energy of the leaf and hw the heat transfer coefficient, which is the same as for a filter-paper of the same dimensions. It is supposed here that the value of sis the same for both sides of the leaf. For many agricultural plants, with stomata on both sides of the leaves (MILLER, 1938), this is approximately true. For leaves of plants with stomata on one side the two surfaces are to be treated separately. This presents no difficulties if it is supposed that the temperature is the same for both sides.
The ratio between transpiration of a leaf - El - and the evaporation from a filter··paper - Ew - of the same size, absorbing the same portion of energy and exposed in the same way as the leaf is therefore
L.-~ --i.J. ... no
El Ll + y
Ew .d + sy
L 0 +Ls,.5
Lo
L ______ ~ __ __l___ ____ _.__ ____ _
fl.i3 0.1. 0.5 1.0
FIG, 1. The relation between diffusion length in the stomata - Ls --, the stomatal coefficient - s - and the ratio between evaporation from a leaf and a filter paper of the same size - Et Ew -l -.
1.9

12
The influences of stomatal number - n -, surface - o - and length - I- on s and ultimately on the ratio EzEw - 1 are relatively small. This is illustrated in figure 1. Along the left side of the horizontal axis, possible values of L 8 in case of open stomata are given and the value of
S = (La + Ls)La-1
is placed along the vertical axis. The two lines represent the relation between these two values for windvelocities of 1 and 2 m sec-1. Along the right hand side of the horizontal axis the ratio EzEw -l between the transpiration of a leaf and a wet filterpaper of the same shape and in the same condition is given. The relation between sand Ez Ew-1 is represented for temperatures of 15 and 25° C. If Ls increases from 0.2to 0.4 em, Ez Ew-1 decreases only from 0.6 to 0.43 (u0 = 2m sec-1; ta = 25°C).
1.1.3. Effects of morphological differences
There are large differences between plants as to number and size of stomata. Consequently~ the transpiration of two leaves of different species under the same conditions is usually not the same. Differences between plant species can_be taken for granted in this paper. The influence of morphological differences between leaves of the same plant species, but grown under different circumstances is of more importance here.
The size of leaves, grown under good and poor conditions may differ considerably, but it is already shown in 1.1.1. that such a difference does not appreciably affect the evaporation per unit of surface. The reflection coefficient of leaves is around 15 percent (MET. TABLES, 1951) and is not affected to a large extent by growing condit_ions, as long as the leaves are green. The transmission coefficient ofleaves is equal to exp (-ex) in which the constant C depends on the composition of the leaf and X is the thickness of the leaf. As the transmission coefficient is. in general below 0.20, considerable differences in thickness and composition caused by different growing c0nditions are of minor importance, as far as the absorption of radiation·and the resulting transpiration is concerned.
MA(GMOV (1929) and MILLER (1938) summarized studies on the morphology of leaves grown under poor and good conditions. Under poor growing <?6nditions, the epidermis cells, stomata and guard cells and, therefore, stomatal apertures were found to be smaller than under good ·growing conditions. However, the number of stomata per unit of surface was higher, because roughly the ·same portion of epidermis cells were stomatal cells. This is illustrated. in ·figure 2. Hence, the total area of the apertures per cm2 does not depend to a large extent on the 'development of the leaves and relative differences in
Ls = l(no)-1
· are smaller than relative differences in size and number' of stomata. Moreover, the influence of L.1. on transpiration is relatively small (figure 1 ).
The effect of differences in the development between leaves of the same plant species on the tra.nspiration rate per unit s11rface is therefore much smaller than

13
F1<1. 2. Lower epidermis of a leaf of a bean plant, grown in moister (A 1) and in,drier soil (A 2) and of a sunftO\ver plant, continuously supplied with water (Bd and repeatedly subjected to wilting 182). (MAXIMOY, 1929).
morphological differences would suggest. In this paper, it is in first instance supposed that this effect is negligible, although it is recognized that this is not necessarily true under extreme conditions. Of course, transpiration rates per unit of surface can be approximately the same, only, if the leaves are exposed in the same environment, the stomata are open, and water is not limiting.
1.1.4. Transpiration of crop swfaces and plants
PENMAN (1956) showed that the transpiration of a field crop not short of water and shading the soil completely, may be estimated with an equation, in form the same as equation 1.8. It is, however, difficult to obtain reasonable estimates for the stomatal factor - s - and the heat exchange coefficient - hw - under these conditions and therefore it is more convenient to follow PENMAN's ( 1948) original suggestion for the time being. Which is to estimate the transpiration - Er -- of a short green plant cover, completely shading the soil of sufficient horizontal extension and never short of water with the equation:
1.10
in which f is an experimental conversion factor and E0 the evaporation of a free water surface. Er is known as the "potential transpiration".
The evaporation of a free water surface is estimated with the following equation:
E(i ~,_ --~~-~~ ~-~- (Ho(n) + ho(ra- fd)\ (j--r-y)V f 1.11
in which H 0 <n) is the net gain of radiation energy and h0 the heat exchange coefficient of the water surface; Ia and td are temperature and dew point temperature on

E Lys1meter
mm ""daY
14
FIG. 3. The relation between monthly potential transpiration - E - as ' measured by means of lysimeters and the factor Ll (Ll + y)-1H both expressed in mm day- 1 (MAKKINK, 1957).
standard screen or weather shelter height. The relation between h0 and wind velocity on standard height and the equations necessary to calculate H 0 <n> are tentative. Nevertheless estimates obtained with formula 1.11 are reasonable, if weather data averaged over one week or more are used.
In equation 1.10, E0 is the evaporation rate which would occur if there were a layer of water instead of a crop and if temperature and dewpoint of the air and wind velocity were the same. According to PENMAN (1948, 1956b) the value ofjis about 0.8 for a short green grasscover of sufficient horizontal extension, shading the soil completely, and never short of water.
According to MAKKINK (1957), the value ofjis, averaged over the season in Holland about the same as in England. MAKKINK showed also that the second term h0 (t0 - fd)
in equation l.ll is positively correlated with the first term H 0 <n> and that for this reason equation 1.11 may be simplified into
L1 E0 = 1.01-A- H- 0.50
LJ + y 1.12
and equation 1.10 and 1.11 into
ET = 0.61 _L1_ H- 0.12 L1 + y
1.13
in which all values are expressed in mm day-1 and H is the short wave radiation received at the earth's surface. The numerical constants in this relation must depend to some extent on climate. In figure 3 it is shown that there is a close agreement between actual transpiration and the factor L1 (L1 + y)-1 H.
At first PENMAN restricted the value of 0.8 for fto short green grass covers, but later on PENMAN (1956a) applied the same conversion factor to whole water sheds with widely varying vegetation. BERNARD's treatment (1956) suggests that transpiration of vegetative surfaces may be appreciable higher because:
a. Considerable heat and vapour exchange may take place due to advection (i.e. exchange caused by heterogeneousness in horizontal a direction). This may occur on fields which are not of "sufficient horizontal extension".
b. The heat and vapour exchange coefficients ofnorma1 field crops may be considerably higher than of a free water surface or a short grass cover.

mrn
a
.~
I \ ,-, '-!. ' ,\ / \
'""- /---- \ \ -r "\ \ I / \"- \
I / \' \ I ""\... I / ,,
/ ..' .1 Jlt
I
15
____ __L__.l_ __ j __ _j__ J A A s
mm
~--
1 I I ___ .J
.-----, b : : I I I I I I
--.J I
A
I I I I I I I I
I I I I I I I I
'----
s
f--H;. 4a. Free water evaporation (----·) and transpiration of young grassland (-- -), oats ( ·- . ---. -) and potatoes (------). The values which are six weeks running averages, are obtained from WIND (1954), except for free water evaporation.
Ftti. 4b. Free water evaporation ( -·--) and transpiration (-- -) of a corn field. Free water evaporation is estimated by multiplying the evaporation from a class A evaporation pan with the customary factor 0. 70 (RussEL and DANII:LSON, 1956).
c. The surface temperature of field crops may be lower than of a short grass cover, and as a consequence lower black radtation losses and higher net radiation gains.
The physical phenomena involved are so complex that physicists have not succeeded in evaluating these effects quantitatively.
The results of two experiments in which transpiration was larger than E0 are given in figure 4. The first experiment (WIND, 1954a) concerns plots of 4 X 5 meters which bordered each other and were surrounded by grassland. The second experiment (RussEL and DA!'o:IELSON, 1956) concerns a small plot of corn which was surrounded by a large field with corn. Other experiments in which the transpiration was much larger than E0 will be discussed in the third part of this paper.
Rough estimates lead to the conclusion that transpiration may range from 0.8 to 1.2 times Eo for fields of "sufficient horizontal extension". Much higher values are unlikely to occur, because the energy to vaporize the water is not available. On smaller plots the transpiration depends on the size of the field and may be considerable higher than 1.2 E0 . Fields with a diameter of a kilometer in arid climates may be still so small that a considerable amount of heat is obtained by advection.
To avoid any misunderstanding it is emphasized that in spite of objections which may be raised, PENMAN's approach is one of the most important achievements in this field. His method of estimating potential transpiration has more general applicability than the methods of THORNTHWAITE (1948) and BLANEY and CRIDDLE (1950), which are based on correlations between transpiration, temperature and daylength (compare

16
F1o. 5. The relation between the transpiration of a container with alfalfa, and the evaporation of a free water surface - Eo -, calculated with PENMAN's formula (DE VRIES and VANDUYN, 1953).
VAN WuK and DE VRIES, 1954 and WESSEL!NG, 1957). These latter methods, which are not discussed here, are perhaps only applicable in the West of U.S.A.
The transpiration of a single plant is also proportional to the evaporation from a free \Vater surface, provided that water is not limiting. This is proved by DE VRIES and VAN DUIN ( 1953), who studied some of BRIGGS and SHANTZ' data on the transpiration of alfalfa plants in a container. The results of some calculations and measurements are summarized in figure 5. ·
The transpiration of a plant cover not shading the soil for hundred percent, is lower than the maximum transpiration since some of the radiation falls on bare soil which is often dry. It is practically impossible to establisch a quantitative relation between the density of the plant cover and the transpiration because the heat exchange under such heterogeneous conditions can not be treated quantitatively. On the other hand, it is obvious that the transpiration of such an incomplete plant cover which is well supplied with water is proportional to the evaporation of a free water surface, because the transpiration rates of single plants and of complete plant covers are both proportional to this value.
1.1.5. Water shortage
In the preceding sections it is supposed that water is not limiting and that stomatal closure does not interfere with water movement. In case of water shortage, low light intensity, or other special conditions, the stomata may be partly or completely closed. Under this condition L8 and s are large and Ez (eq. 1.8) is low.
Stomata are provided with a very complex regulating mechanism and it is not possible at present to predict to what extent stomata are closed. Hence, transpiration of a leaf, plant or crop suffering from water shortage can not be estimated quantitatively.

17
+ L---t---f i I/1
I /~I 10~ I : r 0~---f--------
FIG. 6. The relation between apparent C0 2
assimilation and light intensity in foot candles from MAZDA 300 Watt reflector flood lamps. The curve is the average for leaves of casterbean, sunflower, soybean, tomato, tobacco, cotton, and bean. The individual observations for these crops are within the region marked by the vertical lines through the averages of the observations (BoHN1G and BURNSIDE, 1956). The assimilation curves for leaves of non-agricultural plants (mainly shade plants) are different and not reproduced here.
1. 2. ASSIMILATION OF LEAVES, PLANTS AND CROPS
1.2.1. Assimilation and light intensity
The relation between assimilation and light intensity is given in figure 6 for leaves of several agricultural and horticultural crops (BOHNIG and BURNSIDE, 1956). The apparent or net assimilation in g C02 m-2 hc-1 is given along the vertical axis. The apparent or net assimilation is the excess of photosynthesis over respiration. These measurements were -except for light intensity - made under the same conditions. The C02 concentration of
Ass g C 0 2 m2 hour
3,0
.. i
. . . t . • . k
the air was normal (0.03 percent). The light 2•0 \ •• • • ·u . ... . .
• I • •-o-4-1~-intensity along the horizontal axis is given in foot candles from Mazda 300 Watt reflector flood lamps. One thousand of these foot can-dles is roughly equivalent to a radiation intensity from the sun rays of 0.15 cal cm-2 min-1, infra-red radiation included.
Below a light intensity of 2500 foot candles the assimilation increases with increasing light intensity. Above this light intensity assimilation is about 2.0 g C02 m-2 hr-1. The light saturation value is, therefore, about 2500 foot candles. The curves for the leaves of various agricultural and horticultural crops are strikingly similar.
.. l .. ----a---·-:·-- • •· • I oi 8 • • : • • 1-
~:r · .;. ;.=·~_ ·;: : • ia i ,· .. I . ~· . . , ...
·.l'. ·;· .. I :
0
. . 12
103 f t candles
FIG. 7. Apparent assimilation of corn leaves (year 1940) and sun light intensity in foot candles (VERDUYN and LOOMIS, 1944).

0 co, plot 80 min 40
~0 ...
8 1.2
18
1.6
I 27
0 col cm2 min.
FIG. 8. Midday apparent assimila· tion for a field of alfalfa at different light intensities and temperatures (numbers near observations are °C) for full grown crops. The data for the fifth cut are not given, because leaf mass at time of measurements was much lower than with the first to fourth cut (THOMAS and HILL, 1950).
The assimilation of different corn leaves under field conditions in day light and at normal C02 concentrations of the air, is given in figure 7 (VERDUYN and LooMis, 1944). In this case the scattering of the observations is considerable. Apart from experimental errors, this may be due to differences in nutrient and moisture conditions, age and temperature of the leaves and so on.
Experiments concerning the effect of these ecological factors on assimilation were summarized by THOMAS (1955). It is evident from his work that a detailed and
9 C02
plot 64 min
25
20
1S
10
col 16
cm2min
1.0
0.8
0.4
FIO. 9. Diurnal net assimilation of C02 by three similar plots of alfalfa, measured on a cloudless day, a cloudy day and a day with intermittent clouds. The light intensities are given below the assimilation curves (THOMAS and HILL, 1950).
19
Growth stages
~ Entering Boot Heading Flowering
boot out Milk Dough
120
c
2
;···' .<' N··?\ i\~ .. ,1\l\ \ /\-•C2 •/C1• \ C1 N•-~ _!:1 \ N•·\ N
c 2 '\.c1 80 C I ' •\/•c2 c2•, •C 2
• c'l \ c 1
40 " ,(\i\ C2 •
Cl
June July
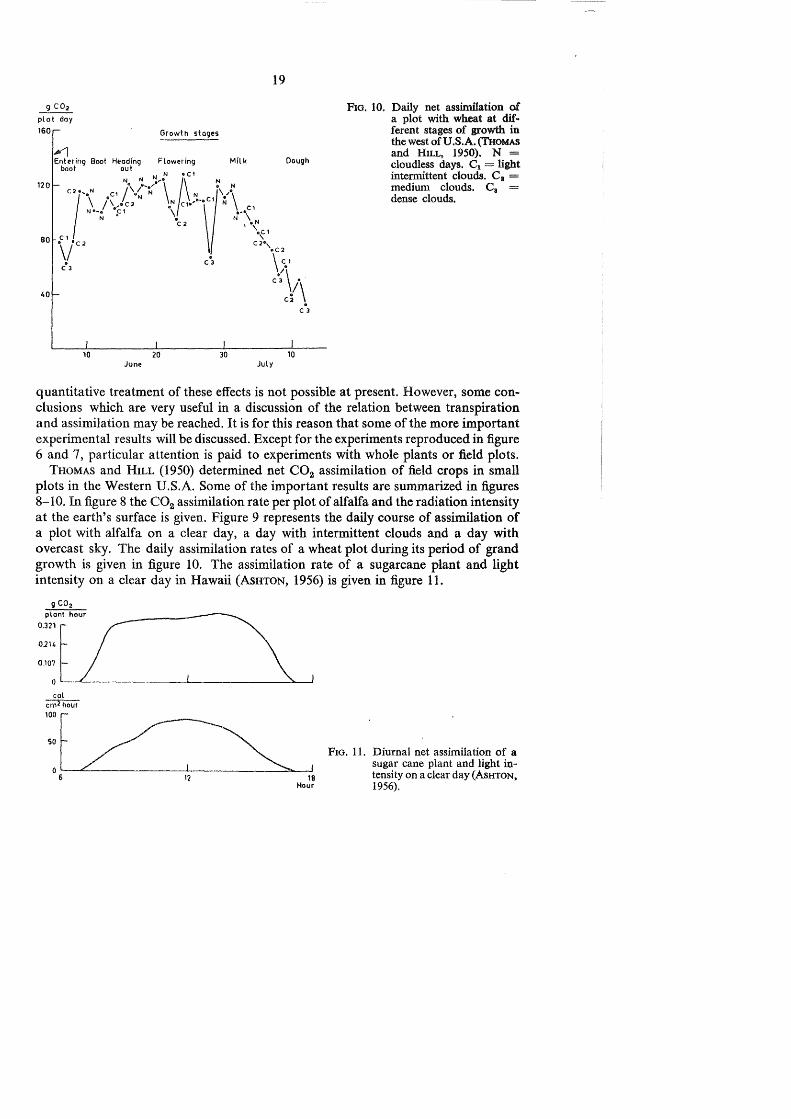
FIG. 10. Daily net assinillation of a plot with wheat at different stages of growth in the west of U.S.A. (THOMAS and HILL, 1950). N = cloudless days. C1 = light intermittent clouds. C 1 = medium clouds. C8 = dense clouds.
quantitative treatment of these effects is not possible at present. However, some conclusions which are very useful in a discussion of the relation between transpiration and assimilation may be reached. It is for this reason that some of the more important experimental results will be discussed. Except for the experiments reproduced in figure 6 and 7, particular attention is paid to experiments with whole plants or field plots.
THOMAS and HILL (1950) determined net C02 assimilation of field crops in small plots in the Western U.S.A. Some of the important results are summarized in figures 8-10. In figure 8 the C02 assimilation rate per plot of alfalfa and the radiation intensity at the earth's surface is given. Figure 9 represents the daily course of assimilation of a plot with alfalfa on a clear day, a day with intermittent clouds and a day with overcast sky. The daily assimilation rates of a wheat plot during its period of grand growth is given in figure 10. The assimilation rate of a sugarcane plant and light intensity on a clear day in Hawaii (AsHTON, 1956) is given in figure 11.
cal Criii hour
FIG. 11. Diurnal net assimilation of a sugar cane plant and light intensity on a clear day (AsHTON, 1956).

NAR 9 dm2 wuk
l,O
0,4
0,2
D J F M A M
20
Fxo. 12. NAR (= net assimilation rate) of wheat (w), barley (b), potatoes (p) and sugar beet (s) in different months of the year in England (WATSON, 1947).
Especially in England, NAR ( = net assimilation rate) of plants and field crops has been determined. This NAR is the amount of dry matter produced per unit of time and leaf surface by a plant or field crop. It is calculated by dividing the difference in dry matter weights at two successive harvests by the average leaf surface and the time between these two harvests. TheNAR in g dm-2 week-1 of four plant species throughout the year is given in figure 12 (WATSON, 1947).
The experimental results sugg~st that:
1. The assimilation rate of field plots on a clear day is closely related to the light intensity on an horizontal surface (figure 9) whereas, the assimilation rate of single plants on clear days is almost constant during a large period of the day (figure 11).
2. The saturation light intensities for field crops and for single plants are appreciable higher than for single leaves (figure 6, 7, 8 and 11).
3. The assimilation rate of crops on days with overcast skies depends to a large extent on light intensity (figure 9 and 10).
4. The daily assimilation by a field of wheat in the midwest of U.S.A. (where bright skies prevail) is almost the same from booting to milk stage (figure 10).
5. NAR in England (where overcast skies prevail) is low in spring and autumn and at a maximum around the longest day (figure 12).
These differences between the assimilation rate curves of individual plants, field plots, and single leaves will be explained in section 1.2.6.
1.2.2. The effect of temperature
The photosynthesis of leaves at low light intensities and normal temperatures is limited by the light intensity, and the light reaction of photosynthesis is known to be more or less independent of temperature (compare RABINOWITCH, 1951 and other handbo~ks). At high light intensities but at normal C02 concentration of the air (around 0.03 percent) and normal temperatures, the photosynthesis is supposed to

21
be limited by the C02 diffusion rate from the surroundings towards the place where the photosynthetic light reaction takes place (THOMAS, 1955). As diffusion rates are more or less proportional with absolute temperatures, the effect of temperature should also be small under these conditions. The small effect of temperature under normal conditions is illustrated in figure 8 and in table 2.
TABLE 2. The effect of temperature on photosynthesis of a plot with alfalfa (THOMAS and HILL, 1950)
Date(l947)
August .. August .. September September September
I
I i I I
Location
Outlet Outlet Outlet
Above plants Outlet
I
I
Average air temperature
PlotD-4 oc
28.0 29.0 23.0 27.0 23.2
I
I I I
Plot D-2 oc
21.5 26.8 16.4 21.6 20.0
I
I I
I I I
Difference oc
6.5 2.2 6.6 5.4 3.2
I
Photosynthesis
Ratio D-4/D-2
0.97 1.02 0.92 0.94 1.00
On the other hand, respiration rates increase almost exponentially with increasing temperatures up to a maximum with is not reached at the same temperature for different plant species (compare LUNDEGARDH, 1954).
As a consequence, the effect of temperature on net assimilation (this is the difference between photosynthesis and respiration) depends at normal temperatures mainly on the relative magnitude of these two processes: If respiration is large compared with photosynthesis, the temperature effect is large, and the reverse.
At a temperature of 15 to 25°C, respiration of potato leaves (LUNDEGARDH, 1954) varies from 0.1 - 0.2 g C02 m-2 hour-1, whereas photosynthesis at normal light intensities is around 2.0 g C02 m-2 hour-1. Accounting for night respiration the ratio between respiration and photosynthesis should be around 0.3/2.0 = 0,15, which is in agreement with THOMAS' (1955) opinion that this ratio varies in general from 0.10-0.20.
Agricultural crops are in general grown under conditions where net assimilation rates are high. This implies that, unless temperature differences are very marked, the effect of temperature on net assimilation rate is small. Marked temperature differences in this respect may be differences between night and day temperature, between temperatures on bright and cloudy days and between temperatures in different seasons and climatic regions. As for plants grown in the same season, in the same climatic region, but in different years, the effect of temperature on I?-et assimilation should be small, because temperatures averaged over the whole growing period vary in general only within a range of around 5° C.
1.2.3. The age of the leaves
SINGH and LAL ( 1935) determined C02 assimilation ofleaves of different ages. They found that the assimilation rate depends to a large extent on leaf and plant age.
The experiments were carried out in an atmosphere with 0.35 percent C02, which makes it doubtful whether C02 diffusion rate or light intensity was limiting. Besides

22
some determinations were made with C02 ccmcentrations of 0.06 percent. In this condition the apparent assimilation of sugarcane leaves with an age of 37, I 15 and 220 days was 1.2, 1.4 and 1.8 mg C02 (surface and time unit not specified), respectively.
HEINICKE and HOFFMAN (1933) determined the C02 assimilation of a single apple leaf during many days in July, August and September. The assimilation rates averaged over periods of ten days are given in table 3. To eliminate the efiect of light intensity, only days, with 75 percent or more direct sunlight are included. Apparent assimilation did not depend much on the age of the leaf, except perhaps early and late in the season.
TABLE 3. The assimilation of an apple leaf (number 0.19), averaged over periods of ten days. To eliminate as far as possible the effect of light intensity, days with only 75 percent or more bright sunshine are included. (HEINICKE and HoFFMAN, 1933).
Average assimilation Period Number of days used
mg C0 2 hcl (100cm 2)-l to obtain the average
9.4 July I 3 13.9 II 5 15.7 III 3 16.1 Aug. I 3 14.3 II 4 14.7 III 8 12.3 Sept. I 7 10.5 II 4 14.6 III 3 8.3 Okt. I 2
WATSON (1952), who determined the effect of age on NAR (see page 20), concluded that the age of the plant is of minor importance, except during senescence. Since only apparent assimilation rates integrated over a whole life period of leaf or plant will be considered in this paper, the possible effect of age on assimilation can be
. neglected. Periods of senescence are exempted.
1.2.4. Mineral nutrition
Recently, VANDER PAAUW (1956) summarized expedments on the influence of the nutrient status of plant and leaf on the assimilation rate per unit leaf area. The conclusions arrived at are:
l. Under many conditions the effect of nutrient status on assimilation rate is small. 2. In case deficiencies occur the assimilation rate is often unfavourable affected.
These conclusions are in complete agreement with WATSON's (1952) conclusions on the effect of fertility of the soil on NAR. He summarizes as follows:
1. Under normal conditions NAR depends slightly or not at all on the fertility of the soil.
2. At low mineral nutrient levels in the plants the assimilation rate may be adversely affected.

23
Both authors do not define "low" and "normal" mineral nutrient levels. A survey of the relevant literature (compare also THOMAS, 1955) showed that there are too few experiments available to obtain quantitative information on this.
The tentative conclusion is justified that there is a "minimum nutrient level in the plant" above which assimilation rate is independent fertility and below which assimilation rate and fertility are positively correlated. The term "n1inimum nutrient level in the plant" cannot be defined properly at present, but there are indications that this level is fairly low.
1.2.5. Water shortage
At saturation light intensity, C02 assimilation appears to be limited by the diffusion rate from the surroundings towards the place the light reaction takes (see 1.2.2.).
Substituting in equation 1.4, 1.6 g C02 m-2 hr-1 (figure 7) for the diffusion rate, 0.14 cm2 sec-1 for the diffusion coefficient of C02 in air, 3.1()-•1 cm3 C02
(cm3 air)-1 for the concentration of C02 outside the leaf and zero for the concentration at the place where the light reaction takes place, a value 'of about 2 em is for the equivalent diffusion length of C02• The total diffusion of water including the diffusion length in the stomata, was about 0.5 em.
Therefore, the greater part of the resistance against diffusion is made the resistance in the leaf tissue between the walls of the stomatal chambers the place of the light reaction. As a consequence the C02 diffusion rate is only controlled by stomatal aperture, if the stomata are nearly closed.
As, on the other hand, assimilation rates appear to decrease considerably with increasing deficiency of water (THOMAS, 1955), it is likely that under conditions of water shortage assimilation is controlled by other reactions than the C02 diffusion rate. It is impossible to treat the effect of water shortage on assimilation, since quantitatively almost nothing is known about these limiting reactions.
1.2.6. Assimilation of crop swfaces
1.2.6.1. A theoretical approach. For crop surfaces, the daily photosynthesis depends on the position of the leaves, the radiation intensity and the height of the sun. The daily net assimilation rate can hardly be calculated because it is very difficult to take limiting factors into account. If assimilation is not limited by factors as mineral level, water shortage, translocation of sugars and age, it may be possible to estimate the portion of the incoming radiation which is neither reflected, nor absorbed by leaves which are already saturated with light, as far as photosynthesis is concerned.
This portion of the incoming radiation is represented by the symbol R. Direct radiation from the sun, diffuse sky radiation measured at a horizontal surface and the sum of both are represented by the symbols H8 , Hd and H 9 respectively. R and II are either expressed in cal cm-2 min-1, or, where integrated over the whole day, in cal cm-2 day-1 . Numerical values are inclusive infra-red radiation. In order to obtain the photosynthetic rate of crop surfaces, the value of R is to be multiplied with the

24
slope of the light intensity versus photosynthetic rate curves for single leaves at low light intensities. The net assimilation rate of the crop surface is equal to this photosynthetic rate minus the respiration rate.
To simplify the calculations necessary to estimate R, the following assumptions are made.
a. There exists a saturation value - Hr - of the absorbed radiation intensity, measured perpendicular on the leaf surface. Below this value assimilation is supposed to be proportional to the absorbed radiation intensity. The proportionality factor estimated from the data of figure 6 is about 0.85.1Q-5 g CH20 cal-l. Above this saturation value, assimilation is supposed to be constant. In subsequent calculations it is assumes that Ilr = 0.25 cal cm-2 min-1 (compare figure 6 and 7).
b. The reflection coefficient - e - and the transmission coefficient - 7: - of the leaves are supposed to be independent of the position of the leaves with respect to the direction of the incoming radiation. In calculations it is assumed that e and 7:
are 0.1. These values are for visible radiation; as far as assimilation is concerned, transmission and reflection of infra-red radiation is of no importance.
c. It is assumed that there is no preference for any direction in arrangement of leaves. This assumption may be not far from the truth because of leaves fluttering due to wind action and the ever changing position of the sun.
d. The crop surface is supposed to be so dense that only a negligible amount of the radiation reaches the soil surface.
In first instance, it is also assumed that the diffuse sky radiation is absent. The leaves of the crop surface may be classified now in three groups. The first
group contains the leaves which are directly exposed to sun rays, but this under such an angle that the absorbed radiation intensity is above the saturation value. The second group contains the leaves which are directly exposed to the sun rays but this under such an angle that the absorbed radiation intensity is below the saturation value - Hr -. The third group cont:lins all leaves which are in the shade of other leaves. Since the maximum radiation intensity of the sun is about 1.6 cal cm-2 min-1, the transmission coefficient for (visible) radiation around 0.1 and Hr about 0.25 cal cm-2
min-1, none of these latter leaves is above saturation radiation intensity. The reflected radiation and the excess radiation absorbed by the leaves of group one, can not participate in assimilation.
Based on this classification in three groups, the following mathematical expression*) for R may be arrived at.
R, "" (1 - e) H, ( 1 - (I - -r) [ v' 1 - r"- r( ~ -bgsin r)] ) · 1.14
with r= Hr sin fJ
(1- e- r)llr;
*) No details on the mathematical treatment are given, because it is the intention to treat the subject of this section in more detail in another paper.

25
and {J the height of the sun above the horizon. The subscript s is added to R to iJ?.dicate that this formula concerns direct radiation only.
The intensity of the diffuse sky radiation appears to be below (1 + e + ·T) Hr = = 0.3 cal cm-2 min-1. Therefore, this diffuse radiation contributes, except for reflection, in full to assimilation in absence of direct radiation. The effect of direct radiation can be superimposed, therefore, on the effect of diffuse radiation, which results in the following expression:
R "" (I -e) ( Ha + H, [ 1 -(1- ~) (v'i - r2- I'(~- bg sin r) ]} 1.15
(Hr-~(1-e-r)Hd) sin{J r=
(1-e-r)Hs with
The fraction 2rc 1 ( 1 - e - r) H d accounts for the reduction of the effect of direct radiation, due to diffuse radiation; the factor 2rcl herein arises from the assumption that the diffuse radiation is evenly distributed over the part of the leaf surface, that may be seen from a vertical direction. This assumption is only approximately correct.
The radiation intensity of the sun on a perfectly clear day- He- (no clouds, no dust and only 10 mm precipitable water) at different heights of the sun is calculated and given in table 4. This is done with the aid of the tables 137 and 149 in METEOROLOGICAL
TABLES (1951). The index c of He indicates that these values hold only for days with perfect clear skies. The fractions H 8 and H d in the table were calculated by making use of table 819 in PHYSICAL TABLES (1956). Values of Re (c indicates again clear skies) calculated with llr = 0.25 cal cm-2 min-1 and e and r:, both, 0.1 are also given. In the last column it may be seen that the ratio ReHe-1 decreases with increasing height of the sun.
TABLE 4. Intensity of total- He-, direct- Hs- and diffuse- Hd- radiation on a perfect clear day at different heights of the sun ({J degrees) and the value of Rc, calculated with equation 1.15. Hand Rc in cal cm- 2 min-\ inclusive infrared radiation.
{30 He fls Hd Rc Rc H,-1
10 0.25 0.14 0.11 0.16 0.65 20 0.51 0.38 0.13 0.25 0.48 30 0.78 0.63 0.15 0.33 0.42 40 1.03 0.86 0.17 0.40 0.39 50 1.25 1.06 0.19 0.45 0.36 60 1.43 1.23 0.20 0.49 0.34 70 1.56 1.35 0.21 0.52 0.33 80 1.63 1.41 0.22 0.53 0.33 90 1.65 1.43 0.22 0.53 0.32
The height of the sun at different dates, latitudes and hours is given in table 170 of METEOROLOGICAL TABLES (1951). The daily course of {J, He and Rc on the 21st of June and at 30 degrees north latitude is given in figure 13. The assimilation curve on a clear day (figure 9) is of about the same shape as the curve for Rc, although the first

He
1.5
1.0
0,5
8 10 12 hour
26
14 16
80°
18
Fxo. 13. Values of He, Rc and f3 on a clear day at the 21st of June at 30° latitude.
is somewhat more flattened probably because of the boundary effect on the small experimental plots of THOMAS and HILL.
There is no maximum level beyond which Rc does not increase with increasing He. Inspection of formula 1.15 reveals that such a maximum can not exist because the portion of the leaves which is not in the shade of other leaves increases with increasing height of the sun. For single plants the portion of the leaves shaded by ot~r leaves depends to a much smaller extent on the height of the sun; so that for these the curve for Rc is of a form, similar to the assimilation curve in figure 11.
Daily totals of Rc and He may be obtained by integrating the curves in figure 13. A numerical integration of hourly values is carried out for several latitudes and dates. Daily values of He are given in figure 14 a and of Rc in figure 14b. The months for the northern hemisphere are given at the bottom and for the southern hemisphere
southern hemisphere southern hemisphere
J M A M F J J M F J c.. mfij09Xa,, A '222Yf/ffi 22 d
0 m!lfff/H"~ "!:>
600 r::::...!;3i~vZ2aZ2~~?:~h~%t:"~0=;A~~~~e::;=.:~ezza:litf?;iQ~lf~h~'2~2 ~~3'§
He _..aL cm 2 day
o uJwk"' A \ .,p';t> fs-L--J.,z~a-K-Ji ....... W..-Lf/-a-, -F -;;:--L---,.:-l---.A,..LR-a-fiM-)',-dr-c:-aa-J "b_J
northern hl!lmlsphere latitude northern hemlspherlfl
FIG. 14. Values of He (figure a) and R, (figure b) at different latitudes and dates. For details see text.

27
FIG. 15. The relation between HHc-1 and R~-1 • For details see text.
at the top of the diagrams. Latitudes are given along the vertical axis. Latitudes and dates with the same value of He (figure 14a) or Rc (figure 14b) are connected. The numbers in the curves are daily values expressed as cal cm-2 day-1. It is read for instance that He is about 800 cal cm-2 day-1 and Rc about 305 cal cm-2 day-1 on the 1Oth of May at 30 degrees north latitude. It should be kept in mind that these values hold for perfectly clear days; on normally clear days values of H may be about 10-15 percent lower because of presence of dust, water vapour and transparant clouds.
The sun is often partly or completely obscured by clouds. To account for this }t is supposed that, where total radiation His reduced to xHc (x smaller than one), Hd remains the same but direct radiation is reduced to H8 -(1- x)Hc. This is certainly not true with overcast skies but under these conditions r in equation 1.15 is close to one. It appears that, irrespective of date and latitude the relation between H and R both expressed as fractions of He and Rc, is reasonably well presented in figure 15.
R is calculated now as follows: In figure 14a it is read that He= 700 cal cm-2 min-1 on the 20th of March at 30° northern latitude. H Hc-1 is here 0.50, if, actually, His 350 cal cm-2 min-1. In figure 15 it is now read that RRc-1 = 0.84, so that with Rc = 260 cal cm-2 :min-1 (figure 14b), R appears to be 220 cal cm-2 min-1. Daily totals of Ron days with intermittent clouds, calculated in this way, are too high since R is less than proportional with H. As only average weather data are available it is impossible to avoid systematic errors of this kind. A rough estimate is that values of R calculated in this way are, at the utmost, 15 percent too high.
1.2.6.2. The valtJe of R in arid and temperate climates. The relation between Hand R at 30° northern latitude on different dates during the growing period is given in figure 16a. This relation appears to depend only slightly on the date. The lines with constant Rc in figure 14b between 20° and 40° northern latitude and during the summer months are wide apart and run partly parallel with the horizontal axis. The curves in figure 16a are therefore representative for these latitudes. Between 20° and 40°

28
R R b cal a col
cm 2 day cm2 day
22/6
2216: 1/5; 12/8 1/5. 12/8
)/4: 10/9
)/4: 10/9
400 800 400 800
FIG. 16. The relation between Hand Rat the dates given in the figures and at 30° (figure a) and 55° northern latitude (figure b). The meaning of the lines I is explained in the text.
latitude many arid climates are found where bright sunshine percentages are around 70. As a consequence, the values of R and H scatter around line I in figure 16a. Apparently, the value of R is approximately constant in these climates and this explains why THOMAS and HILL (op. cit.) who worked in the West of U.S.A. found that, except on a few cloudy days, daily assimilation rates were about the same during the summer months (compare figure 10).
A similar relation between H and R but now at 55° northern latitude is given in figure 16b. Here the relation depends to a large extent on the season. Around this latitude many temperate climates are found where bright sunshine percentages are around 35 and, as a consequence, the values of Hand R scatter around line I in figure 16b. Apparently the value of R depends here to a large extent on the value of H. This explains why in figure 12, NARis at a maximum around the 21st of June.
This striking difference between these arid and temperate climates will be met with in subsequent chapters. It is emphasized here that transitional climates exist. Transpiration and dry matter production in such climates are not discussed in this paper.
1.3. THE RATIO BETWEEN TRANSPIRATION AND ASSIMILATION
1.3.1. Radiation intensity
It was found that waterloss from leaves, plants, crop surfaces and a free water surface increases almost proportionally with increasing radiation intensity (section 1.1.2. and 1.1.4.). On the other hand assimilation was found to approach to a maximum (section 1.2.1. and 1.2.6.). This maximum depends on saturation radiation intensity and arrangement of the leaves. These relations are presented in a diagram (figure 17), which holds for leaves, plants and crop surfaces, since no numerical values are given along the axes. In this diagram, net assimilation rate - A - and transpiration rate - E - are given along the vertical axis and radiation intensity - H - or free water evaporation - E0 - along the horizontal axis. The quotient EA-1 is also in the diagram.

Fio. 17. The relation between net assimilation - A -. transpiration - E - and the ratio EA-1 for leaves or plants on one hand, and radiation - H - or free water evaporation - Eo - on the other.
29
A;E; E/A
At high radiation intensities EA-1 is more or less proportional with radiation intensity or free water evaporation, at lower radiation intensities this quotient is almost constant and at very low intensities EA-1 increases again. Under this latter condition, net assimilation is negligible or negative, and transpiration, although small, anyhow positive.
It is evjdent (see 1.2.6.2.) that in arid regions between 20 and 40° latitude, the quotient EA-1 is more or less proportional with radiation or free water evaporation, whereas in temperate climates this quotient will be more or less constant. As assimilation and transpiration may be affected by temperature, availability of water and the portion of leaves which are in shade of the others, it is necessary to study the effect of those factors on the quotient EA-1.
1.3.2. JreflnJ7erature
Net assimilation and transpiration are both affected by temperature, but not to the same extent. The ratio of both is therefore also affected by temperature. However, temperature effects are not large, except when respiration is large compared with photosynthesis (compare 1.1.2. and 1.2.2.). These effects may be negligible even, when the ratio EA-1 is compared for plants, grown in the same climatic region, in the same season, but in different years.
1.3.3. Water shortage
The effect of water shortage on assimilation and transpiration could not be evaluated. However, in this chapter it is only necessary to be informed on the effect of availability of water on the ratio EA-1 and not on the absolute values of assimilation and transpiration.
Direct information on the effect of drought on the value of this ratio is obtained from experiments where, both, transpiration and assimilation are measured for plants and leaves subjected to drought.

30
12 14 22 Apr1l
F1o. 18. The influence of soil-moisture on photosynthesis and transpiration of apple leaves expressed in percentages of the values for leaves not subjected to drought. The test tree was last given water on April 1; first wilting occurred on April 10, and soil was watered again on April 16 (ScHNEIDER and CmLDERS, 1941).
Such an experiment was carried out by ScHNEIDER and CHILDERS (1941) on leaves of an apple tree growing in a room with constant temperature and constant light. The C02 concentration of the air was normal. The results are summarized in figure 18.
Assimilation and transpiration of the leaves of the tree subjected to drought are expressed as percentages of assimilation and transpiration of the leaves of a tree under normal moisture conditions. Details concerning watering may be found in the caption of the figure. Even before wilting was noticed, transpiration and assimilation were to 50 percent of normal. On the day before watering both were about 10 percent of normal; six days after watering both were again 100 percent.
LousTALOT (1945) measured assimilation and transpiration of leaves of pecan seedlings subjected to drought. The seedlings were grown in pots under normal conditions. His results are summarized in figure 19; details may be found in the captions to the figure. Assimilation and transpiration are again much lower for plants subjected to drought, especially during the afternoon. In the July experiment of figure 19b, photosynthesis did not recover completely after restoring normal moisture conditions. Although it is possible that these leaves were damaged, it may be that assimilation of a leaf is not the same after a period of drought as before.
To investigate possible ,drought conditioning", AsHTON (1956) compared the assimilation of a sugarcane plant subjected to five successive drying cycles with the assimilation of a plant of the same size under normal conditions. The results are given in figure 20. During the periods in which the soil was dry, assimilation was much lower than during normal conditions. The depression of assimilation due to drought is smaller in each following cycle. This is according to AsHTON a result of adaption to drought conditions. Of more importance is the observation that the assimilation was the same before and after five drying cycles during the periods in which the water supply was normal.
STOCKER (1956) has summarized German literature. From his own observations STOCKER concluded that the assimilation of drought conditioned leaves, after restoring normal conditions, is not much different from those not subjected to drought.

31 .,. ,or Figure a: Plants grown in
loamy soil. ~~ .... ,.............., ..... _, -:......t~· •cliaek-I'Oil
li!IOrought 1101l 20
so
c
•An aTronsp.
0 A1111.
a Tronllip.
0~----~----~------------------L-------~-------August Soptembar 23 October .,.
Figure b: Plants grown in sand. 6~~~
:~w.P.~ •Chock sond
•Drought sand
so •A111
oTronsp.
18 24 15 July August Sopt.
FIG. 19. Effect of drought on photosynthesis and transpiration of leaves of pecan seedlings expressed in percentages of the values for leaves of seedlings not subjected to drought. A : moisture percentage of soil; B : afternoon determinations; C : morning determinations.
(LoUSTALOT, 1945).
FIG, 20. The net assimilation of a sugar cane plant subjected to drought in percentages of the value for a plant under optimum moisture conditions. A : percent of full net assimilation. B : percentage moisture in soil. WP : permanent wilting point (AsHTON, 1956).
0/o 055
·:n--;:---f-r---y--r--T -~----r-~: r _v_~jj__ __ IJ_, __ 'J_-~_IL: 0~--------~---------L---------J---
:t>c{\(\rv ·w~ 20 60
days
50·
A
% 100ft?~== ......
50
8
August
32
S&ptember 23 'October
FIG. 21. Effect of flooding . on .photosynthesis and transpiration of leaves of pecan soodlings, expressed in percentages of the values for plants not flooded. Sept. 3 : excess water added, Sept. 23 : excess water removed. A: afternoon determinations. B : morning determinations (LouSTALOT, 1945).
SIMONIS (STOCKER, 1956) found, however, that the assimilation of drought conditioned leaves may be about 10 percent higher than of normal leaves. SIMONIS' measurements were done in air with a C02 content of 0.96 percent so that the practical importance of his results may be doubted.
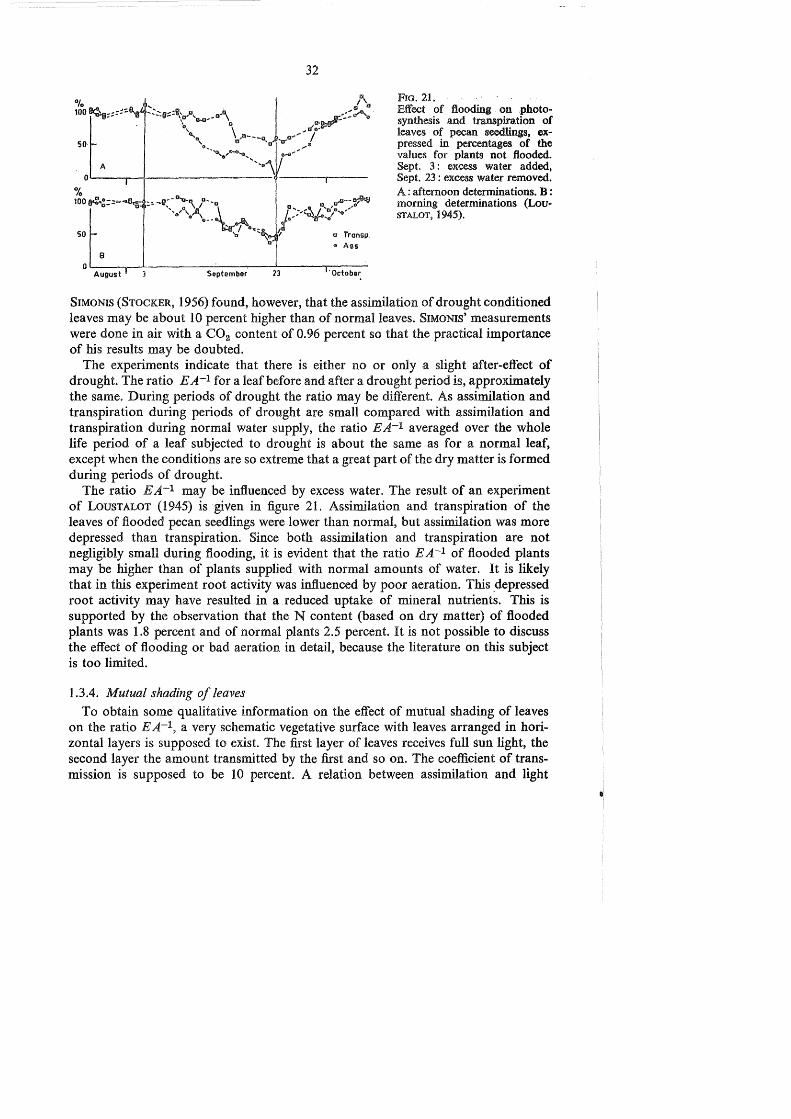
The experiments indicate that there is either no or only a slight after-effect of drought. The ratio EA-1 for a leaf before and after a drought period is, approximately the same. During periods of drought the ratio may be different. As assimilation and transpiration during periods of drought are small compared with assimilation and transpiration during normal water supply, the ratio EA-l averaged over the whole life period of a leaf subjected to drought is about the same as for a normal leaf, except when the conditions are so extreme that a great part of the dry matter is formed during periods of drought.
The ratio EA-1 may be influenced by excess water. The result of an experiment of LousTALOT (1945) is given in figure 21. Assimilation and transpiration of the leaves of flooded pecan seedlings were lower than normal, but assimilation was more depressed than transpiration. Since both assimilation and transpiration are not negligibly small during flooding, it is evident that the ratio EA-1 of flooded plants may be higher than of plants supplied with normal amounts of water. It is likely that in this experiment root activity was influenced by poor aeration. This _depressed root activity may have resulted in a reduced uptake of mineral nutrients. This is supported by the observation that the N content (based on dry matter) of flooded plants was 1.8 percent and of normal plants 2.5 percent. It is not possible to discuss the effect of flooding or bad aeration in detail, because the literature on this subject is too limited.
1.3.4. Mutual shading of leaves
To obtain some qualitative information on the effect of mutual shading of leaves on the ratio EA-1, a very schematic vegetative surface with leaves arranged in horizontal layers is supposed to exist. The first layer of leaves receives full sun light, the second layer the amount transmitted by the first and so on. The coefficient of transmission is supposed to be 10 percent. A relation between assimilation and light

33
intensity for corn leaves is given by the average line in figure 7. The respiration rate of each layer is supposed to be 10 percent of the assimilation rate at saturation light intensity. This is of course a very arbitrary assumption. The intensity of the light falling on the first layer may be 1 cal cm-2 min -1 on a clear day at noon.
In these conditions the net assimilation rate of the first layer is (compare figure 7) about (2.0-0.2) to-6 g dry matter cm-2 min-1, of the second layer, receiving 0.1 cal cm-2 min-1, (0.5--0.2) lQ-6 and of the third layer, receiving a negligible amount of light, (0--0.2) IQ-6 g dry matter cm-2 min-1.
The transpiration rate is roughly proportional to the light intensity; 6.1 o-4 g water cm-2 min-1 is a reasonable value for the first layer in full light. This value is found by substituting average values in equation 1.8 (section 1.1.2.). The transpiration rate of the second layer is about 10 percent of the first or 0.6 lQ-4 g water cm-2 min-1 and the transpiration rate of the third layer is negligible. The values of E and A and of the ratio EA-1 for the first, second and third layer separately and combined are given in table 5.
TABLE 5. Values of A, E and the ratio EA-1 for subsequent leaf layers. For details see text.
A E EA-1
Layer g dry matter gwater gwater cmz min cm2 min g dry matter
1 1.8 to-e 6 10-4 334 2 0.3 1Q-6 0.6 10-4 200 3 -0.2 w-• negl. negative 1 + 2 2.1 w-e 6.6 10-4 314 1+2+3 1.9 to-a 6.6 10-4 348
The differences between the ratios of the three layers are very large. Differences between the first, the first plus second, and the first plus second plus third layer are much smaller because leaves in the shade of other leaves contribute small amounts to assimilation and transpiration. This treatment suggests that the ratio EA-1 is hardly affected by leaf density unless there are many leaves in the shade of other leaves. This is of course a very schematic example. For instance, in the field first, second an third layers can not be distinguished because of the haphazard positions of the leaves and leaf flutter due to wind. However, since large differences between assimilation and transpiration of leaves in the light and in the shade exist also in more complicated cases, the information obtained from this schematic example may be useful.
1.3.5. The horizontal extension of the crop swface
In the foregoing section it was shown that the occurrence of mutual shading can not effect the ratio EA-1 to a large extent. This does not imply that this ratio is the same for a plant not surrounded by other plants as compared with a plant in the middle of a large vegetative surface.
The ratio EA-1 in the second case must be lower than in the first because the
34
presence of many other plants results in a lower wind velocity, a lower temperature and a lower vapour pressure deficit of the air surrounding the plant (compare section 1.1.2.).
The quantitative effect of the size of the vegetative surface on the ratio EA-1 can not be estimated at this stage. The difficulties met with are the same as in section 1.1.4. In that section it was impossible to describe quantitatively the conditions under which transpiration of a field crop is considerable larger than free water evaporation.
1.4. SUMMARY
The transpiration of leav~s, plants and plant covers which are well supplied with water is more or less proportional with the evaporation of a free water surface. This evaporation is again proportional to the radiation intensity received at the earth's surface.
In temperate climates around 55° N.L. with a small percentage of bright sunshine, photosynthesis of a crop surface appears to be positively correlated with the daily total radiation. Such a positive correlation does not exist in arid climates around 30° N.L. with a large percentage of bright sunshine.
The resulting relation between radiation intensity - H - or free water evaporation - E0 -and the ratio EA-1 between transpiration - E - and assimilation - A - is given in figure 17. At the righthand side of the diagram the ratio EA-1 is more or less proportional with free water evaporation; such a relation is to be expected in arid climates. In the middle of the diagram EA-1 is more or less independent of free water evaporation; this relation is to be expected in temperate climates. Possible effects of temperature, nutrient status of the plants, availability of water, mutual shading of leaves, and size of the field on the ratio EA-1 are discussed. It is to be expected that these effects are large only under extreme conditions.

2. TRANSPIRATION AND PRODUCTION OF PLANTS IN CONTAINERS
2.0. INTRODUCTION
Knowledge about assimilation and transpiration rate of leaf surfaces does not make it possible to predict transpiration and production during the whole growing period of a plant, because it is impossible to account for the development of the leaf surface, the effect of mutual shading9 water shortage etc. It has been found that the ratio between transpiration and assimilation is little affected by these factors. It is therefore logical to suppose that this is also the case for the ratio between total transpiration and total dry matter production during the growing period. It is, therefore, worthwhile to study the results of experiments carried out to determine the transpiration ratio of plants.
This transpiration ratio (also water requirement or transpiration coefficient) is the quotient of the transpired amount of water during growth and dry weight of plants at the time of harvest. It is determined for plants grown in containers. To avoid work, the amount of dry matter accumulated below the soil surface is in general not included, except for dry matter in reserve organs of plants like sugar beets and potatoes. The transpired amount of water is determined by frequent weighing and adding known quantities of water. BRIGGS and SHANTZ (1913) showed that, unless proper precautions are taken, direct evaporation from the soil surface can be considerably. MASCHHAUPT
( 1938) who summarized the results of many experiments showed that direct evaporation from sealed containers can be neglected, and also that containers covered with small pebbles or similar material can be corrected for soil surface water loss by means of control containers without plants. In this latter case it is necessary to avoid excessive
. entrance of water from rain by placing the containers under cover during showers, and to correct for possible entrance of rain by means of control containers.
Experiments in which direct evaporation is not prevented are useless, except perhaps where rainfall is small and the plants shade the soil surface of the containers completely. Therefore, no consideration is given here to the well known experiments of HELLRIEGEL, VON SEELHORST, WOLLNY, WILFARTH, WIMMER and other German investigators, who did not take any measures to prevent direct evaporation (compare MASCHHAUPT, 1938).
Many experiments of reasonable quality are discussed in the following sections. In section 2.3. consideration is given to the effect of soil fertility, availability of water, age of the plant, and mutual shading on the relation between transpiration and total dry matter yield. A good evaluation of the influence of these factors appears to be possible only after a discussion of the effect of weather and climate on the transpiration ratio. It will be shown in section 2.3. that the effect of soil fertility and availability of water is of small importance, except under "extreme conditions". It is therefore possible to discuss the effect of weather and climate on the relation between transpiration and production in the sections 2.1. and 2.2., without taking in account other growing conditions~

36
Experiments in the Great Plains of the United States, where bright sunshine percentages are around 70, are discussed in section 2.1. Net assimilation appeared to be more or less independent of daily radiation in this climate (section 1.2.6.2.) so that some kind of proportionality is to be expected between transpiration ratio and free water evaporation (section 1.3.1.). Experiments in the Netherlands, where bright sunshine percentages are around 35, are discussed 'in section 2.2. In this· climate, net assimilation appeared to be positively correlated with daily radiation (section 1.2.6.2.). No proportionality is to be expected here between transpiration ratio and free water evaporation (section 1.3.1.).
2.1. TRANSPIRATION AND PRODUCTION IN ARID CLIMATES .
2.1.1. The classical experiments of BRIGGS, SHANTZ et. a/.
2.1.1.1. Experimental conditions. BRIGGS and SHANTZ (1913, 1914), SHANTZ and PIEMIESEL (1927) and DILLMAN (1931) determined transpiration and production of many plant species in Delhart (Texas), Akron (Colorado), Newell (South Dakota) and Mandan (North Dakota). Except for the kind of soil, the experiments were carried out in the same way. ·
Plants were grown in large galvanized iron containers, holding about 115 kg soil of reasonable fertility. The surface of the soil was sealed to prevent direct evaporation and the containers were placed on the soil surface and in a screened enclosure to protect the plants from birds, severe hail and high winds. Photographs of the experimental sites may be found in SHANTZ and PIEMIESEL's publication. The inclosure intercepted up to 20 percent of the radiation. Simultaneous measurements showed that plants grown in containers sunk in trenches, surrounded by a field of grain, had a transpiration ratio of 10 percent above wheat grown in the enclosure and of 3 percent below plants grown in a free wind swept position (BRIGGS and SHANTZ, 1914; SHANTZ and PIEMIESEL, 1927).
Meteorological measurements were made outside the screened enclosure. Records of the evaporation from an evaporation pan are the most important. This pan was six feet in diameter, two feet deep and sunk into the ground, with the water level at about the same height as the soil surface. In Akron, prior to 1916, the pan was eight feet in diameter. The evaporation per unit surfaae of the eight feet pan is according to HoRTON and CoLE (1934) about 2.25 percent lower. This small difference is neglected here.
During the experiments at LAKE HEFFNER (1952) the evaporation of several evaporation pans was recorded. One of these pans - the "BPI sunken pan" -is the same as BRIGGS and SHANTZ' pan. Based on these measurements, several formulas are suggested t() estimate E0 from pan evaporation Ee. In case of the BPI sunken pan the seasonal influence on the relation between evaporation from a pan· and a free water surface is not large. During the growing season a constant conversion factor of 0.92 ( ..:__ E0 Ee-1) may be accepted. ·
The transpiration ratio of more than 100 plant species and varieties was determined. In this section the results for the three plant species experimented with irr most years

37
and places are considered. These are alfalfa (Medicago sativa; ADI- E 23 or a similar variety) with a large transpiration ratio, sorghum (Andropogon sorghum,· Red Amber or similar variety) with a small transpiration ratio and wheat (Triticum durum; Kubanka variety) with an intermediate transpiration ratio.
The results of the measurements, ranked according dry matter production and not according place and year, are given in table 6. For details it is necessary to consult the original publications. The production - P - is the total dry matter of the above ground parts of the plants at the time of harvest. The transpired amount of water -W - is the actual transpiration during the period of growth. Ee is the pan-evaporation averaged over the period in which most of the water was transpired. From sowing and harvesting dates and records of water use it is found that sorghum transpired most in July and August, wheat in June and July and alfalfa from April to September.
TABLE 6. Transpiration (Win kg) and production (Pin g) of plants grown in containers in Akron (A), Mandan (M), Newell (N) and Delhart (D) from 1911 to 1922. Ee is the evaporation from a BPl sunken pan in mm day-\ averaged over the period most dry matter is formed. For literature references and more details see text.
Sorghum
I Year Place
Wheat
I Year Place
Alfalfa
Year Place p w Ee p w Ee p w E,
1913 A 679 202 7.7 1914 A 306 158 6.6 1912 A 338 222 5.2 12 A 578 136 6.1 13 A 280 139 7.2 14 A 306 272 5.8 14 A 457 130 7.1 12 A 274 108 5.9 13 A 292 243 16.0 11 A 308 92.0 7.8 15 A 238 96.4 5.1 15 A 217 151 4.6 17 A 276 75.0 7.8 22 M 215 79.9 5.1 11 A 196 210 6.8 16 N 272 65.1 5.4 17 A 153 72.0 7.6 17 A 183 150 5.9 11 D 271 84.6 8.5 20 M 148 50.3 5.5 15 N 146 81.2 3.7 19 M 261 71.3 7.2 16 N 146 5L5 5.2 19 M 137 102 5.5 15 N 236 49.6 4.4 15 N BO 43.1 4.1 22 M 132 97.6 4.7 16 A 232 68.6 7.6 12 N 122 56.4 6.7 16 A 124 130 6.5 17 N 218 59.7 6.9 19 M 114+ 59.0 6.8 16 N 113 76.4 4.5 15 A 203 41.2 5.2 17 N 114- 55.3 6.5 17 N 111 95.8 4.8 20 M 178 40.6 6.5 21 M 113 58.0 6.7 21 M 98.4 92.0 5.5 18 N 128 36.4 5.7 18 N 110 45.8 5.4 13 N 83.8 61.7 5.2
in Bombay 1) 11 A 94.7 42.0 8.0 12 N 76.3 55.9 5.3 14 N 93.3 49.3 6.3 14 N 55.2 57.1 4.9
1941 42.1 12.7 8.0 16 A 91.8 58.5 7.8 18 N 47.8 55.5 4.5 38 20.8 8.5 9.2 13 N 90.3 39.9 6.3 37 20.2 8.3 8.8 11 D 45.0 30.2 9.1 39 20.0 9.2 7.9 11 A 13.0 6.56 5.8 35 18.0 8.5 8.0 36 16.6 7.3 7.7 40 14.0 4.0 8.8
1) The model of the evaporation pan in Bombay is not known.
Seven observations (KANITHAR and others, 1943) with sorghum near Bombay (India) in the dry season are given also. These data are included on account of their illustrative value; they will be treated separately.

38
2.1.1.2. A new interpretation of the experimental results. The experiments were carried out in an arid climate, where the sun is not shaded by clouds during the greater part of the growing season. From section 1.3. it follows that under these conditions the ratio between transpiration and net assimilation rate of leaves is proportional to the evaporation of a free water surface, but more or less independent of temperature and other climatic factors. The influence of fertility and availability of water, if any, should be small, because both are normal in these experiments. Hence, it is expected that the transpiration ratio - wp-1 - is in first approximation proportional to Ee and depends on plant species, but is independent of fertility, other weather conditions and the size of the plant.
:!!_ " w . p p
A " . 8 1.00
£-: ./ 600 ,/y. ~· · .. 200 0.) "
y·· 2 300
Ee Ee
10 5 10
w w g water p c in 1200 0 p g dry matter
0 07 A-· E9 in ~
0 day 8
600
Ee
10
FIG. 22. Diagramsshowingtherelationbetweenthetranspirationratio- WP- 1 - and theevaporation from an evaporation pan - Ee - in different years in Delhart (Texas), Akron (Colo.), Mandan (N.D.), Newell (S.D.) in U.S.A. (circles) and in Bombay in India (dots). The data are obtained from table 6. Graph A: sorghum; B: Kubank:a wheat; C: alfalfa. The lines represent the regression equations of table 7. Line 1 in figure A holds for the data in U.S.A. and line 2 for the data in U.S.A. and India, both.
Growing conditions in the South (Texas) and the North of the Great Plains (North Dakota) in different years are as different as may be expected within the same climate, the data of table 6 are therefore very suitable to check these conclusions. For this purpose the observations are represented in a graph (figure 22) with the ratio wp-1

39
along the vertical axis and Ee along the horizontal axis. The relation between WP-1 and Ee is represented by the regression lines. Two lines are given for sorghum. Line 1 is calculated from the observations in the U.S.A. alone, and line 2 from these and the observations in India. The correlation coefficients, regression equations and standard errors of estimate are given in table 7. This correlation was of course noticed by BRIGGS, SHANTZ and others, but- unfortunately- not analysed adequately.
TABLE 7. The relation between WP-1 and Ee.
Crop Corr. coeff. I Regression equation I Standard error of WP- 1 = estimate of wp-l
Sorghum 0.85 97 + 24.9Ee 19 U.S.A. Wheat 0.81 72 + 61.5Ee 52 Alfalfa . 0.48 291 + 103 Ee 147 Sorghum .. 0.67 3.5 + 42.1 Ee 60 U.S.A.+ India
The standard errors of estimates (which are the standard errors of Wp-1 for given values of Ee) are large compared with the average value of WP-1. Although positively correlated, wp-1 and Ee are not strictly proportional. It seems reasonable, therefore, to assume that the value of wp-1 also depends systematically on other factors than Ee and plant species.
However, in the above treatment, and as far as known in all other discussions concerning the transpiration ratio, it is implicitely supposed that the standard error of wp-1 is independent of production. This is an arbitrary assumption. Another assumption, a priori as acceptable, is that the standard error of P is a constant. Both
assumptions are not the same which may be proved as follows. If a [ ~ I W, E, J represents. the standard error of WP-1 and cr[P I W,Ee] the standard error of P for
given values of Wand E,, aud E [ ~ J and E [P] the expectation values, the following
relation holds* :
a[~\w,E.J [w J E [;] ""'aln pi W, E, = crln [WI W, E,] + aln [PI W, E,] =
cr [PI W, Ee] =a 1n [PI W, Ee] = E [P] or
W E[~] a [P I W, E, J "" E [ p ] " [ p I W, E,]
*) The author is indebted to Prof. Dr. N.H. KUIPER for details on the mathematical treatment.

and with
40
E [ ~] "" constant = C, E [ P] "" P,
cr2 [ W I W E ] c.v. C2
cr2 [P I W E ] p ' e - p2 , e 2.1
If it is supposed that the standard error of P is constant, this error of wp-1 is proportional with p-1 and it is necessary in figure 22 to attach weights to the observations proportional with p-2• In the graps of figure 23 these weights are attached by representing the observations by circles with diameters proportional to P. The deviations of the larger circles from a possible mean line through the observations are smaller than the deviations of the small circles. The big circles suggest that W p-l and Ee are proportional in all three cases. The assumption that the standard error of W p-l increases with decreasing Pis confirmed by the negative rank correlation coefficients between P and the absolute value of the vertical distance between the observations and the regression line through the unweighted observations. These coefficients are given in table 8.
400
200
1200
w p
w p
A
c
:
0 ~0· o().,
0 0
E,
5
oO
00 0
<3D 0 o<:P <Po
Ee
s
w p
8
600
• ·~ao 0
go 0
Oo
300
E,
10 10
Q = 600 gjcont
w 11 water pin g dry matter
E11 in mm
doy
10
FIG. 23. In this figure, the data of figure 22 are represented by circles with diameters proportiona to the plant weight per container. The large circles suggest a proportionality between WP- 1
and Ee; the small circles are scattered in the diagrams. Graph A: sorghum; B: Kubanka wheat; C: alfalfa.

41
TABLE 8. SPEARMAN's rank correlation coefficient between P and the absolute value of the vertical distance between the observations in fig. 22 and the regression lines of table 7.
Sorghum U.S.A. Wheat . Alfalfa ... Pooled average Sorghum ... U.S.A.+ India
Crop Rank corr. coeff.
-0.27
-0.23 -0.46
-0.63
Level of significance
0.33
0.34 0.06 0.03 0.01
The expectation value of this rank correlation coefficient is small, even if
cr [ ~ I W, E, J is proportional to E ~PI , because it is very likely that the observed
deviations are not ranked in exactly the same order as the standard deviations. The correlation coefficients are not unduly small. They are significant, because they occur in all three cases.
p / p
600 A J 300 B /0
I /. 100 ,!' I' 1.00 100 ~fll
7 w /0 Ee
vo 10 20 30
0 0 p
200
c 0· 300 / 200 / 10 20 30
P in g dry matter uo
100 /~ 0 oo w
Y1. in k9 woter day
Ee mm Ee
10 20
FIG. 24. Diagrams, showing the relation between production per container - P - and the ratio · WEe- 1 between transpira,tion per container - W -, and pan evaporation - Ee -. The
data are from table 6 and the same as used in the diagrams of figure 22 and 23. There exists a straight line relationship of the form: P =me WEe- 1•
Graph A: sorghum; B: Kubanka wheat; C: alfalfa.

42
According to this new assumption, it is more convenient to represent the data in a graph with P along the vertical axis a:11d WEe-1 along the horizontal and to attach again equal weights to the observations. The result is represented in figure 24. In aU three cases there exists a linear relation between P and WEe-1· Except for very low values of P the absolute value of the vertical distance between the observations and the mean line is not correlated with the value of P. For very low values, near the origin, deviations are necessarily smaller, since negative values of P and WEe-1 can not occur. The observations with sorghum in India are scattered in figure 22 throughout the diagram, but in figure 24 situated close to the origin and hardly of any weight, there.
2.1.1.3. The constant m and its value for sorghum, wheat and alfalfa. The conclusions from the preceding sections may be formulated in the following way. There exists a constant me depending only on plant species, such that the expectation value of the random variable [P- me WEe-1] is zero and the standard error of this variable a constant function of WEe-1· Estimates of me holding for the sorghum, wheat and alfalfa varieties of figure 22, grown in containers in the midwestern United States are 25.2, 13.9 and 6.62 (g dry matter mm) (kg water day)-1. The index e of m indicates that observations are done in a screened enclosure. The standard error of estimate of Pis 25, 15 and 20 grams, respectively, except for low values of P. Therefore, reasonably accurate estimates of P can be made from Wand Ee only, provided the yields are not too low.
The difference [P- me WEe-1] is a random or stochastic variable because assimilation and transpiration rate, both, are to some extent affected by other factors than plant species and free water evaporation. The constancy of the standard error of estimate suggests that these effects are of relatively more importance when the growth of the plants is small. This is not unlikely in view of what is known about the assimilation and transpiration rate of leaves. Some of the scattering of the points is also due to the variations in root weight, which is not necessarily a constant fraction of the weight of the above ground parts of the plants.
The transpiration ratio of plants outside the screened enclosure, but at the height of the soil surface, is about 10 percent higher than inside the screened enclosure and Eo= 0.92 Ee. The value of min the relation P = m WE0 -1 is therefore 20.7, 11.5 and 5.5 (g dry matter mm) (kg water day)-1 for Red Amber sorghum, Kubanka wheat and AD I-E 23 alfalfa, grown in normal position in the Great Plains of U.S.A.
2.1.2. Varietal differences
BRIGGS, SHANTZ and PIEMIESEL determined transpiration ratios of more than hundred plant species and varieties. The reliability of am-value, calculated from their data depends on the number of years, in which experiments were made and the amount of dry matter per container. To obtain some impression of this reliability, the number of years and the average dry matter production per container are given also below.
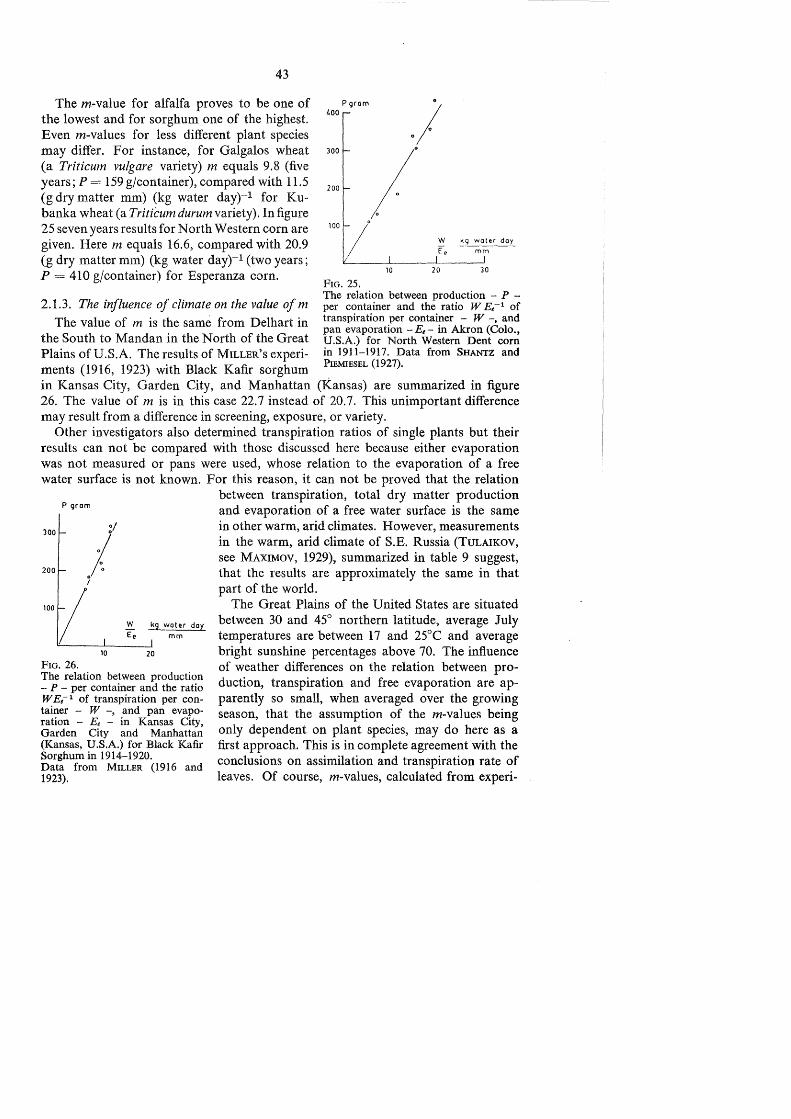
43
The m-value for alfalfa proves to be one of the lowest and for sorghum one of the highest. Even m-values for less different plant species may differ. For instance, for Galgalos wheat (a Triticum vulgare variety) m equals 9.8 (five years; P = 159 g/container), compared with ll.5 (g dry matter mm) (kg water day)-1 for Kubanka wheat (a Triticum durum variety). In figure 25 seven years results for North Western corn are given. Here m equals 16.6, compared with 20.9 (g dry matter mm) (kg water day)-1 (two years; P = 410 g/container) for Esperanza corn.
Pgrom 400
300
200
100
FIG. 25. 10 20 30
2.1.3. The influence of climate on the value of m The relation between production - P -per container and the ratio W Ee-1 of transpiration per container - W -, and pan evaporation -Ee- in Akron (Colo., U.S.A.) for North Western Dent com in 1911-1917. Data from SHANTZ and P!EMIESEL (1927).
The value of m is the same from Delhart in the South to Mandan in the North of the Great Plains of U.S.A. The results of MILLER's experiments (1916, 1923) with Black Kafir sorghum in Kansas City, Garden City, and Manhattan (Kansas) are summarized in figure 26. The value of m is in this case 22.7 instead of 20.7. This unimportant difference may result from a difference in screening, exposure, or variety.
Other investigators also determined transpiration ratios of single plants but their results can not be compared with those discussed here because either evaporation was not measured or pans were used, whose relation to the evaporation of a free water surface is not known. For this reason, it can not be proved that the relation
P gram
200
between transpiration, total dry matter production and evaporation of a free water surface is the same in other warm, arid climates. However, measurements in the warm, arid climate of S.E. Russia (TuLAIKOV, see MAXIMOV, 1929), summarized in table 9 suggest, that the results are approximately the same in that part of the world.
The Great Plains of the United States are situated kg water day between 30 and 45° northern latitude, average July
mm
10 20
FIG. 26. The relation between production - P - per container and the ratio WEe- 1 of transpiration per container - W -, and pan evaporation - Ee - in Kansas City, Garden City and Manhattan (Kansas, U.S.A.) for Black Kafir Sorghum in 1914-1920. Data from MILLER (1916 and 1923).
temperatures are between 17 and 25°C and average bright sunshine percentages above 70. The influence of weather differences on the relation between production, transpiration and free evaporation are apparently so small, when averaged over the growing season, that the assumption of the m-values being only dependent on plant species, may do here as a first approach. This is in complete agreement with the conclusions on assimilation and transpiration rate of leaves. Of course, m-values, calculated from experi-

44
TABLE 9. Transpiration ratio WP- 1 of Boluturka wheat (a Triticum durum variety) in Besenchuk (S.E. Russia), compared with the average of SHANTZ and PIEMIESEL in Akron (Colo., U.S.A.) (MAXIMOV, 1929).
Year 1911 1912 1913 1914 1915 1916 1917 I I SHANTz and
1
Average j PlEMmsEL
576 476 316 397 302 314 464 407 483 w =wet year
d w w d d = dry year
ments in the U.S.A. may be used in similar climates. On the other hand, there are climates with a large percentage of bright sunshine, but where the average temperatures or the Re-values (figure 14) differ considerably from those in the midwestern United States. Here a similar relation between production, transpiration and free water evaporation should exist, but the m-values should be different. For instance, in large parts of India from November to April, i.e. during the dry monsoon, temperatures are around 25° C, but Re-values are here about 230 compared with roughly 300 cal cm-2 day-1 in the U.S.A. As a consequence m-values in this region should be somewhat lower. KANITHAR's observations (figure 24) are, however, too inaccurate to check such a statement. ·
2.2. TRANSPIRATION AND PRODUCTION IN TEMPERATE CLIMATES
2.2.1. Some experiments in the Netherlands
As far as is known, experiments of the quality of those of BRIGGS and SHANTZ were not carried out in temperate climates. Therefore, to study the effect of weather on the relation between transpiration and production, it is necessary to make use of less satisfactory experiments. To avoid too much guess work concerning the magnitude of free water evaporation, effect of variety or experimental conditions, the results of some experiments with peas, beets and oats carried out in the Netherlands are considered, only.
2.2.1.1. Peas. From 1929-1932, BooNSTRA (1934) cultivated peas (Pisum sativum) in containers with about 5 kg of soil (MITSCHERLICH pots), which were sealed with paraffin wax to prevent evaporation and placed under glass during showers to prevent entrance of rain. Besides other data, transpiration and production of different varieties grown at different moisture contents were determined.
As varieties used and moisture treatments were not exactly the same in different years, the average figures are considered here. Averaging is allowed because neither the effect of variety nor that of the moisture treatments on the relation between transpiration and production is large (see section 2.3.). The plants were grown in summer and autumn. The results of periodic harvests enable the estimation of the periods in which most of the water was transpired. For the plants grown in summer and harvested around the 25th, the 15th and the 1st of July in 1929, 1930 and 1931

P gram
'l a
IS
10
W kg day
Eo ---m;;;--
20
45
P gram
'T
15
w kg
s 10
FIG. 27. The relation between dry matter production- P -,exclusive of roots, and the ratio WE,-1
(figure a) of transpiration and free water evaporation and the relation between production - P- and transpiration- W- (figure b) for peas (BooNsTRA, 1934).
Production - P - and free water evaporation - Eo - were
summer autumn
1929 1930 I 1931 1930 1931 1932
P grams ... ·. 13.7 30.4 I
18.4 3.31 10.4 6.8 Eo mm day-1 3.7 4.8 4.0 1.5 1.6 1.7
these periods were June 10-July 31, June 1-July 10 and June 1-June 31, respectively. The plants grown in autumn and of an age of 45-49, 49-53 and 49-53 days in 1930, 1931 and 1932 transpired most of the water in September.
Free water evaporation calculated according to PENMAN, transpiration and production (exclusive roots) are presented in figure 27. In the left hand figure the relation between production and transpiration divided by free water evaporation is given and in the right hand figure the relation between transpiration and production, only. Contrary to the experiments in arid climates, division by free water evaporation serves no useful purpose at all. This was to be expected because a great deal of the dry matter is formed during periods in which the sun is obscured by clouds and because at this latitude of 52 degrees the amount of radiation participating in assimilation is much more in June than in Septemb((r (compare figure 14). The slope of the straight line through the observations in the right hand graph of figure 27 appears to be 3.4 (g dry matter) (kg water )-1.
The relation between transpiration and production of plants of the variety GVZ 8 in 1931, .harvested at intervals and grown at some moisture treatments is given in figure 28. Again, the observations are arranged around a straight line through the

P gram 60
40
20
46
12 w kg
·FIG. 28. The relation between dry matter production - P -, inclusive roots, and transpiration - W - of peas, variety GVZ 8, grown at different periods in 1931 (BOONSTRA, 1934).
percent waterholding planted harvested
capacity at at 68% 46%
0 • April21 May 20 D 1111 , 21 June 3 0 A 21 June 17 • ,
X T , 21 July 1 A "
21 July 15 55% + Sept. 7 Oct. 2 X Aug. 31 Oct. 9 • Aug. 24 Oct. 16
_M_o_nt_h_. ----1 May I June I July I Sept. I Oct.
Decade I I II I III I I II I III I I II I III I I II I III I I II j III
Eommday-1
origin. Apparently the relation is neither affected by weather nor by the age of the plant to any appreciable extent. The scattering of the observations is somewhat larger because of the small number of replications and probably because of some systematic effect of the·moisture treatment.
Each morning the transpired amounts of water were determined by weighing and replaced by adding multiples of 50 cm3 of water. These quantities (personal communication of BOONSTRA) are rough estimates of the transpiration during the preceding day.
To check whether these amounts were actually correlated with radiation the values in June of lg Wn w;~ 1 are plotted against lg HnH;~ 1 (figure 29). Wn and Wn+I are estimates of the transpired amounts of water on the nth and (n + l)th day and Hn and Hn+t the daily radiation totals on these days, as measured on a nearby station (ZUIDHOF and DE VRIES, 1940). Quotients are introduced to eliminate the effect of plant size and the logarithme is taken to obtain a symmetrical figure. The scattering is considerable, because only rough estimates of daily transpiration are available. Nevertheless, the positive correlation is largh enough to prove that also here radiation was one of the main factors controlling transpiration. Since there is also a close relation between transpiration and dry matter production in all these experiments, it appears that radiation was also one of the main factors controlling net assimilation rate. Radiation does not control total dry matter production to the same extent as net assimilation because total dry .matter production depends also on the leaf development during growth.

FIG. 29. The relation between the ratio of transpiration on the n th and (n + l)th day- Wn Wn+t- and the ratio of the radiation on these days -HnH;;+ 1 - on a logarithmic scale for peas, variety GVZ 8, during June 1931. Data from BOONSTRA {pers. comm. and 1934).
47
lg~ Hn +1
+o.&
+ 0.3
.. r-------+---~--+-------4-------~ lg~
- 0.6 .,. 0.3 + Q3 + 0.6 W n+ 1
-0.3
-0.6
2.2.1.2. Beets. Later on BooNSTRA (1942) carried out some experiments with seven varieties of beet (Beta vulgaris), grown in large containers. Direct evaporation was checked by a layer of pebbles and by adding the water below this layer. Large errors due to rain were excluded by shielding the containers during showers and at
P gram
200
/· 100
/
/ 20
1936 month
decade ...
Eommday-1
1937 month
Eommday-1
w kg
40
FIG. 30. Dry matter production - P - and transpiration - W - of seven varieties of beet (BOONSTRA, 1942). • planted June 8, 1936, and harvested at
about weekly intervals up to 12 October, 1936.
X grown up to maturity on containers with sand in 1937.
+ grown up to maturity on containers with clay in 1937.
June I July I August I September 1-0c_t_obe_r
I IIIIIII I IIIIHI I IIIIIII I IIIIIII I
i 4.914.513.613.213.212.812.913.212.0 11.911.41 1.3
June j July I August I September I 3.9 I 3.3 l 3.0 I 1.9 l

48
night time and by the use of control pots without plants. In 1936 the plants were harvested at about weekly intervals from June onwards. In 1937 the plants were grown to maturity in containers filled with sand or with clay.
The results, averaged over the seven varieties, are given in figure 30; the evaporation rate during the growing period is given in the caption of this figure. Introduction of the ratio W E 0 --1 serves here again no useful purpose. The slope of the straight line through the observations is here 6.1 (g dry matter) (kg water)-1.
ln 1935 BooNSTRA ( 1939) determined the water consumption and production of two inbred lines of the Kuhn P sugar beet, but neither excluded the entrance of rain, nor added the water below the layer of pebbles. Average production and "transpiration" of the plants harvested in June, July, August, September and October are given in table 10 together with the rainfall during this period. According to his data, the production per kg transpired water was much larger in September and October than in the beginning of the growing period and also much larger than in other years. This value is thus large that it was almost certainly caused by excessive loss of water from the control pots in the second half of the growing period because of excessive high rainfall. This can not be proved so that these data only illustrate the limited value of experiments, in which no proper precautions are taken to prevent evaporation and entrance of rain.
TABU:. 10. Production P and "transpiration" W of sugar beets grown in containers not shielde!;l to prevent entrance of rain water (BooNSTRA, 1939) together with rainfall figures.
p w PW- 1
Plants harvested in -··--·---- ------------- ------·------ gdry matter g/cont. diff. kg/cont. diff. kg water
------
June. 2.9 0.3 53.8 7.3 7.4
July . 56.7 7.6 7.5 107 13.6 7.9
August 164 21.2 7.7 80 7.0 11.4 (!)
September 244 28.2 8.7 46 2.7 17.1 (!)
October 290 30.9 9.4
Month: July Aug. Sept. Oct. Decade: II Ill I II Ill I II III I II III
Rainfall 8 11 16 3 13 40 32 53 46 20 26 35 1953 inmm 75 82 63 71 40years
average
2.2.1.3. Oats. The results of some experiments with oats (Avena sativa) in Groningen in 1915, 1922 and 1947 and in Wageningen in 1939 are given in figure 31. In MASCHHAUPT's (1938) experiments the plants were subject to a treatment with four phosphate levels, in VERHOEVEN's (1946) experiment to a treatment with NH4N03
and NaN03 and in VAN DER PAAuw's (1949) experiments to a treatment with two moisture levels. In all experiments direct evaporation was prevented by a layer of coarse material and rain was not allowed to interfere seriously.
Here again the relation between transpiration and production is neither affected to an appreciable extent by the treatments nor by the weather. The slope of the

49
straight line through the observations appears to be 2.6 (g dry matter) (kg water)-1.
VERHOEVEN (1946) reports that in 1940 oats were sown very late (probably inJun~) due to war circumstances and that in this year the transpiration ratio was 126 (i.e. 7.94 (g dry matter) (kg water)-1),
which is much lower than in other years. Unfortunately no details and no absolute yields are given, so that the importance of this observation can not be judged. Since no other experiments in temperate climates were found, where the transpiration ratio of plants grown off-season was much lower than that of plants grown in summer, VERHOEVEN's result can not be discussed.
P gram 7S
so
2S
w kg
10 20 39
FIG. 31. The relation between dry matter production - P - and transpiration - W- of oats grown in containers.
Author I Year,. Treatments
X MASCHHAUPT 1915 4 fertility levels (1938)
0 - do - 1922 5 - do -f:l VERHOEVEN 1939 2- do-
(1946) 8 VANDERPAAUW 1947 2 moisture
( 1949) levels
2.2.1.4. The constant n and its value for peas, beets and oats. From the preceding experiments it may be concluded that there exists a constant n, depending only on plant $pecies, such that the expectation valqe of the random variable (P- n W) is zero. Although a smaller number of observations is available than in arid climates it appears also that the standard error of this variable is a more or less constant function of P or W. Estimates of n holding for peas, beets and oats grown in containers in Holland are 3.4, 6.1 and 2.6 (g dry matter) (kg water)-1. (see figure 27, 30 and 31). A detailed analysis of the results of BooNSTRA (1942) shows that for sugar beets this n.-value is about 0.3 units higher and for fodder beets about 0.5 units lower that the average of 6.1 for beets.
2.2.2. The influence of climate on the value of n
Although assimilation and transpiration rates of leaves are positively correlated with radiation, there should be som~ effect of temperature and radiation on the value of n (compare section 1 ). The inability to detect such an effect in figures 28, 30 and 31 does not inply that radiation and temperature effects on n compensate each other. It is also possible that these effects, if any, are not large compared with sm~ll but systematic effects of growing conditions and varieties within a plant species. This may be understood, if it is taken into account that temperature and free water evaporation, averaged over the growing period, do not differ much from year to year. For mstance in Holland, free water evaporation during June and July of the excessive dry year 1947 was only 4.7 mm day-1 compared with 4.0 on the average.

50
Excluding experiments in green houses in which radiation is appreciably lower and in which the correlation between radiation ( H0 <nl) and the factor h0 (ta- td) is cJisturhcd \section 1.1.4.), and excluding experiments in which direct evaporation from the soil surface is badly accounted for, it follows from experiments in Germany that the value of n for small grains is about 2.5 (g dry matter) (kg water)-1, for peas so\vcwhat larger and for sugar beets about 5 (g dry matter) (kg water)-1 (compare M ASCJIHAUP r, 193H). These values are roughly the same as in the Netherlands. It seems therefore that the effect of weather differences as occurring in a wider area than the Netherlands, only, is also of little importance, provided bright sunshine percentages (compare section 1.2.6.2.) are also low. This is in accordance with the results in figure 27. lt may be seen there that the value of n for peas is the same in June and in September.
The m-value for sugar beets in the relation P = rn W £ 0 - 1 in Akron (U.S.A.) is about 1.6 times them-value for oats and them-value for peas about 0.78 times the 111-valuc for oats (m-values calculated from SHANTZ and PIEMIESEL's (1927) data). In Holland the comparable ratios of the n-values in the relation P = n W are, however, 2.3 and 1.6 respectively. The n ... values in the Netherlands can therefore not be found by substituting proper £ 0 -values in the equations, calculated from experiments in lJ .S.A. This illustrates again that a distinction between climatic regions, as introduced here is absolutely necessary.
2.3. TRANSPIRATION AND PRODUCTION OF DIFFERENTLY TREATED PLANTS
2.3.0. Introduction
The results of the preceding sections hold for plants cultivated in large containers filled with fertilized soil and supplied with normal quantities of water. When fertility is low or water is available in very large or small amounts, results may be different.
Many investigators cultivated plants on soils with differences in fertility or in availability of water; they concluded that the transpiration ratio depends to a large extent on these factors. The importance of this conclusion remains to be seen, because it is possible that differences occur only when the plants are treated so badly that resulting yields are too low to be practical importance. A comparison of transpiration ratios is, therefore, not the most convenient way to interpret these experiments.
It is again more convenient to represent the results in a graph with the production along the vertical axis and the transpiration of water along the horizontal axis. Introduction of the evaporation of a free water surface is not necessary as long as transpiration and production of plants cultivated at the same place and time are compared. The values of m or n for differently·treated plants are the same when the observations in such graphs arrange themselves around a straight line through the origin.
2.3.1. Nutrient level of the soil
Production and transpiration of plants grown at different nutrient levels are

51
p a /6 p b 6 p c 3/5
/ BOO
300 300
ISO 150 400
300 600
p d// p e X 50 so
+/ /
15 tX 25
// 0 ./
/ otl
w w )ld> ,;o
10
g /"" p h
/' 20
15 15
10
w w
P in g dry matter Win kg water
FIG. 32. Transpiration - W- and production - P - of plants grown in containers with soils or solutions of different fertility. Details in original publications.
Graphs a and b: Crop: corn. Data from K.lESSELBACH (1916) in 1911 (a) and 1914 (b).
Fertility of soil no manure 2 lbs. sheep manure/cont.
non-fertile . . . . . . . . 1 4 intermediate . . . . . . . 2 5 fertile. . . . . . . . . . 3 6
Graph c: Crop : alfalfa. Data from ScoFIELD (1945) ( •) fertilized, ( 0) unfertilized soil. Graph d: Crop: Sudan grass. Data from BALLARD (1933). (0) 0.75 g, (e) 2.25 g, (X) 4.50 g NaN03
in containers with water. Plants harvested after 37, 56, 78 and 100 days. Graph e: Crop: barley. Data from BALLARD (1933). (0) 0.33 g, (e) 0.66 g, (+) 1.32 g and (X) 2.64 g NaN03 in containers with water. Plants harvested after 61, 97, 125 and 146 days. Graphs f-h: Data from LAWES (1850) cited through BRIGGS and SHANTZ (1913). Soil with (0) no manure, (e) mineral manure, (X) mineral plus ammoniacal manure. f: wheat; g: barley; h: clover. Graph i: Crop: wheat. Data from THOM and HoLTZ (1917). Culture solution containing 0.004, 0.01, 0.02, 0.04, 0.1 and 0.2 percent minerals. (0) and (X) are results in two different years.

52
summarized in figure 32. Details of the experiments are given 1n the captions to the graphs.
Yield differences caused by differences iq fertility are large. The observations for plants which produced roughly 50 percent or more of the maximum yield are arranged around a straight line through the origin. The other observations may be found below this line. This is in agreement with the conclusion of section 1.2.4. where it was mentioned that the net assimilation rate decreases with decreasing fertility if the nutrient status of the plant is below a certain minimum value. The boundary of 50 p~rcent is an arbitrary one and of small quantitative value because it is not possible to compare the fertility of soils in containers or water cultures with soils in the field. In graph 32a the transpiration ratio for the nonfertile, unfertilized soil is larger than for the non-fertile, fertilized soil. It is not justified, therefore, to assume that the values of m or n are always independent of soil fertility under field conditions.
Although the experiments give for the greater part qualitative information, the following working rule may suffice for the time being:
The values of m and n may decrease with decreasing fertility of the soil, only, when production is seriously limited by the availability of nutrient~; they are independent of the fertility of the soil if the production is mainly limited by other factors.
2.3.2. A vai!ability of water
Production and transpiration of plants grown at different saturation values of the soil are summarized in figure 33. Details are given in the captions t9 the graphs. The observations are arranged around a straight line through the origin in about eight out of seventeen cases. Therefore, under many conditions the values of m or n do not depend on the availability of water. At low saturation values, the observations are sometimes below the straight line through other observations. In section 1.3.3. it
- ~- -~--~--~~-~- ~-----
Details in original publications. graphs a~k: Data from ScHULTZ ( 1927). Availability of water between (yo) 76-95%, (Ll) 57-95%, (0) 38-95%, (X) 19-95%, (e) 0-95% of the water holding capacity of the container. a: serradella; b: mustard; c: sorghum; d: hairy vetchi e: carrots; j': oats; g; meadow foxtail; h: meadow fescue; i: red clover; k: white clover. graph 1: Crop: peas. Data from BooNSTRA ( 1934). Availability of water (\7) 90, (A) 70, (0) 50, (X) 30% of water holding capacity. Average two varieties harvested arounc;l. July 10, 1930. graph m: Crop: oats. Data from VANDER PAAUW (1949). (Ll.) wet and (X) dry series. graph n: Crop: oorn. Dat\1 from HAYNES (1948). (e) initially water only (plant died); ( >~) small portion of roots sparingly irrigated (plant died); (C) irrigated fi(fld capacity at permanent wilting perc.; (A) irrigated to permanent wilting perc. to field capacity at 20 inches Hg pressure at; (V') water table 6 inches below soil surface. graph o: Crop: alfalfa. Data from SCOfiELD (1945). (e) infrequently irrigated; (X) frequently irrigated; ( 0) sub irrigated. graphs p-q: Crop: oats. Data from DILLMAN (1931). (e) severe wilting during heading and milking stage; ( ) severe wilting during he&ding stage; (O) regular supply of water. p: Newell; q: Mandan. graphs r-s: Crop: corn. Data from KIESSELBACH (1916). r: 1910. (e) 35, (X) 45, (0) 60, (yo) 80 and (A) 100% of the water holding capacity. s: 1913, (X) 50, (0) 70 and (Ll) 95% of the water holdin~ capacity.

53
p 150
p p d y so a 100 50
/' /~6.v
0/ / 0 .
25 25 50 25 if
~/ ./ / w
10 20 10 20 10 20 30 10
p p f /o/:('v5o
p h 50 100 g ?/_
I(
/ I( C% /
25 50 . 25 25 ./
10 20 20 40
p p
50 - n 1000 500
25 250
P in g dry matter Win kg water
Fxo. 33. Transpiration- W-and production- P ~of plants grown in containers with soil at different moisture contents. (cont. on page 52}

54
was concluded, that the ratio between transpiration and net assimilation rate of leaves may vary considerably if most of the dry matter is formed during periods when stomata are partly closed. In section 2.1.1.3. it was found that the standard error of the transpiration ratio is high when production is low. It is, therefore, not worthwhile to analyse in detail the effect of severe water shortage, although there may be a slight indication that the transpiration ratio for plants very short of water is somewhat lower than for other plants.
It is more important to discuss the effect of large saturation values of the soil on the relation between transpiration and production because under these circumstances high yields may occur. In the experiment of graph 33 r plants were cultivated at 35, 45, 60, 80 and 100 percent of the water holding capacity of the soil. Except for the observation at I 00 percent, the production increases with increasing saturation of 1 he soil. The production at I 00 percent is smaller than at 80 and 60 percent of the water holding capacity: the transpiration ratio is appreciable higher. The transpiration ratio at BO percent is higher than at 60 percent of the water holding capacity, although the production is not yet adversely affected. Apparently, this ratio increases with increasing saturation of the soil before production is reduced. A comparable but smaller effect is obtained in some other experiments of figure 33 (i.e. b, g and i). These effects of high saturation values are in agreement with the assimilation and the transpiration data of leaves of pecan seedlings in section 1.3.3.
This is not the case with the results in graph 33f and 1. The effect of increasing saturation values of the soil is so large and deviates from the results in other graphs to such an extent, that it is not justified to attach much weight to the result in graph 33f. The result in graph 33 I, however, is confirmed by other experiments of the same author. As these were carried out in such a way that direct evaporation was excluded, it is beyond doubt that here the value of n decreased with increasing saturation percentages of the soil.
In most experiments this is definitely not the case. For this reason it is justified to associate the adverse effect of high saturation percentages with bad aeration of the root system and to summarize the results in the following way:
The values of m and n are, in first approximation, independent of the availability of water. If large amounts of water are available, the aeration of the root system may be affected and this may cause a decrease of these values. The boundary between sufficient and insufficient aeration is not defined properly and may depend on crop species and soil type.
2.3.3. The age of the plant
It is difficult to study the effect of age on the relation between transpiration and production because the weather changes in general systematically with the age of the plant. No experiments have been found enabling a comparison of transpiration and production of plants of different age during the same period. The experiments of figure 32 d and e, with plants of different age carried out in a greenhouse where the weather was regulated to some extent suggest, however, that the effect of age, if any is not large. This suggestion is confirmed by the results in the figures 28 and 30.

55
During senescence assimilation and transpiration, both, are probably adversely affected. If not to the same extent, the effect on assimilation is likely to be larger, because during senescence, leaves which do not assimilate may transpire but leaves which do not transpire can not assimilate. Thus, although the effect of age on the relation between transpiration and production is not apparent, an adverse effect may be found if the period leaf senescence is long. This opinion is confirmed by some results of DILLMAN (1931) who cultivated alfalfa up to blossoming and up to the ripening stage. Most crops are harvested at the same age, and in the next chapters only plants are considered which were harvested at maturity. Therefore it is not necessary to pay much attention to this problem of senescence.
2.3.4. Mutual shading
The experiments of the preceding chapter concern plants grown in containers, not surrounded by other plants. In the field, plants are grown much closer together and it is often supposed at present that this difference in arrangement influences the ratio between transpiration and production considerably. For this reason pot experiments are considered to be of very limited use under field conditions.
The obvious way to study the effect of arrangement is by comparing plants in containers not surrounded by other plants, with plants in containers placed within a field of the same plant species. However, experiments of this kind are hardly to carry out, since it is difficult to obtain plants of the same· size in the surrounding field and in the containers and difficult to avoid an air gap between field and pot plants because of handling. In spite of this, it is certainly worthwhile to consider the effect of differences in pot arrangement. BRIGGS, SHANTZ and PIEMIESEL placed their containers close together so that the amount of leaves shaded by leaves of plants on the same and surrounding containers depended to a large extent on the leaf mass or production per container. In different years and places large yield differences occurred and the existence of a straight line relationship between P and WE0 -1 proves, therefore, that these admittedly small differences in shading did not effect the value of m.
To investigate the effect of shading in detail, SHANTZ and PIEMIESEL (1927) cultivated not only plants in the shelter but also in containers on the soil outside the shelter in a free windswept position ("in the open") and in containers placed in trenches surrounded by a field of grain ("in the field"). The results of these experiments are summarized in table 11 and the comment of SHANTZ and PIEMIESEL is given here (page 1095):
"Observations in the shelter were made under most favourable conditions, since plants were protected from excessive high winds and from damage by hail, wind or birds. In the field on the other hand, plants were subject to all the variable and inclement conditions of the weather so that measurements show a much wider variation and a much greater probable error than those grown in the shelter. While the plants grown in the open were also exposed they were watched much more closely and were protected to some extend against excessive storms. The measurements presented in table 11 (this paper) show that the water requirement ( = transpiration ratio) in the field was 10 percent higher than in the screened enclosure. For the freely exposed plants, however, the water requirement was only 3 percent above the field or 13 percent above the crops in the shelter. It seems safe to suppose that had these experiments (in the enclosure) been carried on in the open, unprotected, and with the same exposure as field plots the water requirement would have been about 10 percent higher than at present recorded.''

56
TABLE 11. Effect of exposure on transpiration ratio- WP- 1 - as shown by experiments with plants grown in the open, but slightly protected, in the field, and under shelter at Akron. From SHANTZ and PIEMIESEL, 1927.
Year Crop
I ___ I_n_o.-pe_n ___ , ___ I_n_fi.,-el_d ___ , In shelter
wp-1 I % wp-1 I % wp-1 I %
1911 Tumbleweed 275 99 277 100 1913 Kubanka wheat 627 126 562 113 496 100
Alfalfa, E-23 1030 124 834 100 1914 Kubanka wheat 625 121 518 100
Sudan grass 455 115 402 102 394 100 Alfalfa, E-23 1039 117 890 100 Millet, Kursk 287 97 295 100
1915 Kubanka wheat 361 89 405 100 Sudan grass 287 110 290 112 260 100 Alfalfa, E-23 795 114 695 100 Millet, Kursk 218 108 202 100
1916 Kubanka wheat 908 143 636 100 Sudan grass 377 88 426 100 Alfalfa, E-23 1095 105 1047 100 Millet, Kursk 460 125 367 100
1917 I
Sudan grass 409 108 378 100 Average 113 110 100
This 10 percent correction for the effect of screening was already applied in section 2.1.1. 3 and is undoubtedly associated with the lower light intensity in the shelter. The small difference of 3 percent between transpiration ratios of plants in the open and in the field proves that the effect of mutual shading and arrangement of plants on the transpiration ratio is small.
KIESSELBACH (1916, 1929) working in Lincoln (Nebr., U.S.A.) tried to avoid any bias due to abnormal exposure by placing the containers in excavations in the field with their tops level with the soil surface and by planting surrounding areas with a crop similar to those tested in the pots. The plants were not protected against birds and inclement weather conditions. From his photographs, it may be concluded that his plants were growing close together, so that considerable mutual shading occurred. On the other hand, it can be seen that the growth of plants around his pit is not so luxurious that normal field exposure of his test plants is obtained.
In 1910-1923, KIESSELBACH measured total dry matter yield and transpiration of Hogue corn exposed in this way and determined simultaneously the evaporation from an evaporation pan. The results of his measurements are given in figure 34. The observations are again arranged around a straight line through the origin, except for three years (1912, 1915 and 1922). KIESSELBACH states that "With some irregularity a considerable correlation exists between the transpiration per gram dry matter and the pan evaporation", but does not suggest any explanation of the irregularities in these three years.
His evaporation pan had a surface of 232 cm2 and was at least 17 em deep. His evaporation figures are averages of 6 pans placed at different elevations at intervals of 2 feet from the soil, upwards. The average evaporation during July-August in the

57
fourteen years period was Ee = 13.4 mm day-1. grams p
This high value is due to heat conduction through 5oo
the sides of the pans, since the evaporation of insulated pans was much lower. KIESSELBACH reports enough data to enable at least an estimate of the evaporation from a free water surface - E0 - with PENMAN's formula. This estimate gives a July-August average of 7.02 mm day-1 so 250
that the ratio EoEe-1 was in this case about 0.52. As the slope of the line in figure 34 is 47.5, the best estimate form of Hogue corn is 0.52 x 47,5 = 24.7 (g dry matter mm) (kg water day)-1.
For Black Amber sorhum, cultivated in 1914-1920, KIESSELBACH reports an average weight per container of 143 g and a transpiration of 44.6 kg, so that with an average pan evaporation of 12.5 mm/day a m-value of 21.0 is calculated. During the same period, Esperanza corn yielded 309 g per container and transpired 96.1 kg water, giving for m 21.0 (g dry matter mm) (kg water day)-1. Results with alfalfa concern only the data of one and with wheat of two years. Because of
10
FIG. 34.
W kg water day
E; mm
20
The relation between production - P -and the ratio WEe-1 of Hogue com in Lincoln (Nebr.) from 1910-1923. Eo is estimated to be 0.524 Ee. The three observations with a questionmark (1912, 1915, 1922) are not in agreement with the observations in other years. Data from KIESSELBACH (1929).
an obvious and serious misprint in KIESSELBACH's (1929) table 6, these values are not given here.
In table 12 the m-values of KIESSELBACH in Lincoln are compared with m-values of SHANTZ and PIEMIESEL in Akron. The results for Esperanza corn and sorghum are the same in both places and apparently independent of large differences in mutual shading and arrangement between plants in Akron and Lincoln. The m-values for Hogue corn and North Western Dent differ considerably. This difference is probably due to a difference in variety. A direct check on this supposition is not possible because Hogue corn was not cultivated in Akron and North Western corn was not cultivated in Lincoln. Comparing the results at both places, it should be realized that the very good agreement for Esperanza corn and sorghum is of no importance, since estimates of free water evaporation in Lincoln are not accurate. Because of this, it is also possible that varietal differences between Hogue and North Western Dent corn are smaller than suggested in table 12.
TABLE 12. Values of m for some plant species in Akron and Lincoln. For details see text.
Crop
Esperanza corn red . . Amber sorghum black . N.W. Dent corn ... . Hoguecorn .... .
g dry matter mm kg water day
---------- --------------Akron I Lincoln
20.9 20.7 16.6
21.0 21.0
24.7

58
The plants of the above experiments were not growing close together, nor did they cover n tended areas. The experiments arc therefore unsuitable to study the effect of the size of the tield on the value of m or n. Moreover, they neither prove nor disprove the statement, that them or n values of very dense crop covers may be lower than for single plants because of the respiration of the leaves in the shade.
2.4. SUMMARY
In climates with a large percentage of bright sunshine a relation
P == m WE0-l 2.2
exists between total dry matter yield - P - and total transpiration during growth - W - of plants in containers and free water evaporation - E 0 -. In climates comparable with those of the Great Plains of U.S.A. the value of m for sorghum, wheat and alfalfa is 20.7, 11.5 and 5.5 (g dry matter mm) (kg water day)-1,
In climates with a small percentage of bright sunshine a relation
P = nW 2.3
exists between total dry matter production - P - and total transpiration during growth - W - of plants in containers. In the Netherlands the value of n for beets, peas and oats is 6.1, 3.4 and 2.6 (g dry matter) (kg water)-1.
The constants m and n are at first approximation independent of weather, nutrient level of the soil and availability of water, provided the nutrient level is not "too low" and the availability of water not ''too high''. These values are also independent of the degree of mutual shading, provided the leaf mass is not "too dense". Where these conditions are not fulfilled, the m and n values are larger. The terms between paranthesis are not defined quantitatively.
The influence of the size of the vegetative surface on the value of m and n can not be established by means of experiments in containers.
The above relations are stochastic because, even under normal conditions, m and n depend to a limited extent on such factors as fertility of the soil, availability of water and temperature differences as occurring in the above mentioned regions.
The equations 2.2 and 2.3 are of the following form:
P = y WE0-x 2.4
In the Great Plains of U.S.A. the value of x appears to be about 1 and in the Netherlands about 0. It is likely that there are regions, where the value of xis somewhere between 0 and 1. This can not be proved because of lack of data.

3. TRANSPIRATION AND PRODUCTION IN THE FIELD
3.1. MAINLY THEORETICAL CONSIDERATIONS
3.1.1. Production and transpiration, limited by the availability of water
A simple relation· appeared to exist (section 2.4.) between transpiration and total dry matter production of plants, provided the nutrient level of the soil is not "too low", the availability of water not "too high" and the leaf mass not "too dense". These extreme circumstances do not occur in the field, if the growth in the field is limited by the supply of water. .
Consequently, the relation between transpiration and total dry matter production in the field under conditions of limiting water supply, must be quantitatively the same as in containers.
A relation P = n W was found to exist for plants grown in containers in the Netherlands. The value of n for oats is 2.6 (g dry matter) (kg water)-1 or 2.6 (lQ-3 kg dry matter) (l0-4 mm ha)-1 = 26 kg ha-l mm-1 in units, suitable for use in the field. Under conditions water is limiting, the dry matter yield of oats in kg per ha is found by multiplying the transpiration in mm with 26. The values of n for sugar beets and peas are 61 and 34 kg ha-l mm-1, respectively.
A relation P = m W E0 -1 was found to exist for plants grown in the Great Plains of the United States. The value of m for Kubanka wheat is 11.5 (g dry matter mm) (kg water day)-1 or 11.5 (l0-3 kg dry matter mm) (l0-4 mm ha day)-1 = 115 kg ha-lday-1 in units suitable for use in the field. The values of m for sorghum and alfalfa are 207 and 55 kg ha-1 day-1. As the value of in is independent of E0 , the production in kg per ha is most conveniently compared with the ratio W Eo -l expressed in days. For
p
10
1000 kg -ho-
I
ll I
I I
I a
Pp --- _P- - ·i-/--,---::::>1"-
s
w Eo
0 100 days mm
FIG. 35. The relation between transpiration (WEo-\ resp. W) and dry matter production- P- of Kubanka wheat grown in the midwestern United States (figure a) and oats grown in the Netherlands (figure b). For explanation see text.

60
,,~f';~ ~ ,:, I ·-;rx /w---·- / ·---~--1 -·
I --~-
sooo}_-_/
]00 400 kg N
~
250
FIG. 36. Dry matter production - P - and transpiration - W - of grassland (2nd to 5th cutting, inclusive) and seasonal application of nitrogen (compiled from WIND l954b.). The evaporation of a free water surface - Eo - during the period of growth is presented by a horizontal line.
instance, the ratio W £ 0 - 1 is 40 days if W is 200 mm and Eo is 5 mm day-1. Analogous to the term: "transpiration in mm", this ratio is called: "transpiration in days".
The above relations between transpiration and production in the field are represented by the straight lines I in figure 35a and b. Figure a refers to Kubanka wheat in the Great Plains of the United States and figure b to oats in the Netherlands. The total dry matter production in kg per ha is given along the vertical axis and the transpired amount of water, either expressed in days (figure a) or in mm (figure b) along the horizontal axis.
The conclusion, hased on experiments in containers is that the lines l are valid under field conditions, provided yields are lirnited by the availability of water, only.
3.1.2. A simple, hut necessaryfield experiment
To judge, whether yields are limited by water, it is necessary to know the yield when water is not limiting. The latter yield depends on such factors as type and nutrient level of the soil, application of fertilizers, weather and so on, and can only be estimated on basis of the result of a field experiment, in which the moisture content of the soil is kept near field capacity. This experimental yield which varies from field to field is supposed to be Pp kg dry matter per ha and represented in figure a and b by the horizontal line p.
The values of m and n tend to be lower, if water is not limiting and leaf density is high, especially under conditions production is seriously limited by the nutrient level of the soil (section 2.4.). Hence, the transpiration is likely to be higher than the transpiration given by the lines /, when yields are around the production level- Pp -.
This excess transpiration may be very large for crops like grass with an established root system and a closed crop surface, as is shown in figure 36.

61
3.1.3. The relation between transpiration and production in the field
The most simple way to represent the relation between transpiration and production is by the solid portions of the lines land pin figure 35. However, an abrupt point of inflexion between the water limiting (line l) and water not limiting (line p) part of the curve as suggested by these lines can not exist because periods of water shortage and excess may alternate and the availability of the nutrients in the soil may depend on the availability of the water. Hence, a relation as given by the curves c or d is more acceptable. Consequently, the minimum amount of water necessary to obtain the maximum production, can not be estimated accurately.
If relations like curve d prevail in the field, it is necessary to estimate in some way or another, transpiration and production in the transitional region between the water limiting and not limiting parts. Fortunately, it appears from the following sections that for several crops the relation between transpiration and production is of a form like that of curve c, which approaches the solid portions of the lines land p. Hence, the minimum amount of water necessary to obtain the maximum production- Pp -, may be obtained by adding some more water than the amount corresponding to the intersection of land p (figure 35).
Where water is in short supply, the transpired amount of water is equal to the available amount of water corrected for direct evaporation and some unavoidable losses. In this range, the relation between available amount of water and production is about the same as between transpired amount of water and production. Where water is not limiting, the transpired amount of water is in general less than the available amount of water, since some water is left behind in the soil or lost in some way or another. Where water is in excess, yield depressions may occur of course.
3.1.4. The horizontal extension of the crop surface
The above approach may do as far as the evidence obtained from transpiration ratio measurements in containers goes. However, it was obvious that the maximum transpiration of a field (section 1.1.4.) and the relation between transpiration and production (section 1.3.5.) must depend also on the size of the vegetative surface.
When the size of the field is not taken into account, inconsistent results may be obtained. For instance, the value of m for alfalfa is 55 kg ha-l day-1, whereas production rates of alfalfa under favourable field conditions may be as high as 110 kg ha-1 day-1. The transpiration rate, calculated by substituting these two values in the equation P = m W £ 0 - 1, is two times the free water evaporation rate.
On small fields, the energy necessary to vaporize all this water may be obtained by advection (horizontal transport of energy) but on large fields the amount of available energy suffices only to vaporize an amount of water which is roughly 1.2 times the free water evaporation rate (section 1.1.4.).
Consequently, on fields, sufficiently supplied with water, the relation between transpiration and production can only be the same as in containers, if the fields are so small that sufficient energy is obtained by advection. It is often supposed, although in many cases implicitely, that this is only possible on very small fields. It was already

62
shown in section 1.1.4. that this supposition is not correct. In agreement herewith, it will be shown in the second part of this chapter that there are large fields for which the relation between transpiration and production of the plantcover is the same as in containers.
Under conditions in which water is limiting, only a small part of the energy can be used to vaporize water. Therefore the relation between transpiration and production under these circumstances is not likely to be affected by the horizontal extension of the vegetative surface.
In the Netherlands and regions with a similar climate, the relation between transpiration and production appears to be independent of the evaporation of a free water surface. On the other hand, it is well known that the transpiration of field crops in the Netherlands is closely related with free water evaporation under conditions when water is not limiting. Consequently, the yield under these circumstances will be positively correlated with the free water evaporation. The obvious explanation of this positive correlation is of course that the assimilation rate of crop surfaces depends on the radiation intensity in climates with a small percentage of bright sunshine. (section 1.2.6.).
However, during sunny years, rainfall is small and water is likely to be limiting on many soils. Actual yields are therefore likely to be lower than possible yields under conditions water is not limiting. In other words: In the Netherlands, production may be low because of light shortage during wet years and low because of water shortage during dry years.
3.1.5. The distribution of water during growth
In the above approach no attention is paid to the distribution of water during growth, because the values of m and n depend not or to a small extent on the age of the plant. Periods of severe drought do not affect the relation between transpiration and production, provided the dry matter of the wilted parts of the plant is also harvested, because assimilation and transpiration are both negligible during such periods.
The purpose of farming in dry regions is to obtain a quantity of marketable products which is as large as the available amount of water permits. To meet this purpose it is necessary to cultivate the crops in such a way that all the available water is just exhausted at the time of harvest. If there is still water available at the time of harvest, the total dry matter production is lower than possible. If the water is consumed before ripening, no marketable product is obtained, except for crops which are grown for fodder.
Permanent wilting of plants results always in a loss of leaves and effects, therefore, adversely the ratio between the amount of marketable products (i.e. seeds) and the total dry matter production. Moreover, it may be that after a period of drought not enough leaves are left to make use of the water, which becomes available after this period.
As a consequence, the distribution of water during growth must be such that no permanent wilting occurs. Whether such a distribution is possible or not depends on the amount of available water, the possibilities to distribute this water regularly over

63
the growing period and not in the least on the ability of the plant to withstand periods of drought. The ability to withstand periods of drought, which may be called drought resistance, is not related to the values of m and n. For instance, the value of n for sugar beets is very high, but permanent wilting of leaves may occur already during a short period of drought. On the other hand, a crop like alfalfa appears to be suitable for cultivation in dry regions, in spite of the low value of m.
3.2. FIELD EXPERIMENTS IN THE WEST OF THE UNITED STATES OF AMERICA
3.2.1. The value of m for alfalfa
In the pot experiments of figure 24 c, transpiration and production values of alfalfa were derived from one or more cuts throughout the growing season. Eo was the average evaporation of a free water surface from May up to September; the value of m proved to be 5.5 (g dry matter mm) (kg water day)-1. The scattering of the points around the straight line in figure 24c indicates that the relation between P and W E-1 is stochastic, that is, to a limited extent dependent on environmental factors, which are so numerous that an analysis of separate effects is not practical.
The scattering of the points is larger with alfalfa than with sorghum or wheat (figure 24). One of the reasons is that E0 is averaged over the whole growing season, whereas- as may be judged from the yields of different cuts- the production rate is not constant from April to September. If E0 is weighted according to production rate, the scattering is less and the value of m is about 10 percent higher. Weighting is, however, a subjective procedure, since relevant data are not reported in detail. Another reason for scattering is, that a certain amount of dry matter is stored in the roots in the autumn, which is used for leaf formation in spring (compare DILLMAN,
1931). It must also be taken in account that alfalfa is grown in some years up to the early blossoming stage and in others up to seed formation (compare section 2.3.3.).
It is unpractical to take these factors in account when results of field experiments are compared because the growing stage at time of cutting, the age of the alfalfa sod and the production rate throughout the growing season is generally not reported. For the same reason the effect of the variety on the value of m which may amount to about 10 percent, is not considered.
Therefore, throughout this chapter, the m-value of alfalfa is supposed to be 5.5 (g dry matter mm) (kg water day)-1 or 55 kg dry matter ha-l day-1. With the water content of alfalfa hay being about 15 percent at time of weighing, this amounts to 63 kg hay ha-l day-1 or, in units used in U.S.A., 0.026 tons hay acre-1 day-1.
3.2.2. The treatment of field experiments
The relation between the quantity of water applied and crop yield is usually determined by selecting a tract of land having a uniform soil and on which crops can be grown without deriving any part of their water supply from seepage or a high water table. This tract is divided in subplots, in general a fraction of an acre (some tenth of a hectare) and the surface of each subplot is prer.ared in such a way that it

64
can be irrigated with a measurable quantity of irrigation water so that surface waste or runoff can not take place.
Even under the most ideal conditions, the relation between the applied amount of water and yield is not the same as between the transpired amount of water and yield, because water may be obtained from rainfall and soil, as well as lost by direct evaporation and deep percolation. For crops with a short growing period, quantities of water obtained from rain and out of the soil or lost by evaporation and deep percolation are in general appreciable compared with the amounts of irrigation water applied. Therefore, irrigation experiments with these crops are not very suitable to obtain detailed information on the relation between transpiration and production.
Difficulties with alfalfa are less, because this crop is on the field during several years, covers the soil more or less completely, and grows throughout the whole season. Direct evaporation losses are negligible because evaporation, if occurring at all, reduces the transpiration of the closed plant cover. Deep percolation is not likely to occur, since alfalfa may root down to a depth of four meters. On the other hand, the groundwater table has to be more than four meters below the soil surface to be sure that no water is obtained from this source.
Since the amount of water obtained from rain and soil is generally not very well known, it is convenient to compare yield increases with applied quantities of water, under the assumption that under condition of water shortage the applied amounts of irrigation water are transpired. This will be done in graphs with hay yields along the vertical axis and the amount of irrigation water in days along the horizontal axis, that is the quantity of water in mm (inches) divided by E0 in mm day-1 (inches day-1). Subsequently, a straight line with a slope 0.026 tons acre-1 day-1 is drawn through the observation representing the lowest application. If the observations at higher applications are found on this line, it may be supposed that the value of m is the same in the containers as in the field. If the points are not on this line, this supposition is not correct, or extra water is obtained from other sources, or water is lost by deep percolation or stored in the soil.
Lacking better data E0 estimates are obtained from HoRTON's (1943) evaporation map of the United States, by multiplying his Class A pan figures for May to October, inclusive, with the costumary panfactor of 0. 70. This estimate is checked by means of BLANEY and CRIDDLE's (1950) F-factor (e.g. lSRAELSEN, 1953). The treatment of experimental data is such that conclusions do not change materially if estimates of E0
vary about 0.5 mm day-1 on either side. It is useless to aim at a great accuracy since next to nothing is known about the production rate throughout the growing season.
3.2.3. The results of irrigation experiments
The results of an experiment in Logan (Utah), averaged over 1916-1920 (HARRIS and PITTMAN, 1921) are given in figure 37 a. The soil was a uniform loam, subplots were about 0.2 hectare and E0 was about 4.5 mm day -1. At the lower applications the observations are arranged around the straight line with a slope of 0.026 tons acre-1 day-1.
The production level is apparently 4.3 tons per acre. The amount of water necessary
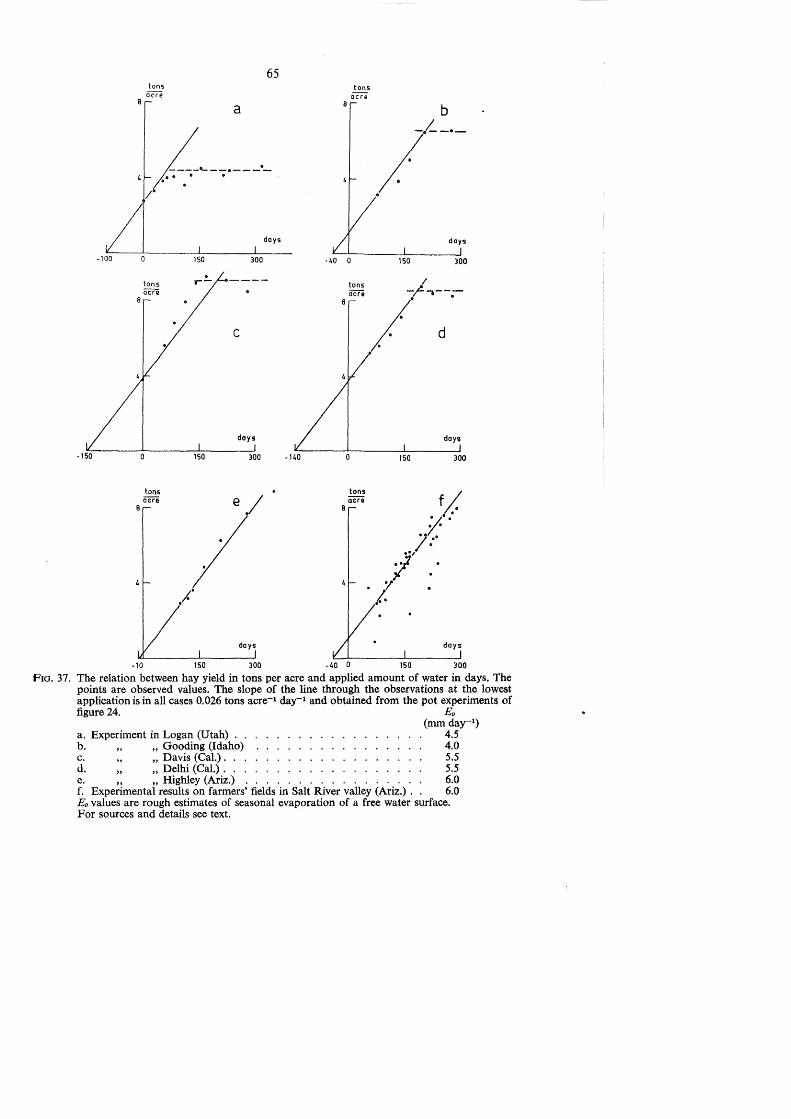
-100
tons acre
a
65
4 /.-~--;·---·-;-
tons acre
8
. . -days
c
days
tons acre
tons iiC'i"i
8
300
150 300
-10 150 300 • 40 0 150 300
F1o. 37. The relation between hay yield in tons per acre and applied amount of water in days. The points are observed values. The slope of the line through the observations at the lowest application is in all cases 0.026 tons acre-1 day-1 and obtained from the pot experiments of figure 24. Eo
(mm day-1)
a. Experiment in Logan (Utah) . . 4.5 b. , Gooding (Idaho) 4.0 c. , Davis (Cal.) . . . 5.5 d. , , Delhi (Cal.) . . . 5.5 e. , , Highley (Ariz.) . . . . . . . . . . . . . . . 6.0 f. Experimental results on farmers' fields in Salt River valley (Ariz.) . 6.0 Eo values are rough estimates of seasonal evaporation of a free water surface. For sources and details see text.

66
to produce the initial yield of 2.6 tons per acre is found at the intersection of the calculated line and the horizontal axis, and is 100 days or 100 X 4.5 = 450 mm. Average yearly rainfall in Logan is 460 mm or 102 days. The difference of 2 days is so small that it is safe to conclude that practica11y all of the rain was used for production. Thi~ is reasonable, since a yearly rainfall of 460 mm can be stored within reach of alfalfa roots. The minimum amount of water necessary to produce a yield of 4.3 tons acre 1 is I 00 -7- 65 -- 165 days. The length of the growing season in Logan is 160 days, so that optimum transpiration about equals free water evaporation. On plots which received more than 160 days of water from rain and irrigation, water is in excess and is probably partly stored in the soil or lost by deep percolation.
The results of an experiment in Gooding (Idaho) averaged over 1910-1916 (FoRTilR, 1925) are given in figure 37 b. The soil was a medium clay loam with a clay subsoil, underlain by rock at a depth of 8 to 12 feet, subplots were less than 0.5 hectare and E0 was about 4.0 mm day-1.
Except for the highest application, observations are arranged around the calculated line. The production level is about 6.5 tons per acre and the amount of water obtained from other sources than irrigation is 40 days or about the same as the average yearly rainfall of about 57 days. The minimum amount of water necessary to produce a yield of 6.5 tons per acre is 200 + 40 = 240 days. Since the length of the growing season is 150 days, actual transpiration should be about 240/150 = 1.6 times the evaporation from a free water surface, unless water is lost by deep percolation or as surface waste. Surface waste did not occur. Loss of water by deep percolation is unlikely because of the type of soil and because a straight line relationship was found between production and applied amounts of irrigation water. It seems justified,. therefore, to conclude that the actual transpiration was considerably higher than free water evaporation and that fields of half an hectare are so small that a considerable amount of heat is obtained by advection.
The results of an experiment in Davis (Cal.) averaged over 1910-1915 (ADAMS and others, 1917) are given in figure 37 c. The soil was a fine sandy loam, the plots were about one tenth of an hectare and £ 0 was about 5.5. mm day-1.
Except for the highest applications, points are found above the straight line with a slope of 0.026 tons acre-1 day-1 through the observation with the lowest application. The amount of water necessary to produce the initial yield of 3.9 tons per acre should have been 150 days, whereas yearly rainfall was only 430 mm or 80 days. The conclusion is that either the interpretation is false or water is obtained from a source other than rainfall and irrigation.
The report of ADAMS and others ( 1917) does not give any clue. BECKET and HUBERTY
( 1928), also discussing the experiments at Davis mention, however, that at no time during the investigation was the groundwater above 4.25 meters from the surface. This means probably that at some time groundwater level was at 4.25 meters and the capillary water on this fine sandy loam down to about 4 meters from the surface and in reach of alfalfa roots, which may penetrate four meters deep.
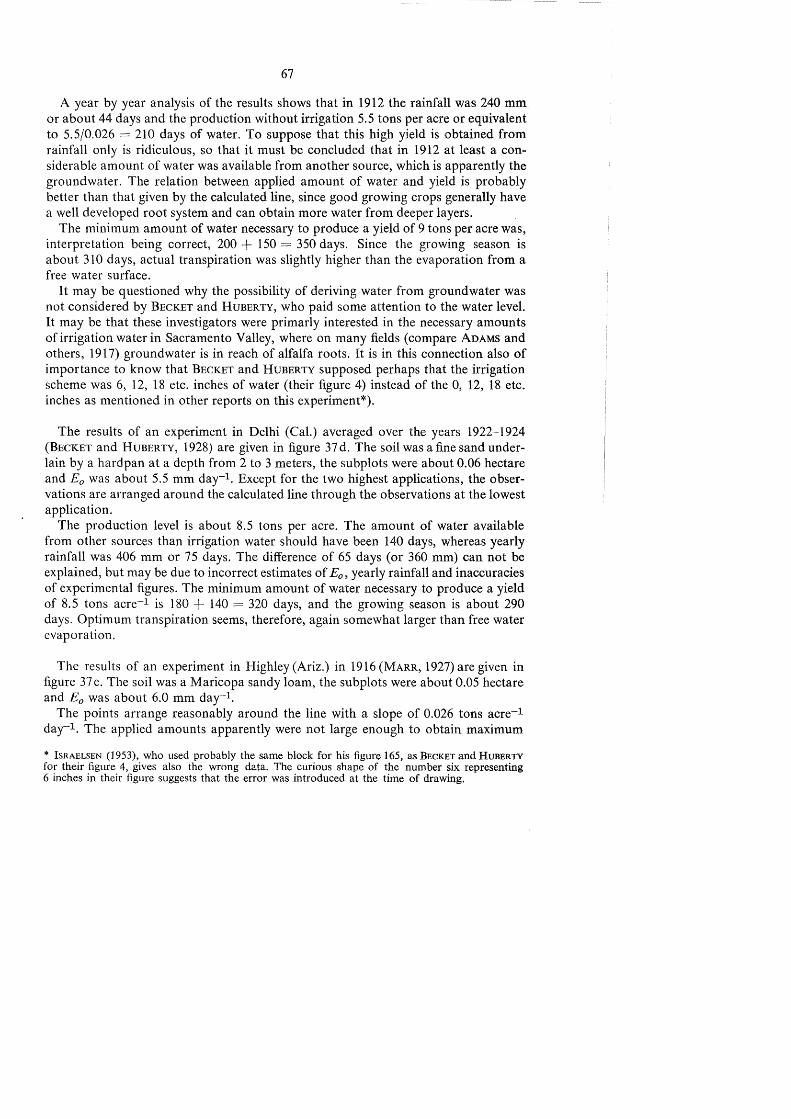
67
A year by year analysis of the results shows that in 1912 the rainfall was 240 mm or about 44 days and the production without irrigation 5.5 tons per acre or equivalent to 5.5/0.026 = 210 days of water. To suppose that this high yield is obtained from rainfall only is ridiculous, so that it must be concluded that in 1912 at least a considerable amount of water was available from another source, which is apparently the groundwater. The relation between applied amount of water and yield is probably better than that given by the calculated line, since good growing crops generally have a well developed root system and can obtain more water from deeper layers.
The minimum amount of water necessary to produce a yield of 9 tons per acre was, interpretation being correct, 200 + 150 = 350 days. Since the growing season is about 310 days, actual transpiration was slightly higher than the evaporation from a free water surface.
It may be questioned why the possibility of deriving water from groundwater was not considered by BECKET and HUBERTY, who paid some attention to the water level. It may be that these investigators were primarly interested in the necessary amounts of irrigation water in Sacramento Valley, where on many fields (compare ADAMS and others, 1917) groundwater is in reach of alfalfa roots. It is in this connection also of importance to know that BECKET and HUBERTY supposed perhaps that the irrigation scheme was 6, 12, 18 etc. inches of water (their figure 4) instead of the 0, 12, 18 etc. inches as mentioned in other reports on this experiment*).
The results of an experiment in Delhi (Cal.) averaged over the years 1922-1924 (BECKET and HuBERTY, 1928) are given in figure 37 d. The soil was a fine sand underlain by a hardpan at a depth from 2 to 3 meters, the subplots were about 0.06 hectare and E0 was about 5.5 mm day-1. Except for the two highest applications, the observations are arranged around the calculated line through the observations at the lowest application.
The production level is about 8.5 tons per acre. The amount of water available from other sources than irrigation water should have been 140 days, whereas yearly rainfall was 406 mm or 75 days. The difference of 65 days (or 360 mm) can not be explained, but may be due to incorrect estimates of Eo, yearly rainfall and inaccuracies of experimental figures. The minimum amount of water necessary to produce a yield of 8.5 tons acre-1 is 180 + 140 = 320 days, and the growing season is about 290 days. Optimum transpiration seems, therefore, again somewhat larger than free water evaporation.
The results of an experiment in Highley (Ariz.) in 1916 (MARR, 1927) are given in figure 37 e. The soil was a Maricopa sandy loam, the subplots were about 0.05 hectare and E0 was about 6.0 mm day-1.
The points arrange reasonably around the line with a slope of 0.026 tons acre-1 day-1. The applied amounts apparently were not large enough to obtain maximum
* lsRAELSEN (1953), who used probably the same block for his figure 165, as BECKET and HuBERTY for their figure 4, gives also the wrong data. The curious shape of the number six representing 6 inches in their figure suggests that the error was introduced at the time of drawing.

68
production. The amount of water available from other sources should be about 10 days, whereas yearly rainfall was 175 mm or 29 days. The difference is of no importance. Maximum transpiration in this experiment was about 300 + 10 = 310 days and the growing season in Highley is about 260 days. Transpiration was, therefore, a little higher than the evaporation from a free water surface.
Other similar experiments are not discussed here, because they do not add more information, nor do they present difficulties not encountered in the above experiments. These five experiments were all done on relatively small experimental plots. From the agreement between measured and calculated slope, it may be concluded that these experimental plots of half an hectare or less obtained considerable amounts of heat by advection.
MARR (1927) reports results obtained in the years 1913-1915 on 38 farmers' fields of 7 to 60 hectare on Maricopa sandy loam in the Salt River valley (around Highley) in Arizona. Alfalfa yields were obtained by stack measurements and applied amounts of irrigation water by means of self recording CIPOLETTI weirs. Surface waste was excluded where possible, or deducted from applied amounts. On this Maricopa sandy loam groundwater was not within reach of the alfalfa roots on probably all 38 fields. The results are given in figure 37f. It is again supposed that E0 = 6.0 mm day-1. Rainfall was 250 mm or about 40 days. A fixed point is obtained by supposing that all the rain was used for production. Consequently, the line with a slope of0.026 tons acre-1 day-1, is drawn through the point - 40 days on the horizontal axis. Taking into account the diversity of experimental conditions, there is a good agreement between the calculated line and the observations. The few observations far below the calculated line were possibly obtained on infertile soil and need no attention.
The other observations agree reasonably well with the calculated line, suggesting that even fields of ten hectares or more obtain so much heat by advection in this arid climate, that the value of m is the same as in containers. However, the assumption must be taken into account that neither rain nor irrigation water was lost. This assumption may be doubted for farmers' fields. It may be possible, therefore, that utilization of water on these large fields was somewhat better than the figure suggests. The experimental results are, however, too inaccurate to permit definite conclusions.
3.3. FIELD EXPERIMENTS WITH KUBANKA WHEAT IN THE GREAT PLAINS OF THE UNITED STATES OF AMERICA
3.3.0. Introduction
In the Great Plains of the United States, rainfall is scarce and in regions where irrigation is not practiced, yields depend to a large extent on the amount of water conserved for crop growth. Spring wheat is widely grown and a large number of experiments have been conducted to establish cultivation practices which conserve as much water as possible. The results of many of these are summarized in an article by CoMPTON (1943) and in several handbooks.
It will be shown in this chapter that reasonable estimates of dry matter yields of

69
spring wheat can be obtained by using the approach suggested in section 3.1. The accuracy of these estimates depends to a large extent on the accuracy with which free water evaporation, available water from soil and rain, direct evaporation from soil, and the production level under conditions where water is not limiting are estimated.
The relation between total dry matter production and seed yield, which depends to a large extent on the availability of water during the growing period, will be discussed also.
3.3.1. The results offield experiments
COLE and MATHEWS (1923) give a very useful summary of the experiments with Kubanka spring wheat conducted by the Office of Dry-Land Agriculture Investigations. K ubanka wheat was cultivated on experimental plots in different years and places; grain plus straw yields and amounts of water obtained from rain and soil were determined.
As an example, the results obtained in North Platte (Nebr.) are given in the first six columns of table 13. The amount of water obtained from the soil - s - was determined by soil sampling at sowing and harvesting time and the amount of rain - r -during the growing period by means of standard rain gauges. The sum of both is equal to the amount of water lost by evaporation from the soil and transpiration, provided runoff and deep percolation during crop growth is negligible. Except on one field (see later), this is supposed to be the case on these selected plats.
TABLE 13. The yield of Kubanka wheat, the amount of water obtained from soil-s- and rain- r -, and the evaporation from a free water surface - Eo - on an experimental plot in North Platte (Nebr.). Data from COLE and MATHEWS (1923) and HORTON (1921).
I Grain+ \ Grain I Eo s+ r !s+r_15
Year lstraw yield, yield s ,. s+,. inches Eo lbs. bushels inches inches inches Eo
! acre I acre day days days
i
1908 3280 22.7 1.74 12.96 I 14.70 0.207 71 56 1909 4440 23.0 3.24 13.56 16.80 0.210 80 65 1910 1410 6.8 3.16 4.59 7.75 0.296 26 11 1911 0 0 -0.08 1.55 1.47 0.336 4 1912 2560 12.8 5.74 3.32 9.06 0.25 1) 36 21 1914 1960 6.0 3.57 5.60 9.17 0.288 32 17 1915 3670 22.7 -1.66 18.12 16.46 0.190 87 72 1916 3470 17.2 3.26 6.72 9.98 0.271 37 22 1917 1540 4.2 3.35 6.35 9.70 0.282 34 19 1919 4300 15.5 3.56 10.66 14.22 0.256 56 41
1) Estimated from temperature.
To estimate the transpiration in days, the value of E 0 during June and July must be known (section 2.1.1.1.). COLE and MATHEWS do not report E 0 -values, but HoRTON
(1921) gives monthly evaporation rates from the "BPI sunken pan" for several localities; this type of pan was also used by BRIGGS, SHANTZ, PIEMIESEL and DILL·

70
MAN. E0 -estimates for places and years concerned are obtained by multiplying HoRTON's June-July average with the panfactor 0.92 (section 2.1.1.1.). These estimates are given in column seven. The value of the quotient (s + r)£0 -1 (in days) is presented in column eight. This is an estimate of the amount of water lost by direct evaporation and transpiration.
Like most investigators, COLE and MATHEWS do not give a separate estimate of direct evaporation from the soil, which is in fact very difficult to make. From experience (DILLMAN, 1931, CoMPTON, 1943), it is known that at ieast 100 mm of water is necessary to secure any yield of seed. The amount of water which is evaporated from the soil is, therefore, less than 100 mm, or with E0 equal to 5 mm day-1, less than 20 days. A crude but not unreasonable estimate is 15 days, which must suffice for the moment. In the column nine of table 13 the estimates of actual transpiration, obtained by substracting these fifteen days from the figures in column eight, are given. It follows from the accuracy of the physical parameters used that estimated and actual transpiration may differ about lO days or 50 mm (2 inches).
The yield given in the second and the transpiration given in the ninth column are presented in graph a of figure 38. The result of 1911, which does not establish any definite point is not entered.
The value of m for Kubanka wheat is 115 kg dry matter ha-l day-1 or 103 lbs acre-1 day-1. Since the weight of the unharvested stubble is partly offset by the difference in weight between airdry and ovendry material, it is assumed that the value of m is also 103lbs straw plus seed ha-l day-1. This ratio between transpiration and production is presented in the figure by the straight line through the origin.
Observations below 45 days transpiration are scattered around this calculated line. The three years that transpiration was higher than 55 days, actual yields were much lower than suggested by the calculated line. Apparently, water was not limiting in these years. The production level of this field was at that time about 4000 lbs seed plus straw per acre. It is not surprising that the yields in the years in which water was adequate are not found on the same horizontal line, because there is no reason to suppose that growing conditions (fertility etc.) were exactly the same in different years.
Results in Akron (Colo.), Williston (N. Dak.), Dickinson (N. Dak.) and Mandan (N. Dak.) are given in figure 38 b, c, d and e. It is assumed for all these experiments that losses due to direct evaporation are 15 days. The observations with a transpiration larger than 50, 40, 60 and 50 days suggest a production level of 3750, 3400 (?), 3500 and 3750 lbs. seed plus straw per acre, respectively.
graph in average Eo (mm day- 1)
a North Platte (Nebr.) 6.6 b Akron (Colo.) 6.3 c Williston (N. Dak.) 5. 7 d Dickinson (N.Dak.) 5.3 e Mandan (N. Dak.) 5.4 f Edgeley (N. Dak.) 4.6
The observations in the years, water is limiting yield are summarized in graph g.

t.OOO
4000
2000
lbs acre
lbs acre
6000
J.OOO
2000
20
I I
I I
I
l/1·
1.0 60
I I
I I
I I
f
80
71
4000
2000
t? ~ - acre • 6000
4000
2000
days
I
20 40
• I I
I ~~ .. . ;· I
I
I I
--.--1--.---?
20 40 60
60 80
g
20 40 60 80 100 20 40 60 80
FIG. 38. The relation between transpiration in days and seed plus straw production in lbs. per acre of Kubanka wheat. The observations are compiled from CoLE and MATHEws (1923). The slope of the line through the origin is 103 lbs. acre-1 day-1 and obtained from the pot experiments of figure 24. The horizontal line presents the estimated production level of the soil. (cont. on page 70}

72
The results of ten years experiments in Edgeley (N. Dak.) are given in figure 38f. The dotted line presents the relation between transpiration and production under the supposition that 15 days of water were lost by direct evaporation. The observation suggest an average line parallel to this calculated line, but 15 days to the right. An additional loss of about 15 days water occurred on this field. COLE and MATHEWS noticed this waste of water and suggested that it may be associated with the soil profile, which was only 60 em deep. It is quite likely that the supposition of runoff (either along the surface or at 60 em) being negligible is not valid on this shallow soil. The observation at a transpiration of 95-15 = 80 days suggests that the production level is above 6000 lbs. seed plus straw per acre; observations under conditions water was adequate are too few to be conclusive.
Other results of CoLE and MATHEWS are in agreement with the results given here but are not discussed because they concern places for which HORTON does not give £ 0 -values, or observations over a period of less than five years.
A good impression of the scattering of the observations may be obtained from figure 38 g, in which all observations of figure 38 a-fin years of water shortage are presented in one graph together with the calculated line with a slope of 103 lbs. acre-1 day-1. The magnitude of deviations which may be due to inaccurate estimates of the actual transpiration is given by the dotted lines, ten days (compare page 70) to the left and to the right of the calculated line. Most of the points are found between these two lines, which shows that the approach suggested in this paper is not at variance with the experimental results. Assuming that the deviations are mainly due to inaccurate estimates of transpiration, it is justified to average the experimental results. The median averages of eight successive points are presented in the figure by the open circles. From the presence of these circles near the calcutated line, it may be concluded that on the average calculated and experimental yields are practically the same, provided water is limiting.
For practical applications, it is necessary to estimate the amount of water available for transpiration, expressed in days, by means of available soil moisture determinations, rainfall data, estimates of E0 and evaporation from soil. Based on the considerations in the preceding chapters and on the knowledge that the above-mentioned physical parameters are hard to determine, is the author's opinion that errors, due to the assumption that the value of m is a constant in these arid regions are not large compared with errors resulting from inaccurate or biassed estimates of the above-mentioned physical parameters.
3.3.2. The distribution of water during growth
3.3.2.1. Seed production of wheat in containers. In the experiments of BRIGGS, SHANTZ, PIEMIESEL and DILLMAN (figure 24 b), both, total dry matter and seed yields were determined. The ratio between these two is presented in figure 39. The dots are for Kubanka wheat, a Triticum durum variety and the circles for Galgalos wheat a T. vulgare variety of spring wheat. The ratio appears to be 0.36. The large difference in yield proves that growing conditions were markedly different in different years
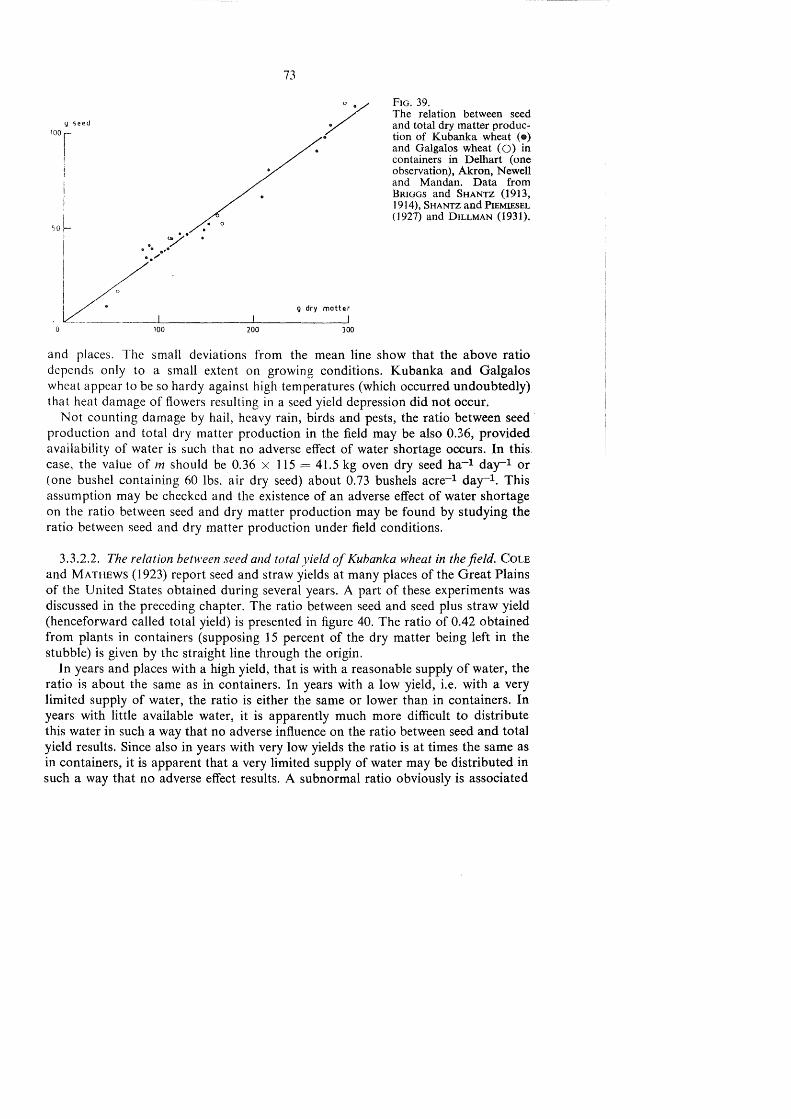
g seed 100
~0 ~ I
• 0 . . ~· . ... -·
73
/
~·'~----------~-----g-d-ry_m_o_tt~er 100 200 300
FIG. 39. The relation between seed and total dry matter production of Kubanka wheat ( •) and Galgalos wheat ( 0) in containers in Delhart (one observation), Akron, Newell and Mandan. Data from BRIGGS and SHANTZ (1913, 1914), SHANTZ and PIEMIESEL (1927) and DILLMAN (1931).
and places. The small deviations from the mean line show that the above ratio depends only to a small extent on growing conditions. Kubanka and Galgalos wheat appear to be so hardy against high temperatures (which occurred undoubtedly) that heat damage of flowers resulting in a seed yield depression did not occur.
Not counting damage by hail, heavy rain, birds and pests, the ratio between seed· production and total dry matter production in the field may be also 0.36, provided availability of water is such that no adverse effect of water shortage occurs. In this. case, the value of m should be 0.36 x 115 = 41.5 kg oven dry seed ha-l day-1 or (one bushel containing 60 lbs. air dry seed) about 0.73 bushels acre-1 day-1. This assumption may be checked and the existence of an adverse effect of water shortage on the ratio between seed and dry matter production may be found by studying the ratio between seed and dry matter production under field conditions.
3.3.2.2. The relation between seed and total yield of Kubanka wheat in the field. CoLE and MATHEWS (1923) report seed and straw yields at many places of the Great Plains of the United States obtained during several years. A part of these experiments was discussed in the preceding chapter. The ratio between seed and seed plus straw yield (henceforward called total yield) is presented in figure 40. The ratio of 0.42 obtained from plants in containers (supposing 15 percent of the dry matter being left in the stubble) is given by the straight line through the origin.
In years and places with a high yield, that is with a reasonable supply of water, the ratio is about the same as in containers. In years with a low yield, i.e. with a very limited supply of water, the ratio is either the same or lower than in containers. In years with little available water, it is apparently much more difficult to distribute this water in such a way that no adverse influence on the ratio between seed and tota) yield results. Since also in years with very low yields the ratio is at times the same as in containers, it is apparent that a very limited supply of water may be distributed in such a way that no adverse effect results. A subnormal ratio obviously is associated

4000
3000
2000
1000
l bs seed acre
/ "/
/ )<
•"" I '·. / : -~= : /,,/'' . . /;/,.
•• /. o;,."l<
~.A X
.~// :f /~·. :. ,_. •• Jl .... v .. )( ..
2000 4000
74
? ... )< ,
6000 8000
l bs seed plus straw acre
10.000
F1u. 40. The relation between seed and seed plus straw yield (total yield) in several places of the Great Plains of U.S.A. in several years. The straight line through the origin presents the same ratio as in containers, but corrected for the stubble (figure 39); the broken curve gives the average ratio under conditions, covered by these experiments. Data from CoLE and MATHEWS (1923). The mark -J- presents the same ratio for Juliana winterwheat in Holland (VAN DoD-BEN, 1949).
1
with damage of leaves, flowers or ears due to drought. If this damage is called permanent wilting, the following conclusion can suffice:
A ratio of about 0.42 may be obtained in the field under conditions of water shortage, provided the limited amount of water is made available in such a way that no permanent wilting occurs, especially during later stages.
If cultivation methods are such that a large portion of the available water is transpired during the first half of the growing season, a large yield of leaves and stalks may be obtained but seed yields are low. In dry regions where late rains may fail to come, it is wise to save a good portion of the water for consumption in these later stages of plant growth. The best way to save water is to avoid luxuriant growth during the first part of the growing period. This is often done in practice by planting the crop in wide rows. In this case, soil and rain water between the rows come gradually available during the whole growing period. Early growth depends to a large extent on the availability of nutrients. In dry regions it is a good practice to avoid the use of fertilizers as much as possible or to supply only a small amount in the seed rows to establish the plants (compare DE WIT, 1953). Of course, early growth may be so slow that the small plants can not consume all the available water in later

1,0
0,5
0
mulbplt co t10n foetor
20
75
days
40 60
FIG. 41. Seed yields of Kubanka wheat calculated with am-value of 0.73 bushels acre-1 day-1
are to be multiplied with the multiplication factor in this figure to obtain an estimate of average seed yields. This figure is calculated from the lines in figure 40.
stages. A good knowledge of local conditions is needed to use the soil water wisely. Therefore, theoretical considerations can never replace practical experience.
There are conditions under which it is practically impossible to distribute the available amount of water in such a way that permanent wilting of leaves or ears is avoided. This is probably the case on the field in Edgeley (N. Dak.) (compare figure 38f), where the soil is only 60 em deep. The ratio between seed and total yield on this field is given by the crosses in figure 40. In practically all the dry years, the ratio is very low, which is probably due to the exhaustion of most of the water available in the shallow soil during the first part of the growing period.
The average relation between seed and total yield of Kubanka wheat in the Great Plains is given by the dotted line in figure 40. At a yield of 2000 lbs. seed plus straw per acre, obtained with an actual transpiration of 22 days, the ratio between average and calculated seed yield appears to be 0. 70. Yields calculated with an m-value of 41.5 ovendry seed ha-l day-1 or about 0.73 bushels acre-1 day-1 must be multiplied by 0. 70 to obtain an average estimate of actual seed yield at this transpiration value. On soils with a large amount of available water or in years with sufficient late rains, the factor is closer to one. On soils with a low amount of available water or in years without late rains it is closer to zero. A reasonable impression of possible variations in individual cases is obtained in the figure. The relation between this multiplication factor and the actual transpiration in days is presented in figure 41, which is calculated from the lines in figure 40. The multiplication factor decreases rapidly with decreasing transpiration. This reflects the difficulty of obtaining a reasonable distribution under conditions where water is limiting. The numerical value of the multiplication factor depends not only on soil and weather conditions and the skill of the farmer, but also on the drought resistance of the plant species and the variety.
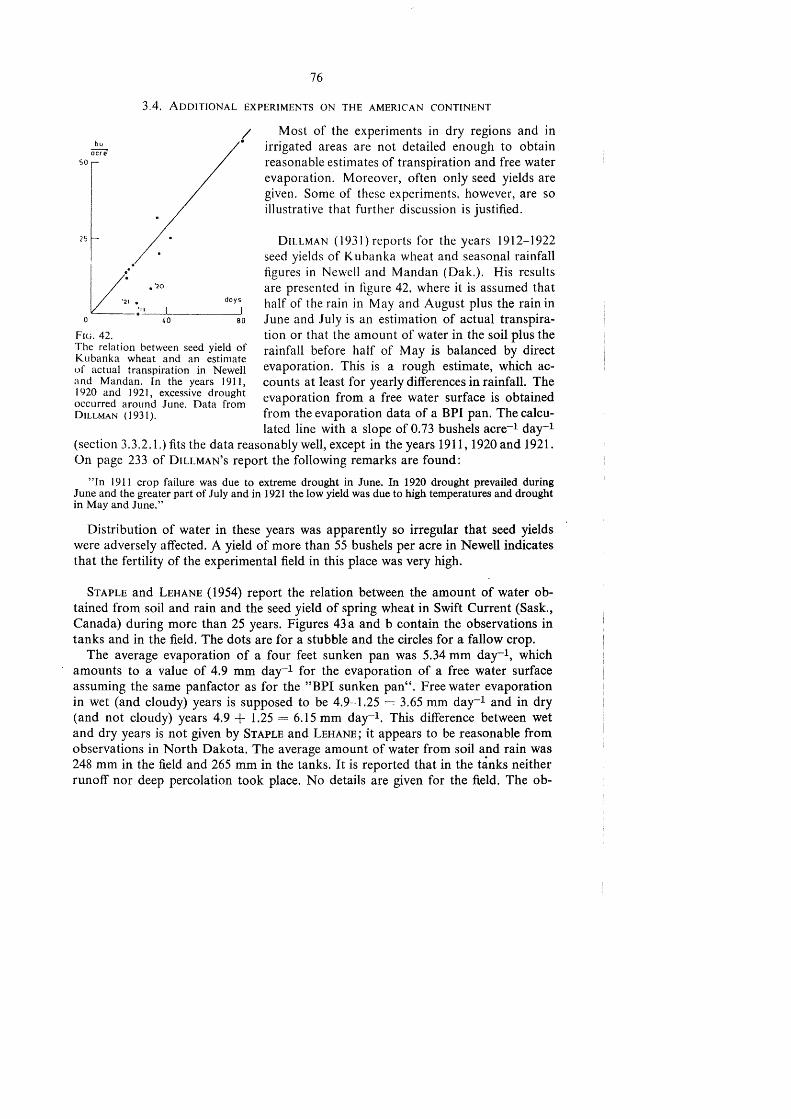
bu CiCr"e
50
25
FIG. 42.
76
3.4. ADDITIONAL EXPERIMENTS ON THE AMERICAN CONTINENT
! Most of the experiments in dry regions and in irrigated areas are not detailed enough to obtain reasonable estimates of transpiration and free water evaporation. Moreover, often only seed yields are given. Some of these experiments, however, are so illustrative that further discussion is justified.
DILLMAN (1931) reports for the years 1912-1922 seed yields of Kubanka wheat and seasonal rainfall
/ figures in Newell and Mandan (Oak.). His results • • '20 are presented in figure 42, where it is assumed that 2 ' • days half of the rain in May and August plus the rain in -~'-' ~-'-4o ____ ____,so June and July is an estimation of actual transpira-
The relation between seed yield of Kubanka wheat and an estimate uf actual transpiration in Newell and Mandan. ln the years 1911, 1920 and 1921, excessive drought occurred around June. Data from DILLMAN (1931).
tion or that the amount of water in the soil plus the rainfall before half of May is balanced by direct evaporation. This is a rough estimate, which accounts at least for yearly differences in rainfall. The evaporation from a free water surface is obtained from the evaporation data of a BPI pan. The calculated line with a slope of 0.73 bushels acre-1 day-1
(section 3.3.2.1.) fits the data reasonably well, except in the years 1911, 1920 and 1921. On page 233 of DILLMAN's report the following remarks are found:
"In 1911 crop failure was due to extreme drought in June. In 1920 drought prevailed during June and the greater part of July and in 1921 the low yield was due to high temperatures and drought in May and June."
Distribution of water in these years was apparently so irregular that seed yields were adversely affected. A yield of more than 55 bushels per acre in Newell indicates that the fertility of the experimental field in this place was very high.
STAPLE and LEHANE (1954) report the relation between the amount of water obtained from soil and rain and the seed yield of spring wheat in Swift Current (Sask., Canada) during more than 25 years. Figures 43 a and b contain the observations in tanks and in the field. The dots are for a stubble and the circles for a fallow crop.
The average evaporation of a four feet sunken pan was 5.34 mm day-1, which amounts to a value of 4.9 mm day-1 for the evaporation of a free water surface assuming the same panfactor as for the "BPI sunken pan". Free water evaporation in wet (and cloudy) years is supposed to be 4.9-1.25 = 3.65 mm day-1 and in dry (and not cloudy) years 4.9 + 1.25 = 6.15 mm day-1. This difference between wet and dry years is not given by STAPLE and LEHANE; it appears to be reasonable from observations in North Dakota. The average amount of water from soil and rain was 248 mm in the field and 265 mm in the tanks. It is reported that in the tanks neither runoff nor deep percolation took place. No details are given for the field. The ob-

bu acre
60 a
40
lO
77
bu
0 060 aero
b
I 300
mm ---, 400
FIG. 43. The relation between amount of water from soil and rain in millimeters (not in days) and seed yield of spring wheat in Swift Current (Sask., Can.) in more than 25 years. Figure a: tank crop Figure b : field crop For details see text. Data from STAPLE and LEHANE (1954).
servations suggest that losses in the field were somewhat higher and that it is reasonable to suppose that losses in the tanks (including evaporation) were around 100 mm and in the field 125 mm. As the wheat variety is not given, it is supposed that the value of m is the same as for Kubanka wheat, which is 0.73 bu acre-1 day-1. These assumptions are sufficient to make at least an estimate of the relation between transpiration and seed production. For years in which soil plus rainwater is 100 mm in the tanks and 125 mm in the fields, yields are negligibly small. Average yields are 0.73 (248-125) 4.9-1 = 18 bu. acre-1 in the field and 0. 73 (265-100) 4.9-1 = 25 bu. acre-1 in the tanks. In wet years field yields are about 0.73 (350-125) 3.65-1 = 45 bu. acre-1 and tank yields 0.73 (350-100) 3.65-1 = 50 bu. acre-1
These yields are presented in the graphs by large circles and joined by a solid line. This line is bent upwards and not straight as in the other figures, because the transpiration is given in mm rather than in days, and years with a high rainfall are years with a low free water evaporation. In years with a low rainfall, the observations in the field are mainly found below the calculated line. This is probably due to an irregular distribution of water. The effect is less in tanks where somewhat more water is available from soil. In other years, observations are arranged around the calculated line. Deviations are probably partly due to the fact that E0 values of individual years could not be taken in account. The observations illustrate that even in wet years water was limiting yield. The dotted line in figure 43 b presents the calculated relationship after applying the multiplication factor of figure 41 ; it fits the experimental data reasonably well.
It was already mentioned that irrigation experiments with crops other than alfalfa are hard to interpret because the estimate of water losses is difficult. However, some ex-

10 000
5000
15.000
10.000
5.000
lbs acre
+.+.+ -+--+
100
78
--·---+
do'ys
200 300
days
200 300
•- alfalfa
x --- oats
+-.-wheat
mo lbs dry matter
acre day
49
84
87
o -· corn ~ 186
FIG. 44. The relation between the amount of water available for transpiration and dry matter yield of wheat , oats, corn and alfalfa on irrigated fields in Logan (Utah). For details see text. Data from WIDSTOE (1912).
periments of WIDSTOE (1912) between 1901 and 1911 in Logan (Utah) are so illustrative that it is worthwhile to consider the results in spite of the aforementioned difficulties.
WIDSTOE reports dry matter yields of several crops obtained with different quantities of irrigation water. Results with alfalfa, corn, wheat and oats are considered here. Apart from the quantities applied, the amounts of water taken up from the soil and obtained from rain are also given. It is assumed here that the sum of these quantities minus 100 mm of unavoidable losses is available for transpiration. As long as water is inadequate, these quantities are actually transpired. At higher applications there is water available in excess which is stored in the soil or lost by deep percolation. The evaporation of a free water surface during the two or three summer months is assumed to be 5.5 mm day-1. This was estimated by means of BLANEY and CRIDDLE's (1950) F-factor. For alfalfa, growing from killing frost to killing frost, E0 is estimated to be 4.5 mm day-1 (compare figure 37 a). The estimates leave much to be desired from the standpoint of accuracy.
The results are presented in figure 44, in which dry matter production is given along the vertical axis and the available amount of water in days along the horizontal. In order not to overload the figure, the results for wheat are given separately. With FORTIER (1925) and on the strength of the results of later experiments on the same farm (given in figure 37 a), an unbelievably high yield of 9094lbs. alfalfa per acre with 118 days of water is omitted.

79
Since crop varieties are not reported, some reasonable estimates for m have been made; these are given in the figure and are the values for Galgalos wheat (section 2.1.2.), Swedish Select oats (from SHANTZ and PIEMIESEL's (1927) data), ADI-E 23 alfalfa (section 2.1.1.3.) and Esperanza corn (section 2.1.2.). Since the m-value for different corn varieties differs considerably, the value used here is probably only approximately correct.
The straight lines through the origin of the graphs present the m-values for the four experimental crops. These lines fit the experimental data at lower applications reasonably well. This result suggests again that the relation between available water and production may be estimated from the m-value and the production level when water is adequate. The utilization of water by corn is better than one should expect from the m-value. As corn uses the water very efficiently, this difference may be due to an incorrect estimate of the amount of water obtained from soil or of the inevitable losses. It is also possible that the m-value is higher than estimated. In case of corn, excessive application of irrigation water caused yield reduction.
FORTIER (1925) reports seed yields of spring wheat obtained with different quantities of irrigation water in Gooding, Idaho, from 1909-1916. It is assumed here that actual transpira-tion in the case of water shortage is equal to
~ acre
40
20
-.
100
......
' \
dciys
200
rainfall and irrigation water and that inevitable losses are balanced by the water in the soil. E 0 is again estimated from BLANEY and CRIDDLE's F-factor and supposed to be 5.5 mm day-1. The results are given in figure 45. 0
The slope of the straight line through the ~~~· ~~iation between amount of water origin is 0.62 bushels acre-1 day-1 and holds available for transpiration in days and the for Galgalos wheat. The production level is seed production of spring wheat in Gooding
(Idaho). For details see text. Data from about 35 bu. per acre. The results show again FoRTIER o925).
that knowledge of the value of m is of primary importance in case of irrigation. Here again, excessive application of irrigation water resulted in a reduction of yield.
3.5. SOME FIELD EXPERIMENTS WITH SMALL GRAINS AND BEETS IN THE NETHERLANDS
A linear relation should exist between dry matter production and transpiration for crops grown in the Netherlands, provided water is a limiting factor (section 3.1.). The number of experiments, suitable to estimate a relation between transpiration and dry matter production is, however, fewer than in arid climates.
Therefore, the experiments on the effect of artificial rain on the yield of different crops, carried out by BAARS (1954, 1954 and 1955) in the south of the Netherlands are of great value*). His experiments on a light reclaimed heath soil which contains in
*) Ir. C. BAARs was so kind to supply data on not published dry matter yields.

200
80
mm
400
1000 kg -halO
mm
200 400
1000 kg 1000 kg
/ c .. .
10 10
mm mm
200 400 1.00
FIG. 46. The relation between amount of water available for transpiration and total yields of oats (fig. a), barley (fig. b), fodder beets (fig. c) and sugar beets (fig. d) grown on light reclaimed heath soil in the Netherlands. The lines present the relation between transpiration and production in containers. Experimental results of BAARS (1954, 1954, 1955) obtained on a soil which contained 50 mm available water in spring.
spring only 50 mm available water are discussed here because on this soil water is likely to be limiting. BAARS' experimental field was 100 x 90 meters and surrounded by arable land, whereas the size of the sub-plots was 10 x 10 meters.
The results of his experiments with oats are presented in figure 46 a. The yield of seed and straw is given along the vertical axis and the amount of water available for transpiration along the horizontal axis. This latter amount is supposed to be equaJ to the rainfall from May up to July, plus, where given, the amount of artificial rain, plus the 50 mm of water which is available in the soil in spring. The rainfall in April is supposed to be lost by direct evaporation. The three lowest values are for plots in 1953, 1954 and 1955, which received no additional water and the three highest values for plots which received 100, 72 and 118 mm of artificial rain in 1953, 1954 and 1955, respectively. The straight line through the origin is the relation between transpiration and production as calculated from experiments in containers (figure 31); the slope of this line is 26 kg ha-l mm-1. The observational points arrange around this calculated line.

81
Similar observations for barley are given in figure 46b. The amount of water available for transpiration is estimated in the same way as for oats. As there is no reason to suppose that as to the relation between transpiration and production, small grains differ much from each other (section 2.2.2.), the same straight line as for oats is given. The observational points arrange again around this calculated line.
The results obtained by BAARS with fodder beets are given in figure 46c. It is supposed that the amount of water available for transpiration was equal to rainfall from June up to September, plus, where given, the artificial rain. The 50 mm of water available in the soil is not taken in account because at the end of the growing season the soil was again practically at :field capacity. The rainfall before June is supposed to be lost by direct evaporation. The yield along the vertical axis is dry matter yield of roots and tops together. The slope of the straight line through the origin is 58 kg ha-l mm-1 and obtained from experiments in containers (section 2.2.1.4). The observational points arrange around the straight line, except for two points. The two observations which are far below the calculated line were obtained in 1953. Of these two the lowest yield is from a field which did not receive artificial rain, and the other from a field which received 135 mm water as artificial rain. Application of water resulted in an increase.: in yield which is not far below the yield increase expected on basis of the experiments in containers. Therefore, the low yield, coni pared with the amount of water available from rain was probably due to percolation losses. There are not sufficient data available to check this point.
The results of an experiment with sugar beets in 1955 are given in figure 46d. The amount of water available for transpiration is calculated in the same way as for fodder beets; the straight line through the origin with a slope of 64 kg ha-l mm-1 is again obtained from experiments in containers (section 2.2.1.4). The observations arrange again around the calculated line.
PENMAN ( 1951) carried out some irrigation experiments in England with sugar beets on a fertile soil. The transpiration ratio was 170, which is equivalent to a n.,j
value of 59 kg ha-1 mm-1. This value is only 10 percent smaller than then-value for sugar beets in containers in the Netherlands.
ScHULTZE and ScHULTZE-GEMEN (1957) calculated the transpiration ratios of crops grown on a permanent fertilizer experiment in Germany. On the well fertilized fields the transpiration ratios of wheat, rye and sugar beets were 408, 353 and 205, respectively, which is equivalent ton-values of 24.5, 28.4 and 48.9 kg dry matter ha-l mm-1. The value for sugar beets is somewhat lower than then-value for this crop in Holland. In spite of this the data illustrate very well the characteristic difference in the n-value for beets on one hand and small grains on the other. The transpiration ratios on their not well fertilized fields were considerably higher, probably because other water losses were considered as transpiration losses.
On large fields with high yields, actual transpiration rates may be lower than the rates calculated with the n-value of the plant species because oflack of energy (compare section 3.1.4.); BAARS (op. cit.) cultivated also small grains on a fertile soil which contained about 130 mm water in spring. The results in 1953, 1954 and 1955 are summarized in figure 47. The amount of water available for transpiration is estimated

1000 ~:
10
26-kg_ ho mm
100
82
X
X
200 300 t
FIG. 47. The relation between the
x /. amount of water available for transpiration and the
• total yield of oats ( •) and barley (X). The arrow indicates free water evaporation from May up to July. The observations at a transpiration rate below 325 mm are for the fields which did not receive additional water. Experimental results of BAARS (1954, 1954, 1955) on a soil which contained at the most 130 mm available water
X
mm I
400
in spring.
in the same way as done in figure 46, except for the soil water which was here at the most 130 rom. Some available water was possibly present in the soil at the time of harvest and plants could not derive moisture from the ground water. Therefore, actual transpiration was certainly not higher than the transpiration, estimated in this way. In spite of this, the observations are to the left of the line with a slope of 26 kg ha-1 mm-1, being then-value for oats.
The experiments were carried out on and surrounded by fields which contained during June and July still considerable amounts of available water (BAARS, 1955). The evaporation and transpiration losses of the surrounding arable lands were therefore also considerable, so that only small amounts of advective energy must have been available for the experimental fields. Since, moreover, the production of these fields was high it is likely that here actual transpiration rates were lower than the rates calculated with the n-value of oats, because of lack of energy (compare section 3.1.4.).
The experiments of figure 46, however, were carried .out on and surrounded by fields which contained practically no available water from June onwards. The evaporation and transpiration losses of the surroundings were therefore low, so that considerable amounts of advective energy must have been available for the experimental fields which covered only a few hectares. The production of these fields was not high, so that sufficient energy was available. It is therefore likely that here (compare again section 3.1.4.), actual transpiration rates were about the same as those calculated with the n-value for oats. ·
The explanation offered here is a tentative one, because it is not proved that the difference between the two experimental :6.elds is due to the different energy relations of the surroundings. Such a proof is difficult without a theoretical reappraisal of the advective terms in the energy balance of crop surface~. Aerodyn~mic processes involved are so complex that such a reappraisal is possible only after specializing on the subject.

83
3.6. TRANSPIRATION DURING GROWTH AND FREE WATER EVAPORATION
The available amount of water must be distributed in such a way that no permanent wilting occurs during the growing period (section 3.1.5.). The relation between transpiration and production depends hardly on the age of the plant (section 2.3.3.). Therefore, the minimum transpiration necessary to obtain the optimum growing rate can be estimated from the growth rate of the plant.
The production rates of a field with oats, grown in western Europe with a total dry matter weight of 5250 kg per ha at the time of harvest are given by HALLIDAY (1948). To obtain an estimate of the production rates of a crop with a dry matter yield of 8000 kg per ha, the rates of HALLIDAY were multiplied with the ratio 8000/5250. The result is given in the first two columns of table 14. The minimum transpiration rates in mm day-1 during growth may be estimated now by dividing these values with 26 kg ha-1 mm-1, being then-value for oats. These transpiration rates, average free water evaporation rates in the Netherlands and the ratios of both are given in the third to fifth column of the table. The calculated transpiration rate is 1.33 times the free water evaporation rate during the period of rapid growth. The total production can be higher than 8000 kg per ha. It is likely that such high productions are only obtained on fields where the period of granp growth is more extended. Therefore, it is assumed that daily production rates of oats do not exceed much the value of about 145 kg ha-l day-1.
TABLE 14. Growth rate- G- of spring sown oats with a total dry matter yield of 8000 kg per ha (after HALLIDAY, 1948), calculated transpiration- W -, average free water evaporation -Eo- in the Netherlands and the ratio WEo- 1•
G w
I
Eo WEo- 1
Month Week kg mm mm -- -
day -
ha day day I
May. 1 4.6 0.2 3.1 0.06 2 7.6 0.3 3.4 0.09 3 17 0.7 3.6 0.19 4 69 2.7 3.8 0.71
June . 1 129 4.9 4.0 1.22 2 129 4.9 4.1 1.20 3 146 5.6 4.2 1.33 4 146 5.6 4.2 1.33
July 1 136 5.2 4.1 1.27 2 129 5.0 4.0 1.25 3 76 2.9 3.9 0.74 4 61 2.3 3.7 0.62
August .. 1 46 1.8 3.5 0.51 2 11 0.4 3.3 0.12
During the periods that the calculated transpiration rates of the 4th column of the table are lower than the free water evaporation rates in the 5th column, these calculated values may be considered correct. The energy necessary to maintain such a transpiration rate is available. During the periods that the calculated rates of column 4 are higher than free water evaporation rates (in table 14 from June 1 to July 15
84
actual transpiration can supposed to be somewhere between the calculated- rate and the free water evaporation rate. On fields, within an area of the order of 1 km2 which is covered with a growing crop surface not lacking water, it is not necessary to supply much more water than indicated by the free water evaportion rate. On fields within a relatively dry area actual transpiration rates may approach the rates calculated with the m- or n-values obtained from experiments in containers; even during periods where these rates are considerably higher than free water evaporation.
It has been shown that this latter situation is frequently met with in arid climates. Especially in humid climates the first situation can occur. It is therefore not possible to calculate under all conditions the minimum amount of water necessarry to obtain a maximum production.
3.7. SUMMARY
The relation between transpiration and total dry matter production of field crops is represented in figures 35 a and b. Figure 35 a holds in climates similar to those in the arid regions of the western United States of America and figure 35b for climates similar to that in the Netherlands, In figure 35 a the transpired amount of water is expressed in days as the ratio between the transpired amount of water and free water evaporation. In figure 35 b the transpired amount of water is expressed in mm.
The slope of the line l in the figures depends only on plant species and is similar to the slope of the relation between production and transpiration of plants grown in containers. The relation between transpiration and production in the field is presented by this line /, provided that yields are only limited by shortage of water. The line p presents the production level of the field under conditions of adequate water supply. Transpiration is generally higher in this region than the transpiration given by the line /. The actual relation between transpiration and production must be something like the relations of curve c or d. It is shown that curves like curve c occur for alfalfa, small grains and corn grown in the western United States and for small grains and beets in the Netherlands.
The minimum amqunt of water necessary to obtain maximum production is given by the intersection of the lines I and p. Where transpiration calculated in this way is lower than free water evaporation, some more water must be given to account for evaporation from the soil and other losses and for the transition zone of curve c. Where transpiration rates calculated in this way are appreciably higher than free water evaporation, evaporation losses are negligible. If moreover fields are large and surrounded by other fields, the advective energy transport may be so low that the energy necessary to maintain this transpiration rate is not available. Under these conditions transpiration should be lower than the transpiration given by the line /. To study this effect quantitatively, a reappraisal of the advective terms of the energy balance is necessary.

LITERATURE
ADAMS, F. and others 1917 Investigations of the economical duty of water for al-falfa in Sacramento Valley, California 1910-1915. State of Cal. Dept. of Engin., Bull. 3.
AsHTON, F. M. 1956 Effects of a series of cycles of alternating low and high soil water contents on the rate· of apparent photosynthesis in sugarcane. Plant Phys. 31, 266-274.
BAARS, C. 1954 De kunstmatige beregening op de droogtegevoelige zandgronden. Landbouwk. Tijdschrift 66, 625-633.
1954 Enige gegevens over de opbrengsten die bij toepassing van kunstmatige beregening op droogte-gevoelige zandgmnden zijn te bereiken en over de hoeveelheden water die daarvoor nodig zijn. Verslag C.I.L.O. over 1954, 132-137.
1956 Verslag over de beregeningsproeven in Noord-Brabant over 1955. C.I.L.O. gestencilde med. No. 5 (1956).
BALLARD, L. A. T. 1933 Effect of nitrate supply on transpiration ratio of plants. The Austr. Journ. of Exp. Biology and Med. Sci. XI, 161-176.
BANGE, G. G. J. 1953 On the quantitative explanation of stomatal transpi-ration. Acta Botanica Neerlandica 2, 256-297.
BECKET, S. H. and M. R. HUBERTY 1928 Irrigation investigations with field crops at Davis and at Delhi, California 1909-1925. Univ.ofCal. Coll.ofAgr.,· Agr. Exp. Sta., Berkeley, Cal. Bull. 450.
BERNARD, E. A. 1956 Le determinisme de !'evaporation dans la nature. Gene-ralites theoriques. INEAC serie Scientifique No. 68.
BLANEY, H. F. and W. D, CRIDDLE • ·1950 Determining water requirements in liTigated areas from climatological and irrigation data. U.S.· Dept. of Agr. Soil Cons. Service, Wash., August 1950.
BoHNIG, R. H. and C. A. BuRNSIDE 1956 The effect of light intensity on apparent photosynthesis in leaves of sun and shade plants. Am. Journ.: of Bot. 43,
. 557-561. BooNSTRA, A. E. H. R. 1934 Physiologisch onderzoek ten dienste van de planten-
. veredeling. Thesis, Utrecht. · ·1939 · Rasverschillen bij bieten III. Med. Inst. voor suiker
bietenteelt 9, 161-287. 1942 Rasverschillen bij bieten VI. Med. Inst. voor suiker
. · bietenteelt 12, 13-96. BRIGGs, L.,J. and H. L. SHA.N'rz 1913 The water requirements of plants. I. Investigations in
the Great Plains in 1910 and 1911. U.S. Dept. Agr. Bur. ofPlant Ind. Bull. 284. .
1913 The water requirements of plants. II. A review of literature. U.S. Dept. Agr. Bur. of Plant Ind. Bull. 285.
1914 Relative water requirements of plants. Journ. of Agr; ·Res.· 3, 1...:.65.
1917 ·A comparison of the hourly evaporation rate of atmometers and free water surfaces with the transpiration rate of Medi9ago savita. Journ. of Agr. Res. 9, 277-292.
CoLE, J. S. and 0. R. M:ATmiws · ·1923 Use of water by spring wheat on the Great Plains. U.S. 'Dept. Agr. Bull. 1004.
COMPTON, L. L. 1942 Moisture conservation practices and the relationship of conserved water to crop yield. Proc. Soil Sci. Soc.
· of Am. 7, 308-373. DILLMAN, A. C. 1931 Water requirement of certain crop plants and weeds in
the Northern Great Plains. Journ. of Agr. Res. 42, 187-238.
DOBBEN, W. H. VAN 1949 Een beschouwing over de hoge tarweopbrengsten van het jaar 1949 in vergelijking met voorgaande jaren. Vers/ag C.l.L.O. over 1949, 80-89.

FORTIER, s.
HARRIS, F. S. and D. W. PITT~AN HAYNES, J. L.
HEINICKE, H. J. and M. B. HOFFMAN
HALLIDAY, D. J.
HORTON, R. E.
- and J. S. CoLE
[SRAELSEN, 0. W. KANITHAR, N. V. and others
KIESSELBACH, T. A.
LAKE HEFFNER
LOUSTALOT, A. J.
LUNDEGARDH, H. MAKKINK, G. F.
MARR, J. C.
MASCHHAUPT, J. G.
MAXIMOV, N. A.
MET. TABLES
MILLER, E. C.
PAAUW, F. VANDER
PENMAN, H. L.
86
1925 Irrigation requirements of the arable lands of the Great Basin. U.S. Dept. of Agr. Bull. 1340.
1921 The irrigation of alfalfa. Utah Agr. Exp. Sta. Bull. 180. 1948 The effect of availability of soil moisture upon vegetative
growth and water use in corn. Journ. Am. Soc. Agron. 40, 385-395.
1933 The rate of photosynthesis of apple leaves under natural conditions. Cornell Un. Agr. Exp. Sta. Bull. 577.
1948 Nutrient uptake by farm crops. Jealott's Hill Res. Sta. Bull. 7.
1921 Results of evaporation observations Monthly Weather Review. 1921. (Oct.) 553-566.
1943 Evaporation maps of the United States. Trans. Amer. Geophys. Union 24, 743-753.
1934 Compilation and summary of the evaporation records of the Bureau of Plant Industry. Monthly Weather Review, 1934 (March) 77-89.
1953 Irrigation principles and practices. New York. 1943 Water requirement of Rabi Jowar in the scarcity tracts
of the Bombay Deccan. Ind. Journ. of Agr. Sci. XIII, 235-251.
1916 Transpiration as a factor in crop production. Univ. of Nebraska, Agr. Exp. Sta. of Nebraska Bull. 6.
1929 Varietal, cultural and seasonal effects upon the water requirements of crops. Intern. Congress (Ithaca, 1926) Plant Sci. Vol. I, 87-105.
1952 Water loss Investigations Vol. 1. Lake Heffner studies. Technical report. Geological survey eire. 229.
1945 Influence of soil moisture conditions on apparent photosynthesis and transpiration of pecan leaves. Journ. Agr. Res. 71, 519-532.
1954 Klima und Boden. 4te Auflage, Jena. 1957 Eksameno de la formulo de Penman. Neth. Journ. Agr.
Sci. 5, 290-305. 1927 The use and duty of water in the Salt River Valley. Univ.
of Arizona, Coil. of Agr. Bull. 120. 1938 Lysimeteronderzoekingen aan het Rijkslandbouwproef
station te Groningen en elders. I. Regenval, drainage en verdamping. Versl. Landbouwk. Onderz. No. 44-1 A.
1929 The plant in relation to water; a study of the physiological behaviour of drought resistance. Translated by R. H. Y APP. London.
1951 Smithsonian Meteorological Tables, prepared by R. J. LIST. 6th rev. ed. Washington.
1916 Relative water requirements of corn and sorghums. Journ. Agr. Res. 6, 473-485.
1 923 Relative water requirements of corn and sorghum. Kansas State Agr. Col!., Manhattan, Kansas. Techn. Bull. 12.
1938 Plant Physiology. New York and London. 1949 Water relations of oats with attention to the influence
of periods of drought. Plant and Soil 1, 303-342. 1956 De plaats van de fotosynthese in het produktieproces.
Landbouwk. Tijdschr. 68, 635-646. 1948 Natural evaporation from open water, bare soil and
grass. Proc. Roy. Soc. A, 193, 120-146. 1952 The physiological basis of irrigation control. Report
13th Int. Hort. Congress. 1952, 913-924. 1956a. Estimating evaporation. Trans. Am. Geoph. Union. 37,
43-50.

PENMAN, H; L.
-and R. K. SCHOFIELD
PHYSICAL TABLES
RABINOWITCH, E. I.
RASCHKE, K.
87
1956b. Evaporation: An introductory survey. Neth. Journ. Agr. Sci. 4, 9-29.
1951 Some physical aspects of assimilation and transpiration. Symp. No. V Soc. Exp. Biology, 115-129.
1956 Smithsonian Physical Tables, prepared by W. E. FoRSYTHE. 9th rev. ed., Washington.
1951 Photosynthesis and related processes. Vol. II, Part I, New York.
1956 Ober die physiologischen Beziehungen zwischen Warmeiibergangszahl, Temperatur und Transpiration eines Blattes. Planta 48, 200-238.
RICHARDS, L.A. and<;. H. WADLEIGH 1952 Soil water and plant growth. 74-252 in B. T. SHAW (editor): Soil physical conditions and plant growth. New York.
RussEL, M. B. and R. E. DANIELSON 1956 Time and depth patterns of water use by corn. Agr. Journ. 48, 163-165.
ScHNEIDER, G. W. and N. F. CHILDERS 1941 Influence of soil moisture on photosynthesis, respiration and transpiration of apple leaves. Plant Phys. 16, 565-
SCHULTZ, G. 583.
1927 Versuche zur Ermittlung von Gesetzmassigkeiten im Wasserhaushalt der Pflanzen. Landw. Jahrbucher 61, 837-858.
SHULTZE, E. and P. SCHULTZE-GEMEN 1957 Der Wasserhaushalt des Bodens im Dauerdiingungsversuch Dikopshof (1953/1954). Zeitschr. fur Acker
SCOFIELD, C. S.
SHANTZ, H. L. and L. N. PIEMIESEL
SINGH, B. N. and K. N. LAL
STAPLE, W. J. and J. J. LEHANE
STOCKER, 0.
THoM, C. C. and H. F. HoLTZ
THOMAS, M. D.
·- and G. R. HILL
THORNTHWAITE, C. W.
VERDUYN, J. and W. E. LooMis
VERHOEVEN, B.
VRIES, D. A. DE and R. H. A. VAN DUIN - and H. J. VENEMA
WATSON, D. J.
WESSELING, J.
und Pfianzenbau 103, 22-59. 1945 The water requirement of Alfalfa. Un. States Dept. of
Agr. Circ. No. 735. 1927 The water requirements of plants at Akron, Colo.
Journ. of Agr. Res. 34, 1093-1190. 1935 Investigation of the effect of age on assimilation of
leaves. Ann. Bot. London 49, 291-307. 1954 Weather conditions influencing wheat yields in tanks
and field plots. Can. Journ. of Agr. Sci. 34, 553-564. 1956 Die Diirreresistenz. Handbuch der Pflanzenphysiolo'gy
III, 696-734. Springer Verlag, Berlin. 1917 Factors influencing the water requirements of plants.
State Coli. Wash. Agr. Exp. Sta. Bull. 146. 1955 Effect of ecological factors on photosynthesis. Ann. Rev.
of Plant Phys. 6, 135-156. 1950 Photosynthesis under field conditions, 19-52. In J.
FRANCK and W. E. LOOMIS (editors): Photosynthesis in plants. Ames (Iowa).
1948 An approach toward a rational classification of climate. Geographical Rev. 38, 55-94.
1944 Absorption of carbon dioxyde by maize. Plant Phys. 19, 278-293.
1946 Bepaling en waarde van verdampingscijfers bij potproeven. Maandb. Landbouwvoorlichtingsd. 3, 162-165.
1953 Some considerations on the diurnal variation of transpiration. Net h. Journ. Agr. Sci. 1, 27-34.
1954 Some considerations on the behaviour of the Piche evaporimeter. Veg. Acta Geobot. V-Vl, 225-234.
1947 Comparative physiological studies on the growth of field crops I. Variation on net assimilation rates and leaf area between species and varieties, and within and between years. Annals of Botany N.S. 11, 41-76.
1952 The physiological basis of variation in yield. Advances in Agronomy Vol. 4, 101-145.
1957 Enige aspecten van de waterbeheersing in landbouwgronden. Versl. Landhouwk. Onderz. No. 63.5.
WIDSTOE, J. A.
WIIK, W. R. VAN and D. A. DE VRIES WJND, G. P.
WIT, C~ T. DE
88
1912 The production of dry matter with different quantities of irrigation water. Utah Agr. Coli. Exp. Sta. Bull. 116.
1954 Evapotranspiration. Neth. Journ. Agr. Sci. 2, 105-119. l954a Verschilkn in waterhuishouding tussen grasland en
bouw1and. Verslag C.J.L.O. m•er 1954, 126-,-131. 1954b The influence of nitrogen fertilizin~ on water consump
tion of grassland. Em. Grassland Conf. O.E.E.C., ·Paris.
1953 A physical theory on placement of fertilizers. Versl. Landhortwk. Onderz. 59.4, 1-71.
1956 Crop, Soil and water. Agr. Res. Institute, Gyogon, ln~·e;n, Union of' Burma. Report No. 12.