Whole Sesame Seed Is as Rich a Source of Mammalian Lignan Precursors as Whole Flaxseed
Upload
khangminh22Category
view
4download
0
Whole-plant Transpiration in Populus sp.: Its Determination,
Nocturnal Effects and Influence by Form of Nitrogen
by
Damián Cirelli
A thesis submitted in partial fulfillment of the requirements for the degree of
Doctor of Philosophy
in
Forest Biology and Management
Department of Renewable Resources
University of Alberta
© Damián Cirelli, 2014
ii
Abstract
Water is a crucial factor in the life of land plants. Transpiration (E) is inevitable and
it is viewed as the universal cost of accessing a CO2-rich atmosphere. Although we
now know that plants lose water at night, it had been assumed that stomata remained
closed after dark. Renewed interest has encouraged more research on night-time E.
An overlooked challenge in this area is that of measuring water loss. Most of the
current research relies on leaf-level measurements using gas analysers. This
presents many complications and although the instruments are simple to operate, it
is not a trivial task to measure E properly, especially at night. I present a system that
includes instructions to build the hardware platform and the software package,
which utilises balances to measure E simultaneously and continuously from
multiple specimens. The system is particularly suited to measuring nocturnal E of
whole plants since it requires minimal interaction and it is not intrusive for the plant.
With this system, a survey of whole-plant nocturnal E was carried out on four
species of Populus with a range of habitat preference from riparian to upland. This
survey characterises night-time water loss in relation to habitat, showing that
Populus from drier environments may curtail night-time E more readily than
riparian species. The survey also investigates the effect of drought on nocturnal E,
arguing that night-time sap flow may be associated with one or more physiological
functions. Lastly, the effect of two forms of N (NO3- and NH4
+) on whole-plant
stomatal conductance is analysed in two hybrid poplars with different growth
potentials. NH4+ is shown to depress day-time, but not night-time conductance in

iii
comparison with NO3-; likely due to a change in stomatal function. Root anatomy
was radically changed in a species-dependent manner when grown under different
N forms. Some of these changes reflect different metabolic needs associated with
each N form, while others may have a direct bearing on plant hydraulics.

iv
In memoriam Miguel Cirelli, my source of ‘newén’
v
Acknowledgements
This research was supported in part by contributions from the West Fraser
Scholarship, the Dr. Ian G. W. Corns Memorial Scholarship and the University of
Alberta Provost Award. Most of the genetic material for propagation was supplied
generously by Al-Pac, through Dr. Barbara Thomas. Thank you.
I would like to express my gratitude to my advisor, Dr. Lieffers, for standing
beside me during many a dark hour, and providing me with both encouragement
and financial support; most of all, he is an exceptional human being, someone with
whom I am proud to be associated.
This thesis could not have been completed (or even started) without the
support of my dear wife, my pillar, María Alejandra Equiza (Ale) who is an
outstanding scientist. She believed in me when I did not believe in myself. Her help
is unmeasurable. She not only made moral support her personal mission, but she
was, at times, the only person I could rely on to physically help me measure and
water plants and to discuss endless ramifications of my topic, sometimes through
fits of desperation, and sometimes while sharing sips of Ilex paraguariensis.
Many close friends have been by my side, some literally and some
metaphorically due to distance, and some both. I am particularly grateful to Walter
Araujo, Darío Ganem and Juan Pablo Peralta for their constant encouragement. I
have leaned on many others; space does not permit a full list. I would be remiss not
to acknowledge their influence on me and therefore their influence on my work,
which may be meager but never for lack of conscience, a good deal of which is

vi
reinforced by these rock-solid friends. They are my patrimony and I can only hope
that they may be proud of my small achievements as I am proud of their friendship.
Thank you.
vii
Table of contents
Abstract ........................................................................................................................ ii
Acknowledgements........................................................................................................v
Table of contents ........................................................................................................ vii
List of Tables .................................................................................................................x
List of Figures ............................................................................................................. xi
Chapter 1. Introduction ................................................................................................1
Transpiration.................................................................................................... 1
Populus and diurnal/nocturnal transpiration ..................................................... 4
Methods of quantifying nocturnal transpiration ................................................ 6
Variation of gN in Populus species from different habitats and interaction with
drought ............................................................................................................ 9
Effect of nitrogen form on transpiration and conductance in two hybrid poplars
with different growth potential ....................................................................... 12
Objectives, hypotheses and overview of the chapters ..................................... 14
Figures ........................................................................................................... 17
Chapter 2. Measuring whole-plant transpiration gravimetrically: a scalable
automated system built from components .................................................................. 19
Introduction ................................................................................................... 19
Materials and Methods ................................................................................... 23
System description, materials and installation ............................................ 23
Hardware requirements .............................................................................. 23
Software overview ..................................................................................... 24
Environmental monitoring ......................................................................... 26
Plant material and growing conditions........................................................ 26
Quantification of evaporation from pots ..................................................... 27
Sensitivity analysis..................................................................................... 27
Results and Discussion .................................................................................. 28
Figures ........................................................................................................... 36
Chapter 3. Populus species from diverse habitats maintain high night-time
conductance under drought ........................................................................................ 41

viii
Introduction ................................................................................................... 41
Materials and Methods ................................................................................... 44
Plant material and growth conditions ......................................................... 44
Measurement of water loss ......................................................................... 45
Watering regime and drought treatment ...................................................... 46
Leaf surface anatomy ................................................................................. 47
Calculation of stomatal pore index ............................................................. 48
Nighttime cuticular conductance ................................................................ 49
Data analysis and statistics ......................................................................... 50
Results ........................................................................................................... 51
Night-time transpiration and water use ....................................................... 51
Cuticular conductance ................................................................................ 52
Stomatal characteristics and stomatal pore index ........................................ 53
Discussion ..................................................................................................... 53
Tables and Figures ......................................................................................... 59
Chapter 4. N form affects whole-plant conductance and root anatomy in two
contrasting Populus hybrid clones .............................................................................. 68
Introduction ................................................................................................... 68
Materials and Methods ................................................................................... 71
Plant material and general growth conditions ............................................. 71
Application of N in different forms ............................................................ 73
Transpiration and whole-plant conductance ................................................ 73
Leaf area and growth measurements........................................................... 75
CO2 response curves and stomatal limitations ............................................ 76
Leaf nutrient analysis ................................................................................. 77
Anatomy .................................................................................................... 78
Allometric calculations and integrated intrinsic water-use efficiency .......... 79
Statistics .................................................................................................... 80
Results ........................................................................................................... 81
Discussion ..................................................................................................... 85
Tables and figures .......................................................................................... 93

ix
Chapter 5. Conclusions ............................................................................................. 101
References ................................................................................................................. 107

x
List of Tables
Table 3-1. Species studied; ranked by estimated drought tolerance .................... 59
Table 3-2. Average whole-plant conductance and water-use under well-watered
and drought conditions, and minimum GN under the maximum level of drought
achieved before total leaf desiccation ................................................................. 59
Table 3-3. Stomatal characteristics of four Populus species ............................... 60
Table 4-1. Composition of the nutrient solution used during the treatments ....... 93
Table 4-2. Projected water use during 5 weeks of treatment at constant VPD ..... 93
Table 4-3. Growth parameters in relation to fertilization with two forms of
nitrogen in two poplar clones ............................................................................. 94
Table 4-4. Concentration of N, P, K and Ca in leaves fully developed under
different N forms ............................................................................................... 94
Table 4-5. Stomatal density of leaves fully developed under different N form
regimes .............................................................................................................. 95
Table 4-6. Vessel density and total vessel cross-sectional area in proportion to
total xylem area of roots developed under different N forms .............................. 95
xi
List of Figures
Figure 1-1: Percentage of different methods used to measure nocturnal water loss
since 1952. ........................................................................................................ 18
Figure 2-1. Schematic representation of the devices and connections involved in
building the Amalthea system. ........................................................................... 36
Figure 2-2. Effect of the length of the data set considered when calculating
transpiration rates from gravimetric measurements. ........................................... 37
Figure 2-3. Relationship between atmospheric evaporative demand and soil water
evaportion. ......................................................................................................... 38
Figure 2-4. Continuous transpiration traces of aspen seedling during two days. . 39
Figure 2-5. Area-corrected transpiration of poplar clones and effect of data
smoothing on the shape of the trace. .................................................................. 40
Figure 3-1. Long-term transpiration and whole-plant conductance traces of four
Populus species under well-watered conditions and progressive drought............ 62
Figure 3-2. Summary of day- and night-time whole-plant conductance by drought
intensity and ratio of night- to day-time conductance (GN/GD) of four Populus
species under well watered conditions followed by increasing drought. ............. 63

xii
Figure 3-3. Change in night-time whole-plant conductance with atmospheric
vapour pressure deficit. ...................................................................................... 64
Figure 3-4. Cuticular and stomatal conductances of excised leaves. .................. 65
Figure 3-5. Scanning electron microscope images of open and closed stomata of
four Populus species. ......................................................................................... 66
Figure 3-6. Correlation of stomatal pore index and whole-plant conductance .... 67
Figure 4-1. Short-term (1 week) and long-term (5 weeks) effects of N form on
day- and night-time whole-plant conductance .................................................... 96
Figure 4-2. Linear regressions of whole-plant conductance versus light for two
forms of nitrogen ............................................................................................... 97
Figure 4-3. A/Ci response curves of plants fed different nitrogen forms ............. 98
Figure 4-4. Thickness of leaves fully developed under different N sources ........ 99
Figure 4-5. Schematic representation of cross-sections of roots developed under
different N forms and frequency distribution of vessel lumen diameter in the root
vascular cylinder .............................................................................................. 100
1
Chapter 1. Introduction
Transpiration
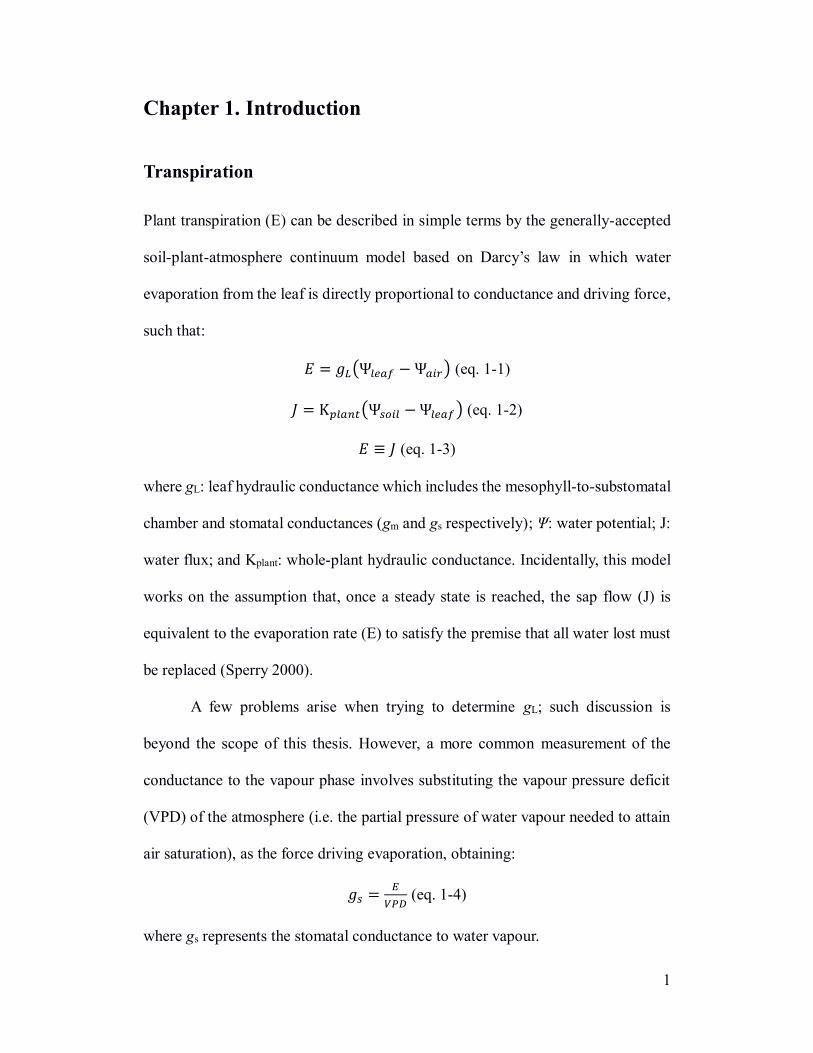
Plant transpiration (E) can be described in simple terms by the generally-accepted
soil-plant-atmosphere continuum model based on Darcy’s law in which water
evaporation from the leaf is directly proportional to conductance and driving force,
such that:
𝐸 = 𝑔𝐿(Ψ𝑙𝑒𝑎𝑓 − Ψ𝑎𝑖𝑟) (eq. 1-1)
𝐽 = K𝑝𝑙𝑎𝑛𝑡(Ψ𝑠𝑜𝑖𝑙 − Ψ𝑙𝑒𝑎𝑓 ) (eq. 1-2)
𝐸 ≡ 𝐽 (eq. 1-3)
where gL: leaf hydraulic conductance which includes the mesophyll-to-substomatal
chamber and stomatal conductances (gm and gs respectively); Ψ: water potential; J:
water flux; and Kplant: whole-plant hydraulic conductance. Incidentally, this model
works on the assumption that, once a steady state is reached, the sap flow (J) is
equivalent to the evaporation rate (E) to satisfy the premise that all water lost must
be replaced (Sperry 2000).
A few problems arise when trying to determine gL; such discussion is
beyond the scope of this thesis. However, a more common measurement of the
conductance to the vapour phase involves substituting the vapour pressure deficit
(VPD) of the atmosphere (i.e. the partial pressure of water vapour needed to attain
air saturation), as the force driving evaporation, obtaining:
𝑔𝑠 =𝐸
𝑉𝑃𝐷 (eq. 1-4)
where gs represents the stomatal conductance to water vapour.
2
Traditionally, transpiration has been seen as an unfortunate by-product of
land colonization (Raven 2002). Biology textbooks have deemed it as an
"unavoidable evil" which stands between the photosynthetic apparatus and the CO2
resource (Raven et al. 2005). This trade-off between carbon fixation and water loss
through the stomata or “the dilemma of opposing priorities” (Raschke 1976) has
driven the development of conceptual models based on stomatal optimization of
gas exchange as well as the continuous search for improving the ratio of carbon
fixed to water lost, i.e. water use efficiency (WUE), of economically important
species. Within this view, the increasing evidence that many species maintain
substantial stomatal conductance and transpirational water loss during the night has
discredited the long-held assumption that stomata remain closed during the night.
At the same time, this challenges us to explain the significance, if any, of a process
that according to some, should have been fixed in evolution.
Current accounts of average water loss during the night estimate that
nocturnal transpiration rates (EN) range from 5 to 30% of day-time rates (Caird et
al. 2007). An intense area of research has then been established in order to assess
the magnitude of nocturnal transpiration in different species, habitats and the
possible functional role of it. This increasing body of research suggest that a new
paradigm might be developing in which transpiration is held as a "design feature"
of plants instead of an impediment to productivity (reviewed in Cramer et al. 2009).
Although knowledge about nocturnal transpiration (EN) of trees is increasing and
its impact on regional water and carbon balance has been recognized, the costs and
benefits of high night-time stomatal conductance (gN) and high EN remain largely

3
unknown. The apparent “wastefulness” of water has prompted the question of
whether nocturnal transpiration confers a functional benefit to the plant. Although
it is possible that nighttime water loss may not necessarily be adaptive and may
simply result from incomplete stomatal control (Cavender-Bares et al. 2007),
several hypotheses have been proposed regarding functional benefits that may be
associated with nocturnal water loss such as:
a. Maintaining the stomata in a “pre-opened” state may reduce
diffusional limitations to CO2 uptake, allowing photosynthesis to
begin without delay at sunrise when VPD is low (e.g. Bucci et al.
2005; Dawson et al. 2007; Auchincloss et al. 2014).
b. Night-time sap flow (driven by transpiration through stomatal
opening) may increase the supply of oxygen to xylem parenchyma
cells to maintain respiration (Gansert 2003).
c. Nocturnal transpiration may enhance nutrient uptake or nutrient
transport to distal parts of the plant by mass flow (Daley and Phillips
2006; Caird et al. 2007).
The possibility that nocturnal transpiration may assist with nutrient uptake
by mass flow has recently received a great deal of attention. However, experimental
results in this area have been contradictory, possibly due to variability in plant
species and experimental conditions such as nutrient concentration, form of
nutrients and the methodology used to assess nocturnal water loss (e.g. Scholz et
al. 2007; Snyder et al. 2008; Howard and Donovan 2007, 2010; Christman et al.
2009; Kupper et al. 2012; de Dios et al. 2013). Overall, there is no clear
4
experimental support for any of these hypotheses and the evolutionary and
ecological role of nocturnal transpiration as well as the mechanisms underlying
night-time stomatal regulation remain as open questions (see de Dios et al. 2013;
Auchincloss et al. 2014 and references therein).
Populus and diurnal/nocturnal transpiration
The genus Populus contains approximately thirty species distributed in a wide
range throughout the northern hemisphere (Eckenwalder 1996). The species are
divided into poplars, cottonwoods and aspens, based on genetic and
ecophysiological characteristics (Eckenwalder 1996; Hamzeh and Dayanandan
2004). Cottonwoods and poplars are found in riparian areas and other moist
habitats, while aspens are generally upland species and occupy more seasonally-
dry areas (Kranjcec et al. 1998). Poplars play a major role in the ecology of a wide
range of landscapes in the northern hemisphere and they represent an important
economic resource as they exhibit some of the fastest growth rates in temperate
forests (Stettler et al. 1996; Monclus et al. 2005). The genus is also becoming
increasingly important as a model plant, not unlike Arabidopsis, for the study of a
wide array of molecular mechanisms that are of interest to both forestry and basic
plant biology (Taylor 2002).
The fast growth of hybrid poplars has been the main incentive for their
establishment in fibre plantations. The government of Canada is also using
incentives to encourage hybrid plantations in order to meet Canada’s carbon
sequestration targets (Natural Resources Canada 2005). Hybrid poplars are highly
demanding in both water and nutrients (Blake et al. 1996; Heilman et al. 1996) and,

5
therefore, meeting growth rate expectations in relatively marginal areas such as the
boreal regions, with relatively short growing seasons, requires a deep knowledge of
the interaction between water and nutrient use. During the past 10 years a notable
amount of research has been done to identify hybrid poplar clones with high
productivity (e.g. Bassman and Zwier 1991; Barigah et al. 1994; Rae et al. 2004;
Monclus et al. 2005). There has also been considerable work to understand the
relationships between growing potential and water use efficiency and how these
factors are affected by water stress and nutrition (e.g. Rhodenbaugh and Pallardy
1993; Liu and Dickman 1996; Harvey and van den Driessche 1999; Marron et al.
2002; Monclus et al. 2006).
The high productivity of poplars has been correlated numerous times with
large water requirements (Wullschleger et al. 1998 and references therein),
especially compared with other temperate species in which the water use can be 1
or 2 orders of magnitude less (see table in Wullschelger et al. 1998). Numerous
studies link (or rather correlate) the hydraulic conductivity of various plant parts
with productivity, thus hinting at a relationship between plant-water relations and
growth (Sperry et al. 1993; Van der Willigen and Pammenter 1998; Atkinson et al.
2003; Tyree 2003). Thus, several questions arise regarding the extent to which
nocturnal transpiration might have a significant role in the overall water-balance of
Populus species. In a meta-analysis that included multiple species with different
growth habits and from different habitats, Populus appears in the upper range of the
reported values of nocturnal water loss (Caird et al 2007). However, what variation
and range exist among species of the same genus that occupy different ecological

6
niches (e.g. riparian versus upland) remains to be explored. Also, it is still unclear
how gN and EN are regulated by environmental factors such as leaf-to-air vapor
pressure difference and soil water content, since contrasting patterns have been
found in some species (Dawson et al. 2007; Phillips et al. 2010; Zeppel et al. 2010).
In exploring the relationship between mineral nutrition and nocturnal
transpiration, recent studies have focused on the effects of nutrient availability
(particularly NO3-) on EN (Howard and Donovan 2010; Kupper et al. 2012).
However, results have been contradictory, with either no changes in EN when plants
were grown at different N concentrations (in P. balsamifera and P. angustifolia,
Howard and Donovan 2010) or increasing E with higher N concentration (in P.
tremuloides, Kupper et al. 2012), while in other species fertilization seems to reduce
EN (Scholz et al. 2007). Clearly, more work is needed elucidate patterns (or point
to a lack thereof) of nutrient availability and nocturnal water use. Finally, although
it may seems rather obvious, it is necessary to emphasize the need for precise
quantification of nocturnal water loss at the whole plant level, since in the majority
of cases analyses have been done using measurements at the leaf level, without
consideration of scaling issues.
Methods of quantifying nocturnal transpiration
Some methods are more accurate and/or have less uncertainty than others for the
estimation of EN/gN and their relative contribution to the daily water budget.
Because nocturnal transpiration rates are typically low, accurate quantification by
widely used instantaneous gas exchange measurements is questionable (Barbour et
al. 2005). Moreover, gas exchange measurements are typically performed on the

7
“youngest fully-expanded leaf”, which is not necessarily representative of the entire
leaf population (e.g. Wilson et al. 2000; Pataki and Oren 2003). Sap-flow methods
typically have attendant uncertainties as to the proportion of the measured flux
resulting in bole refilling rather than transpiration from the canopy (Caird et al.
2007). However, some studies have been able to separate transpiration and refilling
components by using modeling approach based on refilling time constants (Bucley
et al 2011). Other recent studies done at the stand level or with big trees have
combined measurements of sap flow with leaf-level gas exchange measurements
using an infra-red gas analyser (IRGA) (Moore et al. 2008; Philips et al. 2010;
Sellin et al. 2010; Zeppel et al. 2010).
Gravimetric assessment of plant water loss can provide an accurate
measurement of whole-plant/canopy transpiration (E) and conductance (g = E /
VPD, see equation 1-4) independently of the movement of water into or out of the
tissue compartments (Cavender-Bares et al. 2007). It is then surprising that high-
resolution gravimetric measurements are rare. Caird et al. (2007) summarized a
large number of studies on nighttime conductance that span from 1952 to 2007. Out
of the 57 papers, 53% have used gas exchange and/or sap-flow methods, while
gravimetric methods (lysimeters or balances) represented 15% of the studies. I
followed up this analysis by looking at the methodology employed by papers on
nocturnal transpiration that have been published between 2007 and 2014. Out of 36
papers, the use of gas exchange and/or sap flow methods have increased to 88%
while gravimetric methods have been used only in 2 cases (4%) (Figure 1-1).
8
Lysimeters have been used for a long time, with the first lysimeter built in
1875 (Sturtevant 1919). Most lysimeter applications concentrate on larger scales
often for agronomical purposes (large grass patches, crops, etc.) although large trees
have also been measured (e.g. Edwards 1986). Since weighing lysimeters are
gravimetric by nature, they provide an accurate measurement of water loss.
However, custom-built lysimeters tend to be expensive and cumbersome with
special interfaces, and consequently their use in experimental setups is limited and,
once again, with larger scales in mind (plot-level as opposed to plant-level scale,
e.g. Flury et al. 1999; Liu et al. 2002). Regular laboratory balances on the other
hand are relatively inexpensive and have almost a commodity status as they are
indispensable in virtually any plant biology-related research. Furthermore, properly
equipped balances can be easily interfaced through a serial RS-232 port making
them equally suitable for use with either a computer or a simple custom micro-
controller (µC) device and/or data-logger. The technique described here refers to
the use of laboratory bench balances in a greenhouse setting but these balances can
be ‘ruggedized’ to function in moderately harsh environments.
Balances present themselves as great tools for real-time accurate
measurements of water loss, and although their use is limited to potted plants, it
should be the obvious choice for whole-plant level physiological studies. In their
paper, Cavender-Bares et al. (2007) utilize an approach similar to the proposed
methodology here. However, they implemented a point-solution for their study and
did not describe their system in any detail. Moreover, they recorded a single weight
value every 5 minutes and calculated transpiration over that period.
9
The system presented in Chapter 2 improves on this concept by directly
measuring transpiration as the slope of 10-second values over 5 minutes. This
improves resolution and smooths environmentally-induced fluctuations. The
complete system is composed of three parts: i) balances and computer to record
weights, ii) humidity, temperature and light sensors (plus computer to log), and iii)
a non-destructive leaf area measuring system which can be analog (such as a ruler)
or digital (such as caliper-based, or imaging-based).
Variation of gN in Populus species from different habitats and
interaction with drought
The magnitude of water loss occurring during the night depends on gs and the
vapour pressure difference between leaves and the air, as well as canopy structure
and wind speed. While gN has been recorded at up to 90% of daytime conductance,
nighttime transpiration rates (EN) range from 5 to 30% of daytime rates since
nighttime VPD is typically lower than during the day (Caird et al. 2007). It has been
suggested that gN and EN may be most prominent in fast-growing, shade-intolerant
tree species from environments with stable and high water availability (Dawson et
al. 2007). Nocturnal conductance and transpiration have been measured in natural
stands of Populus balsamifera (Snyder et al. 2003) as well as in greenhouse-grown
P. trichocarpa and P. angustifolia (Howard and Donovan 2010), and they are in the
upper range of values reported in the literature. Depending on environmental
conditions, EN can represent a significant percentage of the diel water budget in

10
Populus, although how much variation occurs among Populus species that occupy
habitats with different water availability has not been assessed.
Substantial EN has been found to prevent equilibration between water
potential of soil and leaves resulting in lower-than-expected leaf water potentials,
as well as to reduce the magnitude of hydraulic redistribution during the night
period in some species (Donovan et al. 2003; Bucci et al. 2005; Kavanagh et al.
2007; Howard and Donovan 2010). It has been proposed that the effect of EN on
hydraulic redistribution may affect plant performance and reduce nutrient cycling
during drought periods (Howard and Donovan 2010). In order to explore the
involvement of EN in preventing pre-dawn water potential equilibrium in Populus,
I have measured the pre-dawn water potential of transpiring (uncovered) and non-
transpiring (covered) plants in different Populus species. In all cases, pre-dawn
water potential from uncovered plants was significantly lower than in covered
plants, showing a significant effect of nocturnal transpiration on whole-plant water
status (Cirelli, unpublished). The difference between nominally equilibrated and
non-equilibrated plants ranged from 1.9 to 0.9 bars, which shows a large degree of
variation among Populus species. This created the need to survey gN and EN in
species of the same genus which occupy different habitats.
The magnitude of gN (and EN) is generally significantly higher than the
minimum leaf conductance (measured after water stress and/or ABA treatment),
which suggest that the reported values of gN are largely due to stomatal opening and
should be under guard cell regulation (Howard and Donovan 2010). In fact, it has
been observed that under well-watered conditions, gN declines with increasing
11
VPD, providing evidence for stomatal regulation of nocturnal transpiration (Caird
et al. 2007; Cavender-Bares et al. 2007). However, this is not always the case, and
it can be inferred by the various contrasting data available, that stomatal regulation
by VPD is highly species-specific (Phillips et al. 2010; Zeppel et al. 2010; Dawson
et al. 2007). In addition, the influence of soil water status on EN has also been found
to be variable across species (Dawson et al. 2007; Phillips et al. 2010; Zeppel et al.
2010).
The response of nocturnal stomatal conductance to various environmental
conditions (chiefly water availability and atmospheric demand) may or may not
interact with the various systems that respond to light. It is possible that its
regulation happens through different mechanisms than those operating during the
day (Ogle et al. 2012) and that stomatal response to VPD may be subjected to an
underlying circadian clock (Howard and Donovan 2010). Different patterns have
been observed in different Populus species (Howard and Donovan 2010) but they
have not been tied to any particular set of variables. Based on data obtained from
different oak species, Cavender-Bares et al. (2007) proposed that differences in
mean gN might be related to differences in stomatal pore index (SPI = stomatal
density × stomatal length), although their analysis did not discriminate between SPI
and actual stomatal opening, which they also suggest as a partial contributor.
Whether differences in SPI can explain differences in absolute EN among Populus
species remains unknown. This, together with the influence of drought on whole-
plant EN, is part of the focus of Chapter 3.
12
Effect of nitrogen form on transpiration and conductance in two
hybrid poplars with different growth potential
The possibility that nighttime water loss may be regulated in response to soil
nutrient availability has received a great deal of attention (e.g. Scholz et al. 2007;
Snyder et al. 2008; Howard and Donovan 2007, 2010; Christman et al. 2009,
Kupper et al. 2012; de Dios et al. 2013). If maintaining a flux of water toward roots
at night can decrease the formation of nutrient depletion zones, then increased EN
could be beneficial when water is plentiful and mobile nutrients are scarce. This
idea is supported by the Barber-Cushman model of root nutrient uptake which
predicts that increased water flux to the root rhizoplane will decrease nitrate
depletion zones around roots (Barber and Cushman 1981). However, no consensus
has been found among studies assessing the effect of EN on nutrients (mostly NO3-)
uptake (e.g. Ludwig et al. 2006; Snyder et al. 2008; Christman et al. 2009). While
gN has declined in response to long-term N fertilization in some species (Scholz et
al. 2007), no regulation of gN in response to long-term nitrogen limitation has been
found in other species, e.g. Helianthus (Christman et al. 2009) and Arabidopsis
(Howard and Donovan 2007).
Among Populus species, NO3- can modulate EN but this observation is not
consistent, and more precise experimental conditions may be necessary (Howard
and Donovan 2010). Hybrid aspen plants (P. tremula × P. tremuloides) grown under
high N conditions are reported to have higher night-time sap flux and higher night-
time water use relative to daytime, in contrast to plants under N-limited conditions
(Kupper et al. 2012). These authors suggest that lower night-time water flux under
13
N deficient conditions could be characteristic of fast growing species because “they
are adapted to fertile soils”. Most of the studies have focused on NO3--fertilization,
since, as a mobile form of N, its acquisition is more likely to be affected by changes
in transpiration than the less-mobile NH4+ would be (Cramer et al. 2009; Howard
and Donovan 2010). In consequence, NH4+ has not been systematically compared
with NO3- as a possibly different regulatory form of N in connection to water use
(Matimati et al. 2014), particularly at night. Matimati et al. (2014) observed that
Phaseolus seedlings that were prevented from intercepting urea (a source NH4+)
had a twofold increase in transpiration rates, which could indicate that
transpirationally-driven mass flow may also help to deliver N in NH4+ form.
The form of N is known to have a significant effect on plant growth. The
NH4+:NO3
- ratio optimum for plant growth shows substantial variation among
species and, as such, N-form preference is considered to exert a significant
influence on community structure and forest succession (Kronzucker et al. 2003;
Boudsocq et al. 2012). In boreal forests, the shift in inorganic N from NO3- to NH4
+
has been proposed to be one of the driving forces behind forest succession
(Kronzucker et al. 1997; Kronzucker et al. 2003). In this paradigm, early
successional species such as Populus are expected to grow better in the presence of
NO3- while conifers are expected to favour NH4
+. However, neither soil
characteristics of aspen-dominated boreal forests (where NH4+ is prevalent), nor
experiments of N-form in different Populus species, fully support this hypothesis.
Surprisingly, the effects of N form on physiological responses that are tightly linked

14
with plant growth, such as plant transpiration and carbon assimilation, have been
scarcely analyzed in poplar species.
Objectives, hypotheses and overview of the chapters
The main objective of the present thesis was to investigate the importance of
nocturnal whole-plant stomatal conductance (GN) and transpiration (EN) in the diel
plant water budget of Populus species, and whether night-time water loss may be
functional rather than accidental.
Firstly, Chapter 2 presents an original software package (Amalthea) and a
design to create a system for measuring transpiration using laboratory balances
based on readily available hardware. The system is modular, capable of multiple-
balance synchronisation and is highly scalable from one to one hundred units. Its
flexibility accommodates varied applications such as monitoring nighttime
transpiration or long term drought treatments. The software runs under GNU/Linux
and it requires little computer resources. Reporting of transpiration rates is based
on linear regressions of data from pre-set intervals which yields high resolution and
provides some level of noise filtering.
Secondly, Chapter 3 investigates the relationship of day-time transpiration
(ED) and night-time transpiration (EN) under well watered and drought conditions
in four Populus species (including a hybrid) from different habitats. In particular,
my objectives were: 1—to assess the response of ED and and EN to nocturnal VPD
under both well watered and drought conditions, 2—to relate GN maximum values
with stomatal (anatomical) characteristics, 3—to compare the contribution of E
night to the total diel water budget under well watered and drought conditions in

15
Populus from contrasting habitats. I hypothesized that riparian species would
display higher nocturnal transpiration with little adjustment of nighttime stomatal
conductance in response to moderate drought. I performed simultaneous and
continuous measurements of transpiration and whole-plant stomatal conductance
(G) in whole plants during two weeks using an automated gravimetric technique. I
studied four species of Populus with a range of habitats from riparian to upland
sites with frequent drought. I measured E and G under well-watered conditions,
followed by moderate water stress and lastly severe drought. I found that riparian
species had higher nighttime G than non-riparian species, and did not significantly
reduce their nighttime G in response to moderate stress. On the other hand, non-
riparian species showed a decline in nighttime G proportional to the level of
drought. However, none of the non-riparian species approached minimal G values
until leaf death was imminent and I found evidence of active stomatal involvement
under moderate drought. I concluded that active stomatal opening is responsible for
nighttime water loss even under drought and that this phenomenon may be adaptive.
Finally, Chapter 4 is concerned with the effects of N form on whole plant
physiology in fast- (AP2403) and slow-growing (AP9) poplar hybrids. Specifically,
I assessed day- and night-time conductance, net photosynthesis and growth, and
foliar nutrient concentrations. I pursued the following hypotheses: i—inorganic
nitrogen in the form of NO3- increases whole-plant conductance (particularly night-
time) relative to NH4+; ii—the increased transpiration under NO3
- nutrition has a
secondary effect on the delivery of other nutrients such as K and Ca, for which mass
flow is an important form of acquisition and delivery; and iii—plants under NH4+

16
nutrition produce thicker roots with distinct anatomical changes since they appear
to be the main site of NH4+ metabolism.

17
Figures

18
Figure 1-1: Comparison on the percentage of the number of publications using different
methods to assess nocturnal water loss. Data from 1952 to 2007 corresponds to 57 papers
reviewed by Caird et al. (2007). Data from 2007-2014 is based on the following
references: Barbour and Buckley (2007); Caird et al. (2007); Cavender-Bares et al.
(2007); Dawson et al. (2007); Fisher et al. (2007); Grulke et al. (2007); Kobayashi et al.
(2007); Marks and Lechowicz (2007); Christman et al. (2008, 2009a, 2009b); Moore et al. (2008); Snyder et al (2008); Howard et al. (2009); Novick et al. (2009); Rogiers et al.
(2009); Howard and Donovan (2010); Phillips et al. (2010); Prieto et al. (2010); Sellin
and Lubenets (2010); Zeppel et al. (2010, 2011, 2012); Buckley et al (2011); Pfautsch et
al. (2011); Barbeta et al. (2012); Kupper et al. (2012); Ogle et al. (2012); Rosado et al.
(2012); de Dios et al. (2013); Escalona et al. (2013); Rogiers and Clarke (2013);
Auchincloss et al. (2014); Rohula et al. (2014).
19
Chapter 2. Measuring whole-plant transpiration
gravimetrically: a scalable automated system built from
components1
Introduction
Transpiration (E), is one of the most fundamental processes in vascular plants and
its inextricable nature governs many aspects of their physiology. Transpiration is
linked to carbon gain as both water loss and CO2 uptake (and consequently
assimilation, A) occur through stomata and the water-use efficiency (WUE) is often
expressed as the ratio E/A (Stanhill 1986). High rates of E may foster higher A but
may also come at a peril for the plant and some authors regard E as a negative side-
effect (Kramer and Boyer 1995; Raven et al. 2005; Niklas 1997). Other authors
have attributed specific functions to E, from nutrient delivery to leaf cooling
(Cramer et al. 2009; Mahan and Upchurch 1988; Dawson et al. 2007).
Plant transpiration is of interest not only in the context of whole-plant
physiology but also in a more applied sense since it is tied to production-sensitive
factors like drought tolerance and WUE. In addition, the discussion of plant water-
use patterns has become of central importance since water availability and
distribution are predicted to change around the globe (Naik et al. 2003; Rees and
Ali 2007; Ridgwell et al. 2009; Oliveira et al. 2011). Several recent publications
highlight the current interest in understanding and improving crop WUE (e.g. Yoo
1 A version of this chapter has been published. Cirelli et al. 2012. Trees 26: 1669-1676.
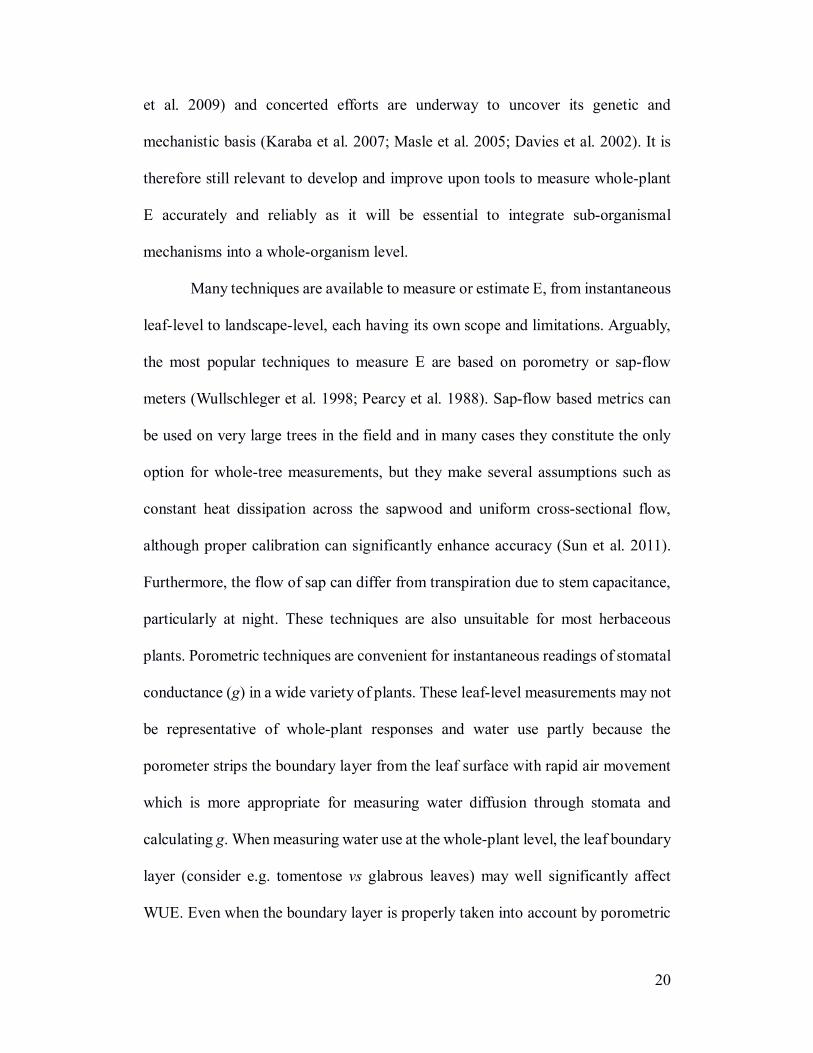
20
et al. 2009) and concerted efforts are underway to uncover its genetic and
mechanistic basis (Karaba et al. 2007; Masle et al. 2005; Davies et al. 2002). It is
therefore still relevant to develop and improve upon tools to measure whole-plant
E accurately and reliably as it will be essential to integrate sub-organismal
mechanisms into a whole-organism level.
Many techniques are available to measure or estimate E, from instantaneous
leaf-level to landscape-level, each having its own scope and limitations. Arguably,
the most popular techniques to measure E are based on porometry or sap-flow
meters (Wullschleger et al. 1998; Pearcy et al. 1988). Sap-flow based metrics can
be used on very large trees in the field and in many cases they constitute the only
option for whole-tree measurements, but they make several assumptions such as
constant heat dissipation across the sapwood and uniform cross-sectional flow,
although proper calibration can significantly enhance accuracy (Sun et al. 2011).
Furthermore, the flow of sap can differ from transpiration due to stem capacitance,
particularly at night. These techniques are also unsuitable for most herbaceous
plants. Porometric techniques are convenient for instantaneous readings of stomatal
conductance (g) in a wide variety of plants. These leaf-level measurements may not
be representative of whole-plant responses and water use partly because the
porometer strips the boundary layer from the leaf surface with rapid air movement
which is more appropriate for measuring water diffusion through stomata and
calculating g. When measuring water use at the whole-plant level, the leaf boundary
layer (consider e.g. tomentose vs glabrous leaves) may well significantly affect
WUE. Even when the boundary layer is properly taken into account by porometric

21
methods, the architecture of the entire plant is inexorably overlooked by leaf-level
measurements. While porometry is an invaluable tool, estimations of E from leaf-
level g seldom agree with in-situ whole-plant transpiration measurements
(McDermitt 1990).
Gravimetric instruments such as weighing lysimeters can provide reliable,
accurate measurements and a resolution-to-scale ratio at the whole-plant level if
properly constructed (Yoo et al 2009; Edwards 1986). The nature of lysimeters
makes replication cumbersome, due not only to the cost and the work involved in
their installation but also because they are field-only stationary instruments by
design. Laboratory balances are well suited to function as small-scale weighing
lysimeters, are relatively inexpensive, provide remarkable precision and accuracy,
and have been used in a number of studies to measure E, sometimes with a fine
degree of time-resolution (Edwards 1986). Unlike the case of lysimeters, a system
with balances can easily incorporate replicates if carefully designed. Despite this,
to date no specific software and technical report are available to help researchers
build such a system.
Measuring E by means of weighing can be considered a sort of “gold-
standard” for whole-plant E since a balance is used to account for the loss in (water)
mass. Three simple assumptions can be identified: i—the water is all lost through
the plant (zero soil evaporation), ii—the plant gains no mass, and iii—the plant
loses no mass other than that of water. The first of these assumptions can be
controlled, to some extent, by minimising soil exposure and by measuring it (e.g. a
pot with no plant). Plant gain or loss in dry weight can be ignored since their
22
contribution to balance mass can only be detected after long periods of time (much
longer than those needed to measure E). It is clear that measuring E with a high
degree of resolution on several plants simultaneously using balances would be a
very impractical task unless automated.
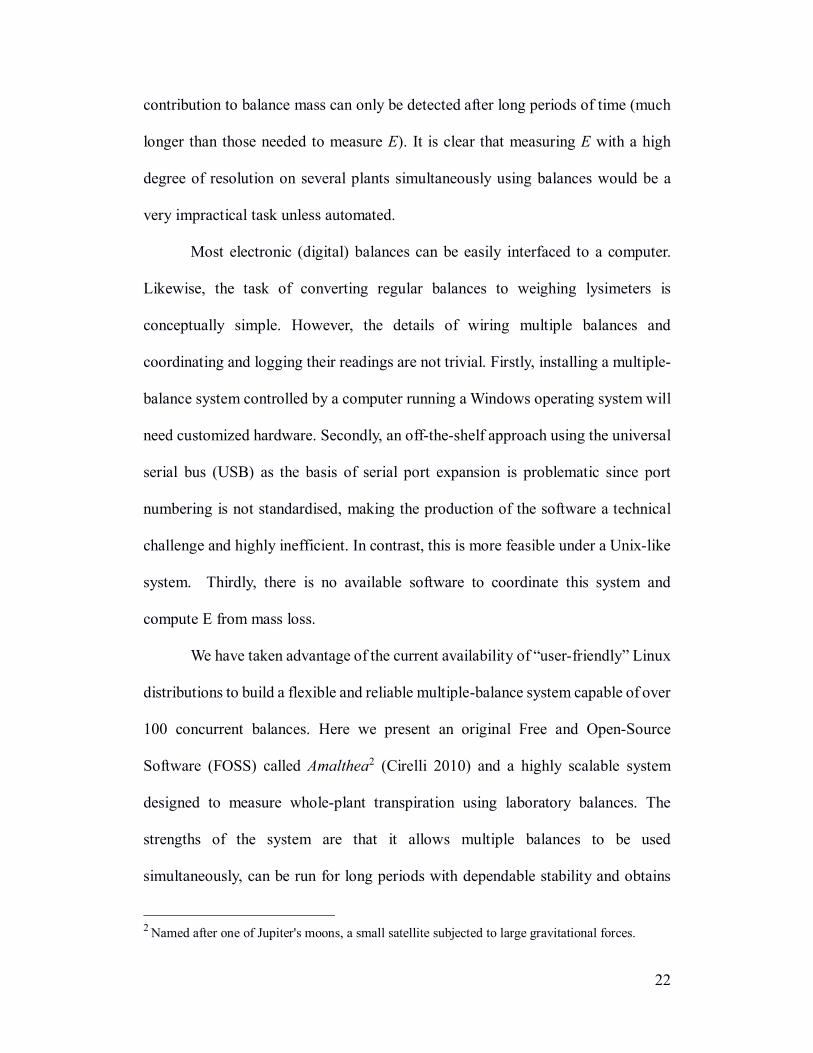
Most electronic (digital) balances can be easily interfaced to a computer.
Likewise, the task of converting regular balances to weighing lysimeters is
conceptually simple. However, the details of wiring multiple balances and
coordinating and logging their readings are not trivial. Firstly, installing a multiple-
balance system controlled by a computer running a Windows operating system will
need customized hardware. Secondly, an off-the-shelf approach using the universal
serial bus (USB) as the basis of serial port expansion is problematic since port
numbering is not standardised, making the production of the software a technical
challenge and highly inefficient. In contrast, this is more feasible under a Unix-like
system. Thirdly, there is no available software to coordinate this system and
compute E from mass loss.
We have taken advantage of the current availability of “user-friendly” Linux
distributions to build a flexible and reliable multiple-balance system capable of over
100 concurrent balances. Here we present an original Free and Open-Source
Software (FOSS) called Amalthea2 (Cirelli 2010) and a highly scalable system
designed to measure whole-plant transpiration using laboratory balances. The
strengths of the system are that it allows multiple balances to be used
simultaneously, can be run for long periods with dependable stability and obtains
2 Named after one of Jupiter's moons, a small satellite subjected to large gravitational forces.

23
high resolution measurements with good noise filtering, suitable to many types of
studies and many scales of plants from small herbs to large potted trees. Moreover,
the system can be built entirely with readily available components.
Materials and Methods
System description, materials and installation
The system was designed to be modular so balances could be added or removed
and the software quickly reconfigured. We also focused on using easily available
and economical parts. Essentially, the system consists of a computer that runs the
software, a laboratory scale (balance) and a connection between them. This would
comprise a “minimal unit” to which more balances can be added. Below, we provide
the general specifications to be met by the hardware and a thorough description of
the software.
Hardware requirements
The most minimal installation requires a computer with an available serial port, a
balance with serial bi-directional communications capability and a serial
communications cable. Multiple balances require an equal number of serial ports.
Universal Serial Bus (USB) to RS-232 (RS232) converter cables are used for this
purpose and can be connected to a USB hub. The USB approach allows for easy
expansion of the system and this was how our final test system was installed. The
configuration we used for testing consisted of one computer to which nine balances
were connected through two USB hubs. Figure 2-1 shows the connection diagram
of a complete system.

24
Since nine serial ports were required to connect the nine balances, we used
two 7-port self-powered “industrial” USB hubs (StarTech ST7200USBM,
StarTech.com Ltd., Canada) connected independently (one hub per built-in system
port), each with its own DC power supply. The hubs were attached to the computer
with 28/24AWG gold-plated type A/B USB cables (Monoprice Inc., USA).
Although we chose a star topology, a daisy-chain arrangement of the hubs could
have been used and it would be our recommended wiring scheme. The nine serial
ports for balance connection were provided by nine USB-to-RS232 converter
cables (StarTech ICUSB232, StarTech.com Ltd., Canada).
We used nine top-loading digital balances with a 0.01 g resolution and a
maximum capacity of 4500 g (Adam Equipment model PGW 4502e, Adam
Equipment, South Africa). The balances were placed on levelled metal greenhouse
benches with ad-hoc medium-density fibreboard platforms for stability (1.25 cm
thickness). Each balance was numbered and connected to the respective USB-serial
port with a null-modem (cross-linked) serial cable (StarTech SCNM9FF,
StarTech.com Ltd., Canada). We performed weekly calibrations of the balances to
maintain linearity and offset any drift.
All electronic equipment, was connected to an uninterrupted power supply
(UPS) (APC Back-UPS CS 350, Schneider Electric SA, France).
Software overview
Amalthea was programmed mainly in the Python language (www.python.org) with
a programme wrapper (amalthea-wrapper) written as a bash shell script
(www.gnu.org/software/bash/bash.html) which makes use of standard GNU/Linux
25
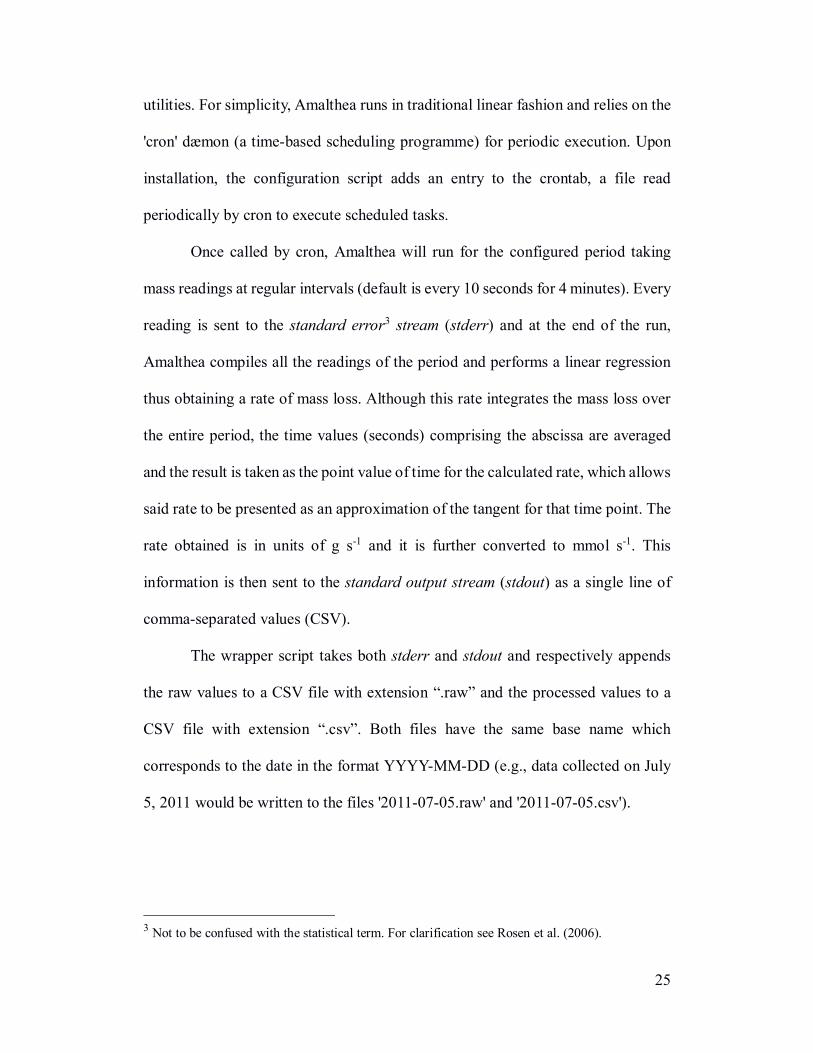
utilities. For simplicity, Amalthea runs in traditional linear fashion and relies on the
'cron' dæmon (a time-based scheduling programme) for periodic execution. Upon
installation, the configuration script adds an entry to the crontab, a file read
periodically by cron to execute scheduled tasks.
Once called by cron, Amalthea will run for the configured period taking
mass readings at regular intervals (default is every 10 seconds for 4 minutes). Every
reading is sent to the standard error3 stream (stderr) and at the end of the run,
Amalthea compiles all the readings of the period and performs a linear regression
thus obtaining a rate of mass loss. Although this rate integrates the mass loss over
the entire period, the time values (seconds) comprising the abscissa are averaged
and the result is taken as the point value of time for the calculated rate, which allows
said rate to be presented as an approximation of the tangent for that time point. The
rate obtained is in units of g s-1 and it is further converted to mmol s-1. This
information is then sent to the standard output stream (stdout) as a single line of
comma-separated values (CSV).
The wrapper script takes both stderr and stdout and respectively appends
the raw values to a CSV file with extension “.raw” and the processed values to a
CSV file with extension “.csv”. Both files have the same base name which
corresponds to the date in the format YYYY-MM-DD (e.g., data collected on July
5, 2011 would be written to the files '2011-07-05.raw' and '2011-07-05.csv').
3 Not to be confused with the statistical term. For clarification see Rosen et al. (2006).
26
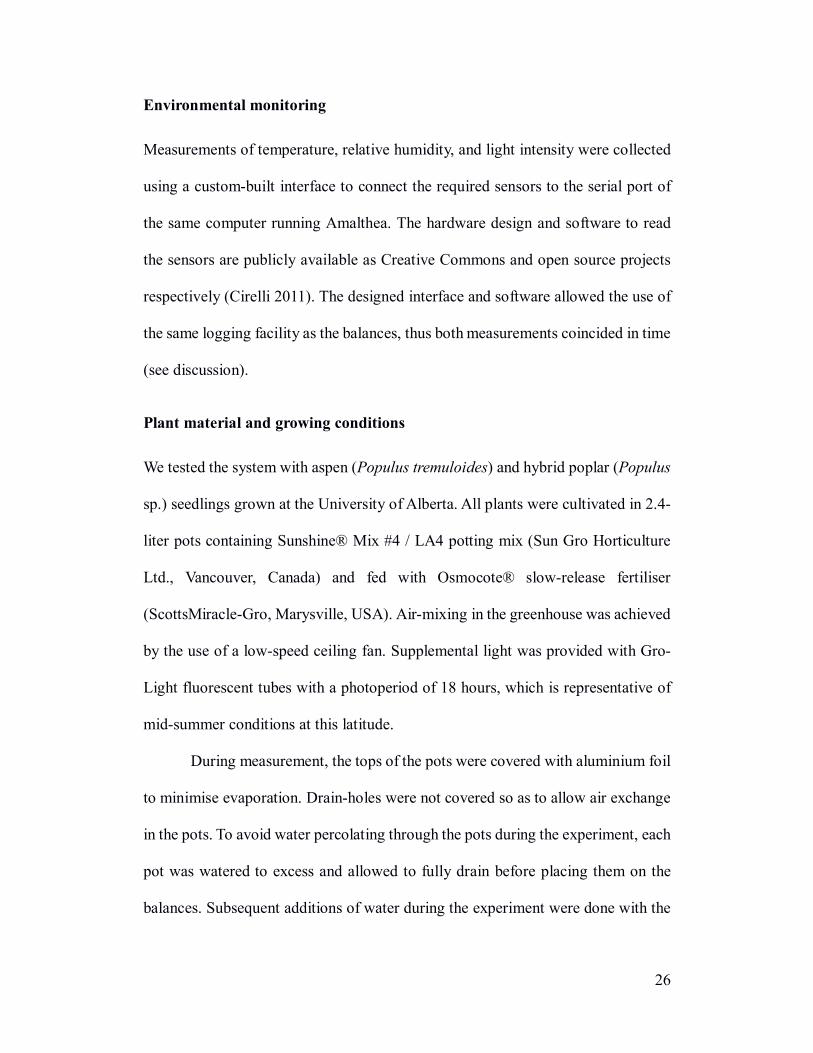
Environmental monitoring
Measurements of temperature, relative humidity, and light intensity were collected
using a custom-built interface to connect the required sensors to the serial port of
the same computer running Amalthea. The hardware design and software to read
the sensors are publicly available as Creative Commons and open source projects
respectively (Cirelli 2011). The designed interface and software allowed the use of
the same logging facility as the balances, thus both measurements coincided in time
(see discussion).
Plant material and growing conditions
We tested the system with aspen (Populus tremuloides) and hybrid poplar (Populus
sp.) seedlings grown at the University of Alberta. All plants were cultivated in 2.4-
liter pots containing Sunshine® Mix #4 / LA4 potting mix (Sun Gro Horticulture
Ltd., Vancouver, Canada) and fed with Osmocote® slow-release fertiliser
(ScottsMiracle-Gro, Marysville, USA). Air-mixing in the greenhouse was achieved
by the use of a low-speed ceiling fan. Supplemental light was provided with Gro-
Light fluorescent tubes with a photoperiod of 18 hours, which is representative of
mid-summer conditions at this latitude.
During measurement, the tops of the pots were covered with aluminium foil
to minimise evaporation. Drain-holes were not covered so as to allow air exchange
in the pots. To avoid water percolating through the pots during the experiment, each
pot was watered to excess and allowed to fully drain before placing them on the
balances. Subsequent additions of water during the experiment were done with the

27
pots on the balances while administering the water slowly with a large-nozzle4 wash
bottle until the mass was about 100 g less than the initial weigh-in. This was done
to avoid percolation.
Quantification of evaporation from pots
The Amalthea system was used to quantify the contribution of water evaporating
directly from the pots. Six pots containing live root systems of decapitated plants
were watered and allowed to drain completely. There were four 2.5 cm × 2 cm
drain-holes on each pot placed on the sides, where the side meets the bottom. The
top of each pot was covered with a square of aluminium foil wrapped around the
rim and containing a slit from the edge to the middle as would be the case when
accommodating the stem of an intact plant. Drain-holes were not covered. The pots
were placed on the balances and their mass loss monitored over a period of four
days. No exudate from root pressure was present after cutting.
Sensitivity analysis
To assess the adequacy of both the balance resolution and the chosen length of one
run, a sensitivity analysis was conducted. A slope of 0.01 g period-1 was chosen as
the starting point, which, with the default period of 220 s, it represents a rate of
4.54×10⁻⁵ g s-1. From this slope, a set of data was constructed containing 23 points,
one every 10 s for 220 s starting at zero seconds. Each point i was then subjected to
the operation floor(10n·i)·10-n where n is the number of decimals available and the
4 This can be achieved by snipping off the tip of the original nozzle to the desired size.
28
function floor takes only the integer part of the number discarding the decimals.
This was done to simulate a conservative scenario in which for a balance to display
an increment of one unit of resolution (0.01 in the case of two-decimal resolution),
the full mass of this unit has to be added before the balance registers the new mass.
For example, under such condition, adding 0.007 g to a balance reading “0.01” will
not cause a reading of “0.02”; only adding a full 0.01 g will change the display to
“0.02”.
A linear regression was fitted to the new “rounded down” data set, and the
resulting slope (SR) compared to the known slope without rounding (SK). The
percentage of variation between the slopes was calculated as (100𝑆𝑅
𝑆𝐾) − 100 and
this process was repeated for slopes of 0.03 to 0.93 g period-1 in 0.09-g increments.
A series of slope variations was obtained for n=1 and n=2. In addition, the entire
process was also repeated with a period of one half of the original period and
another of double length, but maintaining the same reference rates in the series as
grams per second, thus varying the rate in grams per period to evaluate the effect of
period length.
Results and Discussion
Figure 2-2 shows five consecutive intervals of a transpiring plant during the
transition from lights-on to lights-off. Each group of points displays the linear
regression fitted to that particular group, the slope of which is the rate of water loss
in g s-1 unit-1. The differences among the slopes indicate that lengthening the runs
would result in a loss of temporal resolution. Some runs may display a degree of

29
non-linearity and in these cases a quadratic function is a better fit than a linear
regression. The reported abscissa corresponding to each slope is the average of the
time period, thus the linear regression slope can be taken as a very close
approximation to the first derivative of a quadratic function for the same midpoint
in time.
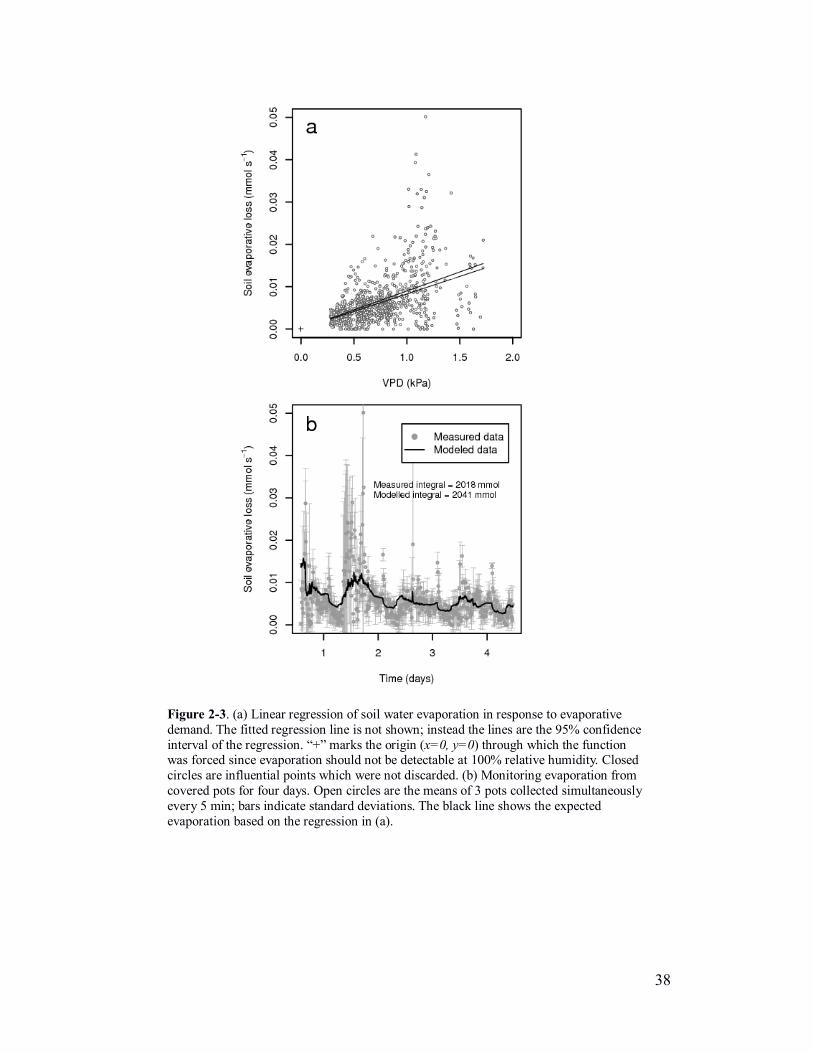
Monitoring potted plants for long periods denies the option of sealing the
pots as it would create an anoxic environment in the roots. For this reason, we
deemed necessary to quantify the water loss from pots with leaky top covers (foil)
and open drain-holes. Water evaporation from the pots was linearly correlated with
the evaporative demand of the air, expressed as vapour pressure deficit (VPD, figure
2-3a). Figure 2-3b shows a four-day span of evaporation measurements from
“empty” pots and a second trace of evaporation modelled from the VPD data.
Compared with a transpiring plant, the evaporation rate from the pots is negligible,
amounting to no more than 1% of the total measured water-loss (see figure 2-4).
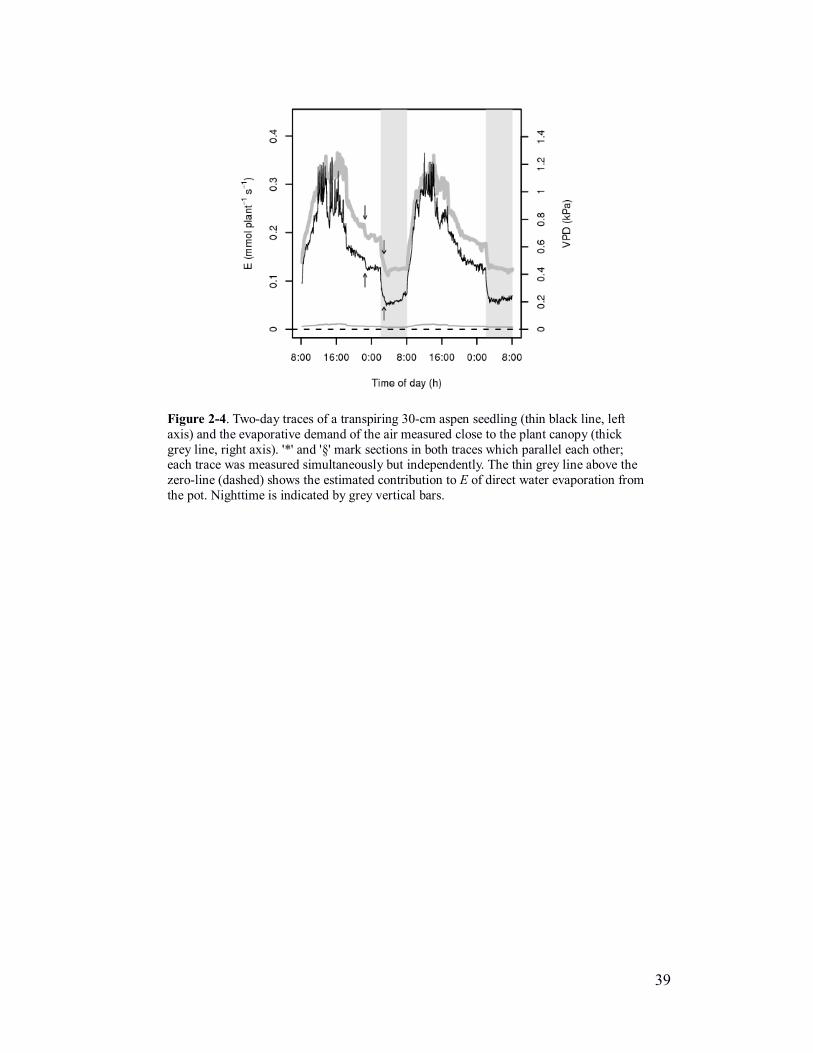
The transpiration over a two-day continuous run of an ~40-cm aspen
seedling can be seen in figure 2-4. This seedling was representative of the six plants
measured. This figure also shows a measure of evaporative demand experienced by
the plants during the same period. It is evident from these data that, the effect of
light on stomatal opening notwithstanding, VPD was the principal driver of
transpiration in these plants. It is also noteworthy that transpiration and atmospheric
conditions were each measured independently, yet there is great parallelism
between both traces with some segments clearly recognisable in both data (arrows
in figure 2-4). This emphasises the close relationship between VPD and E, not only
30
as the main driver but also acting on smaller scales, which Amalthea is able to detect
(the particular drop in VPD – first arrow – can be explained by the opening of a
ventilation window in the greenhouse). Comparatively high-amplitude oscillations
are visible from midday onward lasting about two hours. These are partly in
response to variations in VPD and natural light intensity, but may also exhibit an
intrinsic nature (i.e. an oscillatory component is still present after normalising).
Regardless of the cause, these oscillations are not an artifact of the system which is
capable of reliable measurements and high accuracy, as seen for example after the
first arrow in figure 2-4.
Two poplar clones with contrasting characteristics (primarily in growth rate)
were simultaneously monitored for five consecutive days (and nights) to test the
system and its handling of multi-species configuration while obtaining data to
compare their transpiration responses. For clarity and brevity, figure 2-5 shows two
of the five days and the traces have been corrected by leaf area to make direct
comparison possible.
Area-correction is a necessary post-processing step to obtain a fine level of
resolution, especially when measuring for long periods. However, the system can
be made area-aware while collecting data, through the proper configuration option.
This is advisable only when measuring times are short (1 or 2 days) or when
measuring plants that have negligible expansion rates in the desired time-frame.
During long periods of monitoring fast-growing plants, leaf area increments can be
appreciable as was the case with the clones showed in figure 2-5. The expansion
rates in this case were ~38 cm2 day-1 for ap2403 and ~12 cm2 day-1 for ap9. Thus,

31
we configured Amalthea to collect data assuming a leaf area of 1 and transpiration
was corrected afterwards with individual leaf-area functions.
It can be seen that, despite oscillations in the data, Amalthea consistently
measured higher E on a leaf-area basis in the slower-growing ap9 clone. The traces
in the right panel of the figure have been subjected to a line-smoothing algorithm
(Tukey's running-median smoothing) for visual clarity only, while the left panel
shows the original data. Overall, oscillations in E appear larger than those in figure
2-4 due to the fact that the absolute whole-plant rates measured were much smaller,
but became amplified when standardised to the per-square-meter scale. Naturally,
direct “signal” (E in this case) amplification will also amplify noise, although since
these data are a time series more specialised can be applied such as frequency
domain (highly relevant to circadian rhythm studies).
Since all the individual data points collected by Amalthea (both “raw” and
“compiled”) are synchronised within seconds of each other among balances, and
since all the files contain the same number of points, averages of the entire
transpiration patterns of two or more plants are simple to produce. Thus, the
synchronised replicates of which Amalthea is capable and the response envelopes
they allow are an important advantage of this system. Comparing two or more
envelopes that are one-standard-deviation wide incorporates a robustness not
attainable otherwise, but indispensable when working with natural genetic
variability or when accounting for every independent variable is not feasible. The
average trace of an envelope is also a more reliable signal to use for analysis when
cyclic or circadian fluctuations are of interest.
32
As explained in the Methods section, the main programme in our software
only communicates with the balances and performs the regressions. A helper
programme (amalthea-config) part of the package configures files and coordinates
how the data logging is to be done. However, the actual recursion essential to any
logging software is carried out by cron. This is a key design choice; by outsourcing
the repetitive execution to another, standard programme, we can take advantage of
the resulting coordination not only with multiple instances5 of Amalthea but also
with other components. We chose to build a custom environmental hardware
package and software (both available as open source) in order to obtain coordinated
measurements of transpiration and evaporative demand. This is an important
feature because, following the procedure outlined in the previous paragraph (e.g.
point-by-point division), it allows further standardisation of the data according to
environmental conditions. Combining transpiration and environmental data point-
for-point can be an invaluable tool which allows the comparison of transpirational
behaviours of plants measured sequentially in time (e.g. through phenological
stages) since there can always be a correspondence with driving factors.
We used balances with two-decimal precision (0.01 g) which, together with
the described intervals (220 s and 10 s sub-interval), provided an ideal combination
of resolution and noise tolerance for the plant sizes and transpiration rates
measured. Sensitivity analyses were performed to investigate the viability of 0.1-g
precision and different measuring intervals. These simulations showed that using
5 In computer science, instance refers to each individual copy of an active programme or process
(i.e. executing in memory).
33
the system with a balance capable of a 0.01-g resolution, it is possible to measure
rates greater than 0.03 g period-1 with an accuracy of 5% of the true rate or better.
At the chosen period of 220 s, 0.03 g represents ~0.0075 mmol s-1 which is in the
range of the measured pot water loss. Simulations with 0.1-g precision showed that
220 s is not enough to measure such low rates accurately. However, doubling the
period improved the accuracy, making it possible to measure 0.0555 mmol s-1
within less than 5% of the actual rate. The reader should be aware of the trade-offs
between period length and accuracy due to round-off errors and between balance
precision and signal-to-noise ratio under different environments and transpiration
rates. Ultimately, the system is flexible enough to adapt to different situations given
proper assessment of the conditions: e.g. it is unlikely that a small Arabidopsis plant
can be measured with a 0.01-g balance precision in fast-moving air, while
conversely, 0.1-g precision would be sufficient for a potted tree with a leaf area of
0.5 m2.
The system presented in this paper has the advantage, over other methods,
of relying on fewer assumptions and giving a precise whole-plant E measurement
with a number of true replicates as opposed to an estimation. This is particularly
adept to model validation and verification. Its applications are wide-ranging
although clear limitations emerge from the current hardware. Some of these
limitations can be circumvented with careful planning and consideration of the
experimental requirements such as weather-proofing or load-sharing, amongst
others. Special attention should be paid to connecting and disconnecting converter
cables since a change in port number can create a configuration problem and result
34
in mixed data, but since port numbering is sequential in the Linux kernel it is easy
to predict port assignment (a more in-depth instruction is provided in the 'Readme'
file when downloading the software). The number of ports is also limited by the
system, to 127 devices per bus. In many cases, the 'different' USB ports on a
computer are on the same bus, detracting from the total 127 maximum. For this and
other technical reasons, we recognize a limit of 17 daisy-chained hubs to provide a
total of 103 ports (i.e. possible number of balances). Larger systems would be
possible by adding more buses or by combining computers, the latter afforded by
the use of cron as the logging control given that all computers are regularly
synchronised with a time server. No single system devised to measure E is suited
to every experimental condition or research question and Amalthea is likely to
complement other techniques and form part of a repertoire of tools to investigate
transpiration and its regulation.
Gravimetric techniques have always been reliable but highly impractical on
a larger scale in terms of space (multiple samples) and time, especially without
automation. Studies that look at transpiration which have used automated balance
measurements (e.g. Medrano et al. 2005; Cavender-Bares et al. 2007; Dodd et al.
2008; Dodd et al. 2010) often implement a non-described point-solution6 software
that, although of value to the study, is neither scalable nor universal as evidenced
by the presentation of single-plant measurements. Both the open source software
and the hardware connection scheme put forth in this paper are designed to be
6 Point-solution or point product refers to a product that is used only for a particular situation but
does not address the technical aspects required for a more general implementation.

35
scalable, versatile and simple to implement and use. Since the design is modular, it
is entirely possible to “mix-and-match” balances, to combine balances, or to use all
or some of the balances as potometers. We encourage researchers interested in
transpiration to visit the software website for more information and to obtain help
on downloading and running the programme.

36
Figures
Figure 2-1. (C) Computer running Amalthea; (U[i]) standard USB cable; (H[i]) USB
hub; (R[i.j]) USB-to-RS232 cable; (S[i.j]) serial communications cable (bi-directional);
(B[i.j]) weighing balance. The chain formed by (U1)-(H1)-(R1.1)-(S1.1)-(B1.1) is a
complete system unit. Repeats of (R)-(S)-(B) can be added to (H1) to create more units
until all ports are exhausted; addition of a [(U)-(H)] unit to the computer allows further
expansion (depicted here by (U2)-(H2)). A single-unit system is possible by connecting
(R1.1)-(S1.1)-(B1.1) directly to (C).

37
Figure 2-2. Five runs of “raw” mass data (25 min) in the transition between light (first
two runs) and dark (last three runs). Individual linear regressions are fitted to each run by
Amalthea (thin black lines) and rate information derived from them. An overall linear regression was fitted here for comparison (thick grey line), and to show that periods
longer than 5 min are unsuitable if fine granularity is desired. Dashed lines show
extended regression lines of the first and last runs.
38
Figure 2-3. (a) Linear regression of soil water evaporation in response to evaporative
demand. The fitted regression line is not shown; instead the lines are the 95% confidence
interval of the regression. “+” marks the origin (x=0, y=0) through which the function was forced since evaporation should not be detectable at 100% relative humidity. Closed
circles are influential points which were not discarded. (b) Monitoring evaporation from
covered pots for four days. Open circles are the means of 3 pots collected simultaneously
every 5 min; bars indicate standard deviations. The black line shows the expected
evaporation based on the regression in (a).
39
Figure 2-4. Two-day traces of a transpiring 30-cm aspen seedling (thin black line, left
axis) and the evaporative demand of the air measured close to the plant canopy (thick
grey line, right axis). '*' and '§' mark sections in both traces which parallel each other; each trace was measured simultaneously but independently. The thin grey line above the
zero-line (dashed) shows the estimated contribution to E of direct water evaporation from
the pot. Nighttime is indicated by grey vertical bars.

40
Figure 2-5. Monitoring E of clones ap9 (thin black line) and ap2403 (thick grey line)
over two days. Transpiration rates have been corrected by leaf area. Arrows point to gaps
in the data when the system was paused to water the plants. In the second day shown, the traces have been smoothed for visual clarity (right panel). Nighttime is indicated by grey
vertical bars. Traces represent individual plants.

41
Chapter 3. Populus species from diverse habitats
maintain high night-time conductance under drought
Introduction
The loss of water during the night challenges some of our preconceptions regarding
plant function. Despite long-standing assumptions to the contrary, evidence is
mounting for appreciable nocturnal transpiration (EN) in many tree species (e.g.
Zeppel et al. 2011; Phillips et al. 2010; Caird et al. 2007; Wullschleger et al. 1998).
However, the extent and magnitude of this phenomenon remain sparsely
documented and the notion that stomata remain closed in the absence of light still
influences our general models of water loss (Dawson et al. 2007; Phillips et al.
2010; Daley and Phillips 2006). Fisher et al. (2007), Marks and Lechowicz (2007),
and Dawson et al. (2007), have reported that stomata might be “leaky”, while others
suggest that they are responsible only for negligible nocturnal water loss (e.g. Dixon
and Grace 1984; Pickard 1989; Cienciala et al. 1992; Saugier et al. 1997). In many
cases, the inherent technical problems of accurately measuring night-time
transpiration also contribute to the lack of conclusive data (Seginer 1984; Fisher et
al. 2007).
Daytime transpiration (ED) has been extensively studied since it is
necessarily linked to photosynthesis. Despite the growing body of literature that
documents night-time transpiration and explores its implications (e.g. Caird et al.
2007; Dawson et al. 2007; Zeppel et al. 2010; Cramer et al. 2008), some basic points
still require more attention. Specifically, the level of inter- and intra-specific
42
variation in EN and its underlying control (Zeppel et al. 2010; Phillips et al. 2010);
the ratio of EN/ED within and across species (Caird et al. 2007) and how it is affected
by water relations; the ability of stomata to fully close (Cramer et al. 2009); and the
possible functional role behind EN.
A wide range of EN has been observed across tree taxa. While some species
such as red maple and red oak do in fact appear to have negligible levels of night-
time water loss (Daley and Phillips 2006), other species can have EN values in
excess of 30% of day-time E (Snyder et al. 2003). It has been suggested that night-
time stomatal conductance (gN) and EN may be most prominent in fast-growing,
shade-intolerant tree species from environments that experience high water
availability (Caird et al. 2007; Dawson et al. 2007; Marks and Lechowicz 2007).
However, this relationship has been drawn mostly from comparisons among
unrelated (or distant) species that occupy radically different environments (Caird et
al. 2007; Dawson et al. 2007). Comparisons among closely-related species within
a genera have seldom been performed (e.g. Cavender-Bares et al. 2007 and Phillips
et al. 2010 in oaks and eucalypts respectively).
Populus is a genus of ecological and economic importance with a wide
geographic distribution. In North America, there are approx. 21 species of Populus,
including poplars, hybrid poplars (naturally occurring), cottonwoods and aspens
(Eckenwalder 1996; Hamzeh and Dayanandan 2004). Some species such as P.
deltoides and P. trichocarpa are mainly obligate riparian, while others such as P.
tremuloides can dominate upland sites (Kranjcec et al. 1998; Lieffers et al. 2001).
In addition, Populus differ greatly in their stomatal control (Lu et al. 2010) as well
43
as in stomatal anatomy (Caird et al. 2007). Nocturnal conductance and transpiration
have been measured in natural stands of P. balsamifera (Snyder et al. 2003) as well
as in greenhouse-grown P. trichocarpa and P. angustifolia (Howard and Donovan
2010), and they are in the upper range of values reported in the literature (as part of
a meta-analysis by Caird et al. 2007). However, gN and EN have not been assessed
systematically among different Populus and, therefore, the inter-specific variation
in EN and its possible link with habitat distribution remain unclear. Comparison of
contrasting Populus might provide further insight as to how EN is related to habitat
as well as to stomatal characteristics in closely related species.
Most of the studies that have assessed EN in tree species rely on variants of
the sap-flow technique to estimate both transpiration and refilling. This technique
can provide valuable information in the field, although careful attention has to be
paid to the methodology, especially to decoupling flow due to bole recharging (stem
capacitance) from that due to water loss from leaves (Clearwater et al. 1999;
Dawson et al. 2007; Phillips et al. 2010; Sun et al. 2011). Porometer-style
measurements are also commonly used to obtain EN, but the nature of these
measurements makes it impossible to continuously monitor whole plants as
porometers are typically designed to work at the leaf level and long-term
measurements are not viable. In addition, the majority of the available data pertains
to mature trees (usually from sap-flow data) but little information is available on
seedling and/or saplings (Marks and Lechowicz 2007). Although issues of
capacitance (i.e. storage of water in the bole) and hydraulic redistribution are of less
importance in young tree seedlings, water use and availability are likely major
44
determinants of establishment and competition outcomes (Cooper et al. 1999; Sher
et al. 2003). The evaluation of night-time transpiration patterns might provide
further insight into recruiting and establishment dynamics.
Our main objective was to assess the day- and night-time transpiration of
four species of Populus with habitats ranging from riparian to upland, including a
hybrid poplar clone with drought-tolerant parents. We measured whole seedlings
directly by continuous whole-plant gravimetric readings of water loss from
individual plants over a span of at least one week. In particular, we aimed to
quantify whole-plant stomatal conductance (G) during the night across different
species of Populus, to obtain minimum values of nocturnal E and G under drought,
to analyse the ratio night-/day-time conductance (GN/GD) under well-watered and
drought conditions, and to compare the anatomy of stomata among species. We
hypothesize that riparian species will display higher nocturnal conductance and will
not adjust night-time stomatal conductance in response to moderate drought.
Materials and Methods
Plant material and growth conditions
Four Populus species were measured in this study: P. deltoides, P. trichocarpa, P.
× petrowskyana (hybrid of P. nigra × P. laurifolia), and P. tremuloides. These
species represent a gamut of habitat preference and drought tolerance, from riparian
habits to drier upland environments (Table 3-1). All plants were grown from seed
except plants of P. × petrowskyana which were cloned from stem cuttings. Plants
were grown in 2.4 - l pots filled with potting mix (Sunshine® LA4 mix, Sun Gro
45
Horticulture Canada Ltd.) with 20 g of slow-release fertilizer (13:13:13 N:P:K). All
species shared the same growing conditions in the greenhouse which provided a
mix of natural and supplemental light, under a 16-hour photoperiod. The average
daily light intensity (photosynthetically-active radiation) during the measurement
period was 532 ± 85 µmol m-2 s-1, with daily maximums between 800 and 1000
µmol m-2 s-1.
Measurement of water loss
Four plants of each species were measured continuously by a gravimetric method
(Amalthea system from Cirelli et al. 2012). Briefly, the Amalthea system consists
of a balance array where all the balances are coordinated by a computer which logs
the data. The computer also synchronises the gravimetric measurements with a mid-
canopy sensor array to simultaneously record light, temperature, and relative
humidity. Measurements were collected every 5 minutes, and each measurement
consisted of the average and slope of a linear regression from 23 samples taken at
10-second intervals (for details, refer to Cirelli et al. 2012).
The plants were, on average, 50 cm in height and held between 25 and 30
fully-expanded leaves. Leaf area was calculated on a leaf-by-leaf basis by non-
destructively measuring minimum and maximum caliper (i.e. width and length).
Calculation was based on previously constructed calibration regressions by
destructively sampling a wide range of leaf sizes from each species under the same
growing conditions, and correlating the product of width and length with the actual
area of each leaf thus obtaining a calibration factor (slope of the regression). The
correction factors ranged between 0.65 and 0.76 with every R2 higher than 0.98.

46
Width and length of every leaf was then measured every two days and an area-time
function was adjusted for each plant to correct the transpiration values point-for-
point a posteriori (see Cirelli et al. 2012).
All transpiration values were normalized by vapour pressure deficit (VPD)
thus transforming E to whole-plant or “total” stomatal conductance (G = E/VPD).
The use of VPD as the evaporative driving force assumes that the average leaf
temperature is the same as the air temperature. G applies to the entire soil–plant–
atmosphere continuum and should not be confused with either hydraulic or stomatal
conductance at the leaf level. In addition, we are making the distinction between
transpiration (E) which is the instantaneous rate of water loss expressed in mmol
m-2 s-1 (not taking into account the VPD), and water-use (U) expressed in g m-2 per
period (day—UD or night—UN), in which E is integrated over some period (e.g. the
entire night) in order to show the actual amount of water lost (usually expressed in
grams or alternatively as a percentage as in UN/UD).
Watering regime and drought treatment
Immediately preceding gravimetric measurements, plants were watered and pots
were allowed to percolate fully. After percolation had ceased, the bottom of every
pot was repeatedly blotted with paper towels until no more liquid was present. To
minimize water loss from the soil surface, the tops of the pots were covered with
aluminum foil. Drain holes were left uncovered as it was previously determined
that this only contributed up to 1% of the total loss (as described in Cirelli et al.
2012). Each pot was then weighed and this weight represented the percolation point
for the pot. During measurements under well-watered conditions, pots were watered
47
daily, on the scales, to 100 g less than its percolation weight to avoid water spillage
onto the balances. After 5 days under these well-watered conditions, water was
withdrawn in a controlled manner to observe the decline in night-time transpiration.
This treatment involved the daily addition of 50% of the water that each plant had
individually transpired since the last watering (one full day, since watering was
done at the same time each day). Once the leaves had lost turgor (stage 2 as
described by Lu et al. 2010), water was withheld completely to obtain a possible
minimum night-time E under extreme drought conditions.
Leaf surface anatomy
Stomatal impressions of both abaxial and adaxial surfaces were collected for
anatomical analysis. The impressions were taken with clear nail polish and lifted
from the surface with clear tape. Six digital images of each surface from
independent samples were taken and processed in GIMP (GNU Image
Manipulation Program, http://www.gimp.org). Processing consisted of marking the
length and width (opening) of each stoma outlined by the peristomatal groove on a
transparent layer. The resulting line drawings were extracted as separate images and
analysed in Fiji (Schindelin et al. 2012). The image extracted consisted of a
collection of crosshair-like drawings of varying widths and lengths which
represented the stomata on the original image. We used the particle analysis
function of ImageJ to obtain the Feret’s diameter (also known as maximum caliper)
of each particle-stoma. This measurement included both the length and width of the
stomatal opening including the stomatal ledge (ridge).
48
Leaf samples were also taken for SEM imaging. Small (~1.5 mm2) pieces
of fresh leaves were cut and plunged into 2.8% glutaraldehyde in phosphate buffer
pH 7.2. Primary fixation lasted for 24 hours at 4 °C, followed by dehydration in an
alcohol series consisting of 25%, 50%, 70%, 85% and 95% ethanol before final
dehydration in absolute ethanol. No secondary fixation was performed. Dehydrated
samples were dried in a CO2 critical-point dryer, mounted to show both the abaxial
and adaxial surfaces, and sputter-coated with 150 nm of gold.
Calculation of stomatal pore index
Stomatal pore index is commonly defined as a fixed “aperture” value resulting from
the product of the stomatal density and the square of the mean stomatal pore length
(Sack et al. 2003). However, this value does not take into account the dynamic
nature of stomata, which causes them to act as variable resistors in the hydraulic
pathway by varying their width. Therefore, and since we obtained measurements of
stomatal width, we constructed a “variable” version of SPI, noted here as SPIv.
Other authors have approximated the stomatal pore area to the area of an
ellipse of semi-major axis l/2 and semi-minor axis w/2 (e.g. Field et al. 2011), where
l is the stomatal pore length and w the pore width. We first approximated the pore
area to twice the area occupied by the arc of a parabola of length l and vertex w/2.
However, we also measured individual pore areas from SEM preparations to
compare with the estimates. In all cases, calculating the area as an ellipse
overestimated the actual area of the opening, while using the parabola calculation
underestimated the actual area by about the same amount. We therefore combined
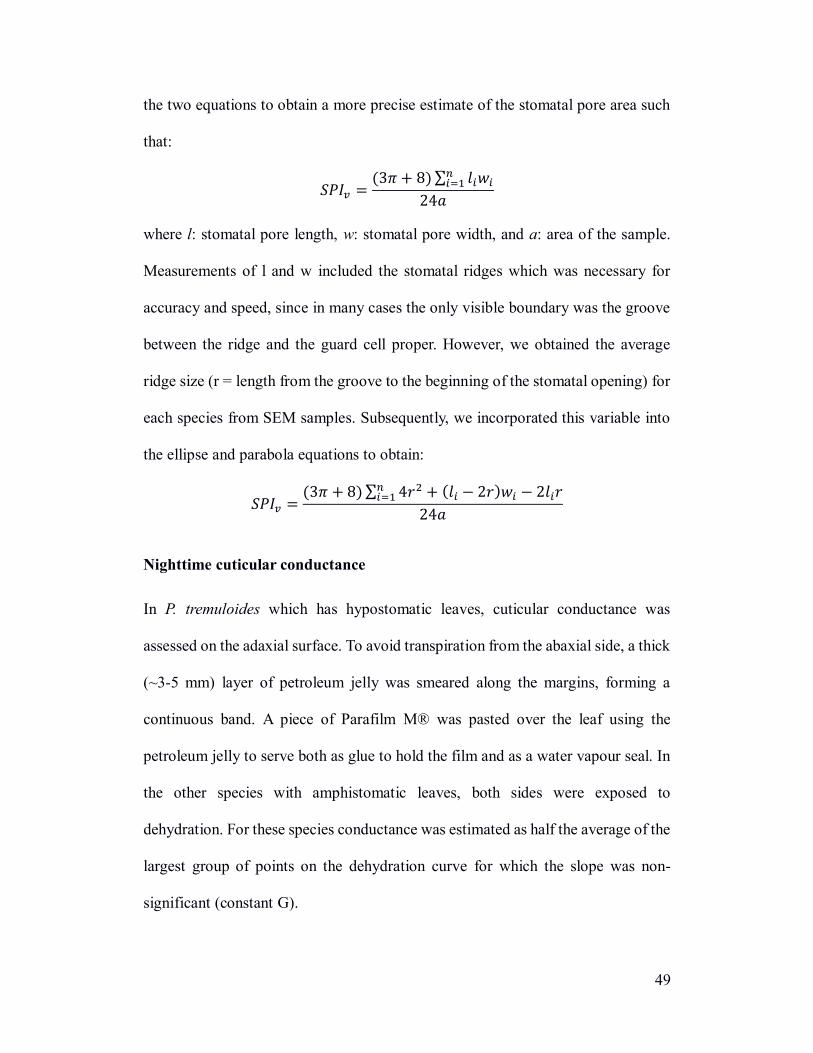
49
the two equations to obtain a more precise estimate of the stomatal pore area such
that:
𝑆𝑃𝐼𝑣 =(3𝜋 + 8) ∑ 𝑙𝑖𝑤𝑖
𝑛𝑖=1
24𝑎
where l: stomatal pore length, w: stomatal pore width, and a: area of the sample.
Measurements of l and w included the stomatal ridges which was necessary for
accuracy and speed, since in many cases the only visible boundary was the groove
between the ridge and the guard cell proper. However, we obtained the average
ridge size (r = length from the groove to the beginning of the stomatal opening) for
each species from SEM samples. Subsequently, we incorporated this variable into
the ellipse and parabola equations to obtain:
𝑆𝑃𝐼𝑣 =(3𝜋 + 8) ∑ 4𝑟2 + (𝑙𝑖 − 2𝑟)𝑤𝑖 − 2𝑙𝑖𝑟
𝑛𝑖=1
24𝑎
Nighttime cuticular conductance
In P. tremuloides which has hypostomatic leaves, cuticular conductance was
assessed on the adaxial surface. To avoid transpiration from the abaxial side, a thick
(~3-5 mm) layer of petroleum jelly was smeared along the margins, forming a
continuous band. A piece of Parafilm M® was pasted over the leaf using the
petroleum jelly to serve both as glue to hold the film and as a water vapour seal. In
the other species with amphistomatic leaves, both sides were exposed to
dehydration. For these species conductance was estimated as half the average of the
largest group of points on the dehydration curve for which the slope was non-
significant (constant G).
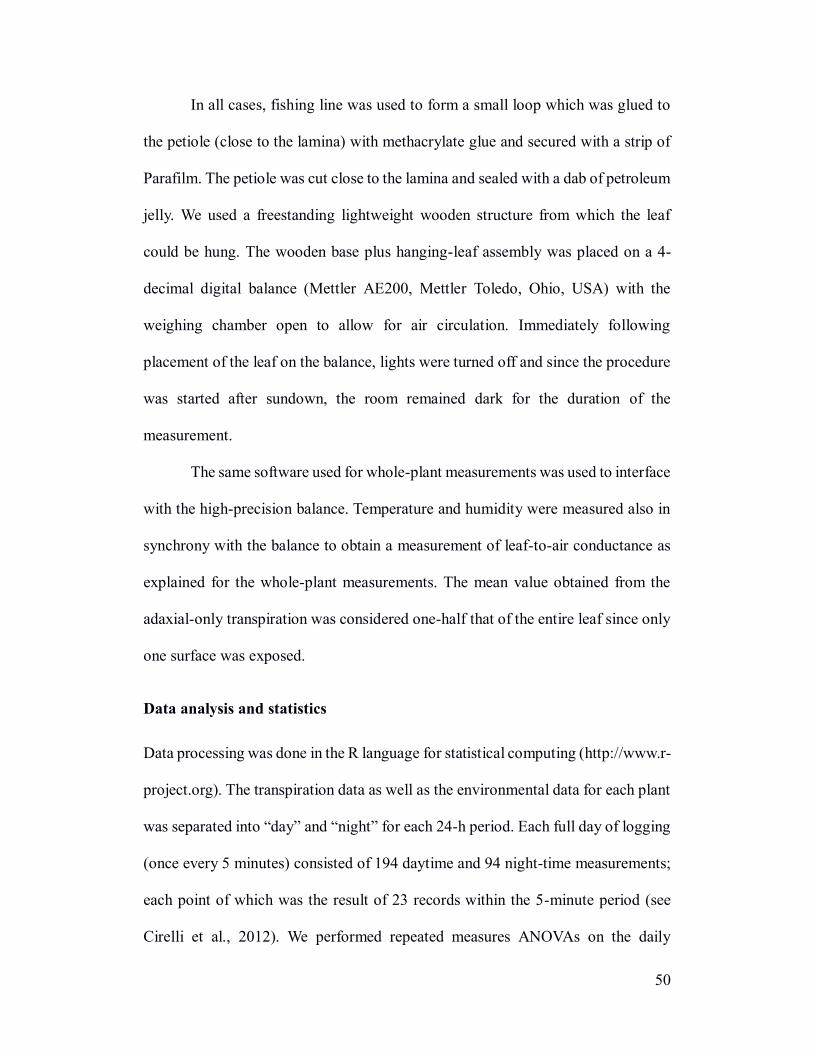
50
In all cases, fishing line was used to form a small loop which was glued to
the petiole (close to the lamina) with methacrylate glue and secured with a strip of
Parafilm. The petiole was cut close to the lamina and sealed with a dab of petroleum
jelly. We used a freestanding lightweight wooden structure from which the leaf
could be hung. The wooden base plus hanging-leaf assembly was placed on a 4-
decimal digital balance (Mettler AE200, Mettler Toledo, Ohio, USA) with the
weighing chamber open to allow for air circulation. Immediately following
placement of the leaf on the balance, lights were turned off and since the procedure
was started after sundown, the room remained dark for the duration of the
measurement.
The same software used for whole-plant measurements was used to interface
with the high-precision balance. Temperature and humidity were measured also in
synchrony with the balance to obtain a measurement of leaf-to-air conductance as
explained for the whole-plant measurements. The mean value obtained from the
adaxial-only transpiration was considered one-half that of the entire leaf since only
one surface was exposed.
Data analysis and statistics
Data processing was done in the R language for statistical computing (http://www.r-
project.org). The transpiration data as well as the environmental data for each plant
was separated into “day” and “night” for each 24-h period. Each full day of logging
(once every 5 minutes) consisted of 194 daytime and 94 night-time measurements;
each point of which was the result of 23 records within the 5-minute period (see
Cirelli et al., 2012). We performed repeated measures ANOVAs on the daily
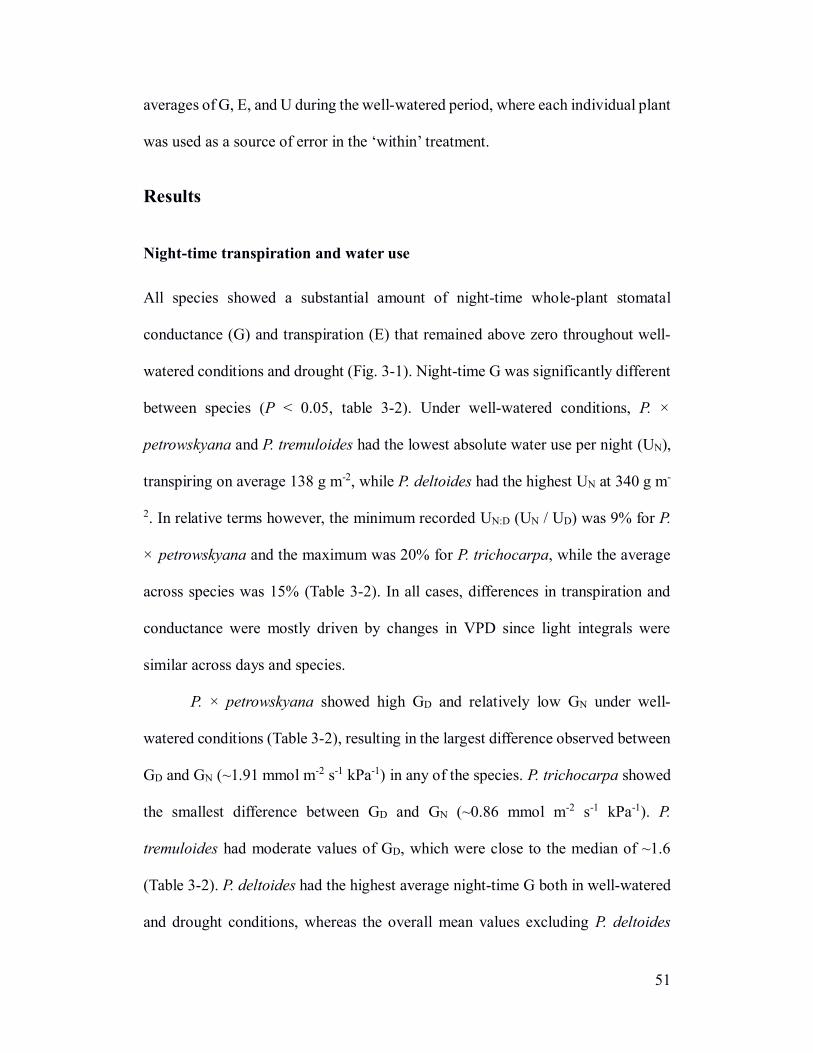
51
averages of G, E, and U during the well-watered period, where each individual plant
was used as a source of error in the ‘within’ treatment.
Results
Night-time transpiration and water use
All species showed a substantial amount of night-time whole-plant stomatal
conductance (G) and transpiration (E) that remained above zero throughout well-
watered conditions and drought (Fig. 3-1). Night-time G was significantly different
between species (P < 0.05, table 3-2). Under well-watered conditions, P. ×
petrowskyana and P. tremuloides had the lowest absolute water use per night (UN),
transpiring on average 138 g m-2, while P. deltoides had the highest UN at 340 g m-
2. In relative terms however, the minimum recorded UN:D (UN / UD) was 9% for P.
× petrowskyana and the maximum was 20% for P. trichocarpa, while the average
across species was 15% (Table 3-2). In all cases, differences in transpiration and
conductance were mostly driven by changes in VPD since light integrals were
similar across days and species.
P. × petrowskyana showed high GD and relatively low GN under well-
watered conditions (Table 3-2), resulting in the largest difference observed between
GD and GN (~1.91 mmol m-2 s-1 kPa-1) in any of the species. P. trichocarpa showed
the smallest difference between GD and GN (~0.86 mmol m-2 s-1 kPa-1). P.
tremuloides had moderate values of GD, which were close to the median of ~1.6
(Table 3-2). P. deltoides had the highest average night-time G both in well-watered
and drought conditions, whereas the overall mean values excluding P. deltoides

52
were 0.48 ± 0.2 mmol m-2 s-1 kPa-1 in well-watered conditions and 0.38 ± 0.2 mmol
m-2 s-1 kPa under drought. GD was also highest in P. deltoides (Table 3-2), although
not statistically different from P. × petrowskyana (P = 0.99).
During the course of drought, all species showed a marked decline in day-
time G. P. deltoides showed lower daytime G under drought mainly in response to
higher VPD since E remained high (Fig. 3-1). P. trichocarpa also showed this
pattern although to a lesser degree. The other species had a decline in both night
time G and E under drought. Nighttime conductance was markedly reduced in P. ×
petrowskyana and P. tremuloides, but not so in P. deltoides or P. trichocarpa (Table
3-2). The contrast between these two groups was maintained after applying plant-
specific VPD corrections. When drought became severe, all species showed similar
GN (about 0.2 mmol m-2 s-1) except P. deltoides, which nonetheless presented a
decline not seen during moderate drought conditions (Fig. 3-2a). The ratio of EN/ED
tended to increase for all species as drought progressed since the rate of reduction
of EN was proportionately less than that of ED (Fig. 3-2b).
In all species, night-time conductance was negatively correlated with VPD.
The slope of this relationship was greater in plants subjected to drought (Fig. 3-3).
P. × petrowskyana was the species with the least difference in GN-VPD slopes
between the well-watered and drought conditions, while it was at the same time the
species with the largest difference in means between such conditions.
Cuticular conductance
Leaves of all species were mostly glabrous, with an occasional trichome along leaf
veins. The mean cuticular conductance (gc) for all species was one order of
53
magnitude below GN (range of gc/GN 0.230 to 0.019) under well-watered conditions
(Table 3-2). Under drought, the mean ratio was 0.24 with a range of 0.52 to 0.088.
None of the slopes of gc versus time were significant (P > 0.01) in the species in
which gc was measured directly, while the opposite was true for measurements of
either bare leaf or leaf with a blocked (sealed) adaxial surface (Fig. 3-4).
Stomatal characteristics and stomatal pore index
Some P. tremuloides leaves had a few stomata concentrated around major veins on
the adaxial side in some of the leaves, but as most did not have adaxial stomata we
consider the plants hypostomatic. P. trichocarpa showed a low stomatal density on
the adaxial side, averaging 11% that of the abaxial surface and being regularly
distributed. Scanning electron micrographs of the leaf surface contained both open
and closed stomata in every sample (Fig. 3-5). The outer ledges on the pore side of
the guard cells were visible in most stomata in all four species, an example of which
can be seen in Figure 3-5c.
Stomatal pore index (SPIv, table 3-3) was lowest in P. tremuloides, owing to
both lower stomatal counts and comparatively narrower stomata. P. × petrowskyana
on the other hand, showed the highest SPIv (Table 3-3), greatly due to more widely
open stomata (higher mean values of stomatal width). We found a positive
correlation between G and SPIv (Fig. 3-6).
Discussion
The most striking finding was the occurrence of night-time transpiration in all
species under drought, whether in obligate riparian species such as P. deltoides or,
54
surprisingly, in upland species such as P. tremuloides. Nocturnal transpiration was
observed under well-watered conditions in all four Populus species and evidence
strongly suggests that stomata are active during the night since VPD was shown to
affect G (i.e. non-linear response of E to VPD; Fig. 3-3). Further evidence of active
stomatal involvement comes from measurements of cuticular transpiration, which
show that the cuticle is only responsible for a small fraction of the leaf transpiration
in the dark (Fig. 3-4). When subjected to moderate drought, two groups could be
identified in terms of night-time water loss which were consistent with habitat
preference: those that maintained high levels of G (and E) after dark comparable to
well-watered conditions (P. deltoides and P. trichocarpa), and those that showed a
marked decline in water use (P. tremuloides and P. × petrowskyana). In either group,
notably, night-time G remained significantly higher than cuticular conductance
during moderate stress, indicating stomatal participation in a water loss process that
could be construed as deleterious to the water relations of trees; this is especially
intriguing in P. tremuloides that frequently experiences water shortages. The
different responses of GN between these 2 groups of species were not associated
with the rates of day-time G or E; on the contrary, sharp contrast in absolute G can
be observed within groups in Figure 3-2. We expand on each of the above points
below.
All species showed a negative correlation between GN and VPD under well-
watered conditions and all the slopes were significant (Fig. 3-3). Howard and
Donovan (2010) found that night-time gs increased during the night in P.
angustifolia but remained constant in P. balsamifera despite both species being

55
exposed to the same, declining VPD conditions, suggesting the action of a
circadiam rhythm in P. angustifolia. We did not find a trend independent of VPD or
evidence suggesting a circadian rhythm in any of the four species. Outside of tree
species, the night-time VPD response we encountered agree with the observations
of Barbour and Buckley (2007) who also show an active nocturnal stomatal
response in Ricinus. Accordingly, we would expect that if appreciable night-time
conductance resulted from residual stomatal openness or simply from cuticular
permeability, GN (and thus night-time gs) should not present a discernible trend
under varying atmospheric demand. An example of such non-responsive stomata
can be seen in droughted Quercus spp. at night (Cavender-Bares et al. 2007).
Values of night-time conductance under drought were between 25 and 55%
of the daytime conductance (these values can be derived from table 3-3 as GN/GD).
Under a 16-hour photoperiod and nights with 50% of the daytime VPD, this can
translate to an integrated night-time water use of about 10% of the diurnal budget
during drought, as was the case in P. tremuloides and P. trichocarpa. The continued
loss of water at night under water stress is in conflict with the optimization
hypothesis (Cowan 1977; Katul et al. 2010 and references therein); this hypothesis
has already been challenged by the occurrence of night-time transpiration under
well-watered conditions but loss of water at night during drought is a much stronger
contradiction. Moreover, the fact that stomata appear to remain open at night even
under stress, albeit to a lesser degree in non-riparian species, suggests that this water
loss is at a time when C gain is not possible and water conservation would appear
paramount.

56
High nocturnal transpiration is not unexpected in anisohydric riparian
species such as P. deltoides, although we had anticipated that drought would exert
more self-regulation at night when no carbon gain is to be had from opening
stomata. Nevertheless, we could see a steeper decline in GN in response to VPD
under drought, compared to well-watered, in both riparian and non-riparian plants
(Fig. 3-3). It is noteworthy that the high day- and night-time conductance of
droughted P. deltoides and P. trichocarpa plants happened in seedlings, which are
often recruited to temporarily flooded high river banks but die once the water level
drops. In this case, their narrow distribution range is reflected in their water-use
patterns.
We could only produce one-sided measurements of cuticular conductance
in hypostomatic leaves, but the bare dehydration method which exposed both sides
of the leaf yielded similar values in amphistomatic species. In all cases, cuticular
conductance was significantly lower than GN, confirming that stomata were
involved in nightly water loss. We also obtained anatomical evidence that, even in
high-transpiring amphistomatous species, stomata seem perfectly capable of
closing fully (see Figure 3-5 for examples of closed stomata of P. deltoides and P.
trichocarpa). A higher magnification image of a closed stoma of P. deltoides (Fig.
3-5c) shows that prominent cuticle-covered outer ledges (and presumably the inner
ledges as well) can overlap and form a tight seam upon closing, likely sealing the
stoma when closed. In addition, as already discussed, the non-linear relationship
between whole-plant conductance and night-time VPD both in non-droughted and
droughted situations (Fig. 3-3) provides further evidence that stomata remain open,
57
in excess of their minimum, whether as a whole or, probably, as part of a patchy
network (Pospíšilová and Šantrůček 1994). Thus, at least in the species we
analysed, we state that night-time transpiration appears to not simply be due to
“incomplete stomatal closure” but more likely has other physiological benefits.
It is interesting to note that daytime conductance in well-watered conditions
appeared to correlate with stomatal pore index. Sack et al. (2005) also found a
similar correlation in tropical species. The SPIv we report, however, conveys a more
realistic value of pore area since we were able to measure the average width and
length of every stoma in the sample and we approximate the opening geometry
averaging an ellipse and a fusiform shape. When the GN/GD ratio was applied to the
daytime SPIv, the resulting values agreed with the correlation (Fig. 3-6).
We modelled GN based on the effects of a theoretical minimum SPI based
on the smallest stomatal opening that we could find for each species, assuming this
minimum would be obtained if all stomata showed the same level of closure. Since
we found completely closed stomata on most species, the minimum SPI resulted in
zero. The values calculated for P. × petrowskyana and P. trichocarpa were higher
since the minimum measured stomatal width was greater than zero for the adaxial
side of P. × petrowskyana and the abaxial side of P. trichocarpa. The calculated
minimum GN for these species was still well below the measured GN (Fig. 3-6).
This provides further insight into the role of stomata in night-time transpiration,
suggesting deliberate opening as the main driver.
There are several hypotheses to explain a functional role of night-time
transpiration. There is some evidence that nutrient availability is linked to nocturnal

58
conductance (Scholz et al. 2007; Barber 1995; Marschner 1995). However, under a
rapid drought cycle, it is unlikely that nutritional status would take precedence in
any but the most extreme nutritional situations, especially since most growth
processes slow down long before carbon fixation becomes limiting due to stomatal
limitations (Hsiao and Acevedo 1974). On the other hand, the flow of sap may
provide an important source of oxygen to internal tissues, particularly those with a
high metabolic requirement, even in situations where conserving water may be
critical. It is conceivable that O2 levels could fall dangerously low without the
replenishment from xylem sap flow (Eklund 2000; Gansert 2003; Daley and
Phillips 2006) particularly within larger stems; lack of O2 could hasten heartwood
formation and slow down the recovery after drought. It is not clear, however,
whether internal tissues are actually susceptible to low oxygen such that reduced
sap flow might have an impact (Spicer and Holbrook 2005).
The evidence presented here clearly shows that there is a wide range of GN
among members of the same genus and species. The source of this variation appears
in part to be the stomatal pore area, although this alone cannot explain the
differences in GN/GD that span across species. The more drought tolerant species
showed some reduction in GN under drought earlier in the drought cycle. However,
those species that reduced EN under drought still maintained a level of GN several
fold greater than gc, thus stomatal involvement seems apparent. The evidence
suggests that night-time sap flow through transpiration may be based on
physiological needs. We believe this warrants further investigations into the nature
and role of night-time conductance in a wide range of species.

59
Tables and Figures
Table 3-1. Species studied; ranked by estimated drought tolerance, from least to most tolerant.
Species Characteristics
P. deltoides Exclusively riparian. Tends to dominate river banks.
P. trichcarpa Wetland species, cannot compete under drier conditions.
P. tremuloides Frequently found in upland sites. Known to respond quickly to drought
(low stomatal conductance, Lu et al., 2009).
P. × petrowskiana Hybrid of P. nigra × P. laurifolia. Both parents are drought tolerant. In
previous experiments this clone showed the highest level of isohydry.
Table 3-2. Average whole-plant conductance (G) and water-use under well-watered and drought
conditions, and minimum night-time conductance (GN) under the maximum level of drought achieved before total leaf desiccation (Max. Dr.). Different superscript letters indicate statistically
significant differences (p < 0.05). Bold numbers show the maximum value in the column. All units
are mmol m-2 s-1 kPa-1 except where % is indicated.
Species
Well-watered
Drought
Max.
Dr.
GD GN UN:D
(%)
GD GN UN:D
(%)
GN dec.1,2
(%)
GN gc*
Populus
deltoides 2.45 0.93a 17 2.40 0.92 18 1( 0) 0.73 0.0646
Populus
trichcarpa 1.62 0.76ab 20 1.49 0.71 22 6( 8) 0.17 0.0149
Populus
tremuloides 1.64 0.56bc 15 0.91 0.37 19 33(33) 0.17 0.0543
Populus × petrowskyana
2.43 0.52bc 9 1.07 0.28 14 46(46) 0.14 0.0318
Means 1.57 0.57 15 1.16 0.47 18 0.23 0.0422 1Represents % decline of GN under drought with respect to GN under well-watered conditions. 2Numbers in parentheses are VPD-adjusted (see Methods). *gc: cuticular conductance.

60
Table 3-3. Stomatal characteristics. Different superscript letters within the same column indicate statistically significant differences (p < 0.01). adax: adaxial side; abax: abaxial side.
Species
Stomatal density
mm-2
Relative1
stomatal
ratio
Stomatal
length
(adax / abax)
Stomatal
width
(adax /
abax)
Stomatal
pore index
(adax +
abax)
adaxial abaxial total adax:abax µm µm ×10-3
P. deltoides 89±10 120±19 209 43:57 24.5/20.2 5.0/4.9 11.37b
P. trichcarpa 20± 8 175± 8 195 10:84 25.8/22.0 5.3/4.3 10.63b
P. tremuloides - 116±17 116 0:56 - /22.2 - /5.3 4.93c
P. ×
petrowskyana 46± 8 147±23 193 22:70 23.5/21.8 5.0/6.3 17.07a
1Relative to the total density of P. deltoides.

61

62
Figure 3-1. Whole-plant conductance (G, solid black trace) and transpiration (E, dashed
black trace) of the four Populus species before and after drought (point-for-point average
of 5 plants per species). pdelt: P. deltoides; ptric: P. trichocarpa; ptrem: P. tremuloides;
ap42: P. × petrowskyana. G is shown with its standard deviation (gray envelope). Light-
gray vertical bands indicate the night period. The first 3 days correspond to well-watered
conditions, followed by the last 4 days of drought ending in total leaf mortality. A black dotted horizontal line denotes the zero mark; a gray dashed horizontal line marks the
average night-time G (five-night average) during the well-watered period. Night-time G
and E are indicated also as a % of previous day-time period. On the last night, additional
percentages of G and E are shown, which represent the G and E of that night, as a percent
of the five-day average rates under well-watered conditions.

63
Figure 3-2. Summary of day- and night-time whole-plant stomatal conductance (G) by
drought intensity (a) and general relative response to drought (b). Overlapping bars in (a)
are non-cumulative and show GD (solid bars) and GN (striped bars) under well-watered
conditions (light bars), moderate drought (medium gray bars) and severe water shortage
(dark bars). Error bars are one-sided standard deviations. pdelt: P. deltoides; ptric: P.
trichocarpa; ptrem: P. tremuloides; ap42: P. × petrowskyana. (b) Ratio of night to
daytime conductance GN/GD of all species combined under 4 days of well watered
conditions and then increasing drought.

64
Figure 3-3. Night-time whole-plant stomatal conductance (GN) in response to night-time VPD under well-watered (larger gray points, solid line) and moderate drought (smaller
black points, dashed line) conditions. All linear regression slopes showed a significant
decline; i.e. slopes significantly different from zero (P < 0.05).
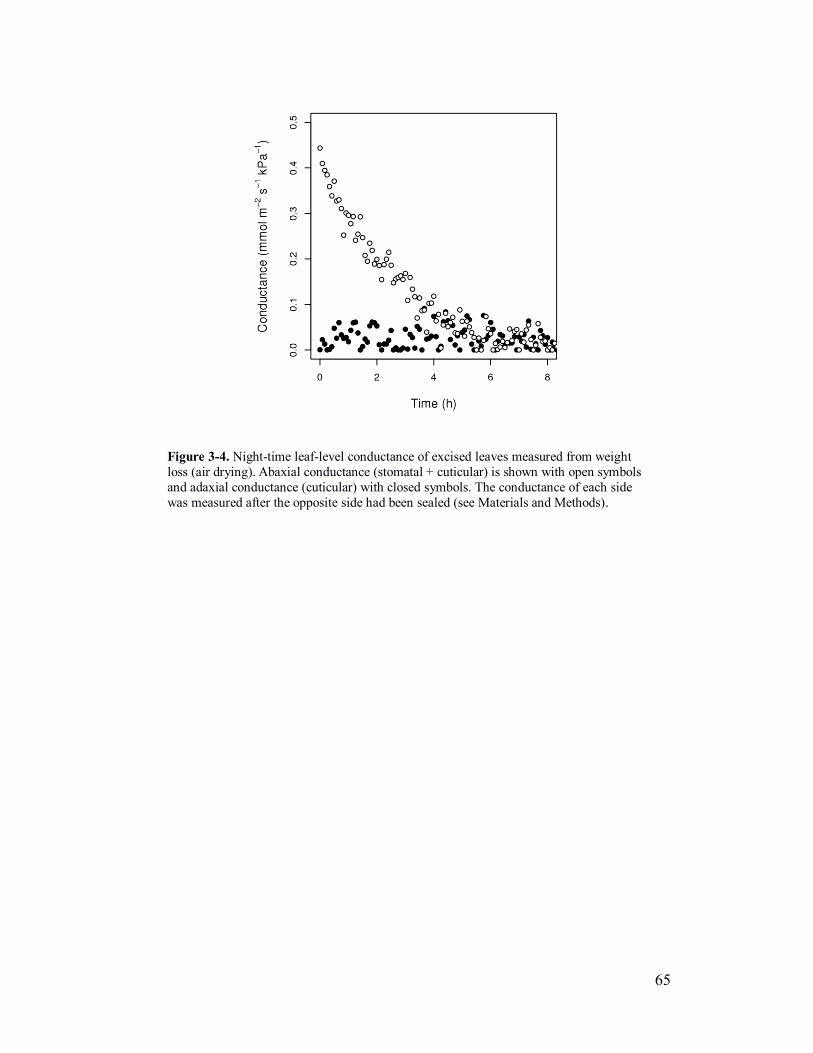
65
Figure 3-4. Night-time leaf-level conductance of excised leaves measured from weight
loss (air drying). Abaxial conductance (stomatal + cuticular) is shown with open symbols
and adaxial conductance (cuticular) with closed symbols. The conductance of each side
was measured after the opposite side had been sealed (see Materials and Methods).
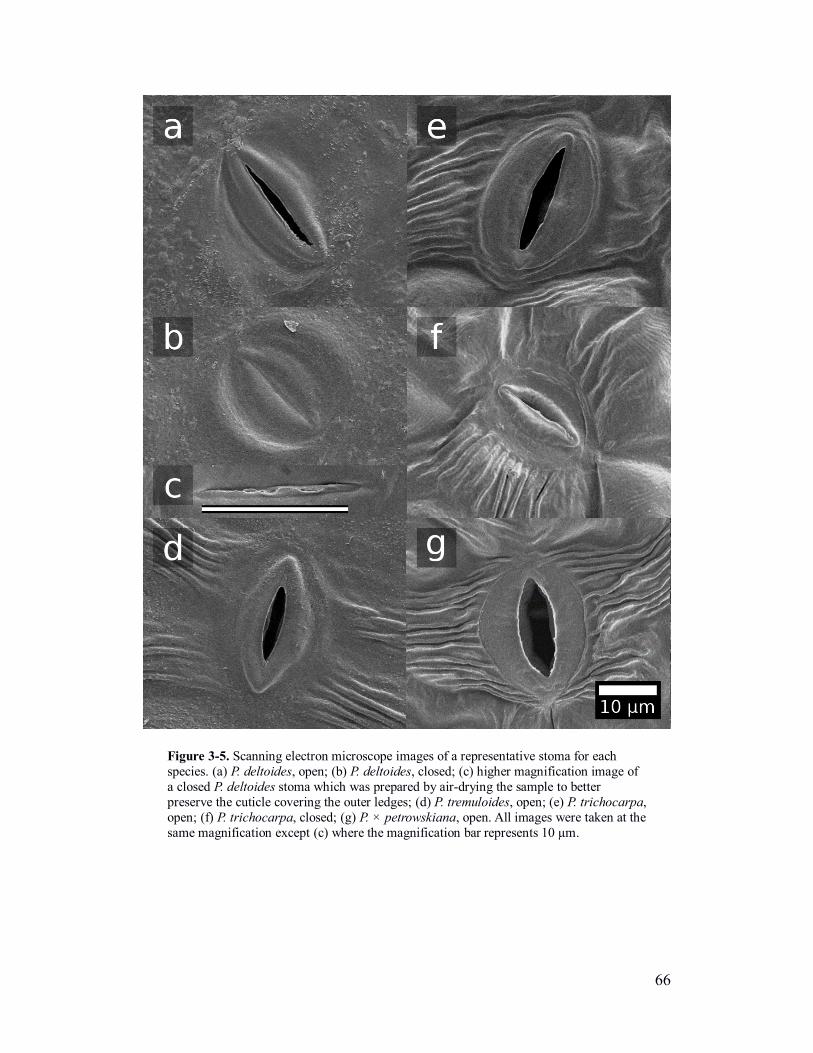
66
Figure 3-5. Scanning electron microscope images of a representative stoma for each
species. (a) P. deltoides, open; (b) P. deltoides, closed; (c) higher magnification image of
a closed P. deltoides stoma which was prepared by air-drying the sample to better
preserve the cuticle covering the outer ledges; (d) P. tremuloides, open; (e) P. trichocarpa,
open; (f) P. trichocarpa, closed; (g) P. × petrowskiana, open. All images were taken at the
same magnification except (c) where the magnification bar represents 10 µm.
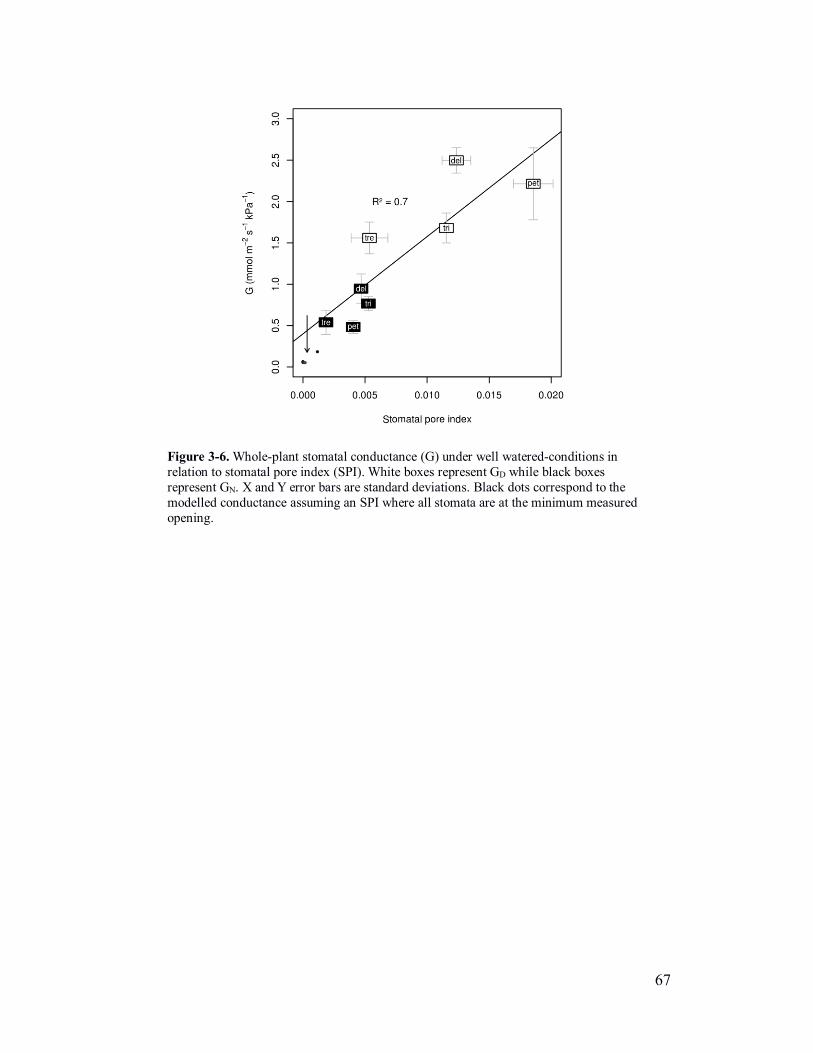
67
Figure 3-6. Whole-plant stomatal conductance (G) under well watered-conditions in
relation to stomatal pore index (SPI). White boxes represent GD while black boxes
represent GN. X and Y error bars are standard deviations. Black dots correspond to the
modelled conductance assuming an SPI where all stomata are at the minimum measured
opening.

68
Chapter 4. N form affects whole-plant conductance and
root anatomy in two contrasting Populus hybrid clones
Introduction
Plants exert tight control over water movement by varying the resistance to water
flow at different checkpoints along its path. Although the role of transpiration (E)
in various functional processes continues to be a controversial topic, some clues
point to a link between mineral nutrition and the regulation of water flow, nitrogen
being of particular interest in this respect (Gorska et al. 2008; Cramer et al. 2009;
Matimati et al. 2014).
Mineral N available to plants occurs primarily in two forms: nitrate (NO3-)
and ammonium (NH4+). NO3
- is most commonly found in early successional
environments after a disturbance and it is characteristically labile. In many species,
NO3- seems to have a stimulatory effect on plant water transport, affecting different
physiological functions of both roots and leaves. A localized increase in soil [NO3-]
can lead to a rapid increase in root hydraulic conductance in herbaceous species
(Clarkson et al. 2000; Gloser et al. 2007; Gorska et al. 2008; Cramer et al. 2009).
This coupling of NO3- and water conductance appears to be driven by changes in
the hydraulic properties of the cell membrane, mediated by intracellular [NO3-]
(Gorska et al. 2008). Therefore, NO3- might act as a hydraulic signal to rapidly
coordinate responses at the whole plant level (Gorska et al. 2008). Unlike NO3-,
NH4+ has not been shown to increase root hydraulic conductance (Guo et al. 2007).
69
Some studies suggest that increased nutrient acquisition and delivery could
be achieved through transpiration-mediated mass flow (Ludwig et al. 2006; Cramer
et al. 2009; Matimati et al. 2014; Cirelli, unpublished data). In this context, NO3--
induced changes in root hydraulic conductivity might contribute to the acquisition
of N by mass flow, while also contributing to the flow of other soil-mobile nutrients
toward the rhizosphere (Cramer et al. 2009). It has been argued nocturnal
transpiration (EN) is linked to nutrient uptake under situations of nutrient limitations
(Ludwig et al 2006; Scholz et al 2007), but this has not been supported by other
studies (Howard and Donovan 2007, 2010; Kupper et al 2012). Furthermore, the
impact of form of N on EN remains unaccounted for. Maintaining EN could be
beneficial when water is plentiful and mobile nutrients are scarce. As NO3- is more
mobile than NH4+, it may be possible that plants under NO3
- nutrition display a
higher EN than those under NH4+.
The form of N is also known to induce changes in root morpho-anatomy. In
several species, plants tend to develop thinner roots under NO3- nutrition than under
NH4+ nutrition (Anderson et al. 1991; Cruz et al. 1997). In two hybrid poplar clones
(Populus maximowiczii × P. balsamifera), NO3--fertilized trees had higher
fine:coarse root ratios and higher specific root length (length-to-mass ratio) than
NH4+-fertilized trees (Domenicano et al. 2011). It has been suggested that the
thinner roots produced under NO3- would reduce the resistance to lateral water flow
(Cruz et al. 1997), although the cytological basis underlying N-form-mediated
changes in root diameter and specific root length are poorly documented (Walch-
Liu et al 2006). A study performed in Arabidopsis showed that a localized supply

70
of NO3-, but not NH4
+, stimulates the development of lateral roots by increasing
rates of cell production in the root tips (Zhang et al. 2007). The authors concluded
that the developmental change was triggered as a result of the signaling properties
of the NO3- ion itself. However, and despite the importance of NO3
- signaling, the
effects of N form on anatomical features have not been described for a wide range
of species, including Populus.
The physiological and morpho-anatomical changes induced by the form of
N are also associated with differences in growth. Issues of NH4+ toxicity aside, the
activation of the regulatory mechanisms by which plants adjust their metabolism of
specific N forms may, secondarily, impact carbon assimilation and water relations.
Nitrate needs to be reduced to NH4+ in order to be used by the plant and this is
energetically expensive steps, because the reduction of NO3- to NO2 by nitrate
reductase (NR), and the subsequent reduction of NO2- to NH4
+ by nitrite reductase
(Gerendás et al. 1997) requires energy. However, the costs for the reduction of NO3-
to NH4+ is lower if the conversion takes place in the leaves instead of roots because
it can be coupled directly to the electron transport chain. On the other hand, NH4+
seems to have an inhibitory effect on photosynthesis which, at least in vitro, has
been proposed to be related to the uncoupling of electron transport from
photophosphorylation in chloroplasts due to NH4+ accumulation in leaves
(Gerendás et al 1997). Agricultural crop species supplied with NH4+ generally have
lower water use efficiency (WUE) than those supplied with NO3- (Cramer et al.
2009). Information regarding N-form-mediated effects on transpiration, carbon
assimilation and water use efficiency has not been assessed in Populus species.

71
In this study we assess the effects of N form on whole plant physiology in a
fast (AP2403) and slow (AP9) growing poplar hybrids. Specifically, we assess day-
and night-time conductance, net photosynthesis and growth, and foliar nutrient
concentrations. We also investigate developmental changes at the leaf and root
level. We pursue the following hypotheses: (i) inorganic nitrogen in the form of
NO3- increases whole-plant conductance (particularly night-time) relative to NH4
+,
(ii) the increased transpiration under NO3- nutrition will have a secondary effect on
the delivery of other nutrients such as K and Ca, for which mass flow is an important
form of acquisition and delivery, and (iii) plants under NH4+ nutrition will produce
thicker roots since they appear to be the main site of NH4+ metabolism. Given that
higher growth rates have been associated with higher conductance (Tyree 2003) and
fast-growing poplar clones have been shown to be more sensitive to N fertilization
than slow-growing clones (Li et al. 2012), we expect that N form would have an
overall greater effect in AP2403.
Materials and Methods
Plant material and general growth conditions
Clones of two Populus hybrids were grown from cuttings provided by Alberta-
Pacific (Al-Pac, Canada); AP2403, a fast-growing (P. deltoides × P. ×
petrowskyana) × P. × petrowskyana hybrid (P. × petrowskiana being the hybrid P.
nigra × P. laurifolia), and AP9, a slow-growing P. balsamifera × P. deltoides hybrid.
The characterization as 'fast'- and 'slow'- growing is based on growth data from Al-
Pac’s evaluation of different hybrids in field plantations in central Alberta, Canada
72
(Dr. Barbara Thomas, personal communication). The same characteristics were
observed in our own trials in potted plants growing outside on a roof-top patio.
Frozen cuttings of each clone, ~ 10 cm in length, were soaked in tap water
for 24 hours at room temperature, then rinsed and planted in Rootrainers®
propagation trays (Beaver Plastics, Acheson, Alberta, Canada) containing LA4
potting mix (Sun Gro Horticulture, Canada). Once planted, the cuttings were
watered once with a high-P liquid fertilizer containing indole-3-butyric acid to aid
initiation of adventitious roots. The planted cuttings were put in a roof-top
greenhouse where they remained for the duration of the experiment. When plants
had an average of 10 leaves, they were removed from the Rootrainers® and their
roots carefully washed to remove as much of the potting mix as possible, then
transplanted to 5-l pots. A mix consisting of equal parts washed silica sand and
perlite was used as substrate to minimize the cation exchange capacity around the
roots. After transplantation, plants were allowed to grow for 4 weeks before
applying the treatments, to an average height of 70 cm with 26 leaves for AP2403
and 77 cm with 30 leaves for AP9. During this time, plants were given 14-14-14
NPK in liquid form once immediately following transplantation and once after 2
weeks. Plants were watered twice daily to offset the fast-draining quality of the
substrate and they never showed any signs of water stress. Supplemental light was
provided by grow light fluorescent tubes and the daily photosynthetically-active
radiation average was 400 µmol m-2 s-1. Average temperature throughout the
experiments was 21 ± 3 °C.

73
Application of N in different forms
Sixteen plants of each hybrid were randomly selected and watered with distilled
water 8 times in the course of 2 days, each time allowing enough water
(approximately the volume of the pot) to percolate so that remaining nutrients
adsorbed to the substrate could be leached out. Plants were then watered with a
complete nutrient solution with a [N] of 2 mM either as NaNO3 or NH4Cl. This
concentration was selected to reflect average N levels in boreal forest soils (Larcher
2003). The pots were placed in a holding tub and twice watered to excess with the
nutrient solutions to fully flush existing nutrients from the soil. The same nutrient
solutions were used to water the plants twice daily for the remainder of the
experiment. An exception to this was that once, midway through the experiment,
pots were well-flushed with distilled water to avoid accumulation of salts in the
substrate. The nutrient solution was prepared in 6.5 pH 0.4 mM phosphate buffer
every 2 days from separate stocks. The composition of the nutrient solution is
presented on table 4-1.
Transpiration and whole-plant conductance
The Amalthea system (see Cirelli et al. 2012) was used to continuously monitor
transpiration (E) by gravimetric water loss. Briefly, 8 top-loading balances were
used (Adam PGW 4502e, Adam Equipment, USA) to simultaneously monitor water
loss in 4 plants of each treatment for 7 days, one hybrid at a time. Because of the
constraint imposed by the amount of balances available, the hybrids were measured
sequentially, first AP2403 and then AP9. Thus, the beginning of treatment for AP9
was delayed 7 days with respect to AP2403 to offset the time chosen to monitor
74
transpiration. The balances were arranged in two rows along a greenhouse bench,
such that each row of balances was below a row of light fixtures. The balances were
connected via USB-to-serial cables to a USB hub and finally to a laptop running
the Amalthea software under Ubuntu 10.04. Power for the balances and laptop was
provided by a voltage-stabilising uninterruptible power supply. The balances were
calibrated with reference weights before each set of measurements.
Four plants of each treatment were randomly selected. After being watered
and fully drained, each pot was blotted dry and its top covered with aluminium foil.
Drain holes were left uncovered. Each plant was randomly assigned to a balance,
and extra plants from both treatments were placed around the balances to provide a
minimal canopy and minimize edge effects. Every day the system was paused, one
balance at a time, to water that plant with the appropriate nutrient solution by the
amount lost since last being watered; no water drained from the pot. This was done
once in the morning and once in the evening. The measurement of transpiration
continued for 7 days to provide a short-term measurement after initial treatment.
The same procedure was repeated a second time for each clone, 5 weeks after the
beginning of treatment on the same plants, to provide a long-term measurement.
This second measurement also lasted 7 days.
Throughout the transpiration measurements, light, temperature and
humidity were monitored by sensors placed in mid canopy and above the canopy
as well. Sensor assemblies were constructed specifically for this task following the
open-sourced specifications of the microviron project
(http://microviron.sourceforge.net). This allowed the transpiration measurements
75
and the environmental measurements to be synchronized point-for-point. Whole-
plant stomatal conductance (G) was calculated as E divided by the atmospheric
vapour pressure deficit (VPD) once the evaporation rates had been converted to
actual E by leaf area (see below). The calculation of 𝐺 = 𝐸 𝑉𝑃𝐷⁄ assumes that the
average leaf temperature is equal to the surrounding air temperature. Although
under higher light intensities the effect of radiation on leaf temperature becomes
significant, appropriate modelling was performed to account for leaf heating. For
brevity, these calculations are not shown. However we report that allowing for a
temperature difference of 2 ºC between treatments did not alter the differences
observed nor the interpretation of the results. In absolute terms, not accounting for
leaf heating results in the overestimation of conductance during the day by about
15 to 20% for maximum allowed temperature increases of 2 to 5 ºC. Night-time
results are unaffected.
Leaf area and growth measurements
One day prior to starting the transpiration measurements, the leaf area of each plant
was recorded non-destructively. The incremental leaf area of every plant was
recorded 4 more times, once every 2 days for a total of 5 data points. To measure
the area, the width (W) and length (L) of each leaf was taken using a Vernier
calliper. The area of each leaf was calculated as 𝑎 = 𝑊𝐿𝑓, where f is a species-
specific factor (0.6237 for AP2403 and 0.6924 for AP9) previously determined by
a calibration constructed from destructive measurements (data not shown). A
quadratic function was fitted for each plant using the 5 leaf area points obtained,
versus time expressed in UNIX epoch seconds. The output from Amalthea contains
76
a time value associated with every point, which is also in UNIX epoch seconds (also
known as “timestamp”). The timestamps from the balances were used as input for
the area function of every plant. This provided a value of leaf area for every plant
and for each data point in the water loss output from Amalthea, with which to
calculate transpiration on a leaf-area basis.
The same procedure was repeated a second time for the measurements of
long-term effects. Every time a leaf area measurement was taken, height was also
recorded. Once the experiments had ended plants were harvested, separated into
leaves, stems, and roots, and dried in an oven at 70 °C. The weight of the separate
dry parts was determined. The last 3 fully-expanded leaves of every plant were
dried and weighed separately, then ground for chemical analysis.
CO2 response curves and stomatal limitations
To analyse limitations to photosynthesis (A), CO2 response curves (A/Ci curves)
were constructed using a LI-COR 6400 (LI-COR, Lincoln, Nebraska, USA) infra-
red gas analyser (IRGA). During the second set of transpiration measurements
(long-term effects), plants were removed from the balances one at a time to be
measured with the IRGA. The measurements were taken between the hours of
10:00 and 13:00. Because of the time required to create the A/Ci curves, only 3 to
4 plants were measured in one day for a total of 6 plants per treatment. Priority was
given to constructing the A/Ci curves during approximately the time of day when
photosynthesis is naturally at its maximum. CO2 was provided by cartridges and
progressively higher concentrations were used in the IRGA chamber in the order:
400 (for initial reference in atmospheric conditions), 50, 100, 200, 300, 400, 400,
77
600, and 800 ppm. Light intensity was set at 1500 µmol m-2 s-1 PAR so as to not be
limiting. In every case, the conditions of temperature and humidity inside the IRGA
chamber were matched to those measured in the open air around the vicinity of the
plants prior to starting the response curve. Since our primary interest was to assess
stomatal limitations to photosynthesis, we chose to fit a single, exponential-rise-to-
maximum, model for the entire curve of the form 𝑦 = 𝑜 + 𝑎(1 − 𝑒−𝑏𝑥). The
function was fitted using the pooled values from each plant in a treatment. Stomatal
limitations were calculated as:
𝐿𝑆 =𝐴0 − 𝐴𝐿
𝐴0
where A0 is the assimilation rate at 400 ppm internal CO2, (Ci = 400 ppm, i.e.
without limitations) and AL is the assimilation rate at 400 ppm external CO2 (Ca =
400 ppm).
Leaf nutrient analysis
Upon the beginning of treatments, the youngest visible leaf was marked. Samples
were collected from 6 plants from each treatment, starting with leaf number 5 after
the marked leaf. The samples were oven-dried and ground in a Wiley mill with a
number 40 mesh. Total N and P concentrations were determined with a SmartChem
200 (Unity Scientific, USA) discrete wet chemistry analyzer after sulfuric acid –
hydrogen peroxide digestion. The concentrations of K and Ca were determined
using a model AA880 atomic absorption spectrophotometer (Varian, Australia).
78
Anatomy
Impressions of both leaf surfaces were taken to analyse stomatal anatomy. Clear
nail polish was applied as a thin coat on either leaf surface, and lifted from the leaf
with the aid of clear sticky tape. The impressions were mounted onto glass slides
for viewing in the light microscope. Digital images were captured for analysis with
ImageJ (Abramoff et al. 2014). Stomata were counted and measured in length.
Leaf discs of the most recent fully-expanded leaf were taken with a hole-
punch, from areas occupied by tissue in between veins of order n-1. Samples were
immediately placed in vials with FAA and stored on ice for a maximum of 30 min
until they were placed under vacuum in the lab, where they were left overnight. The
tissue was included in paraffin wax, cross-sectioned and stained with Safranin –
Fast-Green. Digital bright-field images were captured for processing and analysis
with GIMP (GNU Image Manipulation Program, http://www.gimp.org/) and
ImageJ (http://www.imagej.net/). The thicknesses of each epidermis and each
mesophyll layer were measured.
Root tips 3 cm in length were collected from each plant. From these excised
pieces, a portion less than 1 cm long was taken from the proximal end. Both
resulting pieces were placed in FAA and processed in the same way as the leaf
tissue. The proximal sample was then prepared for cross-sectioning. We used
longitudinal sections of the distal samples to confirm that the features in the cross
sections obtained from the proximal samples corresponded to fully-mature tissue.
Images of the cross sections were captured and analysed. Tissue boundaries were
delineated at the interface between vascular cylinder and cortex, and cortex and
79
exodermis, in low-magnification images (2.5X objective) where the entire root was
visible. The areas of each of these groups were measured. Higher magnification
(10X objective) was used to capture images for analysis of vessels in the vascular
cylinder. These images included a representative wedge of approximately one-
quarter of the root. The lumen area of each vessel in the sample was measured.
Allometric calculations and integrated intrinsic water-use efficiency
Defining t0 as the beginning of treatment and t1 as the time when plants were
harvested, total plant mass at t0 was calculated as:
𝑚0 = 𝑚𝑠0 + 𝑚𝑠0𝑞
where m0: total plant mass at t0, ms0: mass of the shoot at t0 and q: root:shoot ratio.
The individual plant components at t0 were obtained from:
𝑚𝑠0 = 𝑚𝑎0 + 𝑚𝑏0
where ma0: leaf mass at t0 and mb0: stem (bole) mass at t0, given:
𝑚𝑎0 =𝑎0
𝛾𝐿
and
𝑚𝑏0 =𝑚𝑏
(𝑑ℎ
𝑑0ℎ0)
=𝑚𝑏𝑑0ℎ0
𝑑ℎ
where a0: leaf area at t0, γL: leaf specific weight, mb: mass of the stem at t1, d0: stem
base diameter at t0, h0: stem height at t0, d: stem base diameter at t1 and h: stem
height at t1.
Leaf specific weight and R:S corresponding to plants from the NO3- treatment was
used to back-calculate m0 for plants in the NH4+ treatment. This was done because
80
both groups of plants were fed a low level of NO3- during early development, and
since the NO3- plants grew larger it is more conservative to use them as the basis
for m0 without overestimating Δm.
The integrated intrinsic water-use efficiency was calculated as:
𝜂𝑤𝑖 =
𝛥𝑚
�̅�𝑤
where Δm is the difference in total mass between t1 and t0, and Gw is the average
of the weighted means of G at t1 and t0 such that:
𝐺𝑤 =�̅�𝑁
3+
2�̅�𝐷
3
where �̅�𝑁 and �̅�𝐷 are the average night-time and day-time G. Since G was lower in
the second measurement (before harvest) than at t0, �̅�𝑤 assumes that the decay in G
between t0 and t1 was linear.
Statistics
All analysis were performed using the R language for statistical computing
(http://www.r-project.org/). Given the natural modal variation during the day, G
values were separated in two groups for analysis, one corresponding to the first half
of the day-time period and the other to the second half. The sums of the G values
for each day-time half and for the night-time period were compared between
treatments using a repeated-measures two-way ANOVA where the different days
were included in the error term and the hybrids were included in the interaction
term.
Measurements that were not cyclically dependent on time were compared
between treatments using two-way ANOVAs allowing for an interaction term

81
between the hybrids and the treatments. These included quantifications of
anatomical characteristics such as stomatal density tissue areas as well as growth
parameters and foliar nutrients. Where appropriate, one-way ANOVAS were
applied after rejecting a non-significant interaction term.
Results
The form of N nutrition affected whole-plant stomatal conductance (G),
photosynthesis and growth in both poplar hybrids. The fast-growing clone AP2403
showed 10% lower daytime conductance for NH4+-fed plants shortly after
beginning treatment (fig. 4-1, 1 week). Nighttime conductance for AP2403 was also
lower in the NH4+ treatment but only marginally. Conversely, the NH4
+-fed plants
showed slightly increased G in AP9 after one week of treatment but differences
were not significant (p > 0.05). After longer exposure to different N forms, all
NH4+-fed plants showed lower G (fig. 4-1, 5 weeks). In both clones, the difference
between NH4+- and NO3
--fed plants was only significant during the day (p < 0.05).
However, nighttime conductance also showed a small decreasing trend in the NH4+
treatment in both hybrids. In general, plants showed a decreasing trend over time
in conductance, assimilation, and leaf expansion rates regardless of treatment.
Differences in GN were significant between hybrids. No significant interaction was
found between hybrids and treatments (p > 0.05); indicated differences henceforth
are based on one-way ANOVAS.
Overall, projected patterns of water use at constant VPD were different
between the clones but did not change with the form of N (table 4-2). During 5
weeks of treatment, AP9 had a projected water use of 94 l when fed NO3- and 78 l

82
when fed NH4+. This represents an excess of 50% the water use of AP2403 under
NO3- and 70% under NH4
+ (table 4-2); a good part of this difference being driven
by nocturnal transpiration (at constant VPD). In both hybrids, the difference in
whole-plant day-time conductance between treatments was more accentuated near
midday, becoming less pronounced toward the night. Despite the general difference
in conductance, the variations within the diel pattern were almost identical between
treatments. Both hybrids presented lower conductance in relation to incident light
in the NH4+ treatment. This was seen as a reduction in the slope of conductance as
a function of light, and not simply to lower overall conductance (fig. 4-2).
Plants under the NH4+ treatment showed reduced assimilation rates in both
clones. The maximum photosynthetic rate at atmospheric [CO2] was reduced by
approximately 30% in AP2403 and close to 20% in AP9. In both clones, the
recycling of triose phosphates (plateau portion of the curves) was affected when the
N form was NH4+ (fig. 4-3). Enzymatic activity also appeared to be lower in the
NH4+ treatment, as hinted by the decline in the slope of the lower [CO2]-portion of
the A/Ci curves (fig. 4-3). Based on the A/Ci curves, stomatal limitations were
slightly lower in the NH4+ treatment in AP9. In AP2403 on the other hand, stomatal
limitations increased almost twofold in the NH4+ treatment compared with the NO3
-
treatment. Water-use efficiency was negatively impacted under NH4+ nutrition
showing a 14% decline in AP2403 and 31% in AP9 (table 4-3).
Growth was markedly reduced in NH4+-fed plants with respect to NO3
--fed
plants. Total dry weight was 20% lower in AP2403 and 29% lower in AP9. Both
hybrids showed a reduction of 35% in stem dry weight and 32% in leaf dry weight

83
(table 4-3). In contrast with the aerial part, root dry weight increased by about 30%
in AP2403 in the NH4+ treatment, and only by 5% in AP9 (table 4-3) Consequently,
root-to-shoot ratios of NH4+-treated plants increased twofold in AP2403 and 64%
in AP9. Leaf size (and leaf relative expansion rate) was also diminished in both
clones by about 20% (LA5E, table 4-3). NH4+ nutrition slowed the rate of leaf
appearance (LAR) in both hybrids, from approximately 1 leaf every 2 days, to
around 1 leaf every 3 days (table 4-3). Plant height was affected considerably in
AP2403 with ~20% reduction in NH4+, but not so much in AP9 (table 4-3).
Differences in nutrient concentration between treatments were found in both
clones. Nitrogen concentration was lower in the NH4+ treatment in both clones, with
a significant difference of 17% in AP2403 and 12% in AP9 (table 4-4). Similarly to
[N], [K] was consistently lower in the NH4+ treatment, but the difference was only
significant in AP9 showing a 20% decline (table 4-4). In contrast, [P] was lower in
the NO3- treatment by about 25% in AP2403 and 28% in AP9. These differences in
[P] were highly significant in both clones (table 4-4). [Ca] was also lower in the
NO3- treatment in both clones. This decline was less pronounced in AP2403 (10%)
and was only significant in AP9 which amounted to 24% (table 4-4).
Aside from the change in leaf size, leaf anatomy did not seem to be radically
affected by the form of N except for appreciable changes in cell size of the
mesophyll. However, leaf thickness did not follow a consistent pattern in both
clones in response to N form. Leaves of AP2403 that developed under NO3- as the
N source were thicker than their NH4+ counterparts by 8%. The greater thickness in
the NO3- treatment was primarily due to a pallisade layer which contained larger
84
cells. The opposite response was observed in AP9 in which leaves from the NH4+
treatment were 7% thicker and mostly because of a thicker spongy mesophyll with
a small contribution from both epidermis (fig. 4-4). In the external anatomy,
stomatal density of the abaxial side in both clones, showed slightly fewer stomata
in NO3--fed plants (not significant). This small difference was annulled in AP9
clone in which the trend was reversed on the adaxial surface, while the adaxial side
of AP2403 did not show differences (table 4-5).
Large differences were found in root diameter. In both clones, roots
developed in NH4+ were 29% larger in diameter compared with the NO3
- treatment
(fig. 4-5). When considering the exodermis, the cortex, and the vascular cylinder of
the root, tissue proportions on a cross-sectional area basis remained fairly constant
in AP2403. In AP9 however, roots from the NH4+ treatment had a thinner exodermis
and a proportionately larger vascular cylinder in comparison with the NO3-
treatment (fig. 4-5). The vascular cylinder of NH4+-fed plants contained larger
vessels. Remarkably, the result was the same in both clones, where the mean vessel
diameter was 39 µm in the NH4+ treatment and 34 µm under the NO3
- condition
(fig. 4-5). In AP2403, the vessel frequency distribution was evenly shifted toward
zero in the NO3- treatment compared with the NH4
+ treatment. In AP9 on the other
hand, the distribution was slightly compressed on the right hand side in the NO3-
treatment, that is, minimum vessel size remained constant. There was a tendency in
both clones, to form more vessels in groups of two or more in the NH4+ treatment,
rather than the mostly solitary arrangement displayed by roots of the NO3- treatment
(fig. 4-5).
85
Although vessel size changed equally in both hybrids, in AP9 the larger
vessel size of the NH4+ treatment was counteracted by a lower vessel density,
resulting in comparable vessel-to-xylem area ratios in both treatments. In AP2403,
no significant difference in vessel density was found between treatments, which,
because of the larger vessel diameter, resulted in significantly larger vessel:xylem
area in the NH4+ treatment (table 4-6). Nevertheless, taking into account the
relationship between total area of vessels to total area of root in cross-section, the
different changes shown by the hybrids resulted in an increased vessel:root area in
the NH4+ treatments. This was more marked in AP2403 (46%) than in AP9 (27%,
table 4-6).
Discussion
The form of N fed to the plants had a significant impact on whole-plant
conductance. Specifically, GD was higher in both clones when N was supplied as
NO3-. The fast growing hybrid AP2403 showed higher transpiration within a week
of NO3- treatment while the slow growing AP9 did not, and in fact it showed slightly
higher E with NH4+ fertilization. After five weeks of treatment however, both
hybrids showed significantly higher day-time conductance and a small increase in
night-time conductance under the NO3- treatment compared with NH4
+. This is a
seemingly simple response, but anatomical and physiological evidence suggests a
slew of coordinated plant changes which may be both primary and secondary to one
or many signals from N form. In addition to the differences in transpiration, we
observed differences in photosynthetic rates, growth, leaf anatomy, and profound
changes in root anatomy. Most of the changes were paralleled in both hybrids, and
86
in similar proportions between treatments. We discuss each change and the possible
connections between them.
Despite differences in conductance, we found no differences in stomatal
density or in potential maximum pore index of either leaf surface between
treatments. This strongly suggests that differences in whole-plant stomatal
conductance must have been driven by changes in stomatal aperture, either in
response to the form of N or to some physiological difference attributable to N form.
In both hybrids, the effects of light on G was accentuated by NO3- treatment
compared to NH4+ treatment. In other words, it took higher light intensities for
stomata in the NH4+ treatment to open to the same level as those in the NO3
-
treatment. It is interesting that both clones responded similarly since, from a
hydraulic perspective, their stomatal behaviour differs radically (known from our
own trials under drought); AP2403 being typically isohydric in contrast to AP9.
We expected G to be greater in the NO3- treatment, particularly during the
night, since in most temperate deciduous species NO3- reduction occurs more
efficiently in the leaves; specifically in Populus, nitrate reductase has been
measured with much higher activity in leaves than in roots (Rosenstiel et al. 2004).
Many plants are also known to accumulate NO3- overnight (see Andrews 1986;
Larcher 2003) although this has not been mentioned specifically for Populus. While
day-time whole-plant conductance was in fact greater under NO3- in both hybrids,
GN was only slightly higher. We cannot discount that the form of N per se may have
had a direct effect on nocturnal stomatal opening when in fact we did see a minor
difference, albeit not significant. It is evident from the data that there is a strong
87
interaction involving the stomatal light response and the form of N, but given the
link between N form and N content and its possible involvement in stomatal
function, it is more probable than the higher stomatal conductance observed with
NO3- fertilization was secondary to other physiological changes. Thus, the question
arises of whether the mechanisms behind the lower nocturnal transpiration that has
been observed with increasing N fertilization (Scholz et al. 2007) act separate from,
irrespective of, or in conjunction with those that “sense” the form of N.
Leaf [N] was higher in the NO3- treatment in both hybrids. NH4
+ is notorious
for entering the root at high rates even in NO3- specialists (Britto and Kronzucker
2002) but the net uptake of N as NH4+ can be highly inefficient and costly, due to
futile import-export cycles and the C investment associated with its incorporation
into the plant’s glutamate pool. The argument exists that NH4+ should not, in
principle, hinder photosynthetic performance on the basis of C cost (Miller and
Cramer 2004). In our case, the lower leaf [N] of smaller plants suggests a lower net
N uptake when supplied as NH4+, and this would be consistent with the lower
photosynthetic performance of the NH4+ treatment which may be more directly
impacted by reduced leaf N than by C economics. It must be noted, that although
the shoots of NH4+-fed plants were generally 50% smaller in both clones, none of
the plants showed any of the symptoms of NH4+ toxicity (Gerendás et al. 1997;
Britto and Kronzucker 2002). The differences in performance with N form
continues to vary across studies and species (Rosenstiel et al. 2004, Siemens et al.
2011).
88
The CO2 response curves showed that, in both hybrids, NH4+ may be
affecting photosynthesis in several ways. In AP2403, there were clear stomatal
limitations to photosynthesis in the NH4+ treatment, which can be linked to the
reduced stomatal response to light already mentioned. In AP9 the smaller stomatal
opening of NH4+ plants did not appear to directly impact assimilation likely as other
constraints to photosynthesis became more pressing. The A/Ci curves of both
hybrids showed a notably lower plateau in the NH4+ treatment indicating an earlier
onset of limitations imposed by the rate of triose phosphate utilisation (TPU)
(Sharkey et al. 2007). The difference in maxima between treatments was larger in
AP9, with TPU limitations acting just above ambient [CO2], although it is unclear
whether or not this might have contributed to lower assimilation at some point since
PAR was generally bellow 1000 µmol m-2 s-1. In addition, both AP2403 and AP9
had lower slopes in the initial part of the response curve when fed NH4+, which
would suggest an enzymatic limitation. This last point can be tied back to the leaf
[N] issue. It is also conceivable that the decreased stomatal function with respect to
light intensity might be related with this very same issue, since guard cells depend
on chloroplasts for their light-sensing functions and the phytochrome may be
connected to NO3- metabolism (Kamiya 1989; Becker et al. 1992).
N form was also associated with differences in the concentrations of other
nutrients. In both clones, leaves had lower [P] when fed NO3-, although this is likely
due to dilution as plants were bigger, and the total foliar content of P did not change
with treatment. Leaf [K] was lower in NH4+-fed plants of both hybrids, which is in
agreement with other reports (e.g. Rothstein and Cregg 2005). In both hybrids,

89
leaves of NH4+-treated plants had higher [Ca] which might appear to contradict
previous observations (Riley and Barber 1971), especially given the positive
correlation between transpiration and Ca+2 accumulation (de Freitas et al. 2011).
However, total foliar Ca content was lower in the NH4+ treatment despite higher
concentrations, suggesting lower acquisition in NH4+ treatment Considering an
average of 25% increase in total E in NO3- representing about 50% more total water
loss, differences in leaf N content seem to be largely explained by an almost equally
proportional increase in mass flow. Acquisition of soil-mobile nutrients may be
aided by the increased water flux as other works suggest (Matimati et al. 2014),
however the difference in magnitude of K and Ca contents in the hybrids, suggests
the existence of considerable species-specific responses and interactions which
should be further evaluated.
At the whole-plant level, the most striking morphological change was a
much lower root:shoot ratio in NO3--supplied plants. From our perspective, this
reinforces, in vivo, that the increased root hydraulic conductance observed in the
presence of NO3- (Gloser et al. 2007) can, and likely does, have radical
consequences for whole-plant hydraulics. In our experiments, NO3--fed plants not
only had higher G (and thus E, under the same conditions), but also upward of 15%
the leaf area. This means that the same or smaller root mass had to sustain up to
50% more water demand from the aerial part; and unless NH4+-given plants were
grossly overbuilt in terms of root hydraulic conductance, this capacity is probably
the result of increased transport activity at the root cell membrane level.
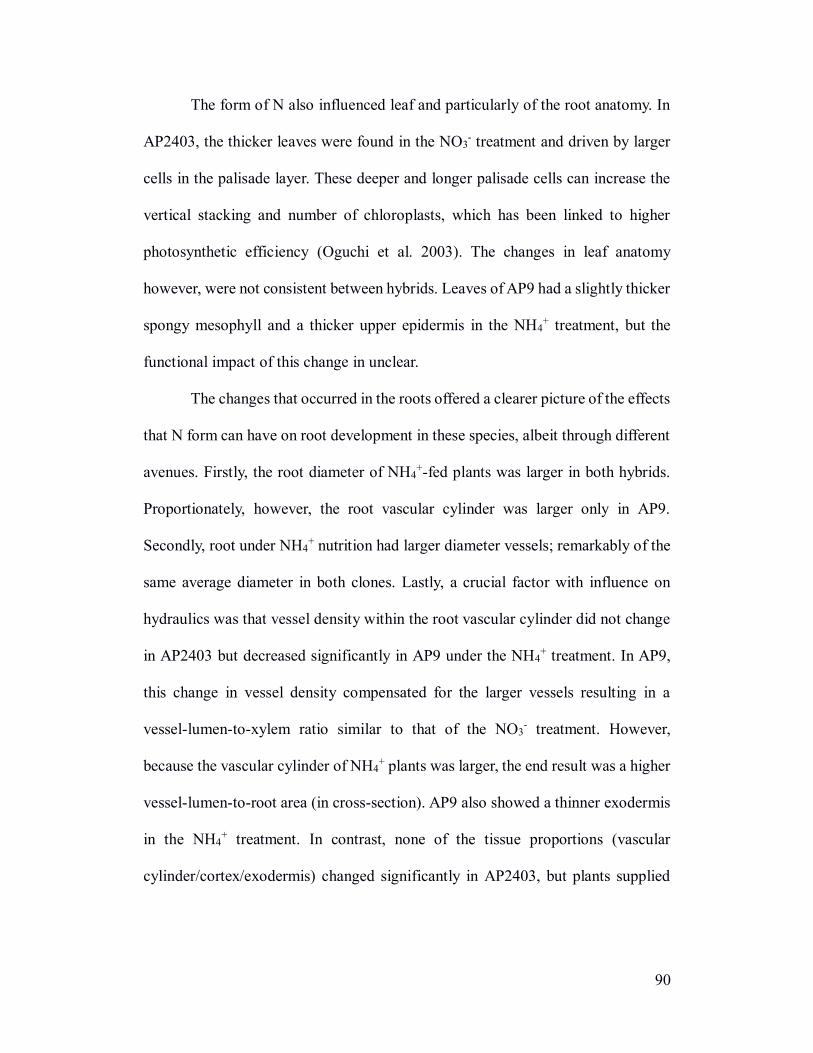
90
The form of N also influenced leaf and particularly of the root anatomy. In
AP2403, the thicker leaves were found in the NO3- treatment and driven by larger
cells in the palisade layer. These deeper and longer palisade cells can increase the
vertical stacking and number of chloroplasts, which has been linked to higher
photosynthetic efficiency (Oguchi et al. 2003). The changes in leaf anatomy
however, were not consistent between hybrids. Leaves of AP9 had a slightly thicker
spongy mesophyll and a thicker upper epidermis in the NH4+ treatment, but the
functional impact of this change in unclear.
The changes that occurred in the roots offered a clearer picture of the effects
that N form can have on root development in these species, albeit through different
avenues. Firstly, the root diameter of NH4+-fed plants was larger in both hybrids.
Proportionately, however, the root vascular cylinder was larger only in AP9.
Secondly, root under NH4+ nutrition had larger diameter vessels; remarkably of the
same average diameter in both clones. Lastly, a crucial factor with influence on
hydraulics was that vessel density within the root vascular cylinder did not change
in AP2403 but decreased significantly in AP9 under the NH4+ treatment. In AP9,
this change in vessel density compensated for the larger vessels resulting in a
vessel-lumen-to-xylem ratio similar to that of the NO3- treatment. However,
because the vascular cylinder of NH4+ plants was larger, the end result was a higher
vessel-lumen-to-root area (in cross-section). AP9 also showed a thinner exodermis
in the NH4+ treatment. In contrast, none of the tissue proportions (vascular
cylinder/cortex/exodermis) changed significantly in AP2403, but plants supplied

91
with NH4+ did have a greater vessel—lumen-to-root ratio, driven solely by larger
vessels.
Ultimately, we might generalise the different changes in root anatomy of the
two clones in response to N form as approaching the same functional response.
Roots of plants fed with NH4+ had more cortex and more conducting area than those
fed with NO3-. The modifications to the root induced by NH4
+ may be costly to the
plant on several accounts. Futile export cycles are carbon sinks; of the NH4+ that
stays in the plant, most of it is likely metabolized in the roots, and it seems logical
that a bigger cortex provides more tissue to process the NH4+. Much of the resulting
glutamine (after glutamate metabolism) will be transported to new leaves via
xylem-phloem redistribution (Dickson et al. 1985) which may also impose a cost,
whereas the bulk of the NO3- may be more efficiently transported to destination
directly via the transpiration stream. Another consideration is the extra xylem
vasculature in the NH4+ treatment, which is an added C cost compared to that of
plants in the NO3- treatment. We may speculate that the increased conducting area
of NH4+-grown roots was a compensation for the other limitations on hydraulic
conductivity, first at the root cell membrane and then as a result of the long path
through the cortex to the vascular cylinder.
It is noteworthy that not only were vessels larger in NH4+-treated plants, but
the roots had more vessels arranged in groups of two or more, whereas NO3--treated
plants had mostly solitary vessels. This type of change is not simply modulated by
changes in growth rate and cell expansion. This result is indicative of a more
profound developmental change in the pattern of fibre and vessel cell
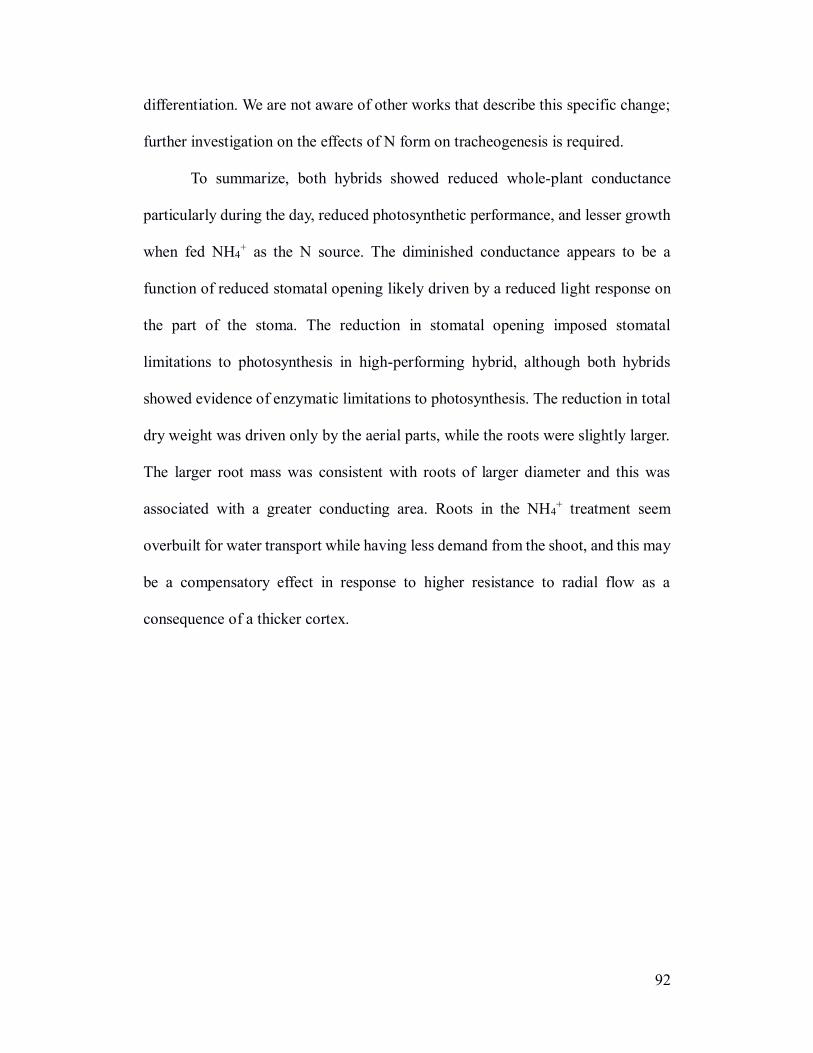
92
differentiation. We are not aware of other works that describe this specific change;
further investigation on the effects of N form on tracheogenesis is required.
To summarize, both hybrids showed reduced whole-plant conductance
particularly during the day, reduced photosynthetic performance, and lesser growth
when fed NH4+ as the N source. The diminished conductance appears to be a
function of reduced stomatal opening likely driven by a reduced light response on
the part of the stoma. The reduction in stomatal opening imposed stomatal
limitations to photosynthesis in high-performing hybrid, although both hybrids
showed evidence of enzymatic limitations to photosynthesis. The reduction in total
dry weight was driven only by the aerial parts, while the roots were slightly larger.
The larger root mass was consistent with roots of larger diameter and this was
associated with a greater conducting area. Roots in the NH4+ treatment seem
overbuilt for water transport while having less demand from the shoot, and this may
be a compensatory effect in response to higher resistance to radial flow as a
consequence of a thicker cortex.

93
Tables and figures
Table 4-1. Composition of the nutrient solution used during the treatments.
Element Concentration (µM) Source
N 2000.000 NaNO3 or NH4Cl
K 580.000 KCl, KH2PO4
P 520.000 KH2PO4, Phosphate Buffer
Mg 90.000 MgSO4
S 90.000 MgSO4
Ca 60.000 CaCl2
B 5.300 H3BO3
Fe 3.560 Fe-EDTA
Mn 2.080 MnCl2
Zn 0.260 ZnCl
Cu 0.130 CuCl2
Mo 0.042 Na2MoO4
Co 0.028 CoCl2
Table 4-2. Water use during the day (UD), during the night (UN) and their sum total (UT) for both clones under the different N forms, as well as the ratio UN/UD. All values are litres except where
percent is indicated. The projected consumption period is 5 weeks and a constant VPD of 1 kPa is
assumed for comparison purposes.
AP2403 AP9
NO3- NH4
+ NO3- NH4
+
UD 60.0 43.0 76.0 63.0
UN 3.3 2.2 18.0 15.0
UT 63.3 45.2 94.0 78.0
UN:UD 5% 5% 20% 20%

94
Table 4-3. Growth parameters in relation to form of N fertilization in two poplar clones. DW: dry
weight of indicated plant parts. (g); R:S: root-to-shoot ratio; 𝜂𝑤𝑖 : dimensionless ratio of the
increment in dry matter to a weighted value of G (i.e. integrated intrinsic WUE); LA: total leaf
area; LA5E: mean leaf area of the five most recently fully-expanded leaves; LAR: leaf-appearance rate. Different superscript letters indicate statistical differences between treatments within the
same clone (p < 0.05). n = 6.
AP2403 AP9
NO3- NH4
+ NO3- NH4
+ Height
(cm) 175.0 ±10.3 A 143.9 ±12.5 B 143.8 ± 8.2 138.7 ± 9.9
DW Leaf 80.2 ± 9.5 A 54.3 ±13.5 B 130.9 ±11.1 a 88.4 ±14.7 b DW Stem 35.1 ± 7.7 A 22.9 ± 7.0 B 39.2 ± 4.2 a 25.4 ± 3.9 b DW Root 28.0 ± 3.9 36.9 ± 8.2 19.4 ± 2.0 20.4 ± 4.6 DW Total 143.3 ±22.8 A 114.1 ±29.5 B 189.5 ±18.6 a 134.2 ±24.4 b R:S 0.24± 0.04B 0.48± 0.14A 0.11± 0.01b 0.18± 0.02a
𝜂𝑤𝑖 90.9 ±14.5 A 77.9 ± 9.9 A 127.0 ±16.2 a 88.2 ±18.7 b
LA5E
(cm2) 121 ±19 A 94 ± 9 B 167 ± 5 a 132 ±22 b
LAR
(n day-1) 0.49± 0.11 0.33± 0.05 0.44± 0.05 0.35± 0.07
Table 4-4. Concentration (% dry weight) of N, P, K and Ca in leaves fully developed under different N forms. Significance letters apply to comparisons between treatments but not across
clones (p < 0.05). Numbers in parentheses indicate total content in the foliar mass (g). n = 6.
AP2403 AP9
NO3- NH4
+ NO3- NH4
+
[N] 1.74±0.07A(1.0) 1.45±0.09B(0.6) 1.72±0.05a(2.2) 1.50±0.08b(1.4)
[P] 0.48±0.10B(0.3) 0.64±0.11A(0.3) 0.33±0.01b(0.4) 0.45±0.07a(0.4)
[K] 1.45±0.05 (0.9) 1.35±0.08 (0.6) 1.60±0.02a(2.0) 1.28±0.09b(1.2)
[Ca] 0.63±0.03 (0.4) 0.71±0.05 (0.3) 0.48±0.05b(0.6) 0.63±0.11a(0.6)
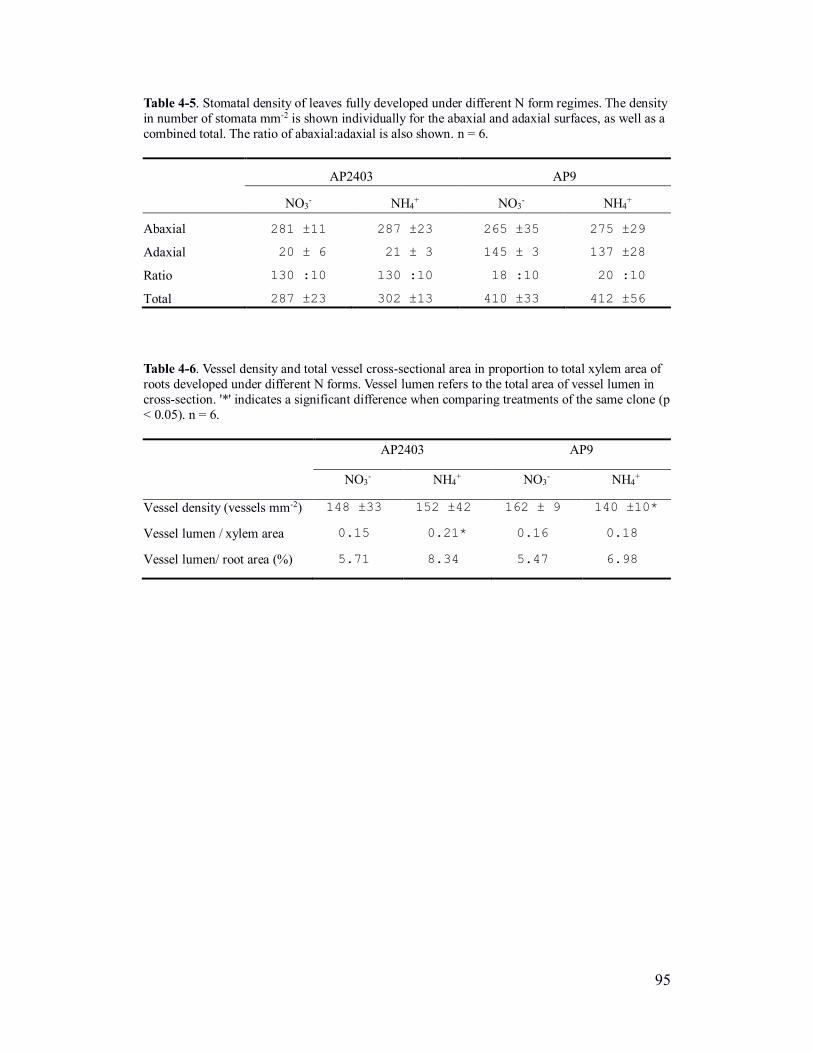
95
Table 4-5. Stomatal density of leaves fully developed under different N form regimes. The density
in number of stomata mm-2 is shown individually for the abaxial and adaxial surfaces, as well as a
combined total. The ratio of abaxial:adaxial is also shown. n = 6.
AP2403 AP9
NO3- NH4
+ NO3- NH4
+
Abaxial 281 ±11 287 ±23 265 ±35 275 ±29
Adaxial 20 ± 6 21 ± 3 145 ± 3 137 ±28
Ratio 130 :10 130 :10 18 :10 20 :10
Total 287 ±23 302 ±13 410 ±33 412 ±56
Table 4-6. Vessel density and total vessel cross-sectional area in proportion to total xylem area of
roots developed under different N forms. Vessel lumen refers to the total area of vessel lumen in
cross-section. '*' indicates a significant difference when comparing treatments of the same clone (p
< 0.05). n = 6.
AP2403 AP9
NO3- NH4
+ NO3- NH4
+
Vessel density (vessels mm-2) 148 ±33 152 ±42 162 ± 9 140 ±10*
Vessel lumen / xylem area 0.15 0.21* 0.16 0.18
Vessel lumen/ root area (%) 5.71 8.34 5.47 6.98
96
Figure 4-1. Short-term (1 week) and long-term (5 weeks) effects of N form on day- and
night-time whole-plant stomatal conductance (G). '*' shows significant differences
between indicated pairs (p < 0.05). Numbers above nighttime bars show the ratio GN:GD
for each treatment.
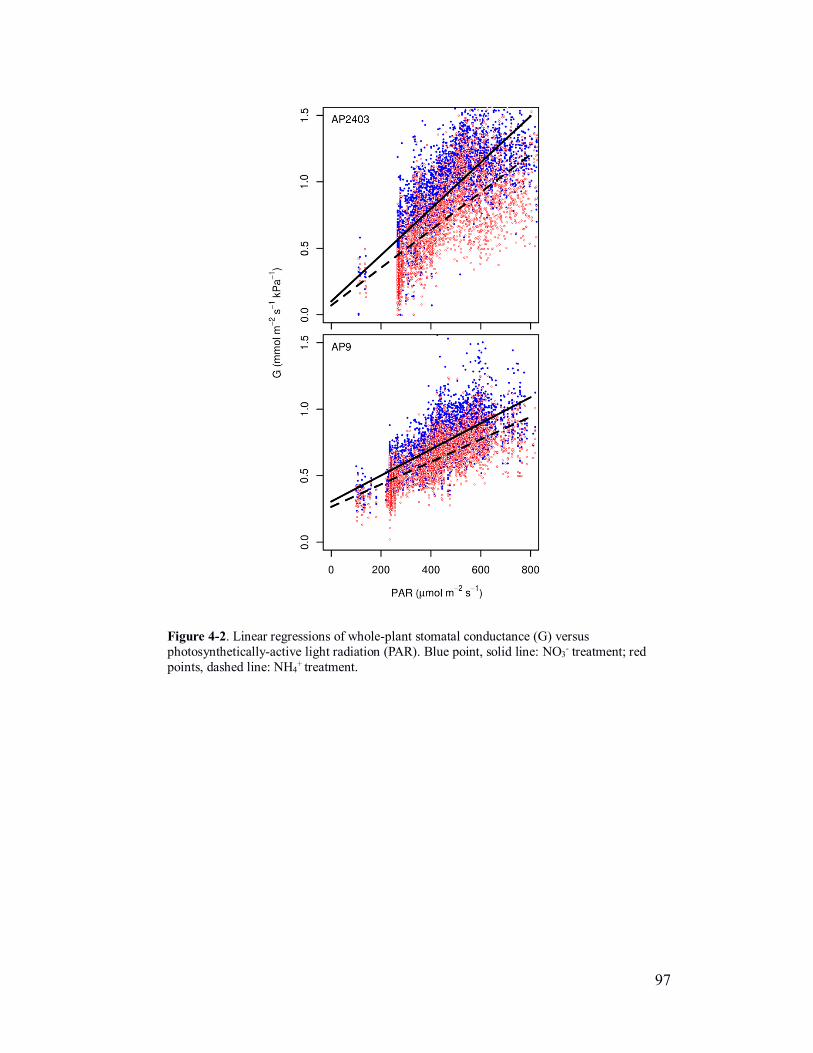
97
Figure 4-2. Linear regressions of whole-plant stomatal conductance (G) versus
photosynthetically-active light radiation (PAR). Blue point, solid line: NO3- treatment; red
points, dashed line: NH4+ treatment.

98
Figure 4-3. A/Ci response curves of plants fed different N forms. Error bars are plus or
minus one standard deviation for each point in each axis. The triangles represent the
pooled measurements at ambient [CO2] (typically 3 measurements at 400 ppm, one taken
before the A/Ci measurements and two as part of the A/Ci curve).

99
Figure 4-4. Thickness of leaves fully developed under different N sources. One entire bar
represents the leaf cross-section profile: upper and lower epidermis (darker gray),
pallisade layer (lighter gray) and spongy mesophyll (hatched). Leaf representations are
aligned with y=0 at the interface between the pallisade layer and the spongy mesophyll
for easy comparison of same layer types across clones and treatments. Numbers above
diagrams indicate the total leaf thickness in µm.
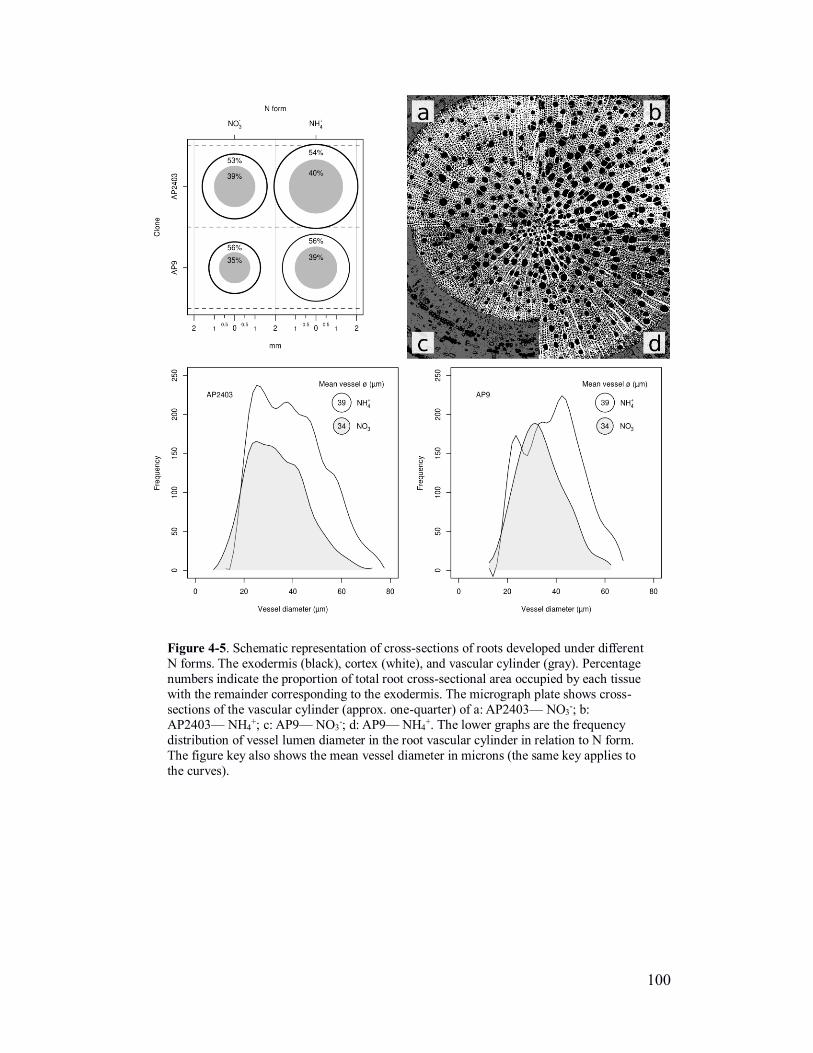
100
Figure 4-5. Schematic representation of cross-sections of roots developed under different
N forms. The exodermis (black), cortex (white), and vascular cylinder (gray). Percentage
numbers indicate the proportion of total root cross-sectional area occupied by each tissue
with the remainder corresponding to the exodermis. The micrograph plate shows cross-
sections of the vascular cylinder (approx. one-quarter) of a: AP2403— NO3-; b:
AP2403— NH4+; c: AP9— NO3
-; d: AP9— NH4+. The lower graphs are the frequency
distribution of vessel lumen diameter in the root vascular cylinder in relation to N form.
The figure key also shows the mean vessel diameter in microns (the same key applies to
the curves).
101
Chapter 5. Conclusions
The physiology of plant transpiration continues to present challenges both from a
theoretical perspective and from the more practical aspect of its empirical
determination. The scale of measurement can span an enormous range from the
cellular scale to the ecosystem. Within this range, the whole-plant scale is notorious
for being overlooked and difficult to measure directly. This is especially true in the
case of nocturnal water loss. I have presented “Amalthea”, a system which is based
on techniques that have been conceptually well-established in the past, in the form
of various lysimetry implementations, but it is novel in that it targets specifically
the whole-plant scale and it is built from readily available parts afforded by a legacy
of proven technologies. Equally important, the system allows for simultaneous
replication within experiments in a way not easily achieved (if at all) by other
techniques.
This system has several advantages over more widespread approaches.
Firstly, it naturally incorporates the whole plant by design and, in doing so, it
provides an actual measurement instead of an estimation based on assumptions
and/or extrapolations from different scales. Secondly, it combines high sensitivity
and accuracy in relation to the scale; but more importantly, this can maintained over
long periods since the system does not exert an influence over the plant. It is also
forgiving of measuring technique. This is no trivial matter when considering the
careful attention that needs to be paid to correctly set up a porometric-based
instrument; a task that is prone to be cast aside in regular practice both in field and
laboratory environments. McDermitt (1990), of LI-COR inc., has commented that

102
one should not so much as try to estimate in-situ transpiration from leaf-level data
taken from a porometer, perhaps the most widely-used instrument for such
measurement.
Leaf-level measurements can provide important information about leaf
status and leaf-level processes. In this context, Amalthea can be used
simultaneously with a properly set-up porometer in order to provide a full picture
of whole-plant plus age- and/or position-dependent leaf measurements. We know
that things like leaf age and plant architecture have a big impact on leaf and stomatal
function whether directly or indirectly (Reich 1984; personal observation). It is
therefore not advisable to extrapolate leaf-level measurements to the whole-plant
scale. Rather, these two types of measurement should be complementary to each
other.
The use of Amalthea has provided a detailed picture of whole-plant
transpiration patterns, particularly during the night, which is challenging to obtain
using porometric measurements. This has been useful in investigating differences
in day- and night-time water use among Populus species from different
environments. Although the survey undertaken in this study concerned only four
species, it provides a starting point for testing several hypotheses regarding water
use at the whole-plant level and comparing it with leaf-level processes. The water
use survey that was carried out tested two main hypotheses: i – that species from
riparian environments have more night-time water use than upland species, and ii –
that night-time transpiration may have functional value as opposed to a mere
accident not deleterious enough to have been maladaptive [during evolution].
103
Night-time whole-plant conductance was positively correlated with an a
priori ranking of the species according to wetness of habitat, which was not the
case with day-time conductance. This would suggest that some environmental
pressure exists to limit night-time water loss but not necessarily to always restrict
it to the absolute minimum. Because the number of species in the study is small and
limited to a single genus, it does not permit generalisations; it does, however, invite
for a larger survey across taxa and habitats.
Another feature highlighted by the study was that all species, including
those associated with drier landscapes, maintained a level of water loss that was an
order of magnitude above cuticular conductance upon experiencing moderate
drought. Stomata also appeared to continue to respond to vapour pressure deficit
when under drought. These findings support the idea that stomata are not fully
closing at night even when stressed, suggesting that there may be a functional value
to transpiration in these conditions that has yet to be determined. This has not been
previously observed by other studies. One of the proposed advantages of nocturnal
transpiration is to maintain water flow to aid with the delivery of oxygen to internal
tissues. This is a controversial topic and it is clear that more research is needed in
this area.
During well watered conditions, nocturnal transpiration (and thus root and
stem water flow) may fulfill other functional roles. One of the main proposed roles
is that of nutrient acquisition (and delivery) by mass flow, and while this is also a
contentious subject, other studies have shown a connection between nutrient level
(particularly N) and night-time transpiration. There is a clear effect of NO3- on
104
hydraulic properties of roots and possibly leaves as it acts as a signal molecule.
However, N is most commonly found in the form of NH4+ in Populus-dominated
landscapes and seldom have these two forms of N been compared. The N-form
study presented here is the first to compare whole-plant conductance patterns in
Populus hybrids as affected by NO3- or NH4
+.
In disagreement with other studies (Rosenstiel et al. 2004) and contrary to
some predictions (Britto and Kronzucker 2002), the Populus clones evaluated in
this study displayed what can be considered a strong “preference” for NO3-,
showing substantially more growth of above-ground parts. However, N form
appeared to have little impact over night-time whole-plant conductance.
Nevertheless, N form had a marked effect on day-time conductance whereby NO3-
-fed plants showed higher overall conductance than NH4+-fed plants. Combined
with a lack of change in stomatal index and length, and a difference in the response
of transpiration to light intensity, it is concluded that the difference in conductance
originates from a change in stomatal physiology.
In addition, root dry mass was slightly lower in NO3--fed plants, which
underscores the importance of NO3- in increasing root hydraulic conductance since
the same root mass amply supplied water to a much larger leaf area. Interestingly,
the greatest effect of N form was not on root morphology but on root anatomy. The
study highlights how two clones altered their root anatomy in different ways in
response to NH4+, to arrive at a comparable proposed functional modification: to
compensate for restrictions to radial water flow imposed by other root

105
modifications such as a thicker cortex tissue, which in turn would have been
induced by the need to metabolise NH4+.
As a corollary, it is clear that night-time transpiration is a dynamic process.
It is dependent on species and environmental conditions both pertaining to the soil
and to the atmosphere. It is also clear that more research would enrich this still
underexplored area of whole-plant physiology. Specifically, the following questions
need to be addressed in future investigations:
There is a large variation in night-time transpiration across species.
To what extent would this trait be deleterious and susceptible to
evolutionary pressure?
Within a single plant, various degrees of heterogeneity are evident
in terms of stomatal function. What is the contribution of leaf age to
night-time transpiration?
Since some plants appear to be nocturnal water-spenders compared
with others that maximise day-time conductance while minimising
night-time conductance, what is the relationship between night-time
and day-time stomatal function?
A circadian clock appears to affect stomatal function. What is the
effect of photoperiod on nocturnal conductance?
Even upland species can maintain some level of nocturnal
transpiration when under water stress. Why is water-flow not
abruptly shut down in this situation?

106
Nutrients seem to influence transpiration to some extent although it
is not clear if this is an indirect effect. What types of species are more
likely to change nocturnal transpiration patterns in response to
nutrient levels?
The form of nutrient can have various effects on whole-plant
physiology, some of which may directly or indirectly affect
transpiration. What interaction exists between different forms of
various nutrients, their relative concentrations, and their effect on
plant hydraulics and transpiration physiology?
These are questions that can be investigated at different scales, one of which,
the whole-plant level, should not be overlooked but rather integrated.

107
References
Anderson DS, Teyker RH, Rayburn AL. 1991. Nitrogen form effects on early corn
root morphological and anatomical development. Journal of Plant
Nutrition 14:1255-1266.
Andrews M. 1986. The partitioning of nitrate assimilation between root and shoot
of higher plants. Plant, Cell & Environment 9:511-519.
Atkinson CJ, Else MA, Taylor L, Dover CJ. 2003. Root and stem hydraulic
conductivity as determinants of growth potential in grafted trees of apple
(Malus pumila Mill.). Journal of Experimental Botany 54:1221-1229.
Auchincloss L, Easlon HM, Levine D, Donovan L, Richards JH. 2014. Pre‐dawn
stomatal opening does not substantially enhance early‐morning
photosynthesis in Helianthus annuus. Plant, Cell & Environment 37:1364-
1370.
Barber SA, Cushman JH. 1981. Nitrogen uptake model for agronomic crops. In:
Modeling Waste Water Renovation-Land Treatment. Iskandar A (ed.).
Wiley-Interscience, New York.
Barber SA. 1995. Soil nutrient bioavailability: A mechanistic approach, 2nd edn.
New York: John Wiley and Sons, Inc.
Barbeta A, Ogaya R, Peñuelas J. 2012. Comparative study of diurnal and
nocturnal sap flow of Quercus ilex and Phillyrea latifolia in a
Mediterranean holm oak forest in Prades (Catalonia, NE Spain). Trees
26:1651-1659.
108
Barbour MM and Buckley TN. 2007. The stomatal response to evaporative
demand persists at night in Ricinus communis plants with high nocturnal
conductance. Plant Cell and Environment 30: 711-721.
Barbour MM, Cernusak LA, Whitehead D, Griffin KL, Turnbull MH, Tissue DT,
Farquhar GD. 2005. Nocturnal stomatal conductance and implications for
modeling δ18O of leaf-respired CO2 in temperate tree species. Functional
Plant Biology 32:1107-1121.
Barigah TS, Saugier B, Mousseau M, Guittet J, Ceulemans R. 1994.
Photosynthesis, leaf area, and productivity of 5 poplar clones during their
establishment year. Annals of Forest Science 51:613-625.
Bassman JH, Zwier JC. 1991. Gas exchange characteristics of Populus
trichocarpa, Populus deltoides and Populus trichocarpa × Populus
deltoides clones. Tree Physiology 8:145-159.
Becker TW, Foyer C, Caboche M. 1992. Light-regulated expression of the nitrate-
reductase and nitrite-reductase genes in tomato and in the phytochrome-
deficient aurea mutant of tomato. Planta 188:39-47.
Blake TJ, Sperry JS, Tschaplinski TJ, Wang SS (1996) Water relations. In: Stettler
RF, Bradshaw HD, Heilman PE, Hinckley TM (eds). Biology of Populus
and its implications for management and conservation. NRC Research
Press, 401-422.

109
Boudsocq S, Niboyet A, Lata JC, Raynaud X, Loeuille N, Mathieu J, Blouin M,
Abbadie L, Barot S. 2012. Plant preference for ammonium versus nitrate:
a neglected determinant of ecosystem functioning? The American
Naturalist 180:60-69.
Britto DT, Kronzucker HJ. 2002. NH4+ toxicity in higher plants: a critical review.
Journal of Plant Physiology 159:567-584.
Bucci SJ, Scholz FG, Goldstein G, Meinzer FC, Hinojosa JA, Hoffman WA,
Franco AC. 2005. Mechanisms contributing to seasonal homeostasis of
minimum leaf water potential and predawn disequilibrium between soil
and plant water potential in neotropical savanna trees. Trees 19:296-304.
Buckley TN, Turnbull TL, Pfautsch S, Adams MA. 2011. Nocturnal water loss in
mature subalpine Eucalyptus delegatensis tall open forests and adjacent E.
pauciflora woodlands. Ecology and evolution 1:435-450.
Caird MA, Richards JH, Donovan LA. 2007. Nighttime stomatal conductance and
transpiration in C3 and C4 plants. Plant Physiology 143:4-10.
Caird MA, Richards JH, Hsiao TC. 2007. Significant transpirational water loss
occurs throughout the night in field-grown tomato. Functional plant
biology 34:172-177.
Cavender-Bares J, Sack L, Savage J. 2007. Atmospheric and soil drought reduce
nocturnal conductance in live oaks. Tree Physiology 27:611-620.
Christman MA, Donovan LA, Richards JH. 2009. Magnitude of nighttime
transpiration does not affect plant growth or nutrition in well‐watered
Arabidopsis. Physiologia plantarum 136:264-273.
110
Christman MA, James JJ, Drenovsky RE, Richards JH. 2009. Environmental
stress and genetics influence night-time leaf conductance in the C4 grass
Distichlis spicata. Functional Plant Biology 36:50-55.
Christman MA, Richards JH, Mckay JK, Stahl EA, Juenger TE, Donovan LA.
2008. Genetic variation in Arabidopsis thaliana for night‐time leaf
conductance. Plant, cell & environment 31:1170-1178.
Cienciala E, Lindroth A, Čermák J, Hällgren J-E, Kučera J. 1992. Assessment of
transpiration estimates for Picea abies trees during a growing season.
Trees 6: 121-127.
Cirelli D, Lieffers VJ, Tyree MT. 2012. Measuring whole-plant transpiration
gravimetrically: a scalable automated system built from components. Trees
26: 1669-1676.
Cirelli D. 2010. Amalthea: scripts for logging plant transpiration using balances.
Sourceforge source code repository. http://amalthea-rte.sourceforge.net.
Accessed 13 December 2011.
Cirelli D. 2011. Light, temperature and humidity logging interface with the
PICAXE-08M. http://microviron.sourceforge.net. Accessed 7 December
2011.
Clarkson DT, Carvajal M, Henzler T, Waterhouse RN, Smyth AJ, Cooke DT,
Steudle E. 2000. Root hydraulic conductance: diurnal aquaporin
expression and the effects of nutrient stress. Journal of Experimental
Botany 51:61-70.

111
Clearwater MJ, Meinzer FC, Andrade JL, Goldstein G, Holbrook NM. 1999.
Potential errors in measurement of nonuniform sapflow using heat
dissipation probes. Tree Physiology 19: 681-687.
Cooper DJ, Merritt DM, Andersen DC, Chimner RA. 1999. Factors controlling
the establishment of Fremont cottonwood seedlings on the Upper Green
River, USA. Regulated Rivers 15: 419-440.
Cowan IR. 1977. Stomatal behaviour and environment. Advances in Botanical
Research 4: 117-228
Cramer MD, H-J Hawkins, Verboom GA. 2009. The importance of nutritional
regulation of plant water flux. Oecologia 161:15-24.
Cramer MD, Hoffmann V, Verboom GA. 2008. Nutrient availability moderates
transpiration in Ehrharta calycina. New Phytologist 179: 1048-1057.
Cruz C, Lips SH, Martins-Louçzão MA. 1997. Changes in the morphology of
roots and leaves of carob seedlings induced by nitrogen source and
atmospheric carbon dioxide. Annals of Botany 80:817-823.
Daley MJ, Phillips NG. 2006. Interspecific variation in night-time transpiration
and stomatal conductance in a mixed New England deciduous forest. Tree
Physiology 26: 411-419.
Davies WJ, Wilkinson S, Loveys B. 2002. Stomatal control by chemical
signalling and the exploitation of this mechanism to increase water use
efficiency in agriculture. New Phytologist 153:449-460.
112
Dawson TE, Burgess SS, Tu KP, Oliveira RS, Santiago LS, Fisher JB, Simonin
KA, Ambrose AR. 2007. Nighttime transpiration in woody plants from
contrasting ecosystems. Tree Physiology 27:561-575.
de Dios VR, Turnbull MH, Barbour MM, Ontedhu J, Ghannoum O, Tissue DT.
2013. Soil phosphorous and endogenous rhythms exert a larger impact
than CO2 or temperature on nocturnal stomatal conductance in Eucalyptus
tereticornis. Tree physiology 33:1206-1215.
de Freitas ST, Shackel KA, Mitcham EJ. 2011. Abscisic acid triggers whole-plant
and fruit-specific mechanisms to increase fruit calcium uptake and prevent
blossom end rot development in tomato fruit. Journal of Experimental
Botany 62:2645-2656.
Dickson RE, Vogelmann TC, Larson PR. 1985. Glutamine transfer from xylem to
phloem and translocation to developing leaves of Populus deltoides. Plant
Physiology 77:412-417.
Dixon M, Grace J. 1984. Effect of wind on the transpiration of young trees.
Annals of Botany 53: 811-819.
Dodd IC, Egea G, Davies WG. 2008. Abscisic acid signalling when soil moisture
is heterogeneous: decreased photoperiod sap flow from drying roots limits
abscisic acid export to the shoots. Plant, Cell and Environment 31:1263–
1274.
Dodd IC, Egea G, Watts CW, Whalley WR. 2010. Root water potential integrates
discrete soil physical properties to influence ABA signalling during partial
rootzone drying. Journal of Experimental Botany 61:3543-3551.
113
Domenicano S, Coll L, Messier C, Berninger F. 2011. Nitrogen forms affect root
structure and water uptake in the hybrid poplar. New Forests 42:347-362.
Donovan LA, Richards JH, Linton MJ. 2003. Magnitude and mechanisms of
disequilibrium between predawn plant and soil water potentials. Ecology
84:463-470.
Eckenwalder JE. 1996. Systematics and evolution of Populus. In: Stettler RF,
Bradshaw HD, Heilman PE, Hinckley TM, eds. Biology of Populus and its
implications for management and conservation. Ottawa: NRC Research
Press, 7-32.
Edwards WRN. 1986. Precision weighing lysimetry for trees, using a simplified
tared-balance design. Tree Physiology 1:127-144.
Eklund L. 2000. Internal oxygen levels decrease during the growing season and
with increasing stem height. Trees 14: 177-180.
Escalona JM, Fuentes S, Tomás M, Martorell S, Flexas J, Medrano H. 2013.
Responses of leaf night transpiration to drought stress in Vitis vinifera L.
Agricultural Water Management 118:50-58.
Feild TS, Upchurch GR Jr., Chatelet DS et al. 2001. Fossil evidence for low gas
exchange capacities for Early Cretaceous angiosperm leaves. Paleobiology
37: 195-213.
Fisher JB, Baldocchi DD, Misson L, Dawson TE, Goldstein AH. 2007. What the
towers don't see at night: nocturnal sap flow in trees and shrubs at two
AmeriFlux sites in California. Tree Physiology 27:597-610.
114
Flury M, Yates MV, Jury WA. 1999. Numerical analysis of the effect of the lower
boundary condition on solute transport in lysimeters. Soil Science Society
of America Journal 63:1493-1499.
Gansert D. 2003. Xylem sap flow as a major pathway for oxygen supply to the
sapwood of birch (Betula pubescens Ehr.). Plant, Cell & Environment
26:1803-1814.
Gerendás J, Zhu Z, Bendixen R, Ratcliffe RG, Sattelmacher B. 1997.
Physiological and biochemical processes related to ammonium toxicity in
higher plants. Zeitschrift für Pflanzenernährung und Bodenkunde 160:239-
251.
Gloser V, Zwieniecki MA, Orians CM, Holbrook NM. 2007. Dynamic changes in
root hydraulic properties in response to nitrate availability. Journal of
Experimental Botany 58:2409-2415.
Gorska A, Ye Q, Holbrook NM, Zwieniecki MA. 2008. Nitrate control of root
hydraulic properties in plants: translating local information to whole plant
response. Plant Physiology 148:1159-1167.
Grulke NE, Paoletti E, Heath RL. 2007. Chronic vs. short-term acute O3 exposure
effects on nocturnal transpiration in two Californian oaks. The Scientific
World Journal 7:134-140.
Guo S, Zhou Y, Shen Q, Zhang F. 2007. Effect of ammonium and nitrate nutrition
on some physiological processes in higher plants‐growth, photosynthesis,
photorespiration, and water relations. Plant Biology 9:21-29.

115
Hamzeh M, Dayanandan S. 2004. Phylogeny of Populus (Salicaceae) based on
nucleotide sequences of chloroplast trnT-trnF region and nuclear rDNA.
American Journal of Botany 91:1398-1408.
Heilman PE, Hinckley TM, Roberts DA, Ceulemans R. 1996. Production
physiology. In: Stettler RF, Bradshaw HD, Heilman PE, Hinckley TM
(eds). Biology of Populus and its implications for management and
conservation. NRC Research Press, 459-489.
Howard AR, Donovan LA. 2007. Helianthus nighttime conductance and
transpiration respond to soil water but not nutrient availability. Plant
Physiology 143:145-155.
Howard AR, Donovan LA. 2010. Soil nitrogen limitation does not impact
nighttime water loss in Populus. Tree physiology 30:23-31.
Howard AR, Van Iersel MW, Richards JH, Donovan LA. 2009. Night‐time
transpiration can decrease hydraulic redistribution. Plant, cell &
environment 32:1060-1070.
Hsiao TC, Acevedo E. 1974. Plant responses to water deficits, water-use
efficiency, and drought resistance. Agricultural Meteorology 14: 59-84.
Kamiya A. 1989. Effects of Blue Light and Ammonia on Nitrogen Metabolism in
a Colorless Mutant of Chlorella. Plant and Cell Physiology 30:513-521.
Karaba A, Dixit S, Greco R, Aharoni A, Trijatmiko KR, Marsch-Martinez N,
Krishnan A, Nataraja KN, Udayakumar M, Pereira A. 2007. Improvement
of water use efficiency in rice by expression of HARDY, an Arabidopsis
drought and salt tolerance gene. PNAS 104:15270-15275.
116
Katul G, Manzoni S, Palmroth S, Oren R. 2010. A stomatal optimization theory to
describe the effects of atmospheric CO2 on leaf photosynthesis and
transpiration. Annals of Botany 105: 431-442.
Kavanagh KL, Pangle R, Schotzko AD. 2007. Nocturnal transpiration causing
disequilibrium between soil and stem predawn water potential in mixed
conifer forests of Idaho. Tree Physiology 27:621-629.
Kobayashi N, Hiyama T, Fukushima Y, Lopez ML, Hirano T, Fujinuma Y. 2007.
Nighttime transpiration observed over a larch forest in Hokkaido, Japan.
Water resources research 43. DOI: 10.1029/2006WR005556
Kramer P, Boyer J. 1995. Water Relations of Plants and Soils. Academic Press,
San Diego.
Kranjcec J, Mahoney JM, Rood SB. 1998. The responses of three riparian
cottonwood species to water table decline. Forest Ecology and
Management 110:77-87.
Kronzucker HJ, Siddiqi MY, Glass AD. 1997. Conifer root discrimination against
soil nitrate and the ecology of forest succession. Nature 385:59-61.
Kronzucker HJ, Siddiqi MY, Glass ADM, Britto DT. 2003. Root ammonium
transport efficiency as a determinant in forest colonization patterns: a
hypothesis. Physiologia Plantarum 117:164-170.
Kupper P, Rohula G, Saksing L, Sellin A, Lõhmus K, Ostonen I, Helmisaari H-S,
Sõber A. 2012. Does soil nutrient availability influence night-time water
flux of aspen saplings? Environmental and Experimental Botany 82:37-42.
117
Larcher W. 2003. Physiological plant ecology: Ecophysiology and stress
physiology of functional groups (4th ed.). Springer.
Li H, Li M, Luo J, Cao X, Qu L, Gai Y, Jiang X, Liu T, Bai H, Janz D, Polle A,
Peng C, Luo Z-B. 2012. N-fertilization has different effects on the growth,
carbon and nitrogen physiology, and wood properties of slow-and fast-
growing Populus species. Journal of Experimental Botany 63:6173-6185.
Lieffers VJ, Landhäusser SM, Hogg EH. 2001. Is the wide distribution of aspen a
result of its stress tolerance? In: Shepperd WD, Binclay DL, Bartos D,
Stohlgren TJ, Eschew LG, eds. Sustaining aspen in western landscapes:
symposium proceedings. Grand Junction: USDA Forest Service
Proceedings RMRS-P-18, 311-324.
Liu C, Zhang X, Zhang Y. 2002. Determination of daily evaporation and
evapotranspiration of winter wheat and maize by large-scale weighing
lysimeter and micro-lysimeter. Agricultural and Forest Meteorology
111:109-120.
Lu Y, Equiza MA, Deng X, Tyree MT. 2010. Recovery of Populus tremuloides
seedlings following severe drought causing total leaf mortality and
extreme stem embolism. Physiologia Plantarum 140: 246-257.
Ludwig F, Jewitt RA, Donovan LA. 2006. Nutrient and water addition effects on
day- and night-time conductance and transpiration in a C3 desert annual.
Oecologia 148:219-225.
118
Mahan JR, Upchurch DR. 1988. Maintenance of constant leaf temperature by
plants—I. Hypothesis—limited homeothermy. Environmental and
Experimental Botany 28:351-357.
Marks CO, Lechowicz MJ. 2007. The ecological and functional correlates of
nocturnal transpiration. Tree Physiology 27:577-584.
Marschner H. 1995. Mineral nutrition of higher plants, 2nd edn. London:
Academic Press.
Masle J, Gilmore SR, Farquhar GD. 2005. The ERECTA gene regulates plant
transpiration efficiency in Arabidopsis. Nature 436:866-870.
Matimati I, Verboom GA, Cramer MD. 2014. Nitrogen regulation of transpiration
controls mass-flow acquisition of nutrients. Journal of experimental botany
65:159-168.
McDermitt, DK. 1990. Sources of error in the estimation of stomatal conductance
and transpiration from porometer data. HortScience, 25:1538-1548.
Monclus R, Dreyer E, Delmotte FM, Villar M, Delay D, Boudouresque E, Petit J-
M, Marron N, Bréchet C, Brignolas F. 2005. Productivity, leaf traits and
carbon isotope discrimination in 29 genotypes of Populus deltoides ×
Populus nigra. New Phytologist 167: 765-777.
Moore GW, Cleverly JR, Owens MK. 2008. Nocturnal transpiration in riparian
Tamarix thickets authenticated by sap flux, eddy covariance and leaf gas
exchange measurements. Tree Physiology 28:521-528.

119
Naik V, Wuebbles DJ, Delucia EH, Foley JA. 2003. Influence of geoengineered
climate on the terrestrial biosphere. Environmental Management 32:373-
381.
Natural Resources Canada. 2005. Afforestation policy analysis.
http://www.nrcan.gc.ca/cfs-scf/national/what-
quoi/afforestation/f2020_e.html
Niklas K. 1997. The Evolutionary Biology of Plants. The University of Chicago
Press, Chicago and London.
Novick KA, Oren R, Stoy PC, Siqueira MBS, Katul GG. 2009. Nocturnal
evapotranspiration in eddy-covariance records from three co-located
ecosystems in the Southeastern US: implications for annual fluxes.
Agricultural and Forest Meteorology 149:1491-1504.
Ogle K, Lucas RW, Bentley LP, Cable JM, Barron‐Gafford GA, Griffith A, Ignace
D, Jenerette GD, Tyler A, Huxman TE, Loik ME, Smith SD, Tissue DT.
2012. Differential daytime and night‐time stomatal behavior in plants from
North American deserts. New Phytologist 194:464-476.
Oguchi R, Hikosaka K, Hirose T. 2003. Does the photosynthetic light‐acclimation
need change in leaf anatomy? Plant, Cell & Environment 26:505-512.
Oliveira PJC, Davin EL, Levis S, Seneviratne SI. 2011. Vegetation-mediated
impacts of trends in global radiation on land hydrology: a global
sensitivity study. Global Change Biology 17:3453-3467.
120
Pataki DE, Oren R. 2003. Species differences in stomatal control of water loss at
the canopy scale in a mature bottomland deciduous forest. Advances in
Water Resources 26:1267-1278.
Pearcy R, Schulze ED, Zimmermann R. 1988. Measurements of transpiration and
leaf conductance. In: Pearcy R, Ehleringer J, Mooney H, Rundel P (eds)
Plant Physiological Ecology Field Methods and Instrumentation. Chapman
and Hall, New York, pp 137-160.
Pfautsch S, Keitel C, Turnbull TL, Braimbridge MJ, Wright TE, Simpson RR,
O'Brien JA, Adams MA. 2011. Diurnal patterns of water use in Eucalyptus
victrix indicate pronounced desiccation–rehydration cycles despite
unlimited water supply. Tree physiology 31:1041-1051.
Phillips NG, Lewis JD, Logan BA, Tissue DT. 2010. Inter- and intra-specific
variation in nocturnal water transport in Eucalyptus. Tree Physiology 30:
586-596.
Pickard WF. 1989. How might a tracheary element which is embolized by day be
healed by night? Journal of Theoretical Biology 141: 259-279.
Pospíšilová J, Šantrůček J. 1994. Stomatal patchiness. Biologia Plantarum 36:
481-510.
Prieto I, Kikvidze Z, Pugnaire FI. 2010. Hydraulic lift: soil processes and
transpiration in the Mediterranean leguminous shrub Retama
sphaerocarpa (L.) Boiss. Plant and Soil 329:447-456.
121
Rae AM, Robinson KM, Street NR, Taylor G. 2004. Morphological and
physiological traits influencing biomass productivity in short-rotation
coppice poplar. Canadian Journal of Forest Research 34:1488-1498.
Raschke K. 1976. How stomata resolve the dilemma of opposing priorities.
Philosophical Transactions of the Royal Society of London. B, Biological
Sciences 273: 551-560.
Raven JA. 2002. Selection pressures on stomatal evolution. New Phytologist
153:371-386.
Raven P, Evert R, Eichhorn S. 2005. Biology of Plants. WH Freeman and
Company, New York.
Rees SW, Ali N. 2006. Seasonal water uptake near trees: a numerical and
experimental study. Geomech Geoeng 1:129-138.
Reich, PB. 1984. Loss of stomatal function in ageing hybrid poplar leaves. Annals
of botany 53:691-698.
Ridgwell A, Singarayer J, Hetherington A, Valdes P. 2009. Tackling regional
climate change by leaf albedo bio-geoengineering. Current Topics in
Biology 19:146-150.
Riley D, Barber SA. 1971. Effect of ammonium and nitrate fertilization on
phosphorus uptake as related to root-induced pH changes at the root-soil
interface. Soil Science Society of America Journal 35:301-306.
Rogiers SY, Clarke SJ. 2013. Nocturnal and daytime stomatal conductance
respond to root-zone temperature in ‘Shiraz’grapevines. Annals of botany
111:433-444.
122
Rogiers SY, Greer DH, Hutton RJ, Landsberg JJ. 2009. Does night-time
transpiration contribute to anisohydric behaviour in a Vitis vinifera
cultivar? Journal of experimental botany 60:3751-3763.
Rohula G, Kupper P, Räim O, Sellin A, Sõber A. 2014. Patterns of night-time
water use are interrelated with leaf nitrogen concentration in shoots of 16
deciduous woody species. Environmental and Experimental Botany
99:180-188.
Rosado BH, Oliveira RS, Joly CA, Aidar MP, Burgess SS. 2012. Diversity in
nighttime transpiration behavior of woody species of the Atlantic Rain
Forest, Brazil. Agricultural and Forest Meteorology 158:13-20.
Rosen K, Host D, Klee R, Rosinski R. 2006. UNIX: The Complete Reference.
McGraw-Hill, New York.
Rosenstiel TN, Ebbets AL, Khatri WC, Fall R, Monson RK. 2004. Induction of
poplar leaf nitrate reductase: a test of extrachloroplastic control of isoprene
emission rate. Plant Biology 6:12-21.
Rothstein DE, Cregg BM. 2005. Effects of nitrogen form on nutrient uptake and
physiology of Fraser fir (Abies fraseri). Forest Ecology and Management
219:69-80.
Sack L, Cowan PD, Jaikumar N, Holbrook NM. 2003. The ‘hydrology’ of leaves:
co-ordination of structure and function in temperate woody species. Plant
Cell and Environment 26: 1343-1356.
123
Sack L, Tyree MT, Holbrook NM. 2005. Leaf hydraulic architecture correlates
with regeneration irradiance in tropical rainforest trees. New Phytologist
167: 403-413.
Saugier B, Granier A, Pontailler JY, Dufrêne E, Baldocchi DD. 1997.
Transpiration of a boreal pine forest measured by branch bag, sap flow and
micrometeorological methods. Tree Physiology 17: 511-519.
Schindelin J, Arganda-Carreras I, Frise E et al. 2012. Fiji: an open-source
platform for biological-image analysis. Nature Methods 9: 676-682.
Scholz FG, Bucci SJ, Goldstein G, Meinzer F, Franco AC, Miralles-Wilhelm F.
2006. Removal of nutrient limitations by long-term fertilization decreases
nocturnal water loss in savanna trees. Tree Physiology 27:551-559.
Seginer I. 1984. On the night transpiration of greenhouse roses under glass or
plastic cover. Agricultural Meteorology 30: 257-268.
Sellin A, Lubenets K. 2010. Variation of transpiration within a canopy of silver
birch: effect of canopy position and daily versus nightly water loss.
Ecohydrology 3:467-477.
Sharkey TD, Bernacchi CJ, Farquhar GD, Singsaas EL. 2007. Fitting
photosynthetic carbon dioxide response curves for C3 leaves. Plant, Cell
and Environment 30:1035–1040
Sher AA and Marshall DL. 2003. Seedling competition between native Populus
deltoides (Salicaceae) and exotic Tamarix ramosissima (Tamaricaceae)
across water regimes and substrate types. American Journal of Botany 90:
413-422.
124
Siemens JA, Calvo-Polanco M, Zwiazek JJ. 2011. Hebeloma crustuliniforme
facilitates ammonium and nitrate assimilation in trembling aspen (Populus
tremuloides) seedlings. Tree Physiology 31:1238-1250.
Snyder KA, James JJ, Richards JH, Donovan LA. 2008. Does hydraulic lift or
nighttime transpiration facilitate nitrogen acquisition? Plant and soil
306:159-166.
Snyder KA, Richards JH, Donovan LA. 2003. Night-time conductance in C3 and
C4 species: do plants lose water at night? Journal of Experimental Botany
54: 861-865.
Sperry JS, Alder NN, Eastlack SE. 1993. The Effect of Reduced Hydraulic
Conductance on Stomatal Conductance and Xylem Cavitation. Journal of
Experimental Botany 44:1075-1082.
Sperry JS. 2000. Hydraulic constraints on plant gas exchange. Agricultural and
Forest Meteorology 104:13-23.
Spicer R, Holbrook NM. 2005. Within-stem oxygen concentration and sap flow in
four temperate tree species: does long-lived xylem parenchyma experience
hypoxia? Plant Cell and Environment 28: 192-201.
Stanhill G. 1986. Water use efficiency. Advances in Agronomy 39:53-85.
Stettler RF, Bradshaw HD, Heilman PE, Hinckley TM. 1996. Biology of Populus
and its implications for management and conservation. NRC Research
Press, 539 pp.
Sturtevant EL. 1919. Sturtevant’s notes on edible plants. Hedrick UP (ed.). JB
Lion Co., Albany, NY. 686pp.
125
Sun G, Alstad K, Chen J et al. 2011. A general predictive model for estimating
monthly ecosystem evapotranspiration. Ecohydrology 4: 245-255.
Sun H, Aubrey D, Teskey R. 2011. A simple calibration improved the accuracy of
the thermal dissipation technique for sap flow measurements in juvenile
trees of six species. Trees. doi:10.1007/s00468-011-0631-1.
Taylor G. 2002. Populus: Arabidopsis for forestry. Do we need a model tree?
Annals of Botany 90:681-689.
Tyree MT. 2003. Hydraulic limits on tree performance: transpiration, carbon gain
and growth of trees. Trees–Structure and Function 7:95-100.
Van der Willigen C, Pammenter NW. 1998. Relationship between growth and
xylem hydraulic characteristics of clones of Eucalyptus spp. at contrasting
sites. Tree Physiology 18:595-600.
Walch-Liu P, Ivanov II, Fillieur S, Gan Y, Remans T, Forde BG. 2006. Nitrogen
regulation of root branching. Annals of Botany 97:875-881.
Wang H, Zhao P, Hölscher D, Wang Q, Lu P, Cai XA, Zeng XP. 2012. Nighttime
sap flow of Acacia mangium and its implications for nighttime
transpiration and stem water storage. Journal of Plant Ecology 5:294-304.
Wilson KB, Baldocchi DD, Hanson PJ. 2000. Quantifying stomatal and non-
stomatal limitations to carbon assimilation resulting from leaf aging and
drought in mature deciduous tree species. Tree Physiology 20:787-797.
Wullschleger SD, Meinzer FC, Vertessy RA. 1998. A review of whole-plant water
use studies in trees. Tree Physiology 18:499-512.
126
Yoo CY, Pence HE, Hasegawa PM, Mickelbart MV. 2009. Regulation of
transpiration to improve crop water use. Critical Reviews in Plant Science
28:410-431.
Zeppel M, Tissue D, Taylor D, Macinnis-Ng C, Eamus D. 2010. Rates of
nocturnal transpiration in two evergreen temperate woodland species with
differing water-use strategies. Tree Physiology 30:988-1000.
Zeppel MJ, Lewis JD, Chaszar B, Smith RA, Medlyn BE, Huxman TE, Tissue
DT. 2012. Nocturnal stomatal conductance responses to rising [CO2],
temperature and drought. New Phytologist 193:929-938.
Zeppel MJ, Lewis JD, Medlyn B, Barton CV, Duursma RA, Eamus D, Adams
MA, Phillips N, Ellsworth DS, Forster MA, Tissue DT. 2011. Interactive
effects of elevated CO2 and drought on nocturnal water fluxes in
Eucalyptus saligna. Tree physiology 31:932-944.
Zhang H, Rong H, Pilbeam D. 2007. Signalling mechanisms underlying the
morphological responses of the root system to nitrogen in Arabidopsis
thaliana. Journal of Experimental Botany 58:2329-2338.
Copyright © 2022 FDOKUMEN