Comparison of a Brassica oleracea Genetic Map With the Genome of Arabidopsis thaliana
Upload
khangminh22Category
view
2download
0
Screening for drought tolerance in
Brassica rapa L.: from genetic variation
to gene expression
Yiming Guo
Bachelor of Science (Agriculture) & Bachelor of Arts (English Literature)
Master of Science (Agriculture)
This thesis is presented for the degree of Doctor of Philosophy
at The University of Western Australia
School of Plant Biology and The UWA Institute of Agriculture
Faculty of Science
2015

I
Abstract
One of the consequences of climate change is a change in rainfall distribution with more
frequent and unpredictable droughts in some regions. Drought threatens supplies of oil
produced from oilseed rape/canola (Brassica napus), while at the same time,
international demand for oilseeds is growing at an unprecedented rate. B. rapa, one of
the diploid progenitor species of the genetically-narrow and relatively recent
allopolyploid B. napus, exhibits greater genetic variation and wider natural distribution
than B. napus, and therefore is a promising source of drought tolerance alleles for
canola breeders.
This thesis aims to develop screening methods for drought tolerance in B. rapa during
the reproductive phase, and to identify expressed drought tolerance genes that may be
transferred to B. napus. An integrated approach was developed to meet this goal, from
assessment of genetic diversity, physiological evaluation of drought tolerance to
transcriptome analysis of drought-tolerant and drought-sensitive accessions.
First, genetic diversity in a global collection of 173 accessions of B. rapa from eight
regions was assessed by 51 simple sequence repeat (SSR) markers which revealed 715
polymorphic alleles. Three groups of B. rapa were identified by STRUCTURE analysis
of SSR data. Group 1 consisted of 42 accessions from Europe and west Asia-north
Africa, which had the highest richness of SSR allelic diversity, and included all the
seven wild type B. rapa ssp. sylvestris accessions. Group 2 consisted of 73 accessions
from east Asia while group 3 was a geographically-mixed group consisting of 58
accessions across all eight regions. Pairwise population probability values for allelic
variation revealed the genetic differences among eight geographic regions, which
provided the genetic background for selecting representative accessions for drought
tolerance screening.
A screening protocol for drought tolerance in B. rapa was developed in the early
reproductive stage, during which several physiological traits were measured in water-
II
stressed (WS) and well-watered (WW) conditions for 13 days. Destructive
measurements included leaf water potential and pollen viability, while non-destructive
measurements included soil water content, stomatal conductance and leaf and floral bud
temperatures. Temperature in leaves and buds was below ambient but began to increase
after a threshold point was reached in the WS treatment. The threshold point was
delayed in floral buds compared with leaf tissue, which suggested that floral bud
temperature may be a useful indicator of drought tolerance, and suitable for large-scale
screening in B. rapa.
Using this screening protocol, nine accessions of B. rapa and one accession of B. juncea
were evaluated for drought tolerance. The nine B. rapa accessions represented the
breadth of SSR genetic diversity in B. rapa, and included two wild type accessions (PI-
4 and PI-5). Large variation was found in flower and pod abortion, seed number, seed
yield, biomass, silique and beak length under WW and WS conditions. The relative
values in the WS compared to the WW treatment (WS/WW, %) reflected the effect of
drought stress on the ten accessions. Eight accessions experienced a 4 to 53% loss in
relative total biomass at maturity while PI-4 and PI-5 had no loss or a small increase in
relative total biomass in the WS treatment. Leaf and bud temperature differences to
ambient in the WS treatment were significantly correlated with relative total biomass,
and this correlation was stronger in floral buds than in leaves; that is, cool leaf and bud
temperatures during a transient drought stress at the reproductive phase were associated
with drought tolerance in this species.
An alternative screening method for drought tolerance, suitable for gene expression
studies, was investigated at the seedling stage, and the results were compared with
drought tolerance measured at the reproductive stage. Seeds of the same nine B. rapa
accessions were germinated and 25-day-old seedlings were subjected to a simulated
osmotic stress by 2.5% polyethylene (PEG) and Murashige and Skoog (MS) medium as
control. There was significant variation among accessions in shoot length, root length,
fresh weight and dry weight after 7 days treatment. The relative seedling dry weight (in
osmotic stress compared with control conditions) was significantly correlated with
drought tolerance based on relative non-reproductive biomass accumulation in soil,
which indicated that the seedling osmotic test may be a useful indicator of potential
drought tolerance at the reproductive stage.
III
Two B. rapa accessions that were drought sensitive or tolerant at the reproductive stage
were chosen for transcriptome analysis in search of drought-related genes in this species.
Plant growth and treatment followed the osmotic method for seedling screening as
described above. Leaf samples were collected 4 h, 8 h and 12 h after start of treatment
and were sequenced using Illumina MiSeq, generating a total of 26.7 million 150 bp
pair-end reads. Across all time points, a total of 17,227 differentially expressed genes
(DEGs) were identified when comparing PEG-stressed and MS-control samples. The
drought-tolerant accession responded differently to PEG-induced stress than the
drought-sensitive accession, and relatively few DEGs were common between the two
accessions at the three time points (1,522, 2,514 and 3,735, respectively). Gene function
enrichment analysis revealed a quicker response to osmotic stress in the drought-
tolerant than the drought-sensitive accession at 4 h, while after 12 h similar stress-
induced response pathways were identified in both accessions. Some potential drought-
related DEGs from the drought-tolerant accession were identified for further
investigation of their role in drought tolerance.


IV
Acknowledgements
My four years’ PhD study in UWA has been a rewarding journey, I could not have
completed it without enormous encouragement, help and support from my supervisors,
the university and school staff, friends and colleagues.
My sincere gratitude goes to my co-ordinating supervisor, Winthrop Professor Wallace
Cowling, for his consistent mentoring and support during my whole PhD training.
Thanks to his generosity and encouragement, I have managed to attend various
workshops especially about data analysis, data management and experimental design at
an early stage, which turned out to be extraordinarily helpful in my later study. I also
have gained experience through conference and research travels not only for research
and experimental purposes, but also a variety of knowledge and skills that shape a better
PhD candidate and from which I could benefit for my whole life. However, the most
grateful part is the trust and respect he has given to me, never too pushy but keeping the
right pace, in fact, step by step, I was not left behind and gradually trained into an
independent and confident researcher.
I would like to express my special thanks to W/Prof. Neil Turner, for his responsible
and excellent supervising for my scientific training. His dedication and enthusiasm
towards research has certainly inspired me and helped me go through the tedious
process of early stage of data collecting. His passion is infectious and enabled me to be
more engaged and to enjoy research that in the end turned out to be a fruitful journey. I
thank him for his patience and constructive guidance for all sorts of research questions
and discussions, which enabled my progress to move forward steadily.
Thanks to my supervisors Assist/ Prof. Sheng Chen and Assoc/Prof. Matthew Nelson,
for their effort in guiding me through this process, especially with specific problems.
Sheng was the initial person who linked me with UWA, his Chinese background has
brought special tie to both of us, which I received not only his research help but also

V
daily-life caring. I thank Matt for his expertise and input in my last part of research, his
stringent attitude has impacted on me for becoming a better-quality researcher.
I deeply appreciate the supervision I received during my time in Germany from
Professor Rod Snowdon, I was lucky to work with such a motivated and talented
scientist. I could not have achieved the tasks without his great support during and after
the trip.
I am grateful to be one of the recipients of UWA China-SIRF scholarships (from China
Scholarship Council and Sir Eric Smart Scholarship from The UWA Insistite of
Agriculture) that guaranteed my life in Australia for four years. I also feel greatly
honoured to be awarded the Convocation Postgraduate Travel Award along with the
Graduate Research School Travel Award and School of Plant Biology Travel Award,
which enabled me to conduct a short-period but productive experiment in Germany and
broadened the experience out of Australia.
I also thank the staff, academics and students in the School of Plant Biology and The
UWA Institute of Agriculture, for providing such a supportive and communicative
environment for our international PhD students. Those memories at the Rottnest
Summer School will be with me through my whole life. In particular, I would like to
thank Dr. Robert Creasy and Mr Bill Piasini, for their responsible and consistent help in
glasshouse. Thanks to Hackett Professor Kadambot Siddique for his great advice and
support for my PhD. Thanks to W/Prof. Hans Lambers, W/Prof. Tim Colmer,
Assoc/Prof. Megan Ryan, Ms. Barbara Jamieson, Ms. Natalie Jagals and Mr. Bradly
Muir for their support for my travel award applications, bookings and administrative
paper work. Thanks to Dr. Ricarda Jost and Mr. Greg Cawthray for their technical
advice. Thanks to Assoc/Prof. Susan Barker for providing opportunities for
undergraduate teaching. Thanks to the help from the past members of the canola breeder
group, especially to Annisa and Dini who shared the office and brought joy and fun.
I also thank Dr. Krystyna Haq and Dr. Michael Azariadis from Graduate Research
School for their help of enhancing my writing skills and providing great advice and
facilities.
There is also a bunch of PhD students who shared happiness and frustrations during
different periods of my study who are worthy of a thank-you note, especially Ying for

VI
her company, Xue and Shasha for their encouragements and helps. The friendships are
enjoyable and brought color and fun into my life.
Particular thanks to my parents for their love and support, especially the integrity and
life-long habits that brought me into a perpetual student. I deeply thank my husband,
Dangzhen, for his enormous love, understanding, patience and support during the
journey, I shall delicate this thesis to him as I could not have achieved this without him.
In retrospect, I always think how lucky I am to have four wonderful supervisors, to have
such large amount of supports from the university, the school and the people I met
during this journey. My acknowledgement goes to them all with apologies that I could
not mention everyone here. My PhD journey ends, but never does our relationships.
These appreciations will be carried and memorised as a spiritual treasure for my whole
life.


VII
Statement of original contribution
This thesis has been substantially accomplished during the course of enrolment in the
degree of Doctor of Philosophy at The University of Western Australia, and has not
previously been accepted for any other degree in this or another institution. I declare
that all sources for this work have been acknowledged, and that there is no breach of
confidentiality or copyright associated with the submission of this thesis for the degree
of Doctor of Philosophy.
In the case of jointly authored work for submitted or published papers, I confirm that all
co-authors have approved publication of the work in this thesis submission, and that I
am the primary contributor to the experimental, analytical and writing components of
the jointly authored work in each case.
Perth, Western Australia, October 2014
------------------
Yiming Guo
-------------------
W./Prof. Wallace Cowling
(co-ordinating supervisor)


VIII
Contents
Abstract ......................................................................................................................................... I
Acknowledgements .................................................................................................................... IV
Statement of original contribution .......................................................................................... VII
Contents .................................................................................................................................... VIII
List of Figures ........................................................................................................................... XIII
List of Tables .......................................................................................................................... XVIII
List of abbreviations ................................................................................................................ XXI
1 General Introduction ............................................................................................................... 1
2 Literature Review .................................................................................................................... 5
2.1 Introduction ................................................................................................................... 5
2.2 Evolutionary history and genetic diversity of B. rapa ............................................... 6
2.2.1 Brassicaceae family and its inter-relationships ................................................. 6
2.2.2 Evolution of B. rapa ............................................................................................ 7
2.2.3 Genetic diversity of B. rapa ................................................................................. 9
2.2.4 Valuable genetic resources transfer to oilseed production .............................. 12
2.3 Breeding for drought tolerance in Brassica species ................................................. 14
2.3.1 Understanding drought tolerance in crops ...................................................... 14
2.3.2 Breeding for drought tolerance in crops .......................................................... 16
2.3.3 Breeding drought tolerance in Brassica crops ................................................. 25
2.4 Molecular technology approaches for improving drought tolerance ..................... 26
2.4.1 Marker-assisted selection .................................................................................. 27
2.4.2 Application of MAS in plant breeding .............................................................. 27
2.4.3 New era of marker-assisted selection with advanced technology .................... 28
2.4.4 Gene networks and metabolites involved in drought stress response and tolerance .. 33

IX
3 Centre of origin and centres of diversity in an ancient crop, Brassica rapa (turnip rape) .. 38
3.1 Introduction ................................................................................................................. 39
3.2 Materials and Methods ............................................................................................... 41
3.2.1 Plant materials and growing conditions ........................................................... 41
3.2.2 Trait performance in glasshouse ....................................................................... 42
3.2.3 DNA extraction and SSR analysis .................................................................... 44
3.2.4 Characterization of suspicious B. rapa accessions ........................................... 44
3.2.5 Population structure analysis ............................................................................ 45
3.2.6 Genetic diversity analysis and analysis of molecular variance ........................ 47
3.3 Results ........................................................................................................................... 47
3.3.1 Population structure analysis and SSR allelic diversity ................................... 48
3.3.2 AMOVA tests on the global collection .............................................................. 51
3.3.3 Comparison of allelic variation across geographical regions .......................... 51
3.3.4 Phenotypic diversity of B. rapa in relation to genetic and geographical diversity ... 54
3.4 Discussion ..................................................................................................................... 56
3.4.1 Groups based on SSR allelic diversity ............................................................... 56
3.4.2 SSR allelic diversity within and among geographic regions ............................ 57
3.4.3 Morphotypes in relation to SSR genetic diversity ............................................. 58
3.4.4 The A-genome of B. napus revealed in accession ZL07 .................................. 59
3.4.5 Centres of origin and diversity in B. rapa ......................................................... 59
3.5 Summary ...................................................................................................................... 60
4 Delayed water loss and temperature rise in floral buds compared with leaves of Brassica rapa L. subjected to a transient water stress during reproductive development ............. 61
4.1 Introduction ................................................................................................................. 62
4.2 Materials and methods ................................................................................................ 64
4.2.1 Plant growth and conditions ............................................................................. 64
4.2.2 Leaf water potential (LWP) and soil water content (SWC) .............................. 65
4.2.3 Leaf conductance ............................................................................................... 65
X
4.2.4 Leaf and bud temperature ................................................................................. 66
4.2.5 Observation of stomata in the epidermis on the leaf and bud ......................... 66
4.2.6 Stomatal and cuticular transpiration ............................................................... 67
4.2.7 Flower tagging, flower and pod development, seed yield and yield components . 68
4.2.8 Statistical analysis ............................................................................................. 68
4.3 Results .......................................................................................................................... 69
4.3.1 Development of water deficits ........................................................................... 69
4.3.2 Effect of the transient water deficit on yield and yield components ................ 69
4.3.3 Effect of the water deficit on floral development and function ....................... 71
4.3.4 Transpiration and transpirational cooling of the leaf and bud ....................... 71
4.3.5 Leaf and bud temperatures ............................................................................... 75
4.4 Discussion ..................................................................................................................... 76
5 Genotypic variation for tolerance to transient drought during the reproductive phase of Brassica rapa .......................................................................................................................... 79
5.1 Introduction ................................................................................................................. 80
5.2 Materials and Methods ............................................................................................... 82
5.2.1 Plant growth conditions .................................................................................... 82
5.2.2 Flower and pod tagging .................................................................................... 85
5.2.3 Plant harvest and biomass records ................................................................... 87
5.2.4 Leaf water potential (LWP) and soil water content (SWC) ............................. 87
5.2.5 Leaf stomatal conductance (LSC) and leaf and bud temperature ................... 88
5.2.6 Data analysis ..................................................................................................... 89
5.3 Results .......................................................................................................................... 89
5.3.1 Soil water and plant changes during the treatment period .............................. 89
5.3.2 Flower development and abortion .................................................................... 91
5.3.3 Biomass and seed yield components ................................................................. 93
5.3.4 Leaf-to-air and bud-to-air temperature differences ......................................... 96
5.4 Discussion ................................................................................................................... 104

XI
6 Association between osmotic stress response at the seedling stage and drought tolerance at the reproductive stage in Brassica rapa ........................................................................................ 108
6.1 Introduction ............................................................................................................... 109
6.2 Materials and Methods ............................................................................................. 111
6.2.1 Plant materials and growth conditions ........................................................... 111
6.2.2 Statistical analysis ............................................................................................ 113
6.3 Results ......................................................................................................................... 113
6.3.1 Responses of seedling growth to the osmotic stress ........................................ 113
6.3.2 Comparison between responses to screening for drought tolerance at the seedling and reproductive stages .............................................................................. 116
6.4 Discussion ................................................................................................................... 117
6.4.1 Hydroponic system and drought tolerance evaluation ................................... 117
6.4.2 Useful traits for evaluating drought tolerance at the seedling stage ............. 117
6.4.3 Early vigour and its association with crop yield ............................................. 118
6.4.4 Identification of drought tolerant and drought sensitive accessions ............. 118
6.5 Summary .................................................................................................................... 120
7 Drought tolerance in Brassica rapa is associated with rapid up-regulation of gene networks for general stress responses and programmed cell death ................................................... 121
7.1 Introduction ............................................................................................................... 123
7.2 Materials and Methods ............................................................................................. 126
7.2.1 Plant materials and growth conditions ........................................................... 126
7.2.2 Tissue sampling, total RNA extraction and pooling ....................................... 127
7.2.3 cDNA library construction and sequencing ................................................... 127
7.2.4 Sequencing data analysis ................................................................................ 129
7.3 Results ......................................................................................................................... 133
7.3.1 Generation, mapping and assessment of RNA-seq reads ............................... 133
7.3.2 Differential expressed genes (DEGs) .............................................................. 133
7.3.3 Patterns of gene co-expression ........................................................................ 134
7.3.4 Gene ontology (GO) classification .................................................................. 136
XII
7.3.5 Enriched biological process in response to osmotic stress ............................ 138
7.3.6 Early stress response of the drought-tolerant accession ................................ 139
7.4 Discussion ................................................................................................................... 146
7.4.1 Drought tolerance is associated with rapid activation of drought-responsive gene expression networks ........................................................................................ 146
7.4.2 Early drought responses are induced by hormone signaling and regulation 147
7.4.3 Tolerance to osmotic stress involves a programmed cell death (PCD) response .................................................................................................................................. 147
7.4.4 Differential transcription factor activation and signal responses in the osmotic stress reaction ........................................................................................................... 148
7.4.5 Sulphur assimilation and metabolism play important roles in drought response in B. rapa ................................................................................................... 149
7.4.6 B. rapa as a source of genetic variation for improvement of drought tolerance in B. napus ................................................................................................................ 150
8 General Discussion ............................................................................................................... 152
8.1 Introduction ............................................................................................................... 152
8.2 Key findings of this thesis ......................................................................................... 152
8.2.1 Evaluation of genetic and allelic diversity in B. rapa .................................... 152
8.2.2 Towards large-scale drought tolerance screening methods .......................... 153
8.2.3 Comparing drought tolerance expressed at the reproductive and seedling stages ......................................................................................................................... 155
8.2.4 Unique regulatory pathways identified in tolerant accessions ...................... 156
8.3 Summary and future work ....................................................................................... 157
References ................................................................................................................................ 160
Appendices ............................................................................................................................... 179
Part A: Outline of publications and conference presentations from this thesis ................ 179
Part B: Supplementary tables and figures ............................................................................ 183


XIII
List of Figures Figure 2.1. Cytogenetic relationships of Brassica species (U 1935). Solid and broken lines
in the allopolyploids represent female and male parents respectively (Prakash et al. 2009). The letters represent the genomes present in each species............................... 7
Figure 2.2. Functions of drought stress-inducible genes in stress tolerance and response. Gene products are classified into two groups. The first group includes proteins that probably function in stress tolerance (functional proteins), and the second group contains protein actors involved in further regulation of signal transduction and gene expression that probably function in stress response (regulatory proteins). Source: Shinozaki and Yamaguchi-Shinozaki (2007). ............................................................. 34
Figure 3.1. Sixteen “suspicious” accessions which clustered outside of the major B. rapa group by 2D-MDS analysis with 51 A/C SSR primer analysis (the other 171 B. rapa accessions were hidden in “(A)”) ................................................................................ 45
Figure 3.2. Three simple sequence repeat marker groups (G1, G2 and G3) of 173 B. rapa accessions were generated by software STRUCTURE based on the optimum cluster number K=3 (Supplementary Figure S3) for polymorphic SSR alleles, and sorted by Q value (accessions estimated membership fractions). ............................................... 49
Figure 3.3. Delta K value for the true subpopulation of 173 confirmed B. rapa accessions using STRUCTURE and STRUCTURE HARVESTER. The peak appeared when K = 3 indicates the most likely true K value. Each K was repeated 10 times for calculation. ..... 50
Figure 3.4. 2D-MDS analysis showing three simple sequence repeat marker groups (G1, G2, G3) generated by STRUCTURE in 173 confirmed B. rapa accessions by 715 SSR alleles at polymorphic loci. Seven wild type B. rapa ssp. sylvestris in G1 are circled in red. ...... 50
Figure 3.5. Genetic relationships between pairs and triplets of regions based on shared unique SSR alleles. The relative size of shapes of geographical regions reflects the number and richness of private allele in each region, and the relative size and degree of shading of overlap areas reflects the number of alleles unique to pairs or triplets of regions (see Tables 3.6 and Table 3.7). Region AU was eliminated from this analysis due to the low number of accessions (2). Region abbreviations: EA – east Asia, SA – south Asia, SEA – southeast Asia, CA – central Asia, WANA – west Asia and north Africa, EU – Europe, AM – America, and AU – Australia. ....................................... 53
Figure 4.1. Epidermal impressions of the leaf and floral bud (a: the adaxial epidermis of the leaf; b: the abaxial epidermis of the leaf; c: the abaxial epidermis of the sepal of the closed floral bud) of B. rapa plants at the flowering stage (scale bar = 5 µm). The arrow in the circle gives the length of the stomatal pore. ........................................... 67
Figure 4.2. Change in soil water content (% of field capacity, FC) (a), predawn leaf water
potential (b), and leaf conductance (c) of B. rapa plants in the well watered (●, WW)
XIV
treatment and the water stressed (○,WS) treatment after water was withheld for 10
days and then rewatered (RW) when indicated by the arrow. Values are the means ± one standard error (n=4) when larger than the symbol. ............................................... 70
Figure 4.3. Newly-opened B. rapa flowers from the well watered (WW) control (a) and from the water stressed (WS) treatment 5 days after water was withheld in the WS treatment (b), and the partly dissected floral bud from the WS (upper) and WW (lower) treatments 5 days after water was withheld in the WS treatment (c). Scale bar = 1 mm. ................. 71
Figure 4.4. Stomatal density (number of stomata per mm2) (a) and stomata length (b) on the adaxial (ad) and abaxial (ab) epidermes of the leaves and abaxial epidermis of the sepals of the floral buds of well watered B. rapa plants. Values are the means + one standard error of mean (n =4). ..................................................................................... 72
Figure 4.5. Four examples of water loss from the leaf and closed floral bud with time after excision from B. rapa plants at four different level of water deficit: LWP = -0.4 MPa and leaf conductance = 450 mmol m-2 s-1 (a), LWP = -0.5 MPa and leaf conductance = 164 mmol m-2 s-1 (b), LWP = -1.08 MPa and leaf conductance = 44 mmol m-2 s-1 (c) , and LWP = -1.45 MPa and a leaf stomatal conductance = 20 mmol m-2 s-1 (d). In each case the leaf and floral bud were measured simultaneously on two balances. .... 73
Figure 4.6. Changes in the leaf and closed floral bud temperatures (relative to the ambient
temperature, Tleaf-Tair and Tbud-Tair) of B. rapa plants in the well-watered (●, WW)
treatment and water-stressed (○, WS) treatment after water was withheld for 10 days
and then rewatered (RW) when indicated by the arrow. Values are the means ± one standard error of mean (n=4) when larger than the symbol. ........................................ 75
Figure 5.1. Demonstration of flowers and pistils of self-compatible B. rapa plants (SC-2) subjected to the well-watered (WW) and transient water-stressed (WS) treatments: . 86
Figure 5.2. Changes in (a) soil water content expressed as% of field capacity (FC), measured just before daily rewatering in the well-watered (WW) treatment; (b) predawn leaf water potential (MPa), and (c) leaf stomatal conductance (mmol m-2 s-1) in the WW treatment (solid symbols) and the water-stressed (WS, open symbols) treatment after water was withheld for 13 days and then re-watered (RW, indicated by the arrow) in accessions SC-2 (circles) and SC-4 (squares). Each mean is accompanied by a bar representing the mean ± s.e. (n=4) when larger than the symbol. .............................................................. 90
Figure 5.3. The average number of mature pods, aborted pods or aborted flowers that formed from tagged open flowers on the main raceme and the two uppermost side branches during the 13-day water-stressed (WS) or well-watered (WW) treatments in ten Brassica accessions. Each flower was tagged as it opened to track the result of pod development at each flower node. Flowers that failed to develop a pod (at least 5 mm) 2 to 3 days after opening were defined as “aborted flowers”, pods that failed to develop mature seeds were defined as “aborted pods”, while “mature pods” contained well developed mature seeds at harvest. ...................................................................... 91

XV
Figure 5.4. Changes in the percentage flower abortion as the soil water content decreased in
the water stress treatment, for accessions SC-2 (●) and SC-4 (○). Each mean is
accompanied by a bar representing the mean ± s.e. (n=4) when larger than the symbol. .. 92
Figure 5.5. Seed yield (a) and average number of seeds per pod (b) on the main raceme and the two uppermost side branches during the 13-day water-stressed (WS) or well-watered (WW) treatments in ten Brassica accessions. Each mean is accompanied by a bar representing one s.e. above the mean (n=4). ......................................................... 93
Figure 5.6. Relative silique length (a) and relative beak length (b) of pods formed on the main raceme and the two uppermost side branches during the 13-day water-stressed (WS) treatment in ten Brassica accessions, expressed as a percentage of the well-watered (WW) treatment. Each mean is accompanied by a bar representing one s.e. above the mean (n=4). ................................................................................................. 94
Figure 5.7. Changes in silique length, beak length and seed number per pod from the main raceme and two upmost side branches (branch 1 and branch 2) in pods of the plants that developed on different days during treatment period in both well-watered (WW) and water-stressed (WS) conditions in one representative Brassica accessions (SC-2): a) silique length and beak length in WW condition; b) silique length and beak length in WS condition; and c) seed number per pod in WW condition and d) seed number per pod in WS condition. Each mean is accompanied by a bar representing the mean ± s.e. (n=4) when larger than the symbol. ...................................................................... 95
Figure 5.8. Effect of reduction in soil water content (%) during 13 days of water-stressed
(WS) treatment on the leaf-to-air temperature difference (LTD) (●) and bud-to-air
temperature difference (BTD) (○) in three representative Brassica accessions: (a)
SC-1, (b) PI-3, and (c) PI-5. Leaf and bud temperatures began to increase significantly after SWC dropped to certain values (varied among accessions) which were defined as the “threshold SWC” and were indicated by arrows. Each mean is accompanied by a bar representing the mean ± s.e. (n=4) when larger than the symbol. See Appendices: Supplementary Figure S2 for all the 10 accessions. ................................................... 97
Figure 5.9. Leaf-to-air (a) and bud-to-air (b) temperature differences during the 13-day treatment period among 10 Brassica accessions. Values are for the average across the 13 days in the well-watered (WW) and water-stressed (WS) treatment, and the interpolated value at soil water content equal to 20% field capacity (FC). Each mean is accompanied by a bar representing one s.e below the mean (n=4). ........................ 98
Figure 5.10. B. rapa accession PI-5 in the water-stressed (WS) treatment (leaf) and in the well-watered (WW) treatment (right) after 10 days of treatment when the soil water content was < 20% FC. ............................................................................................... 99
Figure 6.1. Display of the methodology of the experiment with a) seed germination in plastic tubes (0.2 ml volume) filled with 1% agar gel; b) after 2-4 DAS germinated seeds were transferred into 50 ml falcon tubes containing MS medium; c) after 11-13 DAS seedlings were transferred from enclosed tubes to open (at the base) tubes inserted into a 150 mm deep 10 L water tank; and d) the plants 25-27 DAS when the two treatments were imposed. ................................................................................... 112

XVI
Figure 6.2. Effects of 2.5% PEG 6000 (PEG) and the MS medium control (Ctrl) in nine accessions of B. rapa on a) shoot length; b) root length; c) fresh weight and d) oven-dry weight. Bars give one SE of the mean (n= 9) and the scale for each parameter varies across four plots. ............................................................................................. 114
Figure 6.3. Display of contrasting responses in shoot and root growth in six of the nine accessions of B. rapa exposed to MS solution (control – left) and 2.5% PEG 6000 for 7 d (right): a) SC-2, sensitive response at the reproductive stage; b) SC-3, sensitive response at the reproductive stage; c) SC-5, sensitive response at the seedling stage; d) PI-2, sensitive response at the seedling stage; e) PI-4, tolerant response at the reproductive and seedling stages; f) PI-5, least early vigor, tolerant response at the reproductive and seedling stages. See chapter 5 for the response at the reproductive stage. .............................................. 119
Figure 7.1. Research workflow showing the experimental design. Two genotypes (drought-tolerant and drought-sensitive) were subjected to two treatments (2.5% PEG osmotic stress and MS medium control). Leaf tissues were sampled 4 h, 8 h and 12 h after imposition of treatment, termed as T1, T2 and T3 at time points respectively. Each library contained three biological replicates and randomized before pooling into three multiplex for three sequencing runs. ................................................................ 128
Figure 7.2. Venn diagrams showing the different numbers of differentially expressed genes (DEGs) overlapped and unique in drought-sensitive (DS) and drought-tolerant (DT) in three sampling time points (4 h, 8 h and 12 h after treatment imposition). Numbers within circles showing up- or down regulated in the two accessions and three time points. ....................................................................................................... 134
Figure 7.3. Figures were selected from 50 clusters using k-means cluster approach to represent three different types of gene expression trends between drought-sensitive (DS) and drought-tolerant (DT) accessions. Selected clusters were those differentially expressed genes (DEGs) that closely associate and enriched with biological process responding to osmotic stress or regulatory functions. a) DEGs were relatively stable down-regulated along three time points in DS accession, while a significant increase expression patterns were found in DT. b) DEGs were relative stable up-regulated in DS accession, while initially down-regulated in DT accession at 4 h but vertically changed to up-regulated at 8 h and 12 h time points. c) DEGs showed similar patterns between DS and DT accession in three time points, which showed down-regulated trend from 4 h to 8 h period, but reverse to up-regulation. d) DEGs showed different patterns between DS and DT in three time points. Details of top 50 enriched GO terms refer to Appendices: Supplementary Table S2). Each time point stand for the log2-fold change between PEG-stressed and MS control samples in DS and DT accessions at 4 h, 8 h and 12 h time points, respectively. .................................................................. 135
Figure 7.4. GO functional classification of 15,779 genes detected from 12 libraries with annotated GO terms. The results are summarised in the three main categories as cellular component, molecular function and biological process. In each of the three main categories of the GO classification, there were 10, 14 and 23 functional groups, respectively. ............................................................................................................... 136

XVII
Figure 7.5. Functional groups of gene ontology (GO) categories of (a) Biological process and (b) Molecular function showing the varied numbers of gene functions assigned from differentially expressed genes (DEGs) in drought-sensitive (DS) (left side) and drought-tolerant (DT) (right side) at three time points (4 h, 8 h and 12 h). .............. 137
Figure 7.6. Heat map of common differentially expressed up-regulated genes (up_DEGs) in both drought-sensitive (DS) and drought-tolerant (DT) accessions in three time points. Numbers 5-20 on the colour scale represent log2-FPKM value of the fold change between the PEG-treated and MS control plants. The darker colour in a cell indicates the higher gene expression changes in different comparisons. Sulfur utilization and cellular response to sulphur starvation were the most enriched biological GO terms (log10-P value< -3) (Table 7.3). ............................................... 138
Figure 7.7. The enriched GO list with a significant results from hypergeometric test (p<0.01) for all biological process GO categories for a) drought-sensitive (DS) accession at 4 h, 8 h and 12 h time point and b) drought-tolerant (DT) accession at 4 h, 8 h and 12 h time point. The disc size is proportional to the frequency of the GO term in the underlying Gene Ontology Annotation Database (discs of more general terms are larger; discs of more specific terms are smaller) (Supek et al, 2011). Spatial arrangement of discs approximately reflects a grouping of GO categories by semantic similarity. The scatterplots shows the cluster representatives (i.e. Terms remaining after the redundancy reduction) in 2-D space. Discs representing unrelated GO terms. Categories and terms were selected from a broader set to eliminate redundancy and were prepared to visualization by use of REViGO (http://revigo.irb.hr). ................. 141
Figure 7.8. The enriched GO list with a significant results from hypergeometric test (P<0.05) for molecular function GO categories: a) drought-sensitive (DS) accession at 4 h, 8 h and 12 h time point; b) drought-tolerant (DT) accession at 4 h, 8 h and 12 h time point. The disc size is proportional to the frequency of the GO term in the underlying Gene Ontology Annotation Database (discs of more general terms are larger; discs of more specific terms are smaller) (Supek et al, 2011). Spatial arrangement of discs approximately reflects a grouping of GO cetegories by semantic similarity. The scatterplots shows the cluster representatives (i.e. Terms remaining after the redundancy reduction) in 2-D space. Discs representing unrelated GO terms. Categories and terms were selected from a broader set to eliminate redundancy and were prepared to visualization by use of REViGO (http://revigo.irb.hr). ................. 142
Figure 7.9. Discovery and processing of 16 drought-responsive genes. Genes from biological process category “response to stimulus” (Fig 4) were selected and 241 most closely osmotic stress related genes were clustered. A group of genes showed higher up-regulation in DT at 4h were identified (A), while the enlarged cluster and gene annotation details were summarised in (B) and (C). ................................................. 144
Figure 7.10. Combined biological changes that enriched in drought-sensitive (DS) and drought-tolerant (DT) accessions at three time points. Each square block contains six small squares representing up- or down-regulated enrichment at three time points. The most significant P-value from hypergeometric test during enrichment analysis in corresponding biological changes was used to generate the heat map. P-value = 0.05 represent no enrichment each condition. ................................................................... 145


XVIII
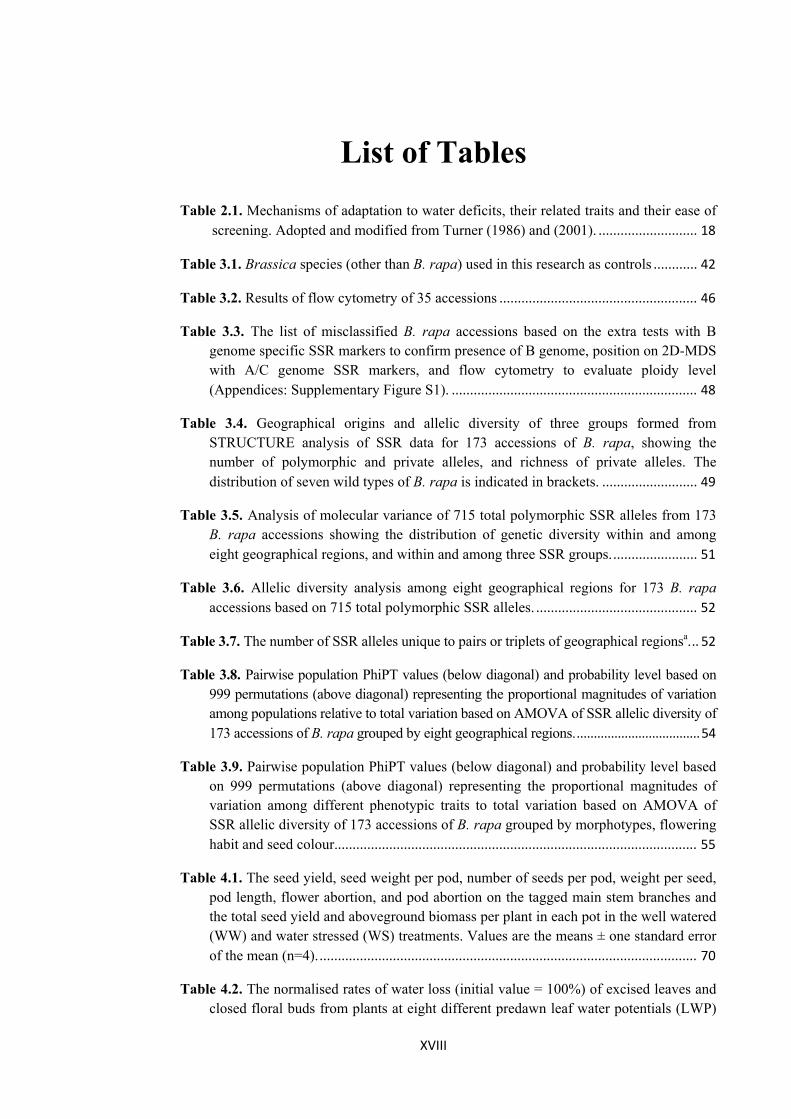
List of Tables Table 2.1. Mechanisms of adaptation to water deficits, their related traits and their ease of
screening. Adopted and modified from Turner (1986) and (2001). ........................... 18
Table 3.1. Brassica species (other than B. rapa) used in this research as controls ............ 42
Table 3.2. Results of flow cytometry of 35 accessions ...................................................... 46
Table 3.3. The list of misclassified B. rapa accessions based on the extra tests with B genome specific SSR markers to confirm presence of B genome, position on 2D-MDS with A/C genome SSR markers, and flow cytometry to evaluate ploidy level (Appendices: Supplementary Figure S1). ................................................................... 48
Table 3.4. Geographical origins and allelic diversity of three groups formed from STRUCTURE analysis of SSR data for 173 accessions of B. rapa, showing the number of polymorphic and private alleles, and richness of private alleles. The distribution of seven wild types of B. rapa is indicated in brackets. .......................... 49
Table 3.5. Analysis of molecular variance of 715 total polymorphic SSR alleles from 173 B. rapa accessions showing the distribution of genetic diversity within and among eight geographical regions, and within and among three SSR groups. ....................... 51
Table 3.6. Allelic diversity analysis among eight geographical regions for 173 B. rapa accessions based on 715 total polymorphic SSR alleles. ............................................ 52
Table 3.7. The number of SSR alleles unique to pairs or triplets of geographical regionsa. .. 52
Table 3.8. Pairwise population PhiPT values (below diagonal) and probability level based on 999 permutations (above diagonal) representing the proportional magnitudes of variation among populations relative to total variation based on AMOVA of SSR allelic diversity of 173 accessions of B. rapa grouped by eight geographical regions. .................................... 54
Table 3.9. Pairwise population PhiPT values (below diagonal) and probability level based on 999 permutations (above diagonal) representing the proportional magnitudes of variation among different phenotypic traits to total variation based on AMOVA of SSR allelic diversity of 173 accessions of B. rapa grouped by morphotypes, flowering habit and seed colour................................................................................................... 55
Table 4.1. The seed yield, seed weight per pod, number of seeds per pod, weight per seed, pod length, flower abortion, and pod abortion on the tagged main stem branches and the total seed yield and aboveground biomass per plant in each pot in the well watered (WW) and water stressed (WS) treatments. Values are the means ± one standard error of the mean (n=4). ....................................................................................................... 70
Table 4.2. The normalised rates of water loss (initial value = 100%) of excised leaves and closed floral buds from plants at eight different predawn leaf water potentials (LWP)
XIX
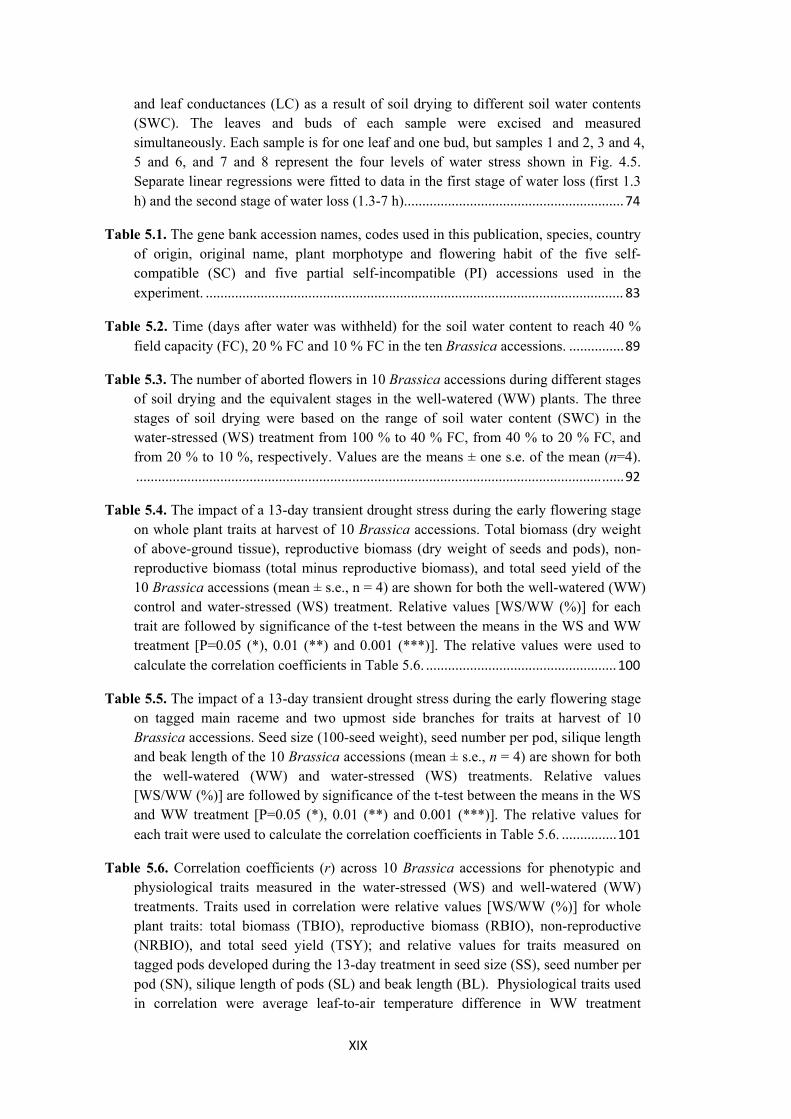
and leaf conductances (LC) as a result of soil drying to different soil water contents (SWC). The leaves and buds of each sample were excised and measured simultaneously. Each sample is for one leaf and one bud, but samples 1 and 2, 3 and 4, 5 and 6, and 7 and 8 represent the four levels of water stress shown in Fig. 4.5. Separate linear regressions were fitted to data in the first stage of water loss (first 1.3 h) and the second stage of water loss (1.3-7 h). ........................................................... 74
Table 5.1. The gene bank accession names, codes used in this publication, species, country of origin, original name, plant morphotype and flowering habit of the five self-compatible (SC) and five partial self-incompatible (PI) accessions used in the experiment. .................................................................................................................. 83
Table 5.2. Time (days after water was withheld) for the soil water content to reach 40 % field capacity (FC), 20 % FC and 10 % FC in the ten Brassica accessions. ............... 89
Table 5.3. The number of aborted flowers in 10 Brassica accessions during different stages of soil drying and the equivalent stages in the well-watered (WW) plants. The three stages of soil drying were based on the range of soil water content (SWC) in the water-stressed (WS) treatment from 100 % to 40 % FC, from 40 % to 20 % FC, and from 20 % to 10 %, respectively. Values are the means ± one s.e. of the mean (n=4). ..................................................................................................................................... 92
Table 5.4. The impact of a 13-day transient drought stress during the early flowering stage on whole plant traits at harvest of 10 Brassica accessions. Total biomass (dry weight of above-ground tissue), reproductive biomass (dry weight of seeds and pods), non-reproductive biomass (total minus reproductive biomass), and total seed yield of the 10 Brassica accessions (mean ± s.e., n = 4) are shown for both the well-watered (WW) control and water-stressed (WS) treatment. Relative values [WS/WW (%)] for each trait are followed by significance of the t-test between the means in the WS and WW treatment [P=0.05 (*), 0.01 (**) and 0.001 (***)]. The relative values were used to calculate the correlation coefficients in Table 5.6. .................................................... 100
Table 5.5. The impact of a 13-day transient drought stress during the early flowering stage on tagged main raceme and two upmost side branches for traits at harvest of 10 Brassica accessions. Seed size (100-seed weight), seed number per pod, silique length and beak length of the 10 Brassica accessions (mean ± s.e., n = 4) are shown for both the well-watered (WW) and water-stressed (WS) treatments. Relative values [WS/WW (%)] are followed by significance of the t-test between the means in the WS and WW treatment [P=0.05 (*), 0.01 (**) and 0.001 (***)]. The relative values for each trait were used to calculate the correlation coefficients in Table 5.6. ............... 101
Table 5.6. Correlation coefficients (r) across 10 Brassica accessions for phenotypic and physiological traits measured in the water-stressed (WS) and well-watered (WW) treatments. Traits used in correlation were relative values [WS/WW (%)] for whole plant traits: total biomass (TBIO), reproductive biomass (RBIO), non-reproductive (NRBIO), and total seed yield (TSY); and relative values for traits measured on tagged pods developed during the 13-day treatment in seed size (SS), seed number per pod (SN), silique length of pods (SL) and beak length (BL). Physiological traits used in correlation were average leaf-to-air temperature difference in WW treatment
XX
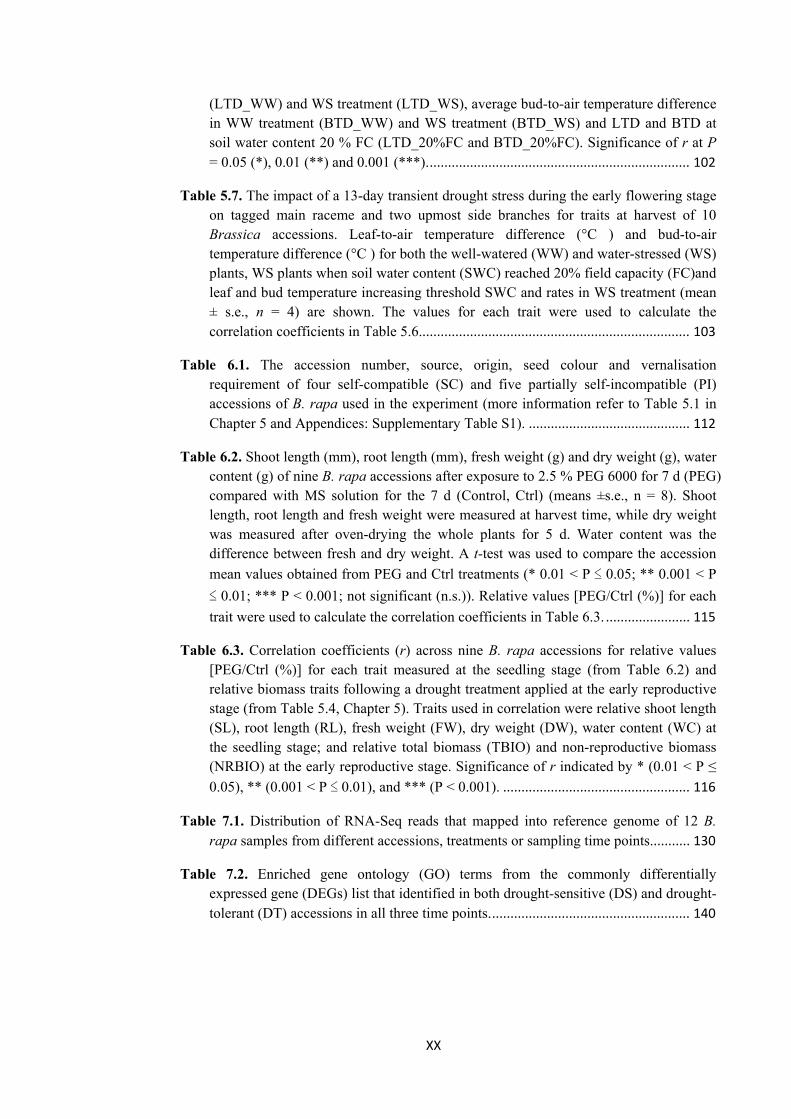
(LTD_WW) and WS treatment (LTD_WS), average bud-to-air temperature difference in WW treatment (BTD_WW) and WS treatment (BTD_WS) and LTD and BTD at soil water content 20 % FC (LTD_20%FC and BTD_20%FC). Significance of r at P = 0.05 (*), 0.01 (**) and 0.001 (***). ....................................................................... 102
Table 5.7. The impact of a 13-day transient drought stress during the early flowering stage on tagged main raceme and two upmost side branches for traits at harvest of 10 Brassica accessions. Leaf-to-air temperature difference (°C ) and bud-to-air temperature difference (°C ) for both the well-watered (WW) and water-stressed (WS) plants, WS plants when soil water content (SWC) reached 20% field capacity (FC)and leaf and bud temperature increasing threshold SWC and rates in WS treatment (mean ± s.e., n = 4) are shown. The values for each trait were used to calculate the correlation coefficients in Table 5.6.......................................................................... 103
Table 6.1. The accession number, source, origin, seed colour and vernalisation requirement of four self-compatible (SC) and five partially self-incompatible (PI) accessions of B. rapa used in the experiment (more information refer to Table 5.1 in Chapter 5 and Appendices: Supplementary Table S1). ............................................ 112
Table 6.2. Shoot length (mm), root length (mm), fresh weight (g) and dry weight (g), water content (g) of nine B. rapa accessions after exposure to 2.5 % PEG 6000 for 7 d (PEG) compared with MS solution for the 7 d (Control, Ctrl) (means ±s.e., n = 8). Shoot length, root length and fresh weight were measured at harvest time, while dry weight was measured after oven-drying the whole plants for 5 d. Water content was the difference between fresh and dry weight. A t-test was used to compare the accession
mean values obtained from PEG and Ctrl treatments (* 0.01 < P ≤ 0.05; ** 0.001 < P
≤ 0.01; *** P < 0.001; not significant (n.s.)). Relative values [PEG/Ctrl (%)] for each
trait were used to calculate the correlation coefficients in Table 6.3. ....................... 115
Table 6.3. Correlation coefficients (r) across nine B. rapa accessions for relative values [PEG/Ctrl (%)] for each trait measured at the seedling stage (from Table 6.2) and relative biomass traits following a drought treatment applied at the early reproductive stage (from Table 5.4, Chapter 5). Traits used in correlation were relative shoot length (SL), root length (RL), fresh weight (FW), dry weight (DW), water content (WC) at the seedling stage; and relative total biomass (TBIO) and non-reproductive biomass (NRBIO) at the early reproductive stage. Significance of r indicated by * (0.01 < P ≤
0.05), ** (0.001 < P ≤ 0.01), and *** (P < 0.001). ................................................... 116
Table 7.1. Distribution of RNA-Seq reads that mapped into reference genome of 12 B. rapa samples from different accessions, treatments or sampling time points........... 130
Table 7.2. Enriched gene ontology (GO) terms from the commonly differentially expressed gene (DEGs) list that identified in both drought-sensitive (DS) and drought-tolerant (DT) accessions in all three time points. ...................................................... 140


XXI
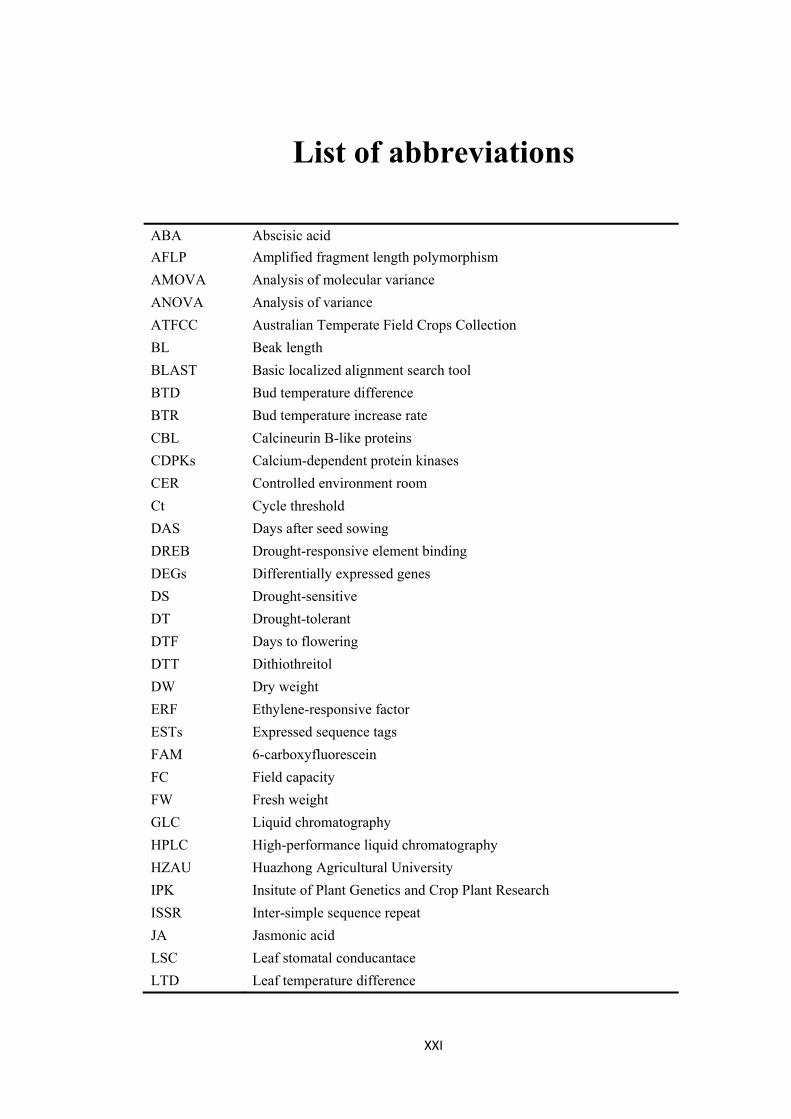
List of abbreviations
ABA Abscisic acid
AFLP Amplified fragment length polymorphism
AMOVA Analysis of molecular variance
ANOVA Analysis of variance
ATFCC Australian Temperate Field Crops Collection
BL Beak length
BLAST Basic localized alignment search tool
BTD Bud temperature difference
BTR Bud temperature increase rate
CBL Calcineurin B-like proteins
CDPKs Calcium-dependent protein kinases
CER Controlled environment room
Ct Cycle threshold
DAS Days after seed sowing
DREB Drought-responsive element binding
DEGs Differentially expressed genes
DS Drought-sensitive
DT Drought-tolerant
DTF Days to flowering
DTT Dithiothreitol
DW Dry weight
ERF Ethylene-responsive factor
ESTs Expressed sequence tags
FAM 6-carboxyfluorescein
FC Field capacity
FW Fresh weight
GLC Liquid chromatography
HPLC High-performance liquid chromatography
HZAU Huazhong Agricultural University
IPK Insitute of Plant Genetics and Crop Plant Research
ISSR Inter-simple sequence repeat
JA Jasmonic acid
LSC Leaf stomatal conducantace
LTD Leaf temperature difference
XXII
LTR Leaf temperature increase rate
LWP Leaf water potential
MAS Maker assisted selection
MAPK Mitogen-activated protein kinase
M-MLV Moloney murine leukemia virus
MS Murashige and Skoog medium
NaCl Sodium chloide
NPZ Norddeutsche Pflanzenzuchi Hans-Georg Lembke KG
NRBIO Non-reproductive biomass
PAR Photosynthetically active radiations
PCD Programmed cell death
PCR Polymerase chain reaction
PEG Polyethylene glycol
PI Partial self-incompatible or partial self-incompatibility
QTL Quantitative trait locus
qRT-PCR Quantitative reverse transcriptase polymerase chain reaction
RAPD Random amplified polymorphic DNA
RFLP Restriction fragment length polymorphism
RL Root length
ROS Reactive oxygen species
SA Salicylic acid
SC Self-compatible or self-compatibility
SCR S-locus cysteine-rich protein
SNP Single nucleotide polymorphism
SRK S-locus receptor kinase protein
SSR Simple Sequence Repeat
SL Silique length in chapter 5; shoot length in chapter 6
SWC Soil water content
TBIO Total biomass
TFs Transcription factors
TSY Total seed yield
UPGMA Unweighted Pair Group Method with Arithmetic Mean
WST Western standard time
WC Water content
1
Chapter 1
1 General Introduction
Brassica rapa L. (genome AA, 2n = 20) has a range of morphological types, and is an
important oilseed crop as well as root (turnip), vegetable (Chinese cabbage) and folder
crop. Due to its long history of domestication in both Europe and Asia, B. rapa has
abundant genetic diversity, which can be identified by molecular markers. It is a close
relative of B. napus (oilseed rape or canola) (AACC, 2n = 38), which is a major edible
and industrial oilseed crop with several breeding bottlenecks in the past so that the level
of diversity has become relatively narrow (Becker et al. 1995; Cowling 2007). B. rapa
could provide an ideal source of useful genes to increase the diversity of B. napus
through introgression by crossing and recombination (Qian et al, 2006; Mei et al, 2009).
It is predicted that global warming and total rainfall redistribution will result in
unexpected hot and dry conditions in key traditional crop production regions of the
world (Parmesan and Yohe 2003; CSIRO and Bureau of Meteorology 2010). Therefore,
genetic improvement of crops for drought tolerance has become urgent (Moffat 2002;
Tester and Langridge 2010).
Over recent decades, extensive studies have been conducted to improve the productivity
of various crops under water-limited conditions (Campos et al. 2004; Cattivelli et al.
2008). Varshney et al. (2011) proposed an integrated approach for developing crops
better adapted to water-limited environments, and this thesis describes the steps that
were followed to achieve the aim of improving the drought tolerance of Brassica
2
species, particularly B. rapa. Several hypotheses and research questions were raised and
are addressed in this thesis by a series of experiments, and the general hypotheses
include:
1) Wide genetic diversity exists among B. rapa accessions collected from diverse
environments; the Old World regions including the wild type B. rapa have
higher diversity than the New World regions.
2) Physiological mechanisms (stomatal conductance and leaf temperatures) can be
identified associated with drought tolerance in B. rapa and may provide rapid
screening tools for drought tolerance.
3) Drought tolerance related genes can be revealed through comparison between
drought-tolerant and drought-sensitive accessions when exposed to drought
stress treatment.
This thesis is dedicated to the improvement of drought tolerance in B. rapa, which
includes the identification of physiological characteristics associated with drought
tolerance, the development of an efficient screening method for a large number of
breeding lines and the exploration of drought-related genes.
The first step (Chapter 3) was to identify the level of genetic and morphological
diversity of a wide-range of landraces and wild relatives of B. rapa in order to narrow
down the possible selection targets from a large number of candidate accessions. A
global collection of B. rapa accessions from 43 countries and 6 continents were
included in this experiment, testing both genotypic and phenotypic variations.
As fundamental research has made significant progress in understanding of the
physiological and molecular responses of plants to moisture deficiency (Turner 1981,
1988a), the second step in this study (Chapters 4 and 5) was to investigate the different
physiological responses to a water deficit in the early reproductive phase, and their
association with increased drought tolerance using a diverse set of accessions identified
by the genetic diversity analysis in the first step of the study (Chapter 3).
Molecular techniques, from marker- or QTL-targeted molecular breeding to genetic
engineering approaches, have been developing rapidly and are showing great potential
for speeding up the identification of improved drought tolerance in crops. In this thesis,
RNA sequencing (RNA-Seq) has been utilized to identify possible drought-related

3
genes as well as relative gene networks and pathways. Unique drought-related genes
represent potentially interesting selection markers for improved drought tolerance in
both B. rapa and B. napus.
This thesis is structured with a General Introduction (Chapter 1), Literature Review
(Chapter 2), five experimental chapters (Chapters 3, 4, 5, 6 and 7), and a General
Discussion (Chapter 8). The five experimental chapters are:
Chapter 3 examines the genetic diversity of 173 B. rapa accessions, and studied
the relationship between their geographical origin and genetic cluster groups
using Simple Sequence Repeat (SSR) markers. This chapter provides initial
phenotypic and genotypic information for the accessions for drought tolerance
screening.
Chapter 4 explores the methodology of measuring drought tolerance during the
early reproductive phase. Leaf and floral-bud temperatures are identified as
important indicators of the plant’s response to drought.
Chapter 5 extends the screening methodology to ten Brassica accessions, nine B.
rapa accessions and one B. juncea accession. It identifies variation among
accessions for various physiological indicators, such as leaf and bud
temperature, that were used to differentiate drought-tolerant from drought-
sensitive accessions. These accessions were then selected for further
investigation at the molecular level.
Chapter 6 compares the drought stress responses of the same nine B. rapa
accessions identified in Chapter 5 as drought-tolerant or drought-sensitive at the
reproductive stage, with the drought stress responses at the seedling stage. It
provides an alternative screening method for drought tolerance based on
osmotic solutions that simulate drought stress and could potentially shorten the
selection time using key indicators such as oven-dried weight at the seedling
stage.
Chapter 7 investigates the differentially-expressed genes under the same
conditions as Chapter 6 in two of the B. rapa accessions that had previously
been identified as drought-tolerant and drought-sensitive at the reproductive
phase. Different regulatory pathways between drought-tolerant and drought-
sensitive accessions were identified, revealing multiple key drought-related
4
genes, which could provide potential resources for future breeding in both B.
rapa and B. napus.
The results of these experimental chapters are summarised and discussed in the final
chapter (Chapter 8). All five chapters have been written as papers for publication in
international journals. Chapters 3, 4 and 5 have already been published or accepted for
publication in different journals (see Appendices: Outline of publications), while
chapters 6 and 7 have been prepared as manuscripts ready for submission.
5
Chapter 2
2 Literature Review
2.1 Introduction
This chapter presents a review of the literature relating to the evolutionary, breeding and
genetic history of B. rapa, previous methods for crop improvement for drought
tolerance and the methodology for the physiological and molecular aspects of drought
tolerance.
The first section in this chapter provides an overview of the genetic and evolutionary
background of B. rapa as well as its relationship within the Brassicaceae family, which
leads to the hypothesis and objectives in the study of Chapter 3.
The second section in this review covers the impact of water deficit on plant growth,
and various physiological methodologies to investigate drought responses in crops,
specifically, the possibility of handling a large number of screening candidates, which
leads to the testing of novel methodology applied in our B. rapa project in Chapter 4.
This section includes current progress in improving drought tolerance in crops, which
forms the background for screening nine accessions of B. rapa in Chapter 5 for drought
stress tolerance at the reproductive stage, or for tolerance of simulated drought stress at
the seedling stage (Chapter 6).

6
The third and last section reviews the fast-developing modern molecular technologies
and their application in crop breeding. This review spans the use of molecular marker
assisted selection (MAS) with DNA markers and identification of QTLs, through to
next generation sequencing which is decreasing in price and becoming more accessible
to crop breeding projects. Sequencing technology for highly expressed genes in RNA
has started a new era of genomic exploration for genes associated with drought
tolerance. Various metabolites and signalling pathways of plants under drought stress
are reviewed in the last section. The possibility of linking physiological responses with
genetic signalling and regulatory pathways leads to conclusions on future directions for
breeding, which relates to experiments in the last two experimental chapters (Chapter 7
and Chapter 8).
Drought tolerance in crops is a large topic and a large volume of literature exists,
therefore the focus of this literature review is drought tolerance in Brassica species.
2.2 Evolutionary history and genetic diversity of B. rapa
2.2.1 Brassicaceae family and its inter-relationships
The Brassicaceae is a large plant family with many important agricultural species that
contribute to the cuisine of many cultures. It contains over 3,700 species in 338 genera
(Warwick et al. 2009). In domestication history, normally only a certain part of a plant
such as leaf, fruit or seed is consumed. However, the Brassica crops have been
domesticated into several forms, and every part of the plant has been selected and used
for human consumption, such as edible oils from seeds, vegetables from roots, leaves,
stems and even the inflorescence. The origin, domestication and breeding history of
Brassica crops can be traced back to ancient documents and literature thousands of
years ago, for example a Chinese almanac (3000 B.C.) and Indian Aryan literature
(1500 B.C) (Prakash et al. 2012).
Apart from some wild species or allied family genera (members of the Tribe Brassiceae),
like Sinapis arvensis, Raphanus raphanistrum, Eruca and Diplotaxis, Brassica crops
are most known for the complex of six species: three diploid B. rapa (AA, n=10), B.
nigra (BB, n=8), B. oleracea (CC, n=9), and three amphidiploids B. carinata (BBCC,
n=17), B. juncea (AABB, n=18) and B. napus (AACC, n=19), which are shown by their

7
genomic relationships in the famous triangle of U (Fig. 2.1) (U 1935). Natural
hybridization among different diploid species generated the amphidiploids in the
triangle. Cytogenetically, researchers (Pradhan et al. 1992; Warwick et al. 1992)
believed that B. nigra and B. rapa were the cytoplasm donors to B. carinata and B.
juncea, respectively, while a related wild species of B. oleracea (B. montana) was the
donor to B. napus (Song and Osborn 1992).
Figure 2.1. Cytogenetic relationships of Brassica species (U 1935). Solid and broken lines in the allopolyploids represent female and male parents respectively (Prakash et al. 2009). The letters represent the genomes present in each species.
2.2.2 Evolution of B. rapa
Brassica rapa L. is a diverse and important agricultural species in Brassicaceae family.
During its long history of domestication, B. rapa has been developed into various crop
types and subspecies with abundant genetic diversity and valuable characteristics,
including oilseed (ssp. oleifera, turnip rape; ssp. dichotoma, brown sarson or toria; ssp.
trilocularis, yellow sarson), leafy vegetables (B. ruvo, broccoletto; ssp. pekinensis,
Chinese cabbage; ssp. chinensis, pak choi and narinosa; ssp. nipposinica, mizuna), root
vegetables (turnip) and fodder crops (ssp. rapifera, fodder turnip) (Warwick et al. 2008;
Prakash et al. 2012).
Although the origin of B. rapa prior to domestication is not agreed by all authors, wild
forms of B. rapa have been collected from the western Mediterranean region, Europe,
Central Asia and the near east (Sinskaia 1928; Vavilov 1949). Burkill (1930) believed
that it was originally biennial but developed into annual forms through selection and
domestication. Two independent centres of diversity of B. rapa (Western and Eastern)
have been proposed including a linear evolutionary mode from Europe through the

8
Middle East and India to South China (Song et al. 1988a). However, there might be
several centres of diversity that developed during or after domestication in the same
region or elsewhere (Harlan 1971).
B. rapa was one of the first Brassica species to be domesticated (Gómez-Campo and
Prakash 1999). The vast diverse morphotypes within this species indicated different
pathways of breeding history because of geographical isolation and different breeding
purposes.
The three well-defined groups, root, leafy vegetable and oilseed types of B. rapa occur
throughout the geographic range of B. rapa (Gómez-Campo and Prakash 1999; Prakash
et al. 2009). In early times in Europe, B. rapa spreaded mainly as the turnip-type crop,
because there were other oil plants available in Southern Europe, especially the olive
tree. The long history of the domestication of the turnip in Europe can be traced back
through linguistic description of turnip as “gongylis” by the Greek Theophrast (371-285
B.C.) and the Roman Columella (35-65 A.D.) (Reiner H. 1995). Turnip type B. rapa
was used for oil when some cold areas in Europe suffered a lack of availability of
vegetable oil, especially northern Europe, therefore oilseed type B. rapa was developed
from about 14th century. Reiner (1995) concluded that European oilseed type B. rapa is
very close to the turnip type B. rapa genetically, because it was selected or raised out of
it just a few hundred years ago. Therefore, Europe constitutes the primary centre for
oleiferous (oilseed type) forms and turnip. The oleiferous form is often referred to as
Polish rape or summer turnip rape in Canada (Khachatourians and Phillips 2001).
Unlike in Europe, East Asia does not have detailed records on the early breeding history
of B. rapa (Khachatourians and Phillips 2001). Varieties of B. campestris (a previous
name for leafy vegetable type B. rapa) in Asia represent the oldest Brassica on record
for cultivation, but the seed source of this early agriculture lacked information on
specific locale, agronomic and other utility indicators (Liu 1984). The modern leafy
forms of B. rapa are extensively cultivated in China, Korea, Indonesia and Japan, where
they are used as vegetable, fresh salad, boiled or salt-pickled leaves. Pak choi (ssp.
chinensis) with a narrow or wide green-white petiole is believed to have evolved first in
central China. It was proposed that some leafy vegetables such as Chinese cabbage (ssp.
pekinensis) were developed originally in central China by natural hybridization between
pak choi and turnip rape (ssp. oleifera), and then formed heading types by adaptation to
9
variable environment through selection (Li 1981). Therefore, more and more
morphotypes were developed via natural isolation and artificial selection in different
regions in China. There is huge diversity of varieties within this type, leading to more
sub-species such as ssp. chinensis, ssp. narinosa, ssp. japonica, and ssp. pekinensis,
according to their morphologically distinct differences of leaf colour, existence of
petioles or formed head. The oilseed type B. rapa in China started when vegetable types
were used as both vegetable and oilseed crops, the latter used for extracting cooking oil
from seeds. Sun et al (2004) reported two types from Gansu Province: one of them is
called “Lintao Caizi” which is used both as a vegetable from leaves and for oil from
seed. Most regions in north-western China can grow “Baicai” (leaves) but only some
places can produce the seeds. Therefore, “Lintao Caizi” may represent a stage in the
evolution of oilseed B. rapa in China.
Various Japanese vegetables, such as ssp. japonica, a large stump with narrow thin
leaves, could have been derived originally from pak choi, but have diverged
considerably through geographic isolation and intensive selection (Song et al. 1988b).
Furthermore, one of the oleiferous subgroup - the sarson group - is unique in the Indian
sub-continent: brown sarson, yellow sarson and toria. The brown sarson is the oldest
type and thought to have evolved independently from the original stock in northwest of
India in the foothills of the Himalayas (Prakash and Hinata 1980). Two forms of brown
sarson are cultivated in India, the self-incompatible lotni and self-compatible tora. It is
believed that lotni is the earlier form, while tora was developed after hybridization with
the yellow sarson because they have similar characteristics in terms of inflorescence
shape, flower morphology and growth rate, except the seed colour (Prakash et al. 2009).
Yellow sarson is characterized by its yellow seeds, self-compatibility and multiple-
valved siliquae. It was selected by farmers because of the attractive yellow seed colour
and larger seed size. The toria type is believed to have evolved from a mutant brown
sarson population, specialised in its dwarf appearance and short life cycle (Prakash et al.
2012).
2.2.3 Genetic diversity of B. rapa
Genetic diversity reveals information about how populations adapt to changing and
various environments. It can be used to understand the genetic structure of the
germplasm and thus uncover the relationship between species or accessions within a
10
species and possible evolutionary pathway (Song et al. 1990). This information is also
valuable to assist breeders in the selection of parental lines for hybrid breeding (Collard
and Mackill 2008).
Initially, genetic diversity was evaluated using morphological, phenological and
agronomical traits. For example, Padilla et al. (2005) evaluated 34 morphological and
agronomical traits for 120 landraces of B. rapa including oilseed and turnip rape which
were collected from two locations in northwest Spain, and distinct clusters based on
these data provided useful information for breeding strategy. However, many oilseed
type varieties are difficult to distinguish based solely on descriptive traits, especially
those cultivars that were mainly bred for commercial purposes. Therefore, more
accurate methods are required in terms of the study of genetic diversity, and several
methods were introduced including biochemical ways such as isoenzymes (Denford and
Vaughan 1977), gas liquid chromatography (GLC) analysis (White and Law 1991;
Kaushik and Aqnihotri 2000) and high-performance liquid chromatography (HPLC)
(Bradfield and Bjeldanes 1987; Velasco and Becker 1998).
DNA-based molecular markers provide promising tools to evaluate genetic variation
among accessions. The marker systems that have been used in examining oilseed type
Brassicas including restriction fragment length polymorphism (RFLP), amplified
fragment length polymorphism (AFLP), random amplified polymorphic DNA (RAPD)
and simple sequence repeat (SSR) and inter-simple sequence repeat (ISSR).
Various genetic diversity work have been done using different DNA markers, from
limited numbers of markers and testing accessions in early stages to larger amount of
DNA markers and testing accessions in later and recent years. Using RFLP markers,
Song et al. (1988a; 1988b; 1990) and Song and Osborn (1992) contemplated the major
evolutionary questions about the origin and taxonomy of B. rapa and its possible
evolutionary pathway during breeding, and these papers stand as key original papers in
genetic diversity study in B. rapa.
Many genetic diversity studies support the high level of diversity within B. rapa (Zhao
et al. 2005; Warwick et al. 2008; Pino Del Carpio et al. 2011; Annisa et al. 2013a). Das
et al. (1999) revealed 69% of AFLP markers and 80% of RAPD markers were
polymorphic in 9 accessions of B. rapa; Warwick et al. (2008) showed 62-79%
polymorphism among B. rapa accessions based on AFLP markers; Dan et al. (2003)

11
found 89% polymorphism among 107 cultivars collected from Tibet based on RAPD
markers; and Zhao et al. (2005) has reported even higher diversity (91%) in AFLP
markers that were polymorphic in 161 B. rapa accessions.
Many studies focused on regional varieties. Chinese literature is dominated by the
analysis of leafy types of B. rapa collected from various regions of China. He and Tu
(2002) studied 29 cultivars from Shaanxi province and Dan et al. (2003) found high
diversity among 107 cultivars from Tibet. Zhu et al. (1998), Chen et al. (2004), Xu et al.
(2004) and Chen et al. (2006) covered cultivars or landraces from Yangtze River
regions like Hunan, Hubei, Jiangsu and Zhejiang provinces. The listed studies
categorised the local cultivars based on genetic clusters, and results demonstrated a
higher level of diversity in spring type B. rapa than in winter type in China. Leafy B.
rapa dominates in southern China and has close relationships with many other types. In
Europe, Soengas et al. (2011) focused on the turnip type of B. rapa (ssp. rapa) from
north-west Spain and established the genetic populations and structure. It is important to
include wild type accessions for the study of genetic variation in Europe. Andersen et al.
(2009) used ISSR markers to study the genetic structure of 15 cultivated B. rapa
accessions and 17 wild type accessions in Scandinavian countries, and revealed separate
clusters of cultivated and wild type accessions, while Warwick et al. (2009) focused on
the wild type classification of Brassica species, including other wild types apart from B.
rapa.
Although regional studies have provided an extensive understanding of widely
distributed accessions in each region, evaluation of germplasm from large international
collections is more useful when seeking exotic resources/alleles for breeding purposes.
McGrath and Quiros (1992b) applied RFLP markers to study genetic diversity among
20 accessions of B. rapa representing three geographical regions, Europe, China and
central Asia/India areas. The results revealed that genetic diversity was linked closely
with geographical regions. Warwick et al. (2008) tested Canadian spring turnip rape
cultivars that originated from China, Europe and India and found descending genetic
polymorphism levels among the three subgroups. With a wider germplasm collection
internationally and more advanced analysis, the AFLP genetic diversity study of B. rapa
by Zhao et al. (2005) is widely cited and taken as one of the key papers. It included 239
accessions of B. rapa that represented different geographical origins and morphotypes,
and revealed a closer genetic relationship among different morphotypes (leaf, root and
12
oilseed types) from the same geographical regions than the same morphotypes from
different regions. This indicates that geographical isolation played an important role in
the development of genetic diversity. Subsequent research by Zhao et al. (2007), based
on the similar methods, developed association mapping of leaf traits, flowering time and
phytate content in the international collection.
More recently, genetic diversity studies have been linked closely with breeding
purposes. Zhao et al. (2010) designed a core collection based on the evaluation of 239
accessions using SSR markers of B. rapa for association mapping for future breeding;
Pino Del Carpi (2011) studied the differentiation of population patterns among 168
accessions of the core collection of B. rapa using AFLP and SSR markers; and Annisa
et al (2013a) focused on the SSR genetic diversity of a global collection of oilseed B.
rapa that would be utilized later for drought and heat tolerance research. The collected
phenotypic and molecular data in core collections of B. rapa will be valuable for
multiple purposes in future breeding.
2.2.4 Valuable genetic resources transfer to oilseed production
Rapeseed oil has become the world’s third-leading source of edible vegetable oil; in fact,
there are two species of plants that can qualify as canola-quality rapeseed – B. napus
and B. rapa. B. rapa, with the exception of the Indian yellow sarson form, is an
obligate out-crosser due to the common presence of self-incompatibility genes
(Takayama et al. 2000; Takayama and Isogai 2005). As a result, little or no seed is set
when B. rapa is self-pollinated, whilst this problem is not present in B. napus. Besides,
B. napus varieties perform well in yield potential and nutrient values, therefore, despite
being a relatively younger species, the distribution of oleiferous variants of B. napus has
far exceeded other oilseed Brassica species, and thus have been grown commercially
worldwide as canola quality varieties (Potter 2009). However, the allotetraploid B.
napus evolved relatively recently from only a few putative hybridization events between
its diploid progenitors (B. rapa and B. oleracea) (Gómez-Campo and Prakash 1999;
Dixon 2007), which limits the genetic diversity within B. napus species and potential
for genetic improvement of current cultivars. In fact, it has experienced breeding
bottlenecks during its domestication into winter and spring breeding pools (Becker et al.
1995), and this has been exacerbated in Australia after three decades (1970-2000) of

13
closed recurrent selection, leading to a very narrow gene base for canola in Australia
(Cowling 2007).
A common approach to increase genetic diversity in B. napus is to cross with its diploid
progenitors B. rapa and B. oleracea. Some attempts of crossing B. napus with B. rapa
or B. oleracea have already been made (Bennett et al. 2008). The genomes of B.
oleracea may be represented as CoCo, and CoCo can gradually replace CnCn (C genome
of B. napus) by backcrossing with B. oleracea. However, the new generated B. napus
could hardly be applied into breeding programs because of serious defects of agronomic
traits. One of the reasons for the poor performance of the Co genome in B. napus may be
that the vegetable traits in B. oleracea cause negative side effects for oil production (Liu
and Meng 2006). Meanwhile, B. rapa (A genome), the other ancestor species of B.
napus, had records of being used as an oil crop for quite a long time, not only with
abundant germplasm but also in good agronomic traits. Therefore, it is more accessible
for introducing useful genetic resources by crossing B. napus with B. rapa instead of B.
oleracea.
Wide hybridization between B. napus and B. rapa has been widely conducted in
rapeseed breeding history in China, where the germplasm resources of B. napus were
rare. B. napus was first introduced into China in order to overcome susceptibility in B.
rapa for major diseases. B. napus showed high resistance and higher yield production
and thus it quickly replaced many B. rapa landraces and cultivars (Liu 1984). Besides,
previous researches (Qian et al. 2005) showed that the A genome of B. napus (An) could
be replaced by the A genome of B. rapa (Ar) by backcrossing breeding, generating a
new type of B. napus with ArArCnCn genomes.
Another way of broadening genetic diversity of B. napus is resynthesis of B. napus by
crossing B. rapa and B. oleracea (Chen and Heneen 1990). Qian et al. (2006)
successfully generated resynthesised B. napus and demonstrated a higher genetic
distance comparing with normal rapeseed from China, Europe and Australia, followed
by Mei et al. (2011) claiming high possibility of widening the gene pool of B. napus
through the “virtual allopolyploid” approach.
However, disadvantages still exist in resynthesised B. napus; for instance, progeny of
such crosses tend to have unstable chromosome arrangements leading to disruption of
genomic information. Recently, a new approach for genetic improvement of Brassica

14
allotetraploids has been proposed using trigenomic bridges, as reviewed by Chen et al.
(2011). From this review, two general pathways of developing trigenomic bridges were
summarised, which were either created by sequential crossing between three diploid
species (e.g., [B. rapa × B. nigra] × B. oleracea), or by crossing between the diploid and
allotetraploid species (e.g., B. rapa × B. carinata). A sucessful example using the
former pathway by crossing between three diploid species was reported by Li and Ge
(2007), in which synthetic B. napus (B. rapa × B. oleracea) was used as maternal parent
in a cross with B. nigra to generate ABC hybrids. More trigenomic hybrids were
generated by crossing different allotetraploids with the other complimentary genome
(Yan et al. 2009; Mason et al. 2010; Navabi et al. 2010).
An understanding of the molecular genetic diversity of valuable genetic resources in B.
rapa is essential for advanced technologies in molecular marker assisted breeding.
2.3 Breeding for drought tolerance in Brassica species
2.3.1 Understanding drought tolerance in crops
In the era of climate change, plants are affected by environmental stresses, and drought
is one of the major abiotic stresses that threatens modern agricultural systems and food
production (Parmesan and Yohe 2003; Varshney et al. 2011).
Water deficits develop in a plant when water loss through transpiration exceeds the
absorption rate of water through the root system. Under these conditions, plant cells lose
turgor and cannot function normally. The two basic parameters that describe the degree
of water stress are (i) water content, and (ii) energy status of the water in the cell. The
former term usually expressed as relative to that at full saturation, i.e. relative water
content, and the latter one is usually expressed as total water potential (Turner 1981).
2.3.1.1 Drought tolerance or drought resistance?
A diversity of morphological and physiological mechanisms enable crop plants to avoid
or tolerate drought, and the ability of a crop to yield satisfactorily when subjected to
water deficits has been termed drought resistance (Begg and Turner 1976). Drought
resistance involves drought escape, dehydration postponement and dehydration
15
tolerance (at high or low tissue water potential) (Table 2.1) (Blum 1988; Turner et al.
2001).
Selection for yield under drought has often resulted in varieties that escape drought
through changes in time of flowering and maturation (Turner 1981). In Brassica crops,
breeding for early flowering to escape drought has met with some success (Williams
and Hill 1986). This thesis focuses on mechanisms of drought resistance, such as turgor
maintenance, dehydration postponement and molecular control of these mechanisms.
Meanwhile, drought tolerance is often used interchangeably as drought resistance by
different researchers. Tolerance is measured (in disease) as the ability to yield well in
the presence of the pathogen and as a defense strategy (Medzhitov et al. 2012), and
sometimes it is difficult to quantify the pathogen, so resistance is the general term. In
this thesis, seed yield and biomass were measured following a transient drought stress,
and the impact of drought stress was evaluated relative to well-watered conditions.
While recognising these different mechanisms of drought resistance, for convenience I
will use the term drought tolerance in this thesis.
2.3.1.2 Physiological mechanisms of drought tolerance
General physiological mechanisms of drought tolerance and yield component traits are
summarised in Table 2.1, and several of these will be discussed below.
2.3.1.2.1 Maintenance of water uptake
Maintenance of water uptake can be achieved by increasing root-to-shoot ratio and
increasing hydraulic conductance. An increase in root-to-shoot ratio may result from an
increase in root length density which enhances water uptake, such as reported in
soybean (Hoogenboom et al. 1987), or from a reduced aboveground shoot mass while
the root mass remains relatively unchanged (Niu and Rodriguez 2008).
2.3.1.2.2 Reduction of water loss
Reduction of water loss involves a reduction in three aspects: a) Reduction in epidermal
conductance; b) reduction of radiation and/or c) reduction in evaporative surface.
a) Reduction in epidermal conductance depends mostly on the control of stomata,
which are small pores on the top (adaxial) and bottom (abaxial) epidermis of the
16
leaf, stem, sepal and pistil, that provide the principle mechanism for controlling the
rate of water loss (Jones et al. 1980). To be effective in maintaining the internal
water balance of plants, the stomatal aperture must be reduced to minimize water
loss when water is limiting.
b) The wilting of plant leaves is a passive process but is effective in reducing the
radiation load (Turner 1981). Other mechanisms to reduce radiation load are found
in Eucalyptus trees which have steeply inclined leaves that avoid the high
temperature and radiation in the middle of the day while increasing the radiation
absorbed in the cooler and more humid early morning and late afternoon (King
1997), and species that have leaf hairs, surface wax or salt to reduce radiation load
by increasing the reflection of the leaves.
c) Active reduction of evaporative surface may occur during water deficits through a
reduction in leaf expansion and leaf size, or abscission or senescence of leaves.
Mechanisms that reduce water loss will also reduce photosynthesis and growth, but are
important for survival under drought stress. Such mechanisms increase water use
efficiency and if this occurs in the vegetative phase can enable sufficient water
conservation to provide water for the reproductive phase and an economic yield (Turner
1988a).
A major question addressed in this thesis is whether or not it is possible to improve
drought tolerance through breeding, through genetic changes in the physiological
responses to drought which ultimately reduce the impact of drought on economic yield.
2.3.2 Breeding for drought tolerance in crops
In the past decades, considerable effort has been made to improve drought tolerance in
crops and progress has been achieved based on screening for morphological and
physiological characteristics (Blum 2011b). The success of such breeding programs is
dependent on the development of screening techniques that are reliable and easily-
measurable indicators of adaptive mechanisms (briefly summarised in Table 2.1).
Drought stress can occur at different stages during plant growth, generating various
impacts on plant growth and yield. Crop development stages vary in their sensitivity to
water stress. Slafer and Whitechurch (2001) stated that the most important stage for
wheat to tolerate water shortage and ensure high yield is the stem elongation stage. In
17
maize, low water potential during the flowering stage is likely to cause a delay in silk
emergence and anthesis (Bolaños and Edmeades 1993), and water stress around the
flowering stage can lead to male sterility due to anther dysfunction (Saini and Westgate
1999).
A range of physiological mechanisms enable plants to adapt to drought stress, and
variation in such mechanisms among genotypes and the relationships between the
mechanisms and seed yield can be used as criteria for breeding purposes. Characteristics
or traits that may be useful in breeding for drought tolerance in Brassica are
summarised below.
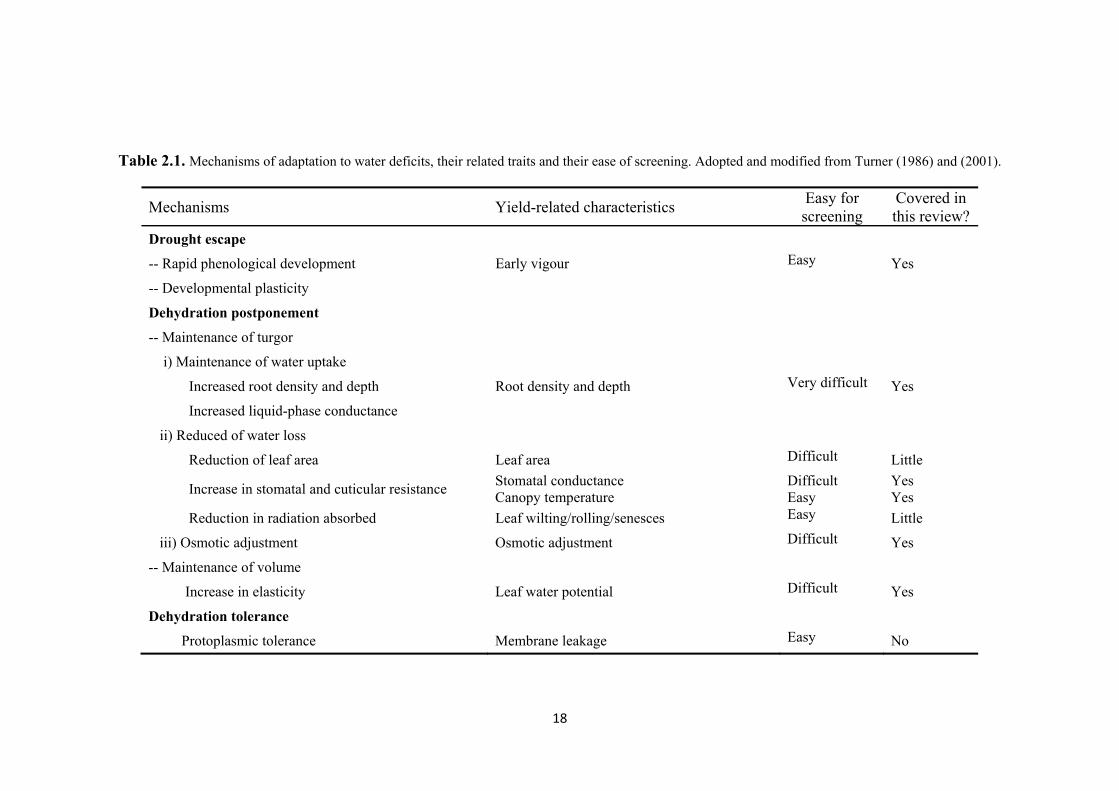
18
Table 2.1. Mechanisms of adaptation to water deficits, their related traits and their ease of screening. Adopted and modified from Turner (1986) and (2001).
Mechanisms Yield-related characteristics Easy for screening
Covered in this review?
Drought escape
-- Rapid phenological development Early vigour Easy Yes
-- Developmental plasticity
Dehydration postponement
-- Maintenance of turgor
i) Maintenance of water uptake
Increased root density and depth Root density and depth Very difficult Yes
Increased liquid-phase conductance
ii) Reduced of water loss
Reduction of leaf area Leaf area Difficult Little
Increase in stomatal and cuticular resistance Stomatal conductance Canopy temperature
Difficult Easy
Yes Yes
Reduction in radiation absorbed Leaf wilting/rolling/senesces Easy Little
iii) Osmotic adjustment Osmotic adjustment Difficult Yes
-- Maintenance of volume
Increase in elasticity Leaf water potential Difficult Yes
Dehydration tolerance
Protoplasmic tolerance Membrane leakage Easy No

19
2.3.2.1 Early vigour
Biomass accumulation at the seedling stage, which is referred to as seedling vigour or
early vigour, is a useful trait associated with final yield in various crops, such as rice
(Rebolledo et al. 2012; Rebolledo et al. 2013), soybean (Bouslama and Schapauph
1984), and wheat (Smith et al. 1993; Turner and Nicolas 1998; Botwright et al. 2002;
Maydup et al. 2012; Pang et al. 2014). The benefits of screening lines at the seedling
stage include low cost, easy handling, and potentially a quicker selection cycle (Rauf et
al. 2008).
Early vigour was associated with greater leaf area and ground cover (Regan et al. 1992),
deeper roots and greater water extraction in wheat (Turner and Nicolas 1998), and a
greater proportion of total evapotranspiration used in crop transpiration rather than soil
evaporation. Non-structural carbohydrates, particularly starch, were relevant markers
for early vigour in rice (Rebolledo et al. 2012). Shoot length (Zhang et al. 2005) and
root length (Rauf et al. 2008; Tang et al. 2010) have both been proposed as selection
criteria for assessing drought tolerance at the seedling stage. In the field, rapid growth
during the vegetative phase with good early vigour can reduce soil evaporation,
accelerate root access to soil water and nitrogen as well as reduce competition with
weeds (Zhao et al. 2006).
However, increased early vigour may also accelerate depletion of soil water reserves
prior to anthesis, making less water available for later stages of the crop, as in rice
(Zhang et al. 2005). Therefore, early vigour is more relevant to drought tolerance when
crops are grown on current-season rainfall and not where crops are grown on stored soil
moisture (Turner 1997). Further, early vigorous growth may make the plants more
susceptible to frost damage, so that knowledge of the target environment needs to be
taken into consideration.
2.3.2.2 Leaf water potential
Measurement of total water potential is crucial in understanding the leaf water status
during drought stress. The pressure chamber technique is one of the major methods for
measuring plant water potential in the field (Boyer 1967; Turner 1988b). This technique
requires that a leaf or branch be cut and placed in the pressure chamber in a plastic bag
to prevent transpiration with the cut end of the petiole or stem just protruding from the
20
chamber through a rubber gland used to seal the chamber. Errors may arise due to rapid
pressurization, but reliable measurements can be obtained when following precautions
such as slow pressurisation (Turner 1988b).
However, this technique requires considerable labour and time, and involves destructive
sampling of plant tissue, which reduces the usefulness of the technique for screening
large populations of plants.
2.3.2.3 Osmotic adjustment
Plants normally accumulate solutes in response to a water deficit, which is termed
osmotic adjustment or osmoregulation (Blum 1989; Turner 2004). Osmotic adjustment
under water deficit helps to maintain cell turgor, cell elongation, leaf growth, stomatal
opening and photosynthesis.
Plant accessions have shown different degrees of osmotic adjustment under similar
stress conditions (Turner and Jones 1980). Wheat genotypes were shown to differ in
osmotic adjustment under drought stress (Morgan 1983), and a cultivar with high
osmotic adjustment was 10% higher yielding in water-limited environments in Australia
(Richards 2006; Damon et al. 2011). Kumar et al. (1984) and Ma et al. (2004) both
found differences of osmotic adjustment or degree of solute accumulation in different
accessions of Brassica species. Niknam et al. (2003) tested Brassica genotypes at a low
rainfall site in Western Australia, and showed that genotypes with low or no osmotic
adjustment had up to 40% yield loss while those with high osmotic adjustment had only
a 10% yield loss under drought, which suggested that osmotic adjustment could be
utilised as a screening criteria for drought tolerance in Brassica species.
However, the degree of osmotic adjustment is limited, and is not always associated with
yield improvements under drought stress (Turner et al. 2001). The measurement of
osmotic adjustment is complex and generally requires destructive sampling, which
limits its application in screening of large populations.
2.3.2.4 Stomatal conductance
The rate of water loss by the plant in transpiration is primarily affected by three
environmental factors: radiation, water supply and temperature (Vadez et al. 2014). It is
also affected by plant factors such as leaf orientation, leaf rolling or wilting, and by the
21
alteration of the stomatal apertures. Stomatal conductance controls the rate of passage of
water vapour from the inside of the leaf to the atmosphere through the stomata as well
as the rate of passage of CO2 from the atmosphere to the leaf interior, and hence affects
the rate of photosynthesis. Therefore, stomatal conductance is an important factor that
can affect the plant’s water status (Munns et al. 2010).
There are several ways of measuring stomatal conductance: pore dimensions under the
microscope from leaf imprints, the flow of air through the leaf with an air-flow
porometer, the diffusion of water vapour from the leaf with a diffusion porometer or
leaf gas exchange equipment, and by leaf temperature (Turner 1991). The relationship
between stomatal conductance and grain yield in wheat was studied by Bahar et al.
(2009) who reported that stomatal conductance at the early-milk stage showed a positive
correlation with grain yield and grain number per spike in early-maturing genotypes of
durum wheat. However, the stomatal conductance of 24 wheat genotypes decreased
with growth stage, therefore it was difficult to compare stomatal conductance across
genotypes which varied in phenology (Bahar et al. 2009). Kumar et al. (1994) studied
both photosynthesis and transpiration in B. juncea and found there was a negative
relationship between photosynthesis and seed yield and that water stress adversely
affected photosynthesis and reduced seed yield through a reduction of pod and seed
numbers.
The measurement of stomatal conductance involves contact with leaves and temporarily
interferes with leaf function. It is also time consuming, and variation exists from leaf to
leaf within a single plant, particularly if the leaves are exposed to different light
conditions as a result of leaf angle or angle to the sun (Costa et al. 2013). While
stomatal conductance has been widely used in water status studies, it is difficult to apply
in large screening programs, particularly in climatic regions in which cloudiness
interferes with the readings (Woods and Turner 1971).
2.3.2.5 Canopy temperature
Evaporation of water is an energy-demanding process, with the latent heat of
evaporation cooling the leaf temperature (Maes and Steppe 2012). The energy balance
of a leaf canopy, which determines its temperature, depends on the net radiation, air
temperature, vapour pressure deficit of the air, and the aerodynamic and canopy
resistances to vapour transport (Jones et al. 2009b).
22
Under water-stressed conditions, stomata close, transpiration and assimilation are
reduced, and the leaf temperature increases (Pinto et al. 2008). Therefore, leaf canopy
temperature has a close relationship with stomatal conductance (Jones 1999b; Jones
1999a; Costa et al. 2013). Based on this principle, and because it has a near-zero effect
on plant growth and grain yield, infrared thermal sensing has become a popular method
for estimating evapotranspiration and water requirement to avoid drought stress in
irrigated agricultural systems (González-Dugo et al. 2006; Jones and Vaughan 2010;
Maes and Steppe 2012).
Leaf surface temperature can be measured by contact methods such as thermocouples
attached or pressed on to the leaf, or by non-contact methods with non-imaging and
imaging devices. Non-imaging devices or infrared thermometers make use of non-
contact detector as either portable hand-held “temperature guns”, or continuously
monitoring stand-alone sensors connected to a data logger. The infrared “gun” is easy to
carry, has a quick response time, and is cost-effective for general use. Imaging devices
use microbolometer sensors which are more delicate but can provide more data than
infrared sensors (Maes and Steppe 2012).
Leaf or canopy temperatures are a surrogate for stomatal conductance, and if the
temperatures are associated with crop yield or yield-related characteristics, then a large
number of accessions can be assessed in breeding programs. Since the report of Jackson
et al. (1977) in wheat, canopy temperature has been widely applied in agricultural field
crops, such as sorghum (Chaudhuri and Kanemasu 1982), maize (Keener and Kircher
1983), Brassicas (Singh and Kanemasu 1982), cotton (González-Dugo et al. 2006), rice
(Turner et al. 1986), potato (Stark et al. 1991), but mainly on wheat species (Blum et al.
1989; Balota et al. 2008; Giukel et al. 2008; Reynolds et al. 2009; Karimizadeh and
Mohammadi 2011). A strong negative relationship was found between grain yield and
midday canopy temperature in rice (Garrity and O'Toole 1995), and high-yielding rice
cultivars have been selected based on lower leaf temperature (Tleaf ) (Jones et al. 2009b);
similar negative correlations were found in wheat (Blum (1996) and reported to be
repeatable across diverse environments (drought, heat and well-irrigated) and years
(Saint Pierre et al. 2010). Similar relationships were found when the leaf-to-air
temperature difference was measured. The relationship was negative when the leaf-to
air temperature difference (Tleaf-Tair) was used (Turner et al. 1986), but positive when

23
the air-to-leaf temperature difference (Tair-Tleaf) was used (Royo et al. 2002; Fan et al.
2005; Balota et al. 2007; Karimizadeh and Mohammadi 2011).
Most recently, advanced-resolution thermal imaging has provided fascinating
advantages for agricultural systems. Firstly, large-scale aerial thermal imaging can be
used to detect the crop water status for irrigation management once a stress threshold for
crop temperature has been established (Costa et al. 2012; Fuentes et al. 2012); secondly,
apart from abiotic stress detection, thermal imaging can be used to screen for biotic
stresses, such as pests and diseases, that change the radiation emitted or reflected from
leaves (Stoll et al. 2008; Chaerle et al. 2009; Costa et al. 2013); and thirdly advanced
thermal imaging can help to characterise morphological and plant architecture traits that
are important for plant phenotyping for different environmental conditions (Furbank
and Tester 2011; Dhondt et al. 2013).
Leaf temperature has also been used in molecular studies that have associated leaf
temperature with useful alleles and genes. Composite interval mapping revealed that
cooler leaf temperatures and higher grain yield were associated with the Babax allele on
wheat linkage groups 1B, 3B and 4A under both drought and heat stress conditions,
indicating some common genetic basis for tolerance to both stresses (Pinto et al. 2008).
The molecular function of such genes will help our understanding of the relationship
between canopy/leaf temperature and drought tolerance (Munns et al. 2010; Furbank
and Tester 2011).
However, leaf temperature readings can be affected by biological and environmental
factors such as, leaf shape and size, leaf water status, radiation, vapour pressure deficit,
wind speed, air temperature, cloudiness, and relative humidity (Smith et al. 1986; Jones
and Vaughan 2010), while canopy temperature can be affected by the soil temperature
and soil water status if there is not full canopy cover of the soil. Maes et al. (2012)
reviewed the factors that affect canopy temperature, namely vapour pressure deficit,
wind speed, air temperature and shortwave radiation as well as leaf traits (leaf angle,
leaf size and leaf shape) and concluded that leaf characteristics have a much smaller
impact on leaf temperature differences than weather and environmental conditions. For
measurements of leaf temperature by infrared thermometry, the emissivity needs to be
taken into account. Emissivity is the amount of heat radiation from the measured object
(compared with an ideal black object). It relates to the principle of temperature sensing

24
in the thermal infrared which is based on the fact that all objects emit an amount of
radiation to the 4th power of the temperature (T: degrees Kelvin) according to the
Stefan-Boltzmann law (Maes and Steppe 2012).
Considerable interest has been devoted to understanding the relationship between
canopy temperature and crop yield and applying the technology into high-throughput
phenotyping (Munns et al. 2010; Furbank and Tester 2011; Dhondt et al. 2013; Araus
and Cairns 2014). This opens up opportunities for plant scientists and crop breeders to
use the techniques for drought tolerance improvement. Until recently, most research has
focused on the measurement of leaf temperature, but as drought stress in many
environments is most severe during reproductive development, thermal screening of the
reproductive organs may be more relevant (Guo et al. 2013).
2.3.2.6 Key metabolites
Drought stress can cause metabolic changes such as increases in abscisic acid (ABA),
proline, and some sugars, major metabolites that act as stress signals (Sharma and
Verslues 2010).
Many studies have shown that endogenous ABA increases several-fold when plants are
subjected to soil drying (Sharma and Verslues 2010). The ABA is synthesised in the
roots (Turner and Hartung 2012), transported to the leaves in the xylem where it closes
stomata and reduces transpiration (Gollan et al. 1986; Davies and Zhang 1991; Schurr
et al. 1992; Davies et al. 1994). Ma et al. (2004) identified higher proline accumulation
in B. juncea genotypes with higher osmotic adjustment, while Richards (1978)
demonstrated that proline accumulated in B. napus leaf tissue at wilting point, leading to
a possible threshold for proline manipulation. More recently, Hatzig et al. (2014) also
found clear ABA and proline responses under polyethylene glycol (PEG) triggered
drought stress in B. napus, but did not find significant differences in hormonal changes
between drought-resistant and drought-sensitive genotypes. The other relevant
metabolites involved in plant water stress responses and their possible mechanism for
gene regulation are briefly covered in the last section of this review (Section 2.4).
2.3.2.7 Other factors
A number of indirect methods have been used to characterize the leaf water status and
have also been used in breeding programs. Leaf thickness or stem diameter is of use for

25
continuous monitoring of plant water status and as non-destructive techniques where
plant material is scarce. Stem diameter (McBurney and Costigan 1984) and leaf
thickness (McBurney 1992) showed positive relationships with plant water potential in
B. oleracea. Furthermore, leaf wilting, rolling and leaf permeability have also been
utilized for assessing drought tolerance (Turner 1997).
2.3.3 Breeding drought tolerance in Brassica crops
2.3.3.1 Stress stage and severity level
When targeting the breeding for drought tolerance in Brassica species, the stage of
growth may have a major impact on methodology and outcomes.
For Brassica species, water supply is critical during flowering and early pod
development when the number of pods and seeds is being determined (Richards and
Thurling 1978a). Ma et al. (2006) found that a water deficit has more impact on B.
juncea at anthesis and during seed-filling than at the juvenile or elongation stage, as the
seed yield is reduced by lower pod number, fewer seeds per pod and smaller harvest
index.
Furthermore, the effectiveness of a selection method depends on the stress severity level.
Blum et al. (1996) and Pantuwan et al. (2002) stated that yield was only markedly
reduced in moderate and severe stresses. Karimizadeh et al. (2011) proposed that
breeders should take into account the stress severity of the target environment when
choosing a screening method. Therefore, it is also important to clarify the conditions of
the target environment into account before conducting a drought-tolerance breeding
program for Brassica species.
2.3.3.2 Self-incompatibility in Brassica species
Brassica species especially B. rapa and B. oleracea accessions are renowned for self-
incompatibility (SI) (Prakash et al. 2012), which is a natural mechanism used by many
flowering plants to prevent self-fertilization (Takayama et al. 2000; Takayama and
Isogai 2005). It is comprised of a self- and non-self-recognition process between pollen
and pistil and the selective inhibition of development of the self-pollen tube. Molecular
studies have revealed that the self-incompatible system in the Brassicaceae family is
controlled by a single multi-allelic locus, termed the S-locus, which contains at least
26
two genes, one encoding the male determinant carried by the pollen grain (S-locus
cysteine-rich protein, SCR) and the other encoding the female determinant that is
expressed in the pistil (S-locus receptor kinase protein, SRK) (Kitashiba et al. 2011).
They are organised into self-recognition haplotypes, and maintained intact due to rare or
no recombination (Mable et al. 2005). Disruption of this haplotype structure leads to a
failure of the recognition system and the loss of self-incompatibility.
Several abiotic factors have been reported to overcome or break down the SI in Brassica
species. Sodium chloride (NaCl) has been confirmed to be effective in B. napus by
spraying 2-10% NaCl during the flowering period (Fu et al. 1992) although it is not
guaranteed to be successful in the field. Also, the treatment of the stigma before
flowering with lectins and sugars in Petunia and Eruca (a member of tribe Brassiceae)
also broke down the SI (Sharma et al. 1985). The partial break down of SI is considered
a possible evolutionary transition of species (Weller and Sakai 1999), generating
intermediate levels or variation of SI within species (Cheptou et al. 2000).
Within B. rapa, only “yellow sarson” is known for its complete lack of SI in the stigma
(Fukai et al. 2001), which is controlled by a modifying gene (m) that is inherited
independently of the S alleles (Prakash et al. 2012). Therefore, screening for drought
tolerance in the reproductive stage in B. rapa could be affected by SI in experiments
where cross-pollination is prevented, especially if seed set and seed yield are important
measures of tolerance. Either an alternative surrogate trait for yield or methods to
overcome self-incompatibility will be required for drought tolerance screening in B.
rapa in the reproductive stage.
2.4 Molecular technology approaches for improving drought tolerance
The fundamental basis of plant breeding is the selection of specific plants with desirable
traits (e.g. yield, agronomic, stress tolerance or disease resistance traits). Therefore, the
goal of breeding is to assemble more desirable combinations of genes in new varieties.
The traditional way of achieving this is through phenotypic selection in segregating
populations in field or glasshouse trials, which is often costly and imprecise, especially
for traits with low heritability (Collard and Mackill 2008). Molecular marker
technology offers the promise of genotypic selection – that is, selection of the genes
underlying traits, also known as marker-assisted selection. With rapid developments in

27
genomic technologies, the cost of marker genotyping continues to decrease. However, it
is only with accurate phenotyping that molecular genetic control is revealed through
linkage and association quantitative trait locus (QTL) analyses. Phenotyping and
genotyping are inevitably linked, and this thesis sets out to demonstrate that, for a
complex trait such as drought tolerance, accurate phenotyping is essential for improved
outcomes from genotypic selection.
2.4.1 Marker-assisted selection
Traditional breeding projects generally use pedigree breeding methods, and selection of
desirable parents begins in early generations for traits of higher heritability. For traits
with low heritability, selection is often postponed until lines become homozygous in
later generations (e.g. F5 or F6). Besides, the larger the number of genes segregating in
a population, the larger the population size required in order to identify specific gene
combinations. Therefore, breeding population size can range from hundreds to
thousands of individual plants, involving numerous selections in the field (Collard et al.
2005).
Marker assisted selection (MAS) involves using marker-trait associations to assess
genotypic values and therefore infer the phenotypic performance of plants. This is, in
theory, more efficient, effective, reliable and cost-effective compared to traditional
phenotypic selection methodology (Collard et al. 2005). This approach is highly
successful for simply-inherited traits such as major disease resistance genes where
closely-linked markers are highly predictive of the phenotypic value, but more
problematic in polygenic traits with low heritabilities and/or substantial G x E
interactions (Collard and Mackill 2008).
There is a wide range of DNA markers available to breeders that can be divided into
three categories based on the method of detection (1) hybridization-based, (2) PCR-
based and (3) DNA sequence-based (Collard et al. 2005). DNA markers that are tightly
linked to agronomically important genes can be used as molecular tools for MAS in
plant breeding (Ribaut and Ragot 2007).
2.4.2 Application of MAS in plant breeding
28
The application of MAS may have profound impact on various aspects of plant breeding,
assisting in the selection of early generation progeny, identification of cultivars for
intellectual property purposes, as well as evaluation of genetic diversity among cultivars
(Collard and Mackill 2008).
MAS has the advantage in early generations to eliminate the undesirable gene
combinations before substantial investments are made in population development and
phenotyping. A strategy proposed by Ribaut and Hoisington (1998) involved
performing MAS on F2 and F3 populations derived from elite parents using flanking
markers for up to three QTLs, which reduced the population size immediately and
identified which progeny were already fixed at the target QTLs, thus greatly shortening
the breeding period.
DNA markers have been applied widely for evaluating genetic diversity of core
breeding material and assistance in selecting parents (Xu et al. 2004; Zhao et al. 2010).
It can also be used to confirm the true identity of individual plants prior to crossing.
Besides, QTL analysis has been used to identify a range of drought resistance
characteristics in wheat (Quarrie et al. 2006) and maize (Lebreton et al. 1995). A major
locus of identified QTL was associated with osmotic adjustment and drought tolerance
in rice (Lilley et al. 1996) and more QTLs were found at the seedling stage (Kato et al.
2008) and expressed in pollen grains in wheat (Morgan 1999). Moreover, QTL has also
been applied to reveal relationships between water-use and photosynthesis in B.
oleracea (Hall et al. 2005).
However, precise and accurate QTL identification is impacted by significant G × E
interaction, large number of genes encoding the trait, errors in phenotyping and the
errors in construction of mapping populations. These have all harmed programs
involved in mapping of QTL for high growth and yield under water-limited conditions.
2.4.3 New era of marker-assisted selection with advanced technology
New genomic technologies promise a new era of marker-assisted selection.
Conventional MAS relies on close linkage of markers to the target traits, which limits
the predictive power of such markers. Rapid developments in genome sequencing
technologies and accumulating knowledge of biosynthetic pathways in model organisms

29
are greatly facilitating the identification of the causal genes underlying traits – the so-
called “candidate gene” approach. Markers based on the nucleotide changes responsible
for trait variation potentially have 100% predictive accuracy. Such gene-discovery is
becoming routine for simple traits but remains challenging for more complex traits such
as drought tolerance. Yet breeders would gain more from markers for complex traits
given that complex traits are intrinsically more difficult to phenotype than simple traits.
One approach that has proven to be effective in identifying candidate genes for complex
traits is transcriptomics. From early hybridization-based microarray technologies to
next-generation sequencing, transcriptomic analysis continues to gain in popularity in
plant research.
2.4.3.1 Early technologies of transcript and genotype analysis
Various technologies have been developed to quantify the transcriptome, including
hybridization or sequence-based approaches (Wang, 2009). Both require the isolation of
high-quality mRNA from plant material grown in controlled experimental conditions,
followed by the synthesis of complementary DNA (cDNA) using reverse transcriptase
(Hoheisel 2006).
Hybridization-based microarrays typically involve incubating fluorescently labelled-
cDNA with custom-made microarrays (Hoheisel 2006). Researchers have used this
technology to characterise abiotic stress-related genes in B. rapa and tested the
responses of these genes under different abiotic stress conditions (Lee et al. 2012).
Microarrays were also applied in a comparison of drought-tolerant and drought-
sensitive genotypes in barley (Guo et al. 2009). In that study, differentially expressed
genes (DEGs) relative to controls were identified, revealing that more DEGs were
expressed in tolerant lines than in sensitive lines, which led the authors to conclude that
the possible mechanisms in tolerant lines involved the enhancement of functional and
structural protection of proteins and membranes, and the adjustment of stomata.
However, array-based technology relies heavily on the existing knowledge about
genome sequence (i.e. there is a strong ascertainment bias) and often difficulties arise
from background noise, saturation of signals and complicated normalization methods
(Ozsolak and Milos 2011).
30
Sequence-based approaches were long dominated by automated Sanger sequencing
before the revolutionary introduction of next-generation sequencing (Hoheisel 2006).
Compare to next-generation sequencing, Sanger sequencing is relatively low throughput,
expensive and generally not quantitative. Moreover, only a small portion of the
transcript is analysed and isoforms (i.e. alternatively spliced transcripts) are generally
indistinguishable from each other, which has limited the use of this technology into
wide genome-wide studies (Ozsolak and Milos 2011).
2.4.3.2 Next generation sequencing revolutionised transcriptomics
Next generation sequencing is a group of new sequencing technologies based on
randomly amplifying DNA and subjecting to shotgun sequencing. When applied to
cDNA (derived from RNA by reverse transcriptase), this is termed RNA-seq and can be
used to simultaneously measure gene expression level and transcript composition. It
produces tens of millions of short sequence reads as digital signals (counts) from the
transcript population of interest and maps those signals either to a pre-existing reference
genome or to custom-made de novo transcriptome assembly. RNA-seq thus allows
unprecedented digital precision as well as removing the requirement of extensive prior
genomic knowledge, which for a long time has only been available for a small number
of model organisms (Wang et al. 2009; Pickrell et al. 2010).
RNA-seq has opened a new era for genomic and transcriptome research in non-model
crop species. For example, genomic functions of different tissues can be elucidated by
this technology. Lu et al. (2013) studied embryo and endosperms in early developing
maize seed. They identified DEGs enriched in endosperm tissues involved in nutrient
reservoir, storage protein accumulation and carbohydrate metabolic processes, while
DEGs enriched in embryos were involved in genetic information transfer, such as
chromatin regulation, nucleosome organisation and DNA packing. These identified
biological functions through RNA-seq were in agreement with previous knowledge of
these two tissues that endosperm provide the stored nutrients to feed the embryo while
embryo developed through a series of cell divisions to pass genetic information to its
offspring. Tong et al. (2013) examined six different tissues of B. rapa (accession Chiifu)
and identified over 30,000 annotated genes as well as alternative splicing variants,
which will serve as a valuable repository for future functional genomic studies.
31
Meanwhile, RNA-seq analyses enhanced our understanding of genomic changes
associated with genome evolution of Brassica species. Higgins et al. (2012) applied
new RNA-seq technology to discriminate the different transcriptomes contributed from
constituent genomics of B. napus. By comparing Brassica A and C genomes between
natural B. napus and synthetic B. napus, they were able to identify 43,761 unigenes
containing at least one inter-homoeologue polymorphisms and about 6,350 of which
were differentially expressed homoeologous gene pairs, with about 4,000 genes in
common or expressing similar patterns during comparison. Zhao et al. (2013)
investigated the transcriptomic changes in synthetic trigenomic allohexaploids of
Brassica using RNA-seq approach. They compared the artificially synthesised
hexaploid and its two parents (B. rapa and B. carinata) and identified more DEGs on
the paternal side (B. rapa and hexaploid) than the maternal side (B. carinata and
hexaploid), which supported the paternal-biased theory (Xu et al. 2009; 2012). Besides,
they detected large amount of transcriptase factors related to methylation (30%
methylation related genes had DEGs between hexaploid and their parents), implying
methylation is an important factor during synthetic polyploidy. Cytosine methylation
has been further studied in B. oleracea, revealing 54.9% of CGs sites have been
methylated and mirrored with the distribution of repetitive elements, which suggested
functional diversification of duplicated genes in B. oleracea and provided more
information for crop improvement strategies throughout the Brassica genus (Parkin et al.
2014).
Moreover, RNA-seq has enabled wider and more precise transcriptome studies related
to abiotic stresses in plants. Dugas et al. (2011) investigated the functional annotation of
the transcriptome of sorghum in response to osmotic stress and exogenous ABA. They
revealed 28,335 unique genes from shoot and root as well as possible metabolic
pathways linking with plant defence, and provided an initial data set for preliminary
look into cascade of gene expression patterns. Kakumanu et al. (2012) applied RNA-seq
in maize under drought stress in both reproductive and leaf stem tissue. The results
demonstrated much higher expressed genes and the expression level in the ovary
compared with the leaf meristem. Gene ontology enrichment analysis revealed massive
decrease in transcript abundance related to cell division and cell cycle and directed
further study on the reproductive tissues for drought-responsive studies.

32
However, there are still several challenges for the application of RNA-seq: firstly, there
are potential biases during the process of library construction, as several manipulation
steps such as RNA fragmentation are involved; secondly, different strategies may apply
to data analysis, especially when dealing with exon junctions during the process of
mapping into the reference genome; thirdly, the sequencing depth (also known as
coverage) is an important factor to reveal transcripts especially those expressed at low
level, but sometimes sequencing depth must be compromised due to a limited budget;
and lastly de novo assembly needs to be applied when dealing with non-model plant
species and pay more attention during sequencing analysis (Martin and Wang 2011;
Strickler et al. 2012). It is crucial to decide whether to increase sequence depth for more
accurate measurements on genes that expressed at low level or increase the sample size
with limited sequencing depth (Ozsolak and Milos 2011). Therefore, proper
experimental design with sufficient biological and technical replicates should be fully
considered before sampling, whilst reasonable sequencing depth using pair-end
sequencing should be applied into RNA-seq along with validation by quantitative RT-
PCR (Fang and Cui 2011; Xiao et al. 2012). With the development of the technologies
and continuously reducing cost, RNA-seq will be applied more widely into crop
breeding projects for improvement of abiotic stress tolerance.
2.4.3.3 Quantitative reverse transcriptase PCR
Transcriptomics is highly effective in generating large sets of candidate genes for target
traits. Despite the declining costs of RNA-seq, in most situations it remains too
expensive for measuring multiple biological replicates in multiple tissues and/or over
multiple time points. Therefore, the involvement of candidate genes must be validated
using more cost-effective, targeted assays. The mainstream of targeted gene expression
analysis is using quantitative reverse transcriptase PCR (qRT-PCR), which is widely
utilized for characterising or confirming gene expression patterns and by comparing
mRNA levels in different sample populations (Bustin 2002). There are other approaches
available such as digital PCR are also available for absolute quantification of DNA copy
number but hasn’t widely applied yet due to the lack of practical technologies (Hindson
et al. 2011).
Reverse transcriptase PCR is a modified form of conventional PCR. Instead of using
genomic DNA as the template for the DNA polymerase enzyme, cDNA is generated
33
from mRNA using reverse transcriptase enzyme which is then used as the template for
the DNA polymerase (Ginzinger 2002).
For gene expression studies, RT-PCR is performed on a quantitative PCR platform by
calculating the fluorescent signal in comparison with background fluorescence at
threshold cycle (Ct), which can be utilized for quantification of RNA in both relative
and absolute terms, by incorporating quantitative assay into the technique and described
as qRT-PCR or real time PCR (Bustin 2002; Ginzinger 2002). Many validations using
qRT-PCR after sequencing have shown consistent results with RNA-seq. Jubault et al.
(2013) applied 12 specific genes and tested their expression after RNA-sequencing with
samples from different time points after inoculating and Xiao et al. (2012) tested 13
candidate reference genes specifically in B. rapa. Almost all the results from qRT-PCR
showed consistent results as from RNA-seq in terms of up- or down-regulated, although
variations among expression levels were also observed.
2.4.4 Gene networks and metabolites involved in drought stress response and
tolerance
Plants respond to stress conditions with a series of changes in physiological, cellular
and molecular processes culminating in stress tolerance. With the emerging RNA-seq
technologies, gene networks and related molecular process as well as enriched
metabolites changes can be better elucidated.
Previous studies have analysed changes in gene expression caused by abiotic stresses
such as drought, high and cold temperatures, and identified various genetic networks
involved in those responses (Atkinson and Urwin 2012). The products of these genes
can be classified into two major groups: the first group involves genes that directly
function in protecting against abiotic stresses, including proteins that protect cells from
dehydration, such as enzymes required for biosynthesis of various osmoprotectants,
late-embryogenesis-abundant proteins and detoxification enzymes. The second group is
comprised of genes that regulate the expression of other genes and perform signal
transduction in stress response, which includes transcription factors, protein kinases and
enzymes involved in phosphoinositide metabolism (Figure 2.2) (Kasuga et al. 1999;
Shinozaki and Yamaguchi-Shinozaki 2007).
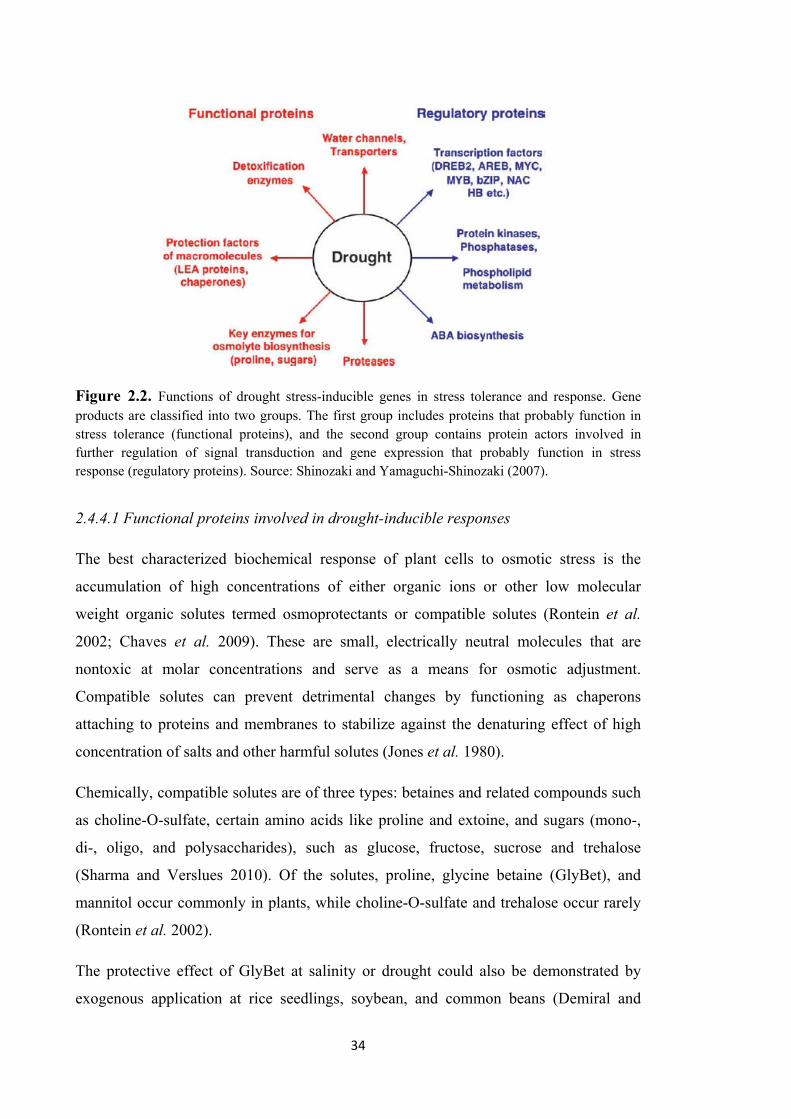
34
Figure 2.2. Functions of drought stress-inducible genes in stress tolerance and response. Gene products are classified into two groups. The first group includes proteins that probably function in stress tolerance (functional proteins), and the second group contains protein actors involved in further regulation of signal transduction and gene expression that probably function in stress response (regulatory proteins). Source: Shinozaki and Yamaguchi-Shinozaki (2007).
2.4.4.1 Functional proteins involved in drought-inducible responses
The best characterized biochemical response of plant cells to osmotic stress is the
accumulation of high concentrations of either organic ions or other low molecular
weight organic solutes termed osmoprotectants or compatible solutes (Rontein et al.
2002; Chaves et al. 2009). These are small, electrically neutral molecules that are
nontoxic at molar concentrations and serve as a means for osmotic adjustment.
Compatible solutes can prevent detrimental changes by functioning as chaperons
attaching to proteins and membranes to stabilize against the denaturing effect of high
concentration of salts and other harmful solutes (Jones et al. 1980).
Chemically, compatible solutes are of three types: betaines and related compounds such
as choline-O-sulfate, certain amino acids like proline and extoine, and sugars (mono-,
di-, oligo, and polysaccharides), such as glucose, fructose, sucrose and trehalose
(Sharma and Verslues 2010). Of the solutes, proline, glycine betaine (GlyBet), and
mannitol occur commonly in plants, while choline-O-sulfate and trehalose occur rarely
(Rontein et al. 2002).
The protective effect of GlyBet at salinity or drought could also be demonstrated by
exogenous application at rice seedlings, soybean, and common beans (Demiral and

35
Türkan 2006). Arabidopsis plants that had been genetically-modified to accumulated
high levels of GlyBet were able to tolerate different environmental stress conditions and
hence improved seed yield (Waditee et al. 2005).
Besides, various amino acids, such as alanine, arginine, glycine, serine, leucine, proline,
are accumulated in response to drought stress (Ashraf and Foolad 2007). Genetic
variation has been identified in terms of the accumulation of proline in response to
osmotic stress, and higher concentrations of proline were identified in more tolerant
genotypes of oilseed Brassica (Ma et al. 2004). Hazen et al. (2005) identified nine
osmotic adjustment related genes that were expressed only in high osmotic adjustment
genotypes while not expressed at all in low osmotic adjustment lines.
2.4.4.2 Regulatory proteins involved in drought-inducible responses
Various signalling pathways in multiple stress responses were reviewed by Atkinson
and Urwin (2012), including transcription factors, mitogen-activated protein kinase
(MAPK) cascades, and reactive oxygen species (ROS), etc.
Transcription factors (TFs) play critical roles in regulating gene expression in response
to drought stress. The proteins are divided into two major subfamilies, the drought-
responsive element binding factor (DREB) subfamily (A group) and ethylene-
responsive factor (ERF) subfamily (B group). Each subfamily is further classified into
six subgroups, A1-A6, and B1-B6, based on conserved domains (Sakuma et al. 2002).
DREB subfamily such as DREB1A and DREB2A were found to be involved in
drought-responsive gene expression (Pellegrineschi et al. 2004; Sakuma et al. 2006).
Similar studies were also reported in ERF subfamily genes. Seo et al. (2010)
investigated ERF4 subfamily and demonstrated that the B. rapa gene BrERF4
overexpressed in Arabidopsis increased tolerance to salt and drought stress. Another
study of AP2/ERF family genes in B. rapa by Zhuang et al. (2010) showed diverse
expression patterns in different tissues of B. rapa, indicating the genes in AP2/ERF
family encode transcriptional regulators that serve a variety of functions in the plants.
Other common recognised TFs involved calcium-related kinases such as calcium-
dependent protein kinases (CDPKs) and calcium B-like proteins (CBL) with their
corresponding kinases (CIPKs). The CBL and CIPKs together form a complex and

36
dynamic Ca2+ decoding signalling network and identified in canola and specific for
osmotic stress (Zhang et al. 2014).
More TFs have also been reported related to drought or dehydration responses such as
MYB, MYC and NAC. A large MYB family of TFs has frequently been associated with
the control of both biotic and abiotic stress responses, in particular the regulation of
phenylpropanoid biosynthesis pathways (Dubos et al. 2010). MYC may act as a central
regulation by which ABA controls biotic stress signalling pathways. The overexpression
of NAC is found to enhance drought and salt tolerance in rice and cotton (Zheng et al.
2009; Liu et al. 2014).
Signalling through MAPK cascades is crucial in eukaryotes for transducing the
perception of environmental stimuli into internal signalling pathways (Rodriguez et al.
2010). Plants have a large number of MAPK components, allowing for the control over
a wide range of stress response pathways.
Reactive oxygen species (ROS) are known as one of the major components in stress
signalling (Baxter et al. 2013): Low levels of ROS accumulate constantly as by-
products of metabolism, but their concentration increases during abiotic stress
conditions. To minimize damage caused by these potentially harmful molecules, plants
produce antioxidants and ROS-scavenging enzymes (Atkinson and Urwin 2012).
Respiratory burst oxidase homologues (RBOHs) are known to play a key role in the
network of ROS production and are involved a multiple signalling pathways such as
stomatal closure, pollen-stigma interactions, and programmed cell death (Suzuki et al.
2011).
Last but not least, phytohormones are also actively involved as signalling molecules,
such as abscisic acid (ABA), ethylene, brassinosteroids (BRs2), jasmonates (JA) and
salicylic acid (SA) (Yoshida et al. 2006). ABA is widely known as its important role in
regulating long-term developmental processes as well as short-term physiological
effects (Sharma and Verslues 2010) (mentioned in section 2.3.2.6 in this review).
Ethylene also plays significant roles in developmental processes (Guo and Ecker 2004).
Unlike ABA and ethylene and their active role in abiotic stress response, JA and SA are
involved more in plant biotic defence (Robert-Seilaniantz et al. 2007).
37
As briefly covered above, there are a great many biochemical pathways that have been
shown to respond to water stress, and these responses change over time and in different
plant tissues, and so the identification of relevant mechanisms is a challenge for
molecular biologists investigating stress responses. Exploration of gene expression and
their functions by RNA-seq has provided a means to investigate various gene pathways
and their potential involvement in stress response, which at the same time has provided
us with better understanding of the underlying mechanisms. As more experimental
evidence accumulates on the genes involved in drought tolerance, breeders will
increasingly use gene-based markers to facilitate the selection of varieties that will be
more productive in a drying climate.
2.4.5 Making the most of drought transcriptomics
The new era of microarray and sequencing technologies has certainly empowered
scientists and breeders to improve crop adaptations with more specific targets,
limitations and attentions should be paid to make the most use of plant transcriptomics
under drought stress (Deyholos 2010).
Various post-transcriptional regulatory influences final gene product, implying
transcript abundance is not necessarily correlated with ultimate activity of gene
expression. Besides, there are also methodological limitations which relate to
experimental design (covered in section 2.4.3.2). Therefore, validation in phenotyping
and physiological experiment plays a vital role in applying molecular results into
breeding.


38
Chapter 3
3 Centre of origin and centres of
diversity in an ancient crop, Brassica
rapa (turnip rape)
Abstract
Brassica rapa is the most widely distributed and has the longest history of
domestication of the agricultural Brassica species. Molecular genetic diversity, based
on 51 simple sequence repeat primer pairs and 715 alleles at polymorphic loci, was used
to predict the centre of origin and centres of diversity in a global collection of 173 B.
rapa accessions. The accessions were separated into three molecular genetic groups
based on STRUCTURE analysis - group 1 from the classical Old World (Europe and
west Asia-north Africa), group 2 from east Asia, and group 3 from east, central, south
and south-east Asia. Accessions classified as “wild” (B. rapa ssp. sylvestris) were found
only in the Old World group 1 and this group had the highest number and richness of
private alleles. Each group included a diverse range of agricultural morphotypes
(oilseed, root or leafy vegetable types); flowering habit (winter, semi-winter or spring
type), self-compatibility or incompatibility, and seed colour. The Old World, east, south
and central Asia were distinct sub-populations based on analysis of shared unique
alleles. This study supports the theory that the classical Old World is the centre of origin
of B. rapa, with centres of diversity in east Asia and along ancient trade routes in Asia,
with recent migration to the New World.
Key words: Brassica campestris, microsatellite markers, molecular genetic diversity,
phenotypic diversity, simple sequence repeat
39
3.1 Introduction
Brassica rapa L. is a diverse and important agricultural species with several
morphotypes including oilseed (ssp. oleifera, turnip rape; ssp. dichotoma, brown sarson
or toria; ssp. trilocularis, yellow sarson), leafy vegetables (B. ruvo, broccoletto; ssp.
pekinensis, Chinese cabbage; ssp. chinensis, pak choi and narinosa; ssp. nipposinica,
mizuna), root vegetables (turnip) and fodder crops (ssp. rapifera, fodder turnip)
(Warwick et al. 2008; Prakash et al. 2012).
B. rapa was one of the first Brassica species to be domesticated (Gómez-Campo and
Prakash 1999). Turnip tubers were used as food or fodder in Roman times and it is often
difficult to distinguish the seeds of wild and turnip type B. rapa (Reiner et al. 1995). A
wide range of morphotypes have been recorded, including root, leafy vegetable and
oilseed types, throughout the geographical range of B. rapa (Gómez-Campo and
Prakash 1999; Prakash et al. 2009), which makes it difficult to decipher the centres of
origin and diversity in B. rapa based on morphology alone.
Breeding and selection of B. rapa in both east Asia and Europe has led to
phenotypically diverse varieties. Some leafy type vegetables such as Chinese cabbage
(ssp. pekinensis) may have originated in central China by natural hybridization between
pak choi (ssp. chinensis) and turnip rape (ssp. oleifera), followed by selection for
heading types and adaptation to variable environments (Li 1981). On the other hand,
oilseed forms of B. rapa are believed to have been selected independently in Europe and
east Asia from the root or vegetable types. In Europe, oilseed forms were selected from
the turnip type B. rapa from about the 14th century onwards, when more oil production
was required in some cold areas(Reiner et al. 1995). Oilseed types have been grown in
south Asia since ancient times (Prakash et al. 2012). In east Asia, the oilseed type is
believed to have been selected from leafy types after its introduction through western
Asia or Mongolia in the 1st century AD (Gómez-Campo and Prakash 1999). Most
regions in China can grow “Baicai” (vegetable) types of B. rapa, but seed production is
possible only in cooler regions. Therefore, some accessions from north-western China
are regarded as both vegetable and oilseed crops, such as “Lintao Caizi”, which may
represent a stage in the evolution of oilseed B. rapa in China (Sun et al. 2004). Only
molecular genetic research can reveal the underlying genetic relationships among these

40
various morphological types of B. rapa which evolved in agriculture in the east and
west.
The centre of origin of a crop plant is normally associated with the geographical origin
of wild and weedy relatives, but there may be several centres of diversity that developed
during or after domestication in the same region or elsewhere (Harlan 1971). The centre
of origin of B. rapa is ambiguous based on previous studies. In one taxonomic study,
based on restriction fragment length polymorphisms (RFLP) markers, it was suggested
that Europe was the centre of origin of B. rapa, and wild types spread across Asia to
south China as weeds in agricultural times, and leafy vegetable types were developed in
east Asia from the wild forms of turnip rape (Song et al. 1990). In contrast, McGrath
and Quiros (1992a) proposed that migration of germplasm occurred eastwards in
Neolithic times following agricultural domestication in Europe, based on the lack of
wild types in east Asia. Studies based on amplified fragment length polymorphism
(AFLP) markers highlighted the occurrence of several groups of B. rapa in Europe,
India (south Asia) and east Asia (Zhao et al. 2005; Warwick et al. 2008). Three
molecular genetic groups of oilseed types of B. rapa based on simple sequence repeat
(SSR) markers were found in south Asia, southern-eastern Europe and northern Europe,
with two subgroups in south Asia (Annisa et al. 2013a). A common conclusion from
these studies was that a wide range of morphological types, such as root and oilseed
types, occurred within and between groups with no apparent relationship to AFLP or
SSR genetic diversity. Unfortunately, few wild types of B. rapa were included in these
studies, which limits the conclusions regarding the centre of origin of the species.
B. rapa (2n = 20, genome AA) is potentially valuable in Brassica breeding because it is
one of the ancestor species of the allotetraploid species B. napus (2n = 38, genome
AACC) and B. juncea (2n = 36, genome AABB), and recently has been used to generate
synthetic allohexaploid Brassica (Ge et al. 2009; Tian et al. 2010; Wang et al. 2011b;
Geng et al. 2013). It is relatively easy to transfer alleles from B. rapa to B. napus
through interspecies introgression and recombination (Qian et al. 2006; Chen et al.
2010; Mei et al. 2011), although some differentiation in the A genome between the two
species is evident (Jiang et al. 2011). Therefore, B. rapa has great potential to contribute
to the genetic improvement of B. napus and B. juncea, which are the most widely grown
and commercially successful Brassica oilseed species. Both of these allotetraploid
species have experienced several bottlenecks in their history which has restricted their
41
genetic base (Becker et al. 1995; Cowling 2007; Bus et al. 2011a; Chen et al. 2013).
Therefore, it is important to study genetic diversity in genetic resource collections of B.
rapa for use in future genetic improvement in B. rapa and other Brassica species.
SSR markers have been useful to demonstrate agro-evolutionary relationships and
biogeography of Brassica species, including oilseed types of B. rapa (Annisa et al.
2013a), B. nigra (Pradhan et al. 2011), B. napus (Chen et al. 2008; Chen et al. 2010)
and B. juncea (Chen et al. 2013). We explored the relationship between geographic
origin, phenotypic and SSR allelic diversity within and among current-day accessions of
B. rapa from global genetic resource collections, including many wild types (ssp.
sylvestris), and from this inferred potential centres of origin and centres of diversity of
the species.
3.2 Materials and Methods
3.2.1 Plant materials and growing conditions
A total of 187 putative B. rapa accessions (Appendics: Supplementary Table S1) plus
one accession from each of five related Brassica species in the ‘Triangle of U’ (U 1935)
(Table 3.1) were evaluated in this study. The 187 accessions represented current-day
accessions from the known geographical origins and morphological types (oilseed, leafy
vegetable or root type) of B. rapa, as indicated by passport details provided by
germplasm banks or donors (Appendics: Supplementary Table S1). Countries of origin
were allocated to geographical regions: (1) east Asia (EA; represented by China, North
Korea, South Korea, Japan and Mongolia); (2) south Asia (SA; represented by India,
Pakistan, Nepal, Bangladesh and Afghanistan); (3) south-east Asia (SEA; represented
by Indonesia and Thailand); (4) west Asia and north Africa (WANA; represented by
Turkey, Syria, Iran, Iraq, Egypt, Algeria, Syria, Libya and Tunisia); (5) central Asia
(CA; represented by Kazakhstan, Kyrgyzstan and Uzbekistan); (6) America, including
both North America and South America (AM; represented by Canada, USA, Brazil and
Columbia); (7) Europe (EU; represented by Austria, Belgium, United Kingdom,
Czechoslovakia, Finland, Norway, Poland, Sweden, Russian, Former Soviet Union,
France, Germany, Hungary, Italy, Portugal and Spain); and (8) Australia (AU).
All glasshouse experiments were conducted at the campus of The University of Western
Australia (UWA), Perth, Australia (31°57’ S, 115°47’ E) from early May until the end
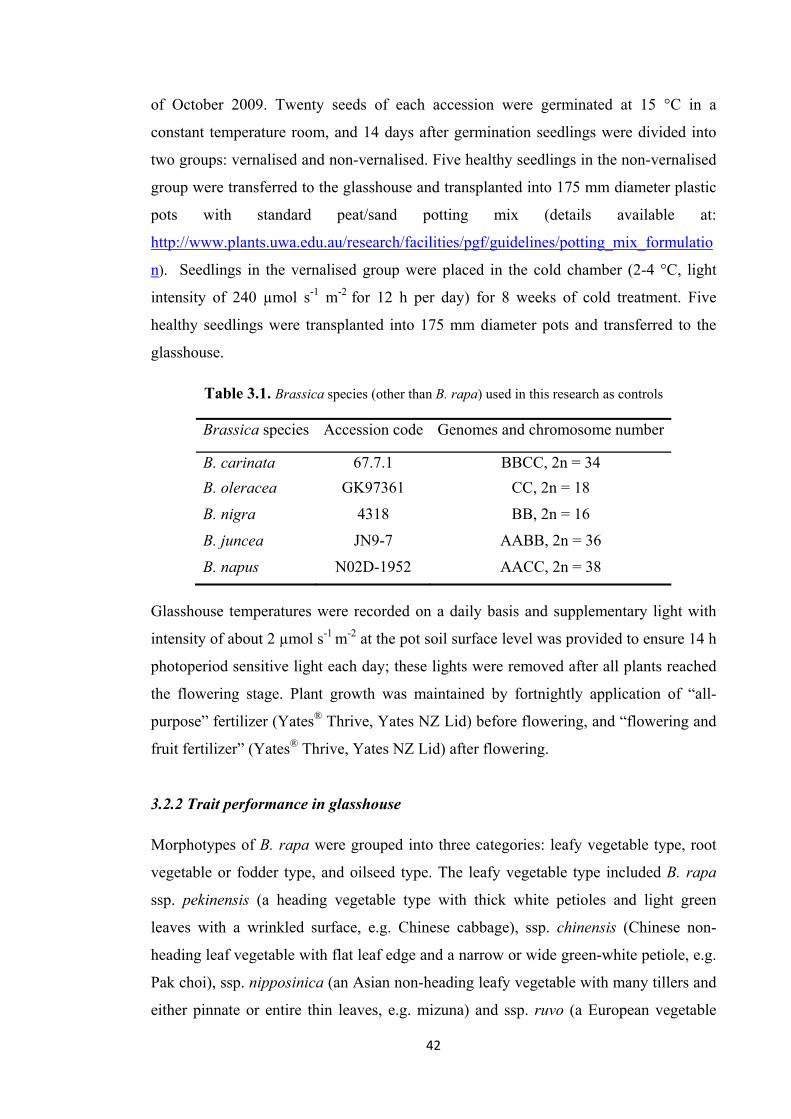
42
of October 2009. Twenty seeds of each accession were germinated at 15 °C in a
constant temperature room, and 14 days after germination seedlings were divided into
two groups: vernalised and non-vernalised. Five healthy seedlings in the non-vernalised
group were transferred to the glasshouse and transplanted into 175 mm diameter plastic
pots with standard peat/sand potting mix (details available at:
http://www.plants.uwa.edu.au/research/facilities/pgf/guidelines/potting_mix_formulatio
n). Seedlings in the vernalised group were placed in the cold chamber (2-4 °C, light
intensity of 240 µmol s-1 m-2 for 12 h per day) for 8 weeks of cold treatment. Five
healthy seedlings were transplanted into 175 mm diameter pots and transferred to the
glasshouse.
Table 3.1. Brassica species (other than B. rapa) used in this research as controls
Brassica species Accession code Genomes and chromosome number
B. carinata 67.7.1 BBCC, 2n = 34
B. oleracea GK97361 CC, 2n = 18
B. nigra 4318 BB, 2n = 16
B. juncea JN9-7 AABB, 2n = 36
B. napus N02D-1952 AACC, 2n = 38
Glasshouse temperatures were recorded on a daily basis and supplementary light with
intensity of about 2 µmol s-1 m-2 at the pot soil surface level was provided to ensure 14 h
photoperiod sensitive light each day; these lights were removed after all plants reached
the flowering stage. Plant growth was maintained by fortnightly application of “all-
purpose” fertilizer (Yates® Thrive, Yates NZ Lid) before flowering, and “flowering and
fruit fertilizer” (Yates® Thrive, Yates NZ Lid) after flowering.
3.2.2 Trait performance in glasshouse
Morphotypes of B. rapa were grouped into three categories: leafy vegetable type, root
vegetable or fodder type, and oilseed type. The leafy vegetable type included B. rapa
ssp. pekinensis (a heading vegetable type with thick white petioles and light green
leaves with a wrinkled surface, e.g. Chinese cabbage), ssp. chinensis (Chinese non-
heading leaf vegetable with flat leaf edge and a narrow or wide green-white petiole, e.g.
Pak choi), ssp. nipposinica (an Asian non-heading leafy vegetable with many tillers and
either pinnate or entire thin leaves, e.g. mizuna) and ssp. ruvo (a European vegetable

43
with enlarged and compact inflorescence and flat edge leaf shape, e.g. broccoletto)
(Appendics: Supplementary Figure S1). Root type was identified as vegetable or fodder
turnip with expanded roots, mostly classified as ssp. rapa. Those without either of these
characters were classified as oilseed type, such as turnip rape (ssp. oleifera) and brown
or yellow sarson (ssp. dichotoma and ssp. trilocularis, respectively).
The days to flowering (DTF) of vernalised and non-vernalised plants were recorded as
the number of days from the date of seed sowing to the date of first open flower, and the
information was used to determine the flowering habit of each accession, i.e., spring,
semi-winter or winter types. Spring types were defined as those which flowered directly
without any vernalisation requirement within 90 days (Snowdon et al. 2007), and the
DTF (non-vernalised) was less than or equal to DTF (vernalised). Semi-winter types
were defined as those in which DTF (non-vernalised) was between 90 and 165 days.
Winter types were those in which flowering occurred in the vernalised treatment, but
not in the non-vernalised treatment, by the end of the experiment (maximum DTF =
165). In some accessions, plant death prevented a comparison between vernalised and
non-vernalised treatments, and for such accessions the flowering habit was recorded as
unknown.
Pollination control was determined through the use of pollination bags to assess self-
compatibility and self-incompatibility. The main stem inflorescence of one plant in each
pot was covered by a small micro-perforated pollination bag at the beginning of
flowering. All plants in the accession in one pot were covered by a large pollination bag
to promote pollen flow between plants within the bag. The bags were shaken gently
during flowering, and removed after flowering had finished.
At harvest, pods in the small pollination bag were classified according to their length
(including the beak): less than 25 mm, between 25-50 mm and more than 50 mm, which
were labelled as small (S), medium (M) and large (L) size, respectively. After harvest,
plants with less than three small or middle sized pods (≤ 3 S or ≤ 3 M, normally only 1-
5 seeds inside) on bagged inflorescences were recorded as self-incompatible, and those
with more or larger size seeded pods (> 3 S, > 3 M or > 1 L) were recorded as self-
compatible.
Seed colours were recorded both before seed sowing and after harvest for each
accession. They were recorded dark (D) (either brown or black) and yellow (Y) when
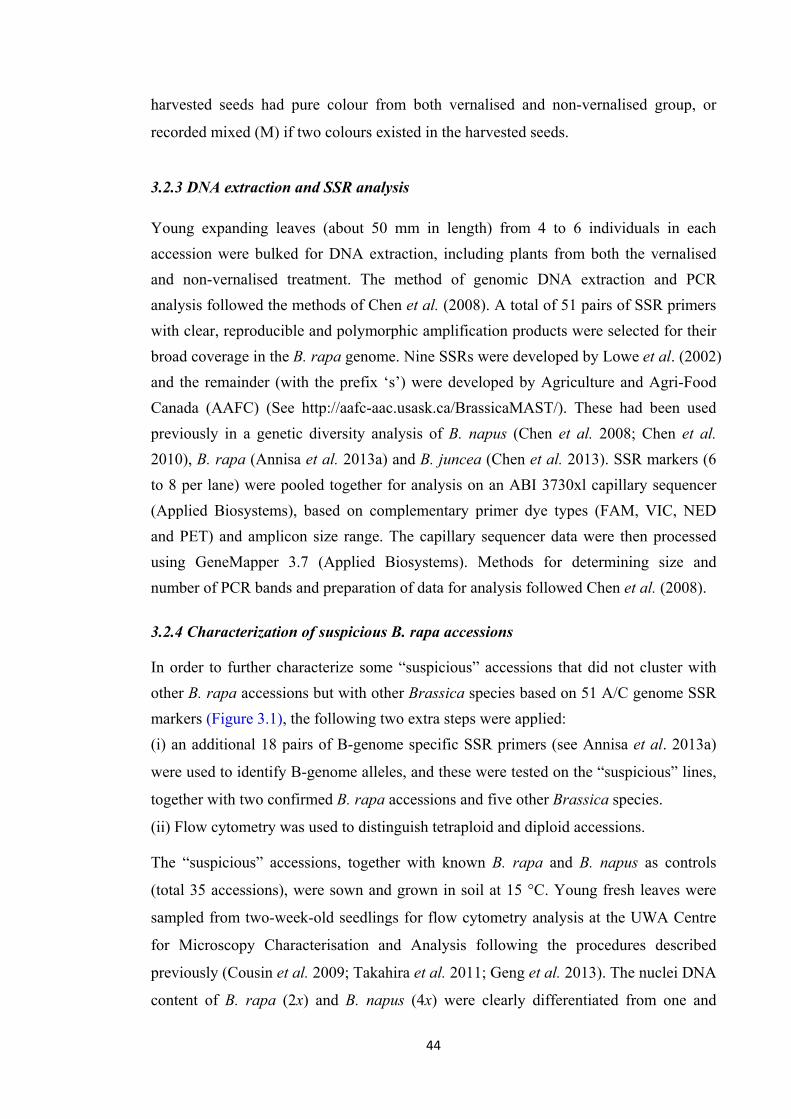
44
harvested seeds had pure colour from both vernalised and non-vernalised group, or
recorded mixed (M) if two colours existed in the harvested seeds.
3.2.3 DNA extraction and SSR analysis
Young expanding leaves (about 50 mm in length) from 4 to 6 individuals in each
accession were bulked for DNA extraction, including plants from both the vernalised
and non-vernalised treatment. The method of genomic DNA extraction and PCR
analysis followed the methods of Chen et al. (2008). A total of 51 pairs of SSR primers
with clear, reproducible and polymorphic amplification products were selected for their
broad coverage in the B. rapa genome. Nine SSRs were developed by Lowe et al. (2002)
and the remainder (with the prefix ‘s’) were developed by Agriculture and Agri-Food
Canada (AAFC) (See http://aafc-aac.usask.ca/BrassicaMAST/). These had been used
previously in a genetic diversity analysis of B. napus (Chen et al. 2008; Chen et al. 2010), B. rapa (Annisa et al. 2013a) and B. juncea (Chen et al. 2013). SSR markers (6
to 8 per lane) were pooled together for analysis on an ABI 3730xl capillary sequencer
(Applied Biosystems), based on complementary primer dye types (FAM, VIC, NED
and PET) and amplicon size range. The capillary sequencer data were then processed
using GeneMapper 3.7 (Applied Biosystems). Methods for determining size and
number of PCR bands and preparation of data for analysis followed Chen et al. (2008).
3.2.4 Characterization of suspicious B. rapa accessions
In order to further characterize some “suspicious” accessions that did not cluster with
other B. rapa accessions but with other Brassica species based on 51 A/C genome SSR
markers (Figure 3.1), the following two extra steps were applied:
(i) an additional 18 pairs of B-genome specific SSR primers (see Annisa et al. 2013a)
were used to identify B-genome alleles, and these were tested on the “suspicious” lines,
together with two confirmed B. rapa accessions and five other Brassica species.
(ii) Flow cytometry was used to distinguish tetraploid and diploid accessions.
The “suspicious” accessions, together with known B. rapa and B. napus as controls
(total 35 accessions), were sown and grown in soil at 15 °C. Young fresh leaves were
sampled from two-week-old seedlings for flow cytometry analysis at the UWA Centre
for Microscopy Characterisation and Analysis following the procedures described
previously (Cousin et al. 2009; Takahira et al. 2011; Geng et al. 2013). The nuclei DNA
content of B. rapa (2x) and B. napus (4x) were clearly differentiated from one and
45
another with central peak values 50 and 100, respectively, and samples that showed the
same pattern of nuclei peak at the value of 50 and 100 were classified as diploid (2x)
and tetraploid (4x), respectively. Any accessions which could not be classified based on
nuclei content peaks in the first run were repeated in a second run. This technique
readily separated diploid B. rapa from tetraploid species, such as B. juncea and B.
napus (Table 3.2).
Figure 3.1. Sixteen “suspicious” accessions which clustered outside of the major B. rapa group by 2D-MDS analysis with 51 A/C SSR primer analysis (the other 171 B. rapa accessions were hidden in “(A)”)
3.2.5 Population structure analysis
The relationship between geographical origins of accessions and SSR diversity was
examined by cluster and 2D-MDS analysis. Following this, the program STRUCTURE
version 2.3.3 was used to identify groups in the population of 173 confirmed B. rapa
accessions, based on SSR allelic diversity, using a Bayesian approach (Prichard et al. 2000). Several numbers of groups (K) from 1-10 were tested assuming that genotypes
have independent allele frequencies between subpopulations (Chen et al. 2013). Each
process was run with burn in of 100 000 and repeated 10 times to obtain adequate Q
values (estimated population ancestries). STRUCTURE HARVESTER online program
was used to calculate the optimum K value, or number of groups (Earl and vonHoldt
2012).
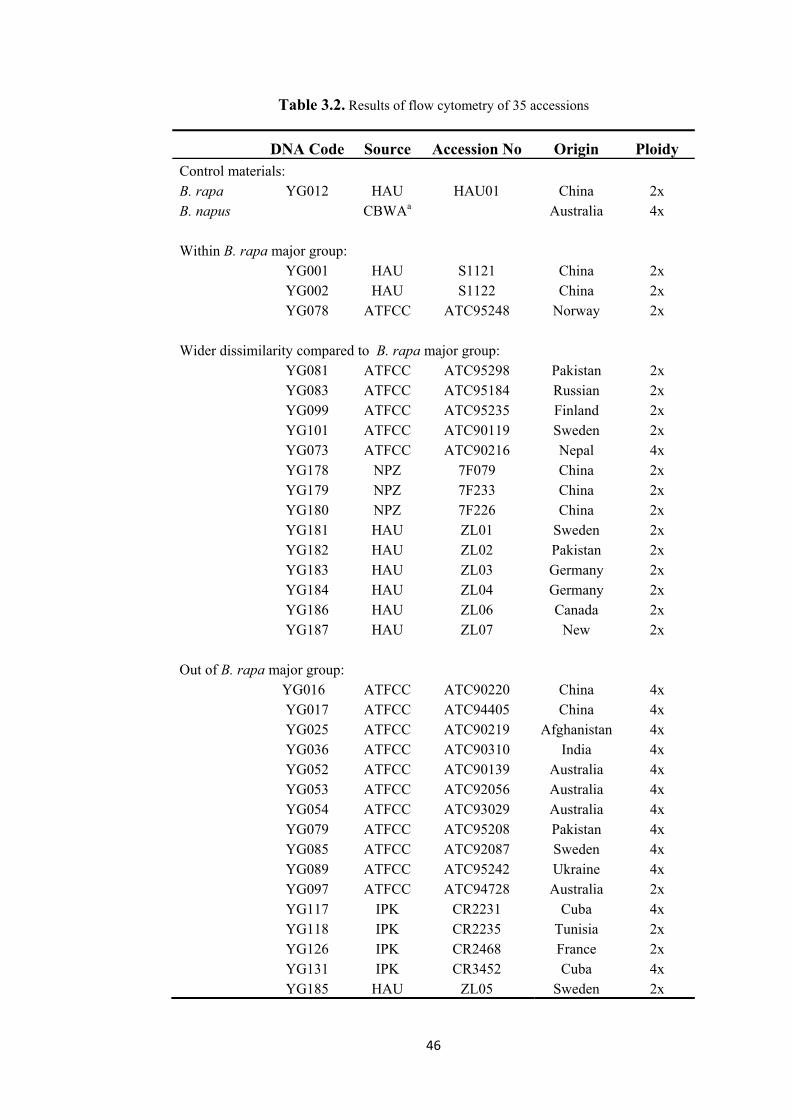
46
Table 3.2. Results of flow cytometry of 35 accessions
DNA Code Source Accession No Origin Ploidy Control materials: B. rapa YG012 HAU HAU01 China 2x B. napus CBWAa Australia 4x Within B. rapa major group:
YG001 HAU S1121 China 2x YG002 HAU S1122 China 2x YG078 ATFCC ATC95248 Norway 2x
Wider dissimilarity compared to B. rapa major group: YG081 ATFCC ATC95298 Pakistan 2x YG083 ATFCC ATC95184 Russian 2x YG099 ATFCC ATC95235 Finland 2x YG101 ATFCC ATC90119 Sweden 2x YG073 ATFCC ATC90216 Nepal 4x YG178 NPZ 7F079 China 2x YG179 NPZ 7F233 China 2x YG180 NPZ 7F226 China 2x YG181 HAU ZL01 Sweden 2x YG182 HAU ZL02 Pakistan 2x YG183 HAU ZL03 Germany 2x YG184 HAU ZL04 Germany 2x YG186 HAU ZL06 Canada 2x YG187 HAU ZL07 New 2x
Out of B. rapa major group: YG016 ATFCC ATC90220 China 4x YG017 ATFCC ATC94405 China 4x YG025 ATFCC ATC90219 Afghanistan 4x YG036 ATFCC ATC90310 India 4x YG052 ATFCC ATC90139 Australia 4x YG053 ATFCC ATC92056 Australia 4x YG054 ATFCC ATC93029 Australia 4x YG079 ATFCC ATC95208 Pakistan 4x YG085 ATFCC ATC92087 Sweden 4x YG089 ATFCC ATC95242 Ukraine 4x YG097 ATFCC ATC94728 Australia 2x YG117 IPK CR2231 Cuba 4x YG118 IPK CR2235 Tunisia 2x YG126 IPK CR2468 France 2x YG131 IPK CR3452 Cuba 4x YG185 HAU ZL05 Sweden 2x

47
3.2.6 Genetic diversity analysis and analysis of molecular variance
Dissimilarity matrices based on SSR allelic diversity were calculated using NTSYSpc
(Rohlf 2002), version 2.20f, based on Euclidean distance. Hierarchical cluster analysis
was performed using the unweighted pair group method and arithmetic averages
(UPGMA) and ordination by two-dimensional multi-dimensional scaling (2D-MDS) in
PRIMER 6 and PERMANOVA software (Clarke and Gorley 2006).
The analysis of molecular variance (AMOVA) and pairwise population comparison was
conducted using GenAIEx ver 6.5 (Peakall and Smouse 2012). PhiPT coefficient values
(VAP/[VWP+VAP]) denotes the proportion of the variance among population relative to
the total variance, and pairwise between populations PhiPT = (VAP+VAR)/(VWP+VAP+VAR).
VAP is the variance among populations, VWP is the variance within populations and VAR
is the variance between geographical regions (Keneni et al. 2012).
The SSR allelic diversity in B. rapa was also examined by assessing the number of
“private” alleles (alleles unique to a population), and the richness of private SSR alleles
(number of private alleles per accession) as described in Chen et al. (2008). The number
of SSR alleles uniquely shared between pairs and triplets of regions was then calculated,
and this number was used to generate a diagram of genetic relationships between pairs
and triplets of regions.
In fulfilment of data archiving guidelines (Baker 2013), we have deposited the
primary data underlying these analyses (i.e., the genotypes) with Research Data
Online, the University of Western Australia’s public repository for research datasets:
http://researchdataonline.research.uwa.edu.au/.
3.3 Results
Preliminary 2D-MDS analysis using 51 A/C SSR primers revealed 16 “suspicious”
accessions of uncertain classification which clustered with B. juncea (6), B. napus (6) or
formed their own branches (ATC94728, CR2235, CR2468 and ZL05) (Figure 3.1).
Flow cytometry identified 13 tetraploid accessions (Table 3.2). Several accessions
tested positive for specific B-genome alleles, and in total, 14 accessions were deemed to
have been misclassified in gene banks and were not B. rapa (Table 3.3), leaving a total
of 173 confirmed B. rapa accessions for further studies.

48
Table 3.3. The list of misclassified B. rapa accessions based on the extra tests with B genome
specific SSR markers to confirm presence of B genome, position on 2D-MDS with A/C genome
SSR markers, and flow cytometry to evaluate ploidy level (Appendices: Supplementary Figure S1).
Number Code Sourcea Accession
number Ploidy
Positive for B-genome specific
marker
Putative Species
1 YG016 ATFCC ATC90220 4x + B. juncea 2 YG017 ATFCC ATC94405 4x + B. juncea 3 YG025 ATFCC ATC90219 4x + B. juncea 4 YG036 ATFCC ATC90310 4x + B. juncea 5 YG052 ATFCC ATC90139 4x - B. napus 6 YG053 ATFCC ATC92056 4x - B. napus 7 YG054 ATFCC ATC93029 4x + B. juncea 8 YG073 ATFCC ATC90216 4x + B. juncea 9 YG079 ATFCC ATC95208 4x + B. juncea
10 YG085 ATFCC ATC92087 4x - B. napus 11 YG089 ATFCC ATC95242 4x - B. napus 12 YG097 ATFCC ATC94728 2x - B. oleracea 13 YG117 IPK CR2231 4x - B. napus 14 YG131 IPK CR2235 4x - B. napus
a ATFCC stands for Australian Temperate Field Crops Collection and IPK stands for Institute of Plant Genetics and Crop Plant Research in Germany
3.3.1 Population structure analysis and SSR allelic diversity
A total of 715 SSR alleles were detected at polymorphic loci in 173 B. rapa accessions.
Based on the A/C genome SSR markers used in this study, geographical groups were
not clearly distinguished by cluster and 2D-MDS analysis (figures not shown).
Therefore, we used the log probability by STRUCTURE and STRUCTURE
HARVESTER, which reached a peak at K = 3 (delta K = 23.8, Figure 3.3). On this
basis, three groups of accessions were differentiated by STRUCTURE analysis (Figure
3.2). The geographical origins and allelic diversity of B. rapa in the three groups are
summarised in Table 3.4. SSR group 1 consisted of 42 accessions, mainly from EU and
WANA, and AM. In addition, all the seven wild type B. rapa accessions (B. rapa ssp.
silvestris) (ATC95330, ATC95373, CR2212, CR2213, CR2300, CR2355 and CR2468)
clustered into group 1 by STRUCTURE analysis. SSR group 2 consisted of 73
accessions, most of which originated from EA (94.5%), mainly from China (67, 91.8%),
and included a special B. rapa line (ZL07) that was derived from B. napus spring
oilseed variety ‘Oro’ during interspecific breeding (Tu et al. 2010). SSR group 3 was a
geographically mixed group consisting of 58 accessions across all the eight regions,
predominantly EA and SA, with north-east Asia (Korea, Japan) represented in EA.

49
The three STRUCTURE groups were differentiated also in 2D-MDS (Figure 3.4). The
wild type B. rapa were clustered into SSR group 1 and the wild types were more
genetically diverse than other accessions in SSR group 1 (Figure 3.4).
Figure 3.2. Three simple sequence repeat marker groups (G1, G2 and G3) of 173 B. rapa accessions were generated by software STRUCTURE based on the optimum cluster number K=3 (Supplementary Figure S3) for polymorphic SSR alleles, and sorted by Q value (accessions estimated membership fractions).
SSR group 1 (Old World) had the highest richness of private alleles (average of 1.52
private alleles per accession), which was more than three times the rate of private alleles
found in SSR group 3 (Table 3.4).
Table 3.4. Geographical origins and allelic diversity of three groups formed from STRUCTURE
analysis of SSR data for 173 accessions of B. rapa, showing the number of polymorphic and private
alleles, and richness of private alleles. The distribution of seven wild types of B. rapa is indicated in
brackets.
SSR Group
Total number of accessions
Number of accessions in each region of origina Total
polymorphic alleles
Private allelesb
EA SA SEA CA WANA EU AM AU No. Richness
G1 – Old World
42 1(1) 1 0 0 7(1) 25(4) 8(1) 0 595 64 1.52
G2 – East Asia
73 69 0 1 0 0 2 1 0 563 44 0.60
G3 - Mixed 58 27 12 4 4 3 5 1 2 533 26 0.45 a Region abbreviations: EA – east Asia, SA – south Asia, SEA – south-east Asia, CA – central Asia, WANA – west Asia and north Africa, EU – Europe, AM – America, and AU – Australia b Private alleles are those alleles found only in one SSR group; richness of private alleles is equal to the number of private alleles divided by the number of accessions.
G3 G2 G1
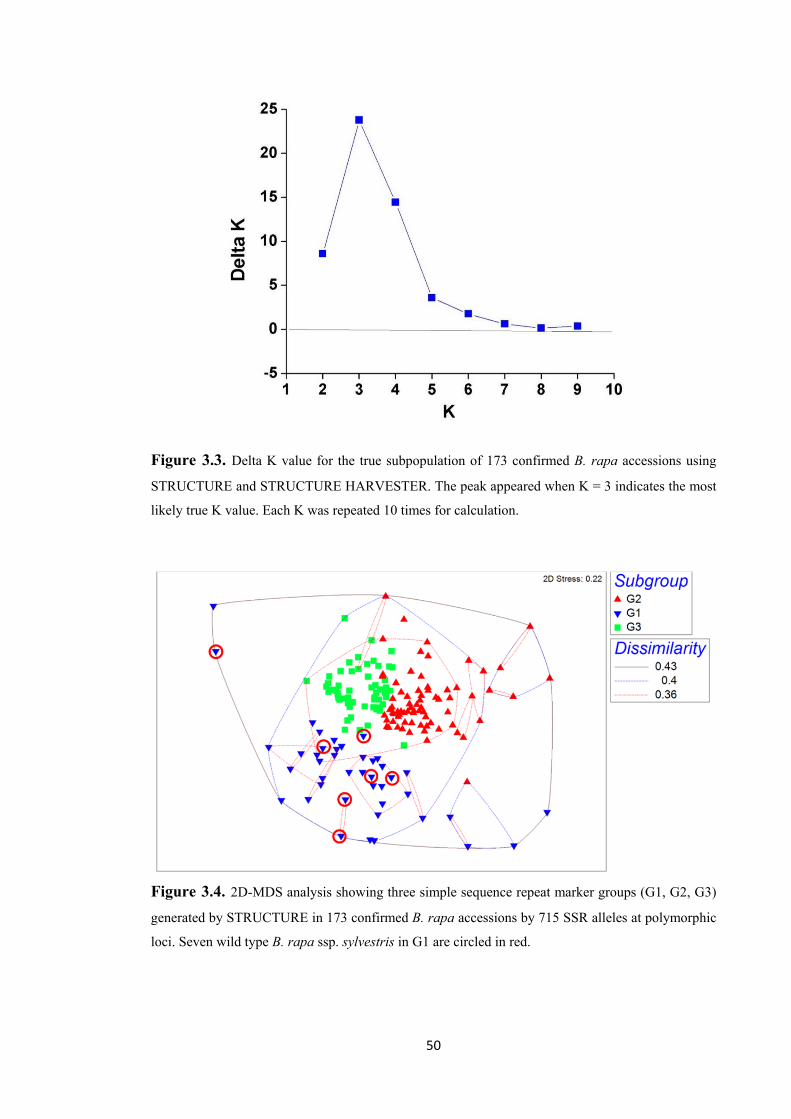
50
Figure 3.3. Delta K value for the true subpopulation of 173 confirmed B. rapa accessions using
STRUCTURE and STRUCTURE HARVESTER. The peak appeared when K = 3 indicates the most
likely true K value. Each K was repeated 10 times for calculation.
Figure 3.4. 2D-MDS analysis showing three simple sequence repeat marker groups (G1, G2, G3)
generated by STRUCTURE in 173 confirmed B. rapa accessions by 715 SSR alleles at polymorphic
loci. Seven wild type B. rapa ssp. sylvestris in G1 are circled in red.

51
3.3.2 AMOVA tests on the global collection
AMOVA tests based on eight geographical regions showed that most of the allelic
variance occurred within geographical populations (90%), and only 10% among
populations, which reflects the large genetic diversity among individual B. rapa
accessions within geographical regions (Table 3.5). The AMOVA showed marginally
higher variance among groups when based on 3 SSR populations from STRUCTURE
analysis (11%) (Table 3.5).
Table 3.5. Analysis of molecular variance of 715 total polymorphic SSR alleles from 173 B. rapa
accessions showing the distribution of genetic diversity within and among eight geographical regions,
and within and among three SSR groups.
Source of variationa df MS Variance
component Total
variance P value
By geographical regions
Among eight regions 7 140.982 5.684 10%
Within eight regions 165 51.422 51.422 90% 0.001
Total 172 57.105 100% By SSR groups
Among three groups 2 402.224 6.241 11%
Within three groups 170 50.982 50.982 89% 0.001
Total 172 57.224 100% a df – degrees of freedom, MS – mean squares, P value – probability of F-test
3.3.3 Comparison of allelic variation across geographical regions
Of the 715 alleles at polymorphic loci, 401 (56%) were common among the three SSR
groups. When compared across geographic regions, EA was a genetically diverse region
with a high number of private alleles although EA was relatively low in “richness” of
private alleles (Table 3.6). Accessions from WANA and EU in SSR group 1 showed the
highest richness of private alleles (Table 3.6).
Many alleles were unique to pairs or triplets of geographical regions, and genetic
relationships between geographical regions were revealed through a diagram based on
these uniquely shared alleles (Figure 3.5, Table 3.7). EA was linked by shared unique
alleles to EU (54 alleles were uniquely shared by EA and EU) and many other regions.
EU was also linked to many other regions, with 10 alleles uniquely shared with WANA
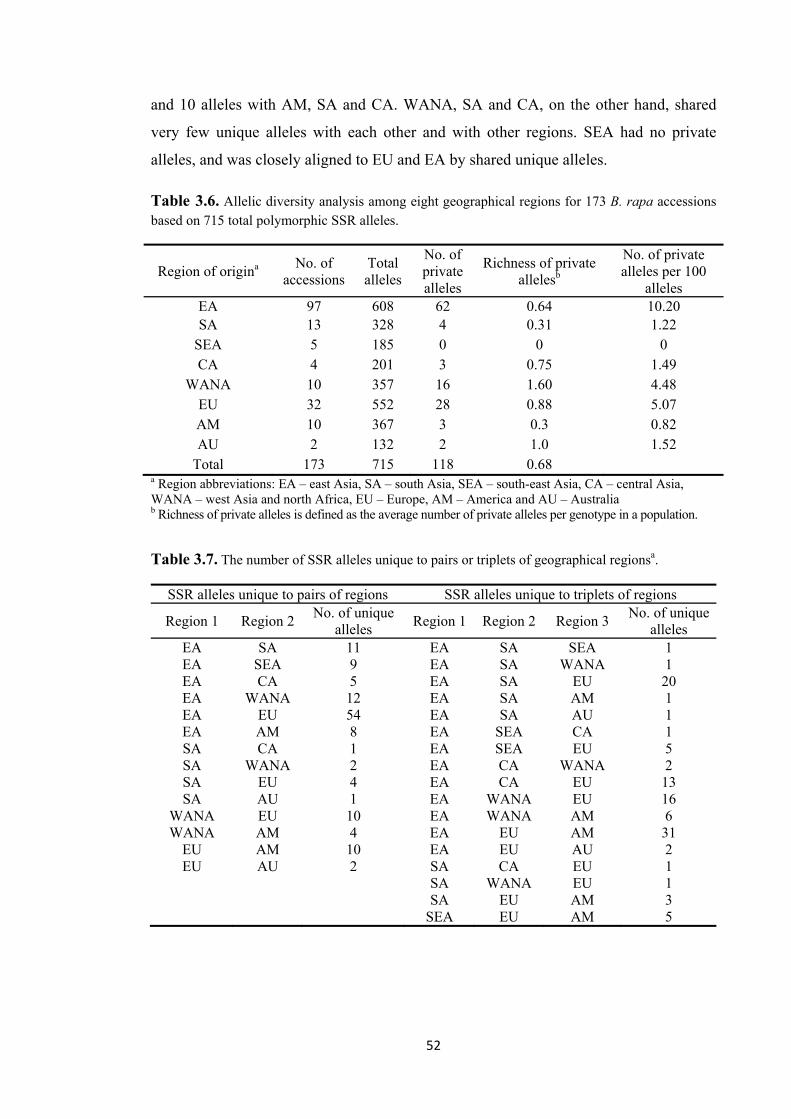
52
and 10 alleles with AM, SA and CA. WANA, SA and CA, on the other hand, shared
very few unique alleles with each other and with other regions. SEA had no private
alleles, and was closely aligned to EU and EA by shared unique alleles.
Table 3.6. Allelic diversity analysis among eight geographical regions for 173 B. rapa accessions based on 715 total polymorphic SSR alleles.
Region of origina No. of
accessions Total alleles
No. of private alleles
Richness of private allelesb
No. of private alleles per 100
alleles EA 97 608 62 0.64 10.20 SA 13 328 4 0.31 1.22
SEA 5 185 0 0 0 CA 4 201 3 0.75 1.49
WANA 10 357 16 1.60 4.48 EU 32 552 28 0.88 5.07 AM 10 367 3 0.3 0.82 AU 2 132 2 1.0 1.52
Total 173 715 118 0.68 a Region abbreviations: EA – east Asia, SA – south Asia, SEA – south-east Asia, CA – central Asia, WANA – west Asia and north Africa, EU – Europe, AM – America and AU – Australia b Richness of private alleles is defined as the average number of private alleles per genotype in a population.
Table 3.7. The number of SSR alleles unique to pairs or triplets of geographical regionsa.
SSR alleles unique to pairs of regions SSR alleles unique to triplets of regions
Region 1 Region 2 No. of unique
alleles Region 1 Region 2 Region 3
No. of unique alleles
EA SA 11 EA SA SEA 1 EA SEA 9 EA SA WANA 1 EA CA 5 EA SA EU 20 EA WANA 12 EA SA AM 1 EA EU 54 EA SA AU 1 EA AM 8 EA SEA CA 1 SA CA 1 EA SEA EU 5 SA WANA 2 EA CA WANA 2 SA EU 4 EA CA EU 13 SA AU 1 EA WANA EU 16
WANA EU 10 EA WANA AM 6 WANA AM 4 EA EU AM 31
EU AM 10 EA EU AU 2 EU AU 2 SA CA EU 1
SA WANA EU 1 SA EU AM 3 SEA EU AM 5
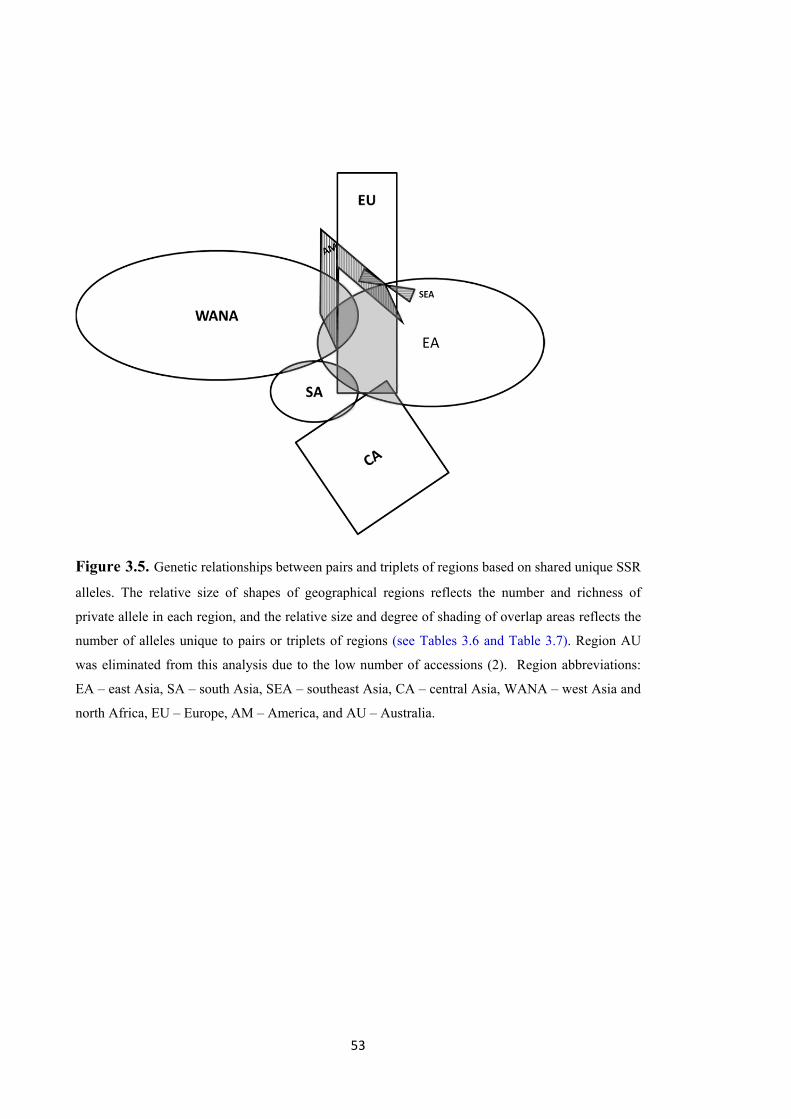
53
Figure 3.5. Genetic relationships between pairs and triplets of regions based on shared unique SSR
alleles. The relative size of shapes of geographical regions reflects the number and richness of
private allele in each region, and the relative size and degree of shading of overlap areas reflects the
number of alleles unique to pairs or triplets of regions (see Tables 3.6 and Table 3.7). Region AU
was eliminated from this analysis due to the low number of accessions (2). Region abbreviations:
EA – east Asia, SA – south Asia, SEA – southeast Asia, CA – central Asia, WANA – west Asia and
north Africa, EU – Europe, AM – America, and AU – Australia.
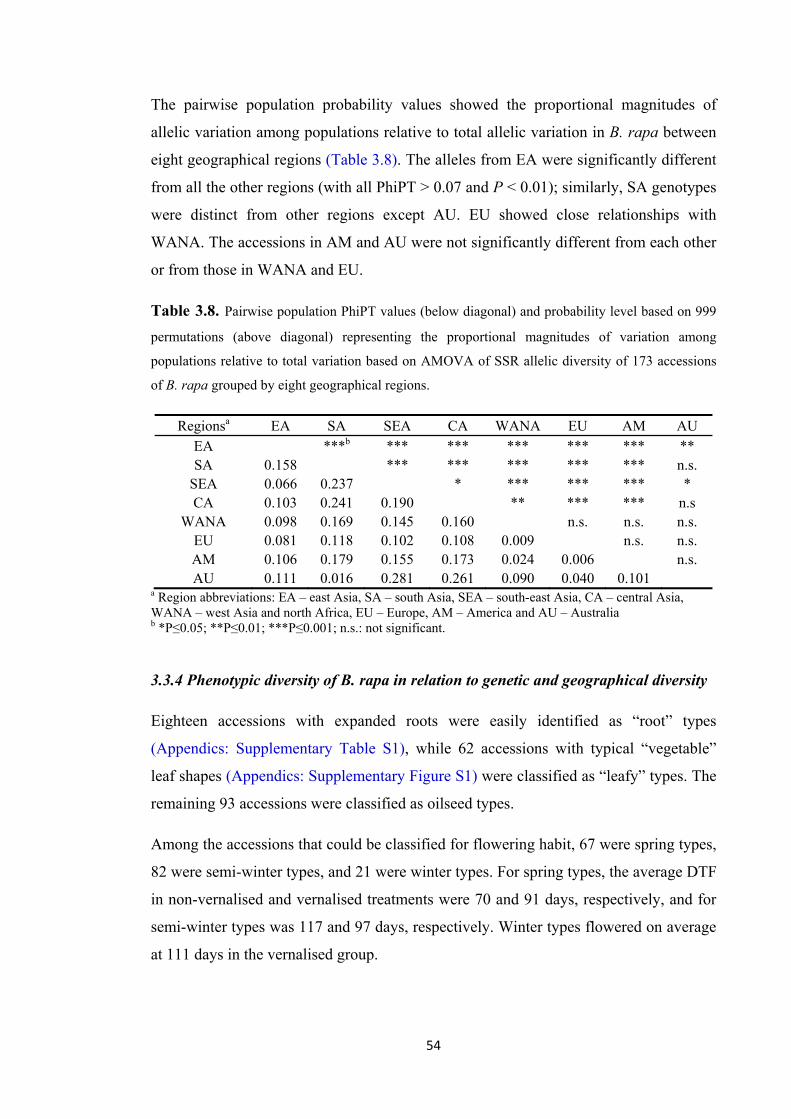
54
The pairwise population probability values showed the proportional magnitudes of
allelic variation among populations relative to total allelic variation in B. rapa between
eight geographical regions (Table 3.8). The alleles from EA were significantly different
from all the other regions (with all PhiPT > 0.07 and P < 0.01); similarly, SA genotypes
were distinct from other regions except AU. EU showed close relationships with
WANA. The accessions in AM and AU were not significantly different from each other
or from those in WANA and EU.
Table 3.8. Pairwise population PhiPT values (below diagonal) and probability level based on 999
permutations (above diagonal) representing the proportional magnitudes of variation among
populations relative to total variation based on AMOVA of SSR allelic diversity of 173 accessions
of B. rapa grouped by eight geographical regions.
Regionsa EA SA SEA CA WANA EU AM AU EA ***b *** *** *** *** *** ** SA 0.158 *** *** *** *** *** n.s.
SEA 0.066 0.237 * *** *** *** * CA 0.103 0.241 0.190 ** *** *** n.s
WANA 0.098 0.169 0.145 0.160 n.s. n.s. n.s. EU 0.081 0.118 0.102 0.108 0.009 n.s. n.s. AM 0.106 0.179 0.155 0.173 0.024 0.006 n.s. AU 0.111 0.016 0.281 0.261 0.090 0.040 0.101
a Region abbreviations: EA – east Asia, SA – south Asia, SEA – south-east Asia, CA – central Asia, WANA – west Asia and north Africa, EU – Europe, AM – America and AU – Australia b *P≤0.05; **P≤0.01; ***P≤0.001; n.s.: not significant.
3.3.4 Phenotypic diversity of B. rapa in relation to genetic and geographical diversity
Eighteen accessions with expanded roots were easily identified as “root” types
(Appendics: Supplementary Table S1), while 62 accessions with typical “vegetable”
leaf shapes (Appendics: Supplementary Figure S1) were classified as “leafy” types. The
remaining 93 accessions were classified as oilseed types.
Among the accessions that could be classified for flowering habit, 67 were spring types,
82 were semi-winter types, and 21 were winter types. For spring types, the average DTF
in non-vernalised and vernalised treatments were 70 and 91 days, respectively, and for
semi-winter types was 117 and 97 days, respectively. Winter types flowered on average
at 111 days in the vernalised group.

55
The seed colour of accessions (as harvested) was brown (133), black (8), or pure yellow
(16), while 16 were recorded with mixed seed colours.
Ninety-three accessions were self-incompatible while 80 accessions were self-
compatible. Most of the self-incompatible lines produced abundant pods and seeds
when cross-pollinated among a group of 4 to 5 plants from the same accession.
The phenotypic traits were distributed across regions and the three SSR groups as
defined by STRUCTURE analysis (Appendics: Supplementary Table S1).
AMOVA of SSR allelic data vs phenotypic data showed that leafy type accessions were
distinct from root and oilseed types, while there was no significant difference in SSR
allelic diversity between oilseed and root type accessions (Table 3.9).
Table 3.9. Pairwise population PhiPT values (below diagonal) and probability level based on 999
permutations (above diagonal) representing the proportional magnitudes of variation among different
phenotypic traits to total variation based on AMOVA of SSR allelic diversity of 173 accessions of B.
rapa grouped by morphotypes, flowering habit and seed colour.
Phenotypic Traits Morphotypes Oilseed Root Leafy Oilseed n.s. *** Rooty 0.004 *** Leafy 0.015 0.037 Flowering Habit Spring Semi-winter Winter Spring * ** Semi-winter 0.004 *** Winter 0.021 0.024 Seed Colour Dark Yellow Mixed Dark *** ** Yellow 0.103 ** Mixed 0.016 0.138 a *P≤0.05; **P≤0.01; ***P≤0.001; n.s.: not significant. b three accessions only had records from vernalised condition therefore classified as “Unknown” for their flowering habit and were excluded from AMOVA analysis
56
3.4 Discussion
Our B. rapa collection includes extant varieties, landraces and wild types from all the
known regions where the species has been collected and deposited in gene banks. The
collection represents the classical Old World, which includes south-west Asia, the
Mediterranean basin and temperate Europe as defined in Zohary et al. (2012), but also
includes accessions from the New World (north and south America), south Asia, central
Asia, east Asia, south-east Asia, and Australia. The collection includes root types, leafy
vegetable types, and oilseed types, and at least seven wild types (B. rapa ssp. sylvestris)
as defined in genebank records. Our study, based on SSR genetic diversity, supports
previous claims (Song et al. 1990; McGrath and Quiros 1992a), that the classical Old
World is the centre of origin of B. rapa, but we also identified many centres of diversity
along trade routes in south, central and east Asia which were populated by agricultural
types of B. rapa. Each centre of diversity has a range of morphotypes, seed colours,
self-incompatibility and flowering times. In contrast to the previous hypothesis (Song et
al. 1990), we found no evidence of wild types outside of the classical Old World.
3.4.1 Groups based on SSR allelic diversity
The collection showed large SSR allelic genetic diversity with 715 alleles at A-genome
loci in 173 confirmed B. rapa accessions (average 4.1 alleles per accession at
polymorphic loci). This is double the rate of alleles per accession at polymorphic A-
genome loci reported in a global collection of the allotetraploid B. juncea (2.1 alleles
per accession) based on similar SSR markers (Chen et al. 2013). B. juncea is considered
to be a “recent” allopolyploid species that evolved in agricultural times through the
union of the A genome in B. rapa and the B genome in B. nigra (Gómez-Campo and
Prakash 1999; Prakash et al. 2012), and B. juncea has a more limited geographical
distribution than B. rapa (Dixon 2007). The allelic diversity in the A genome of B. rapa
is therefore potentially valuable for the genomic improvement of the allotetraploid
Brassica species (B. juncea and B. napus) that were formed by one or few natural
allopolyploidy events with the A genome from B. rapa (Qian et al. 2006; Chen et al.
2010; Mei et al. 2011).
B. rapa accessions were assigned to geographical groups in previous studies based on
RFLP and AFLP markers (Song et al. 1988b; Zhao et al. 2005; Warwick et al. 2008). In
57
our study, based on A/C genome SSR markers, geographical groups were not separated
clearly by cluster analysis and 2D-MDS analysis of SSR markers (figures not shown).
Therefore, STRUCTURE analysis was important to define SSR groups in B. rapa.
STRUCTURE analysis, in combination with other classification methods, has been
widely used in assessing agro-evolutionary relationship in crop plants based on SSR and
single nucleotide polymorphism (SNP) genetic variation, for example in grape
(Emanuelli et al. 2013), wheat (Chao et al. 2010), barley (Jones et al. 2011) and B.
juncea (Chen et al. 2013). STRUCTURE analysis revealed an optimum K number of
three SSR groups of B. rapa accessions (Figures 3.2, 3.3, 3.4), which were distinct but
not completely separated by 2D-MDS (Figure 3.4). Interestingly, the STRUCTURE
groups were associated with the putative centre of origin and centres of diversity in B.
rapa. SSR group 1 represented the classical Old World as defined by Zohary et al.
(2012), with accessions from EU and WANA; SSR group 2 represented mostly EA; and
SSR group 3 represented a diverse array of regions including EA, SEA, SA and CA.
SSR group 1 is the most genetically diverse and contains all the wild types of B. rapa;
SSR group 2 represents the long period of selection and differentiation of agricultural
types in EA; and SSR group 3 includes migrants into EA, SA and CA along the trade
routes between east and west in Neolithic times (Prakash et al. 2012).
AMOVA indicated that the percentage of genetic diversity explained within the three
SSR groups (11 %) was marginally greater than that explained by eight regions of
origin (10 %) (Table 3.5). Genetic diversity was relatively high within groups, whether
classification was based on SSR groups or geographic region.
3.4.2 SSR allelic diversity within and among geographic regions
Private SSR alleles, which are unique to a population, and SSR alleles that are uniquely
shared among pairs or triplets of populations, may provide evidence on centres of origin
and diversity and migration events in B. rapa. Based on the eight major geographical
regions distinguished in this study, private alleles identified two major centres of
diversity in EU and EA (Table 3.6), and uniquely shared alleles supported the existence
of geographical subpopulations in the Old World and across ancient trade routes to Asia
(Figure 3.5, Table 3.7). This follows the arguments of Song et al. (1988b) based on
RFLP markers.
58
The joining of EU and WANA into SSR group 1 was supported by the similar pairwise
population probability values for these two geographic regions (Table 3.8). The richness
of private alleles was greatest in EU and WANA (the Old World) (Table 3.6) and wild
forms (B. rapa ssp. silvestris) were restricted to EU and WANA (circled in red in Figure
3.4). The joining of EU and WANA into one SSR group is also supported by the high
frequency of private or shared unique alleles (Figure 3.5).
The pairwise PhiPT values by AMOVA analysis indicated that most Asian groups (EA,
SA, SEA and CA) were different from each other and from EU-WANA (Table 3.8).
SSR group 3 is therefore a mixture of unique populations with relatively low genetic
diversity within populations.
3.4.3 Morphotypes in relation to SSR genetic diversity
Leafy vegetable, root and oilseed types were found in each of the three major SSR
groups (Appendics: Supplementary Table S1, Supplementary Figure S1), and AMOVA
analysis did not support classification of genetic diversity based on morphotypes (Table
3.9). SSR genetic diversity did not follow classification of leafy types into groups, such
as Pak Choi (ssp. chinensis), Chinese cabbage (ssp. pekinensis), and Mizuna (ssp.
nipposinica), which supports the conclusions of previous authors based on AFLP
markers (Zhao et al. 2005). The selection of oilseed types in EU dates back to the 14th
century (Reiner et al. 1995), and post-dates domestication of turnip-types in EU. A
similar conclusion is reached in EA, where leafy type accessions were used for oilseed
breeding (Sun et al. 2004). Oilseed B. rapa was selected from root or leafy
domesticated types in the Old World and EA (Reiner et al. 1995; Gómez-Campo and
Prakash 1999).
The other phenotypic traits, such as flowering time, self-compatibility and seed colour
were also distributed across SSR groups (Appendics: Supplementary Table S1). Semi-
winter type and spring types were distributed across three SSR groups, while winter
types were found only in EU in SSR group 1.
Self-incompatibility is a common problem in B. rapa accessions (Takayama and Isogai
2005). This is one of the major causes of heterozygosity and mixed phenotypes in B.
rapa breeding programs, and could negatively affect breeding progress in B. rapa. It is
also one of the reasons for the greater SSR allelic diversity in the A genome of B. rapa
59
over that found in the A genome of B. juncea (Chen et al. 2013), which is self-
compatible. Most B. rapa accessions were thought to have some level of self-
incompatibility except yellow sarson type (Prakash et al. 2012), and distinguishing high
and low level of self-incompatibility within B. rapa accessions is valuable information
for future breeding. In our study, a new criterion was used to separate poorly self-
compatible and moderate self-compatible lines. As a result, 46.8% of accessions were
self-incompatible with almost no seed-setting when protected from cross-pollination,
while self-compatible types had a few pods under selfing conditions.
Mixed seed colours in B. rapa may rise from out-crossing due to self-incompatibility
(Pino Del Carpio et al. 2011). Among the 16 accessions with mixed seed colours in this
study, two were from Canada (advanced cultivars), while the rest were from China,
from breeding programs where they were listed as “2007 new material”, “free cross
materials” or “double low type” (Appendics: Supplementary Table S1).
3.4.4 The A-genome of B. napus revealed in accession ZL07
Accession ZL07 is a Chinese accession originally derived from the intertribal cross
between B. napus (cv. Oro) and another crucifer Isatis indigotica through the successive
loss of C-genome chromosomes (Tu et al. 2010). The remaining A genome represents
the ancestral B. rapa genome used in the formation of B. napus. ZL07 showed a
flowering habit similar to winter type of B. rapa. In our study, ZL07 was located in SSR
group 2 but in the outer layer of 2D MDS graph of B. rapa (Figure 3.4). The parent B.
napus cv. Oro was a spring oilseed type from Germany. The A genome in ZL07,
derived from B. napus, will be valuable to compare with the A-genome in B. rapa,
which was recently sequenced (Wang et al. 2011a).
3.4.5 Centres of origin and diversity in B. rapa
Several lines of evidence, including (i) SSR grouping by STRUCTURE analysis, (ii)
SSR allelic diversity based on private and shared unique alleles, (iii) pairwise PhiPT
values from AMOVA analysis, and (iv) the presence of wild types mostly in EU and
WANA (also reported in Annisa et al. 2013a), support the theory that the centre of
origin of B. rapa is the classical Old World including EU and WANA as defined by
Zohary et al (2012), and this expands the centre of origin from strictly Europe as
proposed by Song et al (1990) and McGrath and Quiros (1992a). A recent study of SSR
60
diversity in a global collection of oilseed types of B. rapa resulted in three genetic
groups, including northern and southern Europe and SA (Annisa et al. 2013a), which
supports the Old World as a centre of origin of B. rapa.
The high rate of shared unique SSR alleles between SSR groups 1 and 2 suggests that
there has been a high level of migration between the Old World and EA (Figure 3.5,
Table 3.7). EA has high allelic diversity and represents at least one centre of diversity
and domestication, as proposed by Song et al (1988b). SSR group 3, which includes EA,
SA, CA and SEA, is relatively narrow in genetic diversity and represents a series of
isolated and differentiated populations formed along traditional trade routes (Prakash et
al. 2012).
The results also support the contention that AM accessions were migrants from the Old
World. Most AM accessions were assigned to SSR group 1, and were not
distinguishable from populations in EU and WANA by pairwise PhiPT values from
AMOVA analysis (Table 3.8), which is consistent with the reported breeding history in
the New World, especially in Canada (Warwick et al. 2008). Genetic relationships
between AM and EU-WANA based on shared unique SSR alleles, depicted in Figure
3.5, support the origin of AM accessions in the Old World. AU accessions were not
distinct from AM accessions and shared their relationship with EU and WANA by
pairwise PhiPT values from AMOVA analysis (Table 3.8), and are almost certainly
migrants to AU since colonial times.
3.5 Summary
Climate change is causing problems in crop production worldwide and sources of
genetic diversity are necessary to breed crops tolerant to heat, drought and more
frequent extreme weather (Turner and Meyer 2011). This study confirms that high SSR
allelic diversity exists in extant agricultural and wild types of B. rapa in genetic
resource collections. These accessions represent the centre of origin (the classical Old
World) and several centres of diversity of the species across Asia. Therefore B. rapa has
great potential for future genetic improvement of the major allotetraploid Brassica crop
species which share the A genome, namely B. napus and B. juncea. B. rapa may
contribute valuable new traits for Brassica breeding in a time of rapid climate change,
for improvements in drought (Guo et al. 2013) and heat (Annisa et al. 2013b) tolerance.


61
Chapter 4
4 Delayed water loss and temperature rise in
floral buds compared with leaves of Brassica
rapa L. subjected to a transient water stress
during reproductive development
Abstract:
Leaf canopy temperature has been proposed as a rapid selection tool for drought
tolerance among crop genotypes. However, floral bud temperature may be a better
indicator of drought tolerance than leaf temperature in grain crops. In this study, we
examined whether the floral bud and leaves of B. rapa had similar stomatal
characteristics and showed similar water loss during a drying cycle. We also compared
the leaf and bud temperatures when the plants were exposed to a 10-day transient water
stress during reproductive development that affected flower development, increased
flower abortion, increased pod abortion and reduced yield by an average of 85%. The
water loss by detached leaves and floral buds showed that the stomata on the leaves
closed before those of the floral buds as the leaf water potential decreased. Consistent
with the water loss studies, the temperature of the intact bud showed a delayed increase
during the drying process compared with the leaves. This suggested that floral bud
temperature could be a useful indicator of the water status of the reproductive organs of
B. rapa.
Key words: canopy temperature, cuticular transpiration, drought tolerance, leaf water
potential, stomatal characteristics, stomatal transpiration
62
4.1 Introduction
Drought stress is the major factor reducing crop production worldwide (Boyer 1982).
Furthermore, the predicted global warming and decrease or redistribution of rainfall
(Parmesan and Yohe 2003; CSIRO and Bureau of Meteorology 2010) will result in
increased water stress in many traditional crop production regions of the world,
particularly in semiarid regions (Turner and Meyer 2011). Therefore, the genetic
improvement of crops for drought tolerance has become urgent (Moffat 2002; Tester
and Langridge 2010). Water shortage affects a range of physiological and
morphological processes (Turner 1997). A decrease in leaf water potential reduces leaf
growth and stomatal conductance that in turn induces a decrease in photosynthesis and
dry matter accumulation. A reproductive phase water shortage can reduce flower
production, increase flower abortion, pod abortion and seed abortion in indeterminate
plants such as Lupinus angustifolius (lupin), Cicer arietinum (chickpea) and Brassica
species (French and Turner 1991; Leport et al. 2006; Ma et al. 2006), but can also
accelerate seed filling (Fang et al. 2010).
The Brassica family is renowned for its large diversity of species and its contribution to
the world’s vegetable and edible oil (mustard and canola oil) markets. Now widely
grown in a range of different environments, B. napus (mostly grown for canola) is
subjected to drought stress at various developmental stages. In rainfed Mediterranean-
type climates such as Australia and southern Europe, drought stress occurs primarily
during the reproductive stage when the number of pods and seeds is being determined
(Richards and Thurling 1978b; Ma et al. 2006; Ahmadi and Bahrani 2009). B. rapa
also suffered a significant yield loss as a result of a period of water deficit during
reproductive development (Richards 1978). Therefore, the reproductive stage is the key
stage for determining the responses and drought tolerance of Brassica plants to water
shortage.
Traditionally, breeding for yield or relative yield under drought has been the most
widespread method for the evaluation of differences in drought resistance among
genotypes, but this requires many years of evaluation in a range of environments (Blum
2011b). Self-incompatibility in many B. rapa cultivars further complicates the breeding
and selection process (Franklin-Tong and Franklin 2000; Takayama et al. 2000). A
number of physiological and morphological characteristics have been evaluated in other

63
crops to select for improved drought tolerance (Turner 1997). While these physiological
and morphological characteristics can be associated with yield and yield under water
stress conditions, they have not been widely adopted in breeding for drought tolerance
germplasm as some require destructive sampling, for instance, measurement of leaf
water potential, leaf turgor pressure and osmotic adjustment, and most are time-
consuming. These drawbacks limit the number of genotypes that can be assessed at one
time. However, higher canopy temperature has been associated with reduced yield
under drought in Brassica species, potato (Solanum tuberosum), and wheat (Triticum
aestivum), and provides a rapid screening tool for drought tolerance (Singh et al. 1985;
Stark et al. 1991; Rashid et al. 1999). Canopy temperature is measured remotely with an
infrared thermometer (González-Dugo et al. 2006) which can also be designed to
measure small objects, making it possible to quickly monitor the temperature of small
floral buds as well as a canopy of leaves as water stress develops.
The impact of a water deficit on floral organs, which are directly linked to seed
production, might be more relevant to understand the impact of drought on crop yield.
However, while the water relations and water loss by transpiration from leaves has been
widely studied, the water relations and water loss by the floral organs has been less well
studied, particularly in Brassica species (Edwards et al. 2012). In part, this is the result
of the difficulty of measuring the water relations, stomatal conductance or transpiration
of the floral organs. In cereals, the water relations of the floral organs have been studied
and shown to differ from those in the leaves. The detrimental effects of a decrease in
water relations occurred at a later stage in a drying cycle and at a lower water content in
floral tissues than in leaves, suggesting that the floral organs are protected from
decreasing soil water potentials (Morgan 1980; Westgate et al. 1996; Saini and
Westgate 1999; Powell et al. 2012).
The aims of this study were to (i) determine whether stomata on the buds were as
functional as on the leaves; (ii) determine if floral bud temperature, as a measure of
water loss by the bud, had a similar pattern to that of the leaves or whether the floral
buds had a delayed response to soil drying compared with the leaves when the plants
were subjected to a transient water deficit; and (iii) determine whether the leaf water
relations, the leaf stomatal conductance and the temperature of the leaves and floral
buds were related to the effects of a transient water deficit on seed yield.

64
4.2 Materials and methods
4.2.1 Plant growth and conditions
On 27 February 2011, an oilseed Brassica rapa (L.) accession (IB1109, spring, yellow
sarson type from India) was sown in a glasshouse at The University of Western
Australia, Crawley, Western Australia (31°57’ S, 115°47’ E) with an average relative
humidity (RH) of 65%, 22/16˚C day/night temperature and 635 µmol m-2 s-1
photosynthetically active radiation (PAR). The plants were then transferred to a
controlled environment room (CER) when the plants were about to flower (BBCH scale
57-58, (Lancashire et al. 1991) and all the measurements were taken within the CER.
The CER was set at 23/15˚C day/night temperature, 70% RH, and 425 µmol m-2 s-1 PAR
for a 16 h light period between 06.00 and 22.00 h.
Plastic pots (radius: 85 mm, height: 250 mm) with holes at the base to allow free
drainage of water were filled with a field soil with 50% clay, 22% silt, 27% sand, 1%
organic matter and a pH of 8.0. Filter paper was placed over the holes at the bottom of
each pot, which was filled with 6.0 kg of sieved soil mixed with 10 g of soluble nutrient
powder (Yates® Thrive, Yates NZ Ltd) with 27% nitrogen (N), 5.5% phosphorus (P),
9.0% potassium (K) and 0.22% S, 0.5% Mg, 0.18% Fe, 0.04% Mn, 0.02% Zn, 0.005%
B, 0.005% Cu, and 0.002% Mo. Before flowering, the same nutrient mixture and a 1%
calcium solution were sprayed on the leaves every second week. No fertilizer was
applied during the treatment period.
Nine seeds were sown in each of 8 pots containing soil that had previously been watered
to excess and then allowed to drain for 24 h before weighing to determine the field
capacity (FC). One hundred and fifty grams (15 mm thick) of plastic beads were placed
on the soil in each pot to reduce water loss by soil evaporation. The plants were thinned
to 5 seedlings per pot at 7 days after sowing (BBCH 10-11), and reduced to 2 plants per
pot 21 days later (BBCH 17-19). All pots were watered to bring the soil back to 100%
FC by weighing them every second day at first (before BBCH 50), and thereafter daily
until the two watering treatments were imposed when the first flower opened (BBCH
60): (i) half the pots were maintained well watered (WW) as controls by daily weighing
and watered to 100% FC until most pods reached maturity (BBCH 86-88); (ii) a
transient water stress (WS) treatment was imposed to the other four pots by cessation of

65
watering for a period of 10 days after which the pots were rewatered to 100% FC and
maintained well watered to maturity.
Thus the experimental design was two watering, WW and WS, treatments with four
replicates in each treatment. The two plants in each pot were used for two types of
measurements: one was used for the destructive measurements such as leaf water
potential (LWP) and for sampling leaves and floral buds, while the other plant per pot
was used for non-destructive measurements such as leaf conductance, leaf and bud
temperature, tagging and for the measurement of yield and yield components.
4.2.2 Leaf water potential (LWP) and soil water content (SWC)
A pressure chamber (Model 1000, PMS Instrument Company, Albany, OR, USA) was
used to measure the predawn (05.00 to 06.00 h, Australian Western Standard Time)
LWP of one fully-expanded leaf from one of the plants in each pot every second day
during the 10-day treatment period and on 2 days after rewatering. Precautions such as
slow pressurization were followed as recommended by Turner (Turner 1988b).
The weight of each pot in both treatments was measured between 07.00 to 08.00 h every
morning during the treatment period to determine the soil water content relative to 100%
FC. In the WW treatment, water was applied at about 09.00 h to bring the soil back to
100% FC.
4.2.3 Leaf conductance
The stomatal conductance of the leaves was measured between 08.00 h and 09.00 h
after weighing the pots and before re-watering the WW treatment. The two youngest
fully-expanded leaves per plant with good light exposure were chosen and tagged for
subsequent measurements. The conductance of both the adaxial and abaxial epidermes
was measured using a leaf porometer (Model SC-1, Decagon Devices, Pullman,
Washington, USA). The sum of the adaxial and abaxial conductances was used as the
measure of leaf conductance and the average conductance from two leaves per plant
was then taken as a replicate in the analysis.
66
4.2.4 Leaf and bud temperature
The leaf and bud temperatures were measured between 08.00 h and 09.00 h with an
infrared thermometer (Impac® Model IN 15 plus, LumaSense Technologies GmbH,
Santa Clara, CA, USA) with a minimum 2.2 mm diameter measurement area. Another
separate digital thermometer with a 1 s response time was used to measure the ambient
temperature. The leaf temperatures were measured on the same leaves that were used
for the measurement of leaf conductance, whilst two ready-to-open floral buds on a side
branch at similar canopy height to the leaves were measured for the bud temperature
measurements. The temperatures on the leaf and bud and the ambient temperature were
recorded simultaneously with four repeat measurements per leaf and bud. As these
measurements were made just prior to daily re-watering, the plants in the WW treatment
were returned to 100% FC shortly after measurement.
4.2.5 Observation of stomata in the epidermis on the leaf and bud
During the 10-day treatment period, leaf and bud samples from four replicate plants in
the WW control were taken from newly-watered plants around 09.00-10.00 h in the
morning. The adaxial and abaxial epidermis of the leaf and the abaxial surface of the
sepals of the unopened bud were brushed with transparent nail polish (butyl acetate,
ethyl acetate, nitrocellulose) and dried for 0.25-0.33 h. Forceps were used to carefully
remove the dried film from the epidermis, flatly placed on to a clean slide and observed
under a compound microscope (Model BH-2, Olympus, Tokyo, Japan), and the images
saved (Carl Zeiss, Oberkochen, Germany) for stomatal size measurements. An area near
the central vein of each leaf was chosen, the number of stomata observed under a
microscope at 40X magnification (field-of-view 0.06 mm2) counted and used to
compare the stomatal density on the leaf and bud epidermes. One leaf and two buds
were used to obtain 30 observations per replicate plant.
The size of each stoma was determined by measuring the length of the pore only (the
guard cell was not included), as shown in the black circle in Figure 4.1. Open stomata
with a clear pore were chosen to measure the size of ten stomata from each of 4
replicate plants.

67
Figure 4.1. Epidermal impressions of the leaf and floral bud (a: the adaxial epidermis of the leaf; b:
the abaxial epidermis of the leaf; c: the abaxial epidermis of the sepal of the closed floral bud) of B.
rapa plants at the flowering stage (scale bar = 5 µm). The arrow in the circle gives the length of the
stomatal pore.
4.2.6 Stomatal and cuticular transpiration
The stomatal and cuticular transpiration were measured simultaneously on an excised
leaf and unopened floral bud using two analytical balances (Model CP224S, Sartorius,
New York, NY, USA) by measuring their water loss after removal from the plants. A
leaf and a whole unopened floral bud were hung from a metal hook on each balance to
enable good ventilation during the course of measurement. The predawn LWP was
measured in the early morning, as above, and then the plants were moved close to the
balances and allowed to adapt to the environment for at least 0.5 h before cutting the
leaf or bud. Leaf size (length and width) and leaf conductance were measured before the
leaf was cut; the unopened buds were considered as a cone and the length and maximum
diameter measured before cutting for water loss measurements.
The first reading was taken within 60 s of cutting, and the weight of the leaf or bud was
recorded every 15-30 s for the first 0.5 h, and then at a reduced recording frequency, but
at regular intervals for 5 to 7 h. Fluorescent light (PAR = 12 µmol m-2 s-1) was provided
for the whole period. After 5-7 h of measurement, the leaf and bud samples were dried
in an oven at 70°C for 48 h and weighed. The water content was calculated as a
percentage of the difference between the initial and dry weight.
68
4.2.7 Flower tagging, flower and pod development, seed yield and yield components
All the flowers on the main stem that opened during the 10-day treatment period were
tagged and the date of flowering noted on the tag on one of the two plants per pot.
Podding was recorded on the tag once the pistil grew at least 5 mm longer than its initial
size. Flower abortion was calculated from the number of tags on which there was no
pod development recorded. Pod abortion was calculated where podding was recorded,
but no pod was present or the pod was empty at maturity.
During the treatment period, newly-opened flowers were collected from the main
branch between 11.30 h and 12.30 h every second day. Pollen viability was assessed by
observing pollen exuded from the tips of the anthers and stained using 1% acetocarmine
under a microscope (Model BH-2, Olympus, Tokyo, Japan). Smaller pollen grains with
light yellow colour were regarded as having lost viability, whilst bright orange ones
were considered viable. Two flowers from one plant were used to make two separate
slides per replicate, and three hundred pollen grains per slide were counted.
The plant in each pot that had been tagged and without any destructive measurements
was cut off at 30-35 mm above the soil surface two weeks after cessation of watering
(BBCH 89-91). Yield components were evaluated from individual tagged pods after
oven drying at 70°C for 72 h: seed number per pod, seed weight per pod, whole pod
length, total biomass and total seed yield.
4.2.8 Statistical analysis
Repeated values within a plant were averaged for each replicate plant. Differences
between the WS treatment and the WW control were analysed using the t test routine by
R software v2.14.0 (Hornik 2012). Regressions were fitted using Origin 7.5 (OriginLab,
Northampton, MA).
The two stages of water loss by the leaf and floral bud samples were determined based
on the water loss by the WW leaf samples, which showed two clear rates of water loss.
The time when the rate changed was determined based on the intersection point of the
two fitted regressions in a similar way as that described by Xu et al. (1995). The time
(1.3 h) when the rate changed in the WW leaf samples was then applied to the floral
buds and the WS leaves.
69
4.3 Results
4.3.1 Development of water deficits
During the 10-day treatment period, the soil water content (SWC) in the WW controls
remained above 60% FC (Figure 4.2a). The SWC in WS plants decreased rapidly to 50%
FC in 2 days after cessation of watering and to 5% FC after 10 days, but returned
rapidly to 85% FC at the end of the experimental period, 24 h after re-watering to 100%
FC (Figure 4.2a). The higher SWC after re-watering the plants in the WS treatment
compared to the WW controls (Figure 4.2a) reflects the lower leaf area and lower daily
water use of the WS-treated plants after re-watering. The predawn LWP in the WW
plants was maintained at -0.4 MPa throughout the experimental period, while the
predawn LWP in the WS treatment decreased to -1.4 MPa in 3 days and to -2.0 MPa
after 7 days without water, but rapidly recovered to -0.4 MPa within 2 days of re-
watering (Figure 4.2b). The predawn LWP was closely correlated (r2 = 0.91) with SWC
during the drying treatment. The leaf conductance of the WW plants averaged 200
mmol m-2 s-1 throughout the treatment period, but tended to decrease as the leaves aged
(Figure 4.2c). In the WS treatment, the stomatal conductance of the plants decreased to
25% of this value in the first 2 days after the water was withdrawn and then decreased
further to 13 µmol m-2 s-1 after 5 days without water and then remained at this low level
until re-watered when the conductance increased to that in the WW plants or even
higher (Figure 4.2c).
4.3.2 Effect of the transient water deficit on yield and yield components
The 10-day WS treatment reduced the mean aboveground biomass by 39% and the
mean seed yield by 85% compared to WW plants (Table 4.1). From the tagged main
stem of the WS plants, the seed yield was reduced by 92% compared to the WW control
and flower and pod abortion were nearly 6 and 4.5 times greater in the WS treatment
than WW plants, while seed number per pod, seed weight per pod, pod length and seed
size (100-seed weight) were reduced by 67%, 76%, 64% and 30%, respectively. Flower
abortion, pod abortion and seed abortion all played key roles in reducing the seed yield
under the transient water stress conditions.

70
Table 4.1. The seed yield, seed weight per pod, number of seeds per pod, weight per seed, pod
length, flower abortion, and pod abortion on the tagged main stem branches and the total seed yield
and aboveground biomass per plant of Brassica rapa in each pot in the well watered (WW) and
water stressed (WS) treatments. Values are the means ± one standard error of the mean (n=4).
Total seed yield (g)
Above-ground biomass
(g)
Main stem seed yield
(g)
Seed weight per
pod (g)
Seed number per pod
100-seed weight
(g)
Pod length (mm)
Flower abortion
(%)
Pod abortion
(%)
WW 8.8±0.8 33.5±0.7 2.7±0.3 0.07±0.01 15.3±1.9 0.46±0.01 71.4±5.1 8.1±0.8 4.9±1.1
WS 1.3±0.2 20.4±4.8 0.2±0.1 0.02±0.01 5.1±0.7 0.32±0.04 26.0±1.8 54.5±5.1 26.7±5.0
Figure 4.2. Change in soil water content (% of field capacity, FC) (a), predawn leaf water potential
(b), and leaf conductance (c) of B. rapa plants in the well watered (●, WW) treatment and the water
stressed (○,WS) treatment after water was withheld for 10 days and then rewatered (RW) when
indicated by the arrow. Values are the means ± one standard error (n=4) when larger than the symbol.

71
4.3.3 Effect of the water deficit on floral development and function
After 5 days of the WS treatment, the flower size was reduced (Figure 4.3). The length
and width of the petals in open flowers in the WS treatment were significantly reduced
by 24% and 27% after 4 days of treatment and 47% and 55% after 8 days of treatment,
respectively, compared with petals from the first day water was withheld (data not
shown).
On the contrary, the pollen viability of WS plants was not significantly reduced (P =
0.27) compared with that in the WW treatment (average 98%) at any time over the 10-
day treatment period (data not shown).
Figure 4.3. Newly-opened B. rapa flowers from the well watered (WW) control (a) and from the
water stressed (WS) treatment 5 days after water was withheld in the WS treatment (b), and the
partly dissected floral bud from the WS (upper) and WW (lower) treatments 5 days after water was
withheld in the WS treatment (c). Scale bar = 1 mm.
4.3.4 Transpiration and transpirational cooling of the leaf and bud
Stomata were observed to be present on the adaxial and abaxial epidermes of the leaf
and on the abaxial epidermis of the sepals of the unopened floral bud (Figure 4.1). The
stomatal frequency was greatest on the abaxial leaf epidermis followed by the abaxial
epidermis of the floral buds with the least frequency on the adaxial leaf epidermis
(Figure 4.4a). However, the size of the stomata on the floral bud was smaller (8.9 µm)
than on the leaf (13.4 µm), which had similar-sized stomata on both epidermes (P =
0.08) (Figure 4.4b).
We measured the water loss from the leaves and buds to determine whether the stomata
were functional. For WW plants (predawn LWP = -0.4 MPa and leaf conductance = 450

72
mmol m-2 s-1), water loss for both the leaf and bud had two stages and the WW leaf
sample was used to determine the time (1.3 h) at which the rate of water loss changed
and this time was applied to the other samples of leaves and floral buds (Figure 4.5a).
For the first 1.3 h after excision from the plants, water loss was rapid (11.0% h-1, r2 =
0.98) from the leaf, while the bud lost water at a slower rate (4.9% h-1, r2 = 0.98). This
suggests that the water loss by stomatal transpiration was lower in the bud than the leaf.
In the second stage (1.3 - 6.7 h) when most of the stomata were presumed to be closed,
both the leaf and bud started to lose water steadily at the same rate (2.4% h-1 in the leaf
and 2.2% h-1 in the bud, r2 = 0.98 and 0.99, respectively), suggesting that the cuticular
transpiration rate was similar in the bud and leaf. For slightly water stressed plants with
a lower leaf stomatal conductance (LWP = -0.5 MPa and leaf conductance about 160
mmol m-2 s-1) (Figure 4.5b), the rate of first-stage water loss in the leaf had declined to
5.6% h-1 (r2 = 1.00), while the water loss rate in the bud increased to 7.4% h-1 (r2 = 0.97);
the second stage rate of water loss in the leaf and bud were similar to those at higher
water potential (2.4% h-1 for the leaf and 1.8% h-1 for the bud, r2 = 0.99 and 0.96,
respectively).
Figure 4.4. Stomatal density (number of stomata per mm2) (a) and stomata length (b) on the
adaxial (ad) and abaxial (ab) epidermes of the leaves and abaxial epidermis of the sepals of the floral
buds of well watered B. rapa plants. Values are the means + one standard error of mean (n =4).
On the other hand, when the LWP reached -1.08 MPa and the stomatal conductance was
44 mmol m-2 s-1, the water loss from the leaf did not occur in two stages, and the rate
was 4.1% h-1 for the first 1.3 h and also for the remaining 4 h (r2 = 1.00) (Figure 4.5c),
indicating that the stomata were already closed or rapidly closed after excision of the
leaf. Nevertheless, at the same LWP, water loss by the bud occurred in two stages. The
water loss rate for the first 1.3 h was 5.5% h-1 (r2 = 0.99) and then 2.1% h-1 (r2 = 0.98)
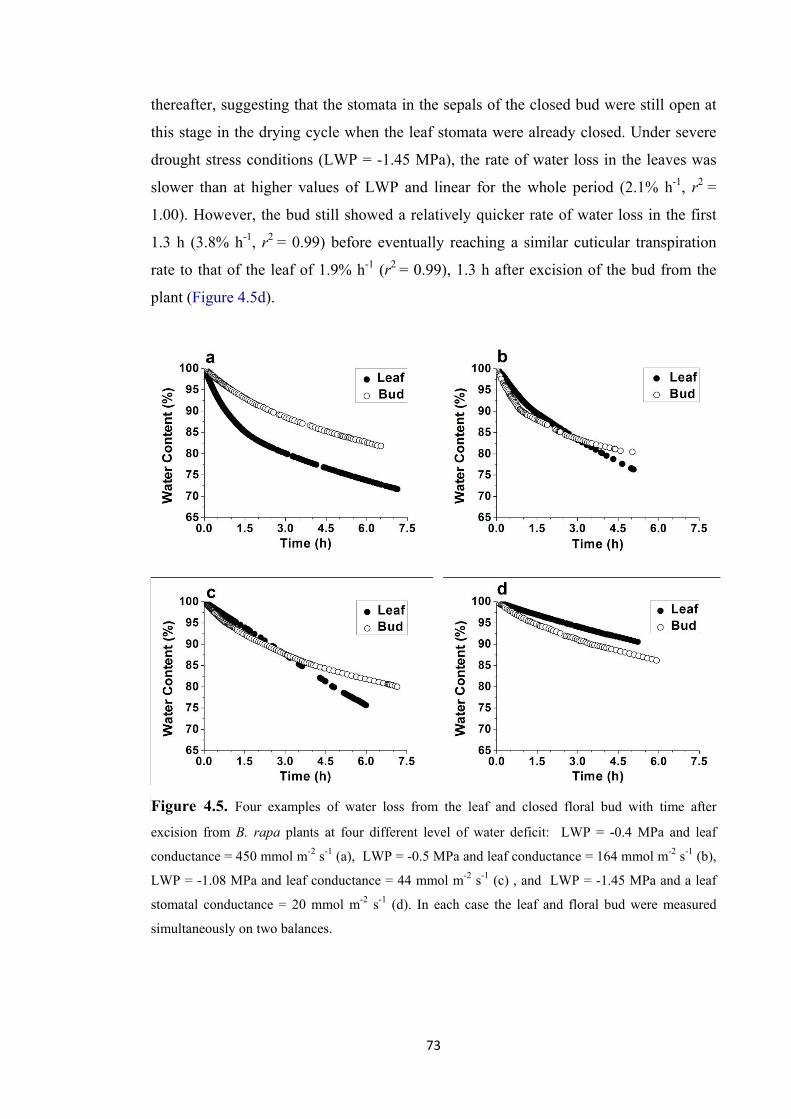
73
thereafter, suggesting that the stomata in the sepals of the closed bud were still open at
this stage in the drying cycle when the leaf stomata were already closed. Under severe
drought stress conditions (LWP = -1.45 MPa), the rate of water loss in the leaves was
slower than at higher values of LWP and linear for the whole period (2.1% h-1, r2 =
1.00). However, the bud still showed a relatively quicker rate of water loss in the first
1.3 h (3.8% h-1, r2 = 0.99) before eventually reaching a similar cuticular transpiration
rate to that of the leaf of 1.9% h-1 (r2 = 0.99), 1.3 h after excision of the bud from the
plant (Figure 4.5d).
Figure 4.5. Four examples of water loss from the leaf and closed floral bud with time after
excision from B. rapa plants at four different level of water deficit: LWP = -0.4 MPa and leaf
conductance = 450 mmol m-2 s-1 (a), LWP = -0.5 MPa and leaf conductance = 164 mmol m-2 s-1 (b),
LWP = -1.08 MPa and leaf conductance = 44 mmol m-2 s-1 (c) , and LWP = -1.45 MPa and a leaf
stomatal conductance = 20 mmol m-2 s-1 (d). In each case the leaf and floral bud were measured
simultaneously on two balances.

74
When all the data are summarised (Table 4.2), it is clear that during the first stage of
water loss after excision from the plant, the rate of water loss of the leaf was strongly
correlated with the initial leaf conductance (r2 = 0.89) and predawn LWP (r2 = 0.81),
indicating that the initial water loss rate is a good indicator of the leaf conductance.
However in the second stage of water loss, the rates of water loss from the leaf, but not
the bud, increased with decreasing LWP until the most severe water deficit, suggesting
that the stomata may not have closed completely when the leaf was losing turgor and
that the rate of second-stage water loss may not be a good indicator of cuticular
transpiration in the leaves. In the buds, the second-stage water loss was similar at all
levels of LWP, suggesting that the second-stage water loss is a good measure of
cuticular transpiration (Table 4.2).
Table 4.2. The normalised rates of water loss (initial value = 100%) of excised leaves and closed
floral buds from plants at eight different predawn leaf water potentials (LWP) and leaf conductances
(LC) as a result of soil drying to different soil water contents (SWC). The leaves and buds of each
sample were excised and measured simultaneously. Each sample is for one leaf and one bud, but
samples 1 and 2, 3 and 4, 5 and 6, and 7 and 8 represent the four levels of water stress shown in Fig.
4.5. Separate linear regressions were fitted to data in the first stage of water loss (first 1.3 h) and the
second stage of water loss (1.3-7 h).
No
LWP SWC LC Leaf Bud
(MPa) (%) (mmol m-2 s-1) First stage Second stage First stage Second stage
1 -0.40 >95 450 Y=-11.09x+99.4 Y=-2.36x+87.8 Y=-4.90x+99.9 Y=-2.24x+95.7
2 -0.45 >95 444 Y=-9.95x+96.7 Y=-3.06x+87.8 Y=-5.98x+99.5 Y=-2.36x+94.4
3 -0.50 65 165 Y=-5.55x+100.1 Y=-2.39x+95.1 Y=-7.42x+99.4 Y=-1.78x+92.4
4 -0.55 62 158 Y=-7.78x+100.1 Y=-3.73x+94.4 Y=-9.77x+99.4 Y=-2.32x+90.9
5 -1.08 36 44 Y=-4.14x+100.0 Y=-4.07x+99.8 Y=-5.50x+99.7 Y=-2.12x+94.4
6 -1.10 33 30 Y=-3.75x+99.9 Y=-2.11x+97.7 Y=-7.20x+99.7 Y=-2.45x+93.7
7 -1.30 26 39 Y=-2.61x+99.9 Y=-1.97x+99.2 Y=-6.40x+99.8 Y=-2.58x+94.5
8 -1.45 26 20 Y=-2.11x+99.3 Y=-1.72x+99.4 Y=-3.83x+99.9 Y=-1.91x+97.1

75
4.3.5 Leaf and bud temperatures
Based on the above observations, that the stomata in the buds as well as the leaves were
functioning and that the stomata in the bud remained active even when the stomata in
the leaves were closed, we measured the temperature of the leaves and buds to
determine if this was correlated with stomatal function in both organs. As the water
deficit increased, the leaf temperature differences [Tleaf-Tair]) increased from -4°C to -
2.5°C within 2 days and remained at this temperature for the remaining days before re-
watering (Figure 4.6a). There was a good relationship (r2 = 0.51) between the leaf
conductance and Tleaf-Tair. The floral bud temperature difference increased from -4°C to
-1.5°C in the first 4 days after water was withdrawn and remained at this value until the
plants were re-watered (Figure 4.6b).
Figure 4.6. Changes in the leaf (a) and closed floral bud (b) temperatures (relative to
the ambient temperature, Tleaf-Tair and Tbud-Tair) of B. rapa plants in the well-watered
(●, WW) treatment and water-stressed (○, WS) treatment after water was withheld for
10 days and then rewatered (RW) when indicated by the arrow. Values are the means ±
one standard error of mean (n=4) when larger than the symbol.
76
4.4 Discussion
Water deficit is a key factor limiting yield in B. rapa. A 10-day transient water deficit
during the reproductive stage caused flower distortion, reduced flower size, increased
flower abortion, pod abortion and seed abortion which decreased total seed yield by
85%. Of the 44 tagged main stem flowers produced in the WW plants, 41 produced a
pod with an average of 15 seeds per pod, but in the WS treatments only 11 pods
developed from 33 tagged flowers with an average of 5 seeds per pod and an average of
67% reduction of seed number per pod and 92% reduction in main stem seed yield.
Water stress is known to inhibit cell enlargement more than cell division and causes
morphological changes during plant development (Randall and Sinclair 1988). In the
present study, the size of the petals, both length and width, in the WS plants was
reduced to 47% and 55%, respectively, after 8 days of treatment.
While the pollen was equally viable in both WS and WW treatments, a water deficit
reduced the growth of the pistil (data not shown), suggesting that the major effect of the
water deficit was on pistil growth and function, pollen tube growth to the ovule, failure
of fertilization, or embryo abortion. All these post-pollination growth processes may
have been associated with flower abortion and caused the yield loss. The B. rapa
accession responded to the transient water shortage in a similar way to that in other
indeterminate species (Barnabás et al. 2008). The leaf stomata closed and leaf
temperature increased as the water deficit developed, presumably reducing leaf
photosynthesis and assimilate transfer to the developing pods and seeds (Kumar and
Singh 1998). It is difficult to measure the stomatal conductance of the floral parts of
plants as they are too small to measure with a porometer or gas exchange equipment.
We used the rate of water loss from the bud as an indicator of sepal stomatal
conductance. In our experiment, the stomata in the sepals surrounding the closed flower
bud in B. rapa were functional and closed at lower SWC than those in the leaf. Whether
this is because the water status of the bud is higher than the leaves, or the stomata
remain open at lower water potentials, is not clear and requires further investigation.
Excised plant samples have been used previously to investigate the rate of stomatal and
cuticular transpiration (Bengtson et al. 1978; Xu et al. 1995; Burghardt and Riederer
2003), but this previous work has mainly been with leaf samples and few have
measured the floral organs. While the present study has clearly shown that water loss by

77
the flower bud continued at a lower SWC and predawn LWP than the leaf, it is not clear
whether this contributed to the maintenance of pod and seed development in the B. rapa
accession.
Normally, after excision of the leaf, a two stage decrease in water loss is observed (Xu
et al. 1995): the first stage is interpreted as water loss through the stomata and the
second stage as water loss through the cuticle. In our experiment, the water loss rate
from leaves in the first stage was strongly correlated with the leaf conductance just prior
to excision (r2 = 0.89), indicating the stomata were open at the beginning and then
gradually closed during the drying cycle, which is one of the spontaneous responses of
active stomata as water content decreases. Once the water deficit of the leaf before
excision decreased, the leaf samples showed a consistent water loss rate of 4.1% h-1 for
the whole period, implying that most of the stomata in the leaf had already closed
before excision from the plant, which is the similar to results reported for tomato
(Lycopersicon esculentum) leaves (Xu et al. 1995). However, this was not the case with
the bud samples: at high predawn LWP, the buds had a two-stage drying cycle, but with
a lower rate of water loss, probably due to the lower density and smaller size of the
stomata on the abaxial epidermis of the closed floral bud. The size of stomata on the
abaxial bud epidermis was much smaller (33.6%) than in the leaf epidermis, but the
stomatal density on the bud was only slightly lower (15%) compared to the leaf abaxial
epidermis. The highest water loss rate in the floral bud was recorded under slightly
stressed conditions and stayed higher compared to leaf samples at all levels of water
deficit, indicating that the stomata in the buds were at least partially open and
functioning during drought stress, even under severe conditions.
Interestingly, the leaf samples had a higher rate of cuticular transpiration when the
plants were slightly or moderately stressed (Table 4.2). This phenomenon has been
observed in other species (tomato, Picea glauca and evergreen plants) (Xu et al. 1995;
Stowe et al. 2001; Burghardt and Riederer 2003), and is considered to be caused by cell
turgor recovery or osmotic adjustment. However, we did not observe a similar response
in the buds, in which the cuticular transpiration rate was low and relatively stable at all
values of predawn LWP. Nevertheless, the water loss curves show that the Brassica
plants exhibited a “self-adjustment” system, in which leaves were more susceptible
under drought stress and responded quickly by closing stomata to conserve water supply,
presumably to protect the reproductive organs and increase plant survival and seed
78
production; in contrast, stomata in the buds remained open even under severe drought
stress. We used the infrared thermometer to measure the water loss of the sepals of the
floral bud. The leaf-to-air temperature difference (Tleaf - Tair ) of the B. rapa leaves was
closely correlated with the leaf conductance (r2 = 0.51) and we assume that the
temperature difference of the bud is also closely correlated with its water vapour
conductance. The observed Tleaf - Tair of the leaf and bud both increased with time after
water was withheld, but at different rates. Leaf temperature increased faster than bud
temperature when water was withheld increasing rapidly after 2 days without water and
then was maintained at this temperature for the remaining 8 days, whereas a similar
increase in temperature occurred 2 days later in the buds and then became relatively
stable at this higher temperature (Figure 4.6). The increase of 2.5°C after 4 days in bud
temperature could indicate a threshold stress beyond which the floral organs were
affected by the water shortage.
Bud temperature can be measured quickly with the infrared thermometer and this may
be an efficient way to identify genotypes that delay the onset of water deficits in the
reproductive organs and assist in determining the drought tolerance of the genotype.
The use of bud temperature as a screening tool for drought tolerance in the reproductive
phase warrants further investigation with a wider range of germplasm.
In conclusion, the present study has shown that the stomata of leaves closed earlier into
a drying cycle than the stomata of buds, and this was corroborated by the delay in
increase in bud compared to leaf temperatures. This suggests that during drought in the
reproductive phase a “self-adjustment” mechanism of the floral parts exists that limits
the transpiration of the leaf and conserves the function of floral organs. Additionally,
the study has suggested that floral bud temperature may provide an indication of
drought stress in Brassica during reproductive development. Further testing of this
method in a range of genotypes would reveal its usefulness as a selection tool for
drought tolerance (grain yield under drought) in Brassica species.
79
Chapter 5
5 Genotypic variation for tolerance to
transient drought during the
reproductive phase of Brassica rapa
Abstract
Brassica rapa L. is a genetically-diverse parent species of the allotetraploid species,
oilseed rape (B. napus) and a potential source of drought tolerance for B. napus. We
examined the effect of a 13-day drought stress period during the early reproductive
phase, relative to a well-watered control, on subsequent growth and development in
nine accessions of B. rapa and one accession of B. juncea selected for their wide
morphological and genetic diversity. We measured leaf water potential, stomatal
conductance, water use, and leaf and bud temperatures during the stress period and
aboveground dry weight of total biomass at maturity. Dry weight of seeds and
reproductive tissue were not useful measures of drought tolerance in this study due to
self-incompatibility in B. rapa. The relative total biomass (used as the measure of
drought tolerance in this study) of the 10 accessions exposed to drought stress ranged
from 47 to 117% of the well-watered treatment, and was negatively correlated with leaf-
to-air and bud-to-air temperature difference when averaged across the 13-day stress
period. Two wild types (B. rapa ssp. sylvestris) accessions had higher relative total
biomass at maturity and cooler leaves and buds, than other types. We conclude that
considerable genotypic variation for drought tolerance exists in B. rapa and cooler
leaves and buds during a transient drought stress in the early reproductive phase may be
a useful screening tool for this drought tolerance.
Keywords: drought tolerance, biomass, bud temperature difference, leaf temperature
difference, soil water content, stomatal conductance
80
5.1 Introduction
Global climate change is expected to increase the frequency, intensity and length of
drought in many regions where oilseed rape (Brassica napus L., canola) is grown, such
as Australia (CSIRO and Bureau of Meteorology 2010). This poses a potential
challenge to meet the growing world demand for canola oil. B. napus is considered to be
more drought sensitive than B. juncea (Gunasekera et al. 2009), particularly if drought
occurs at anthesis (Richards and Thurling 1978b). B. napus is genetically vulnerable as
a result of its narrow genetic diversity following several bottlenecks during its breeding
history (Becker et al. 1995; Cowling 2007; Bus et al. 2011b). This relatively low
genetic diversity limits the possibility of finding drought tolerance genes within the
current B. napus gene pool. Therefore, identifying other sources of drought tolerant
Brassica germplasm has become urgent for oilseed rape breeding.
Among the cultivated Brassica species, B. rapa is renowned for its range of phenotypic
characteristics and wide genetic diversity (Zhao et al. 2005; Warwick et al. 2008;
Annisa et al. 2013a; Guo et al. 2014a). B. rapa is one of the parent species of the
allotetraploid B. napus. B. rapa is considered a valuable resource for genetic
improvement of B. napus (Qian et al. 2006; Chen et al. 2010), and is a potential source
of drought-tolerance genes in B. napus.
Traditionally, in grain crops, drought tolerant genotypes are identified in experiments,
which assess seed yield relative to well-watered controls (Richards and Thurling 1978b;
Blum 2011b). Additionally, yield components such as pod and seed number, flower and
pod abortion, biomass and water use efficiency are considered as alternative indicators
of drought tolerance as they are directly linked to plant growth and seed production
(Turner 1997; Blum 2011b; Bloomfield et al. 2014). However, self-incompatibility is a
natural characteristic, which prevents self-fertilization in many B. rapa accessions
(Takayama et al. 2000; Takayama and Isogai 2005). It is not present in B. napus, B.
juncea and certain types of B. rapa, such as yellow sarson, which are self-compatible
(SC) (Prakash et al, 2012). Several environmental factors such as high humidity
(Ockendon 1978), high temperature (Palloix et al. 1985; Wilkins and Thorogood 1992),
increased CO2 (Palloix et al. 1985), and the treatment of stigma with sodium chloride
(Fu et al. 1992) have been shown to overcome self-incompatibility. The partial
breakdown of self-incompatibility by drought stress in Crepis sancta (Cheptou et al.

81
2000) is considered to be the result of a selective process in the breeding system to
maintain seed production under water-limited conditions. Therefore, seed yield is not a
suitable measure of drought tolerance in self-incompatible species when plants are
isolated or without pollen flow from compatible genotypes.
Previous experiments in our group reported the self-incompatibility and genetic
diversity of a global collection of 340 accessions of B. rapa, including oilseed, turnip,
leafy vegetable and wild types, and we reported a range of self-incompatibility and self-
compatibility in this collection (Guo et al. 2014a). Therefore, we investigated various
physiological traits that may indicate drought tolerance, which were not reliant on grain
yield as the ultimate measure of drought tolerance in B. rapa (Guo et al. 2013).
Transpiration reduces the leaf temperature below air temperature, so that leaf-to-air
temperature difference (LTD) is an indirect measure of the instantaneous transpiration
rate (Reynolds et al. 2007; Costa et al. 2013). A robust negative association between
LTD and grain yield in water-limited environments has been established in rainfed
wheat (Reynolds et al. 2009) and LTD has been proposed as an efficient screening tool
to evaluate breeding populations of wheat for yield in drought-prone environments
(Blum et al. 1989; Olivares-Villegas et al. 2007).
The effect of drought stress on floral organs is directly linked to seed production, so
floral bud-to-air temperature difference (BTD) may be highly relevant as an indirect
measure of drought tolerance when water stress occurs during the reproductive period.
The previous research of Guo et al. (2013) showed a delayed increase in bud
temperature compared with leaf temperature suggesting that BTD during drought stress
may be a useful screening tool for drought tolerance in B. rapa during reproductive
development. Several environmental factors, such as net radiation, air temperature, and
wind speed affect the measurement of temperature in bud and leaf tissue (Maes and
Steppe 2012; Costa et al. 2013). Thus, consistent environmental conditions and
protocols need to be adopted to guarantee reliable phenotyping (Balota et al. 2008), and
therefore our studies on drought tolerance were conducted in a controlled environment
facility.
In this study, nine genetically-diverse B. rapa accessions and one B. juncea accession
were evaluated for their response to a 13-day drought-stress treatment during the early
reproductive stage. The degree of drought stress was measured by soil water content,
82
leaf stomatal conductance, leaf and floral bud temperatures, and total dry weight of
aboveground biomass at maturity, divided into reproductive (seed and pods) and non-
reproductive tissue, relative to a well-watered control. The major objectives of this
study were to: (i) evaluate variation in physiological, morphological, biomass and seed
yield responses of nine diverse B. rapa accessions and one B. juncea accession to a 13-
day water stress imposed during early reproductive development; (ii) measure LTD and
BTD of the ten accessions during the transient drought treatment compared with the
well-watered control; and (iii) determine whether total biomass or other yield-related
traits are associated with drought tolerance and with LTD and BTD during the drought
stress treatment.
This research follows a similar experiment on heat tolerance in B. rapa (Annisa et al.
2013b), in which heat stress was imposed without drought stress in a controlled
environment facility. The two studies shared six genotypes in common, and provided an
opportunity to compare tolerance to drought and heat stress in the same B. rapa
accessions, without confounding the two stresses, as typically occurs in field studies
(Jagadish et al. 2011).
5.2 Materials and Methods
5.2.1 Plant growth conditions
Nine B. rapa accessions were chosen for this study (Table 5.1) to represent the wide
genetic variation in the species based on previous genetic diversity results (Annisa et al.
2013a; Guo et al. 2014a). The accessions CR2300 and CR2355 (IPK collection, Guo et
al. 2014) were included because they were wild or weedy types (B. rapa L. ssp.
sylvestris (L.) Janch., referred to in the IPK collection as B. rapa L. subsp. oleifera (DC)
Metzg. var. silvestris (Lam.) Briggs) and showed wide genetic distances from cultivated
B. rapa (Guo et al. 2014a). One B. juncea accession was used as a control, as B. juncea
is putatively drought tolerant, with better water use efficiency (Gunasekera et al. 2009)
and osmoregulation in water-limited environments (Singh et al. 1985) than other
Brassica species. Of the 10 accessions, five were self-compatible (SC) and five were
partially self-incompatible (PI) (Table 5.1).

83
Table 5.1. The gene bank accession names, codes used in this publication, species, country of
origin, original name, plant morphotype and flowering habit of the five self-compatible (SC) and
five partial self-incompatible (PI) accessions used in the experiment.
Accession
namea
Codes in
text Species
Country of
origin Original name
Plant
morphotype
Flowering
habit
Control B. juncea
ATC95209 SC-1 B. juncea Pakistan CGN 6851 Oilseed Spring
Self-compatible B. rapa
ATC92037 SC-2 B. rapa India IB 1109 Oilseed Spring
111 SC-3 B. rapa Germany Yellow sarson Oilseed Spring
ATC92240 SC-4 B. rapa India 66-197-3 Oilseed Spring
ATC93034 SC-5 B. rapa Turkey TURKEY-1 Oilseed Semi-winter
Partially self-incompatible B. rapa
7F056 PI-1 B. rapa China Fu Ding bai cai Leafy Spring
ATC95217 PI-2 B rapa Indonesia Tsja Sin Leafy Spring
121 PI-3 B. rapa Germany CGN 7221 Oilseed Semi-winter
CR2300 PI-4 B. rapa ssp.
sylvestris Colombia 289745 Wild Spring
CR2355 PI-5 B. rapa ssp.
sylvestris UK 289800 Wild Spring
a More detailed information on source and passport data of the ten accessions is available in Annisa et al
(2013a) and Guo et al (2014).
All 10 accessions were grown in a glasshouse at The University of Western Australia,
Crawley, Western Australia (31°59’ S, 115°49’ E) between 15 April and 20 September
2011. Accessions were sown sequentially every two weeks so that all plants could be
placed in the growth room facilities during the transient drought stress period at
flowering, without overcrowding the facilities. Polyvinyl chloride pots, 75 mm diameter
and 400 mm height, were closed at the base with a cover with four holes to allow free
drainage of water. Soil was collected from the top 0.1 m of an arable field at Bindi
Bindi, Western Australia (30°62’ S, 116°47’ E), dried and sieved to remove stones and
particles greater than 2 mm. Filter paper was placed over the base of each pot, which
was filled with 7.5 kg of a mixture of four parts of the field soil (50% clay, 22% silt, 27%
84
sand and 1% organic matter) and one part potting mix (v/v) (Details available in section
3.2.1, Chapter 3). Prior to filling the pots, 5.0 g urea, 2.0 g potassium sulphate, 2.0 g
super phosphate, 0.8 g trace elements (S, Fe, Zn, Ca, Cu, Mn, B, Mg and Mo) and 4.0 g
sulphur were mixed per 7.5 kg soil, and after sowing, soluble nutrient powder (Yates®
Thrive, Yates NZ Ltd., Auckland, New Zealand) with 27% nitrogen (N), 5.5%
phosphorus (P), 9.0% potassium (K) and 0.22% S, 0.50% Mg, 0.18% Fe, 0.04% Mn,
0.02% Zn, 0.005% B, 0.005% Cu, and 0.002% Mo was applied to the soil as a solution
and a 1.0% calcium solution was sprayed on the leaves every 14 days except during the
treatment period.
Passport and morphological information on the ten accessions (Table 5.1) is available in
Annisa et al. (2013a) and Guo et al. (2014). Spring-type accessions did not require
vernalisation before flowering, while two semi-winter type accessions were subjected to
a period of vernalisation to ensure they would reach the flowering stage within an
acceptable period (Table 5.1). For non-vernalised accessions, five seeds of each
accession were sown directly into 400-mm deep pots that had previously been watered
with 2.20 L of water, the amount of water required to bring the soil to 100% field
capacity (FC), which is the water content 48 h after wetting the soil to free-water
drainage. The plants were thinned to one seedling per pot 21 days after sowing equating
to stages 17-18 on the BASF, Bayer, Ciba-Geigy, Hoechst (BBCH) scale (Lancashire et
al. 1991). For vernalised accessions, seeds were sown in small plastic pots (60 mm
diameter) in a constant temperature room [15°C, 240 µmol m-2 s-1 photosynthetically
active radiation (PAR) for 16 h between 06.00 and 22.00 h Australian Western Standard
Time (WST) for 14 days and then were vernalised at constant 4°C for 28 days in the
same constant temperature room before transplanting into the 400-mm deep pots.
All pots were watered to 100% FC by randomly weighing 5 pots per accession every
second day before flower buds developed (BBCH 50). The minimum soil water content
was 65% FC between watering times. The plants were kept in the glasshouse with an
average relative humidity of 72%, 23/17°C day/night temperature and 650 µmol m-2 s-1
PAR, and were transferred into a controlled environment room when the flower buds
were ready to open, but still closed (BBCH 57-58). The controlled temperature room
was set at 23/15°C day/night temperature, 70% relative humidity, 420 µmol m-2 s-1 PAR
for a 16 h light period between 06.00 and 22.00 h WST.
85
When the pots were moved into the controlled environment room, 140g of plastic beads
were placed on the soil surface of each pot (15 mm thick) to reduce evaporative water
loss from the soil surface. Two treatments were imposed from the first open flower (30-
59 days after sowing for non-vernalised and 66-87 days for vernalised accessions)
(BBCH 60): (i) plants in the well-watered (WW) treatment were watered daily at 08.00
h WST to 100% FC for 13 days, and then maintained near 100% FC to maturity; (ii)
plants in the water stress (WS) treatment were not watered for a period of 13 days, after
which the pots were rewatered to 100% FC and maintained near 100% FC to maturity.
There were twenty pots (one plant per pot) of each accession, with ten pots in each
water treatment (WS and WW). Within each water treatment, the pots were randomly
divided into two groups of five for different measurement purposes: group 1 was used
for destructive sampling and group 2 for non-destructive measurements, and for seed
yield and seed yield components at maturity. The four most uniform plants in each
group of five were selected for measurements. Measurements on group 1 plants
included soil water content (SWC) and predawn leaf water potential (LWP); while
measurements on group 2 included SWC, leaf stomatal conductance (LSC), leaf
temperature, closed floral bud temperature, and biomass (see below). Plants from group
1 were abandoned after measurements finished (end of flowering, BBCH 69), while
those in group 2 were kept until harvest at physiological maturity (pods fully ripe,
BBCH 89).
5.2.2 Flower and pod tagging
Fine cotton threads with paper labels were used to tag the flowers that opened during
the 13-day water treatment period, and different coloured threads were chosen for each
day. Tagging started from the first open flower until the end of the 13-day water
treatment period. All flowers on the main raceme and two uppermost side branches
were tagged when they opened on each day during the 13-day of treatment period.
Those pistils that grew at least 5 mm long within 3 days after the flower was tagged
were considered to have started pod development and the date was noted on the tag
(Figure 5.1 a-c). Pistils that did not grow, but turned yellow, were recorded as aborted
flowers (Figure 5.1 d-f). Pods that grew at least 5 mm in length but which did not
contain well-developed seeds at harvest were defined as aborted pods.

86
Figure 5.1. Demonstration of flowers and pistils of self-compatible B. rapa plants (SC-2)
subjected to the well-watered (WW) and transient water-stressed (WS) treatments:
(a) a freshly-opened flower in the WW treatment; (b) flower one day after opening in the WW
treatment with normal pistil growth; (c) flower 2 to 3 days after opening in the WW treatment with
pistil growth of at least 5 mm; (d) aborted flower with undeveloped pistil 2 to 3 days after opening in
the WS treatment; (e): three types of aborted pistils (flowers) from severe to less severe (from left to
right) in the WS treatment; (f) comparison of pistils considered as a pod (upper) or aborted (lower)
when recorded 3 days after flower opening. Scale bar = 1 mm.

87
5.2.3 Plant harvest and biomass records
Plants in group 2 were watered daily until 30-50% of pods were ripe (BBCH 83-85).
Plants were harvested two weeks later (harvest date varied from 96-114 days after
sowing for non-vernalised and 119-138 days after sowing for vernalised plants) by
cutting the plants 30 mm above the soil level. Plants were air dried in the laboratory
before all the tagged pods from the primary stem and the two side branches were
removed, and sorted by the date of tagging. The length of the tagged pods, and the
length of each silique and beak, was measured with a digital slide calliper. The number
of seeds in each pod was counted, and seeds and pod walls were weighed separately on
an analytical balance (Model CP224S, Sartorius, New York, NY, USA) after oven
drying at 70°C for at least 72 h. The number of side branches was recorded and the
remaining pods from other branches were harvested and measured. For each plant,
leaves and stems were separated into one bag to provide an estimate of non-
reproductive biomass, and pod and seed material into other bags for an estimate of
reproductive biomass, and all bags were placed in an oven and dried at 70°C for at least
72 h before weighing. Total biomass per plant was the sum of non-reproductive and
reproductive biomass. Relative biomass was the ratio of biomass in the WS and WW
treatment (WS/WW, %).
5.2.4 Leaf water potential (LWP) and soil water content (SWC)
A pressure chamber (Model 1000, PMS Instrument Company, Albany, OR, USA) was
used to measure the LWP at 05.00 to 06.00 h before the lights came on at 06.00 h WST
(hereafter called predawn LWP). One fully-expanded leaf per plant from group 1 plants
was measured every second day during the 13-day treatment period as well as 2 days
after rewatering. Precautions such as slow pressurization were followed as
recommended by Turner (1988b).
The weight of each pot in the WW and WS treatments was measured between 07.00 to
08.00 h WST every morning during the treatment period to determine the SWC and
daily water loss. In the WW treatment, water was applied to bring the soil back to 100%
FC.
88
5.2.5 Leaf stomatal conductance (LSC) and leaf and bud temperature
Prior to the measurement of LSC and leaf and floral bud temperature during the WS and
WW treatment, the plants were moved from the controlled environment room into the
air-conditioned annexe, where the air temperature was stable and air movement was less
than in the controlled environment room. The temperature in the annexe was 22 ± 0.2°C,
relative humidity was 50% and PAR was 6.2 µmol m-2 s-1. The plants were allowed to
adjust to the new conditions for at least 0.5 h; preliminary studies showed that the LSC
stabilised within 0.3 to 0.5 h.
The LSC was measured on the two youngest fully-expanded leaves per plant between
09.00 h and 11.00 h WST with a leaf porometer (Model SC-1, Decagon Devices,
Pullman, WA, USA) as described previously (Guo et al. 2013). The conductance of
both the adaxial and abaxial epidermis was measured and summed to give the LSC.
The leaf and closed floral bud temperatures were measured daily during the 13-day
treatment between 09.00 h and 11.00 h WST with an infrared thermometer (Impac®
Model IN 15 plus, LumaSense Technologies GmbH, Santa Clara, CA, USA) with a
minimum 2.2 mm diameter measurement area as described by Guo et al. (2013).
Another separate digital thermometer with a 1 s response time (Dick Smith Electronics
Ltd., New South Wales, Australia) was used to measure the ambient temperature.
Emissivity was set at 76 after calibration of the infrared thermometer to that measured
by a set of thermocouples attached to the leaves (Maes and Steppe 2012). The leaf
temperature was measured on the same leaves that were used for the measurement of
LSC, while two ready-to-open floral buds at similar canopy height to the leaves were
measured for bud temperature. The leaf and bud temperatures were the average of four
repeat measurements per leaf and per bud, and the ambient temperature was recorded at
the same time as each measurement. The difference between the leaf/bud and ambient
temperatures was used to calculate leaf-to-air temperature difference (LTD) and bud-to-
air temperature difference (BTD). LTD and BTD at 20% FC in the WS treatment were
estimated by interpolating between daily measurements of SWC which were above and
below 20% FC.
89
5.2.6 Data analysis
Repeated values within a plant were averaged for each plant, and four plants were
measured in each treatment. Differences between the WS treatment and the WW control
and the analysis of variance (ANOVA) within and among different accessions were
analysed using the t test and Tukey’s test routine by R software v2.14.0 (The R Project for
Statistical Computing, http://www.R-project.org). Correlation coefficients and regressions
were fitted using Origin 8.0 (OriginLab, Northampton, MA, USA), and the relative value
(WS value divided by WW value) for each trait was calculated before analysis.
Non-reproductive biomass excluded pod and seed weight from both tagged and side
branches. The rate of leaf temperature increase (LTR) and rate of bud temperature
increase (BTR) was determined by fitting a linear equation to the increase in
temperature after the plants reached the “threshold” SWC, that is, the SWC at which the
temperature began to increase following a relatively stable period at the beginning of
the WS treatment (indicated by arrows in Appendices: Supplementary Figure S2).
5.3 Results
5.3.1 Soil water and plant changes during the treatment period
During the 13-day treatment period, pots in the WW treatment were rewatered daily to
100% FC and the lowest daily SWC was 65% FC (Figure 1a). The SWC in the WS
treatment decreased rapidly during the first 3-4 days, but at a different rate in each
accession. For example, SWC in accession SC-2 decreased very rapidly and reached 20%
FC in 4 days compared with 8 days in accession SC-4 (Figure 1a). SC-2 experienced a
more rapid decrease in leaf water potential (LWP) and leaf stomatal conductance (LSC)
during the 13-day treatment in SC-2 compared with SC-4 (Figures 1b, 1c).
Table 5.2. Time (days after water was withheld) for the soil water content to reach 40 % field
capacity (FC), 20 % FC and 10 % FC in the ten Brassica accessions.
Accession Codes
Days after water was withheld to reach different soil water contents 40 % FC 20 % FC 10 % FC
SC-1 2 6 13 SC-2 2 4 7 SC-3 3 8 12 SC-4 4 8 12 SC-5 2 5 7 PI-1 2 4 7 PI-2 3 8 12 PI-3 3 6 8 PI-4 4 7 10 PI-5 6 9 12
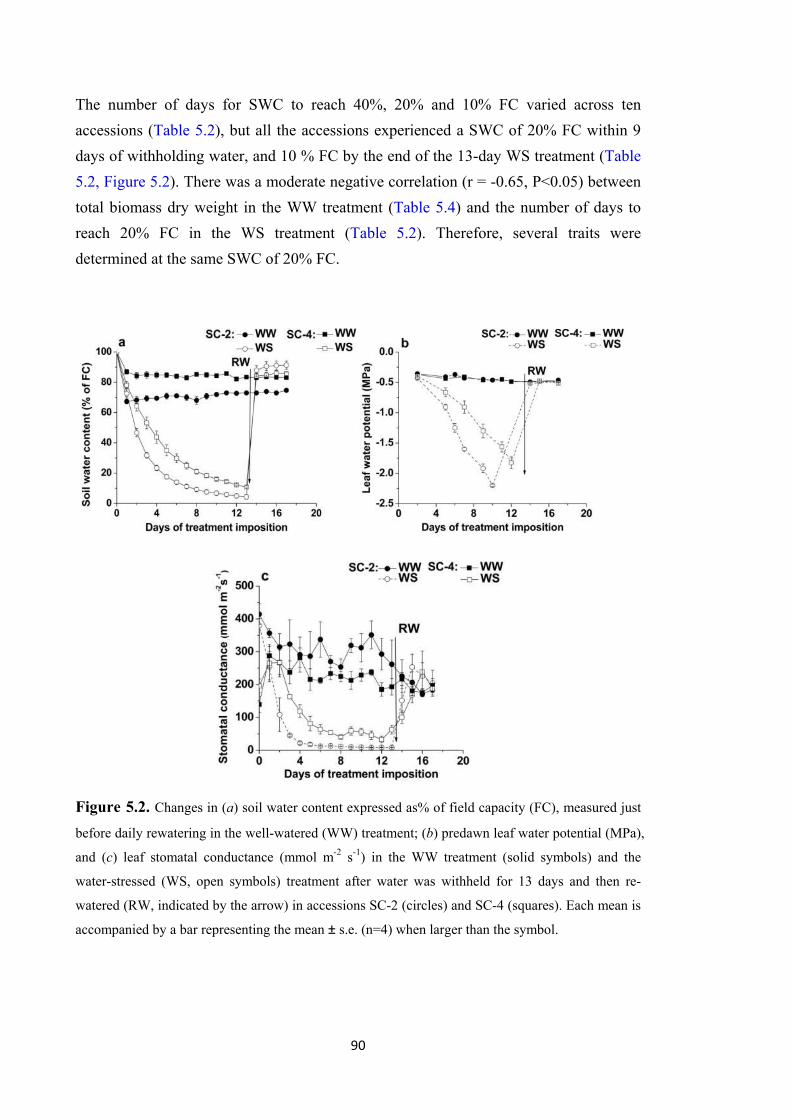
90
The number of days for SWC to reach 40%, 20% and 10% FC varied across ten
accessions (Table 5.2), but all the accessions experienced a SWC of 20% FC within 9
days of withholding water, and 10 % FC by the end of the 13-day WS treatment (Table
5.2, Figure 5.2). There was a moderate negative correlation (r = -0.65, P<0.05) between
total biomass dry weight in the WW treatment (Table 5.4) and the number of days to
reach 20% FC in the WS treatment (Table 5.2). Therefore, several traits were
determined at the same SWC of 20% FC.
Figure 5.2. Changes in (a) soil water content expressed as% of field capacity (FC), measured just
before daily rewatering in the well-watered (WW) treatment; (b) predawn leaf water potential (MPa),
and (c) leaf stomatal conductance (mmol m-2 s-1) in the WW treatment (solid symbols) and the
water-stressed (WS, open symbols) treatment after water was withheld for 13 days and then re-
watered (RW, indicated by the arrow) in accessions SC-2 (circles) and SC-4 (squares). Each mean is
accompanied by a bar representing the mean ± s.e. (n=4) when larger than the symbol.

91
5.3.2 Flower development and abortion
The total number of tagged flowers that opened on the main raceme and two side
branches during the 13-day treatment period ranged from 70 to 160 among different
accessions, and each accession had similar values in the WW and WS treatment (Figure
5.3). Flower abortion was significantly higher in the WS versus WW treatment in the
five SC accessions, but not in the five PI accessions (Figure 5.3).
There was a similar pattern of flower abortion rate among the SC accessions as the
SWC decreased during the WS treatment. Flower abortion rate increased rapidly when
the SWC fell below 20% FC (Figure 5.4, Table 5.3), independently of the number of
days to reach SWC 20% FC. Accession SC-4 reached SWC 20% FC 4 days later than
accession SC-2 (Figure 5.2), but flower abortion rate increased rapidly in both
accessions below SWC 20% FC (Figure 5.4).
Pod abortion (recorded at maturity) was much higher in PI than SC accessions in both
WW and WS treatments (Figure 5.3). In the SC accessions, the WS plants had higher
numbers of aborted pods than the respective WW plants (Figure 5.3).
Figure 5.3. The average number of mature pods, aborted pods or aborted flowers that formed from
tagged open flowers on the main raceme and the two uppermost side branches during the 13-day
water-stressed (WS) or well-watered (WW) treatments in ten Brassica accessions. Each flower was
tagged as it opened to track the result of pod development at each flower node. Flowers that failed to
develop a pod (at least 5 mm) 2 to 3 days after opening were defined as “aborted flowers”, pods that
failed to develop mature seeds were defined as “aborted pods”, while “mature pods” contained well
developed mature seeds at harvest.
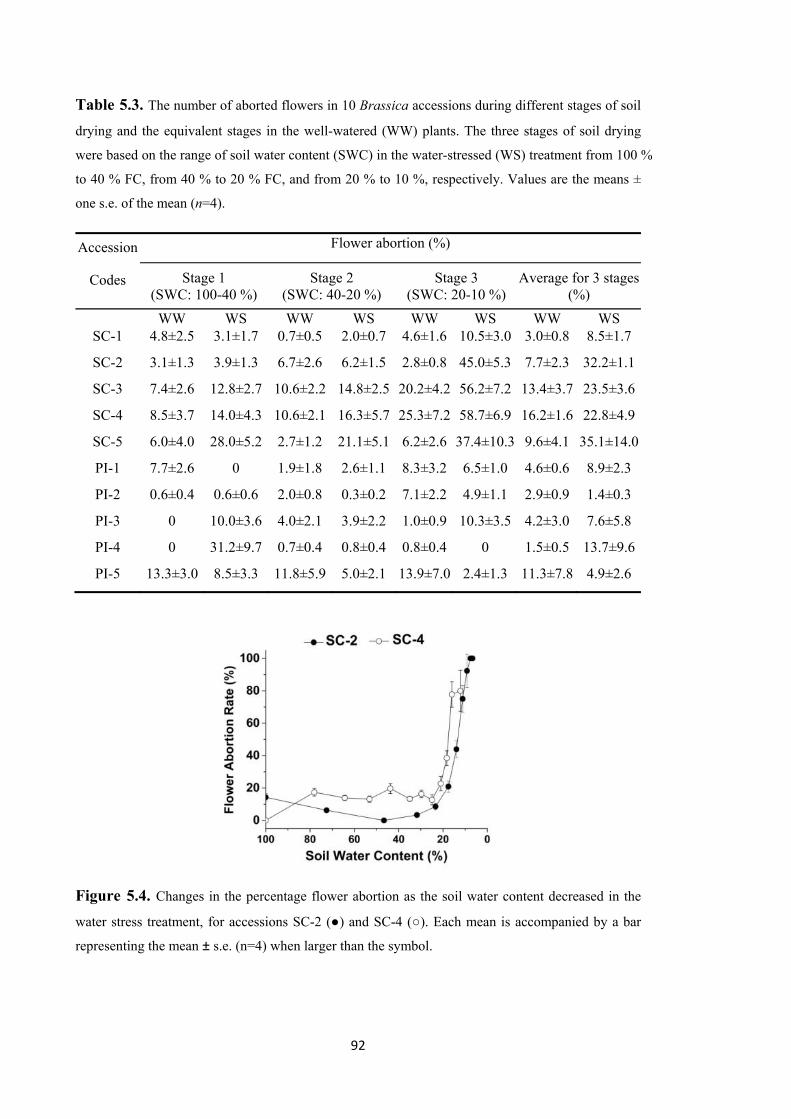
92
Table 5.3. The number of aborted flowers in 10 Brassica accessions during different stages of soil
drying and the equivalent stages in the well-watered (WW) plants. The three stages of soil drying
were based on the range of soil water content (SWC) in the water-stressed (WS) treatment from 100 %
to 40 % FC, from 40 % to 20 % FC, and from 20 % to 10 %, respectively. Values are the means ±
one s.e. of the mean (n=4).
Accession
Codes
Flower abortion (%)
Stage 1 (SWC: 100-40 %)
Stage 2 (SWC: 40-20 %)
Stage 3 (SWC: 20-10 %)
Average for 3 stages (%)
WW WS WW WS WW WS WW WS SC-1 4.8±2.5 3.1±1.7 0.7±0.5 2.0±0.7 4.6±1.6 10.5±3.0 3.0±0.8 8.5±1.7
SC-2 3.1±1.3 3.9±1.3 6.7±2.6 6.2±1.5 2.8±0.8 45.0±5.3 7.7±2.3 32.2±1.1
SC-3 7.4±2.6 12.8±2.7 10.6±2.2 14.8±2.5 20.2±4.2 56.2±7.2 13.4±3.7 23.5±3.6
SC-4 8.5±3.7 14.0±4.3 10.6±2.1 16.3±5.7 25.3±7.2 58.7±6.9 16.2±1.6 22.8±4.9
SC-5 6.0±4.0 28.0±5.2 2.7±1.2 21.1±5.1 6.2±2.6 37.4±10.3 9.6±4.1 35.1±14.0
PI-1 7.7±2.6 0 1.9±1.8 2.6±1.1 8.3±3.2 6.5±1.0 4.6±0.6 8.9±2.3
PI-2 0.6±0.4 0.6±0.6 2.0±0.8 0.3±0.2 7.1±2.2 4.9±1.1 2.9±0.9 1.4±0.3
PI-3 0 10.0±3.6 4.0±2.1 3.9±2.2 1.0±0.9 10.3±3.5 4.2±3.0 7.6±5.8
PI-4 0 31.2±9.7 0.7±0.4 0.8±0.4 0.8±0.4 0 1.5±0.5 13.7±9.6
PI-5 13.3±3.0 8.5±3.3 11.8±5.9 5.0±2.1 13.9±7.0 2.4±1.3 11.3±7.8 4.9±2.6
Figure 5.4. Changes in the percentage flower abortion as the soil water content decreased in the
water stress treatment, for accessions SC-2 (●) and SC-4 (○). Each mean is accompanied by a bar
representing the mean ± s.e. (n=4) when larger than the symbol.

93
5.3.3 Biomass and seed yield components
5.3.3.1 Biomass and seed production in self-compatible (SC) and partially self-
incompatible (PI) accessions
The negative impact of PI on reproductive biomass and seed yield was clear: in the WW
control treatment, the average total seed yield and seed number per pod of the five SC
accessions was 11.3 g plant-1 and 17 seeds pod-1, respectively, but only 2.1 g plant-1 and
3 seeds pod-1 for the five PI accessions (Tables 5.4, 5.5; Figure 5.5).
Figure 5.5. Seed yield (a) and average number of seeds per pod (b) on the main raceme and the
two uppermost side branches during the 13-day water-stressed (WS) or well-watered (WW)
treatments in ten Brassica accessions. Each mean is accompanied by a bar representing one s.e.
above the mean (n=4).
The total aboveground biomass in the WW treatment varied from 20 to 82 g plant-1
among accessions, whereas reproductive tissue varied from 1 to 40 g plant-1, which
reflected the lower seed yields in PI accessions compared with SC accessions (Table
5.4). The 13-day drought treatment had a major impact on the total aboveground
biomass, reducing it significantly in 4 of the 10 accessions, including both SC and PI
accessions (Table 5.4). The non-reproductive biomass was reduced significantly in 3
accessions (Table 5.4). The relative values (WS/WW, %) for these traits ranged widely,
and two accessions of B. rapa ssp. sylvestris with naturally very low seed yield due to
PI suffered decrease in relative total biomass following drought stress (Table 5.4).

94
5.3.3.2 Silique and beak length
The length of the silique was significantly reduced in the WS treatment compared with
the WW treatment in three accessions (SC-1, SC-2, SC-3), while 6 accessions
experienced a significant reduction in the length of beak in the WS treatment, ranging
from 15 to 64% of the WW treatment (Figure 5.6a, Table 5.5).
Figure 5.6. Relative silique length (a) and relative beak length (b) of pods formed on the main
raceme and the two uppermost side branches during the 13-day water-stressed (WS) treatment in ten
Brassica accessions, expressed as a percentage of the well-watered (WW) treatment. Each mean is
accompanied by a bar representing one s.e. above the mean (n=4).
However, pods that were tagged on different days during the WW or WS treatment had
the same silique length, beak length, and number of seeds per pod whether measured on
the main raceme, branch 1 or branch 2 (as shown by accession SC-2 in Figure 5.7).
Drought stress affected all pods tagged on the same day equally, whether they were
formed on the main stem or branches.
5.3.3.3 Correlation between biomass and yield components
Across all ten accessions, there was a strong correlation between relative total biomass
(WS/WW, %) and relative non-reproductive biomass, but non-significant correlation
between relative non-reproductive biomass and reproductive biomass (Table 5.6).
Relative total biomass was only weakly correlated with total seed yield, and not
correlated with seed number per pod and seed size (Table 5.6). This reflects the large
impact of PI on seed production in B. rapa in the growth room, and supports the use of
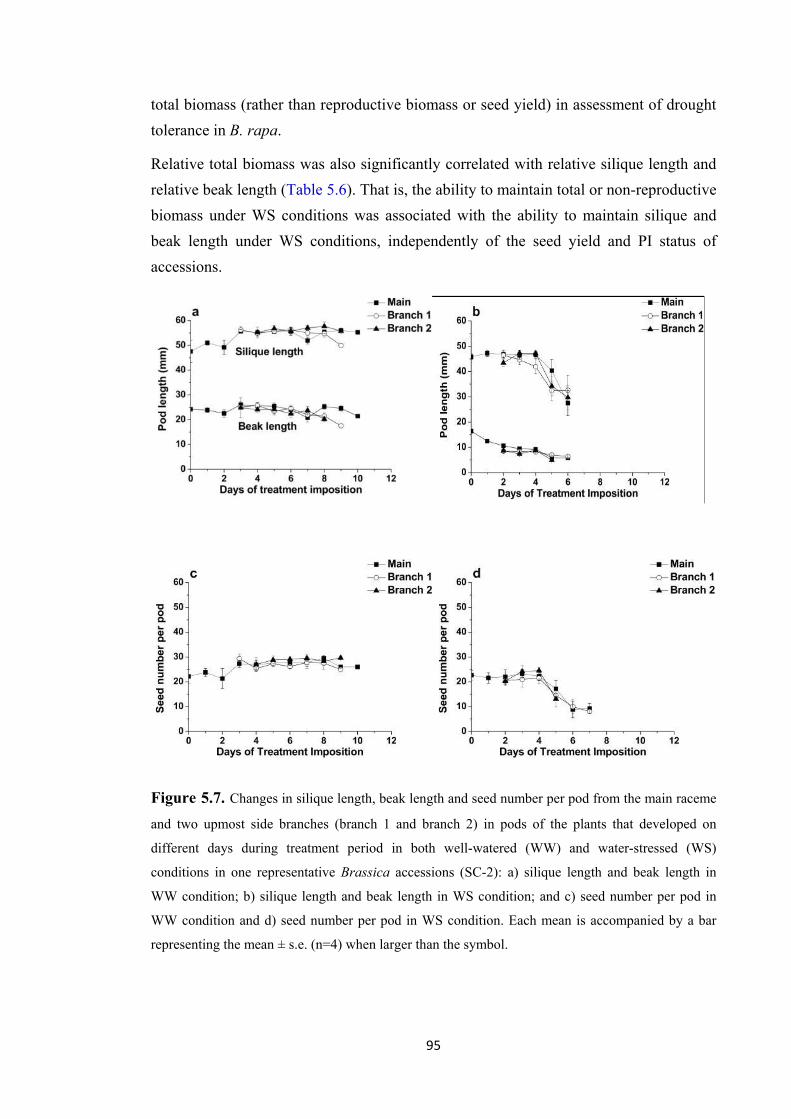
95
total biomass (rather than reproductive biomass or seed yield) in assessment of drought
tolerance in B. rapa.
Relative total biomass was also significantly correlated with relative silique length and
relative beak length (Table 5.6). That is, the ability to maintain total or non-reproductive
biomass under WS conditions was associated with the ability to maintain silique and
beak length under WS conditions, independently of the seed yield and PI status of
accessions.
Figure 5.7. Changes in silique length, beak length and seed number per pod from the main raceme
and two upmost side branches (branch 1 and branch 2) in pods of the plants that developed on
different days during treatment period in both well-watered (WW) and water-stressed (WS)
conditions in one representative Brassica accessions (SC-2): a) silique length and beak length in
WW condition; b) silique length and beak length in WS condition; and c) seed number per pod in
WW condition and d) seed number per pod in WS condition. Each mean is accompanied by a bar
representing the mean ± s.e. (n=4) when larger than the symbol.

96
5.3.4 Leaf-to-air and bud-to-air temperature differences
5.3.4.1 Leaf and bud temperature responses to decreasing soil water content
At the beginning of the 13-day WS period, LTD and BTD remained strongly negative
as SWC decreased, until a “threshold” SWC was reached, after which LTD and BTD
became less negative (Figure 5.8 and Appendices: Supplementary Figure S2). The mean
threshold SWC at which the bud temperatures began to increase was 51% ± 5% FC
averaged across the 10 accessions, whereas the threshold SWC at which leaf
temperatures began to increase was 68 ± 2% FC (Table 5.7).
At the end of the 13-day WS treatment, LTD and BTD of all accessions remained
negative, but varied among accessions. Bud temperature in accession PI-5 was 1- 2˚C
cooler than most other accessions, and leaf temperature in accession SC-4 was 1 - 1.5˚C
cooler than most other accessions (Figure 5.8, Appendices: Supplementary Figure S2).
Average leaf and bud temperatures during the 13-day drought treatment were warmer
(less negative LTD and BTD) in the WS than the WW treatment (Figure 5.9). At SWC
20% FC, accessions SC-1 and PI-2 had the warmest leaves and buds, whereas PI-5 had
the coolest buds (Figure 5.9).
The rate of increase in temperature of the leaf (LTR) and bud (BTR) after the threshold
SWC varied from 0.028 to 0.044 °C % FC-1 in the leaves and 0.037 to 0.085 °C % FC-1
in the buds (Table 5.7).
5.3.4.2 Correlation between leaf and bud temperature differences and relative biomass
There were significant negative correlations between relative total biomass
(WS/WW, %) and average LTD and BTD under WS conditions (Table 5.6). That is, the
relative total biomass of accessions in the WS relative to the WW treatment was higher
in accessions with cooler average leaf and bud temperatures during the WS treatment.
No significant correlations were found between LTD and BTD and relative reproductive
biomass, total seed yield, seed size or seed number, as a result of the interference of PI
in some of these accessions (Table 5.6).
The results at SWC 20% FC follow the same trends – accessions with high relative total
biomass at maturity tended to have cooler buds when the SWC reached 20% FC (Table
5.6) The mean rate of increase of the bud temperature after the threshold SWC in the
WS treatment (BTR_WS) was negatively correlated with relative seed number (r = -
0.69, P<0.05) and relative beak length (r = -0.88, P<0.001). That is, accessions which
had a rapid rise in bud temperature after the threshold SWC produced pods with shorter
beaks and fewer seeds.
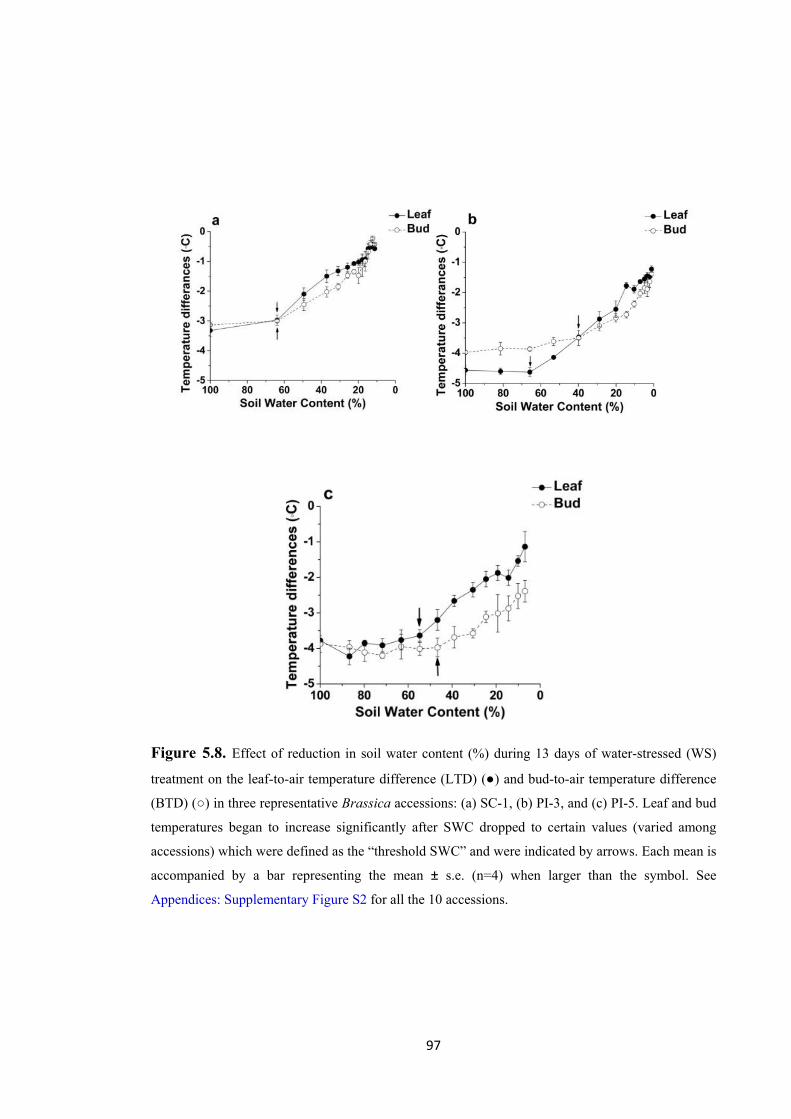
97
Figure 5.8. Effect of reduction in soil water content (%) during 13 days of water-stressed (WS)
treatment on the leaf-to-air temperature difference (LTD) (●) and bud-to-air temperature difference
(BTD) (○) in three representative Brassica accessions: (a) SC-1, (b) PI-3, and (c) PI-5. Leaf and bud
temperatures began to increase significantly after SWC dropped to certain values (varied among
accessions) which were defined as the “threshold SWC” and were indicated by arrows. Each mean is
accompanied by a bar representing the mean ± s.e. (n=4) when larger than the symbol. See
Appendices: Supplementary Figure S2 for all the 10 accessions.
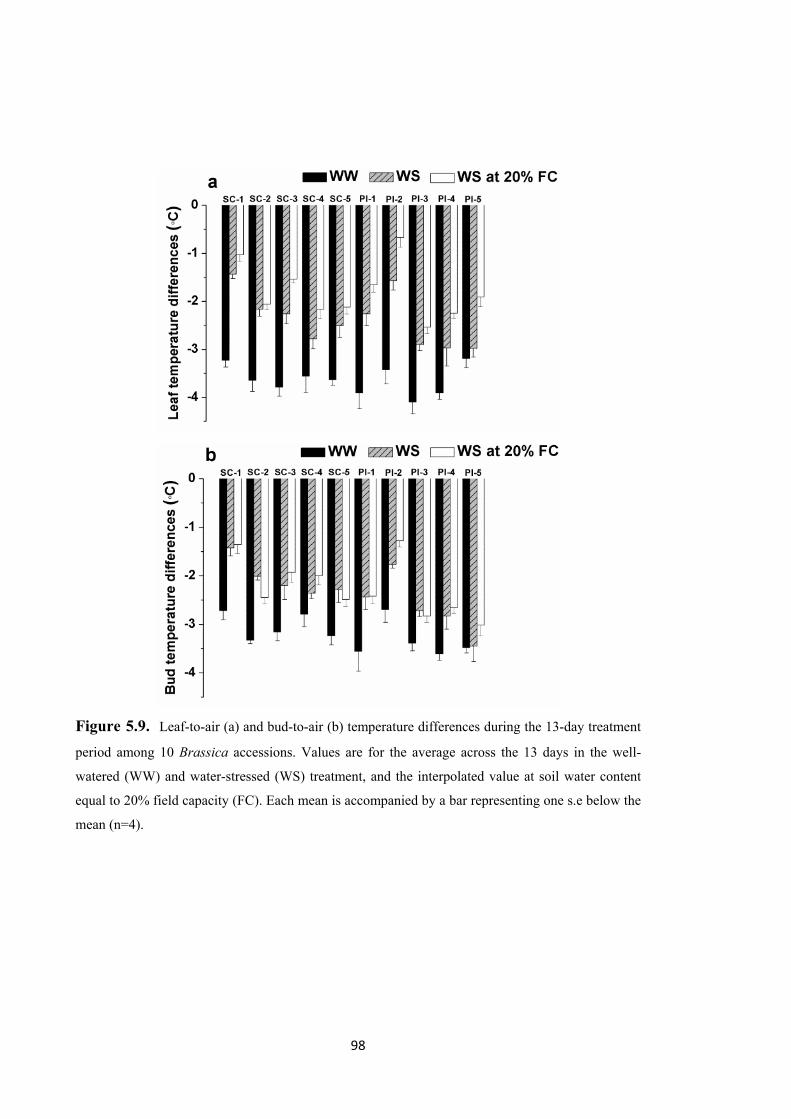
98
Figure 5.9. Leaf-to-air (a) and bud-to-air (b) temperature differences during the 13-day treatment
period among 10 Brassica accessions. Values are for the average across the 13 days in the well-
watered (WW) and water-stressed (WS) treatment, and the interpolated value at soil water content
equal to 20% field capacity (FC). Each mean is accompanied by a bar representing one s.e below the
mean (n=4).

99
Figure 5.10. B. rapa accession PI-5 in the water-stressed (WS) treatment (leaf) and in the well-
watered (WW) treatment (right) after 10 days of treatment when the soil water content was < 20%
FC.
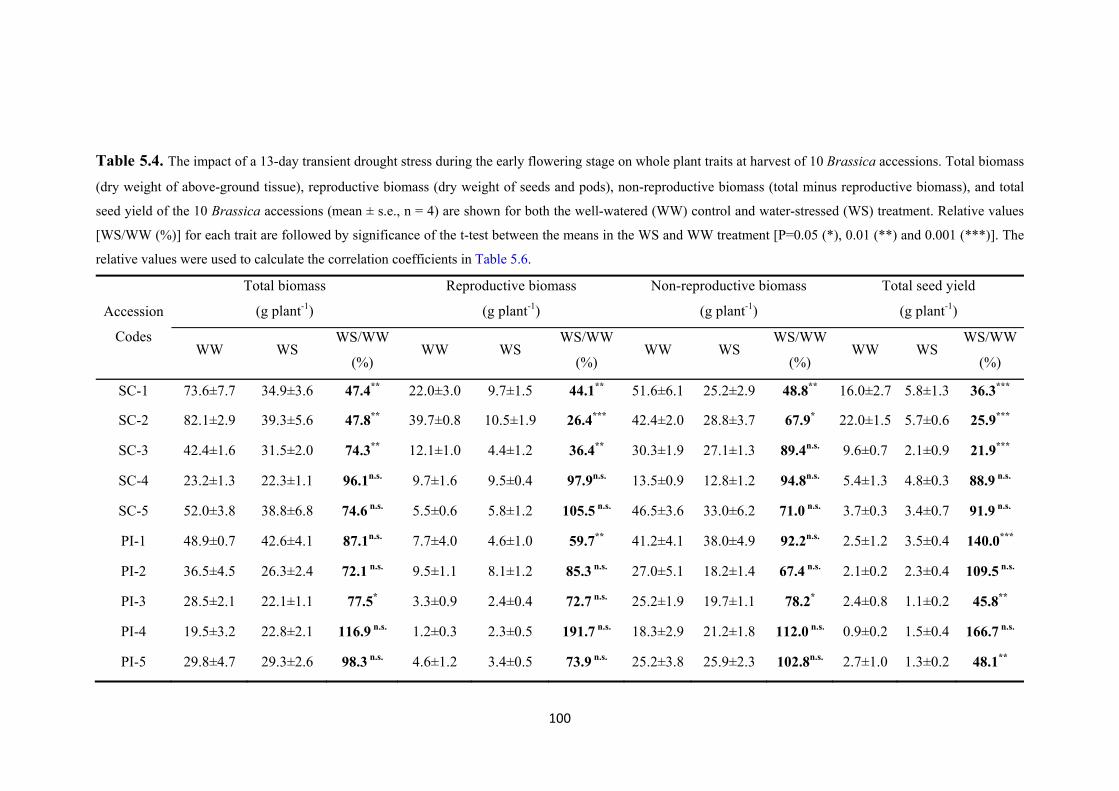
100
Table 5.4. The impact of a 13-day transient drought stress during the early flowering stage on whole plant traits at harvest of 10 Brassica accessions. Total biomass
(dry weight of above-ground tissue), reproductive biomass (dry weight of seeds and pods), non-reproductive biomass (total minus reproductive biomass), and total
seed yield of the 10 Brassica accessions (mean ± s.e., n = 4) are shown for both the well-watered (WW) control and water-stressed (WS) treatment. Relative values
[WS/WW (%)] for each trait are followed by significance of the t-test between the means in the WS and WW treatment [P=0.05 (*), 0.01 (**) and 0.001 (***)]. The
relative values were used to calculate the correlation coefficients in Table 5.6.
Accession
Codes
Total biomass
(g plant-1)
Reproductive biomass
(g plant-1)
Non-reproductive biomass
(g plant-1)
Total seed yield
(g plant-1)
WW WS WS/WW
(%) WW WS
WS/WW
(%) WW WS
WS/WW
(%) WW WS
WS/WW
(%)
SC-1 73.6±7.7 34.9±3.6 47.4** 22.0±3.0 9.7±1.5 44.1** 51.6±6.1 25.2±2.9 48.8** 16.0±2.7 5.8±1.3 36.3***
SC-2 82.1±2.9 39.3±5.6 47.8** 39.7±0.8 10.5±1.9 26.4*** 42.4±2.0 28.8±3.7 67.9* 22.0±1.5 5.7±0.6 25.9***
SC-3 42.4±1.6 31.5±2.0 74.3** 12.1±1.0 4.4±1.2 36.4** 30.3±1.9 27.1±1.3 89.4n.s. 9.6±0.7 2.1±0.9 21.9***
SC-4 23.2±1.3 22.3±1.1 96.1n.s. 9.7±1.6 9.5±0.4 97.9n.s. 13.5±0.9 12.8±1.2 94.8n.s. 5.4±1.3 4.8±0.3 88.9 n.s.
SC-5 52.0±3.8 38.8±6.8 74.6 n.s. 5.5±0.6 5.8±1.2 105.5 n.s. 46.5±3.6 33.0±6.2 71.0 n.s. 3.7±0.3 3.4±0.7 91.9 n.s.
PI-1 48.9±0.7 42.6±4.1 87.1n.s. 7.7±4.0 4.6±1.0 59.7** 41.2±4.1 38.0±4.9 92.2n.s. 2.5±1.2 3.5±0.4 140.0***
PI-2 36.5±4.5 26.3±2.4 72.1 n.s. 9.5±1.1 8.1±1.2 85.3 n.s. 27.0±5.1 18.2±1.4 67.4 n.s. 2.1±0.2 2.3±0.4 109.5 n.s.
PI-3 28.5±2.1 22.1±1.1 77.5* 3.3±0.9 2.4±0.4 72.7 n.s. 25.2±1.9 19.7±1.1 78.2* 2.4±0.8 1.1±0.2 45.8**
PI-4 19.5±3.2 22.8±2.1 116.9 n.s. 1.2±0.3 2.3±0.5 191.7 n.s. 18.3±2.9 21.2±1.8 112.0 n.s. 0.9±0.2 1.5±0.4 166.7 n.s.
PI-5 29.8±4.7 29.3±2.6 98.3 n.s. 4.6±1.2 3.4±0.5 73.9 n.s. 25.2±3.8 25.9±2.3 102.8n.s. 2.7±1.0 1.3±0.2 48.1**
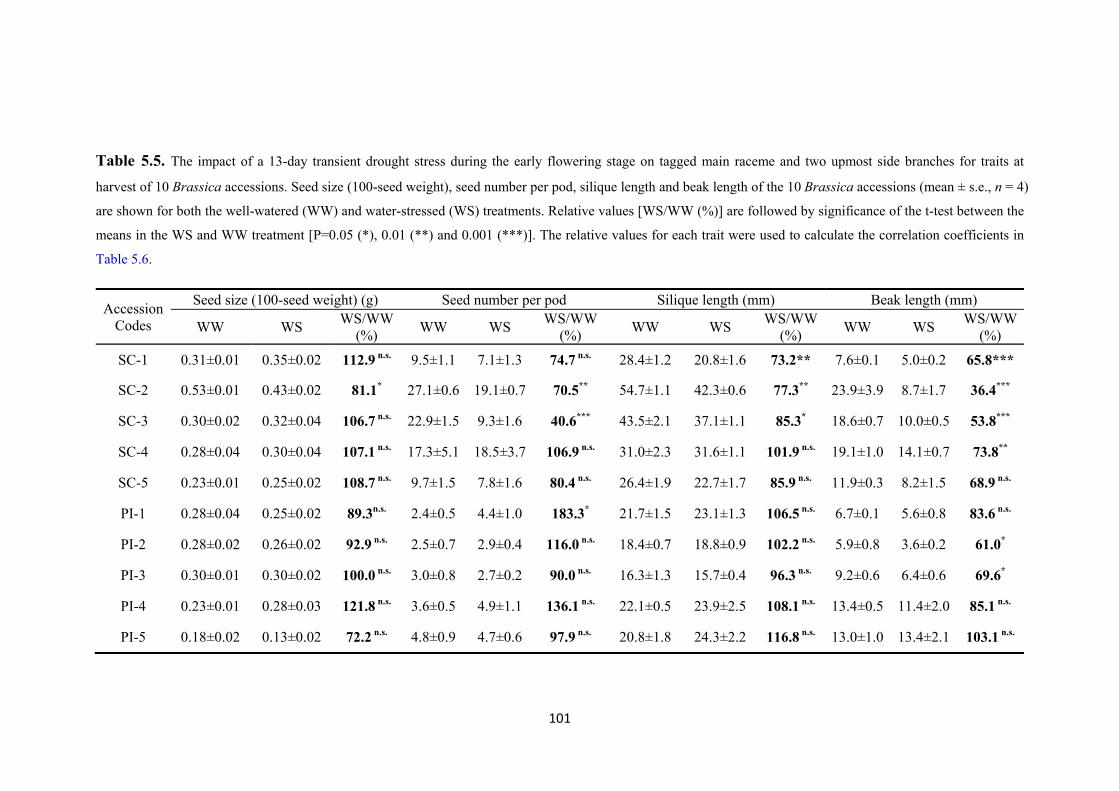
101
Table 5.5. The impact of a 13-day transient drought stress during the early flowering stage on tagged main raceme and two upmost side branches for traits at
harvest of 10 Brassica accessions. Seed size (100-seed weight), seed number per pod, silique length and beak length of the 10 Brassica accessions (mean ± s.e., n = 4)
are shown for both the well-watered (WW) and water-stressed (WS) treatments. Relative values [WS/WW (%)] are followed by significance of the t-test between the
means in the WS and WW treatment [P=0.05 (*), 0.01 (**) and 0.001 (***)]. The relative values for each trait were used to calculate the correlation coefficients in
Table 5.6.
Accession Codes
Seed size (100-seed weight) (g) Seed number per pod Silique length (mm) Beak length (mm)
WW WS WS/WW
(%) WW WS
WS/WW (%)
WW WS WS/WW
(%) WW WS
WS/WW (%)
SC-1 0.31±0.01 0.35±0.02 112.9 n.s. 9.5±1.1 7.1±1.3 74.7 n.s. 28.4±1.2 20.8±1.6 73.2** 7.6±0.1 5.0±0.2 65.8***
SC-2 0.53±0.01 0.43±0.02 81.1* 27.1±0.6 19.1±0.7 70.5** 54.7±1.1 42.3±0.6 77.3** 23.9±3.9 8.7±1.7 36.4***
SC-3 0.30±0.02 0.32±0.04 106.7 n.s. 22.9±1.5 9.3±1.6 40.6*** 43.5±2.1 37.1±1.1 85.3* 18.6±0.7 10.0±0.5 53.8***
SC-4 0.28±0.04 0.30±0.04 107.1 n.s. 17.3±5.1 18.5±3.7 106.9 n.s. 31.0±2.3 31.6±1.1 101.9 n.s. 19.1±1.0 14.1±0.7 73.8**
SC-5 0.23±0.01 0.25±0.02 108.7 n.s. 9.7±1.5 7.8±1.6 80.4 n.s. 26.4±1.9 22.7±1.7 85.9 n.s. 11.9±0.3 8.2±1.5 68.9 n.s.
PI-1 0.28±0.04 0.25±0.02 89.3n.s. 2.4±0.5 4.4±1.0 183.3* 21.7±1.5 23.1±1.3 106.5 n.s. 6.7±0.1 5.6±0.8 83.6 n.s.
PI-2 0.28±0.02 0.26±0.02 92.9 n.s. 2.5±0.7 2.9±0.4 116.0 n.s. 18.4±0.7 18.8±0.9 102.2 n.s. 5.9±0.8 3.6±0.2 61.0*
PI-3 0.30±0.01 0.30±0.02 100.0 n.s. 3.0±0.8 2.7±0.2 90.0 n.s. 16.3±1.3 15.7±0.4 96.3 n.s. 9.2±0.6 6.4±0.6 69.6*
PI-4 0.23±0.01 0.28±0.03 121.8 n.s. 3.6±0.5 4.9±1.1 136.1 n.s. 22.1±0.5 23.9±2.5 108.1 n.s. 13.4±0.5 11.4±2.0 85.1 n.s.
PI-5 0.18±0.02 0.13±0.02 72.2 n.s. 4.8±0.9 4.7±0.6 97.9 n.s. 20.8±1.8 24.3±2.2 116.8 n.s. 13.0±1.0 13.4±2.1 103.1 n.s.
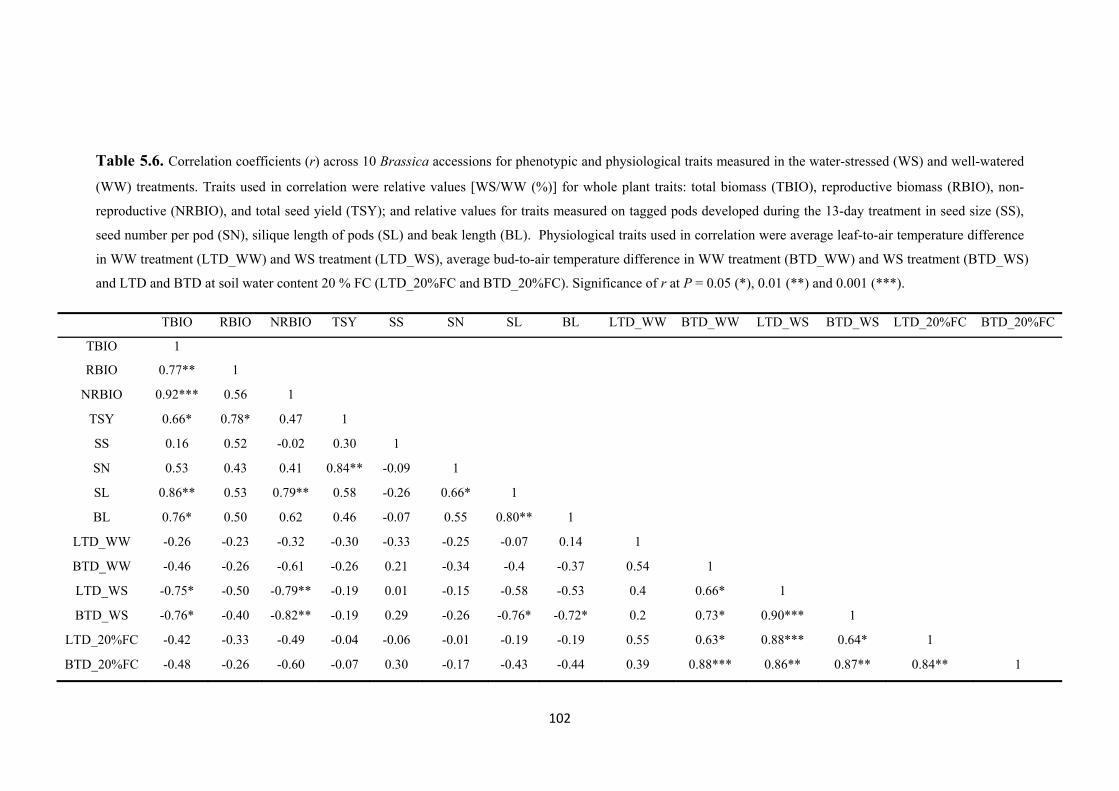
102
Table 5.6. Correlation coefficients (r) across 10 Brassica accessions for phenotypic and physiological traits measured in the water-stressed (WS) and well-watered
(WW) treatments. Traits used in correlation were relative values [WS/WW (%)] for whole plant traits: total biomass (TBIO), reproductive biomass (RBIO), non-
reproductive (NRBIO), and total seed yield (TSY); and relative values for traits measured on tagged pods developed during the 13-day treatment in seed size (SS),
seed number per pod (SN), silique length of pods (SL) and beak length (BL). Physiological traits used in correlation were average leaf-to-air temperature difference
in WW treatment (LTD_WW) and WS treatment (LTD_WS), average bud-to-air temperature difference in WW treatment (BTD_WW) and WS treatment (BTD_WS)
and LTD and BTD at soil water content 20 % FC (LTD_20%FC and BTD_20%FC). Significance of r at P = 0.05 (*), 0.01 (**) and 0.001 (***).
TBIO RBIO NRBIO TSY SS SN SL BL LTD_WW BTD_WW LTD_WS BTD_WS LTD_20%FC BTD_20%FC
TBIO 1
RBIO 0.77** 1
NRBIO 0.92*** 0.56 1
TSY 0.66* 0.78* 0.47 1
SS 0.16 0.52 -0.02 0.30 1
SN 0.53 0.43 0.41 0.84** -0.09 1
SL 0.86** 0.53 0.79** 0.58 -0.26 0.66* 1
BL 0.76* 0.50 0.62 0.46 -0.07 0.55 0.80** 1
LTD_WW -0.26 -0.23 -0.32 -0.30 -0.33 -0.25 -0.07 0.14 1
BTD_WW -0.46 -0.26 -0.61 -0.26 0.21 -0.34 -0.4 -0.37 0.54 1
LTD_WS -0.75* -0.50 -0.79** -0.19 0.01 -0.15 -0.58 -0.53 0.4 0.66* 1
BTD_WS -0.76* -0.40 -0.82** -0.19 0.29 -0.26 -0.76* -0.72* 0.2 0.73* 0.90*** 1
LTD_20%FC -0.42 -0.33 -0.49 -0.04 -0.06 -0.01 -0.19 -0.19 0.55 0.63* 0.88*** 0.64* 1
BTD_20%FC -0.48 -0.26 -0.60 -0.07 0.30 -0.17 -0.43 -0.44 0.39 0.88*** 0.86** 0.87** 0.84** 1
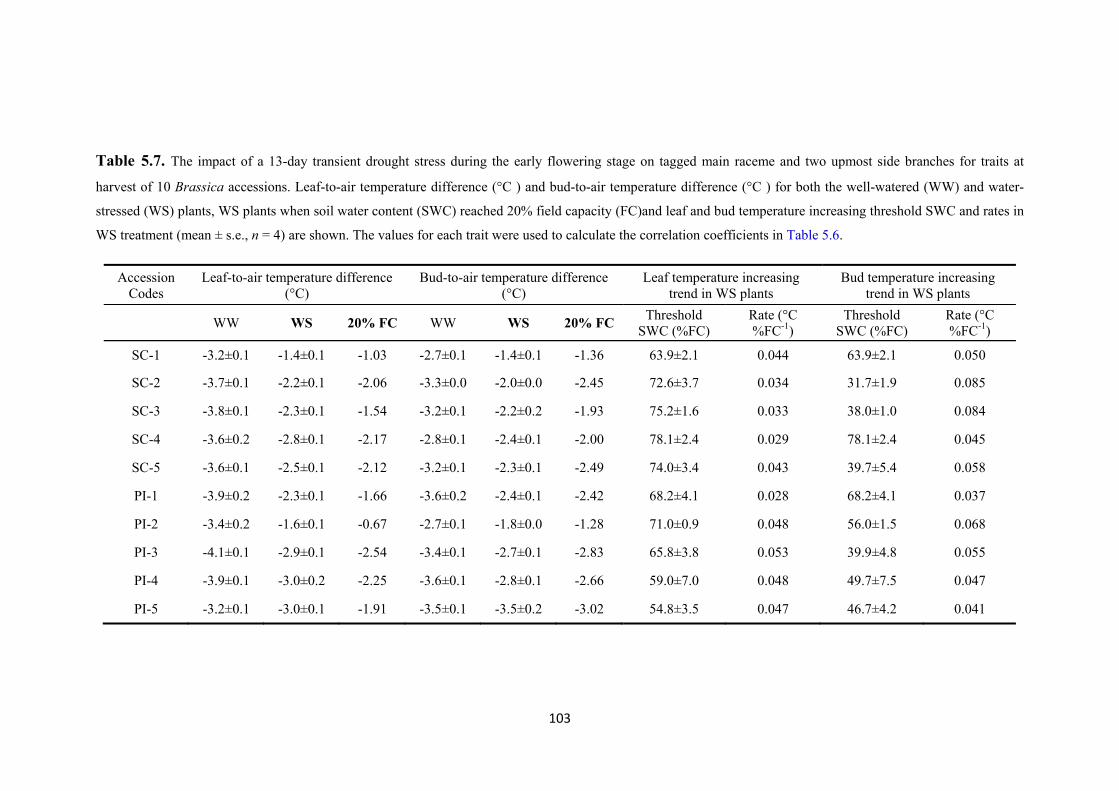
103
Table 5.7. The impact of a 13-day transient drought stress during the early flowering stage on tagged main raceme and two upmost side branches for traits at
harvest of 10 Brassica accessions. Leaf-to-air temperature difference (°C ) and bud-to-air temperature difference (°C ) for both the well-watered (WW) and water-
stressed (WS) plants, WS plants when soil water content (SWC) reached 20% field capacity (FC)and leaf and bud temperature increasing threshold SWC and rates in
WS treatment (mean ± s.e., n = 4) are shown. The values for each trait were used to calculate the correlation coefficients in Table 5.6.
Accession Codes
Leaf-to-air temperature difference (°C)
Bud-to-air temperature difference (°C)
Leaf temperature increasing trend in WS plants
Bud temperature increasing trend in WS plants
WW WS 20% FC WW WS 20% FC Threshold SWC (%FC)
Rate (°C %FC-1)
Threshold SWC (%FC)
Rate (°C %FC-1)
SC-1 -3.2±0.1 -1.4±0.1 -1.03 -2.7±0.1 -1.4±0.1 -1.36 63.9±2.1 0.044 63.9±2.1 0.050
SC-2 -3.7±0.1 -2.2±0.1 -2.06 -3.3±0.0 -2.0±0.0 -2.45 72.6±3.7 0.034 31.7±1.9 0.085
SC-3 -3.8±0.1 -2.3±0.1 -1.54 -3.2±0.1 -2.2±0.2 -1.93 75.2±1.6 0.033 38.0±1.0 0.084
SC-4 -3.6±0.2 -2.8±0.1 -2.17 -2.8±0.1 -2.4±0.1 -2.00 78.1±2.4 0.029 78.1±2.4 0.045
SC-5 -3.6±0.1 -2.5±0.1 -2.12 -3.2±0.1 -2.3±0.1 -2.49 74.0±3.4 0.043 39.7±5.4 0.058
PI-1 -3.9±0.2 -2.3±0.1 -1.66 -3.6±0.2 -2.4±0.1 -2.42 68.2±4.1 0.028 68.2±4.1 0.037
PI-2 -3.4±0.2 -1.6±0.1 -0.67 -2.7±0.1 -1.8±0.0 -1.28 71.0±0.9 0.048 56.0±1.5 0.068
PI-3 -4.1±0.1 -2.9±0.1 -2.54 -3.4±0.1 -2.7±0.1 -2.83 65.8±3.8 0.053 39.9±4.8 0.055
PI-4 -3.9±0.1 -3.0±0.2 -2.25 -3.6±0.1 -2.8±0.1 -2.66 59.0±7.0 0.048 49.7±7.5 0.047
PI-5 -3.2±0.1 -3.0±0.1 -1.91 -3.5±0.1 -3.5±0.2 -3.02 54.8±3.5 0.047 46.7±4.2 0.041
104
5.4 Discussion
Large genetic variation in relative total biomass (WS/WW, %) in mature plants was
demonstrated among nine B. rapa accessions and one B. juncea accession following a
13-day transient drought stress treatment imposed during the early reproductive stage.
Seed yield and dry weight of reproductive tissues were not valid measures of drought
tolerance due to partial self-incompatibility (PI) in some accessions. Therefore, we
focused on total biomass (Table 5.6) as a measure of drought tolerance in B. rapa,
because it relevant to leafy vegetable types, as well as the other diverse morphological
types in this study.
Variation in relative total biomass among ten accessions differentiated drought tolerant
from drought sensitive accessions. Four B. rapa accessions had a significant reduction
in total biomass in the WS relative to the WW treatment (Table 5.4), and two accessions
showed no loss or a small increase in total biomass relative to the WW treatment
(accessions PI-4 and PI-5, Table 5.4). On the basis of these results, drought tolerance in
B. rapa can be defined as the ability to maintain mature plant biomass following a
transient drought stress in the early reproductive phase.
However, the rate of decrease in SWC in pots varied across accessions, and was
associated with the total biomass of mature plants in the WW treatment. It is possible,
therefore, that some accessions experienced more severe drought stress during the 13-
day WS treatment than others. To explore this further, we compared leaf and bud
temperature difference (LTD and BTD) across ten accessions at the time when SWC
reached 20% FC, BTD at 20% FC showed moderate but not significant negative
correlation with relative total and non-reproductive biomass (Table 5.6). This negative
correlation between relative total biomass and BTD in the WS treatment (Table 5.6)
raised the potential for new screening methods to evaluate drought tolerance in larger
breeding populations of B. rapa. Similar correlations have been identified in other crops,
such as rice (Jones et al. 2009a) and wheat (Saint Pierre et al. 2010). In this study,
drought-tolerant accessions had cooler floral buds and maintained mature plant biomass
at low soil water content, with no loss in silique length, while sensitive accessions had
higher floral bud temperatures and reduced silique length. Accession PI-5 had the most
negative average BTD in the WS treatment (Figure 5.9), the most negative BTD at
SWC 20 % FC, and did not increase in bud temperature until SWC was below 50% FC
105
(Figure 5.8). It also showed little leaf desiccation and senescence even at the end of the
13-day WS treatment when the SWC was less than 10% FC (Figure 5.10). In contrast,
accessions SC-2 and PI-2 had the least negative average BTD and LTD in the WS
treatment (Figure 5.9) – that is, relatively warm buds and leaves – and suffered the
greatest loss in total biomass in the B. rapa accessions. Interestingly, the B. juncea
accession showed the greatest relative loss in biomass in the WS compared with the
WW treatment (Table 5.4), and had the warmest buds and leaves under WS conditions
(Figure 5.9).
The fact that relative total biomass at maturity was reduced in some accessions by
transient drought stress at the early flowering stage, was not expected in this study. This
suggests that transient drought stress in the field during flowering may have long-lasting
consequences on growth and development in drought-sensitive accessions, but not in
drought-tolerant accessions. While the mechanisms of tolerance to transient drought
stress during flowering are not fully understood, the flower buds may be a source of
systemic signals under drought stress that have long-term impacts on plant growth and
reproduction – such as a change in transcription factors as a result of the stress response
(Bloomfield et al. 2014).
The drought “sensitive” and “tolerant” accessions were from different molecular
marker-defined genetic groups in a global collection of B. rapa germplasm (Annisa et al.
2013a; Guo et al. 2014a), which is encouraging - it should be possible to find further
sources of drought tolerance in the global genetic resources of B. rapa following these
methods. Drought-sensitive types included an annual oilseed type (yellow sarson) from
India (SC-2), and a vegetable type from Indonesia (PI-2) (Annisa et al. 2013a).
Interestingly, PI-2 was also shown to be the most heat-tolerant of the accessions
evaluated in Annisa et al. (2013a), which demonstrates that heat and drought tolerance
are most likely under different genetic control, and supports the view that the two traits
should be evaluated separately under controlled conditions (Jagadish et al. 2011). In
Annisa et al. (2013a), heat tolerance was measured in the absence of drought stress, and
likewise, in the current study, drought tolerance was measured in the absence of heat
stress.
Generally, in drought screening experiments in grain crops, seed yield is the ultimate
indicator of drought tolerance (Boukerrou and Rasmusson 1990; Blum 2011b).

106
However, self-incompatibility is a complicating factor that prohibits the use of seed
yield in assessing drought tolerance in B. rapa in controlled environment rooms, where
there are low rates of cross-pollination and pollination by compatible pollen was not
practical. Both SC and PI accessions of B. rapa were included in this study to cover
wider diversity for genetic exploration, but these two groups differed in both absolute
and relative seed yield (Table 5.4, Figure 5.8). Cross-pollination and potential seed set
in PI accessions would be less of a problem under field conditions, where additional
pollinators and insect/wind would overcome the limitations of PI. Besides, there was no
correlation between relative total yield and relative seed number per pod or relative seed
size (Table 5.6), most likely as a result of the poor pod and seed set in the PI accessions.
Therefore, seed or pod production traits were not useful measures of drought tolerance
in this experiment.
Most recently, thermal imaging and leaf surface temperature have been proposed as new
screening tools for drought tolerance (Munns et al. 2010; Furbank and Tester 2011;
Araus and Cairns 2014). Similarly, we found that average both LTD and BTD under a
transient drought stress in the early flowering stage were negatively correlated with
relative total biomass in mature plants. It is possible that drought tolerant accessions
have efficient mechanisms to maintain cool bud temperatures at all levels of soil
moisture content. Drought tolerance was also associated with a lower threshold SWC
below which floral bud temperatures increased (Figure 5.8, Appendices: Supplementary
Figure S2), which follows the data presented in Guo et al (2013). These results
emphasise that the phenotype for drought tolerance in B. rapa is more related to
temperature control in reproductive tissue than in leaf tissue. In order to reliably use
such effects in screening for drought tolerance, controlled and consistent environmental
conditions are necessary (Costa et al. 2013).
A number of traits have been targeted for potential use in screening for drought
tolerance in large populations. As the major seed storage compartment, silique length is
an important yield-related trait in oilseed rape (Yang et al. 2012), and in this study
silique length was highly correlated with the relative total biomass and relative seed
number per pod (Table 5.6). Silique and beak length were both negatively correlated
with BTD under WS conditions (Table 5.6). Therefore, long silique and beak lengths
under WS relative to WW conditions are potentially valuable indicators of drought
tolerance in B. rapa.
107
Wild relatives or land races of crop plants may contain valuable genes for drought
tolerance which may be exploited through molecular breeding (Varshney et al. 2011).
Our results demonstrate the value of wild relatives as potential sources of drought
tolerance in B. rapa. The nine B. rapa accessions in these experiments were from
genetically-diverse backgrounds, as measured by molecular markers in previous
experiments (Guo et al. 2014a). Two oilseed yellow sarson accessions were identified
as the most drought sensitive, while the two weedy wild types of B. rapa ssp. sylvestris
were the most tolerant (PI-5, Figure 5.10). The “advanced backcross QTL analysis”
process of Tanksley and Nelson (1996) could be used to move QTLs for drought
tolerance from wild types to cultivated types. Genomic selection may reduce the amount
of “linkage drag” caused by linked negative alleles by eliminating linked genes during
the backcross process. This is an exciting result that demonstrates the potential value of
B. rapa genetic resource collections in oilseed rape breeding for drought tolerance. The
most heat tolerant accession (PI-2) in Annisa et al (2013b) was not drought tolerant in
this study, indicating that heat and drought tolerance are most likely controlled by
different genes, which will be important to consider in breeding for heat and drought
tolerance in oilseed rape.


108
Chapter 6
6Association between osmotic stress response at the seedling stage and
drought tolerance at the reproductive stage in Brassica rapa
Abstract
Biomass accumulation at the seedling stage is an important trait that is associated with
final yield, and ability to maintain seedling biomass under drought stress has been used
as a selection criterion for drought tolerance. Nine accessions of Brassica rapa varying
in drought tolerance at the reproductive stage, including two wild-type accessions, were
subjected to an osmotic stress to simulate drought by the addition of PEG 6000 at the 4-
5 true-leaf stage for 7 d. Shoot length, root length, fresh weight and dry weight of the 9
accessions were measured after the 7-d treatment period and the results compared
between the PEG 6000 and control treatments. Shoot length was significantly decreased
by simulated drought in all accessions. Fresh weight was significantly reduced by the
simulated drought treatment in 5 accessions, and dry weight was significantly reduced
in one accession and showed no loss or a significant increase in dry weight in two wild
type accessions PI-4 and PI-5. In Chapter 5, PI-4 and PI-5 also showed no loss of
relative total biomass following drought stress at the reproductive stage. There was a
significant correlation between relative non-reproductive and total biomass in water-
stressed and well-watered treatments in the reproductive stage (Chapter 5) and the
relative dry weight in osmotic stress versus control treatments in the seedling stage (r =
0.68, 0.01 < P ≤ 0.05). Accession PI-5 had the lowest seedling dry weight but PI-4 had
the highest dry weight under stress conditions.
Key words: early vigour, drought tolerance, drought resistance, genetic variation
109
6.1 Introduction
The warming and drying conditions associated with climate change pose significant
threats to oilseed production (Varshney et al. 2011). Collection and selection for
drought tolerance among current cultivars, landraces and wild relatives is the initial step
involved in an integrated approach to developing crops that are better adapted to
drought stress (Varshney et al. 2011). However, an efficient method of screening for
drought tolerance is required if large populations of candidate lines are to be screened.
Canopy temperature has been proposed as one method for screening a large number of
plants for drought tolerance in potato (Stark et al. 1991), wheat (Rashid et al. 1999;
Balota et al. 2007), rice (Turner et al. 1986) and Brassica species (Singh et al. 1985;
Guo et al. 2013). However, temperature measurements are difficult to apply to a large
number of genotypes in the field or glasshouse as they are easily affected by short-term
environmental fluctuations such as net radiation, air temperature, and wind speed
(Balota et al. 2008; Costa et al. 2013). Furthermore, use of temperature as an indicator
of drought tolerance in the reproductive tissues delays screening until after flowering,
which increases the time taken for evaluation.
In B. rapa, the existence of self-incompatibility complicates the measurement of seed
yield, so that Guo et al. (2014b) used relative total biomass as a measure of drought
tolerance, under water-stressed treatment relative to well-watered conditions.
Biomass accumulation at the seedling stage, which is referred to as seedling vigour or
early vigour, is a useful trait associated with final yield in various crops and applied into
drought tolerance evaluation, such as rice (Rebolledo et al. 2012; Rebolledo et al. 2013),
soybean (Bouslama and Schapauph 1984), wheat (Smith et al. 1993; Turner and Nicolas
1998; Botwright et al. 2002; Maydup et al. 2012; Pang et al. 2014). The benefits of
screening lines at the seedling stage include low cost, easy handling, a more consistent
stress level, and less time to remove susceptible genotypes (Rauf et al. 2008). Previous
research has focussed on early vigour as a useful screen prior to field evaluation for
drought tolerance, whereas Bouslama and Schapauph (1984) tested three techniques of
evaluating drought tolerance in soybean, including germinating seed in PEG, subjecting
seedlings to PEG for 14 d, and found that a hydroponic seedling test was more reliable
for comparing genotypes for stress during seed germination and early seedling growth.

110
Kato et al. (2008) concluded that PEG-treated hydroponic culture is very effective in
genetic analyses of drought tolerance at the seedling stage. Non-structural carbohydrates,
particularly starch, were relevant markers for early vigour (Rebolledo et al. 2012), and
shoot length (Zhang et al. 2005) and root length (Rauf et al. 2008) have both been
proposed as selection criteria for assessing drought tolerance at the seedling stage. In the
field, rapid growth during the vegetative phase with good early vigour can reduce soil
evaporation, accelerate root access to soil water and nitrogen as well as reduce
competition with weeds (Zhao et al. 2006). However, better early vigour may also
accelerate depletion of soil water reserves, making less water available for later stages
of the crop (Zhang et al. 2005) so that early vigour is more beneficial when crops are
grown on current rainfall and not where crops are grown on stored soil moisture (Turner
1997).
In order to be effective, measures of drought tolerance in the seedling stage should be
associated with drought tolerance in adult plants. Drought tolerance at the seedling
stage was reported to be weakly associated with tolerance during the reproductive phase
in rice (Moradi and Ismail 2007). However, Cakir et al. (2004) concluded, based on a
three-year field trial in maize, that the impact of water stress during vegetative growth
was related to the impact of water stress in the reproductive phase. In Brassica species,
Hatzig et al. (2014) developed an in vitro system based on PEG 6000 solution to screen
for drought tolerance in B. napus at the seedling stage and showed that shoot fresh and
dry weight were consistently associated with the level of drought tolerance observed in
previous field trails (Hohmann et al. 2014, unpublished). Some important drought
related hormones such as abscisic acid (ABA) and proline were found to be
significantly higher in drought-sensitive lines compared to drought-tolerant lines,
indicating that there are consistent metabolic and physiological responses that can
distinguish drought-tolerant from drought-sensitive lines (Guo et al. 2009). The newly-
developed in vitro system by Hatzig et al. (2014) in B. napus may also be applicable for
evaluating drought tolerance in B. rapa.
Guo et al. (2014b) tested the drought responses of B. rapa during the reproductive
phase and demonstrated that there was genetic variation in relative total biomass
following a transient drought stress period during the early flowering stage. Several
drought-tolerant lines and drought-sensitive lines were identified (Guo et al. 2014b).
The main aim of the present study was to determine if drought tolerance based on

111
drought stress at the reproductive stage in B. rapa (Guo et al. 2014b) was associated
with drought tolerance measured in seedlings in a high osmotic solution. A seedling
bioassay for drought tolerance would speed up the screening process and make it viable
to screen a large population of lines/accessions. This experiment was based on a
hydroponic system with polyeythylene glycol to impose the water stress, based on the
system used by Hatzig et al. (2014) in B. napus. The specific objectives were (i) to
identify traits that associated with early vigour and drought tolerance; (ii) compare
whether tolerant and sensitive accessions at the seedling stage have similar responses to
those observed in the previous experiment at the reproductive stage.
6.2 Materials and Methods
6.2.1 Plant materials and growth conditions
Nine accessions of B. rapa that had undergone drought tolerance screening at the
reproductive stage (Guo et al. 2014b) were chosen for this experiment (Table 6.1). In
order to be at a similar growth stage when the treatments imposed, seeds from PI-4 and
PI-5 were sown 1 and 2 d earlier than other accessions due to their slower rate of
germination. Ninety-six seeds of each accession were germinated in plastic tubes (0.2
ml volume) with 1% agar gel (Figure 6.1a) at 10 ˚C in the dark for 2-4 days before
transferring into individual tubes (50 ml volume) (Figure 6.1b). The tubes were placed
in a controlled-environment chamber with a day length of 16 h, 60% relative humidity,
day/night temperatures of 16 ˚C/12 ˚C and light intensity of 216-257 μmol m-2 s-1
[details see (Hatzig et al. 2014)].
Seedlings were initially grown inside the 50 ml falcon tubes containing Murashige and
Skoog (MS) (Murashige and Skoog 1962) medium solution (Duchefa Biochemie,
Haarlem, The Netherlands) with the following nutrient concentrations: NH4NO3 (10.54
mM), KNO3 (9.61 mM), CaCl2 (1.53 mM), MgSO4 (0.77 mM), KH2PO4 (0.64), H3BO3
(51.28 μM), MnSO4 (51.14 μM), FeNaEDTA (51.14 μM), ZnSO4 (15.30 μM), KI,
Na2MoO4 (0.53 μM), CoCl2 (0.06 μM), CuSO4 (0.05 μM). At 11-13 days after sowing
(DAS), the plants were transferred from the closed tubes to open tubes inserted into a
150 mm deep 10 L water tank (Figures 6.1c). An air pump was used to oxygenate the
solution.

112
Table 6.1. The accession number, source, origin, seed colour and vernalisation requirement of four
self-compatible (SC) and five partially self-incompatible (PI) accessions of B. rapa used in the
experiment (more information refer to Table 5.1 in Chapter 5 and Appendices: Supplementary Table
S1).
Accession namea Codes in text
Country of origin
Original name
Self-compatible B. rapa ATC92037 SC-2 India IB 1109
111 SC-3 Germany Yellow sarson ATC92240 SC-4 India 66-197-3 ATC93034 SC-5 Turkey TURKEY-1
Partially self-incompatible B. rapa
7F056 PI-1 China Fu Ding bai cai ATC95217 PI-2 Indonesia Tsja Sin
121 PI-3 Germany CGN 7221 CR2300 PI-4 Colombia 289745 CR2355 PI-5 UK 289800
Figure 6.1. Display of the methodology of the experiment with a) seed germination in plastic tubes
(0.2 ml volume) filled with 1% agar gel; b) after 2-4 DAS germinated seeds were transferred into 50
ml falcon tubes containing MS medium; c) after 11-13 DAS seedlings were transferred from
enclosed tubes to open (at the base) tubes inserted into a 150 mm deep 10 L water tank; and d) the
plants 25-27 DAS when the two treatments were imposed.
a b
c d
113
After 25-27 DAS (4-5 true-leaf stage) [BBCH 14-15, (Lancashire et al. 1991)], osmotic
stress was imposed by addition of 2.5 % polyethylene glycol (PEG) 6000 (Carl Roth
GmbH + Co. KG, Karlsruhe, Germany) to half of the seedlings, and the other half
remained in the MS medium (control). Following the formula of Michel and Kaufmann
(1973), the corresponding osmotic potential of the PEG solutions was calculated to be -
0.022 MPa at 2.5% PEG 6000.
The treatments lasted for 7 d after which 9 seedlings from each treatment were
harvested (32-34 DAS) as replicates. The shoot and root were separated at the hypocotyl,
and shoot length, root length, and fresh weight (includes both shoots and roots) were
measured during harvesting, while dry weight was measured after oven drying at 70 ˚C
for 5 d. Water content was calculated between the difference of fresh weight and dry
weight.
6.2.2 Statistical analysis
Data were analysed using a t-test based on paired samples between treated (PEG 6000)
and control MS medium. Correlation coefficient and regressions were fitted using
Origin ver. 7.5 (OriginLab, Northampton, MA, USA), and the values of each trait for
calculation were used relative values (PEG value divided by control value).
6.3 Results
6.3.1 Responses of seedling growth to the osmotic stress
After 31-35 d in the hydroponic MS medium (control, Ctrl), large variation in growth
was observed among the nine accessions. Accession means for shoot length varied from
4.7 mm to 11.6 mm, root length varied from 12.3 mm to 19.3 mm, fresh weight varied
from 0.96 g to 6.61 g and oven-dry weight varied from 0.10 to 0.50 g (Table 6.2). Shoot
length was significantly reduced in all accessions by the 7-d treatment in 2.5% PEG
6000 compared with the control treatment, and relative shoot length (PEG/Ctrl%)
ranged from 53.4% to 76.6% across nine accessions (Table 6.2 and Figure 6.2), while
root length was also significantly reduced by the PEG treatment in four of the nine
accessions, but no differences were found in SC-2, SC-3, PI-3, PI-4 and PI-5 (Table 6.2
and Figure 6.2b).
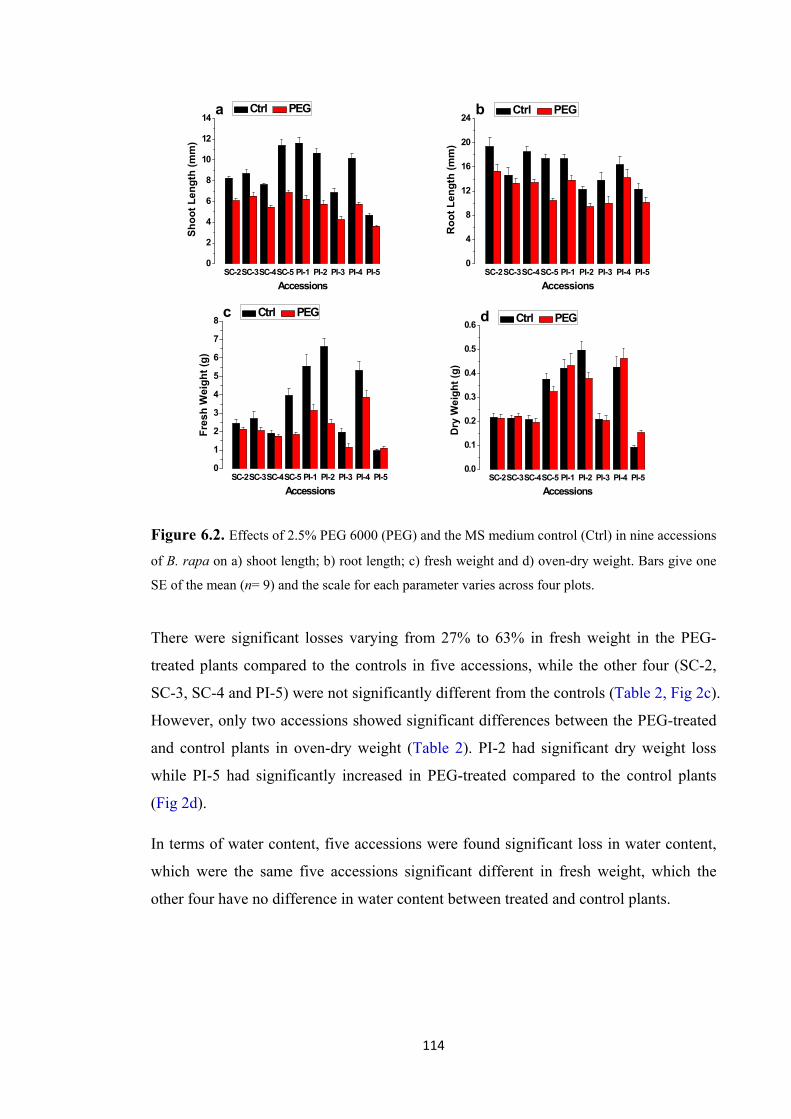
114
SC-2SC-3SC-4SC-5 PI-1 PI-2 PI-3 PI-4 PI-50
2
4
6
8
10
12
14
Shoo
t Len
gth
(mm
)
Accessions
Ctrl PEGa
SC-2SC-3SC-4SC-5 PI-1 PI-2 PI-3 PI-4 PI-50
4
8
12
16
20
24
Roo
t Len
gth
(mm
)
Accessions
Ctrl PEGb
SC-2SC-3SC-4SC-5 PI-1 PI-2 PI-3 PI-4 PI-50
1
2
3
4
5
6
7
8
Fres
h W
eigh
t (g)
Accessions
Ctrl PEGc
SC-2SC-3SC-4SC-5 PI-1 PI-2 PI-3 PI-4 PI-50.0
0.1
0.2
0.3
0.4
0.5
0.6
Dry
Wei
ght (
g)
Accessions
Ctrl PEGd
Figure 6.2. Effects of 2.5% PEG 6000 (PEG) and the MS medium control (Ctrl) in nine accessions
of B. rapa on a) shoot length; b) root length; c) fresh weight and d) oven-dry weight. Bars give one
SE of the mean (n= 9) and the scale for each parameter varies across four plots.
There were significant losses varying from 27% to 63% in fresh weight in the PEG-
treated plants compared to the controls in five accessions, while the other four (SC-2,
SC-3, SC-4 and PI-5) were not significantly different from the controls (Table 2, Fig 2c).
However, only two accessions showed significant differences between the PEG-treated
and control plants in oven-dry weight (Table 2). PI-2 had significant dry weight loss
while PI-5 had significantly increased in PEG-treated compared to the control plants
(Fig 2d).
In terms of water content, five accessions were found significant loss in water content,
which were the same five accessions significant different in fresh weight, which the
other four have no difference in water content between treated and control plants.
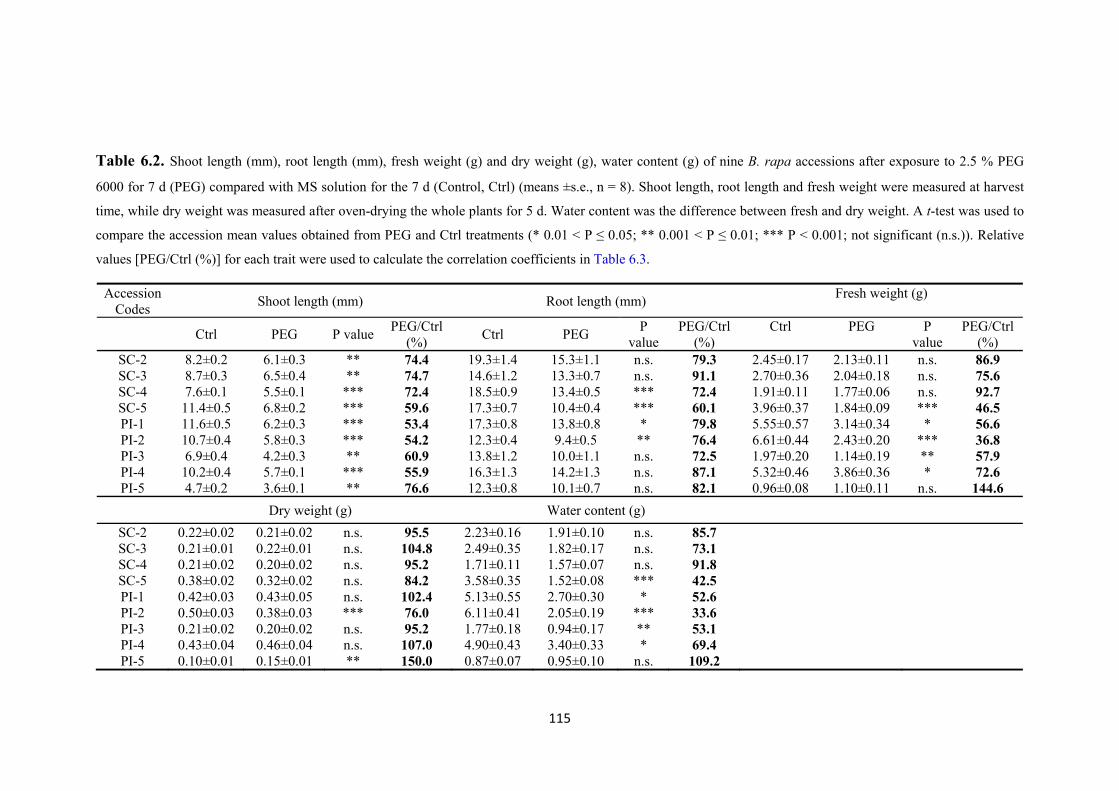
115
Table 6.2. Shoot length (mm), root length (mm), fresh weight (g) and dry weight (g), water content (g) of nine B. rapa accessions after exposure to 2.5 % PEG
6000 for 7 d (PEG) compared with MS solution for the 7 d (Control, Ctrl) (means ±s.e., n = 8). Shoot length, root length and fresh weight were measured at harvest
time, while dry weight was measured after oven-drying the whole plants for 5 d. Water content was the difference between fresh and dry weight. A t-test was used to
compare the accession mean values obtained from PEG and Ctrl treatments (* 0.01 < P ≤ 0.05; ** 0.001 < P ≤ 0.01; *** P < 0.001; not significant (n.s.)). Relative
values [PEG/Ctrl (%)] for each trait were used to calculate the correlation coefficients in Table 6.3.
Accession Codes
Shoot length (mm) Root length (mm) Fresh weight (g)
Ctrl PEG P value PEG/Ctrl
(%) Ctrl PEG
P value
PEG/Ctrl (%)
Ctrl PEG P value
PEG/Ctrl (%)
SC-2 8.2±0.2 6.1±0.3 ** 74.4 19.3±1.4 15.3±1.1 n.s. 79.3 2.45±0.17 2.13±0.11 n.s. 86.9 SC-3 8.7±0.3 6.5±0.4 ** 74.7 14.6±1.2 13.3±0.7 n.s. 91.1 2.70±0.36 2.04±0.18 n.s. 75.6 SC-4 7.6±0.1 5.5±0.1 *** 72.4 18.5±0.9 13.4±0.5 *** 72.4 1.91±0.11 1.77±0.06 n.s. 92.7 SC-5 11.4±0.5 6.8±0.2 *** 59.6 17.3±0.7 10.4±0.4 *** 60.1 3.96±0.37 1.84±0.09 *** 46.5 PI-1 11.6±0.5 6.2±0.3 *** 53.4 17.3±0.8 13.8±0.8 * 79.8 5.55±0.57 3.14±0.34 * 56.6 PI-2 10.7±0.4 5.8±0.3 *** 54.2 12.3±0.4 9.4±0.5 ** 76.4 6.61±0.44 2.43±0.20 *** 36.8 PI-3 6.9±0.4 4.2±0.3 ** 60.9 13.8±1.2 10.0±1.1 n.s. 72.5 1.97±0.20 1.14±0.19 ** 57.9 PI-4 10.2±0.4 5.7±0.1 *** 55.9 16.3±1.3 14.2±1.3 n.s. 87.1 5.32±0.46 3.86±0.36 * 72.6 PI-5 4.7±0.2 3.6±0.1 ** 76.6 12.3±0.8 10.1±0.7 n.s. 82.1 0.96±0.08 1.10±0.11 n.s. 144.6
Dry weight (g) Water content (g)
SC-2 0.22±0.02 0.21±0.02 n.s. 95.5 2.23±0.16 1.91±0.10 n.s. 85.7 SC-3 0.21±0.01 0.22±0.01 n.s. 104.8 2.49±0.35 1.82±0.17 n.s. 73.1 SC-4 0.21±0.02 0.20±0.02 n.s. 95.2 1.71±0.11 1.57±0.07 n.s. 91.8 SC-5 0.38±0.02 0.32±0.02 n.s. 84.2 3.58±0.35 1.52±0.08 *** 42.5 PI-1 0.42±0.03 0.43±0.05 n.s. 102.4 5.13±0.55 2.70±0.30 * 52.6 PI-2 0.50±0.03 0.38±0.03 *** 76.0 6.11±0.41 2.05±0.19 *** 33.6 PI-3 0.21±0.02 0.20±0.02 n.s. 95.2 1.77±0.18 0.94±0.17 ** 53.1 PI-4 0.43±0.04 0.46±0.04 n.s. 107.0 4.90±0.43 3.40±0.33 * 69.4 PI-5 0.10±0.01 0.15±0.01 ** 150.0 0.87±0.07 0.95±0.10 n.s. 109.2
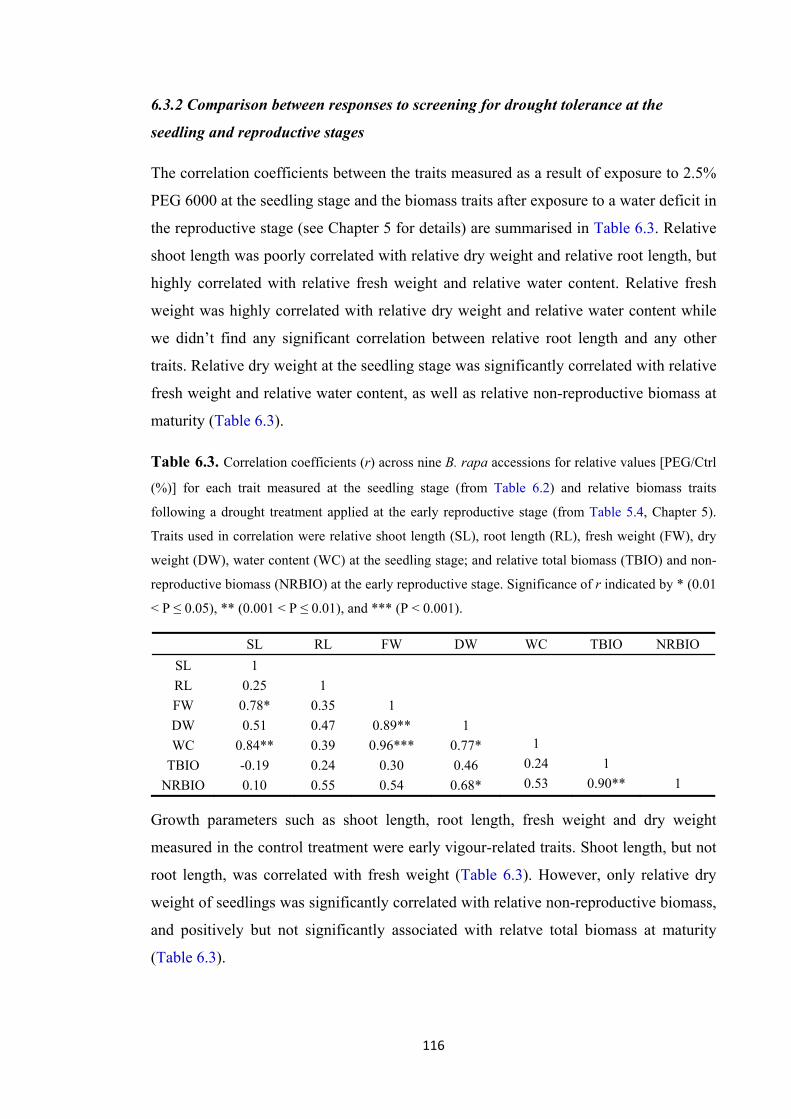
116
6.3.2 Comparison between responses to screening for drought tolerance at the
seedling and reproductive stages
The correlation coefficients between the traits measured as a result of exposure to 2.5%
PEG 6000 at the seedling stage and the biomass traits after exposure to a water deficit in
the reproductive stage (see Chapter 5 for details) are summarised in Table 6.3. Relative
shoot length was poorly correlated with relative dry weight and relative root length, but
highly correlated with relative fresh weight and relative water content. Relative fresh
weight was highly correlated with relative dry weight and relative water content while
we didn’t find any significant correlation between relative root length and any other
traits. Relative dry weight at the seedling stage was significantly correlated with relative
fresh weight and relative water content, as well as relative non-reproductive biomass at
maturity (Table 6.3).
Table 6.3. Correlation coefficients (r) across nine B. rapa accessions for relative values [PEG/Ctrl
(%)] for each trait measured at the seedling stage (from Table 6.2) and relative biomass traits
following a drought treatment applied at the early reproductive stage (from Table 5.4, Chapter 5).
Traits used in correlation were relative shoot length (SL), root length (RL), fresh weight (FW), dry
weight (DW), water content (WC) at the seedling stage; and relative total biomass (TBIO) and non-
reproductive biomass (NRBIO) at the early reproductive stage. Significance of r indicated by * (0.01
< P ≤ 0.05), ** (0.001 < P ≤ 0.01), and *** (P < 0.001).
SL RL FW DW WC TBIO NRBIO
SL 1
RL 0.25 1
FW 0.78* 0.35 1
DW 0.51 0.47 0.89** 1
WC 0.84** 0.39 0.96*** 0.77* 1
TBIO -0.19 0.24 0.30 0.46 0.24 1
NRBIO 0.10 0.55 0.54 0.68* 0.53 0.90** 1
Growth parameters such as shoot length, root length, fresh weight and dry weight
measured in the control treatment were early vigour-related traits. Shoot length, but not
root length, was correlated with fresh weight (Table 6.3). However, only relative dry
weight of seedlings was significantly correlated with relative non-reproductive biomass,
and positively but not significantly associated with relatve total biomass at maturity
(Table 6.3).
117
6.4 Discussion
6.4.1 Hydroponic system and drought tolerance evaluation
To try to simulate a field study, many drought experiments have been conducted using
soil in large pots in a glasshouse. However, when a water stress treatment is applied to a
range of genotypes in a breeding project, different drying rates often occur due to
different growth rates prior to the imposition of the stress treatment so that the
genotypes experience different soil moisture conditions [see (Guo et al. 2014b) for
examples in B. rapa]. Hydroponic systems with PEG added to the bathing solution, on
the other hand, have been widely used to impose a relatively consistent stress to plants
and are therefore ideal for molecular research when using large numbers of accessions.
Additionally, use of hydroponic systems are less laborious, particularly at the seedling
stage (Rauf et al. 2008).
An efficient in vitro cultivation and drought tolerance screening system was developed
by Hatzig et al. (2014) for B. napus which showed that tolerant accessions had lower
losses of growth parameters such as seedling biomass and leaf area than sensitive lines,
confirming the previous selection outcome from the field. This study has shown that the
use of PEG in a hydroponic system can be successfully applied to screen for differences
in sensitivity/tolerance to an osmotic stress in B. rapa.
6.4.2 Useful traits for evaluating drought tolerance at the seedling stage
Genetic variation for relative shoot length, root length, fresh weight and dry weight was
observed in the seedlings, but the variation alone does not determine the drought
tolerance. Shoot length was reported to be closely related to seedling vigour (Botwright
et al. 2002), and it was a reliable determinant of early vigour in rice and was associated
with several identified QTLs (Redoña and Mackill 1996; Zhang et al. 2005). Meanwhile,
root length is also considered to be an important factor in reference to tolerance as it
associates better with crop’s final yield (Rauf et al. 2008). Unfortunately, the correlation
coefficient between root length and other parameters were not significant in this study
and neither shoot length nor root length was found to be significant correlated with
flowering stage biomass. Instead, compared with other parameters, relative dry weight
in the seedling stage had significant correlation with the relative non-reproductive
biomass at flowering stage, and a positive but not significant correlation with relative
total biomass (Table 6.3).
118
6.4.3 Early vigour and its association with crop yield
Early vigour has been shown to be associated with crop yield in water-limited
environments (Turner and Nicolas 1998), and good early vigour reduces soil
evaporation, accelerates root development for soil water (Turner and Nicolas 1998) and
nitrogen as well as reduce competition with weeds (Zhao et al. 2006). However, early
vigour may also accelerate the depletion of soil water reserves, making less water
available for seed development and filling (Zhang et al. 2005). Thus, early vigour is
important in short-season environments where crop growth is dependent on current
rainfall, such as Mediterranean-type semiarid environments or the Canadian prairies, but
not in environments in which the crop grows on stored soil moisture such as wheat and
canola production in summer-rainfall environments such as the Indian sub-continent.
Yue et al. (2006) emphasised the importance of separating drought avoidance from
drought tolerance, because one refers to better plant growth (radiation shading, leaf area)
and access to resources (e.g. deep root growth), while the other refers to osmotic
adjustment and regulation of drought-related genes (Turner 1997). In our experiment,
the wild accession PI-5 had high drought tolerance as the growth and weights were
similar or better in the PEG treatment than in the control treatment. However, it had the
slowest growth in the MS controls and was much smaller in size when it was exposed to
the PEG treatments. Unfortunately, we didn’t have a special design to separate drought
avoidance as Yue et al. (2006) did in rice, but in terms of the relative biomass in the
previous experiment (Guo et al. 2014), PI-5 showed a significant increase in the PEG
treatment at the reproductive stage, similar to that in this experiment (Figure 6.3).
Furthermore, none of the four early vigour related traits in WW treated plants showed
correlation with relative biomass traits. Therefore, relative values should be considered
when assessing drought tolerance among accessions.
6.4.4 Identification of drought tolerant and drought sensitive accessions
Previous results at reproductive stage showed that the B. rapa accessions varied in their
response to a 13-d water stress treatment (Guo et al., 2014). Two B. rapa accessions had
lower seed yields and greater non-reproductive aboveground biomass loss and were
considered drought sensitive, while another two B. rapa accessions had significant
biomass increases in the PEG treatment compared to the control treatment and were
considered to be drought tolerant (Guo et al. 2014b). However, in this seedling
experiment, SC-5, PI-1, PI-2 and PI-4 had the best early vigour in the control treatment,
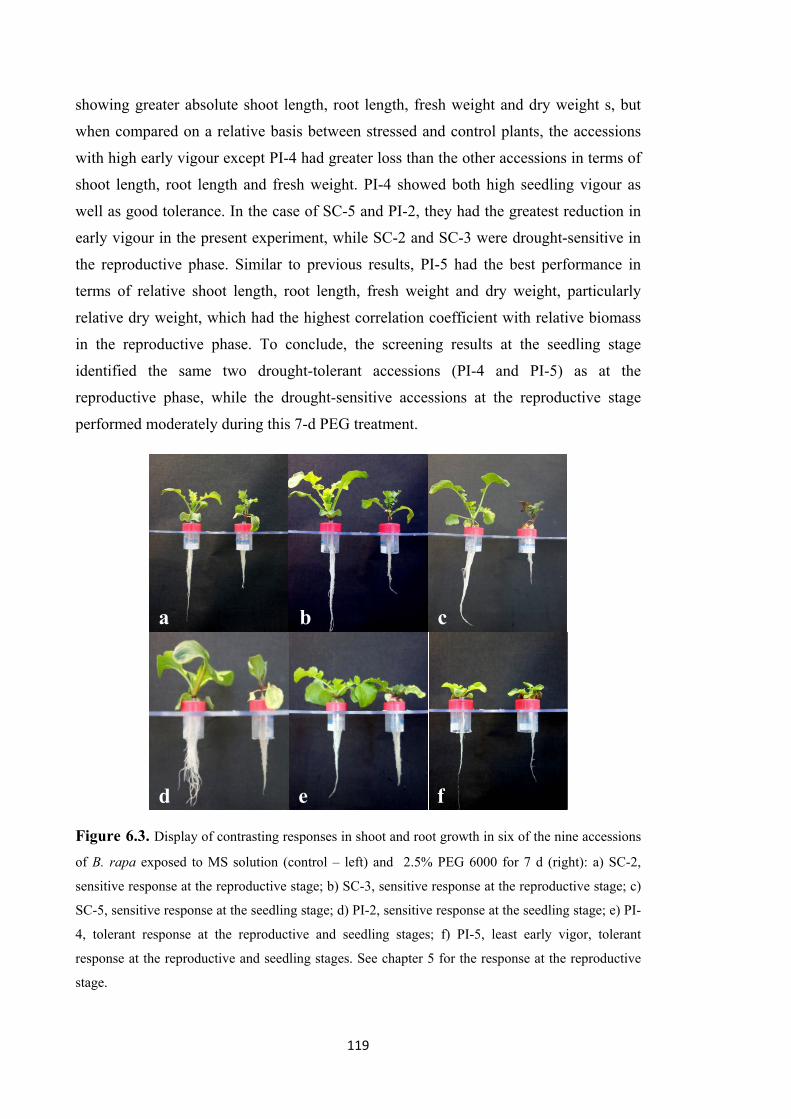
119
showing greater absolute shoot length, root length, fresh weight and dry weight s, but
when compared on a relative basis between stressed and control plants, the accessions
with high early vigour except PI-4 had greater loss than the other accessions in terms of
shoot length, root length and fresh weight. PI-4 showed both high seedling vigour as
well as good tolerance. In the case of SC-5 and PI-2, they had the greatest reduction in
early vigour in the present experiment, while SC-2 and SC-3 were drought-sensitive in
the reproductive phase. Similar to previous results, PI-5 had the best performance in
terms of relative shoot length, root length, fresh weight and dry weight, particularly
relative dry weight, which had the highest correlation coefficient with relative biomass
in the reproductive phase. To conclude, the screening results at the seedling stage
identified the same two drought-tolerant accessions (PI-4 and PI-5) as at the
reproductive phase, while the drought-sensitive accessions at the reproductive stage
performed moderately during this 7-d PEG treatment.
Figure 6.3. Display of contrasting responses in shoot and root growth in six of the nine accessions
of B. rapa exposed to MS solution (control – left) and 2.5% PEG 6000 for 7 d (right): a) SC-2,
sensitive response at the reproductive stage; b) SC-3, sensitive response at the reproductive stage; c)
SC-5, sensitive response at the seedling stage; d) PI-2, sensitive response at the seedling stage; e) PI-
4, tolerant response at the reproductive and seedling stages; f) PI-5, least early vigor, tolerant
response at the reproductive and seedling stages. See chapter 5 for the response at the reproductive
stage.
a b c
d e f

120
6.5 Summary
An association between the drought responses at the seedling stage with those at the
reproductive phase would accelerate the screening process in B. rapa. Screening at the
seedling stage would be particularly valuable in B. rapa due to the existence of self-
incompatibility in most B. rapa accessions (Guo et al. 2014b).
In this experiment, seedling responses in the hydroponic system using PEG 6000 as the
osmoticum to induce water stress have provided some hope that a simpler method of
screening for drought tolerance may be possible. Relative seedling dry weight was
found to be associated with relative non-reproductive biomass at the flowering stage,
which gave us some confidence to apply this method in bigger projects, particularly if
molecular changes at the seedling stage mirror those at the reproductive stage.
Nonetheless, the hydroponic system provides a consistent stress environment, albeit an
osmotic stress not water stress, compared with soil drying experiments that should
provide ideal conditions for the evaluation of transcriptase responses and gene
regulation in the accessions. The difference in genetic regulation between drought-
tolerant and drought-sensitive genotypes is worthy of further investigation for future
breeding.


121
Chapter 7
7 Drought tolerance in Brassica rapa is
associated with rapid up-regulation of
gene networks for general stress responses
and programmed cell death
Abstract
Growing global demand for vegetable oil from oilseed rape/canola (Brassica napus) is
increasingly threatened by dry conditions in many parts of the world. Brassica rapa,
one of the diploid progenitor species of the genetically-narrow, recent polyploid B.
napus, is a promising source of drought tolerance for canola breeders. However, a better
understanding of the genetic basis of this variation is needed to enable its targeted
exploitation in breeding. We sought to address this deficiency by analysis of gene
expression networks in two B. rapa genotypes with contrasting physiological responses
to drought stress. Global gene expression was assayed by mRNAseq after application of
osmotic stress conditions in a drought-sensitive and a drought-tolerant accession,
respectively, in comparison to control samples from plants of each accession not
subjected to stress. Gene function enrichment analyses revealed dramatic differences
between the drought-sensitive and drought-tolerant plants in the onset and mode of
stress responses. The drought-tolerant accession reacted by rapidly up-regulating genes
associated with abscisic acid, jasmonic acid and salicylic acid metabolism. Furthermore,
within 4 hours after the stress application, the drought-tolerant accession induced genes

122
involved in endoplasmic reticulum protein formation that are known to cause
endoplasmic reticulum stress and induction of programmed cell death. Active responses
of this kind were delayed until 8 h or 12 h after stress application in the drought-
sensitive accession, which instead exhibited primarily negative early responses
including down-regulation of gene networks associated with photosynthesis and
assimilation. The results provide potential biomarkers for selection of breeding
materials with potentially improved drought tolerance.
Key words: RNA sequencing, abscisic acid, transcription factor, gene ontology, gene
enrichment analysis
123
7.1 Introduction
Meeting increasing global demand for vegetable oil is becoming increasingly
challenging in the face of climate change, with dry conditions becoming less predictable
in many parts of the world (Tester and Langridge 2010). The recent allopolyploid
oilseed crop Brassica napus L. (canola, rapeseed, oilseed rape; genome AACC, 2n=38)
is today the most important Brassica species worldwide (Prakash et al. 2012) and is the
second-most important oilseed crop in temperate climatic areas. However, low genetic
diversity (Becker et al. 1995; Cowling 2007) in this recently evolved species limits the
possibility to breed for drought tolerance and other environmental adaptation traits,
meaning that identification of variation for drought-tolerance genes from related species
has become urgent for canola breeding. In contrast, Brassica rapa L. (AA, 2n=20), one
of the diploid ancestor species of B. napus, is renowned for its wide genetic diversity
(Zhao et al. 2005; Ofori et al. 2008; Annisa et al. 2013a). Interspecific crosses between
B. rapa and B. napus are relatively easy to achieve, so there is great potential to transfer
useful genetic variation from B. rapa into B. napus.
Plants have evolved various mechanisms to adapt to and cope with water stress
conditions by implementing a series of biochemical, molecular, physiological and/or
morphological changes (Moore et al. 2009). Over the last decade, tremendous efforts
have focused on understanding these complex mechanisms and recent progress has been
extensively reviewed (Cattivelli et al. 2008; Huang et al. 2008; Varshney et al. 2011).
Wang et al. (2003) summarized the genes related to drought stress responses into three
categories, involved either in signalling control, protective function or water and ion
transporters. The respective groups of genes were reported to delay water stress
symptoms (Pellegrineschi et al. 2004), enhance the tolerance level (Zheng et al. 2009)
or to play an important role in tolerating abiotic stresses (Zhang et al. 2014).
Recently, gene expression profiling techniques based on ultra-high throughput
messenger RNA sequencing (mRNAseq) have brought unprecedented resolution to
global transcription profiling including the potential for discovery of new transcripts or
genes (Wang et al. 2009; Ozsolak and Milos 2011). The whole genome sequences of B.
rapa (Wang et al. 2011a) and B. napus (Chalhoub et al. 2014) enabled direct
associations of transcriptome sequence data with Brassica crop genomes (Tong et al.
2013). Comparisons of transcriptomes under stressed vs. control conditions can help to
124
gain a comprehensive insight into how plants respond to stresses and to identify and
characterise the genes and gene networks responsible for mounting stress tolerance
responses. For example, Yu et al. (2012) identified a large number of differentially
expressed genes after dehydration stress in Chinese cabbage, revealing a high
transcription complexity involved in this process. Therefore, identification of
differences in transcriptional responses between drought-tolerant and drought-sensitive
B. rapa accessions in response to osmotic stress can potentially provide new
information about the mechanisms and regulation of stress tolerance, and help identify
novel methods to breed for drought tolerance.
An essential step for transcriptome analysis is the biological interpretation of observed
differences in gene expression. Gene ontology (GO) and gene cluster analyses provide
an approach to associate transcriptome sequence data with biological understanding, by
linking differentially expressed genes (DEGs) to putative molecular functions (Falcon
and Gentleman 2007). However, genes showing significant responsiveness to stress are
not necessarily the most effective targets for enhanced drought tolerance and yield
protection (Serraj and Sinclair 2002). Often, the pattern of significant biological or
molecular changes arising from a group of genes is of more interest, because these
describe the general response mechanisms associated with the stress tolerance
phenotype. A relatively small number of well-known hormones and transcription factors
are actively involved with regulating tolerance to stresses, such as abscisic acid (ABA),
salicylic acid (SA), jasmonic acid (JA) and calcium-mediated transcription factors
(Shinozaki and Yamaguchi-Shinozaki 2007). Among the regulatory metabolites driving
drought responses, the phytohormone ABA is arguably the most important. ABA
controls the expression of drought stress-related genes and is responsible for closure of
the stomatal aperture (Cutler et al. 2010). Some links have been demonstrated between
ABA function and sulphur metabolism. For example, in maize (Zea mays) sulphate was
found to be the only xylem-borne metabolite that follows ABA transport from root to
shoot and regulates the ABA-induced closure of stomata in the leaves (Ernst et al. 2010).
Glucosinolates, a group of sulphur-rich compounds found exclusively in the
Brassicaceae, are also believed to be involved in the plant defence system and possibly
with abiotic stress tolerance (Halkier and Gershenzon 2006). Whereas glucosinolate
contents in seeds of canola-quality B. napus have been largely reduced by intensive
breeding for seed meal quality (Snowdon and Friedt 2004), an enormous diversity for
125
glucosinolate compounds is found in leaves of different B. rapa accessions (Cartea and
Velasco 2008) and in the glucosinolate pathway (Pino Del Carpio et al. 2014). Variation
in glucosinolate synthesis and its response to stress may be of particular interest as a
potential factor contributing to drought tolerance in Brassica species.
Apart from metabolite accumulation during osmotic stress, programmed cell death
(PCD) is another well-known factor in plant defense (van Doorn and Woltering 2004).
PCD is an active cellular process that facilitates the removal of unwanted or damaged
cells and is essential for cellular differentiation and tissue homeostasis (van Doorn et al.
2011). High salinity leads to ionic, osmotic and oxidative stress in plants, resulting in
the induction of signalling events that lead to PCD in higher plants (Wang et al. 2010).
Duan et al. (2010) reported the pattern and morphological characteristics of PCD
induced by water stress, which might represent an important mechanism of plant
drought tolerance at the organ level. It has also been demonstrated that PCD can be
mediated by stress induced by caspase-like enzymatic activities in the endoplasmic
reticulum (ER) (Cai et al. 2014).
In previous work we identified considerable variation for drought tolerance among nine
B. rapa and on B. juncea accessions that were subjected to detailed physiological
evaluations of drought responses under controlled environment conditions. A wild type
B. rapa ssp. sylvestris was found to maintain mature plant biomass following a transient
drought stress during the early reproductive stage, compared to control conditions,
whereas a Yellow Sarson type (B. rapa ssp. triloculoris) suffered significant reductions
in mature plant biomass under the same conditions (Guo et al. 2014b). Similarly, in B.
napus we demonstrated that drought-sensitive (DS) and drought-tolerant (DT) cultivars
exhibit differential physiological responses to osmotic stress, including considerable
differences in ABA responses and osmotic adjustment (Hatzig et al. 2014). However,
the genetic mechanisms underlying differences between DS and DT accessions remain
unknown. Identification of the major drought response pathways and potential
regulatory factors whose expression changes are in associated with drought-tolerance
traits would be highly valuable for breeding of new, drought tolerance varieties.
The objectives of this study were (i) to assess differential gene expression between DS
and DT B. rapa accessions under osmotic stress vs. non-stress treatments; (ii) to
elucidate differences between their temporal patterns of gene and network expression
126
after stress application; (iii) to investigate patterns of enrichment for gene ontology (GO)
and metabolic regulation pathways; and (iv) to identify unique drought-related genes for
future Brassica breeding.
7.2 Materials and Methods
7.2.1 Plant materials and growth conditions
Two accessions of B. rapa (CR2355 and ATC92037) were selected as contrasting
genotypes for this study. CR2355 is a wild type B. rapa (ssp. sylvestris) considered as a
drought-tolerant genotype because it shows fewer stress symptoms and less yield and
biomass loss during transient drought stress at the reproductive stage. On the other hand,
the Yellow Sarson type ATC92037 suffered considerably greater yield and biomass
reduction under the same drought stress treatment and is therefore considered to be
drought sensitive (Guo et al. 2014b).
Plant materials were grown in a hydroponic growth system which enables controlled
application of osmotic stress to the roots by addition of polyethylene glycol (PEG 6000),
combined with the ability to harvest not only leaf materials but also clean, soil-free root
samples for gene expression profiling. The plant growth system and stress experiments
were described in detail by Hatzig et al. (2014).
Ninety-six seeds per genotype were germinated in 1% agar gel in plastic tubes (0.2 ml
volume) at 10 ˚C in the dark for 2-4 days before removal of the bottom of the tubes and
transferring each one into a hole bored in the lid of a 50 ml Falcon tube containing
Murashige and Skoog (MS) medium solution (Murashige and Skoog 1962) (Duchefa
Biochemie, Haarlem, The Netherlands). After 7 days the seedlings were transferred,
inside the lids of the tubes, to open tubes inserted into 15 cm deep 10 L aquaria in a
controlled environment chamber with a day length of 16 hrs, 60% humidity, day/night
temperatures of 16 ˚C/12 ˚C and photosynthetically-active radiation of 216-257 μmol m-
2 s-1. The nutrient solution was changed at 7-day intervals.
At 25-27 days after sowing (DAS), when the plants had 4-5 true leaves (BBCH 14-15
(Lancashire et al. 1991), osmotic stress was applied to half of the seedlings by adding
2.5 % PEG 6000 (Carl Roth GmbH + Co. KG, Karlsruhe, Germany), and the other half
remained with MS medium as control for PEG. The corresponding osmotic potentials of

127
the PEG solution can be calculated as follows using the formula of Michel and
Kaufmann (1973): -0.022 MPa at 2.5% PEG 6000. To ensure oxygen supply the
solutions were aerated using a pressure air pump.
7.2.2 Tissue sampling, total RNA extraction and pooling
Whole shoots and roots were sampled after 4 h, 8 h and 12 h imposition of the stress,
shock-frozen immediately in liquid nitrogen and stored at -80 ˚C until RNA extraction.
Three biological replicates per time point and genotype were harvested.
Total RNA was extracted using the RNEasy Mini Kit (Qiagen, Hilden, Germany) from
shoot samples and treated with DNase using the RNase-free DNase Set (Qiagen, Hilden,
Germany) during the process. The quantity and quality of all RNA samples were
checked using a Fragment AnalyzerTM Automated Capillary Electrophoresis system
(Advanced Analytical, Heidelberg, Germany) before being pooled for cDNA synthesis.
Three equimolar RNA samples per treatment per genotype were combined and used to
prepare cDNA for RNAseq analysis as described below.
7.2.3 cDNA library construction and sequencing
cDNA libraries were prepared with the TruSeq Stranded Total RNA with Ribo-ZeroTM
Plant kit from Illumina (San Diego, CA, USA), according to the manufacturer’s
protocol. Each cDNA library was tagged with Multiplex Identifier barcode adaptors,
with three independent multiplexes created by following the rule of randomizing (Fang
and Cui 2011) with mixed libraries from different sampling time-points (Figure 7.1).
The quantity of each cDNA library was checked using the KAPA library quantification
kit (KAPA Biosystems, Wilmington, MA, USA) and the fragment size was check by
capillary electrophoresis using a QIAxcel Advanced (Qiagen, Hilden, Germany) before
final multiplexing for sequencing. Each multiplex was freshly prepared and diluted as
instructed by the user manual provided by MiSeq (Illumina, San Diego, CA, USA).
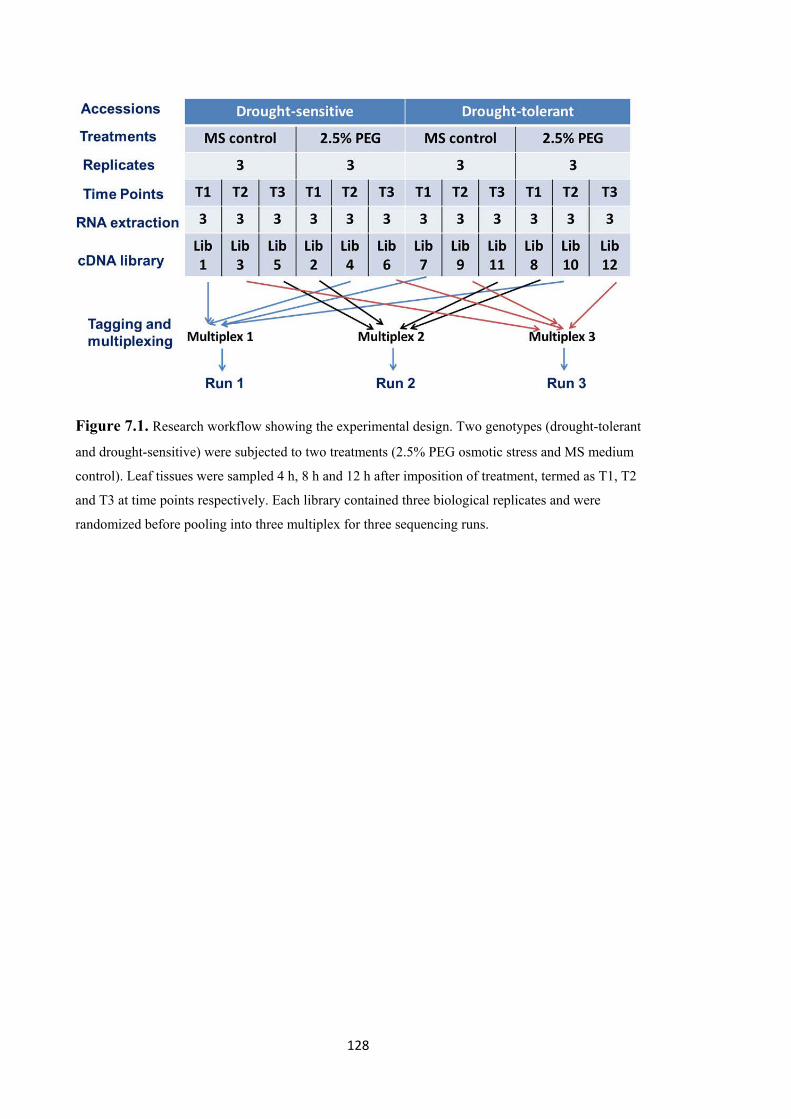
128
Figure 7.1. Research workflow showing the experimental design. Two genotypes (drought-tolerant
and drought-sensitive) were subjected to two treatments (2.5% PEG osmotic stress and MS medium
control). Leaf tissues were sampled 4 h, 8 h and 12 h after imposition of treatment, termed as T1, T2
and T3 at time points respectively. Each library contained three biological replicates and were
randomized before pooling into three multiplex for three sequencing runs.
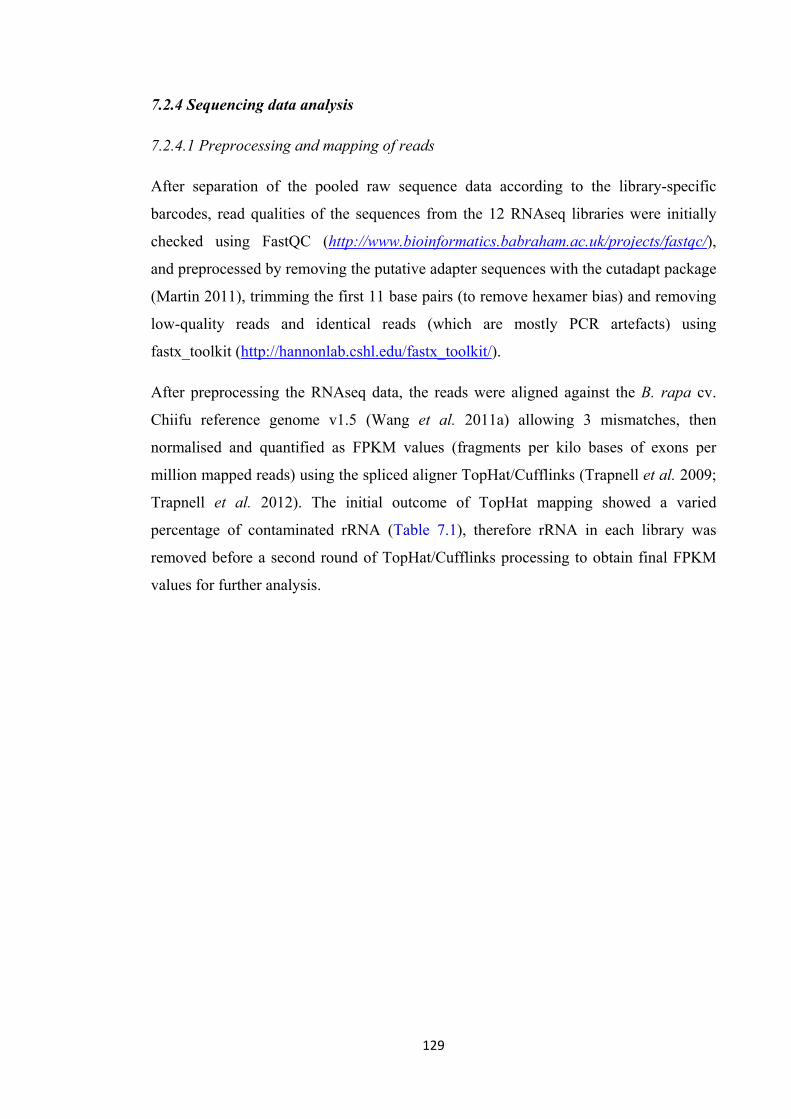
129
7.2.4 Sequencing data analysis
7.2.4.1 Preprocessing and mapping of reads
After separation of the pooled raw sequence data according to the library-specific
barcodes, read qualities of the sequences from the 12 RNAseq libraries were initially
checked using FastQC (http://www.bioinformatics.babraham.ac.uk/projects/fastqc/),
and preprocessed by removing the putative adapter sequences with the cutadapt package
(Martin 2011), trimming the first 11 base pairs (to remove hexamer bias) and removing
low-quality reads and identical reads (which are mostly PCR artefacts) using
fastx_toolkit (http://hannonlab.cshl.edu/fastx_toolkit/).
After preprocessing the RNAseq data, the reads were aligned against the B. rapa cv.
Chiifu reference genome v1.5 (Wang et al. 2011a) allowing 3 mismatches, then
normalised and quantified as FPKM values (fragments per kilo bases of exons per
million mapped reads) using the spliced aligner TopHat/Cufflinks (Trapnell et al. 2009;
Trapnell et al. 2012). The initial outcome of TopHat mapping showed a varied
percentage of contaminated rRNA (Table 7.1), therefore rRNA in each library was
removed before a second round of TopHat/Cufflinks processing to obtain final FPKM
values for further analysis.
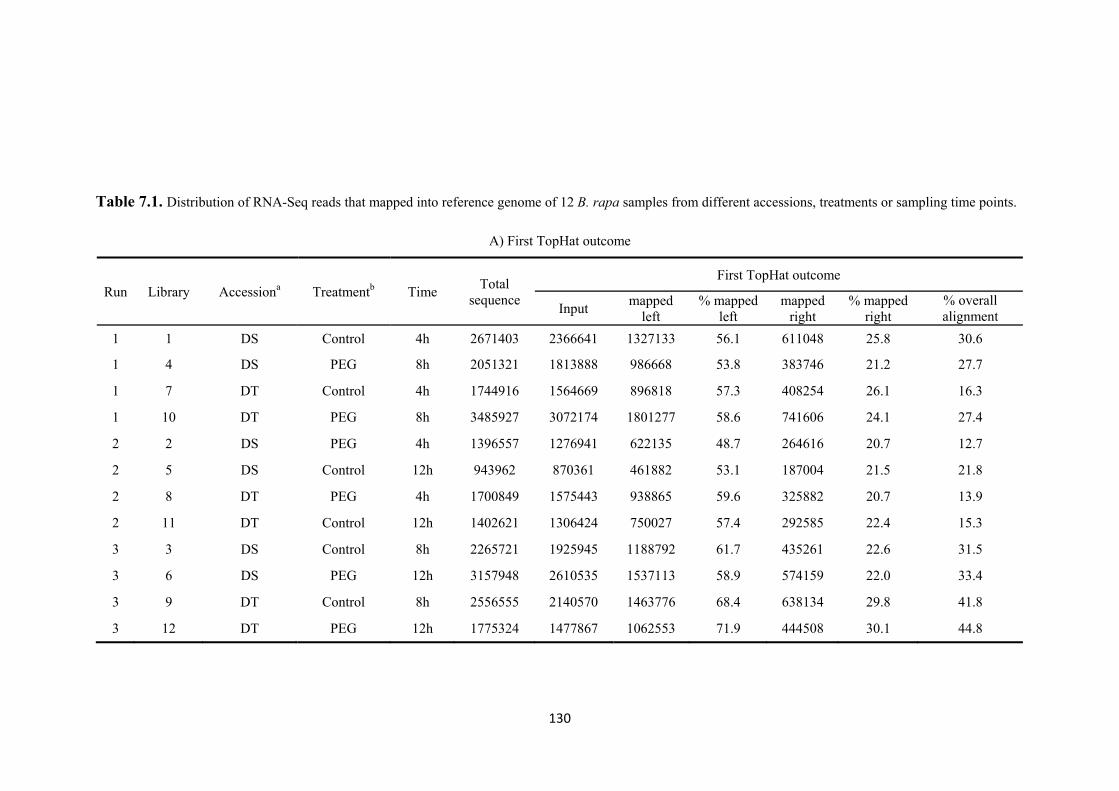
130
Table 7.1. Distribution of RNA-Seq reads that mapped into reference genome of 12 B. rapa samples from different accessions, treatments or sampling time points.
A) First TopHat outcome
Run Library Accessiona Treatmentb Time Total
sequence
First TopHat outcome
Input mapped
left % mapped
left mapped
right % mapped
right % overall alignment
1 1 DS Control 4h 2671403 2366641 1327133 56.1 611048 25.8 30.6
1 4 DS PEG 8h 2051321 1813888 986668 53.8 383746 21.2 27.7
1 7 DT Control 4h 1744916 1564669 896818 57.3 408254 26.1 16.3
1 10 DT PEG 8h 3485927 3072174 1801277 58.6 741606 24.1 27.4
2 2 DS PEG 4h 1396557 1276941 622135 48.7 264616 20.7 12.7
2 5 DS Control 12h 943962 870361 461882 53.1 187004 21.5 21.8
2 8 DT PEG 4h 1700849 1575443 938865 59.6 325882 20.7 13.9
2 11 DT Control 12h 1402621 1306424 750027 57.4 292585 22.4 15.3
3 3 DS Control 8h 2265721 1925945 1188792 61.7 435261 22.6 31.5
3 6 DS PEG 12h 3157948 2610535 1537113 58.9 574159 22.0 33.4
3 9 DT Control 8h 2556555 2140570 1463776 68.4 638134 29.8 41.8
3 12 DT PEG 12h 1775324 1477867 1062553 71.9 444508 30.1 44.8

131
B) Second TopHat outcome
Run Library Accessiona Treatmentb Time Total
sequence
Second TopHat outcome
Input mapped left % mapped left mapped
right % mapped right
1 1 DS Control 4h 2671403 1447145 610532 42.2 277216 19.2
1 4 DS PEG 8h 2051321 1154059 463855 40.2 171385 14.9
1 7 DT Control 4h 1744916 1238828 635362 51.3 280527 22.6
1 10 DT PEG 8h 3485927 1962727 908624 46.3 361030 18.4
2 2 DS PEG 4h 1396557 1066961 464071 43.5 189795 17.8
2 5 DS Control 12h 943962 618882 259909 42.0 99140 16.0
2 8 DT PEG 4h 1700849 1275868 696000 54.6 230758 18.1
2 11 DT Control 12h 1402621 999200 504806 50.5 191830 19.2
3 3 DS Control 8h 2265721 1092230 449157 41.1 146696 13.4
3 6 DS PEG 12h 3157948 1413950 451142 31.9 141016 10.0
3 9 DT Control 8h 2556555 968634 366812 37.9 139558 14.4
3 12 DT PEG 12h 1775324 590420 212318 36.0 76905 13.0
Accessiona: drought-sensitive (DS) and drought-tolerant (DT) Treatment b: MS medium control (Control) and PEG-6000 stressed (PEG)
Second TopHat outcome:rRNA sequences were removed before attempting on the second mapping, see details in Materials and Methods section 7.2.4.1

132
7.2.4.2 Comparison of differential gene expression
The logarithms of the FPKM values for the 12 libraries were used to identify
differentially expressed genes (DEGs). The values were processed in R by calculating
the standard deviation of two fold change (log2-FPKM) values from the 12 samples and
selecting genes with a standard deviation of at least 1.
Genes with differential expression levels were compared between the two genotypes
under the control vs. osmotic stress treatments across the three time points. For the three
time points we compared DEGs from osmotically stressed (PEG) plants with MS
control samples in both drought-sensitive (DS) and drought-tolerant (DT) accessions.
Common expressed DEGs in all the six comparisons were obtained along with
overlaping and unique DEGs in the DS and DT genotypes in three time points. These
groups were later used separately for gene ontology and enrichment analyses.
7.2.4.3 Gene expression network analysis
All genes that showed expression changes between PEG and control conditions in the
two genotypes and three time points were clustered using the k-means clustering
approach in R, allowing 50 clusters
7.2.4.4 Gene ontology (GO) and enrichment analysis
The sequences of the B. rapa transcriptome (Brassica_rapa_v1.2) were functionally
annotated using Blast2GO (Conesa et al. 2005). The GO terms of differentially
expressed genes (DEGs) were summarised and plotted using the online tool WEGO (Ye
et al. 2006). The number of DEGs in different categories describing the biological
process, molecular function or cellular components, respectively, was obtained from the
WEGO summary output.
Differentially expressed genes and coordinated expressed genes in the different
treatments and timepoints were analysed for enriched GO terms using the GOstats
package implemented within the R/Bioconductor environment (Falcon and Gentleman
2007). Enriched GO terms and corresponding P values were then used as input for the
REViGO analysis (http://revigo.irb.hr), to reduce redundancy within lists of GO terms
and visualize semantic clustering of the identified top scoring GO terms (sorted by P
values) (Supek et al. 2011). A medium sized similarity using the Arabidopsis thaliana
database for GO terms was applied when processing the REViGO analysis.
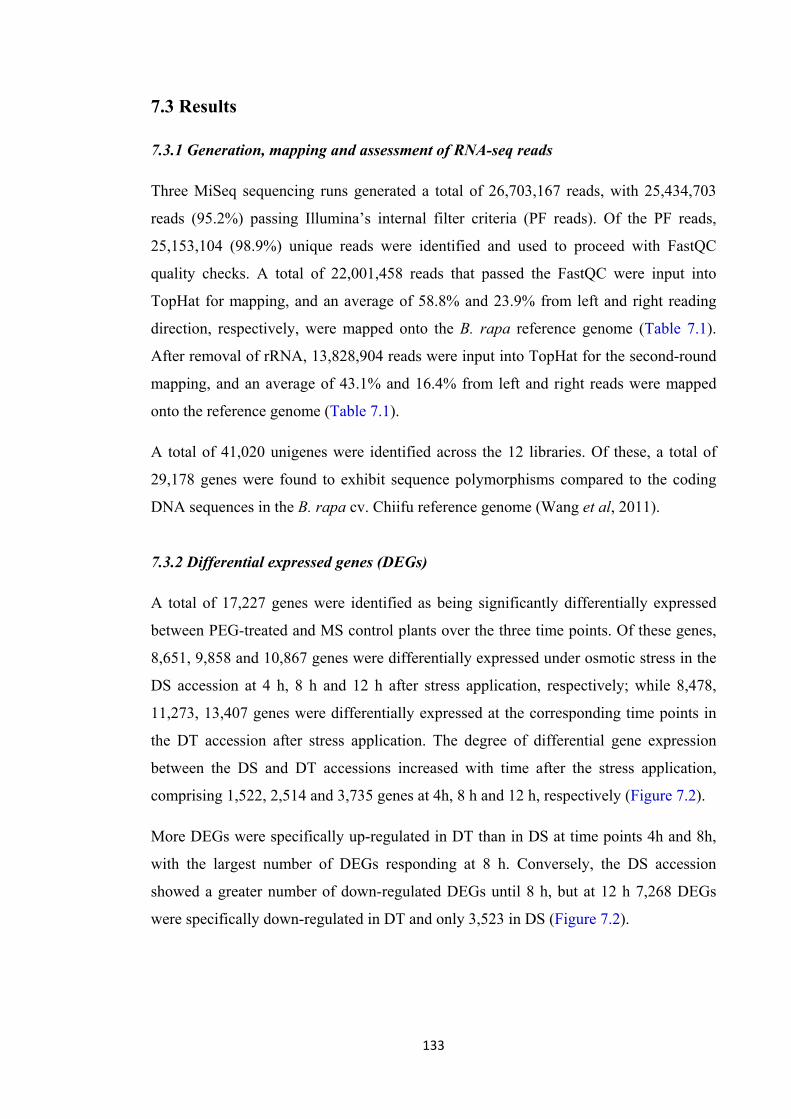
133
7.3 Results
7.3.1 Generation, mapping and assessment of RNA-seq reads
Three MiSeq sequencing runs generated a total of 26,703,167 reads, with 25,434,703
reads (95.2%) passing Illumina’s internal filter criteria (PF reads). Of the PF reads,
25,153,104 (98.9%) unique reads were identified and used to proceed with FastQC
quality checks. A total of 22,001,458 reads that passed the FastQC were input into
TopHat for mapping, and an average of 58.8% and 23.9% from left and right reading
direction, respectively, were mapped onto the B. rapa reference genome (Table 7.1).
After removal of rRNA, 13,828,904 reads were input into TopHat for the second-round
mapping, and an average of 43.1% and 16.4% from left and right reads were mapped
onto the reference genome (Table 7.1).
A total of 41,020 unigenes were identified across the 12 libraries. Of these, a total of
29,178 genes were found to exhibit sequence polymorphisms compared to the coding
DNA sequences in the B. rapa cv. Chiifu reference genome (Wang et al, 2011).
7.3.2 Differential expressed genes (DEGs)
A total of 17,227 genes were identified as being significantly differentially expressed
between PEG-treated and MS control plants over the three time points. Of these genes,
8,651, 9,858 and 10,867 genes were differentially expressed under osmotic stress in the
DS accession at 4 h, 8 h and 12 h after stress application, respectively; while 8,478,
11,273, 13,407 genes were differentially expressed at the corresponding time points in
the DT accession after stress application. The degree of differential gene expression
between the DS and DT accessions increased with time after the stress application,
comprising 1,522, 2,514 and 3,735 genes at 4h, 8 h and 12 h, respectively (Figure 7.2).
More DEGs were specifically up-regulated in DT than in DS at time points 4h and 8h,
with the largest number of DEGs responding at 8 h. Conversely, the DS accession
showed a greater number of down-regulated DEGs until 8 h, but at 12 h 7,268 DEGs
were specifically down-regulated in DT and only 3,523 in DS (Figure 7.2).
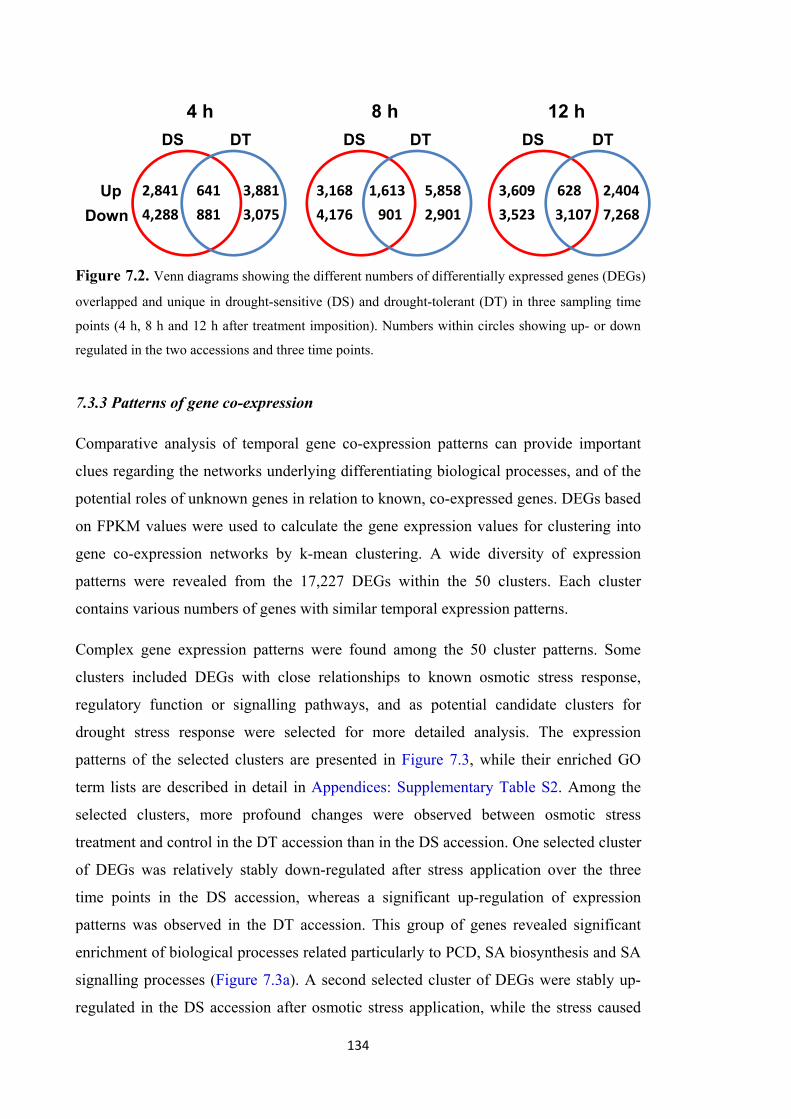
134
Figure 7.2. Venn diagrams showing the different numbers of differentially expressed genes (DEGs)
overlapped and unique in drought-sensitive (DS) and drought-tolerant (DT) in three sampling time
points (4 h, 8 h and 12 h after treatment imposition). Numbers within circles showing up- or down
regulated in the two accessions and three time points.
7.3.3 Patterns of gene co-expression
Comparative analysis of temporal gene co-expression patterns can provide important
clues regarding the networks underlying differentiating biological processes, and of the
potential roles of unknown genes in relation to known, co-expressed genes. DEGs based
on FPKM values were used to calculate the gene expression values for clustering into
gene co-expression networks by k-mean clustering. A wide diversity of expression
patterns were revealed from the 17,227 DEGs within the 50 clusters. Each cluster
contains various numbers of genes with similar temporal expression patterns.
Complex gene expression patterns were found among the 50 cluster patterns. Some
clusters included DEGs with close relationships to known osmotic stress response,
regulatory function or signalling pathways, and as potential candidate clusters for
drought stress response were selected for more detailed analysis. The expression
patterns of the selected clusters are presented in Figure 7.3, while their enriched GO
term lists are described in detail in Appendices: Supplementary Table S2. Among the
selected clusters, more profound changes were observed between osmotic stress
treatment and control in the DT accession than in the DS accession. One selected cluster
of DEGs was relatively stably down-regulated after stress application over the three
time points in the DS accession, whereas a significant up-regulation of expression
patterns was observed in the DT accession. This group of genes revealed significant
enrichment of biological processes related particularly to PCD, SA biosynthesis and SA
signalling processes (Figure 7.3a). A second selected cluster of DEGs were stably up-
regulated in the DS accession after osmotic stress application, while the stress caused
DS
4 h 8 h 12 h
DT DS DS DT DT
2,841 641 3,881
4,288 881 3,075
Up
Down 4,176
3,168 1,613
901
5,858
2,901 3,523
3,609 628
3,107
2,404
7,268

135
initial down-regulation in the DT accession at 4h but a strong swing towards up-
regulation at 8 h and 12 h. This group of genes was significantly enriched with the
removal of superoxide or reactive oxygen radicals and phosphorus metabolism (Figure
7.3b). A group of DEGs showing similar patterns between the DS and DT accessions
over all three time points, with initial down-regulation followed by up-regulation at 12 h,
were enriched significantly for general abiotic stress regulation mechanisms (e.g.
response to salinity, JA stimulus, osmotic stress, etc.; Figure 7.3c). On the other hand, a
further cluster of DEGs showing differential expression patterns between DS and DT
over the three time points were enriched for JA stimulus, receptor and abscisic acid
signalling pathways and programmed cell death (Figure 7.3d).
Figure 7.3. Figures were selected from 50 clusters using k-means cluster approach to represent
three different types of gene expression trends between drought-sensitive (DS) and drought-tolerant
(DT) accessions. Selected clusters were those differentially expressed genes (DEGs) that closely
associate and enriched with biological process responding to osmotic stress or regulatory functions. a)
DEGs were relatively stable down-regulated along three time points in DS accession, while a
significant increase expression patterns were found in DT. b) DEGs were relative stable up-regulated
in DS accession, while initially down-regulated in DT accession at 4 h but vertically changed to up-
regulated at 8 h and 12 h time points. c) DEGs showed similar patterns between DS and DT
accession in three time points, which showed down-regulated trend from 4 h to 8 h period, but
reverse to up-regulation. d) DEGs showed different patterns between DS and DT in three time points.
Details of top 50 enriched GO terms refer to Appendices: Supplementary Table S2). Each time point
stand for the log2-fold change between PEG-stressed and MS control samples in DS and DT
accessions at 4 h, 8 h and 12 h time points, respectively.

136
7.3.4 Gene ontology (GO) classification
In order to understand the gene expression and examine the macro-level distribution of
gene functions for PEG-induced osmotic stress in both the DS and DT genotypes, we
first retrieved the GO annotations of all DEGs from the GO database. Of the 29,178
detected DEGs, only 15,779 had assigned GO terms. The functional classifications of
the GOs retrived by the WEGO online software were classified into 10, 14 and 23
functional groups corresponding to the three GO output categories “cellular component”,
“molecular function” and “biological process”, respectively (Figure 7.4).
The number of GO terms corresponding to the DEGs increased from each time point to
the next in both the DS and DT accessions for the biological process categories “cellular
process”, “metabolic process” and “response to stimulus” (Figure 7.5a), and for the
molecular function category “binding and catalytic activity” (Figure 7.5b). Notably,
considerably more DEGs were assigned to the biological process “response to stimulus”
in DT than in DS, especially at 12 h.
Figure 7.4. GO functional classification of 15,779 genes detected from 12 libraries with annotated
GO terms. The results are summarised in the three main categories as cellular component, molecular
function and biological process. In each of the three main categories of the GO classification, there
were 10, 14 and 23 functional groups, respectively.
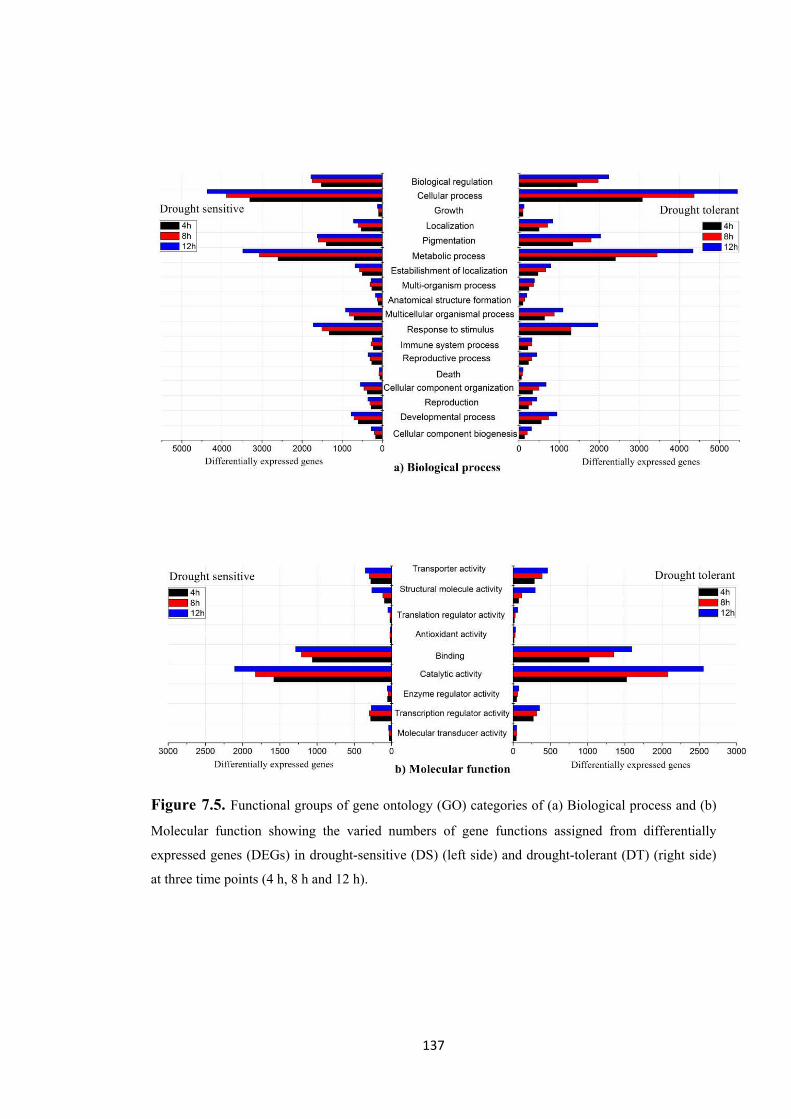
137
Figure 7.5. Functional groups of gene ontology (GO) categories of (a) Biological process and (b)
Molecular function showing the varied numbers of gene functions assigned from differentially
expressed genes (DEGs) in drought-sensitive (DS) (left side) and drought-tolerant (DT) (right side)
at three time points (4 h, 8 h and 12 h).
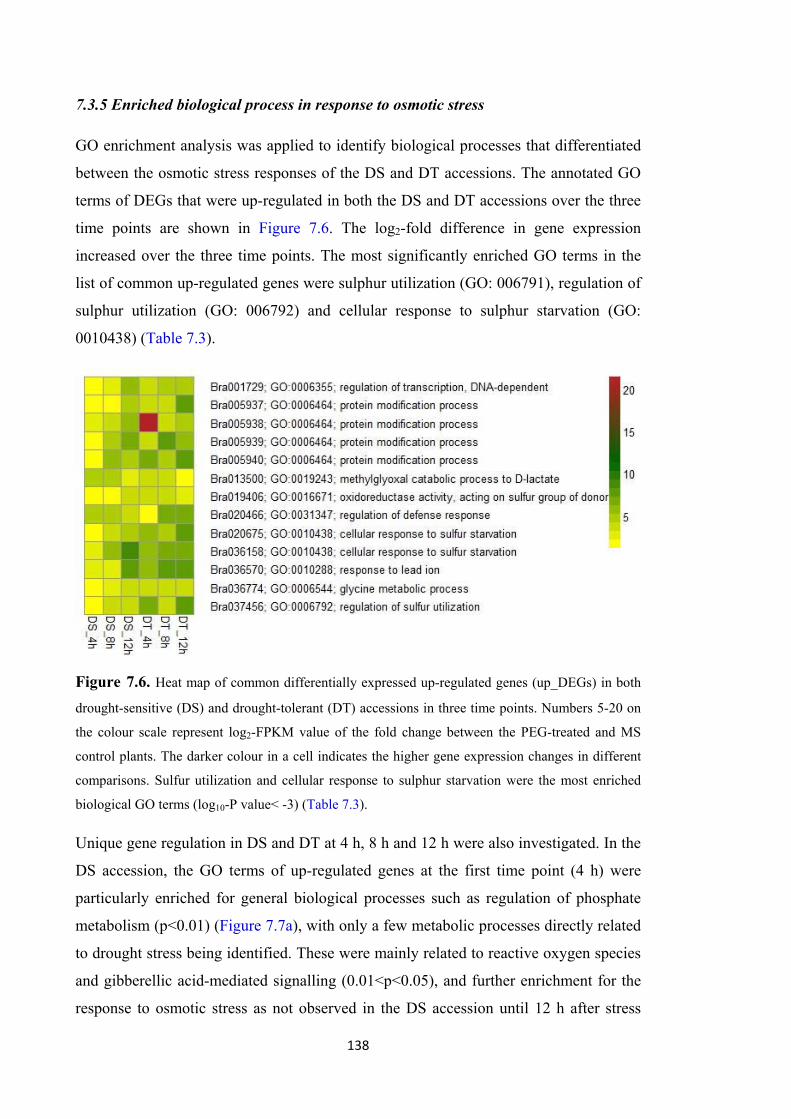
138
7.3.5 Enriched biological process in response to osmotic stress
GO enrichment analysis was applied to identify biological processes that differentiated
between the osmotic stress responses of the DS and DT accessions. The annotated GO
terms of DEGs that were up-regulated in both the DS and DT accessions over the three
time points are shown in Figure 7.6. The log2-fold difference in gene expression
increased over the three time points. The most significantly enriched GO terms in the
list of common up-regulated genes were sulphur utilization (GO: 006791), regulation of
sulphur utilization (GO: 006792) and cellular response to sulphur starvation (GO:
0010438) (Table 7.3).
Figure 7.6. Heat map of common differentially expressed up-regulated genes (up_DEGs) in both
drought-sensitive (DS) and drought-tolerant (DT) accessions in three time points. Numbers 5-20 on
the colour scale represent log2-FPKM value of the fold change between the PEG-treated and MS
control plants. The darker colour in a cell indicates the higher gene expression changes in different
comparisons. Sulfur utilization and cellular response to sulphur starvation were the most enriched
biological GO terms (log10-P value< -3) (Table 7.3).
Unique gene regulation in DS and DT at 4 h, 8 h and 12 h were also investigated. In the
DS accession, the GO terms of up-regulated genes at the first time point (4 h) were
particularly enriched for general biological processes such as regulation of phosphate
metabolism (p<0.01) (Figure 7.7a), with only a few metabolic processes directly related
to drought stress being identified. These were mainly related to reactive oxygen species
and gibberellic acid-mediated signalling (0.01<p<0.05), and further enrichment for the
response to osmotic stress as not observed in the DS accession until 12 h after stress
139
application. In contrast, a much higher number of DEGs in the DT accession were
enriched for GO-terms related to osmotic stress-related metabolism (Figure 7.7b). A
much more sophisticated and complex regulatory response was activated in the DT
accession just 4 h after the osmotic stress application, with the terms “jasmonic acid
mediated signalling pathways”, “regulation of reactive oxygen species metabolism”,
“MAPK cascade” and “response to salicylic acid stimulus” being prominently
represented. A similar complexity of the regulatory response was identified at all of the
three time points (Figure 7.7b). Detailed lists of the enriched GO terms are provided in
Appendices: Supplementary Table S3 and S4.
A similar trend was also observed for the enrichment of molecular functions from up-
regulated unique DEGs in the two accessions (Figure 7.8). In this case, calcium-
dependent protein kinases and heat shock proteins were enriched in the DT accession
from 4 h after imposition of stress, while a similar trend was not detected in DS until 12
h after stress application (Appendices: Supplementary Table S5 and S6).
7.3.6 Early stress response of the drought-tolerant accession
We considered the DEGs that were uniquely activated in the DT accession at 4 h after
the stress application to be of particular interest for elucidating the genetic basis of the
stress tolerance response. A total of 238 genes with documented responsiveness to
drought or osmotic stress were selected from the GO annotation biological process
category “responsive to stimulus” (Figure 7.4). Figure 7.9 shows a heat map presenting
the log-2 fold gene expression changes of these selected genes between PEG-stressed
and MS control conditions in DT (Figure 7.9). One group of co-expressed genes
(highlighted in Figure 7.9A), with greater up-regulation in DT at 4 h after stress
application, revealed activation of various hormone regulatory pathways including
ethylene, ABA, brassinosteroid, cytokinin, JA and GA-mediated signalling and
regulation pathways (Figure 7.9B, 7.9C). These genes were selected for further
validation.
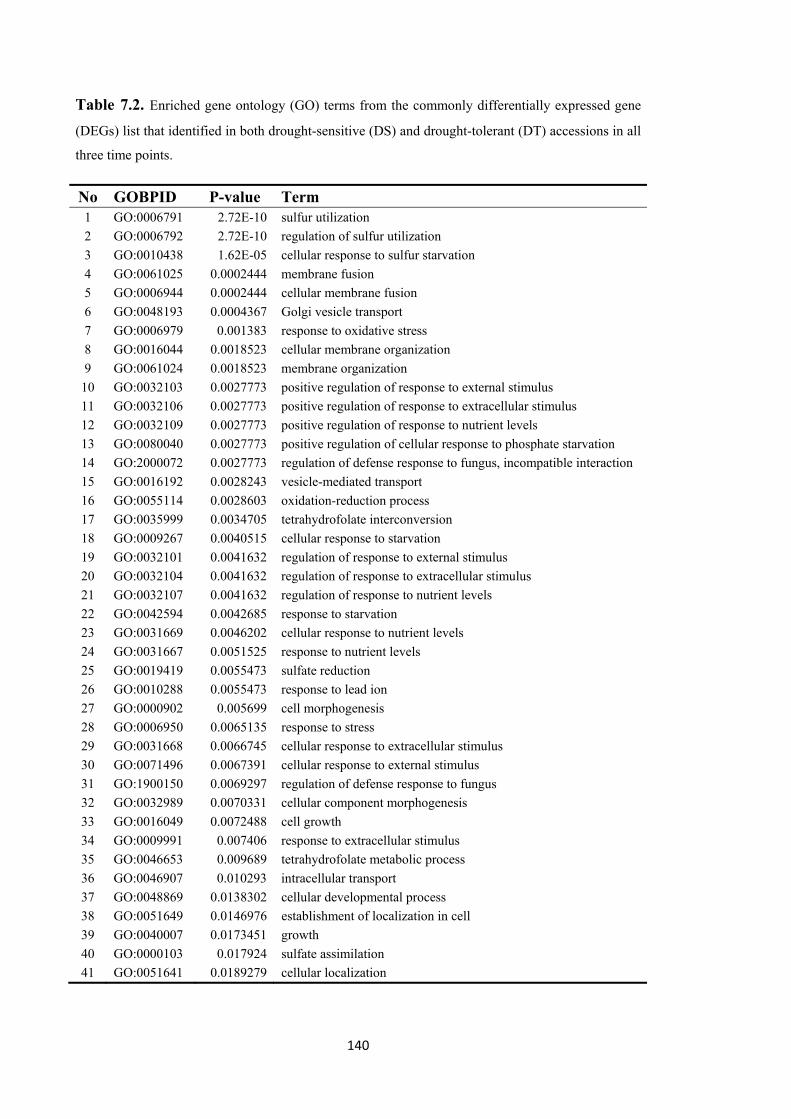
140
Table 7.2. Enriched gene ontology (GO) terms from the commonly differentially expressed gene
(DEGs) list that identified in both drought-sensitive (DS) and drought-tolerant (DT) accessions in all
three time points.
No GOBPID P-value Term 1 GO:0006791 2.72E-10 sulfur utilization
2 GO:0006792 2.72E-10 regulation of sulfur utilization
3 GO:0010438 1.62E-05 cellular response to sulfur starvation
4 GO:0061025 0.0002444 membrane fusion
5 GO:0006944 0.0002444 cellular membrane fusion
6 GO:0048193 0.0004367 Golgi vesicle transport
7 GO:0006979 0.001383 response to oxidative stress
8 GO:0016044 0.0018523 cellular membrane organization
9 GO:0061024 0.0018523 membrane organization
10 GO:0032103 0.0027773 positive regulation of response to external stimulus
11 GO:0032106 0.0027773 positive regulation of response to extracellular stimulus
12 GO:0032109 0.0027773 positive regulation of response to nutrient levels
13 GO:0080040 0.0027773 positive regulation of cellular response to phosphate starvation
14 GO:2000072 0.0027773 regulation of defense response to fungus, incompatible interaction
15 GO:0016192 0.0028243 vesicle-mediated transport
16 GO:0055114 0.0028603 oxidation-reduction process
17 GO:0035999 0.0034705 tetrahydrofolate interconversion
18 GO:0009267 0.0040515 cellular response to starvation
19 GO:0032101 0.0041632 regulation of response to external stimulus
20 GO:0032104 0.0041632 regulation of response to extracellular stimulus
21 GO:0032107 0.0041632 regulation of response to nutrient levels
22 GO:0042594 0.0042685 response to starvation
23 GO:0031669 0.0046202 cellular response to nutrient levels
24 GO:0031667 0.0051525 response to nutrient levels
25 GO:0019419 0.0055473 sulfate reduction
26 GO:0010288 0.0055473 response to lead ion
27 GO:0000902 0.005699 cell morphogenesis
28 GO:0006950 0.0065135 response to stress
29 GO:0031668 0.0066745 cellular response to extracellular stimulus
30 GO:0071496 0.0067391 cellular response to external stimulus
31 GO:1900150 0.0069297 regulation of defense response to fungus
32 GO:0032989 0.0070331 cellular component morphogenesis
33 GO:0016049 0.0072488 cell growth
34 GO:0009991 0.007406 response to extracellular stimulus
35 GO:0046653 0.009689 tetrahydrofolate metabolic process
36 GO:0046907 0.010293 intracellular transport
37 GO:0048869 0.0138302 cellular developmental process
38 GO:0051649 0.0146976 establishment of localization in cell
39 GO:0040007 0.0173451 growth
40 GO:0000103 0.017924 sulfate assimilation
41 GO:0051641 0.0189279 cellular localization
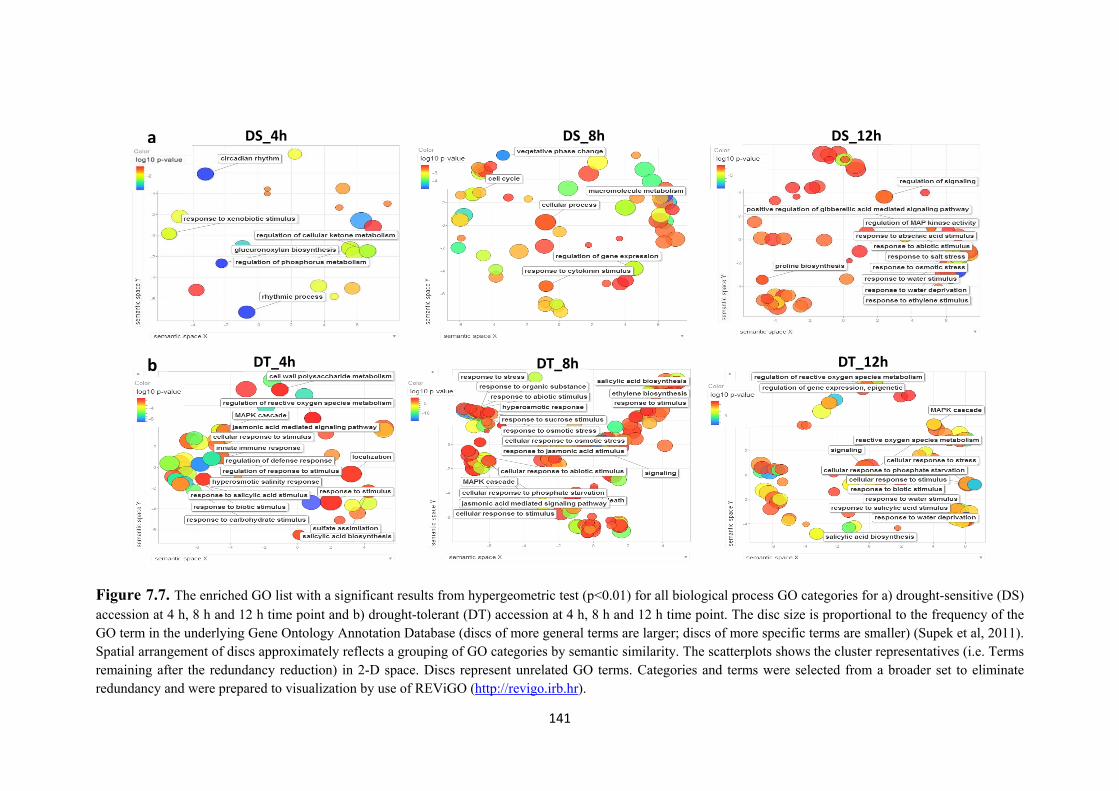
141
Figure 7.7. The enriched GO list with a significant results from hypergeometric test (p<0.01) for all biological process GO categories for a) drought-sensitive (DS) accession at 4 h, 8 h and 12 h time point and b) drought-tolerant (DT) accession at 4 h, 8 h and 12 h time point. The disc size is proportional to the frequency of the GO term in the underlying Gene Ontology Annotation Database (discs of more general terms are larger; discs of more specific terms are smaller) (Supek et al, 2011). Spatial arrangement of discs approximately reflects a grouping of GO categories by semantic similarity. The scatterplots shows the cluster representatives (i.e. Terms remaining after the redundancy reduction) in 2-D space. Discs represent unrelated GO terms. Categories and terms were selected from a broader set to eliminate redundancy and were prepared to visualization by use of REViGO (http://revigo.irb.hr).
a
b
DS_4h
DT_4h
DS_8h DS_12h
DT_8h DT_12h
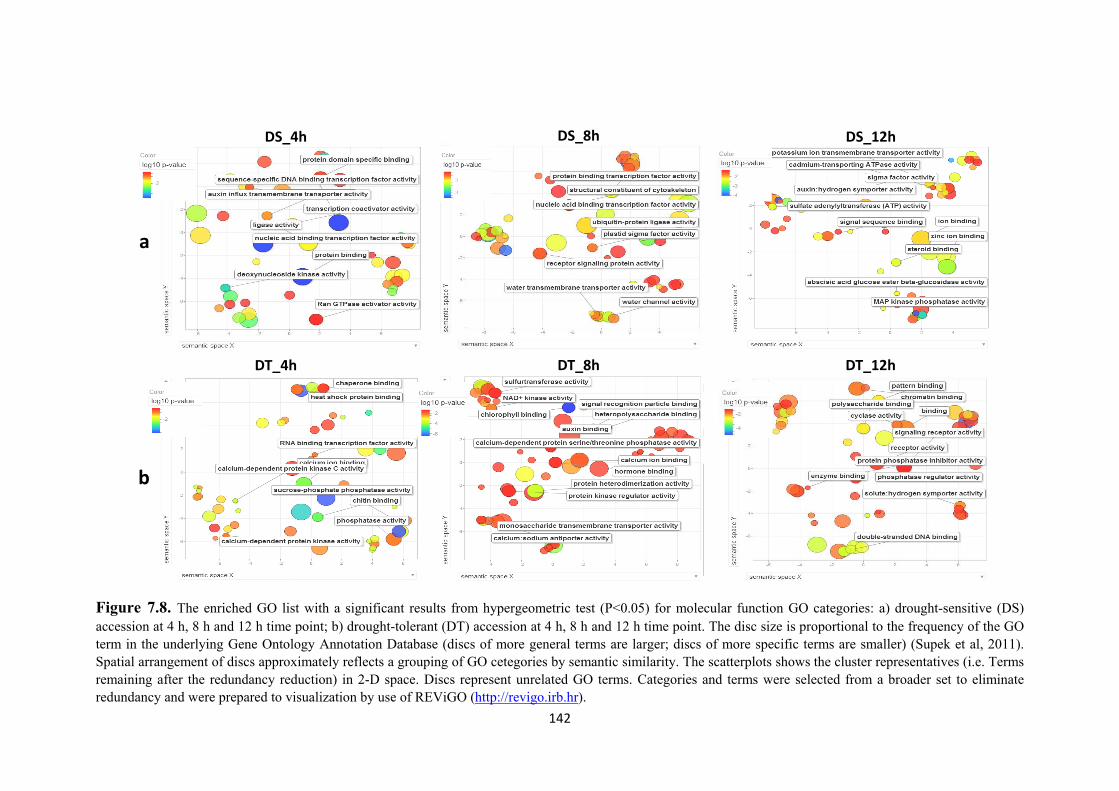
142
Figure 7.8. The enriched GO list with a significant results from hypergeometric test (P<0.05) for molecular function GO categories: a) drought-sensitive (DS) accession at 4 h, 8 h and 12 h time point; b) drought-tolerant (DT) accession at 4 h, 8 h and 12 h time point. The disc size is proportional to the frequency of the GO term in the underlying Gene Ontology Annotation Database (discs of more general terms are larger; discs of more specific terms are smaller) (Supek et al, 2011). Spatial arrangement of discs approximately reflects a grouping of GO cetegories by semantic similarity. The scatterplots shows the cluster representatives (i.e. Terms remaining after the redundancy reduction) in 2-D space. Discs represent unrelated GO terms. Categories and terms were selected from a broader set to eliminate redundancy and were prepared to visualization by use of REViGO (http://revigo.irb.hr).
DS_4h
DT_4h
DS_8h
DT_8h DT_12h
DS_12h
a
b
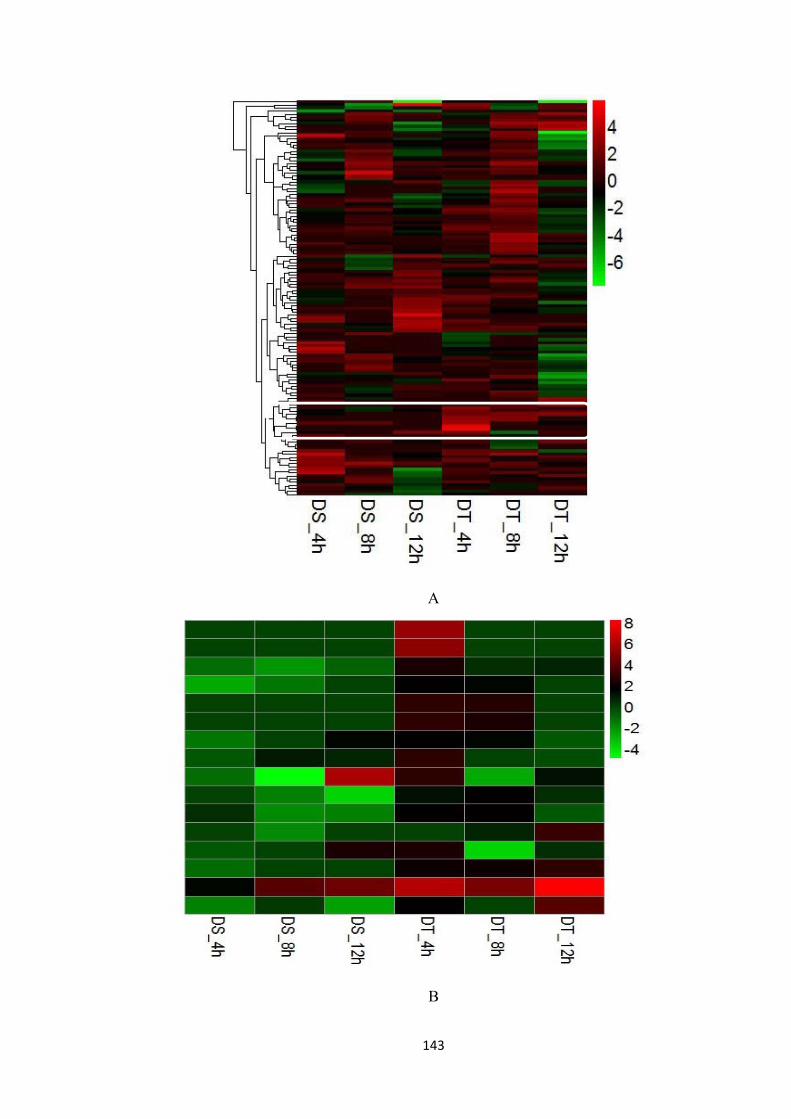
143
A
B
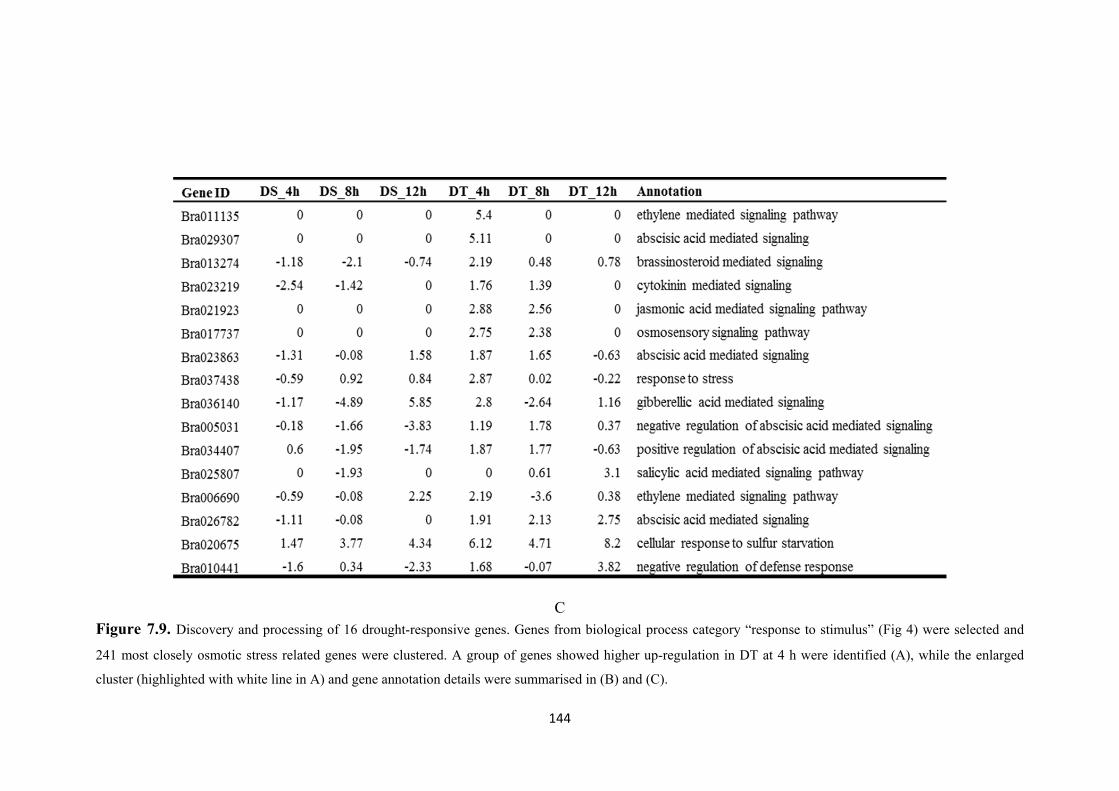
144
C Figure 7.9. Discovery and processing of 16 drought-responsive genes. Genes from biological process category “response to stimulus” (Fig 4) were selected and
241 most closely osmotic stress related genes were clustered. A group of genes showed higher up-regulation in DT at 4 h were identified (A), while the enlarged
cluster (highlighted with white line in A) and gene annotation details were summarised in (B) and (C).
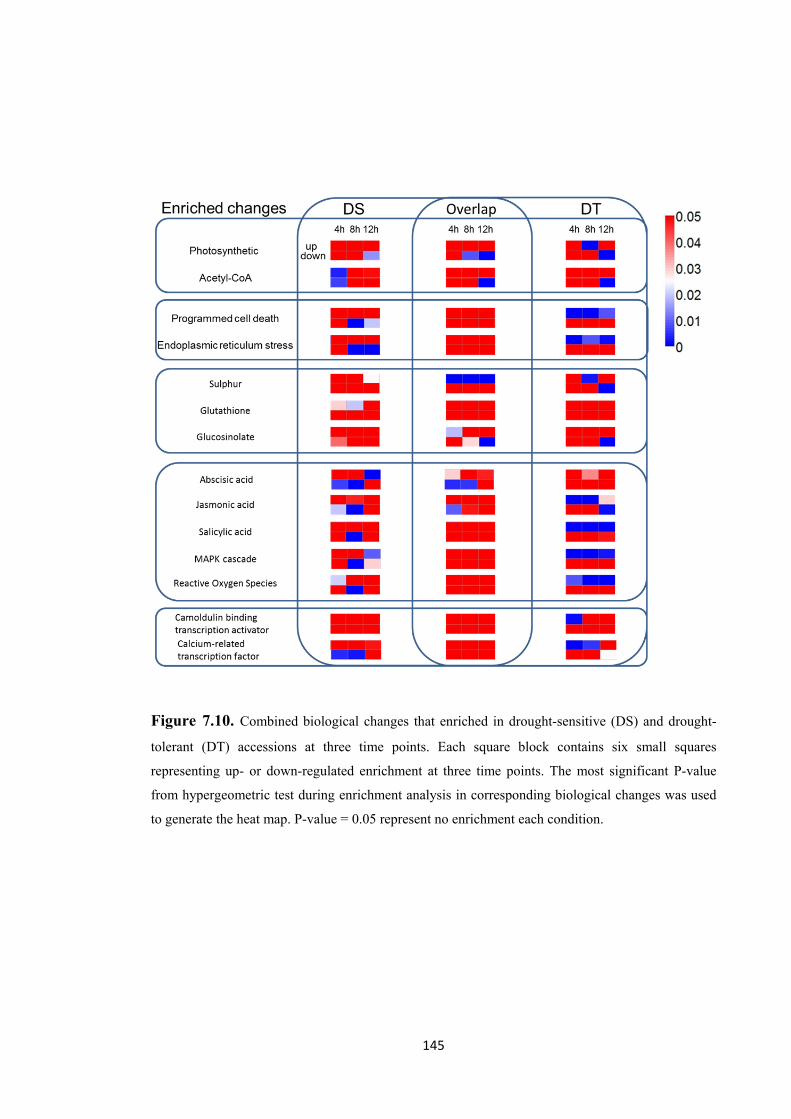
145
Figure 7.10. Combined biological changes that enriched in drought-sensitive (DS) and drought-
tolerant (DT) accessions at three time points. Each square block contains six small squares
representing up- or down-regulated enrichment at three time points. The most significant P-value
from hypergeometric test during enrichment analysis in corresponding biological changes was used
to generate the heat map. P-value = 0.05 represent no enrichment each condition.
146
7.4 Discussion
Identification of the key differences in gene regulation between drought-sensitive (DS)
and drought-tolerant (DT) B. rapa accessions represents a major advance in our
understanding of the genetic mechanisms of drought tolerance in this species. This
study provides a detailed sequence-based analysis of transcriptomes from DS and DT
accessions during the 12 hours after application of osmotic stress, compared to the gene
expression under non-stress control conditions. Analysis of gene networks exhibiting
differential expression patterns after stress application provided important new
information towards a better understanding of the mechanisms underlying the regulation
of drought stress susceptibility and tolerance in this species. The results are highly
relevant not only for B. rapa, which includes a variety of important vegetable, oilseed
and fodder crops, but also for close relatives for which the B. rapa gene pool is
frequently exploited to enrich breeding pools. In particular, B. rapa is an important
source of genetic diversity for the gene pool of the globally important oilseed crop
canola/oilseed rape (B. napus).
7.4.1 Drought tolerance is associated with rapid activation of drought-responsive
gene expression networks
One of the most striking differences between the DS and DT accessions in their
response to the applied osmotic stress was characterized by the speed of reaction in
terms of up-regulation of general stress responsive pathways (Figure 7.10). The initial
response of the DS accession was limited to relatively minor changes in gibberellic acid
signaling and brassionosteroid stimulus responses. This indicates that stress symptoms
were being registered at this time point in the DS accession, however little evidence was
observed for induction of a proactive response to combat the stress. The DT accession,
on the other hand, showed a rapid and pronounced activation of multiple stress response
mechanisms, including response networks to SA, MAPK cascade and JA stimulus.
Furthermore, drought-related transcription factors such as calcium-dependent protein
kinase (CDPK) genes and sucrose-phosphate activity were already observed in the DT
accession 4 h after stress induction. A corresponding stress-related gene activation was
not induced in the DS accession until 12 h after the imposition of the osmotic stress
treatment. The rapid and multifaceted stress response in the DT accession can be

147
assumed to provide a considerably greater protection from water deficiency following
the onset of the osmotic stress.
7.4.2 Early drought responses are induced by hormone signaling and regulation
Various signalling pathways are involved in the regulation of plants in response to
osmotic stress. Enrichment for DEGs involved in hormone-related regulation and
signalling pathways in the DT accession 4 h after stress induction indicate that these
pathways play an important role in the early stress tolerance response. One of the major
hormones that plays a key role in adaptive responses to drought stress in ABA, which
regulates a large number of genes (Cutler et al. 2010). Specfically in drought reactions,
ABA is known to control the expression of genes involved in formation of reactive
oxygen species (ROS) such as hydrogen peroxide (H2O2), hence it is responsible for
H2O2-dependent closure of the stomatal aperture (Sharma and Verslues 2010). Of the 16
drought-responsive genes we identified that were uniquely up-regulated in the DT
accession 4 h after the onset of stress (Figure 7.9C), 3 were annotated to play a role in
ABA-mediated signalling. In association with with other hormone-related signalling
pathways, these genes may play an important role in the early stage osmotic stress
response in B. rapa, reducing water loss by stomatal closure.
The well-known stress response hormones SA and JA generate a wide range of
metabolic and physiological responses in relation to abiotic stress in plants (Huang et al.
2008; Hayat et al. 2010). In various crops such as rice, wheat and barley, drought
tolerance has been found to be improved by applying exogenous SA (Farooq et al. 2009;
Kang et al. 2013; Fayez and Bazaid 2014). Our results showed that genes involved in
cellular response and signalling pathways related to SA and JA were already enriched in
the DT accession at 4 h after stress application, and remained up-regulated after 8 h and
12 h. In contrast, no up-regulation of SA- or JA-related genes was observed in the DS
accession (Figure 7.10). This indicates that the DS accession failed to respond to the
onset of osmotic stress with physiological protection processes.
7.4.3 Tolerance to osmotic stress involves a programmed cell death (PCD) response
Programmed cell death (PCD) affords cells the ability to self-destruct in a controlled
manner as a response to stress. PCD is believed to be regulated and involved with plant
148
development and plant defense (van Doorn and Woltering 2004), and is a well-known
resistance response to attacks by biotrophic pathogens. Like hormone signaling and
other stress-responsive genes, PCD genes can also be induced by various abiotic stimuli
such as salt stress, osmotic stress, or endoplasmic reticulum (ER) stress (van Doorn and
Woltering 2004; Duan et al. 2010; Wang et al. 2010; Cai et al. 2014), particularly in the
plant roots (Huh et al. 2002). It has also been shown to be accelerated by hormones,
such as ABA or SA (van Doorn and Woltering 2004; Huang et al. 2008; Hayat et al.
2010), whose expression can also be induced by various stress factors.
In our experiment, we identified the activation of a genetic response to cell death and
PCD in the DT accession 4 h after stress application (Figure 7.10; Appendices:
Supplementary Table S3), whereas the DS accession showed no such response at this
time point. Cai et al. (2014) described how formation of proteins in the endoplasmic
reticulum (ER) can lead to stress that induces PCD. In accordance with this finding,
genes involved in the response to ER stress were significantly enriched in the DT
accession at this early time point after stress induction, indicating an early response with
a potential effect of minimizing tissue damage due to water deficit. In contrast, PCD-
related gene expression changes were not seen in the DS accession until after 8h
treatment, and they occurred in a passive manner with a down-regulation of genes
responsible for negative regulation of PCD (Figure 7.9; Appendices: Supplementary
Table S4). This indicates that the response in the DS accession is more the result of cell
death due to tissue dehydration rather than being an active mechanism to restrict tissue
decomposition.
7.4.4 Differential transcription factor activation and signal responses in the osmotic
stress reaction
Transcription factors (TFs) play critical roles in the modulation of gene expression in
response to drought and other abiotic stresses. Calcium-related TFs such as calcium-
dependent protein kinases (CDPKs), calcium B-like (CBL) proteins and calcium-
modulated proteins (calmodulin – CaM), along with their corresponding kinases
(CIPKs), were frequently reported to regulate resistance responses against abiotic stress.
For example, Pandey et al. (2013) demonstrated that the calmodulin transcription
activator CAMTA 1 regulates drought responses in Arabidopsis thaliana.
149
Corresponding to this finding we observed a clear enrichment of genes involved in
calcium-related binding or signalling in the DT accession at 4 h and 8 h after stress
application. In contrast, the DS accession was characterised by a much more passive
regulatory response throughout the duration of the stress treatment. Transcriptional
activators of calcium-modulated stress responses therefore also appear to be highly
interesting candidates for regulation of drought resistance strategies in Brassica species.
7.4.5 Sulphur assimilation and metabolism play important roles in drought response
in B. rapa
Alongside the differentially regulated genes or metabolites, we also observed various
common regulatory changes between the DS and DT accessions throughout the duration
of the osmotic stress treatment. In particular, genes involved in sulphur assimilation and
regulation were up-regulated in both the DS and the DT accession throughout the entire
duration of the stress treament. This demonstrates that sulphur regulation is a key
component of the stress response both in resistant and susceptible B. rapa plants.
Sulphur is an essential element for plant growth due to its presence in proteins,
glutathione, phytochelatins, thioredoxins, chloroplast membrane lipids, and certain
coenzymes and vitamins (Khan et al. 2010). Sulphur applied as sulphate or element
sulphur has been found to play a significant role in drought stress signalling and
responses (Chan et al. 2013).
Different regulators of sulphur metabolism have been identified, but the signal
transduction toward supply and demand, as well as coordination with other assimilatory
pathways, are unknown (Takahashi et al. 2011). Remarkably, sulphate is the only
macronutrient that increases in the xylem sap during drought, while others such as
nitrate and phosphate are not affected, indicating a higher demand of sulphate in leaves
during drought (Ernst et al. 2010). This increase could be caused by the regulatory
function of sulphate in ABA signalling, as ABA regulates several components of
sulphur assimilation including sulphate transport, cysteine synthesis and flux into
primary assimilation. On the other hand, there is as yet no clear understanding of these
processes (Urano et al. 2009), making this topic of great interest for future exploration.
Interestingly, sulphur assimilation is also likely to be regulated by glutathione during
drought, and glutathione was found to inhibit sulphate uptake in roots of canola plants
150
(B. napus) plants (Lappartient and Touraine 1996). In our study, although we found
sulphur-related drought responses to be common to both the DS and DT accessions, we
observed no regulation in the DT accession in all three times, whereas glutathione-
related genes were up-regulated in the DS accession at 4 h and 8 h after stress
application (Figure 7.10). This result suggests that glutathione could be a key factor in
delaying the response to osmotic stress in drought sensitive B. rapa.
Similarly, glucosinolate biosynthetic and metabolic processes also showed stress
responsiveness in both accessions at all three time points after stress application.
Glucosinolates are a class of secondary metabolites that exist exclusively in
Brassicaceae, besides a clear interactive role with regard to both beneficial and harmful
biotic factors, glucosinolates may also play a role in regulation of drought stress (del
Carmen Martínez-Ballesta et al. 2013). Interestingly, as glucosinolate may represent up
to 30% of the total sulphur content of plant organs, the regulation of glucosinolates are
intimately related to the sulphur status of the entire plant (Falk et al. 2007). An
increased sulphur supply has been shown to result in higher levels of total
glucosinolates in Brassica species after moderate or severe drought stress (Zhang et al.
2008; Schreiner et al. 2009; Gutbrodt et al. 2012). However, when sulphur supply is
deficient, there is a general down-regulation of glucosinolate biosynthetic genes,
accompanied by an up-regulation of genes controlling sulphur uptake and assimilation
(Falk et al. 2007). A similar response was clearly observed in our study: glucosinolate
biosynthetic process genes were quickly up-regulated only 4 h after osmotic stress
application in both accessions, but reverted back to down-regulation at 8 h and 12 h
(Figure 7.10). This can be explained by the depletion of sulphur caused by stress-related
up-regulation of sulphur assimilation across the duration of the stress application.
7.4.6 B. rapa as a source of genetic variation for improvement of drought tolerance in
B. napus
Hatzig et al. (2014) applied a similar osmotic treatment system to investigate hormone
metabolism and metabolic status in drought-sensitive and drought-tolerant B. napus
varieties. That study also revealed a similar hormonal adjustment and osmolyte
accumulation in DT accessions compared to DS accessions; however the differentiation
of the stress response between tolerant and susceptible B. napus accessions in that study
did not occur until considerably later, when the stress treatment (PEG concentration)
151
was increased. Furthermore, the main difference between the DT and DS B. napus
accessions seemed to be characterised by a lack of response of the DS accession
compared to the DT accession, similar to what we observed here in B. rapa in this study.
Given that the extremely rapid activation of multiple, proactive stress defence
mechanisms in the DT B. rapa accession, the results indicate that the DT B. rapa
accession may harbour a superior, rapid stress resistance modulated by rapid induction
of multiple, complex regulatory stress response pathways. We conclude that DEGs
induced in the stress-tolerant B. rapa accession, at a very early stage after the onset of
stress, lead to a rapid cascade of molecular and biological changes that confer different
layers of morphological and metabolic protection against drought.


152
Chapter 8
8 General Discussion
8.1 Introduction
Crops are often grown in environments that are suboptimal, which prevents them from
expressing their full genetic potential for growth and reproduction (Blum 2011b).
Drought is a common stress encountered by crops, and can reduce growth and seed
yield. Plant responses to different stresses are highly complex and involve changes at
genome, transcriptome, cellular and physiological levels. Breeding strategies for
selection of tolerance should reflect these complex responses. This thesis is part of
broader breeding research activities aimed at improving drought and heat tolerance in B.
rapa with the ultimate aim of transferring useful genes into the more economically
significant crop species, B. napus (rapeseed, canola). In this thesis, I have developed a
screening protocol for drought tolerance based on an understanding of the genetic
background, physiological response as well as transcriptome changes during drought.
8.2 Key findings of this thesis
8.2.1 Evaluation of genetic and allelic diversity in B. rapa
A genetically-diverse global collection of B. rapa provided the foundation for this
drought-tolerance screening project. Previous researchers have shown large genetic
variation in B. rapa based on AFLP and SSR molecular markers (Das et al. 1999; Zhao
et al. 2005; Annisa et al. 2013a), and SSR markers were used for the creation of a core
153
collection for this species by Zhao et al. (2010). Wild and weedy type B. rapa (ssp.
sylvestris) is thought to originate from the western Mediterranean region, and Europe to
Central and West Asia (Sinskaia 1928; Vavilov 1949), and was found to have much
wider genetic diversity than cultivated types (Anderson et al. 2009). Wild types were
included in the research on this thesis, due to their great potential as a source of
drought-stress tolerance, and for inclusion in future breeding for drought tolerance in B.
rapa. The SSR genetic relationship between wild-type accessions and current cultivars
was investigated. Using STRUCTURE and 2D-MDS analysis (Figure 3.4), the wild
accessions all clustered in one group (G1), with higher genetic dissimilarity level
compared to other accessions, providing higher potential with novel resources in
breeding projects, and the representative two wild type accessions were found to be
more tolerant in drought tolerance screening in later experiments (Chapter 5).
The B. rapa accessions from eight geographical regions were compared by pairwise
population values based on AMOVA analysis of SSR allelic diversity (Table 3.8).
Generally, eastern regions were significantly different from each other and from western
regions (the Old World regions), indicating more than one centre of diversity and
domestication, as proposed by Song et al. (1988a). However, all the wild types of B.
rapa ssp. sylvestris were found in G1, suggesting that the classical Old World was the
centre of origin of this species (Chapter 3). B. rapa accessions from America and
Australia were not significantly different from most other regions, from which it was
concluded that B. rapa arrived in these regions as migrants in colonial times from the
Old World and Asia.
8.2.2 Towards large-scale drought tolerance screening methods
Identification of drought-tolerant genotypes among current cultivars, landraces and wild
relatives is the first step of an integrated method for improving drought tolerance of
crops (Varshney et al. 2011). However, screening for drought tolerance is not an easy
task, as it is a complex trait and associated with multiple physiological and molecular
changes (Blum 2011a). In Chapter 4 of this thesis, the physiological responses to
drought of a single B. rapa accession were evaluated during reproductive development.
In Chapter 5, nine B. rapa accessions, which represented the wide range of genetic
diversity in the species, were used to develop a large-scale method for drought tolerance
screening.

154
Inferring drought tolerance using thermal sensing of canopy temperature is based on the
principle that evapotranspiration of leaves reduces leaf surface temperature (Costa et al.
2012). Thermal sensing of leaf temperature has been used to assess drought stress in
crops and to predict irrigation requirements, and is an important tool in agricultural
production systems (Munns et al. 2010; Furbank and Tester 2011; Maes and Steppe
2012; Dhondt et al. 2013) as leaf temperature increases relative to ambient temperature
as drought causes stomata to close and to decrease the rate of leaf transpiration. Thus,
leaf temperature has been proposed as an effective method for screening drought or heat
tolerance in the field (Blum et al. 1989; Balota et al. 2007; Bahar et al. 2008). At the
commencement of the research reported in this thesis, however, thermal sensing of
floral buds had not been tested as an indicator of drought tolerance during the
reproductive phase. Therefore we pioneered the use of thermal sensing of reproductive
tissues during drought stress and showed that it could be used as a method for screening
of drought tolerance in the early reproductive stage of B. rapa. A non-destructive
infrared thermometer was used to show that bud temperatures were lower than leaf
temperatures during the transient drought stress, suggesting that reproductive processes
were protected by cool temperatures during drought stress. Leaf tissue remained lower
than ambient until a threshold soil moisture content was reached and then increased as
drought stress became more severe. This threshold soil moisture content was higher in
leaves than in reproductive buds. Below the threshold soil moisture content that closed
the leaf stomata and increased leaf temperature, floral buds continued to transpire
through open stomata and the buds remained cooler than the leaves (Chapter 4).
Potentially, tolerance to drought stress involves a complex feedback regulatory system
which stops moisture flow to leaves, which are sacrificed to protect buds where
transpiration continues to cool the reproductive tissues. This invoked the hypothesis,
investigated in Chapter 5, that drought tolerance in terms of seed production or biomass
should be positively correlated with lower temperatures in the reproductive tissues.
Drought tolerance is usually measured as the seed yield under drought relative to the
seed yield in adequately watered plants. However, self-incompatibility in many B. rapa
accessions prevented the use of self-seed production as the primary measure of drought
stress tolerance in the growth room. Therefore in addition to seed yield, total biomass at
maturity in the 10 accessions was measured following the 13-day water-stressed (WS)
treatment in the early reproductive phase (Chapter 5). Some accessions, especially the

155
wild type B. rapa, tolerated the 13-day WS treatment better than others as measured by
the relative biomass of accessions at maturity The accessions ATC92037 and CR2355
had 47.8% and 98.3% relative total biomass (Table 5.4) and were selected as the
representative drought-sensitive and drought-tolerant accessions for the subsequent
experiment (Chapter 7). Relative total biomass was significantly negatively correlated
with the average bud temperatures below ambient in the WS compared with WW
treatments. That is, accessions with cooler buds in the WS treatment had higher relative
total biomass at maturity. A similar correlation was found with the relative rate of bud
temperature increase in WS conditions: accessions with greater drought tolerance had a
slower rate of increase in the temperature of buds after the threshold was reached during
the WS treatment (Chapter 5). Thus we concluded that average bud temperature is a
useful measure of drought tolerance in B. rapa accessions. Indeed, significant genetic
variation existed among the 10 accessions for the relative values (WS vs WW) of
measured physiological and morphological traits like stomatal conductance and leaf
temperature. For example, relative silique length was also closely correlated with
relative biomass following the WS treatment. Average leaf and bud temperatures
measured during and after the WS treatment may be useful in large-scale drought
tolerance screening in plant breeding programmes.
8.2.3 Comparing drought tolerance expressed at the reproductive and seedling stages
In Brassica species, water supply is critical during flowering and early pod development
when the number of pods and seeds is being determined (Richards, 1978), therefore,
drought tolerance at the reproductive stage is potentially important for maintenance of
seed yield or biomass at maturity. As we have just discussed, relative biomass of non-
reproductive tissue was found to be a key indicator of drought tolerance at the
reproductive stage in B. rapa. However, at least two obstacles exist in screening drought
tolerance in genetically diverse B. rapa at the reproductive stage, namely, self-
incompatibility (which prevents self-pollination) and inconsistent flowering time
resulting from different vernalisation requirements. Those accessions with a
vernalisation requirement or self-incompatibility must be identified before the screening
process begins (Chapter 3). As reproductive biomass was not a suitable assay for
drought tolerance in self-incompatible accessions, we assessed the possibility of
evaluating drought tolerance in the seedling stage. Screening for drought tolerance at
156
the seedling stage has many advantages, with lower costs for plant growth and it avoids
the problem of self-incompatibility and vernalisation requirement (Rauf et al. 2008). A
comparison between the drought responses in the same 10 accessions at the seedling
stage with the drought responses at the reproductive stage showed that relative dry
weight in osmotic stress vs control conditions at the seedling stage was significantly
correlated with relative non-reproductive biomass and positively but not significantly
correlated with relative total biomass at the reproductive stage. Potentially, therefore,
initial screening for drought tolerance could occur at the seedling stage to reduce the
number of accessions that are further validated at the reproductive stage.
8.2.4 Unique regulatory pathways identified in tolerant accessions
Plants have evolved to live in environments where they are often exposed to different
stress factors. They have developed specific mechanisms that allow them to detect
environmental changes and respond to complex stress conditions, minimizing damage
while conserving valuable resources for growth and reproduction (Atkinson and Urwin
2012). Elucidating the underlying regulatory mechanisms between drought-sensitive
(DS) and drought-tolerant (DT) accessions is essential for the detection of drought-
tolerance genes for further study.
Differentially expressed genes (DEGs) between stressed and controlled conditions
reflect stress-induced changes at the level of gene expression, which can be further
analysed in terms of changes in regulatory pathways under stress. In previous research,
significantly under- or over-expressed DEGs were detected during stress conditions in
rice (Zhang et al. 2012) and barley (Guo et al. 2009). With the development of the
technologies for transcriptome analysis, RNA-seq is more easily applied to plant
systems under stress, where thousands of DEGs reveal significant changes in regulatory
pathways (Dugas et al. 2011). In Chapter 7, the DEGs between DS and DT accessions
were compared at three different time points at 4 h, 8 h and 12 h following the start of
an osmotic stress treatment on young seedlings, which simulated drought stress. Sulphur
assimilation and regulation as well as glucosinolate biosynthetic process were
commonly enriched in both DS and DT at all three times, revealing that glucosinolate
regulation could play a role in response to the osmotic stress perhaps as a generalised
defence mechanism to ward off herbivores at times of drought when there is reduced
availability of food sources. There was a much quicker response in terms of stress-

157
induced DEGs in DT than in DS accessions at 4 h, with an activation of drought-
responsive pathways such as phytohormone-mediated signalling (e.g. abscisic acid,
jasmonic acid and salicylic acid) and transcription factors, while fewer specific DEGs
were found in the DS accession (Figure 7.7). Like hormone signalling and transcription
factors, programmed cell death is also enriched in the DT accession at 4 h but were not
found until 8 h in the DS accession, another mechanism for the tolerant accession for
self-protection. The differences in gene regulation between the DS and DT accessions
confirmed the existence of unique regulatory pathways expressed in the DT accession
which are worthy of further investigation.
8.3 Summary and future work
In this thesis, a framework and model for identifying drought-tolerant germplasm and
drought-related genes has been demonstrated. The research has demonstrated valuable
phenotypic and genotypic variation for drought tolerance in B. rapa; an infrared leaf and
bud temperature-based screening method was developed for drought-tolerance at the
reproductive stage; and drought-related candidate genes from transcriptome analysis
were found in a drought-tolerant accession which will help direct molecular breeding
approaches to drought tolerance.
Further work and attention is recommended based on the research in this thesis.
First of all, extra attention needs to be paid to self-incompatibility in B. rapa for
drought-tolerance breeding. Self-incompatibility is commonly present in B. rapa
accessions and is a natural mechanism that prevents self-fertilization and crossing with
close relatives (Takayama et al. 2000; Takayama and Isogai 2005). Among B. rapa
accessions, only “yellow sarson” types from India have completely lost this trait in the
stigma (Fukai et al. 2001). This trait is inconvenient for yield-based evaluation of
drought tolerance in this species under controlled environment conditions. Self-
incompatibility is not normally a problem in open-pollinated field screening of B. rapa
due to the presence of compatible pollen from a diverse range of flowering accessions
and pollinators in the field. In Chapter 5, non-reproductive biomass was used as a
surrogate for seed yield and applied to the evaluation of 10 Brassica accessions;
methods should be explored to overcome self-incompatibility, such as spraying sodium
chloride (NaCl) (Fu et al. 1992) although this is not guaranteed to overcome the

158
problem. Alternatively, screening for lower leaf or bud temperatures under the WS
treatment will be useful to identify candidate drought tolerant accessions for future work.
Secondly, the drought-tolerance related genes identified in Chapter 7 should be
validated under soil-grown conditions. Seedlings tested in hydroponics allow easy
experimental access to the roots for physiological or biomass measurements, and the
PEG-simulated osmotic stress can be imposed precisely across replicated plants, which
is an ideal system for transcriptome analysis (Poorter et al. 2012). Candidate genes for
drought tolerance require validation in pot and field experiments to link the expression
at molecular level with the expression when grown in soil and an imposed water stress.
Thirdly, some breeding programs such as in maize, have led to plants which are tolerant
to drought (Bänziger et al. 2006). However, research programmes aimed at developing
tolerance to one particular stress may fail in practice if this is done in isolation of other
biotic or abiotic stresses. This can have unforeseen consequences, as improved
germplasm from the research laboratory may respond unpredictably when grown in
field conditions, as other abiotic stresses could occur at the same time (Collins et al.
2008). In previous work, B. rapa germplasm was evaluated for heat tolerance (Annisa et
al., 2013b), while in this thesis I have evaluated common germplasm for drought
tolerance (Chapter 5), and one accession (ATC95217) which showed heat tolerance
(Annisa et al. 2013b) did not show high tolerance to drought, indicating a complex
system behind these two stresses. In this thesis, two drought-tolerant wild types of B.
rapa (ssp. sylvestris) would be worthy of further investigation for heat tolerance.
Backcrossing to transfer drought tolerance from wild to cultivated types may be
accompanied by “linkage drag”. However, new methods of genomic selection could
remove undesirable alleles and retain target drought tolerance alleles based on the
“advanced backcross QTL analysis” of Tanksley and Nelson (1996). In fact, the
universal feature of abiotic stress is the generation of excess reactive oxygen species
(ROS) through impairment of biochemical reactions (Møller et al. 2007), and some
heat-stress related genes such as heat shock proteins were enriched in the drought-
tolerant accession after 4 hours of osmotic stress treatment in Chapter 7 (Appendices:
Supplementary Table S4). More research is required to demonstrate the similarities and
differences in key tolerance genes and gene pathways for both heat and drought
tolerance. Meanwhile, it will be important to include both stresses in breeding programs,
159
as both stresses are predicted to increase with global climate change and tend to appear
simultaneously under field conditions like in Australia.
Fourthly, drought-related genes identified in molecular genetic studies can be evaluated
for their function and underlying biochemical mechanisms, and can be located on the
genome with gene-specific molecular markers for the purposes of crossing or genetic
modification. All possible outcomes can be realised by combining methods of
conventional breeding strategies and modern technologies.
To summarise, the development of extensive genetic and genomic resources now
enables complex traits that were once intractable to be dissected at the genetic and
molecular level. In this thesis, a drought tolerance screening protocol was developed
and a comparison of drought tolerant and sensitive B. rapa revealed a complex
signalling network unique to the drought-tolerant accession. The utilization of these
resources has led to the identification of key genes that will be used to develop targeted
strategies for oilseed breeding. Therefore, the gradual understanding of the complex
regulatory mechanisms combined with comparative plant physiology holds great
promise for future oilseed improvement in drought or other abiotic stress tolerance
improvement.
160
References Ahmadi, M. and M. J. Bahrani, 2009: Yield and yield components of rapeseed as influenced by
water stress at different growth stages and nitrogen levels. Am. Eurasian J. Agric. Environ. Sci. 5, 755‐761.
Anderson, N. S., G. Poulsen, B. A. Andersen, L. P. Kiaer, T. D'Hertefeldt, M. J. Wilkinson and B. B. Jorgensen, 2009: Processes affecting genetic structure and conservation: a case study of wild and cultivated Brassica rapa. Genet. Resour. Crop Evol. 56, 189‐200.
Annisa, S. Chen and W. A. Cowling, 2013a: Global genetic diversity in oilseed Brassica rapa. Crop Pasture Sci. 64, 993‐1007.
Annisa, S. Chen, N. C. Turner and W. A. Cowling, 2013b: Genetic variation for heat tolerance during the reproductive phase in Brassica rapa. J. Agron. Crop Sci. 199, 424‐435.
Araus, J. L. and J. E. Cairns, 2014: Field high‐throughput phenotyping: the new crop breeding frontier. Trends Plant Sci. 19, 52‐61.
Ashraf, M. and M. R. Foolad, 2007: Roles of glycine betaine and proline in improving plant abiotic stress resistance. Environ. Exp. Bot. 59, 206‐216.
Atkinson, N. J. and P. E. Urwin, 2012: The interaction of plant biotic and abiotic stresses: from genes to the field. J. Exp. Bot. 63, 3523‐3544.
Bahar, B., M. Yildirim and C. Barutcular, 2009: Relationships between stomatal conductance and yield components in spring durum wheat under Mediterranean conditions. Not. Bot. Hort. Agrobot. 37, 45‐48.
Bahar, B., M. Yildirim, C. Barutcular and I. Genc, 2008: Effect of canopy temperature depression on grain yield and yield components in bread and durum wheat. Not. Bot. Hort. Agrobot. 36, 34‐37.
Baker, C. S., 2013: Journal of Heredity Adopts Joint Data Archiving Policy. J Hered 104, 1. Balota, M., W. A. Payne, S. R. Evett and M. D. Lazar, 2007: Canopy temperature depression
sampling to assess grain yield and genotypic differentiation in winter wheat. Crop Sci. 47, 1518‐1529.
Balota, M., W. A. Payne, S. R. Evett and T. R. Peters, 2008: Morphological and physiological traits associated with canopy temperature depression in three closely related wheat lines. Crop Sci. 48, 1897‐1910.
Bänziger, M., P. S. Setimela, D. Hodson and B. Vivek, 2006: Breeding for improved abiotic stress tolerance in maize adapted to southern Africa. Agric. Water Manage. 80, 212‐224.
Barnabás, B., K. Jäger and A. Fehér, 2008: The effect of drought and heat stress on reproductive processes in cereals. Plant Cell Environ. 31, 11‐38.
Baxter, A., R. Mittler and N. Suzuki, 2013: ROS as key players in plant stress signalling. J. Exp. Bot.
Becker, H. C., G. M. Engqvist and B. Karlsson, 1995: Comparison of rapeseed cultivars and resynthesized lines based on allozyme and RFLP markers. Theor. Appl. Genet. 91, 62‐67.
Begg, J. E. and N. C. Turner, 1976: Crop water deficits Advances In Agronomy. New York. Bengtson, C., S. Larsson and C. Liljenberg, 1978: Effects of water stress on cuticular
transpiration rate and amount and composition of epicuticular wax in seedlings of six oat varieties. Physiol. Plant 44, 319‐324.
Bennett, R. A., M. R. Thiagarajah, J. R. King and M. H. Rahman, 2008: Interspecific cross of Brassica oleracea var. alboglabra and B. napus: effects of growth condition and silique age on the efficiency of hybrid production, and inheritance of erucic acid in the self‐pollinated backcross generation. Euphytica 164, 593‐601.
Bloomfield, J. A., T. J. Rose and G. J. King, 2014: Sustainable harvest: managing plasticity for resilient crops. Plant Biotech. J. 12, 517‐533.
161
Blum, A., 1988: Plant breeding for stress environments. CRC Press, Boca Raton, FL, USA. Blum, A., 1989: Osmotic adjustment and growth of barley genotypes under drought stress.
Crop Sci. 29, 230‐233. Blum, A., 1996: Crop responses to drought and the interpretation of adaptation. Plant Growth
Regul. 20, 135‐148. Blum, A., 2011a: Drought resistance ‐ is it really a complex trait? Funct. Plant Biol. 38, 753‐757. Blum, A., 2011b: Plant breeding for water‐limited environments. Springer‐Verlag, New York. Blum, A., L. Shpiler, G. Golan and J. Mayer, 1989: Yield stability and canopy temperature of
wheat genotypes under drought‐stress. Field Crops Res. 22, 289‐296. Bolaños, J. and G. O. Edmeades, 1993: Eight cycles of selection for drought tolerance in
lowland tropical maize. I. Responses in grain yield, biomass, and radiation utilization. Field Crops Res. 31, 233‐252.
Botwright, T. L., A. G. Condon, G. J. Rebetzke and R. A. Richards, 2002: Field evaluation of early vigour for genetic improvement of grain yield in wheat. Aust. J. Agric. Res. 53, 1137‐1145.
Boukerrou, L. and D. D. Rasmusson, 1990: Breeding for high biomass yield in spring barley. Crop Sci. 30, 31‐35.
Bouslama, M. and W. T. Schapauph, 1984: Stress tolerance in soybean. I. Evaluation of three screening techniques for heat and drought tolerance. Crop Sci. 24, 933‐937.
Boyer, J. S., 1967: Leaf water potentials measured with a pressure chamber. Plant Physiol. 42, 133‐137.
Boyer, J. S., 1982: Plant productivity and environment. Science 218, 443‐448. Bradfield, C. A. and L. F. Bjeldanes, 1987: High‐performance liquid chromatographic analysis of
anticarcinogenic indoles in Brassica oleracea. J. Agric. Food Chem. 35, 46‐49. Burghardt, M. and M. Riederer, 2003: Ecophysiological relevance of cuticular transpiration of
deciduous and evergreen plants in relation to stomatal closure and leaf water potential. J. Exp. Bot. 54, 1941‐1949.
Burkill, I. H., 1930: The Chinese mustards in the Malay Peninsula. Gad's Bulletin 5. Bus, A., N. Körber, R. J. Snowdon and B. Stich, 2011a: Patterns of molecular variation in a
species‐wide germplasm set of Brassica napus. Theor. Appl. Genet. 123, 1413‐1423. Bus, A., N. Körber, R. J. Snowdon and B. Stich, 2011b: Patterns of molecular variation in a
species‐wide germplasm set of Brassica napus. Theor. Appl. Genet. 123, 1413‐1423. Bustin, S. A., 2002: Quantification of mRNA using real‐time reverse transcription PCR (RT‐PCR):
trends and problems. J. Mol. Endocrinol. 29, 23‐39. Cai, Y., J. Yu and P. Gallois, 2014: Endoplasmic reticulum stress‐induced PCD and caspase‐like
activities involved. Front. Plant Sci. 5, 1‐6. Çakir, R., 2004: Effect of water stress at different development stages on vegetative and
reproductive growth of corn. Field Crops Res. 89, 1‐16. Campos, H., M. Cooper, J. E. Habben, G. O. Edmeades and J. R. Schussler, 2004: Improving
drought tolerance in maize: a view from industry. Field Crops Res. 90, 19‐34. Cartea, M. and P. Velasco, 2008: Glucosinolates in Brassica foods: bioavailability in food and
significance for human health. Phytochem Rev. 7, 213‐229. Cattivelli, L., F. Rizza, F.‐W. Badeck, E. Mazzucotelli, A. M. Mastrangelo, E. Francia, C. Marè, A.
Tondelli and A. M. Stanca, 2008: Drought tolerance improvement in crop plants: An integrated view from breeding to genomics. Field Crops Res. 105, 1‐14.
Chaerle, L., S. Lenk, I. Leinonen, H. G. Jones, D. Van der Straeten and C. Buschmann, 2009: Multi‐sensor plant imaging: towards the development of a stress‐catalogue. Biotech. J. 4, 1152‐1167.
Chalhoub, B., F. Denoeud, S. Liu, I. A. P. Parkin, H. Tang, X. Wang, J. Chiquet, H. Belcram, C. Tong, B. Samans, M. Corréa, C. Da Silva, J. Just, C. Falentin, C. S. Koh, I. Le Clainche, M. Bernard, P. Bento, B. Noel, K. Labadie, A. Alberti, M. Charles, D. Arnaud, H. Guo, C.

162
Daviaud, S. Alamery, K. Jabbari, M. Zhao, P. P. Edger, H. Chelaifa, D. Tack, G. Lassalle, I. Mestiri, N. Schnel, M.‐C. Le Paslier, G. Fan, V. Renault, P. E. Bayer, A. A. Golicz, S. Manoli, T.‐H. Lee, V. H. D. Thi, S. Chalabi, Q. Hu, C. Fan, R. Tollenaere, Y. Lu, C. Battail, J. Shen, C. H. D. Sidebottom, X. Wang, A. Canaguier, A. Chauveau, A. Bérard, G. Deniot, M. Guan, Z. Liu, F. Sun, Y. P. Lim, E. Lyons, C. D. Town, I. Bancroft, X. Wang, J. Meng, J. Ma, J. C. Pires, G. J. King, D. Brunel, R. Delourme, M. Renard, J.‐M. Aury, K. L. Adams, J. Batley, R. J. Snowdon, J. Tost, D. Edwards, Y. Zhou, W. Hua, A. G. Sharpe, A. H. Paterson, C. Guan and P. Wincker, 2014: Early allopolyploid evolution in the post‐Neolithic Brassica napus oilseed genome. Science 345, 950‐953.
Chan, K. X., M. Wirtz, S. Y. Phua, G. M. Estavillo and B. J. Pogson, 2013: Balancing metabolites in drought: the sulfur assimilation conundrum. Trends Plant Sci. 18, 18‐29.
Chao, S., J. Dubcovsky, J. Dvorak, M.‐C. Luo, S. P. Baenziger, R. Matnyazov, D. R. Clark, L. E. Talbert, J. Anderson, S. Dreisigacker, K. Glover, J. Chen, K. Campbell, P. L. Bruckner, J. C. Rudd, S. Haley, B. F. Carver, S. Perry, M. E. Sorrells and E. D. Akhunov, 2010: Population‐ and genome‐specific patterns of linkage disequilibrium and SNP variation in spring and winter wheat (Triticum aestivum L.). BMC Genomics 11, 727.
Chaudhuri, U. N. and E. T. Kanemasu, 1982: Effect of water gradient on sorghum growth, water relations and yield. Can. J. Plant Sci. 62, 599‐607.
Chaves, M. M., J. Flexas and C. Pinheiro, 2009: Photosynthesis under drought and salt stress: regulation mechanisms from whole plant to cell. Ann. Bot. 103, 551‐560.
Chen, B., X. Wu, K. Xu, H. Wang and X. Li, 2006: RAPD analysis for the genetic diversity of 31 B. campestris L from Jiangsu province in China. Chinese J. Oil Crop Sci. 28, 67‐71.
Chen, B., X. Wu, K. Xu, Wang. Hanzhong and X. Li, 2004: Genetic diversity analysis on 55 Brassica campestris L. from Hunan province in China. Chinese J. Oil Crop Sci. 26, 10‐14.
Chen, B. Y. and W. K. Heneen, 1990: Resynthesized Brassica napus L.: A review of its potential in breeding and genetic analysis. Hereditas 111, 255‐263.
Chen, S., M. N. Nelson, A.‐M. Chèvre, E. Jenczewski, Z. Li, A. S. Mason, J. Meng, J. A. Plummer, A. Pradhan, K. H. M. Siddique, R. J. Snowdon, G. Yan, W. Zhou and W. A. Cowling, 2011: Trigenomic bridges for Brassica improvement. Crit. Rev. Plant Sci. 30, 524‐547.
Chen, S., M. N. Nelson, K. Ghamkhar, T. Fu and W. A. Cowling, 2008: Divergent patterns of allelic diversity from similar origins: the case of oilseed rape (Brassica napus L.) in China and Australia. Genome 51, 1‐10.
Chen, S., Z. Wan, M. N. Nelson, J. S. Chauhan, B. Redden, W. A. Burton, P. Lin, P. A. Salisbury, T. Fu and W. A. Cowling, 2013: Evidence from genome‐wide simple sequence repeat markers for a polyphyletic origin and secondary centres of genetic diversity of Brassica juncea in China and India. J. Hered. 104, 416‐427.
Chen, S., J. Zou, W. A. Cowling and J. Meng, 2010: Allelic diversity in a novel gene pool of canola‐quality Brassica napus enriched with alleles from B. rapa and B. carinata. Crop Pasture Sci. 61, 483‐492.
Cheptou, P.‐O., A. Berger, A. Blanchard, C. Collin and J. Escarre, 2000: The effect of drought stress on inbreeding depression in four populations of the Mediterranean outcrossing plant Crepis sancta (Asteraceae). Heredity 85, 294‐302.
Clarke, K. R. and R. N. Gorley, 2006: PRIMER version 6: user manual/tutorial. Plymouth (UK), PRIMER‐E Ltd.
Collard, B., M. Jahufer, J. Brouwer and E. Pang, 2005: An introduction to markers, quantitative trait loci (QTL) mapping and marker‐assisted selection for crop improvement: The basic concepts. Euphytica 142, 169‐196.
Collard, B. C. Y. and D. J. Mackill, 2008: Marker‐assisted selection: an approach for precision plant breeding in the twenty‐first century. Philos. Trans. R. Soc. Lond. B Biol. Sci. 363, 557‐572.

163
Collins, N. C., F. Tardieu and R. Tuberosa, 2008: Quantitative trait loci and crop performance under abiotic stress: where do we stand? Plant Physiol. 147, 469‐486.
Conesa, A., S. Götz, J. M. García‐Gómez, J. Terol, M. Talón and M. Robles, 2005: Blast2GO: a universal tool for annotation, visualization and analysis in functional genomics research. Bioinformatics 21, 3674‐3676.
Costa, J. M., O. M. Grant and M. M. Chaves, 2013: Thermography to explore plant–environment interactions. J. Exp. Bot. 64, 3937‐3949.
Costa, J. M., M. F. Ortuño, C. M. Lopes and M. M. Chaves, 2012: Grapevine varieties exhibiting differences in stomatal response to water deficit. Funct. Plant Biol. 39, 179‐189.
Cousin, A., K. Heel, W. A. Cowling and M. N. Nelson, 2009: An efficient high‐throughput flow cytometric method for estimating DNA ploidy level in plants. Cytometry A 75, 1015‐1019.
Cowling, W. A., 2007: Genetic diversity in Australian canola and implications for crop breeding for changing future environments. Field Crops Res. 104, 103‐111.
CSIRO and Bureau of Meteorology, 2010: State of the Climate. In "http://www.csiro.au/resources/State‐of‐the‐Climate.html".
Cutler, S. R., P. L. Rodriguez, R. R. Finkelstein and S. R. Abrams, 2010: Abscisic acid: emergence of a core signaling network. Ann. Rev. Plant Biol. 61, 651‐679.
Damon, P. M., Q. F. Ma and Z. Rengel, 2011: Wheat genotypes differ in potassium accumulation and osmotic adjustment under drought stress. Crop Pasture Sci. 62, 550‐555.
Dan, B., J. Tu, S. Hu, Y. He, J. Wang, B. Chen, Y. Luan, Z. Nima, X. Meng and g. Zhuo, 2003: Analysis of rapeseed germplasm resources in Tibet by RAPD. Acta Agro. Sin. 2003, 1‐7.
Das, S., J. Rajagopal, S. Bhatia, P. S. Srivastava and M. Lakshmikumaran, 1999: Assessment of genetic variation within Brassica campestris cultivars using amplified fragment length polymorphism and random amplification of polymorphic DNA markers. J. Biosci. 24, 433‐440.
Davies, W. J., F. Tardieu and C. L. Trejo, 1994: How do chemical signals work in plants that grow in drying soil? Plant Physiol. 104, 309‐314.
Davies, W. J. and J. Zhang, 1991: Root signals and the regulation of growth and development of plants in drying soil. Annu. Rev. Plant Physio. Plant Mol. Biol. 42, 55‐76.
del Carmen Martínez‐Ballesta, M., D. A. Moreno and M. Carvajal, 2013: The physiological importance of glucosinolates on plant response to abiotic stress in Brassica. Int. J. Mol. Sci. 14, 11607‐11625.
Demiral, T. and I. Türkan, 2006: Exogenous glycinebetaine affects growth and proline accumulation and retards senescence in two rice cultivars under NaCl stress. Environ. Exp. Bot. 56, 72‐79.
Denford, K. E. and J. G. Vaughan, 1977: A comparative study of certain seed isoenzymes in the ten chromosome complex of Brassica campestris and its allies. Ann. Bot. 41, 411‐418.
Deyholos, M. K., 2010: Making the most of drought and salinity transcriptomics. Plant Cell Environ. 33, 648‐654.
Dhondt, S., N. Wuyts and D. Inzé, 2013: Cell to whole‐plant phenotyping: the best is yet to come. Trends Plant Sci. 18, 428‐439.
Dixon, G. R., 2007: Origins and diversity of Brassica and its relatives. In: G. R. Dixon ed. Vegetable Brassicas and related crucifers. pp. 1‐33.
Duan, Y., W. Zhang, B. Li, Y. Yang, K. Li, Sodmergen;, C. Han, Y. Zhang and X. Li, 2010: An endoplasmic reticulum response pathway mediates programmed cell death of root tip induced by water stress in Arabidopsis. New Phytol. 186, 681‐695.
Dubos, C., R. Stracke, E. Grotewold, B. Weisshaar, C. Martin and L. Lepiniec, 2010: MYB transcrition factors in Arabidopsis. Trends Plant Sci. 15, 573‐581.
164
Dugas, D., M. Monaco, A. Olson, R. Klein, S. Kumari, D. Ware and P. Klein, 2011: Functional annotation of the transcriptome of Sorghum bicolor in response to osmotic stress and abscisic acid. BMC Genomics 12, 514.
Earl, D. A. and B. M. vonHoldt, 2012: STRUCTURE HARVESTER: a website and program for visualizing STRUCTURE output and implementing the Evanno method. Conserv. Genet. Resour. 4, 359‐361.
Edwards, C. E., B. E. Ewers, C. R. McClung, P. Lou and C. Weinig, 2012: Quantitative variation in water‐use efficiency across water regimes and its relationship with circadian, vegetative, reproductive, and leaf gas‐exchange traits. Mol. Plant 5, 653‐668.
Emanuelli, F., S. Lorenzi, L. Grzeskowiak, V. Catalano, M. Stefanini, M. Troggio, S. Myles, J. Martinez‐Zapater, E. Zyprian, F. Moreira and M. S. Grando, 2013: Genetic diversity and population structure assessed by SSR and SNP markers in a large germplasm collection of grape. BMC Plant Biol 13, 39.
Ernst, L., J. Q. D. Goodger, S. Alvarez, E. L. Marsh, B. Berla, E. Lockhart, J. Jung, P. Li, H. J. Bohnert and D. P. Schachtman, 2010: Sulphate as a xylem‐borne chemical signal precedes the expression of ABA biosynthetic genes in maize roots. J. Exp. Bot.
Falcon, S. and R. Gentleman, 2007: Using GOstats to test gene lists for GO term association. Bioinformatics 23, 257‐258.
Falk, K. L., J. G. Tokuhisa and J. Gershenzon, 2007: The effect of sulfur nutrition on plant glucosinolate content: physiology and molecular mechanisms. Plant Biol. 9, 573‐581.
Fan, T., B. Maria, R. Jackie and A. P. William, 2005: Canopy temperature depression as a potential selection criterion for drought resistance in wheat. Agric. Sci. China 4, 793‐800.
Fang, X., N. C. Turner, G. Yan, F. Li and K. H. M. Siddique, 2010: Flower numbers, pod production, pollen viability, and pistil function are reduced and flower and pod abortion increased in chickpea (Cicer arietinum L.) under terminal drought. J. Exp. Bot. 62, 1‐11.
Fang, Z. and X. Cui, 2011: Design and validation issues in RNA‐seq experiments. Brief. Bioinform. 12, 280‐287.
Farooq, M., S. M. A. Basra, A. Wahid, N. Ahmad and B. A. Saleem, 2009: Improving the drought tolerance in rice (Oryza sativa L.) by exogenous application of salicylic acid. J. Agron. Crop Sci. 195, 237‐246.
Fayez, K. A. and S. A. Bazaid, 2014: Improving drought and salinity tolerance in barley by application of salicylic acid and potassium nitrate. J. Saudi Soc. Agri. Sci. 13, 45‐55.
Franklin‐Tong, V. E. and F. C. H. Franklin, 2000: Self‐Incompatibility in Brassica: The elusive pollen S gene Is identified. Plant Cell 12, 305‐308.
French, R. J. and N. C. Turner, 1991: Water deficits change dry matter partitioning and seed yield in narrow‐leafed lupins (Lupinus angustifolius L.). Aust. J. Agric. Res. 42, 471‐484.
Fu, T., P. Si, X. Yang and G. Yang, 1992: Overcoming self‐incompatibility of Brassica napus by salt (NaCl) spray. Plant Breed. 109, 255‐258.
Fuentes, S., R. De Bei, J. Pech and S. Tyerman, 2012: Computational water stress indices obtained from thermal image analysis of grapevine canopies. Irrig. Sci. 30, 523‐536.
Fukai, E., T. Nishio and M. E. Nasrallah, 2001: Molecular genetic analysis of the candidate gene for MOD, a locus required for self‐incompatibility in Brassica rapa. Mol. Genet. Genomics 265, 519‐525.
Furbank, R. T. and M. Tester, 2011: Phenomics ‐ technologies to relieve the phenotyping bottleneck. Trends Plant Sci. 16, 635‐644.
Garrity, D. P. and J. C. O'Toole, 1995: Selection for reproductive stage drought avoidance in rice, using infrared thermometery. Agron. J. 87, 773‐779.

165
Ge, X. H., J. Wang and Z. Y. Li, 2009: Different genome‐specific chromosome stabilities in synthetic Brassica allohexaploids revealed by wide crosses with Orychophragmus. Ann. Bot. 104, 19‐31.
Geng, X. X., S. Chen, I. A. Astarini, G. J. Yan, E. Tian, J. Meng, Z. Y. Li, X. H. Ge, M. N. Nelson, A. S. Mason, A. Pradhan, W. J. Zhou and W. A. Cowling, 2013: Doubled haploids of novel trigenomic Brassica derived from various interspecific crosses. Plant Cell Tiss. Organ Cult. 113, 501‐511.
Ginzinger, D. G., 2002: Gene quantification using real‐time quantitative PCR: an emerging technology hits the mainstream. Exp. Hermatol. 30, 503‐512.
Giukel, M. v., M. P. Reynolds, R. Trethowan and E. Hernandez, 2008: Complementing the breeder's eye with canopy temperature measurements. In: M. P. Reynolds, Pietragalla, J., Braun, H.J. ed. International symposium on wheat yield potential: challenges to international wheat breeding. pp. 134‐135.
Gollan, T., R. Richards, H. Rawson, J. Passioura, D. Johnson and R. Munns, 1986: Soil water status affects the stomata1. Funct. Plant Biol. 13, 459‐464.
Gómez‐Campo, C. and S. Prakash, 1999: 2 Origin and domestication. In: G.‐C. César ed. Developments in Plant Genetics and Breeding: Biology of Brassica Coenospecies. pp. 33‐58. Elsevier.
González‐Dugo, M., M. Moran, L. Mateos and R. Bryant, 2006: Canopy temperature variability as an indicator of crop water stress severity. Irrig. Sci. 24, 233‐240.
Gunasekera, C. P., R. J. French, L. D. Martin and K. H. M. Siddique, 2009: Comparison of the responses of two Indian mustard (Brassica juncea L.) genotypes to post‐flowering soil water deficit with the response of canola (B. napus L.) cv. Monty. Crop Pasture Sci. 60, 251‐261.
Guo, H. and J. R. Ecker, 2004: The ethylene signalling pathway: new insights. Curr. Opin. Plant Biol. 7, 40‐49.
Guo, P., M. Baum, S. Grando, S. Ceccarelli, G. Bai, R. Li, M. von Korff, R. K. Varshney, A. Graner and J. Valkoun, 2009: Differentially expressed genes between drought‐tolerant and drought‐sensitive barley genotypes in response to drought stress during the reproductive stage. J. Exp. Bot. 60, 3531‐3544.
Guo, Y. M., S. Chen, Z. Y. Li and W. A. Cowling, 2014a: Centre of origin and centres of diversity in an ancient crop, Brassica rapa (turnip rape). J. Hered. 105, 555‐565.
Guo, Y. M., S. Chen, M. N. Nelson, W. Cowling and N. C. Turner, 2013: Delayed water loss and temperature rise in floral buds compared with leaves of Brassica rapa subjected to a transient water stress during reproductive development. Funct. Plant Biol. 40, 690‐699.
Guo, Y. M., N. C. Turner, S. Chen, M. N. Nelson, K. H. M. Siddique and W. A. Cowling, 2014b: Genotypic variation for tolerance to transient drought during the reproductive phase of Brassica rapa. J. Agron. Crop Sci. Accepted on Oct 6, 2014.
Gutbrodt, B., S. Dorn, S. Unsicker and K. Mody, 2012: Species‐specific responses of herbivores to within‐plant and environmentally mediated between‐plant variability in plant chemistry. Chemoecology 22, 101‐111.
Halkier, B. A. and J. Gershenzon, 2006: Biology and biochemistry of glucosinolates. Ann. Rev. Plant Biol. 57, 303‐333.
Hall, N. M., H. Griffiths, J. A. Corlett, H. G. Jones, J. Lynn and G. J. King, 2005: Relationships between water‐use traits and photosynthesis in Brassica oleracea resolved by quantitative genetic analysis. Plant Breed. 124, 557‐564.
Harlan, J. R., 1971: Agricultural origins: centers and noncenters. Science 174, 468‐474. Hatzig, S., I. L. Zaharia, S. Abrams, M. Hohmann, L. Legoahec, A. Bouchereau, N. Nesi and R. J.
Snowdon, 2014: Early osmotic adjustment responses in drought‐resistant and drought sensitive oilseed rape. J. Integr. Plant Biol. 56, 797‐809.
166
Hayat, Q., S. Hayat, M. Irfan and A. Ahmad, 2010: Effect of exogenous salicylic acid under changing environment: A review. Environ. Exp. Bot. 68, 14‐25.
Hazen, S. P., M. S. Pathan, A. Sanchez, I. Baxter, M. Dunn, B. Estes, H.‐S. Chang, T. Zhu, J. A. Kreps and H. T. Nguyen, 2005: Expression profiling of rice segregating for drought tolerance QTLs using a rice genome array. Funct. Integr. Genomics 5, 104‐116.
He, Y. and J. Tu, 2002: Genetic diversity of germplasm resources of Brassica campestris L. in China by RAPD markers. Acta Agro. Sin. 28, 697‐703.
Higgins, J., A. Magusin, M. Trick, F. Fraser and I. Bancroft, 2012: Use of mRNA‐seq to discriminate contributions to the transcriptome from the constituent genomes of the polyploid crop species Brassica napus. BMC Genomics 13, 247.
Hindson, B. J., K. D. Ness, D. A. Masquelier, P. Belgrader, N. J. Heredia, A. J. Makarewicz, I. J. Bright, M. Y. Lucero, A. L. Hiddessen, T. C. Legler, T. K. Kitano, M. R. Hodel, J. F. Petersen, P. W. Wyatt, E. R. Steenblock, P. H. Shah, L. J. Bousse, C. B. Troup, J. C. Mellen, D. K. Wittmann, N. G. Erndt, T. H. Cauley, R. T. Koehler, A. P. So, S. Dube, K. A. Rose, L. Montesclaros, S. Wang, D. P. Stumbo, S. P. Hodges, S. Romine, F. P. Milanovich, H. E. White, J. F. Regan, G. A. Karlin‐Neumann, C. M. Hindson, S. Saxonov and B. W. Colston, 2011: High‐throughput droplet digital PCR system for absolute quantitation of DNA copy number. Anal. Chem. 83, 8604‐8610.
Hoheisel, J. D., 2006: Microarray technology: beyond transcript profiling and genotype analysis. Nat. Rev. Genet. 7, 200‐210.
Hoogenboom, G., M. G. Huck and C. M. Peterson, 1987: Root growth rate of soybean as affected by drought stress. Agron. J. 79, 607‐614.
Hornik, K. (2012). "The R FAQ." from http://CRAN.R‐project.org/doc/FAQ/R‐FAQ.html. Huang, D., W. Wu, S. R. Abrams and A. J. Cutler, 2008: The relationship of drought‐related gene
expression in Arabidopsis thaliana to hormonal and environmental factors. J. Exp. Bot. 59, 2991‐3007.
Huh, G. H., B. Damsz, T. K. Matsumoto, M. P. Reddy, A. M. Rus, J. I. Iveas, M. L. Narasimhan, R. A. Bressan and P. M. Hasegawa, 2002: Salt causes ion disequilibrium‐induced programmed cell death in yeast and plants. Plant J. 29, 649‐659.
Jackson, R. D., R. J. Reginato and S. B. Idso, 1977: Wheat canopy temperature: A practical tool for evaluating water requirements. Water Resour. Res. 13, 651‐656.
Jagadish, K. S. V., J. E. Cairns, A. Kumar, I. M. Somayanda and P. Q. Craufurd, 2011: Does susceptibility to heat stress confound screening for drought tolerance in rice? Funct. Plant Biol. 38, 261‐269.
Jiang, C., N. Ramchiary, Y. Ma, M. Jin, J. Feng, R. Li, H. Wang, Y. Long, S. Choi, C. Zhang, W. Cowling, B. Park, Y. Lim and J. Meng, 2011: Structural and functional comparative mapping between the Brassica A genomes in allotetraploid Brassica napus and diploid Brassica rapa. Theor. Appl. Genet. 123, 927‐941.
Jones, H., P. Civan, J. Cockram, F. Leigh, L. Smith, M. Jones, M. Charles, J.‐L. Molina‐Cano, W. Powell, G. Jones and T. Brown, 2011: Evolutionary history of barley cultivation in Europe revealed by genetic analysis of extant landraces. BMC Evol Biol 11, 320.
Jones, H. G., 1999a: Use of infrared thermometry for estimation of stomatal conductance as a possible aid to irrigation scheduling. Agric. Forest Meteor. 95, 139‐149.
Jones, H. G., 1999b: Use of thermography for quantitative studies of spatial and temporal variation of stomatal conductance over leaf surfaces. Plant Cell Environ. 22, 1043‐1055.
Jones, H. G., R. Serraj, B. R. Loveys, L. Xiong, A. Wheaton and A. H. Price, 2009a: Thermal infrared imaging of crop canopies for the remote diagnosis and quantification of plant responses to water stress in the field. Funct. Plant Biol. 36, 978‐989.
Jones, H. G., R. Serraj, B. R. Loveys, L. Xiong, A. Wheaton and A. H. Price, 2009b: Thermal infrared imaging of crop canopies for the remote diagnosis and quantification of plant responses to water stress in the field. Funct. Plant Biol. 36, 978‐989.

167
Jones, H. G. and R. A. Vaughan, 2010: Remote sensing of vegetation: principles, techniques, and application. Oxford University Press, New York, USA.
Jones, M. M., C. B. Osmond and N. C. Turner, 1980: Accumulation of solutes in leaves of sorghum and sunflower in response to water deficits. Funct. Plant Biol. 7, 193‐205.
Jubault, M., C. Lariagon, L. Taconnat, J.‐P. Renou, A. Gravot, R. Delourme and M. J. Manzanares‐Dauleux, 2013: Partial resistance to clubroot in Arabidopsis is based on changes in the host primary metabolism and targeted cell division and expansion capacity. Funct. Integr. Genomics 13, 191‐205.
Kakumanu, A., M. M. R. Ambavaram, C. M. Klumas, A. Krishnan, U. Batlang, E. Myers, R. Grene and A. Pereira, 2012: Effects of drought on gene expression in maize reproductive and leaf meristem tissue revealed by RNA‐seq. Plant Physiol. 160, 846‐867.
Kang, G. Z., G. Z. Li, G. Q. Liu, W. Xu, X. Q. Peng, C. Y. Wang, Y. J. Zhu and T. C. Guo, 2013: Exogenous salicylic acid enhances wheat drought tolerance by influence on the expression of genes related to ascorbate‐glutathione cycle. Biol. Plant. 57, 718‐724.
Karimizadeh, R. and M. Mohammadi, 2011: Association of canopy temperature depression with yield of Durum wheat genotypes under supplimentary irrigated and rainfed conditions. Aust. J. Crop Sci. 5, 138‐146.
Kasuga, M., Q. Liu, S. Miura, Y.‐S. Kazuko and K. Shinozaki, 1999: Improving plant drought, salt, and freezing tolerance by gene transfer of a single stress‐inducible transcription factor. Nat. America Inc 17, 287‐291.
Kato, Y., S. Hirotsu, K. Nemoto and J. Yamagishi, 2008: Identification of QTLs controlling rice drought tolerance at seedling stage in hydroponic culture. Euphytica 160, 423‐430.
Kaushik, N. and A. Aqnihotri, 2000: GLC analysis of Indian rapeseed‐mustard to study the variability of fatty acid composition. Biochem. Soc. T. 28, 581‐583.
Keener, M. E. and P. L. Kircher, 1983: The use of canopy temperature as an indicator of drought stress in humid regions. Agric. Meteor. 28, 339‐349.
Keneni, G., E. Bekele, M. Imtiaz, K. Dagne, E. Getu and F. Assefa, 2012: Genetic diversity and population structure of Ethiopian Chickpea (Cicer arietinum L.) germplasm accessions from different geographical origins as revealed by microsatellite markers. Plant Mol. Biol. Rep. 30, 654‐665.
Khachatourians, G. G. and P. W. B. Phillips, 2001: An introduction to the history of canola and the scientific basis for innovation. In: P. W. B. Phillips and G. G. Khachatourians eds. The biotechnology revolution in global agriculture: invention, innovation and investment in the canola industry. pp. 33‐48. CABI Publishing, Wallingford, UK.
Khan, M. A. M., C. Ulrichs and I. Mewis, 2010: Influence of water stress on the glucosinolate profile of Brassica oleracea var. italica and the performance of Brevicoryne brassicae and Myzus persicae. Entomol. Exp. Appl. 137, 229‐236.
King, D. A., 1997: The functional significance of leaf angle in Eucalyptus. Aust. J. Bot. 45, 619‐639.
Kitashiba, H., P. Liu, T. Nishio, J. B. Nasrallah and M. E. Nasrallah, 2011: Functional test of Brassica self‐incompatibility modifiers in Abrabidopsis thaliana. Proc. Nat. Acad. Sci. USA 108, 18173‐18178.
Kumar, A. and D. P. Singh, 1998: Use of physiological indices as a screening technique for drought tolerance in oilseed Brassica species. Ann. Bot. 81, 413‐420.
Kumar, A., D. P. Singh and P. Singh, 1994: Influence of water stress on photosynthesis, transpiration, water‐use efficiency and yield of Brassica juncea L. Field Crops Res. 37, 95‐101.
Kumar, A., P. Singh, D. P. Singh, H. Singh and H. C. Sharma, 1984: Differences in osmoregulation in Brassica species. Ann. Bot. 54, 537‐542.
168
Lancashire, P. D., H. Bleiholder, T. Van den Boom, P. Langelüddeke, R. Stauss, E. Weber and A. Witzenberger, 1991: A uniform decimal code for growth stages of crops and weeds. Ann. Appl. Biol. 119, 561‐601.
Lappartient, A. G. and B. Touraine, 1996: Demand‐driven control of root ATP sulfurylase activity and SO42‐ uptake in intact canola (The role of phloem‐translocated glutathione). Plant Physiol. 111, 147‐157.
Lebreton, C., V. Lazić‐Jančić, A. Steed, S. Pekić and S. A. Quarrie, 1995: Identification of QTL for drought responses in maize and their use in testing causal relationships between traits. J. Exp. Bot. 46, 853‐865.
Lee, S. C., M. H. Lim, J. G. Yu, B. S. Park and T. J. Yang, 2012: Genome‐wide characterization of the CBF/DREB1 gene family in Brassica rapa. Plant Physiol Biochem. 61, 142‐152.
Leport, L., N. C. Turner, S. L. Davies and K. H. M. Siddique, 2006: Variation in pod production and abortion among chickpea cultivars under terminal drought. Eur. J. Agron. 24, 236‐246.
Li, C. W., 1981: The origin, evolution, taxonomy and hybridization of Chinese cabbage. In: N. S. Talekar and T. D. Griggs eds. International Symposium on Chinese Cabbage. pp. 1‐10. Asian Vegetable Research Development Center, Tsukuba), Japan.
Li, Z. Y. and X. H. Ge, 2007: Unique chromosome behavior and genetic control in Brassica × Orychophragmus wide hybrids: a review. Plant Cell Rep. 26, 701‐710.
Lilley, J. M., M. M. Ludlow, S. R. McCouch and J. C. O'Toole, 1996: Locating QTL for osmotic adjustment and dehydration tolerance in rice. J. Exp. Bot. 47, 1427‐1436.
Liu, G., X. Li, S. Jin, X. Liu, L. Zhu, Y. Nie and X. Zhang, 2014: Overexpression of rice NAC gene SNAC1 improves drought and salt tolerance by enhancing root development and reducing transpiration rate in transgenic cotton. PLoS ONE 9, e86895.
Liu, H., 1984: Origin and evolution of genus Brassica oilseed rapes. Acta Agro. Sin. 10, 9‐18. Liu, R. and J. Meng, 2006: RFLP and AFLP analysis of inter‐ and intraspecific variation of
Brassica rapa and B. napus shows that B. rapa is an important genetic resource for B. napus improvement. Acta Genet. Sin. 33, 814‐823.
Lowe, A. J., A. E. Jones, A. F. Raybould, M. Trick, C. L. Moule and K. J. Edwards, 2002: Transferability and genome specificity of a new set of microsatellite primers among Brassica species of the U triangle. Mol. Ecol. Notes 2, 7‐11.
Lu, X., D. Chen, D. Shu, Z. Zhang, W. Wang, C. Klukas, L. Chen, Y. Fan, M. Chen and C. Zhang, 2013: The differential transcription network between embryo and endosperm in the early developing maize seed. Plant Physiol. 162, 440‐455.
Ma, Q., S. R. Niknam and D. W. Turner, 2006: Responses of osmotic adjustment and seed yield of Brassica napus and B. juncea to soil water deficit at different growth stages. Aust. J. Agric. Res. 57, 221‐226.
Ma, Q., D. W. Turner, D. Levy and W. A. Cowling, 2004: Solute accumulation and osmotic adjustment in leaves of Brassica oilseeds in response to soil water deficit. Aust. J. Agric. Res. 55, 939‐945.
Mable, B. K., A. V. Robertson, S. Dart, C. Di Berardo and L. Witham, 2005: Breakdown of self‐incompatibility in the perennial Arabidopsis lyrata (Brassicaceae) and its genetic consequences. Evolution 59, 1437‐1448.
Maes, W. H. and K. Steppe, 2012: Estimating evapotranspiration and drought stress with ground‐based thermal remote sensing in agriculture: a review. J. Exp. Bot. 63, 4671‐4712.
Martin, J. A. and Z. Wang, 2011: Next‐generation transcriptome assembly. Nat. Rev. Genet. 12, 671‐682.
Martin, M., 2011: Cutadapt removes adapter sequences from high‐throughput sequencing reads. Ebmnet J. 17.

169
Mason, A., V. Huteau, F. Eber, O. Coriton, G. Yan, M. Nelson, W. Cowling and A.‐M. Chèvre, 2010: Genome structure affects the rate of autosyndesis and allosyndesis in AABC, BBAC and CCAB Brassica interspecific hybrids. Chromosome Res. 18, 655‐666.
Maydup, M. L., C. Graciano, J. J. Guiamet and E. A. Tambussi, 2012: Analysis of early vigour in twenty modern cultivars of bread wheat (Triticum aestivum L.). Crop Pasture Sci. 63, 987‐996.
McBurney, T., 1992: The Relationship between leaf thickness and plant water potential. J. Exp. Bot. 43, 327‐335.
McBurney, T. and P. A. Costigan, 1984: The relationship between stem diameter and water potentials in stems of young cabbage plants. J. Exp. Bot. 35, 1787‐1793.
McGrath, J. M. and C. Quiros, 1992a: Genetic diversity at isozyme and RFLP loci in Brassica campestris as related to crop type and geographical origin. Theor. Appl. Genet. 83, 783‐790.
McGrath, J. M. and C. F. Quiros, 1992b: Genetic diversity at isozyme and RFLP loci in Brassica campestris as related to crop type and geographical origin. Theor. Appl. Genet. 83, 783‐790.
Medzhitov, R., D. S. Schneider and M. P. Soares, 2012: Disease tolerance as a defense strategy. Science 335, 936‐941.
Mei, J., Y. Fu, L. Qian, X. Xu, J. Li and W. Qian, 2011: Effectively widening the gene pool of oilseed rape (Brassica napus L.) by using Chinese B. rapa in a ‘virtual allopolyploid’ approach. Plant Breed. 130, 333‐337.
Michel, B. E. and M. R. Kaufmann, 1973: The osmotic potential of polyethylene glycol 6000. Plant Physiol. 51, 914‐916.
Moffat, A. S., 2002: Finding New Ways to Protect Drought‐Stricken Plants. Science 296, 1226‐1229.
Møller, I. M., P. E. Jensen and A. Hansson, 2007: Oxidative modifications to cellular components in plants. Ann. Rev. Plant Biol. 58, 459‐481.
Moore, J. P., N. T. Le, W. F. Brandt, A. Driouich and J. M. Farrant, 2009: Towards a systems‐based understanding of plant desiccation tolerance. Trends Plant Sci. 14, 110‐117.
Moradi, F. and A. M. Ismail, 2007: Responses of photosynthesis, chlorophyll fluorescence and ROS‐scavenging systems to salt stress during seedling and reproductive stages in rice. Ann. Bot. 99, 1161‐1173.
Morgan, J. M., 1980: Possible role of abscisic acid in reducing seed set in water‐stressed wheat plants. Nature 285, 655‐657.
Morgan, J. M., 1983: Osmoregulation as a selection criterion for drought tolerance in wheat. Aust. J. Agric. Res. 34, 607‐614.
Morgan, J. M., 1999: Pollen grain expression of a gene controlling differences in osmoregulation in wheat leaves: a simple breeding method. Aust. J. Agric. Res. 50, 953‐962.
Munns, R., R. A. James, X. R. R. Sirault, R. T. Furbank and H. G. Jones, 2010: New phenotyping methods for screening wheat and barley for beneficial responses to water deficit. J. Exp. Bot. 61, 3499‐3507.
Murashige, T. and F. Skoog, 1962: A revised medium for rapid growth and bio assays with tobacco tissue cultures. Physiol. Plant 15, 473‐497.
Navabi, Z. K., I. A. P. Parkin, J. C. Pires, Z. Xiong, M. R. Thiagarajah, A. G. Good and M. H. Rahman, 2010: Introgression of B‐genome chromosomes in a doubled haploid population of Brassica napus × B. carinata. Genome 53, 619‐629.
Niknam, S. R., Q. Ma and D. W. Turner, 2003: Osmotic adjustment and seed yield of Brassica napus and B. juncea genotypes in a water‐limited environment in south‐western Australia. Aust. J. Exp. Agric. 43, 1127‐1135.
170
Niu, G. and D. S. Rodriguez, 2008: Growth and physiological responses to drought stress in four oleander clones. J. Amer. Soc. Hort. Sci. 133, 188‐196.
Ockendon, D. J., 1978: Effect of hexane and humidity on self‐incompatibility in Brassica oleracea. Theor. Appl. Genet. 52, 113‐117.
Ofori, A., H. C. Becker and F. J. Kopisch‐Obuch, 2008: Effect of crop improvement on genetic diversity in oilseed Brassica rapa (turnip‐rape) cultivars, detected by SSR markers. J. Appl. Genet. 49, 207‐212.
Olivares‐Villegas, J. J., M. P. Reynolds and G. K. McDonald, 2007: Drought‐adaptive attributes in the Seri/Babax hexaploid wheat population. Funct. Plant Biol. 34, 189‐203.
Ozsolak, F. and P. M. Milos, 2011: RNA sequencing: advances, challenges and opportunities. Nat. Rev. Genet. 12, 87‐98.
Padilla, G., M. Cartea, V. Rodríguez and A. Ordás, 2005: Genetic diversity in a germplasm collection of Brassica rapa subsp rapa L. from northwestern Spain. Euphytica 145, 171‐180.
Palloix, A., Y. Herve, R. B. Knox and C. Dumas, 1985: Effect of carbon dioxide and relative humidity on self incompatibility in cauliflower, Brassica oleracea. Theor. Appl. Genet. 70, 628‐633.
Pandey, N., A. Ranjan, P. Pant, R. K. Tripathi, F. Ateek, H. P. Pandey, U. V. Patre and S. V. Sawant, 2013: CAMTA 1 regulates drought responses in Arabidopsis thaliana. BMC Genomics 14, 216.
Pang, J., J. A. Palta, G. J. Rebetzke and S. P. Milroy, 2014: Wheat genotypes with high early vigour accumulate more nitrogen and have higher photosynthetic nitrogen use efficiency during early growth. Funct. Plant Biol. 41, 215‐222.
Pantuwan, G., S. Fukai, M. Cooper, S. Rajatasereekul and J. C. O’Toole, 2002: Yield response of rice (Oryza sativa L.) genotypes to drought under rainfed lowlands: 2. Selection of drought resistant genotypes. Field Crops Res. 73, 169‐180.
Parkin, I., C. Koh, H. Tang, S. Robinson, S. Kagale, W. Clarke, C. Town, J. Nixon, V. Krishnakumar, S. Bidwell, F. Denoeud, H. Belcram, M. Links, J. Just, C. Clarke, T. Bender, T. Huebert, A. Mason, J. Pires, G. Barker, J. Moore, P. Walley, S. Manoli, J. Batley, D. Edwards, M. Nelson, X. Wang, A. Paterson, G. King, I. Bancroft, B. Chalhoub and A. Sharpe, 2014: Transcriptome and methylome profiling reveals relics of genome dominance in the mesopolyploid Brassica oleracea. Genome Biol. 15, R77.
Parmesan, C. and G. Yohe, 2003: A globally coherent fingerprint of climate change impacts across natural systems. Nature 421, 37‐42.
Peakall, R. and P. E. Smouse, 2012: GenAIEx 6.5: genetic analysis in excel. Population genetic software for teaching and research‐an update. Bioinformatics 28, 2537‐2539.
Pellegrineschi, A., M. Reynolds, M. Pacheco, R. M. Brito, R. Almeraya, K. Yamaguchi‐Shinozaki and D. Hoisington, 2004: Stree‐induced expression in wheat of the Arabidopsis thaliana DREB1A gene delays water stress symptoms under greenhouse conditions. Genome 47, 493‐500.
Pickrell, J. K., J. C. Marioni, A. A. Pai, J. F. Degner, B. E. Engelhardt, E. Nkadori, J.‐B. Veyrieras, M. Stephens, Y. Gilad and J. K. Pritchard, 2010: Understanding mechanisms underlying human gene expression variation with RNA sequencing. Nature 464, 768‐772.
Pino Del Carpio, D., R. Basnet, R. H. Vos, C. Maliepaard, R. Visser and G. Bonnema, 2011: The patterns of population differentiation in a Brassica rapa core collection. Theor. Appl. Genet. 122, 1105‐1118.
Pino Del Carpio, D., R. K. Basnet, D. Arends, K. Lin, R. C. H. De Vos, D. Muth, J. Kodde, K. Boutilier, J. Bucher, X. Wang, R. Jansen and G. Bonnema, 2014: Regulatory network of secondary metabolism in Brassica rapa: insight into the glucosinolate pathway. PLoS ONE 9, e107123.

171
Pinto, S., S. C. Chapman, C. L. McIntyre, R. Shorter and M. P. Reynolds, Year: QTL for canopy temperature response related to yield in both heat and drought environments. In, Sydney, Australia.
Poorter, H., F. Fiorani, M. Stitt, U. Schurr, A. Finck, Y. Gibon, B. Usadel, R. Munns, O. K. Atkin, F. Tardieu and T. L. Pons, 2012: The art of growing plants for experimental purposes: a practical guide for the plant biologist. Funct. Plant Biol. 39, 821‐838.
Potter, T., 2009: The canola plant and how it grows Canola‐best practice management guide for south‐eastern Australia. pp. 11‐14. Grains Research and Development Corporation, Barton.
Powell, N., X. Ji, R. Ravash, J. Edlington and R. Dolferus, 2012: Yield stability for cereals in a changing climate. Funct. Plant Biol. 39, 539‐552.
Pradhan, A., M. N. Nelson, J. A. Plummer, W. A. Cowling and G. Yan, 2011: Characterization of Brassica nigra collections using simple sequence repeat markers reveals distinct groups associated with geographical location, and frequent mislabelling of species identity. Genome 54, 50‐63.
Pradhan, A. K., S. Prakash, A. Mukhopadhyay and D. Pental, 1992: Phytogeny of Brassica and allied genera based on variation in chloroplast and mitochondrial DNA patterns: molecular and taxonomic classifications are incongruous. Theor. Appl. Genet. 85, 331‐340.
Prakash, S., S. R. Bhat, C. F. Quiros, P. B. Kirti and V. L. Chopra, 2009: Brassica and its close allies: cytogenetics and evolution. Plant Breed. Rev. 31, 21‐187.
Prakash, S. and K. Hinata, 1980: Taxonomy, cytogenetics and origin of crop Brassicas: a review. Opera Bot., 55‐57.
Prakash, S., X. Wu and S. R. Bhat, 2012: History, evolution and domestication of Brassica crops. Plant Breed. Rev. 35, 19‐84.
Prichard, J. K., M. Stephens and P. Donnelly, 2000: Inference of population structure using multilocus genotype data. Genetics 155, 945‐959.
Qian, W., X. Chen, D. Fu, J. Zou and J. Meng, 2005: Intersubgenomic heterosis in seed yield potential observed in a new type of Brassica napus introgressed with partial Brassica rapa genome. Theor. Appl. Genet. 110, 1187‐1194.
Qian, W., J. Meng, M. Li, M. Frauen, O. Sass, J. Noack and C. Jung, 2006: Introgression of genomic components from Chinese Brassica rapa contributes to widening the genetic diversity in rapeseed (B. napus L.), with emphasis on the evolution of Chinese rapeseed. Theor. Appl. Genet. 113, 49‐54.
Quarrie, S. A., S. P. Quarrie, R. Radosevic, D. Rancic, A. Kaminska, J. D. Barnes, M. Leverington, C. Ceoloni and D. Dodig, 2006: Dissecting a wheat QTL for yield present in a range of environments: from the QTL to candiate genes. J. Exp. Bot. 57, 2627‐2637.
Randall, H. C. and T. R. Sinclair, 1988: Sensitivity of soybean leaf development to water deficits. Plant Cell Environ. 11, 835‐839.
Rashid, A., J. C. Stark, A. Tanveer and T. Mustafa, 1999: Use of canopy temperature measurements as a screening tool for drought tolerance in spring wheat. J. Agron. Crop Sci. 182, 231‐237.
Rauf, S., H. A. Sadaqat and I. A. Khan, 2008: Effect of moisture regimes on combining ability variations of seedling traits in sunflower (Helianthus annuus L.). Can. J. Plant Sci. 88, 323‐329.
Rebolledo, M. C., M. Dingkuhn, A. Clément‐Vidal, L. Rouan and D. Luquet, 2012: Phenomics of rice early vigour and drought response: Are sugar related and morphogenetic traits relevant? Rice 5, 1‐15.
Rebolledo, M. C., D. Luquet, B. Courtois, A. Henry, J.‐C. Soulie, L. Rouan and M. Dingkuhn, 2013: Can early vigor occur in combination with drought tolerance and efficient water use in rice genotypes? Funct. Plant Biol. 40, 582‐594.
172
Redoña, E. D. and D. J. Mackill, 1996: Genetic variation for seedling vigor traits in rice. Crop Sci. 36, 285‐290.
Regan, K. L., K. H. M. Siddique, N. C. Turner and B. R. Whan, 1992: Potential for increasing early vigour and total biomass in spring wheat. II. Characteristics associated with early vigour. Aust. J. Agric. Res. 43, 541‐553.
Reiner, H., W. Holzner and R. Ebermann, 1995: The development of turnip‐type and oilseed‐type Brassica rapa crops from the wild type in Europe‐an overview of botanical, historical and linguistic facts Rapeseed today and tomorrow, 9th International Rapeseed Congress. pp. 1066‐1069. Cambridge, UK.
Reiner H., H. W., Ebermann R.; , 1995: The development of turnip‐type and oilseed‐type Brassica rapa crops from the wild type in Europe‐an overview of botanical, historical and linguistic facts Rapeseed today and tomorrow, 9th International Rapeseed Congress. pp. 1066‐1069. Cambridge, UK.
Reynolds, M., F. Dreccer and R. Trethowan, 2007: Drought‐adaptive traits derived from wheat wild relatives and landraces. J. Exp. Bot. 58, 177‐186.
Reynolds, M., Y. Manes, A. Izanloo and P. Langridge, 2009: Phenotyping approaches for physiological breeding and gene discovery in wheat. Ann. Appl. Biol. 155, 309‐320.
Ribaut, J.‐M. and M. Ragot, 2007: Marker‐assisted selection to improve drought adaptation in maize: the backcross approach, perspectives, limitations, and alternatives. J. Exp. Bot. 58, 351‐360.
Ribaut, J. M. and D. Hoisington, 1998: Marker‐assisted selection: new tools and strategies. Trends Plant Sci. 3, 236‐239.
Richards, R. A., 1978: Variation between and within species of rapeseed (Brassica campestris and B. napus) in response to drought stress III. Physiological and physicochemical characters. Aust. J. Agric. Res. 29, 491‐501.
Richards, R. A., 2006: Physiological traits used in the breeding of new cultivars for water‐scarce environments. Agric. Water Manage. 80, 197‐211.
Richards, R. A. and N. Thurling, 1978a: Variation between and within species of rapeseed (Brassica campestris and B. napus) in response to drought stress. I. Sensitivity at different stages of development. Aust. J. Agric. Res. 29, 469‐477.
Richards, R. A. and N. Thurling, 1978b: Variation between and within species of rapeseed (Brassica campestris and B. napus) in response to drought stress. II.* Growth and development under natural drought stresses. Aust. J. Agric. Res. 29, 479‐490.
Robert‐Seilaniantz, A., L. Navarro, R. Bari and J. D. G. Jones, 2007: Pathological hormone imbalances. Curr. Opn. Plant Biol. 10, 372‐379.
Rodriguez, M. C., M. Petersen and J. Mundy, 2010: Mitogen‐activated protein kinase signalling in plants. Ann. Rev. Plant Biol. 61, 621‐649.
Rohlf, F. J., 2002: NTSYS‐pc: numerical taxonomy system ver. 2.1. Exeter Publishing Ltd, Setauket, New York.
Rontein, D., G. Basset and A. D. Hanson, 2002: Metabolic engineering of osmoprotectant accumulation in plants. Metab. Eng. 4, 49‐56.
Royo, C., D. Villegas, L. F. G. del Moral, iacute, S. Elhani, N. Aparicio, Y. Rharrabti and J. L. Araus, 2002: Comparative performance of carbon isotope discrimination and canopy temperature depression as predictors of genotype differences in durum wheat yield in Spain. Aust. J. Agric. Res. 53, 561‐569.
Saini, H. S. and M. E. Westgate, 1999: Reproductive development in grain crops during drought. Advances Agron. 68, 59‐96.
Saint Pierre, C., J. Crossa, Y. Manes and M. Reynolds, 2010: Gene action of canopy temperature in bread wheat under diverse environments. Theor. Appl. Genet. 120, 1107‐1117.
Sakuma, Y., Q. Liu, J. G. Dubouzet, H. Abe, K. Shinozaki and K. Yamaguchi‐Shinozaki, 2002: DNA‐binding specificity of the ERF/AP2 domain of Arabidopsis DREBs, transcription

173
factors involved in dehydration‐ and cold‐inducible gene expression. Biochem. Biophys. Res. Commun. 290, 998‐1009.
Sakuma, Y., K. Maruyama, Y. Osakabe, F. Qin, M. Seki, K. Shinozaki and K. Yamaguchi‐Shinozaki, 2006: Functional analysis of an Arabidopsis transcription factor, DREB2A, involved in drought‐responsive gene expression. Plant Cell 18, 1292‐1309.
Schreiner, M., B. Beyene, A. Krumbein and S. H., 2009: Ontogenetic changes of 2‐propenyl and 3‐indolylmethyl glucosinolates in Brassica carinata leaves as affected by water supply. J. Agric. Food Chem. 57, 7259‐7263.
Schurr, U., T. Gollan and E. D. Schulze, 1992: Stomatal response to drying soil in relation to changes in the xylem sap composition of Helianthus annuus. II. Stomatal sensitivity to abscisic acid imported from the xylem sap. Plant Cell Environ. 15, 561‐567.
Seo, Y. J., J. B. Park, Y. J. Cho, C. Jung, H. S. Seo, S. K. Park, B. H. Nahm and J. T. Song, 2010: Overexpression of the ethylene‐responsive factor gene BrERF4 from Brassica rapa increases tolerance to salt and drought in Arabidopsis plants. Mol. Cells 30, 271‐277.
Serraj, R. and T. R. Sinclair, 2002: Osmolyte accumulation: can it really help increase crop yield under drought conditions? Plant Cell Environ. 25, 333‐341.
Sharma, N., M. Bajaj and K. R. Shivanna, 1985: Overcoming self‐incompatibility through the use of lectins and sugars in Petunia and Eruca. Ann. Bot. 55, 139‐141.
Sharma, S. and P. E. Verslues, 2010: Mechanisms independent of abscisic acid (ABA) or proline feedback have a predominant role in transcriptional regulation of proline metabolism during low water potential and stress recovery. Plant Cell Environ. 33, 1838‐1851.
Shinozaki, K. and K. Yamaguchi‐Shinozaki, 2007: Gene networks involved in drought stress response and tolerance. J. Exp. Bot. 58, 221‐227.
Singh, D. P., P. Singh, A. Kumar and H. C. Sharma, 1985: Transpirational cooling as a screening technique for drought tolerance in oil seed Brassicas. Ann. Bot. 56, 815‐820.
Singh, P. and E. T. Kanemasu, 1982: Leaf and canopy temperatures of pearl millet genotypes under irrigated and nonirrigated conditions. Agron. J. 75, 497‐501.
Sinskaia, E. N., 1928: The oleiferous plants and root crops of the family Cruciferae. Bull Appl. Bot. Genet. Plant Breed. 17, 1‐166.
Slafer, G. A. and E. M. Whitechurch, 2001: Manipulating wheat development to improve adaptation and to search for alternative oppotunities to increase yield potential. In: M. P. Reynolds, Ortiz‐Monasterio, J.I., McNab, A. ed. Application of Physiology on Plant Breeding. pp. 160‐170. CYMMIT, Mexico, DF.
Smith, R. C. G., H. D. Barrs and J. L. Steiner, 1986: Alternative models for predicting the foliage—Air temperature difference of well irrigated wheat under variable meteorological conditions. I. Derivation of parameters II. Accuracy of predictions. Irrig. Sci. 7, 225‐236.
Smith, R. C. G., J. F. Wallace, P. T. Hick, R. F. Gilmour, R. K. Belford, P. A. Portmann, K. L. Regan and N. C. Turner, 1993: Potential of using field spectroscopy during early growth for ranking biomass in cereal breeding trails. Aust. J. Agric. Res. 44, 1713‐1730.
Snowdon, R., W. Lühs and W. Friedt, 2007: Oilseed rape. In: C. Kole ed. Genome mapping and molecular breeding in plants: Oilseed. Springer, New York.
Snowdon, R. J. and W. Friedt, 2004: Molecular markers in Brassica oilseed breeding: current status and future possibilities. Plant Breed. 123, 1‐8.
Soengas, P., M. E. Cartea, M. Francisco, M. Lema and P. Velasco, 2011: Genetic structure and diversity of a collection of Brassica rapa subsp. rapa L. revealed by simple sequence repeat markers. J. Agric. Sci. 149, 617‐624.
Song, K. and T. C. Osborn, 1992: Polyphyletic origins of Brassica napus: new evidence based on organelle and nuclear RFLP analyses. Genome 35, 992‐1001.
Song, K., T. C. Osborn and P. H. Williams, 1990: Brassica taxonomy based on nuclear restriction fragment length polymorphisms (RFLPs) 3. Genome relationships in Brassica and
174
related genera and the origin of B. oleracea and B. rapa (syn. campestris). Theor. Appl. Genet. 79, 497‐506.
Song, K. M., T. C. Osborn and P. H. Williams, 1988a: Brassica taxonomy based on nuclear restriction fragment length polymorphisms (RFLPs) 1. Genome evolution of diploid and amphidiploid species. 1. Genome evolution of diploid and amphidiploid species. Theor. Appl. Genet. 75, 784‐794.
Song, K. M., T. C. Osborn and P. H. Williams, 1988b: Brassica taxonomy based on nuclear restriction fragment length polymorphisms (RFLPs) 2. Preliminary analysis of subspecies within B. rapa (syn. campestris) and B. oleracea. Theor. Appl. Genet. 76, 593‐600.
Stark, J. C., J. J. Pavek and I. R. McCann, 1991: Using canopy temperature measurements to evaluate drought tolerance of potato genotypes. J. Am. Soc. Hortic. Sci. 116, 412‐415.
Stoll, M., H. R. Schultz and B. Berkelmann‐Loehnertz, 2008: Exploring the sensitivity of thermal imaging for Plasmopara viticola pathogen detection in grapevines under different water status. Funct. Plant Biol. 35, 281‐288.
Stowe, D. C., M. S. Lamhamedi and H. A. Margolis, 2001: Water relations, cuticular transpiration, and bud characteristics of air‐slit containerized Picea glauca seedlings in response to controlled irrigation regimes. Can. J. Forest. Res. 31, 2200‐2212.
Strickler, S. R., A. Bombarely and L. A. Mueller, 2012: Designing a transcriptome next‐generation sequencing project for a nonmodel plant species1. Am. J. Bot. 99, 257‐266.
Sun, W., Q. Pan, L. Zigang;, M. Yaxiong;, T. Zhang, H. Wang and Z. Xiucong;, 2004: Genetic resources of oilseed Brassica and related species in Gansu Province, China. Plant Genet. Resour. 2, 167‐173.
Supek, F., M. Bošnjak, N. Škunca and T. Šmuc, 2011: REVIGO summarizes and visualizes long lists of gene ontology terms. PLoS ONE 6, e21800.
Suzuki, N., G. Miller, J. Morales, V. Shulaev, M. A. Torres and R. Mittler, 2011: Respiratory burst oxidases: the engines of ROS signaling. Curr. Opn. Plant Biol. 14, 691‐699.
Takahashi, H., S. Kopriva, M. Giordano, K. Saito and R. Hell, 2011: Sulfur assimilation in photosynthetic organisms: molecular functions and regulations of transporters and assimilatory enzymes. Ann. Rev. Plant Biol. 62, 157‐184.
Takahira, J., A. Cousin, M. Nelson and W. Cowling, 2011: Improvement in efficiency of microspore culture to produce doubled haploid canola (Brassica napus L.) by flow cytometry. Plant Cell Tiss. Organ Cult. 104, 51‐59.
Takayama, S. and A. Isogai, 2005: Self‐incompatibility in plants. Ann. Rev. Plant Biol. 56, 467‐489.
Takayama, S., H. Shiba, M. Iwano, H. Shimosato, F.‐S. Che, N. Kai, M. Watanabe, G. Suzuki, K. Hinata and A. Isogai, 2000: The pollen determinant of self‐incompatibility in Brassica campestris. Proc. Nat. Acad. Sci. USA 97, 1920‐1925.
Tang, L.‐S., Y. Li and J. Zhang, 2010: Partial rootzone irrigation increases water use efficiency, maintains yield and enhances economic profit of cotton in arid area. Agric. Water Manage. 97, 1527‐1533.
Tanksley, S. D., Nelson, J. C., 1996: Advanced backcross QTL analysis: a method for the simultaneous discovery and transfer of valuable QTLs from unadapted germplasm into elite breeding lines. Theor. Appl. Genet. 92, 191‐203.
Tester, M. and P. Langridge, 2010: Breeding technologies to increase crop production in a changing world. Science 327, 818‐822.
Tian, E., Y. Jiang, L. Chen, J. Zou, F. Liu and J. Meng, 2010: Synthesis of a Brassica trigenomic allohexaploid (B. carinata × B. rapa) de novo and its stability in subsequent generations. Theor. Appl. Genet. 121, 1431‐1440.

175
Tong, C., X. Wang, J. Yu, J. Wu, W. Li, J. Huang, C. Dong, W. Hua and S. Liu, 2013: Comprehensive analysis of RNA‐seq data reveals the complexity of the transcriptome in Brassica rapa. BMC Genomics 14, 689.
Trapnell, C., L. Pachter and S. L. Salzberg, 2009: TopHat: discovering splice junctions with RNA‐Seq. Bioinformatics 25, 1105‐1111.
Trapnell, C., A. Roberts, L. Goff, G. Pertea, D. Kim, D. R. Kelley, K. Pimentel, S. L. Salzberg, J. L. Rinn and L. Pachter, 2012: Differential gene and transcript expression analysis of RNA‐seq experiments with TopHat and Cufflinks. Nat. Protocols 7, 562‐578.
Tu, Y. Q., J. Sun, X. H. Ge and Z. Y. Li, 2010: Production and genetic analysis of partial hybrids from intertribal sexual crosses between Brassica napus and Isatis indigotica and progenies. Genome 53, 146‐156.
Turner, N., 1981: Techniques and experimental approaches for the measurement of plant water status. Plant Soil 58, 339‐366.
Turner, N., 1988a: Effects of water stress on plant growth and yield. ISI Atl. Sci‐Anim. Plant Sci. 1, 241‐244.
Turner, N. C., 1986: Crop water deficits: a decade of progress. Advances Agron. 39, 1‐51. Turner, N. C., 1988b: Measurement of plant water status by the pressure chamber technique.
Irrig. Sci. 9, 289‐308. Turner, N. C., 1991: Measurement and influence of environmental and plant factors on
stomatal conductance in the field. Agric. Forest Meteor. 54, 137‐154. Turner, N. C., 1997: Further progress in crop water relations. Advances Agron. 58, 293‐338. Turner, N. C., 2004: Agronomic options for improving rainfall‐use efficiency of crops in dryland
farming systems. J. Exp. Bot. 55, 2413‐2425. Turner, N. C. and W. Hartung, 2012: Dehydration of isolated roots of seven Lupinus species
induces synthesis of different amounts of free, but not conjugated, abscisic acid Plant Growth Regul. 66, 265‐269.
Turner, N. C. and M. M. Jones, 1980: Turgor maintenance by osmotic adjustment: A review and evaluation. In: N. C. Turner and P. J. Kramer eds. Adaptation of Plants to Water and High Temperature Stress. pp. 87‐103. John Wiley, New York.
Turner, N. C. and R. Meyer, 2011: Synthesis of regional impacts and global agricultural adjustments. In: S. S. Yadav, Redden, R.J., Hatfield, J.L., Lotze‐Campen, H., Hall, A.E. ed. Crop Adaptation to Climate Change. pp. 156‐165. Wiley‐Blackwell, Chichester, UK.
Turner, N. C. and M. E. Nicolas, 1998: Early vigour: a yield‐positive characteristic for wheat in drought‐prone Mediterranean‐type environment. In: R. K. Behl, D. P. Singh and G. P. Lodhi eds. Crop Improvement for Stress Tolerance. pp. 47‐62. CCS Haryana Agricultural University, Hisar and Max Mueller Bhawan, New Delhi.
Turner, N. C., J. C. O'Toole, R. T. Cruz, O. S. Namuco and S. Ahmad, 1986: Responses of seven diverse rice cultivars to water deficits I. Stress development, canopy temperature, leaf rolling and growth. Field Crops Res. 13, 257‐271.
Turner, N. C., G. C. Wright and K. H. M. Siddique, 2001: Adaptation of grain legumes (pulses) to water‐limited environments Advances in Agronomy. pp. 193‐231. Academic Press.
U, N., 1935: Genome analysis in Brassica with special reference to the experimental formation of B.napus and peculiar mode of fertilization. Jpn. J. Bot. 7, 389‐452.
Urano, K., K. Maruyama, Y. Ogata, Y. Morishita, M. Takeda, N. Sakurai, H. Suzuki, K. Saito, D. Shibata, M. Kobayashi, K. Yamaguchi‐Shinozaki and K. Shinozaki, 2009: Characterization of the ABA‐regulated global responses to dehydration in Arabidopsis by metabolomics. Plant J. 57, 1065‐1078.
Vadez, V., J. Kholova, S. Medina, A. Kakkera and H. Anderberg, 2014: Transpiration efficiency: new insight into an old story. J. Exp. Bot. online, 10.1093/jxb/eru1040.
van Doorn, W. G., E. P. Beers, J. L. Dangl, V. E. Franklin‐Tong, P. Gallois, I. Hara‐Nishimura, A. M. Jones, M. Kawai‐Yamada, E. Lam, J. Mundy, L. A. J. Mur, M. Petersen, A. Smertenko, M.
176
Taliansky, F. Van Breusegem, T. Wolpert, E. Woltering, B. Zhivotovsky and P. V. Bozhkov, 2011: Morphological classification of plant cell deaths. Cell Death Differ 18, 1241‐1246.
van Doorn, W. G. and E. J. Woltering, 2004: Senescence and programmed cell death: substance or semantics? J. Exp. Bot. 55, 2147‐2153.
Varshney, R. K., K. C. Bansal, P. K. Aggarwal, S. K. Datta and P. Q. Craufurd, 2011: Agricultural biotechnology for crop improvement in a variable climate: hope or hype? Trends Plant Sci. 16, 363‐371.
Vavilov, N. I., 1949: The origin, variation, immunity and breeding of cultivated plants. Chron. Bot. 13, 1‐364.
Velasco, L. and H. C. Becker, 1998: Analysis of total glucosinolate content and individual glucosinolates in Brassica spp. by near‐infrared reflectance spectroscopy. Plant Breed. 117, 97‐102.
Waditee, R., M. N. H. Bhuiyan, V. Rai, K. Aoki, Y. Tanaka, T. Hibino, S. Suzuki, J. Takano, A. T. Jagendorf, T. Takabe and T. Takabe, 2005: Genes for direct methylation of glycine provide high levels of glycinebetaine and abiotic‐stress tolerance in Synechococcus and Arabidopsis. Proc. Nat. Acad. Sci. USA 102, 1318‐1323.
Wang, J., X. Li, Y. Liu and X. Zhao, 2010: Salt stress induces programmed cell death in Thellungiella halophila suspension‐cultured cells. J. Plant Physiol. 167, 1145‐1151.
Wang, W., B. Vinocur and A. Altman, 2003: Plant responses to drought, salinity and extreme temperatures: towards genetic engineering for stress tolerance. Planta 218, 1‐14.
Wang, X., H. Wang, J. Wang, R. Sun, J. Wu, S. Liu, Y. Bai, J.‐H. Mun, I. Bancroft, F. Cheng, S. Huang, X. Li, W. Hua, J. Wang, X. Wang, M. Freeling, J. C. Pires, A. H. Paterson, B. Chalhoub, B. Wang, A. Hayward, A. G. Sharpe, B.‐S. Park, B. Weisshaar, B. Liu, B. Li, B. Liu, C. Tong, C. Song, C. Duran, C. Peng, C. Geng, C. Koh, C. Lin, D. Edwards, D. Mu, D. Shen, E. Soumpourou, F. Li, F. Fraser, G. Conant, G. Lassalle, G. J. King, G. Bonnema, H. Tang, H. Wang, H. Belcram, H. Zhou, H. Hirakawa, H. Abe, H. Guo, H. Wang, H. Jin, I. A. P. Parkin, J. Batley, J.‐S. Kim, J. Just, J. Li, J. Xu, J. Deng, J. A. Kim, J. Li, J. Yu, J. Meng, J. Wang, J. Min, J. Poulain, K. Hatakeyama, K. Wu, L. Wang, L. Fang, M. Trick, M. G. Links, M. Zhao, M. Jin, N. Ramchiary, N. Drou, P. J. Berkman, Q. Cai, Q. Huang, R. Li, S. Tabata, S. Cheng, S. Zhang, S. Zhang, S. Huang, S. Sato, S. Sun, S.‐J. Kwon, S.‐R. Choi, T.‐H. Lee, W. Fan, X. Zhao, X. Tan, X. Xu, Y. Wang, Y. Qiu, Y. Yin, Y. Li, Y. Du, Y. Liao, Y. Lim, Y. Narusaka, Y. Wang, Z. Wang, Z. Li, Z. Wang, Z. Xiong and Z. Zhang, 2011a: The genome of the mesopolyploid crop species Brassica rapa. Nat. Genet. 43, 1035‐1039.
Wang, Y., N. Ghaffari, C. Johnson, U. Braga‐Neto, H. Wang, R. Chen and H. Zhou, 2011b: Evaluation of the coverage and depth of transcriptome by RNA‐Seq in chickens. BMC Bioinformatics 12, S5.
Wang, Z., M. Gerstein and M. Snyder, 2009: RNA‐Seq: a revolutionary tool for transcriptomics. Nat. Rev. Genet. 10, 57‐63.
Warwick, S. I., L. D. Black and I. Aguinagalde, 1992: Molecular systematics of Brassica and allied genera (Subtribe Brassicinae, Brassiceae) — chloroplast DNA variation in the genus Diplotaxis. Theor. Appl. Genet. 83, 839‐850.
Warwick, S. I., A. Francis and R. K. Gugel, 2009: Guide to wiid germplasm of Brassica and allied crops (tribe Brassiceae, Brassicaceae) 3rd edition Agricultural and Agri‐Food Canada Techenical Bulletin. Ottawa, Canada.
Warwick, S. I., T. James and K. C. Falk, 2008: AFLP‐based molecular characterization of Brassica rapa and diversity in Canadian spring turnip rape cultivars. Plant Genet. Resour. 6, 11‐21.
Weller, S. G. and A. K. Sakai, 1999: Using phylogenetic approaches for the analysis of plant breeing system evolution. Ann. Rev. Ecol. Syst. 30, 167‐199.

177
Westgate, M. E., J. B. Passioura and R. Munns, 1996: Water status and ABA content of floral organs in drought‐stressed wheat. Funct. Plant Biol. 23, 763‐772.
White, J. and J. R. Law, 1991: Differentiation between varieties of oilseed rape (Brassica napus L.) on the basis of the fatty acid composition of the oil. Plant Var. Seeds 4, 125‐132.
Wilkins, P. W. and D. Thorogood, 1992: Breakdown of self‐incompatibility in perennial ryegrass at high temperature and its uses in breeding. Euphytica 64, 65‐69.
Williams, P. H. and C. B. Hill, 1986: Rapid‐cycling populations of Brassica. Science 13, 1985‐1989.
Woods, D. B. and N. C. Turner, 1971: Stomatal response to changing light by four tree species of varying shade tolerance. New Phytol. 70, 77‐84.
Xiao, D., N.‐W. Zhang, J.‐J. Zhao, G. Bonnema and X.‐L. Hou, 2012: Validation of reference genes for real‐time quantitative PCR normalisation in non‐heading Chinese cabbage. Funct. Plant Biol. 39, 342‐350.
Xu, H., L. Gauthier and G. André, 1995: Stomatal and cuticular transpiration of greenhouse tomato plants in response to high solution electrical conductivity and low soil water cotent. J. Am. Soc. Hortic. Sci. 120, 417‐422.
Xu, K., B. Chen, H. Wang, Q. Hu, C. Dixelius and X. Wu, 2004: RAPD analysis of genetic diversity of B.campestris accessions from Hubei and Zhejiang provinces and its relation with agronomic traits. Chinese J. Oil Crop Sci. 26, 20‐26.
Xu, Y., Q. Zhao, S. Mei and J. Wang, 2012: Genomic and transcriptomic alterations following hybridisation and genome doubling in trigenomic allohexaploid Brassica carinata × Brassica rapa. Plant Biol. 14, 734‐744.
Xu, Y., L. Zhong, X. Wu, X. Fang and J. Wang, 2009: Rapid alterations of gene expression and cytosine methylation in newly synthesized Brassica napus allopolyploids. Planta 229, 471‐483.
Yan, G., M. Nelson, A. Pradhan, A. S. Mason, S. Weerakoon, P. Si, J. A. Plummer and W. Cowling, 2009: Progress towards the creation of trigenomic Brassica hexaploid populations. SABRAO Journal of Breeding and Genetics 41, Special Supplement: 00274.
Yang, P., C. Shu, L. Chen, J. Xu, J. Wu and K. Liu, 2012: Identification of a major QTL for silique length and seed weight in oilseed rape (Brassica napus L.). Theor. Appl. Genet. 125, 285‐296.
Ye, J., L. Fang, H. Zheng, Y. Zhang, J. Chen, Z. Zhang, J. Wang, S. Li, R. Li, L. Bolund and J. Wang, 2006: WEGO: a web tool for plotting GO annotations. Nucl. Acids Res. 34, W293‐W297.
Yoshida, T., N. Nishimura, N. Kitahata, T. Kuromori, T. Ito, T. Asami, K. Shinozaki and T. Hirayama, 2006: ABA‐hypersensitive germination3 encodes a protein phosphatase 2C (AtPP2CA) that strongly regulates abscisic acid signaling during germination among Arabidopsis protein phosphatase 2Cs. Plant Physiol. 140, 115‐126.
Yu, S., F. Zhang, Y. Yu, D. Zhang, X. Zhao and W. Wang, 2012: Transcriptome profiling of dehydration stress in the Chinese cabbage (Brassica rapa L. ssp. pekinensis) by tag sequencing. Plant Mol. Biol. Rep. 30, 17‐28.
Yue, B., W. Xue, L. Xiong, X. Yu, L. Luo, K. Cui, D. Jin, Y. Xing and Q. Zhang, 2006: Genetic basis of drought resistance at reproductive stage in rice:separation of drought tolerance from drought avoidance. Genetics 172, 1213‐1228.
Zhang, H., I. Schonhof, A. Krumbein, B. Gutezeit, L. Li, H. Stützel and M. Schreiner, 2008: Water supply and growing season influence glucosinolate concentration and composition in turnip root (Brassica rapa ssp. rapifera L.). J. Plant Nutr. Soil Sci. 171, 255‐265.
Zhang, H., B. Yang, W. Z. Liu, H. Li, L. Wang, B. Wang, M. Deng, W. Liang, M. K. Deyholos and Y. Q. Jiang, 2014: Identification and characterization of CBL and CIPK gene families in canola (Brassica napus L.). Bmc Plant Biol. 14, 8.
Zhang, L., S. Yu, K. Zuo, L. Luo and K. Tang, 2012: Identification of gene modules associated with drought response in rice by network‐based analysis. PLoS ONE 7, e33748.
178
Zhang, Z. H., X. S. Qu, S. Wan, L. H. Chen and Y. G. Zhu, 2005: Comparison of QTL controlling seedling vigour under different temperature conditions using recombinant inbred lines in rice (Oryza sativa). Ann. Bot. 95, 423‐429.
Zhao, D. L., G. N. Atlin, L. Bastiaans and J. H. J. Spiertz, 2006: Comparing rice germplasm groups for growth, grain yield and weed‐suppressive ability under aerobic soil conditions. Weed Res. 46, 444‐452.
Zhao, J., A. Artemyeva, D. P. D. Carpio, R. K. Basnet, N. Zhang, J. Gao, F. Li, J. Bucher, X. Wang, R. G. F. Visser and G. Bonnema, 2010: Design of a Brassica rapa core collection for association mapping studies. Genome 53, 884‐898.
Zhao, J., J. Wang, L. An, R. Doerge, Z. Chen, C. Grau, J. Meng and T. Osborn, 2007: Analysis of gene expression profiles in response to Sclerotinia sclerotiorum in Brassica napus. Planta 227, 13‐24.
Zhao, J., X. Wang, B. Deng, P. Lou, J. Wu, R. Sun, Z. Xu, J. Vromans, M. Koornneef and G. Bonnema, 2005: Genetic relationships within Brassica rapa as inferred from AFLP fingerprints. Theor. Appl. Genet. 110, 1301‐1314.
Zhao, Q., J. Zou, J. Meng, S. Mei and W. Jianbo, 2013: Tracing the transcriptomic changes in synthetic trigenomic allohexaploids of Brassica using an RNA‐Seq approach. PLoS ONE 8, e68883.
Zheng, X., B. Chen, G. Liu and B. Han, 2009: Overexpression of a NAC transcription factor enhances rice drought and salt tolerance. Biochem. Biophys. Res. Commun. 379, 985‐989.
Zhu, L., R. Li, X. Wu, N. Wu, Y. Fan and X. Qian, 1998: Genetic diversity among Chinese oilseed accessions of Brassica rapa as determined by RAPD markers. Chinese Biod. 6, 99‐104.
Zhuang, J., A. S. Xiong, R. H. Peng, F. Gao, B. Zhu, J. Zhang, X. Y. Fu, X. F. Jin, J. M. Chen, Z. Zhang, Y. S. Qiao and Q. H. Yao, 2010: Analysis of Brassica rapa ESTs: gene discovery and expression patterns of AP2/ERF family genes. Mol. Biol. Rep. 37, 2485‐2492.
Zohary, D., M. Hopf and E. Weiss, 2012: Domestication of plants in the Old World, 4th Edition. Oxford University Press, Oxford, UK.


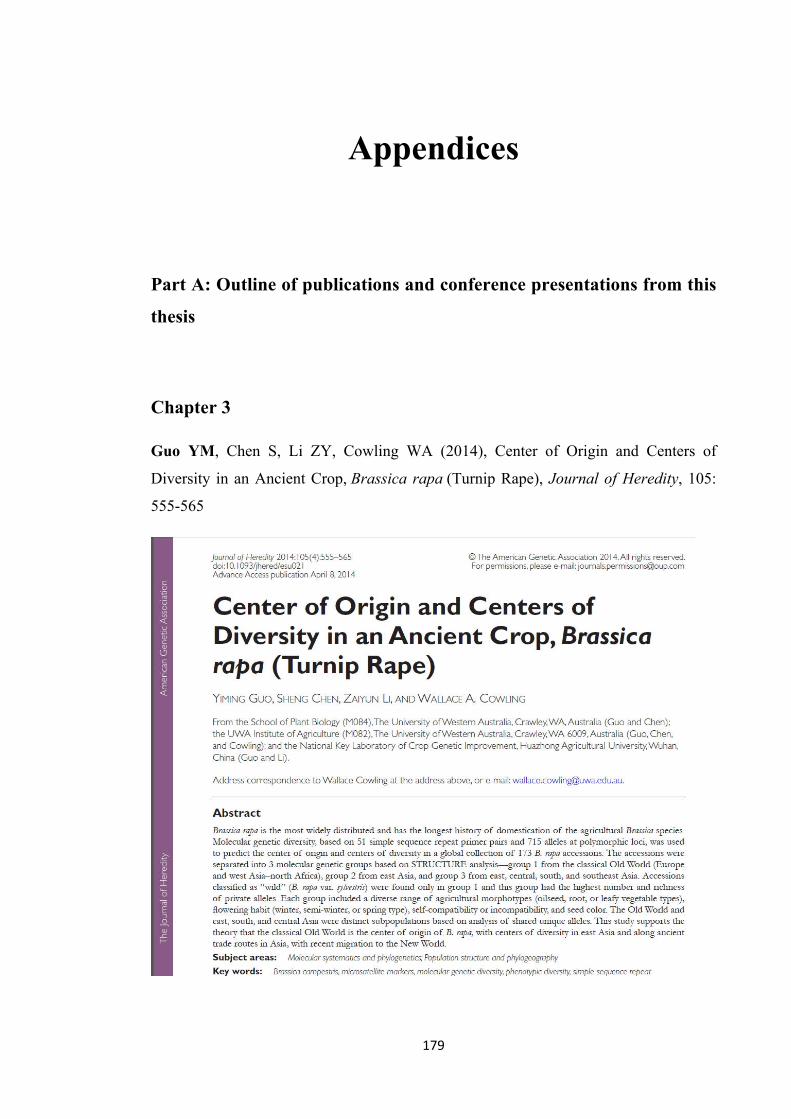
179
Appendices
Part A: Outline of publications and conference presentations from this
thesis
Chapter 3
Guo YM, Chen S, Li ZY, Cowling WA (2014), Center of Origin and Centers of
Diversity in an Ancient Crop, Brassica rapa (Turnip Rape), Journal of Heredity, 105:
555-565
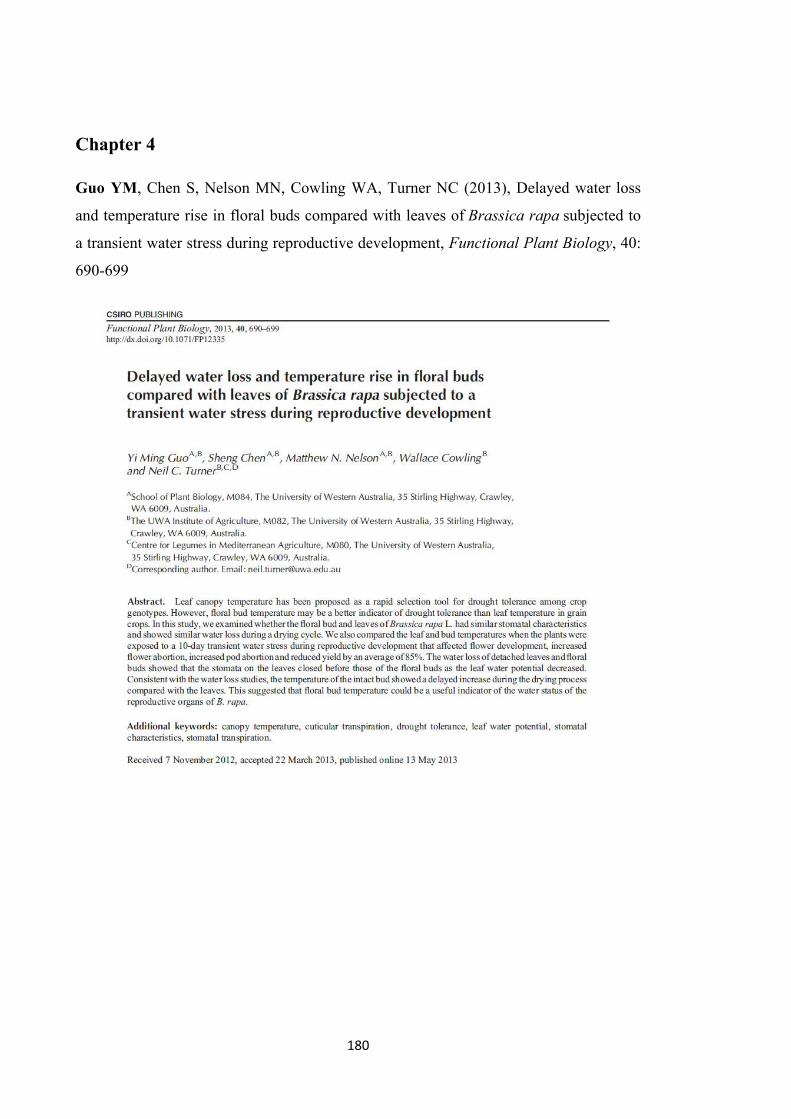
180
Chapter 4
Guo YM, Chen S, Nelson MN, Cowling WA, Turner NC (2013), Delayed water loss
and temperature rise in floral buds compared with leaves of Brassica rapa subjected to
a transient water stress during reproductive development, Functional Plant Biology, 40:
690-699
181
Chapter 5
Guo YM, Turner NC, Chen S, Nelson MN, Siddique KHM, Cowling WA (2014),
Genotypic variation for tolerance to transient drought during the reproductive phase of
Brassica rapa, Journal of Agronomy and Crop Science, submitted in June, 2014,
resubmitted on 29th Sept, 2014 with minor revision, and accepted for publication 6
October 2014.
Chapter 6
Guo YM, Hatzig S, Chen S, Nelson MN, Turner NC, Snowdon R. and Cowling WA
Association between drought stress response at the seedling stage and drought tolerance
at the reproductive stage in Brassica rapa. Formatted for submission to “Crop Pasture
Science”.
182
Chapter 7
Guo YM, Hatzig S, Samans B, Kibret K, Chen S, Turner NC, Cowling WA, Nelson
MN, Snowdon R (2015), Drought tolerance in Brassica rapa is associated with rapid
up-regulation of gene networks for general stress responses and programmed cell death.
Formatted for submission to “Plant, Cell & Environment”.
Conference Presentations
2014 The 18th Australian Research Assembly on Brassicas, Australian Oilseeds
Federation, Sept 30 – Oct 2, 2014, Adelaide, Australia
Oral presentation: Screening drought tolerance in Brassica rapa: from genetic variation
to gene expression
2014 The 19th Crucifer Genetic Workshop, Huazhong Agricultural University, Mar 30
– Apr 2, 2014, Wuhan, China
Poster presentation: Screening for drought tolerance in Brassica rapa
2013 InterDrought Ⅳ, The University of Western Australia, Sept 2 – 6, 2013, Perth,
Australia
Oral presentation: Is floral bud temperature a good indicator of drought tolerance in
Brassica rapa?
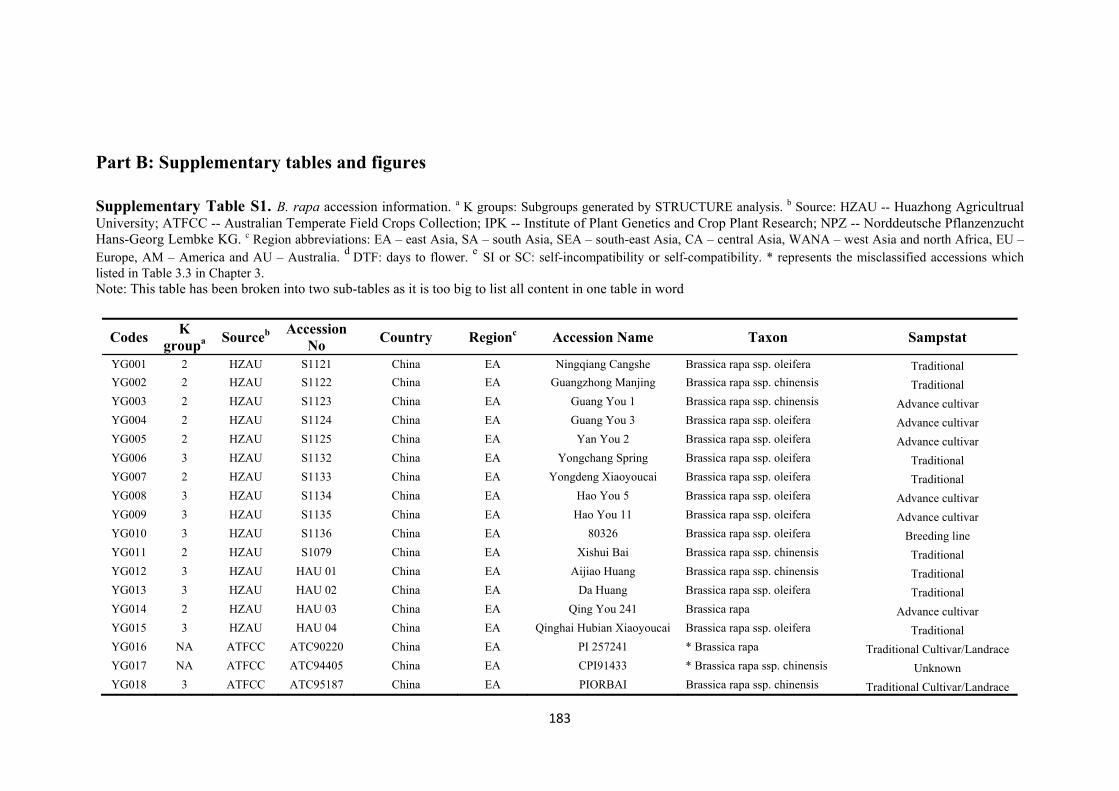
183
Part B: Supplementary tables and figures
Supplementary Table S1. B. rapa accession information. a K groups: Subgroups generated by STRUCTURE analysis. b Source: HZAU -- Huazhong Agricultrual University; ATFCC -- Australian Temperate Field Crops Collection; IPK -- Institute of Plant Genetics and Crop Plant Research; NPZ -- Norddeutsche Pflanzenzucht Hans-Georg Lembke KG. c Region abbreviations: EA – east Asia, SA – south Asia, SEA – south-east Asia, CA – central Asia, WANA – west Asia and north Africa, EU – Europe, AM – America and AU – Australia. d DTF: days to flower. e SI or SC: self-incompatibility or self-compatibility. * represents the misclassified accessions which listed in Table 3.3 in Chapter 3. Note: This table has been broken into two sub-tables as it is too big to list all content in one table in word
Codes K groupa Sourceb Accession
No Country Regionc Accession Name Taxon Sampstat
YG001 2 HZAU S1121 China EA Ningqiang Cangshe Brassica rapa ssp. oleifera Traditional YG002 2 HZAU S1122 China EA Guangzhong Manjing Brassica rapa ssp. chinensis Traditional YG003 2 HZAU S1123 China EA Guang You 1 Brassica rapa ssp. chinensis Advance cultivar YG004 2 HZAU S1124 China EA Guang You 3 Brassica rapa ssp. oleifera Advance cultivar YG005 2 HZAU S1125 China EA Yan You 2 Brassica rapa ssp. oleifera Advance cultivar YG006 3 HZAU S1132 China EA Yongchang Spring Brassica rapa ssp. oleifera Traditional YG007 2 HZAU S1133 China EA Yongdeng Xiaoyoucai Brassica rapa ssp. oleifera Traditional YG008 3 HZAU S1134 China EA Hao You 5 Brassica rapa ssp. oleifera Advance cultivar YG009 3 HZAU S1135 China EA Hao You 11 Brassica rapa ssp. oleifera Advance cultivar YG010 3 HZAU S1136 China EA 80326 Brassica rapa ssp. oleifera Breeding line YG011 2 HZAU S1079 China EA Xishui Bai Brassica rapa ssp. chinensis Traditional YG012 3 HZAU HAU 01 China EA Aijiao Huang Brassica rapa ssp. chinensis Traditional YG013 3 HZAU HAU 02 China EA Da Huang Brassica rapa ssp. oleifera Traditional YG014 2 HZAU HAU 03 China EA Qing You 241 Brassica rapa Advance cultivar YG015 3 HZAU HAU 04 China EA Qinghai Hubian Xiaoyoucai Brassica rapa ssp. oleifera Traditional YG016 NA ATFCC ATC90220 China EA PI 257241 * Brassica rapa Traditional Cultivar/Landrace YG017 NA ATFCC ATC94405 China EA CPI91433 * Brassica rapa ssp. chinensis Unknown YG018 3 ATFCC ATC95187 China EA PIORBAI Brassica rapa ssp. chinensis Traditional Cultivar/Landrace

184
YG019 3 ATFCC ATC95188 China EA K-109 Brassica rapa ssp. pekinensis Traditional Cultivar/Landrace YG020 3 ATFCC ATC95190 China EA K-123 Brassica rapa ssp. pekinensis Traditional Cultivar/Landrace YG021 3 ATFCC ATC95295 China EA CGN07187 Brassica rapa ssp. pekinensis Breeder's Line YG022 3 ATFCC ATC95302 China EA Tientsin Brassica rapa ssp. chinensis Traditional Cultivar/Landrace YG023 3 ATFCC ATC95303 China EA Xiao qing kou Brassica rapa ssp. pekinensis Traditional Cultivar/Landrace YG024 3 ATFCC ATC95360 China EA BRA 981 / 01 Brassica rapa ssp. pekinensis Traditional Cultivar/Landrace YG025 NA ATFCC ATC90219 Afghanistan SA PI 212083 * Brassica rapa Traditional Cultivar/Landrace YG026 3 UWA UWA01 Australia AU Mauri Ghat Brassica rapa / YG027 3 ATFCC ATC95339 Austria EU HRI 6175 Brassica rapa ssp. pekinensis Advanced cultivar YG028 1 ATFCC ATC95205 Belgium EU Ronde Witte-Dries 3 Brassica rapa Traditional Cultivar/Landrace YG029 3 NPZ 111 Germany EU yellow sarson Brassica rapa ssp. trilocularis / YG030 1 ATFCC ATC91213 Canada AM REWARD Brassica rapa ssp. trilocularis Advanced Cultivar YG031 1 ATFCC ATC91216 Canada AM MARERIUE Brassica rapa Advanced Cultivar YG032 1 ATFCC ATC95293 Canada AM Candle Brassica rapa Advanced cultivar YG033 3 ATFCC ATC95214 Egypt WANA Balady Brassica rapa Traditional Cultivar/Landrace YG034 3 NPZ 121 Germany EU CGN 7221 Brassica rapa / YG035 3 ATFCC ATC95234 Finland EU rova, svedjerova, lantsort Brassica rapa ssp. rapa Traditional Cultivar/Landrace YG036 NA ATFCC ATC90310 India SA PI 179652 * Brassica rapa Traditional Cultivar/Landrace YG037 3 ATFCC ATC92036 India SA IB 1104 Brassica rapa ssp. trilocularis Unknown YG038 3 ATFCC ATC92240 India SA 66-197-3 Brassica rapa ssp. trilocularis Unknown YG039 3 ATFCC ATC92254 India SA ARMIT CL-3 Brassica rapa ssp. trilocularis Unknown YG040 3 ATFCC ATC92339 India SA KBG CL-2 Brassica rapa ssp. trilocularis Unknown YG041 3 ATFCC ATC92368 India SA DC-1 Brassica rapa ssp. dicbotoma Unknown YG042 3 ATFCC ATC92371 India SA BS 113(AND) Brassica rapa ssp. dicbotoma Unknown YG043 3 ATFCC ATC92801 India SA IB 23 Brassica rapa Unknown YG044 3 ATFCC ATC95215 Indonesia SEA Tsja Sin Brassica rapa ssp.ruvo Traditional Cultivar/Landrace YG045 3 ATFCC ATC95216 Indonesia SEA Tsja Sin Brassica rapa ssp.ruvo Traditional Cultivar/Landrace YG046 3 ATFCC ATC95217 Indonesia SEA Tsja Sin Brassica rapa ssp.ruvo Traditional Cultivar/Landrace YG047 3 ATFCC ATC95218 Indonesia SEA Tsja Sin Brassica rapa ssp.ruvo Traditional Cultivar/Landrace
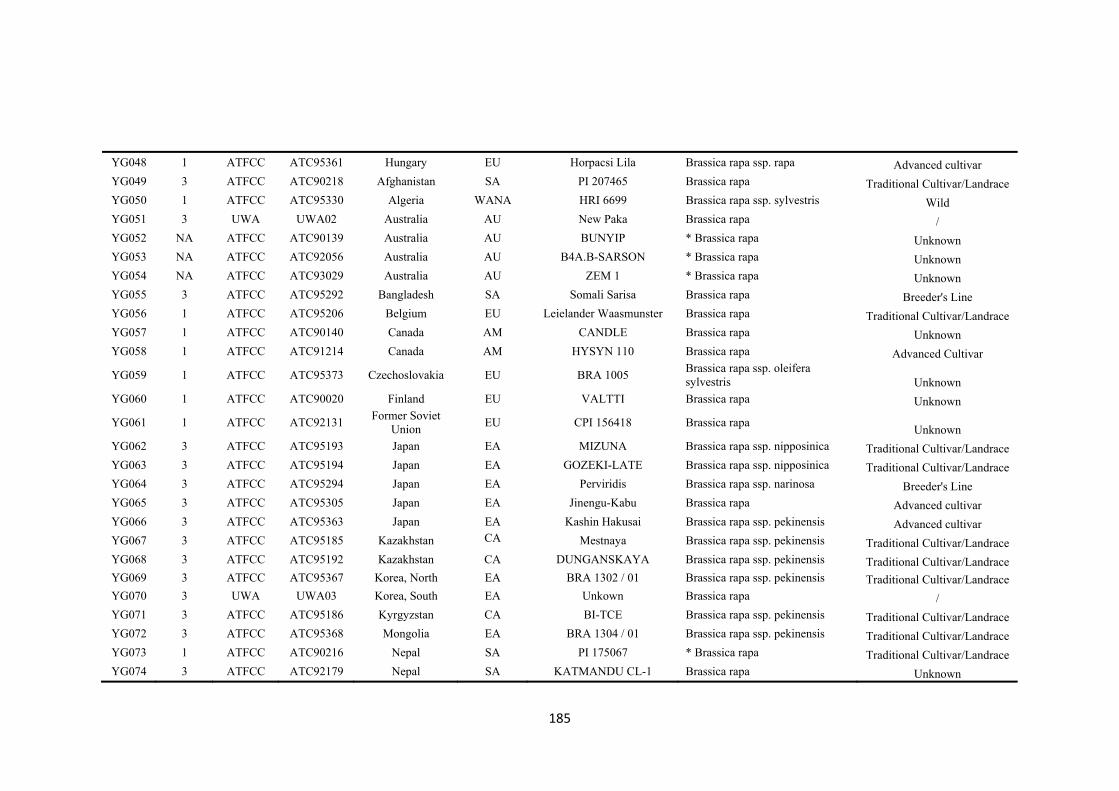
185
YG048 1 ATFCC ATC95361 Hungary EU Horpacsi Lila Brassica rapa ssp. rapa Advanced cultivar YG049 3 ATFCC ATC90218 Afghanistan SA PI 207465 Brassica rapa Traditional Cultivar/Landrace YG050 1 ATFCC ATC95330 Algeria WANA HRI 6699 Brassica rapa ssp. sylvestris Wild YG051 3 UWA UWA02 Australia AU New Paka Brassica rapa / YG052 NA ATFCC ATC90139 Australia AU BUNYIP * Brassica rapa Unknown YG053 NA ATFCC ATC92056 Australia AU B4A.B-SARSON * Brassica rapa Unknown YG054 NA ATFCC ATC93029 Australia AU ZEM 1 * Brassica rapa Unknown YG055 3 ATFCC ATC95292 Bangladesh SA Somali Sarisa Brassica rapa Breeder's Line YG056 1 ATFCC ATC95206 Belgium EU Leielander Waasmunster Brassica rapa Traditional Cultivar/Landrace YG057 1 ATFCC ATC90140 Canada AM CANDLE Brassica rapa Unknown YG058 1 ATFCC ATC91214 Canada AM HYSYN 110 Brassica rapa Advanced Cultivar
YG059 1 ATFCC ATC95373 Czechoslovakia EU BRA 1005 Brassica rapa ssp. oleifera sylvestris Unknown
YG060 1 ATFCC ATC90020 Finland EU VALTTI Brassica rapa Unknown
YG061 1 ATFCC ATC92131 Former Soviet
Union EU CPI 156418 Brassica rapa
Unknown YG062 3 ATFCC ATC95193 Japan EA MIZUNA Brassica rapa ssp. nipposinica Traditional Cultivar/Landrace YG063 3 ATFCC ATC95194 Japan EA GOZEKI-LATE Brassica rapa ssp. nipposinica Traditional Cultivar/Landrace YG064 3 ATFCC ATC95294 Japan EA Perviridis Brassica rapa ssp. narinosa Breeder's Line YG065 3 ATFCC ATC95305 Japan EA Jinengu-Kabu Brassica rapa Advanced cultivar YG066 3 ATFCC ATC95363 Japan EA Kashin Hakusai Brassica rapa ssp. pekinensis Advanced cultivar YG067 3 ATFCC ATC95185 Kazakhstan CA Mestnaya Brassica rapa ssp. pekinensis Traditional Cultivar/Landrace YG068 3 ATFCC ATC95192 Kazakhstan CA DUNGANSKAYA Brassica rapa ssp. pekinensis Traditional Cultivar/Landrace YG069 3 ATFCC ATC95367 Korea, North EA BRA 1302 / 01 Brassica rapa ssp. pekinensis Traditional Cultivar/Landrace YG070 3 UWA UWA03 Korea, South EA Unkown Brassica rapa / YG071 3 ATFCC ATC95186 Kyrgyzstan CA BI-TCE Brassica rapa ssp. pekinensis Traditional Cultivar/Landrace YG072 3 ATFCC ATC95368 Mongolia EA BRA 1304 / 01 Brassica rapa ssp. pekinensis Traditional Cultivar/Landrace YG073 1 ATFCC ATC90216 Nepal SA PI 175067 * Brassica rapa Traditional Cultivar/Landrace YG074 3 ATFCC ATC92179 Nepal SA KATMANDU CL-1 Brassica rapa Unknown

186
YG075 1 ATFCC ATC95237 Norway EU Målselvnepe Åsvejen Stamme
Brassica rapa ssp. rapa Advanced Cultivar YG076 1 ATFCC ATC95238 Norway EU Brunstadnepe Brassica rapa ssp. rapa Advanced Cultivar YG077 1 ATFCC ATC95239 Norway EU Gul Finlandsk Brassica rapa ssp. rapa Advanced Cultivar YG078 1 ATFCC ATC95248 Norway EU Foll' Elite E Brassica rapa Traditional Cultivar/Landrace YG079 NA ATFCC ATC95208 Pakistan SA CGN 6850 * Brassica rapa Traditional Cultivar/Landrace YG080 3 ATFCC ATC95211 Pakistan SA CGN 7222 Brassica rapa ssp. pekinensis Traditional Cultivar/Landrace YG081 3 ATFCC ATC95298 Pakistan SA CGN07222 Brassica rapa ssp. pekinensis Traditional Cultivar/Landrace YG082 1 ATFCC ATC95331 Portugal EU NABAL DE GREILOS Brassica rapa ssp. rapa Traditional Cultivar/Landrace YG083 2 ATFCC ATC95184 Russian EU SALAT YAPONSKII Brassica rapa ssp. chinensis Traditional Cultivar/Landrace YG084 3 ATFCC ATC95191 Russian EU K-136 Brassica rapa ssp. pekinensis Traditional Cultivar/Landrace YG085 NA ATFCC ATC92087 Sweden EU GULLE * Brassica rapa Unknown YG086 3 ATFCC ATC95349 Syria WANA HRI 8170 Brassica rapa ssp. rapa Traditional Cultivar/Landrace YG087 2 ATFCC ATC95340 Thailand SEA HRI 6202 Brassica rapa ssp. pekinensis Advanced cultivar YG088 3 ATFCC ATC90217 Turkey WANA PI 175608 Brassica rapa Traditional Cultivar/Landrace YG089 NA ATFCC ATC95242 Ukraine EU K-4170 * Brassica rapa ssp. oleifera Wild YG090 3 ATFCC ATC95219 Uzbekistan CA CGN 20198 Brassica rapa ssp. pekinensis Traditional Cultivar/Landrace YG091 2 HZAU S1160 China EA Guiyangzaoyoucai Brassica rapa var. oleifera / YG092 3 HZAU S1161 China EA Xiangxiangyoucai Brassica rapa var. oleifera / YG093 2 HZAU S1174 China EA Qidonghuangyoucai Brassica rapa var. oleifera / YG094 3 HZAU S1175 China EA Suzhouzangcai Brassica rapa var. oleifera / YG095 3 HZAU S1200 China EA Shaoxingguihuazhong Brassica rapa var. oleifera / YG096 3 HZAU S1201 China EA Tongxiangchanggengbai Brassica rapa var. oleifera / YG097 NA ATFCC ATC94728 Australia AU BRA 3 * Brassica rapa Unknown YG098 3 ATFCC ATC90223 Brazil AM PI 324507 Brassica rapa Traditional Cultivar/Landrace YG099 1 ATFCC ATC95235 Finland EU rova, svedjerova Brassica rapa ssp. rapa Traditional Cultivar/Landrace
YG100 1 ATFCC ATC92133 Former Soviet Union
EU CPI 156420 Brassica rapa Unknown YG101 1 ATFCC ATC90119 Sweden EU ARLO Brassica rapa Unknown YG102 2 ATFCC ATC95366 Korea, North EA BRA 1297 / 01 Brassica rapa ssp. pekinensis Traditional Cultivar/Landrace
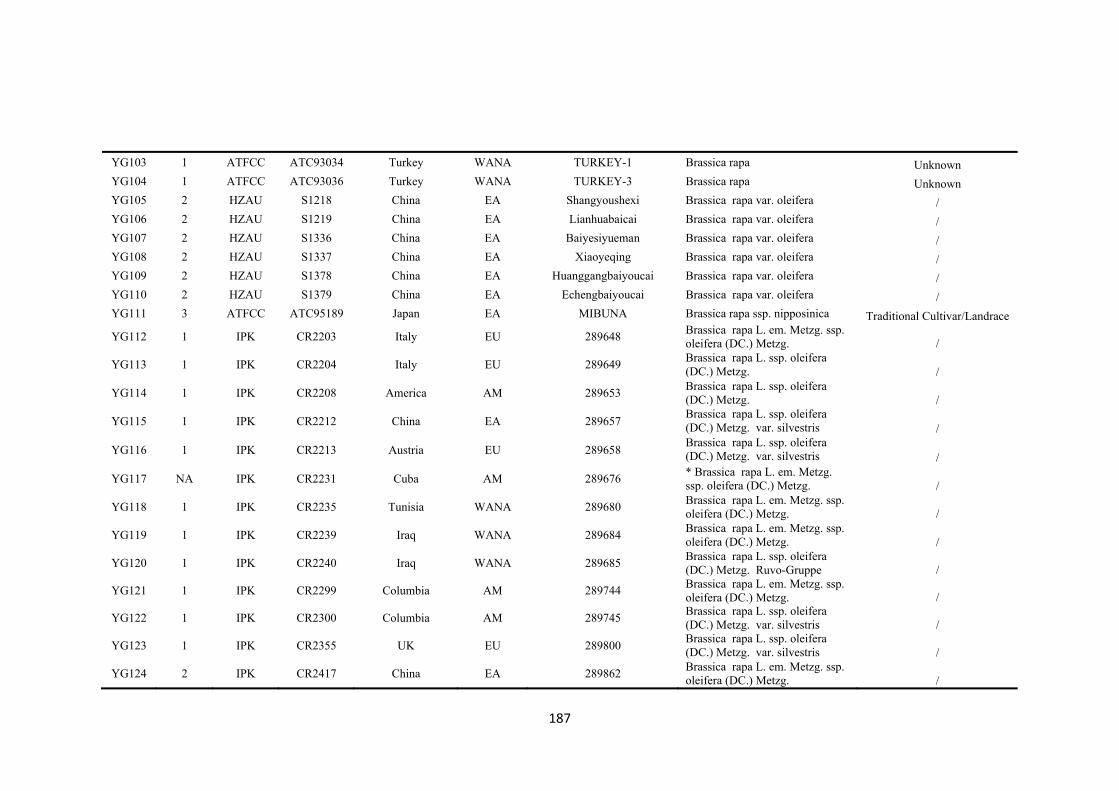
187
YG103 1 ATFCC ATC93034 Turkey WANA TURKEY-1 Brassica rapa Unknown YG104 1 ATFCC ATC93036 Turkey WANA TURKEY-3 Brassica rapa Unknown YG105 2 HZAU S1218 China EA Shangyoushexi Brassica rapa var. oleifera / YG106 2 HZAU S1219 China EA Lianhuabaicai Brassica rapa var. oleifera / YG107 2 HZAU S1336 China EA Baiyesiyueman Brassica rapa var. oleifera / YG108 2 HZAU S1337 China EA Xiaoyeqing Brassica rapa var. oleifera / YG109 2 HZAU S1378 China EA Huanggangbaiyoucai Brassica rapa var. oleifera / YG110 2 HZAU S1379 China EA Echengbaiyoucai Brassica rapa var. oleifera / YG111 3 ATFCC ATC95189 Japan EA MIBUNA Brassica rapa ssp. nipposinica Traditional Cultivar/Landrace
YG112 1 IPK CR2203 Italy EU 289648 Brassica rapa L. em. Metzg. ssp. oleifera (DC.) Metzg. /
YG113 1 IPK CR2204 Italy EU 289649 Brassica rapa L. ssp. oleifera (DC.) Metzg. /
YG114 1 IPK CR2208 America AM 289653 Brassica rapa L. ssp. oleifera (DC.) Metzg. /
YG115 1 IPK CR2212 China EA 289657 Brassica rapa L. ssp. oleifera (DC.) Metzg. var. silvestris /
YG116 1 IPK CR2213 Austria EU 289658 Brassica rapa L. ssp. oleifera (DC.) Metzg. var. silvestris /
YG117 NA IPK CR2231 Cuba AM 289676 * Brassica rapa L. em. Metzg. ssp. oleifera (DC.) Metzg. /
YG118 1 IPK CR2235 Tunisia WANA 289680 Brassica rapa L. em. Metzg. ssp. oleifera (DC.) Metzg. /
YG119 1 IPK CR2239 Iraq WANA 289684 Brassica rapa L. em. Metzg. ssp. oleifera (DC.) Metzg. /
YG120 1 IPK CR2240 Iraq WANA 289685 Brassica rapa L. ssp. oleifera (DC.) Metzg. Ruvo-Gruppe /
YG121 1 IPK CR2299 Columbia AM 289744 Brassica rapa L. em. Metzg. ssp. oleifera (DC.) Metzg. /
YG122 1 IPK CR2300 Columbia AM 289745 Brassica rapa L. ssp. oleifera (DC.) Metzg. var. silvestris /
YG123 1 IPK CR2355 UK EU 289800 Brassica rapa L. ssp. oleifera (DC.) Metzg. var. silvestris /
YG124 2 IPK CR2417 China EA 289862 Brassica rapa L. em. Metzg. ssp. oleifera (DC.) Metzg. /
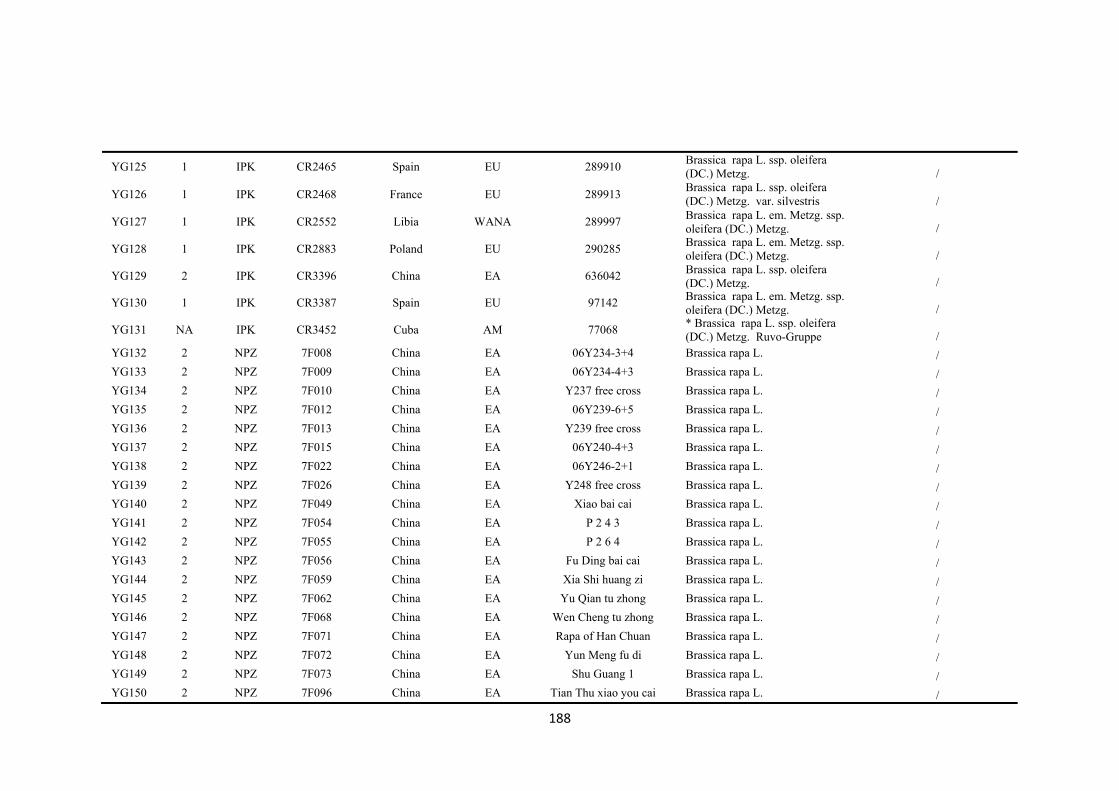
188
YG125 1 IPK CR2465 Spain EU 289910 Brassica rapa L. ssp. oleifera (DC.) Metzg. /
YG126 1 IPK CR2468 France EU 289913 Brassica rapa L. ssp. oleifera (DC.) Metzg. var. silvestris /
YG127 1 IPK CR2552 Libia WANA 289997 Brassica rapa L. em. Metzg. ssp. oleifera (DC.) Metzg. /
YG128 1 IPK CR2883 Poland EU 290285 Brassica rapa L. em. Metzg. ssp. oleifera (DC.) Metzg. /
YG129 2 IPK CR3396 China EA 636042 Brassica rapa L. ssp. oleifera (DC.) Metzg. /
YG130 1 IPK CR3387 Spain EU 97142 Brassica rapa L. em. Metzg. ssp. oleifera (DC.) Metzg. /
YG131 NA IPK CR3452 Cuba AM 77068 * Brassica rapa L. ssp. oleifera (DC.) Metzg. Ruvo-Gruppe /
YG132 2 NPZ 7F008 China EA 06Y234-3+4 Brassica rapa L. / YG133 2 NPZ 7F009 China EA 06Y234-4+3 Brassica rapa L. / YG134 2 NPZ 7F010 China EA Y237 free cross Brassica rapa L. / YG135 2 NPZ 7F012 China EA 06Y239-6+5 Brassica rapa L. / YG136 2 NPZ 7F013 China EA Y239 free cross Brassica rapa L. / YG137 2 NPZ 7F015 China EA 06Y240-4+3 Brassica rapa L. / YG138 2 NPZ 7F022 China EA 06Y246-2+1 Brassica rapa L. / YG139 2 NPZ 7F026 China EA Y248 free cross Brassica rapa L. / YG140 2 NPZ 7F049 China EA Xiao bai cai Brassica rapa L. / YG141 2 NPZ 7F054 China EA P 2 4 3 Brassica rapa L. / YG142 2 NPZ 7F055 China EA P 2 6 4 Brassica rapa L. / YG143 2 NPZ 7F056 China EA Fu Ding bai cai Brassica rapa L. / YG144 2 NPZ 7F059 China EA Xia Shi huang zi Brassica rapa L. / YG145 2 NPZ 7F062 China EA Yu Qian tu zhong Brassica rapa L. / YG146 2 NPZ 7F068 China EA Wen Cheng tu zhong Brassica rapa L. / YG147 2 NPZ 7F071 China EA Rapa of Han Chuan Brassica rapa L. / YG148 2 NPZ 7F072 China EA Yun Meng fu di Brassica rapa L. / YG149 2 NPZ 7F073 China EA Shu Guang 1 Brassica rapa L. / YG150 2 NPZ 7F096 China EA Tian Thu xiao you cai Brassica rapa L. /
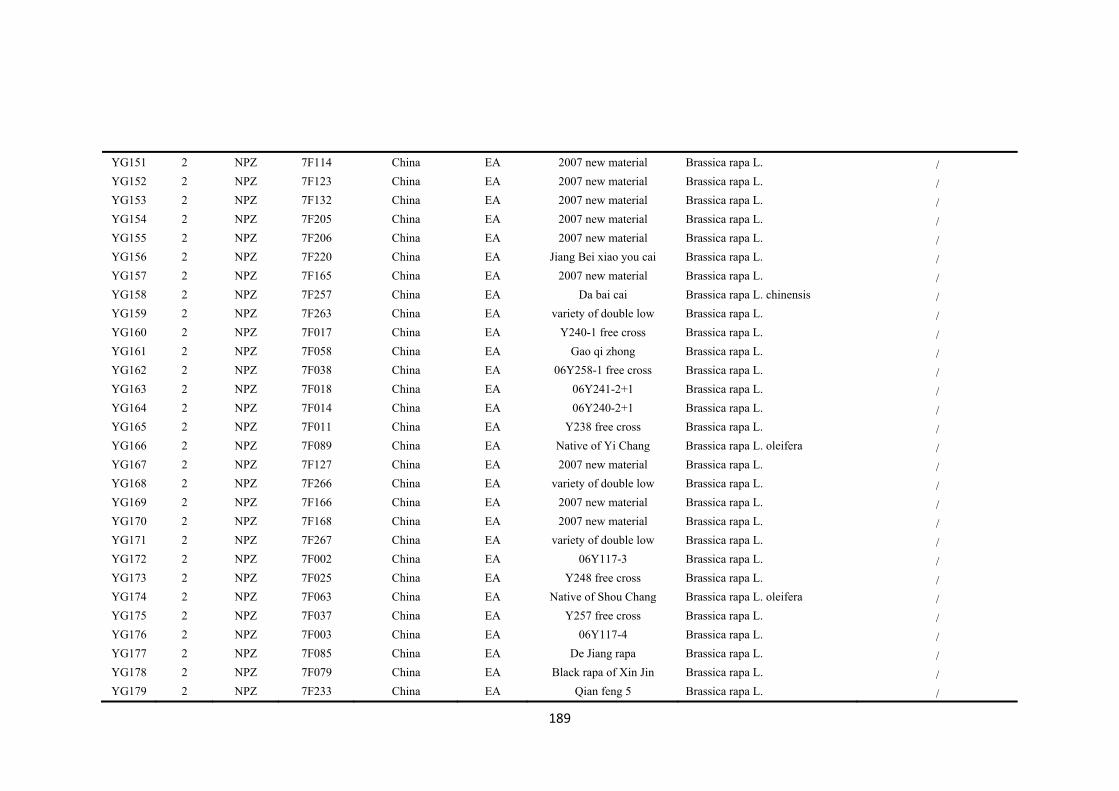
189
YG151 2 NPZ 7F114 China EA 2007 new material Brassica rapa L. / YG152 2 NPZ 7F123 China EA 2007 new material Brassica rapa L. / YG153 2 NPZ 7F132 China EA 2007 new material Brassica rapa L. / YG154 2 NPZ 7F205 China EA 2007 new material Brassica rapa L. / YG155 2 NPZ 7F206 China EA 2007 new material Brassica rapa L. / YG156 2 NPZ 7F220 China EA Jiang Bei xiao you cai Brassica rapa L. / YG157 2 NPZ 7F165 China EA 2007 new material Brassica rapa L. / YG158 2 NPZ 7F257 China EA Da bai cai Brassica rapa L. chinensis / YG159 2 NPZ 7F263 China EA variety of double low Brassica rapa L. / YG160 2 NPZ 7F017 China EA Y240-1 free cross Brassica rapa L. / YG161 2 NPZ 7F058 China EA Gao qi zhong Brassica rapa L. / YG162 2 NPZ 7F038 China EA 06Y258-1 free cross Brassica rapa L. / YG163 2 NPZ 7F018 China EA 06Y241-2+1 Brassica rapa L. / YG164 2 NPZ 7F014 China EA 06Y240-2+1 Brassica rapa L. / YG165 2 NPZ 7F011 China EA Y238 free cross Brassica rapa L. / YG166 2 NPZ 7F089 China EA Native of Yi Chang Brassica rapa L. oleifera / YG167 2 NPZ 7F127 China EA 2007 new material Brassica rapa L. / YG168 2 NPZ 7F266 China EA variety of double low Brassica rapa L. / YG169 2 NPZ 7F166 China EA 2007 new material Brassica rapa L. / YG170 2 NPZ 7F168 China EA 2007 new material Brassica rapa L. / YG171 2 NPZ 7F267 China EA variety of double low Brassica rapa L. / YG172 2 NPZ 7F002 China EA 06Y117-3 Brassica rapa L. / YG173 2 NPZ 7F025 China EA Y248 free cross Brassica rapa L. / YG174 2 NPZ 7F063 China EA Native of Shou Chang Brassica rapa L. oleifera / YG175 2 NPZ 7F037 China EA Y257 free cross Brassica rapa L. / YG176 2 NPZ 7F003 China EA 06Y117-4 Brassica rapa L. / YG177 2 NPZ 7F085 China EA De Jiang rapa Brassica rapa L. / YG178 2 NPZ 7F079 China EA Black rapa of Xin Jin Brassica rapa L. / YG179 2 NPZ 7F233 China EA Qian feng 5 Brassica rapa L. /

190
YG180 2 NPZ 7F226 China EA Rapa of Yi Chang Brassica rapa L. oleifera / YG181 1 HZAU ZL01 Sweden EU Svalof 0308 Brassica rapa oleifera biennis Breeding/research material YG182 1 HZAU ZL02 Pakistan SA CGN07221 Brassica rapa oleifera biennis Traditional cultivar/landrace YG183 1 HZAU ZL03 Germany EU Rapido's Winterraapzaad Brassica rapa oleifera biennis Advanced/Improved Cultivar YG184 2 HZAU ZL04 Germany EU Gruebers Winterraapzaad Brassica rapa oleifera biennis Advanced/Improved Cultivar YG185 1 HZAU ZL05 Sweden EU SV 8437520 Brassica rapa Breeding/research material YG186 2 HZAU ZL06 Canada AM 1329 Brassica rapa / YG187 2 HZAU ZL07 New EA New rapa Brassica rapa Derived from B. napus
Code Seed Color DTFd Flowering
type Pod number and size SI or SCe Variety 100-seed weight (g)
Non-vern Vern After vern Non-vern Vern YG001 Dark 129 93 21 Semi-Winter 0 0 SI Oilseed 0.465
YG002 Dark 151 101 29 Semi-Winter 0 0 SI Leafy 0.219
YG003 Dark 99 99 27 Semi-Winter 0 0 SI Leafy 0.31
YG004 Dark 127 95 23 Semi-Winter 2S 2M SI Oilseed 0.344
YG005 Dark 112 93 21 Semi-Winter 1S 0 SI Oilseed 0.348
YG006 Dark 103 99 27 Semi-Winter 0 0 SI Oilseed 0.272
YG007 Dark 109 93 21 Semi-Winter 4S 1S SC Oilseed 0.364
YG008 Dark 109 100 28 Semi-Winter 7S 1S SC Oilseed 0.36
YG009 Dark 104 95 23 Semi-Winter 0 0 SI Oilseed 0.272
YG010 Dark 111 94 22 Semi-Winter 5M 9M SC Oilseed 0.31
YG011 Mixed 78 90 18 Spring 0 1M SI Oilseed 0.26
YG012 Dark 153 106 34 Semi-Winter 0 0 SI Leafy 0.28
YG013 Yellow 91 118 46 Semi-Winter 0 0 SI Oilseed 0.589
YG014 Dark 67 96 24 Spring 2S 0 SI Oilseed 0.369
YG015 Dark 77 97 25 Spring 0 3S SI Oilseed 0.312
YG016 Dark 82 93 21 Spring 0 0 SI Leafy 0.403
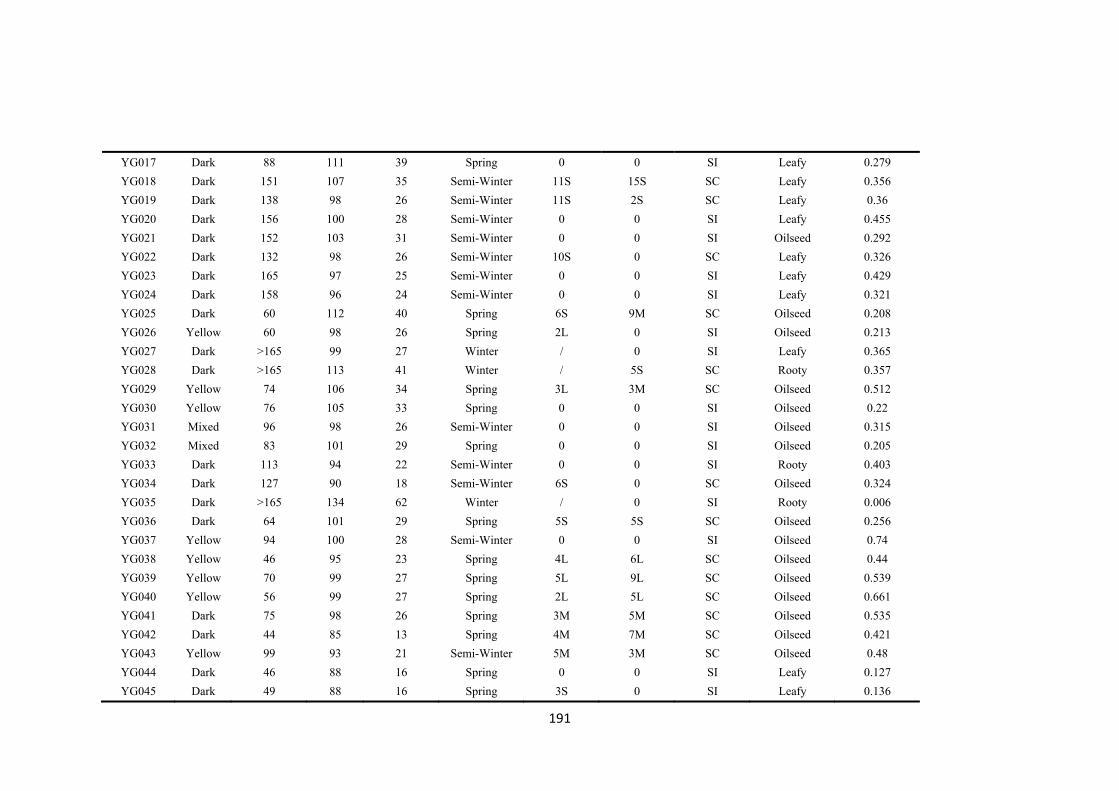
191
YG017 Dark 88 111 39 Spring 0 0 SI Leafy 0.279
YG018 Dark 151 107 35 Semi-Winter 11S 15S SC Leafy 0.356
YG019 Dark 138 98 26 Semi-Winter 11S 2S SC Leafy 0.36
YG020 Dark 156 100 28 Semi-Winter 0 0 SI Leafy 0.455
YG021 Dark 152 103 31 Semi-Winter 0 0 SI Oilseed 0.292
YG022 Dark 132 98 26 Semi-Winter 10S 0 SC Leafy 0.326
YG023 Dark 165 97 25 Semi-Winter 0 0 SI Leafy 0.429
YG024 Dark 158 96 24 Semi-Winter 0 0 SI Leafy 0.321
YG025 Dark 60 112 40 Spring 6S 9M SC Oilseed 0.208
YG026 Yellow 60 98 26 Spring 2L 0 SI Oilseed 0.213
YG027 Dark >165 99 27 Winter / 0 SI Leafy 0.365
YG028 Dark >165 113 41 Winter / 5S SC Rooty 0.357
YG029 Yellow 74 106 34 Spring 3L 3M SC Oilseed 0.512
YG030 Yellow 76 105 33 Spring 0 0 SI Oilseed 0.22
YG031 Mixed 96 98 26 Semi-Winter 0 0 SI Oilseed 0.315
YG032 Mixed 83 101 29 Spring 0 0 SI Oilseed 0.205
YG033 Dark 113 94 22 Semi-Winter 0 0 SI Rooty 0.403
YG034 Dark 127 90 18 Semi-Winter 6S 0 SC Oilseed 0.324
YG035 Dark >165 134 62 Winter / 0 SI Rooty 0.006
YG036 Dark 64 101 29 Spring 5S 5S SC Oilseed 0.256
YG037 Yellow 94 100 28 Semi-Winter 0 0 SI Oilseed 0.74
YG038 Yellow 46 95 23 Spring 4L 6L SC Oilseed 0.44
YG039 Yellow 70 99 27 Spring 5L 9L SC Oilseed 0.539
YG040 Yellow 56 99 27 Spring 2L 5L SC Oilseed 0.661
YG041 Dark 75 98 26 Spring 3M 5M SC Oilseed 0.535
YG042 Dark 44 85 13 Spring 4M 7M SC Oilseed 0.421
YG043 Yellow 99 93 21 Semi-Winter 5M 3M SC Oilseed 0.48
YG044 Dark 46 88 16 Spring 0 0 SI Leafy 0.127
YG045 Dark 49 88 16 Spring 3S 0 SI Leafy 0.136

192
YG046 Dark 48 83 11 Spring 4S 4M SC Leafy 0.35
YG047 Dark 40 86 14 Spring 0 0 SI Leafy 0.276
YG048 Dark Uknown 114 42 Winter / 0 SI Rooty 0.06
YG049 Dark 55 98 26 Spring 0 0 SI Oilseed 0.446
YG050 Dark 158 131 59 Semi-Winter 0 7S SC Rooty 0.242
YG051 Dark 52 82 10 Spring 0 0 SI Oilseed 0.463
YG052 Dark 130 114 28 Semi-Winter 11M 0 SC Oilseed 0.367
YG053 Dark 105 123 51 Semi-Winter 4M 9M SC Oilseed 0.392
YG054 Yellow 112 141 69 Semi-Winter 5M 10M SC Oilseed 0.253
YG055 Yellow 77 95 23 Spring 2L 5M SC Oilseed 0.429
YG056 Dark >165 117 31 Winter / 1S SI Rooty 0.305
YG057 Dark 63 105 19 Spring 1S 4S SC Oilseed 0.27
YG058 Mixed 96 101 15 Semi-Winter 0 0 SI Oilseed 0.195
YG059 Dark 100 111 39 Semi-Winter 0 0 SI Oilseed 0.025
YG060 Yellow 92 109 37 Semi-Winter 3S 8M SC Oilseed 0.307
YG061 Dark 96 100 28 Semi-Winter 0 0 SI Oilseed 0.111
YG062 Dark >165 116 44 Winter / 0 SI Leafy 0.145
YG063 Dark 173 126 54 Semi-Winter / 3S SI Leafy 0.312
YG064 Dark 146 116 30 Semi-Winter 0 0 SI Leafy 0.34
YG065 Yellow Uknown 101 29 Semi-Winter / 3S SI Rooty 0.418
YG066 Dark Uknown 100 28 Unknown / 0 SI Leafy 0.473
YG067 Dark 142 101 29 Semi-Winter 2S 0 SI Leafy 0.392
YG068 Dark >165 103 31 Winter / 0 SI Leafy 0.338
YG069 Dark Uknown 98 26 Semi-Winter / 0 SI Leafy 0.369
YG070 Dark Uknown 105 33 Semi-Winter / 0 SI Leafy 0.037
YG071 Dark 130 97 25 Semi-Winter 0 0 SI Leafy 0.389
YG072 Dark Uknown 108 22 Semi-Winter / 4M SC Leafy 0.044
YG073 Dark Uknown 104 32 Semi-Winter / 4S SC Oilseed 0.228
YG074 Yellow 81 92 20 Spring 3M 3M SC Oilseed 0.358
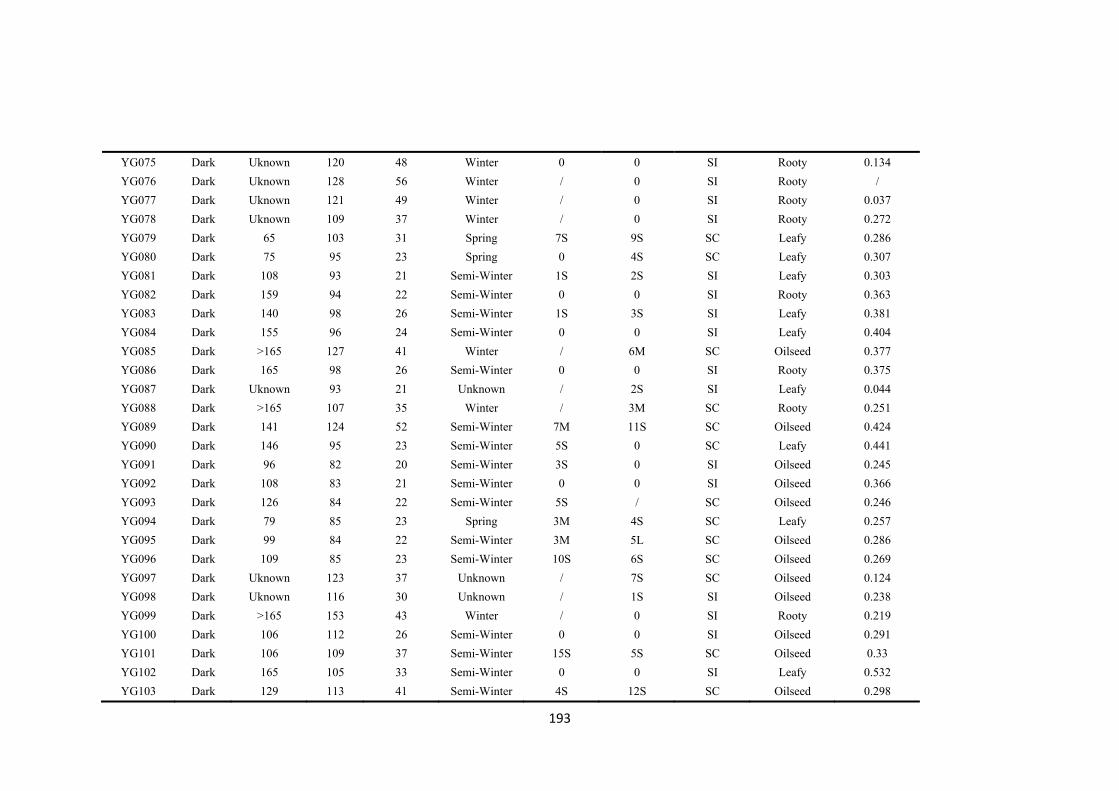
193
YG075 Dark Uknown 120 48 Winter 0 0 SI Rooty 0.134
YG076 Dark Uknown 128 56 Winter / 0 SI Rooty /
YG077 Dark Uknown 121 49 Winter / 0 SI Rooty 0.037
YG078 Dark Uknown 109 37 Winter / 0 SI Rooty 0.272
YG079 Dark 65 103 31 Spring 7S 9S SC Leafy 0.286
YG080 Dark 75 95 23 Spring 0 4S SC Leafy 0.307
YG081 Dark 108 93 21 Semi-Winter 1S 2S SI Leafy 0.303
YG082 Dark 159 94 22 Semi-Winter 0 0 SI Rooty 0.363
YG083 Dark 140 98 26 Semi-Winter 1S 3S SI Leafy 0.381
YG084 Dark 155 96 24 Semi-Winter 0 0 SI Leafy 0.404
YG085 Dark >165 127 41 Winter / 6M SC Oilseed 0.377
YG086 Dark 165 98 26 Semi-Winter 0 0 SI Rooty 0.375
YG087 Dark Uknown 93 21 Unknown / 2S SI Leafy 0.044
YG088 Dark >165 107 35 Winter / 3M SC Rooty 0.251
YG089 Dark 141 124 52 Semi-Winter 7M 11S SC Oilseed 0.424
YG090 Dark 146 95 23 Semi-Winter 5S 0 SC Leafy 0.441
YG091 Dark 96 82 20 Semi-Winter 3S 0 SI Oilseed 0.245
YG092 Dark 108 83 21 Semi-Winter 0 0 SI Oilseed 0.366
YG093 Dark 126 84 22 Semi-Winter 5S / SC Oilseed 0.246
YG094 Dark 79 85 23 Spring 3M 4S SC Leafy 0.257
YG095 Dark 99 84 22 Semi-Winter 3M 5L SC Oilseed 0.286
YG096 Dark 109 85 23 Semi-Winter 10S 6S SC Oilseed 0.269
YG097 Dark Uknown 123 37 Unknown / 7S SC Oilseed 0.124
YG098 Dark Uknown 116 30 Unknown / 1S SI Oilseed 0.238
YG099 Dark >165 153 43 Winter / 0 SI Rooty 0.219
YG100 Dark 106 112 26 Semi-Winter 0 0 SI Oilseed 0.291
YG101 Dark 106 109 37 Semi-Winter 15S 5S SC Oilseed 0.33
YG102 Dark 165 105 33 Semi-Winter 0 0 SI Leafy 0.532
YG103 Dark 129 113 41 Semi-Winter 4S 12S SC Oilseed 0.298
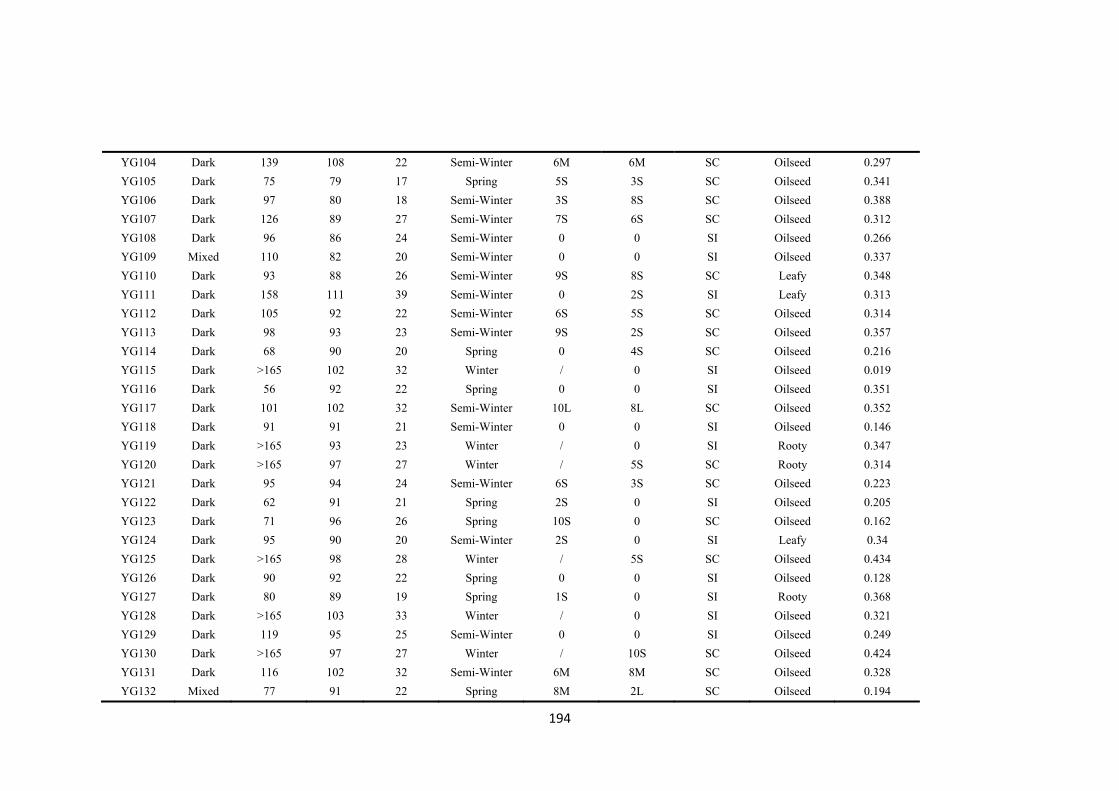
194
YG104 Dark 139 108 22 Semi-Winter 6M 6M SC Oilseed 0.297
YG105 Dark 75 79 17 Spring 5S 3S SC Oilseed 0.341
YG106 Dark 97 80 18 Semi-Winter 3S 8S SC Oilseed 0.388
YG107 Dark 126 89 27 Semi-Winter 7S 6S SC Oilseed 0.312
YG108 Dark 96 86 24 Semi-Winter 0 0 SI Oilseed 0.266
YG109 Mixed 110 82 20 Semi-Winter 0 0 SI Oilseed 0.337
YG110 Dark 93 88 26 Semi-Winter 9S 8S SC Leafy 0.348
YG111 Dark 158 111 39 Semi-Winter 0 2S SI Leafy 0.313
YG112 Dark 105 92 22 Semi-Winter 6S 5S SC Oilseed 0.314
YG113 Dark 98 93 23 Semi-Winter 9S 2S SC Oilseed 0.357
YG114 Dark 68 90 20 Spring 0 4S SC Oilseed 0.216
YG115 Dark >165 102 32 Winter / 0 SI Oilseed 0.019
YG116 Dark 56 92 22 Spring 0 0 SI Oilseed 0.351
YG117 Dark 101 102 32 Semi-Winter 10L 8L SC Oilseed 0.352
YG118 Dark 91 91 21 Semi-Winter 0 0 SI Oilseed 0.146
YG119 Dark >165 93 23 Winter / 0 SI Rooty 0.347
YG120 Dark >165 97 27 Winter / 5S SC Rooty 0.314
YG121 Dark 95 94 24 Semi-Winter 6S 3S SC Oilseed 0.223
YG122 Dark 62 91 21 Spring 2S 0 SI Oilseed 0.205
YG123 Dark 71 96 26 Spring 10S 0 SC Oilseed 0.162
YG124 Dark 95 90 20 Semi-Winter 2S 0 SI Leafy 0.34
YG125 Dark >165 98 28 Winter / 5S SC Oilseed 0.434
YG126 Dark 90 92 22 Spring 0 0 SI Oilseed 0.128
YG127 Dark 80 89 19 Spring 1S 0 SI Rooty 0.368
YG128 Dark >165 103 33 Winter / 0 SI Oilseed 0.321
YG129 Dark 119 95 25 Semi-Winter 0 0 SI Oilseed 0.249
YG130 Dark >165 97 27 Winter / 10S SC Oilseed 0.424
YG131 Dark 116 102 32 Semi-Winter 6M 8M SC Oilseed 0.328
YG132 Mixed 77 91 22 Spring 8M 2L SC Oilseed 0.194

195
YG133 Mixed 76 86 17 Spring 9S 10S SC Oilseed 0.348
YG134 Dark 91 90 21 Semi-Winter 8M 12M SC Oilseed 0.272
YG135 Dark 96 91 22 Semi-Winter 6L 5L SC Oilseed 0.355
YG136 Mixed 82 91 22 Spring 0 0 SI Leafy 0.308
YG137 Yellow 77 86 17 Spring 6S 12S SC Oilseed 0.306
YG138 Yellow 94 91 22 Semi-Winter 1S 1S SI Oilseed 0.29
YG139 Dark 103 92 23 Semi-Winter 0 0 SI Leafy 0.021
YG140 Dark 68 86 17 Spring 4M 6M SC Leafy 0.211
YG141 Dark 61 87 18 Spring 0 0 SI Leafy 0.301
YG142 Mixed 62 89 20 Spring 3S 3M SC Leafy 0.211
YG143 Mixed 69 87 18 Spring 10S 7M SC Leafy 0.342
YG144 Dark 109 90 21 Semi-Winter 4M 9L SC Leafy 0.269
YG145 Dark 78 89 20 Spring 0 / SC Leafy 0.306
YG146 Mixed 121 100 31 Semi-Winter 6S 5S SC Leafy 0.279
YG147 Dark 93 91 22 Semi-Winter 5M 8M SC Leafy 0.234
YG148 Dark 92 92 23 Semi-Winter 0 0 SI Leafy 0.242
YG149 Dark 89 89 20 Spring 0 0 SI Leafy 0.133
YG150 Dark 82 90 21 Spring 0 0 SI Leafy 0.317
YG151 Dark 91 91 22 Semi-Winter 6M 7M SC Leafy 0.236
YG152 Dark 91 90 21 Semi-Winter 0 0 SI Leafy 0.244
YG153 Dark 86 94 25 Spring 9S 7S SC Leafy 0.266
YG154 Dark 47 84 15 Spring 6S 8S SC Leafy 0.301
YG155 Dark 71 88 19 Spring 4M 10M SC Leafy 0.261
YG156 Dark 66 87 18 Spring 5M 2M SC Leafy 0.263
YG157 Dark 79 92 23 Spring 6S 4S SC Leafy 0.257
YG158 Dark 100 90 21 Semi-Winter 0 0 SI Leafy 0.243
YG159 Mixed 58 93 24 Spring 4S 5M SC Leafy 0.052
YG160 Mixed 65 85 16 Spring 5M 9M SC Oilseed 0.215
YG161 Dark 96 92 23 Semi-Winter 0 0 SI Leafy 0.25
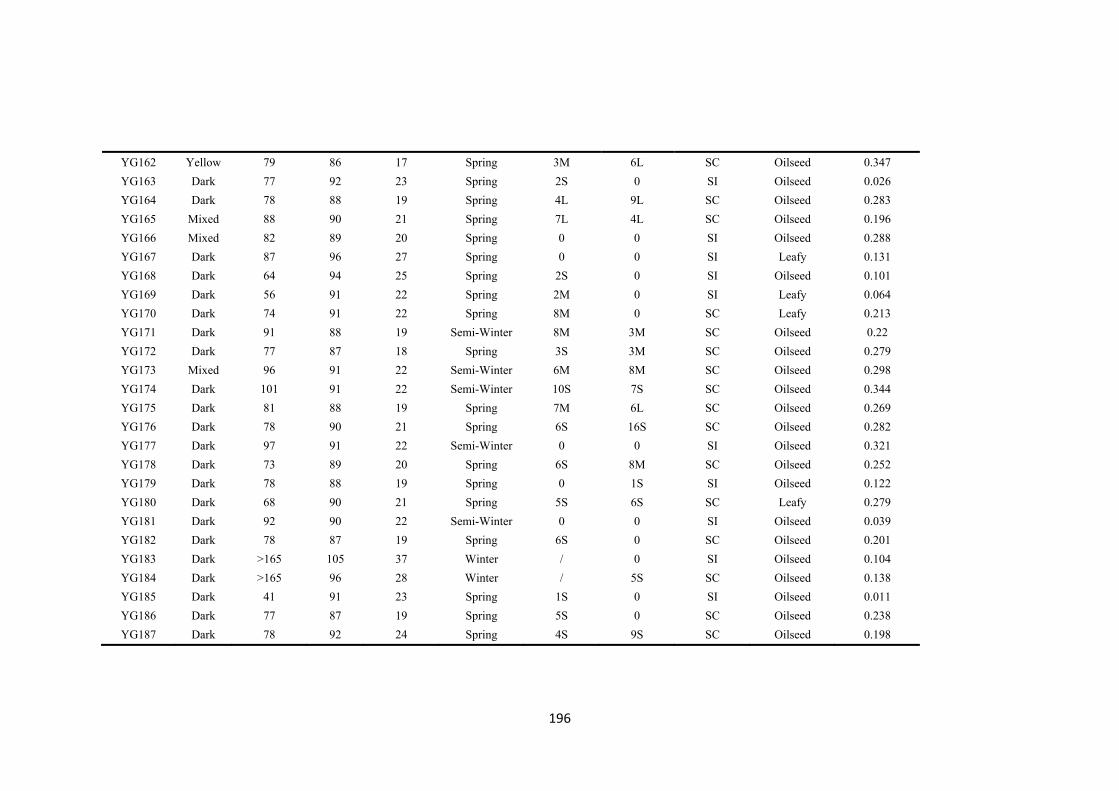
196
YG162 Yellow 79 86 17 Spring 3M 6L SC Oilseed 0.347
YG163 Dark 77 92 23 Spring 2S 0 SI Oilseed 0.026
YG164 Dark 78 88 19 Spring 4L 9L SC Oilseed 0.283
YG165 Mixed 88 90 21 Spring 7L 4L SC Oilseed 0.196
YG166 Mixed 82 89 20 Spring 0 0 SI Oilseed 0.288
YG167 Dark 87 96 27 Spring 0 0 SI Leafy 0.131
YG168 Dark 64 94 25 Spring 2S 0 SI Oilseed 0.101
YG169 Dark 56 91 22 Spring 2M 0 SI Leafy 0.064
YG170 Dark 74 91 22 Spring 8M 0 SC Leafy 0.213
YG171 Dark 91 88 19 Semi-Winter 8M 3M SC Oilseed 0.22
YG172 Dark 77 87 18 Spring 3S 3M SC Oilseed 0.279
YG173 Mixed 96 91 22 Semi-Winter 6M 8M SC Oilseed 0.298
YG174 Dark 101 91 22 Semi-Winter 10S 7S SC Oilseed 0.344
YG175 Dark 81 88 19 Spring 7M 6L SC Oilseed 0.269
YG176 Dark 78 90 21 Spring 6S 16S SC Oilseed 0.282
YG177 Dark 97 91 22 Semi-Winter 0 0 SI Oilseed 0.321
YG178 Dark 73 89 20 Spring 6S 8M SC Oilseed 0.252
YG179 Dark 78 88 19 Spring 0 1S SI Oilseed 0.122
YG180 Dark 68 90 21 Spring 5S 6S SC Leafy 0.279
YG181 Dark 92 90 22 Semi-Winter 0 0 SI Oilseed 0.039
YG182 Dark 78 87 19 Spring 6S 0 SC Oilseed 0.201
YG183 Dark >165 105 37 Winter / 0 SI Oilseed 0.104
YG184 Dark >165 96 28 Winter / 5S SC Oilseed 0.138
YG185 Dark 41 91 23 Spring 1S 0 SI Oilseed 0.011
YG186 Dark 77 87 19 Spring 5S 0 SC Oilseed 0.238
YG187 Dark 78 92 24 Spring 4S 9S SC Oilseed 0.198
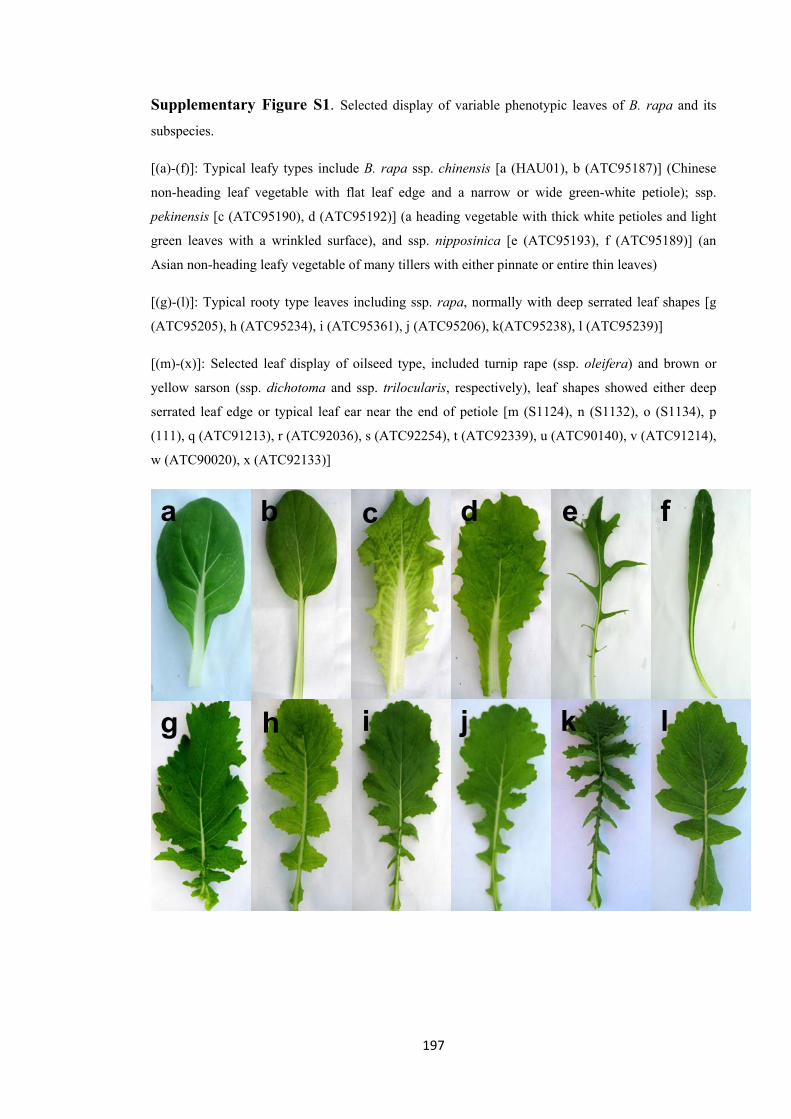
197
Supplementary Figure S1. Selected display of variable phenotypic leaves of B. rapa and its
subspecies.
[(a)-(f)]: Typical leafy types include B. rapa ssp. chinensis [a (HAU01), b (ATC95187)] (Chinese
non-heading leaf vegetable with flat leaf edge and a narrow or wide green-white petiole); ssp.
pekinensis [c (ATC95190), d (ATC95192)] (a heading vegetable with thick white petioles and light
green leaves with a wrinkled surface), and ssp. nipposinica [e (ATC95193), f (ATC95189)] (an
Asian non-heading leafy vegetable of many tillers with either pinnate or entire thin leaves)
[(g)-(l)]: Typical rooty type leaves including ssp. rapa, normally with deep serrated leaf shapes [g
(ATC95205), h (ATC95234), i (ATC95361), j (ATC95206), k(ATC95238), l (ATC95239)]
[(m)-(x)]: Selected leaf display of oilseed type, included turnip rape (ssp. oleifera) and brown or
yellow sarson (ssp. dichotoma and ssp. trilocularis, respectively), leaf shapes showed either deep
serrated leaf edge or typical leaf ear near the end of petiole [m (S1124), n (S1132), o (S1134), p
(111), q (ATC91213), r (ATC92036), s (ATC92254), t (ATC92339), u (ATC90140), v (ATC91214),
w (ATC90020), x (ATC92133)]
a b c d e f
g h i j k l
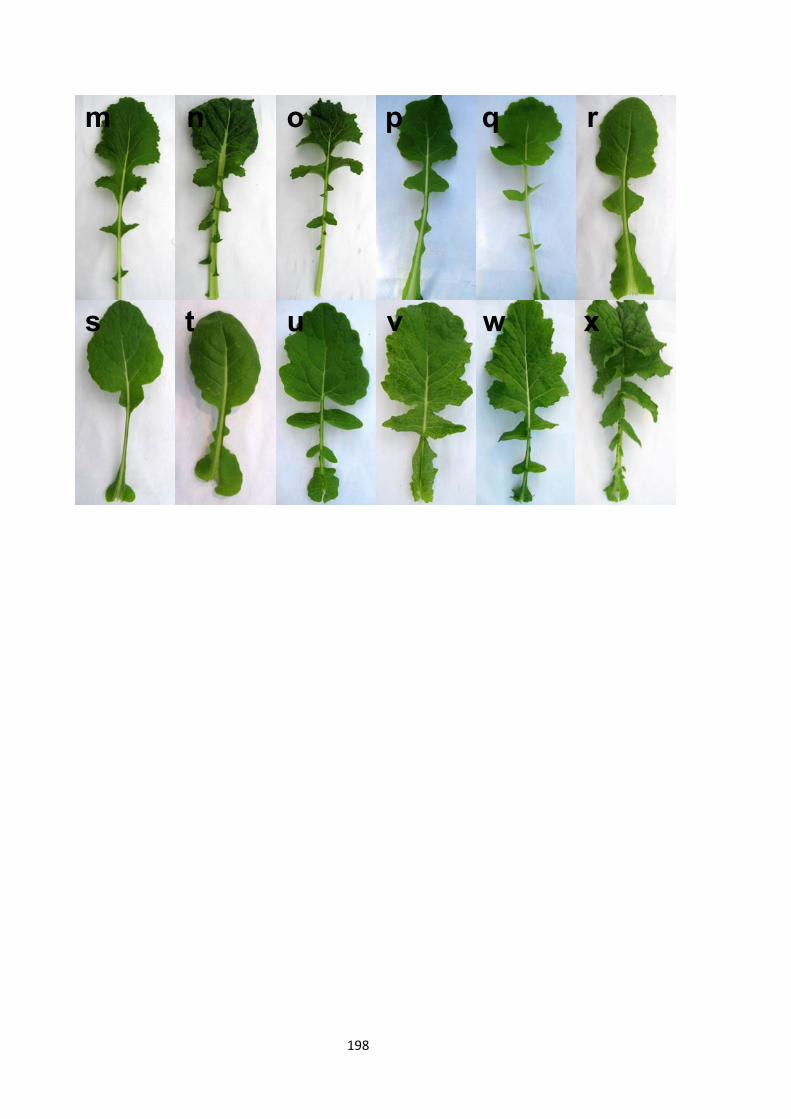
198
s
m n o p q r
t u v w x

199
Supplementary Figure S2. Changes with soil water content in the leaf-to-air (●) and floral bud-
to-air (○) temperature differences in ten Brassica accessions in the water stressed treatment when
water was withheld for 13 days. (a) – (j) represent accessions, SC-1 to SC-5 and, PI-1 to PI-5. Leaf
and bud temperatures began to increase significantly after SWC dropped to threshold SWC
(Supplementary Table S3) and were indicated by arrows. Each mean is accompanied by a bar
representing the mean ± s.e. (n=4) when larger than the symbol.

200
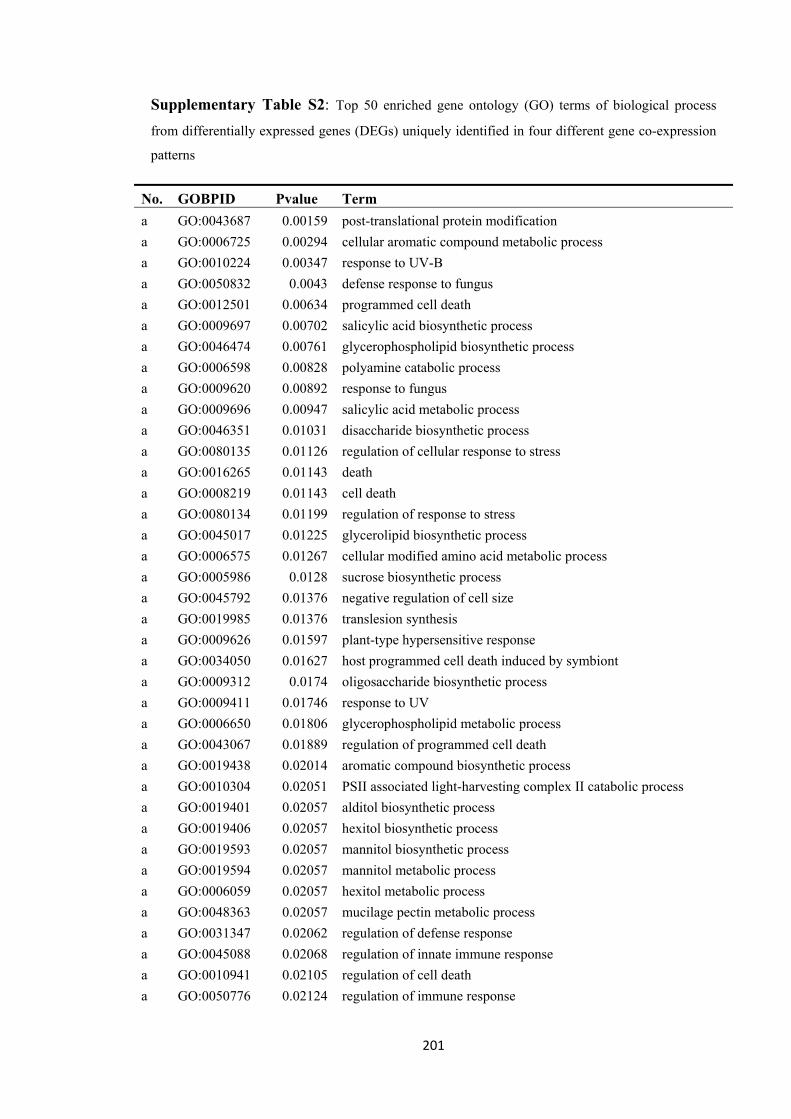
201
Supplementary Table S2: Top 50 enriched gene ontology (GO) terms of biological process
from differentially expressed genes (DEGs) uniquely identified in four different gene co-expression
patterns
No. GOBPID Pvalue Term a GO:0043687 0.00159 post-translational protein modification
a GO:0006725 0.00294 cellular aromatic compound metabolic process
a GO:0010224 0.00347 response to UV-B
a GO:0050832 0.0043 defense response to fungus
a GO:0012501 0.00634 programmed cell death
a GO:0009697 0.00702 salicylic acid biosynthetic process
a GO:0046474 0.00761 glycerophospholipid biosynthetic process
a GO:0006598 0.00828 polyamine catabolic process
a GO:0009620 0.00892 response to fungus
a GO:0009696 0.00947 salicylic acid metabolic process
a GO:0046351 0.01031 disaccharide biosynthetic process
a GO:0080135 0.01126 regulation of cellular response to stress
a GO:0016265 0.01143 death
a GO:0008219 0.01143 cell death
a GO:0080134 0.01199 regulation of response to stress
a GO:0045017 0.01225 glycerolipid biosynthetic process
a GO:0006575 0.01267 cellular modified amino acid metabolic process
a GO:0005986 0.0128 sucrose biosynthetic process
a GO:0045792 0.01376 negative regulation of cell size
a GO:0019985 0.01376 translesion synthesis
a GO:0009626 0.01597 plant-type hypersensitive response
a GO:0034050 0.01627 host programmed cell death induced by symbiont
a GO:0009312 0.0174 oligosaccharide biosynthetic process
a GO:0009411 0.01746 response to UV
a GO:0006650 0.01806 glycerophospholipid metabolic process
a GO:0043067 0.01889 regulation of programmed cell death
a GO:0019438 0.02014 aromatic compound biosynthetic process
a GO:0010304 0.02051 PSII associated light-harvesting complex II catabolic process
a GO:0019401 0.02057 alditol biosynthetic process
a GO:0019406 0.02057 hexitol biosynthetic process
a GO:0019593 0.02057 mannitol biosynthetic process
a GO:0019594 0.02057 mannitol metabolic process
a GO:0006059 0.02057 hexitol metabolic process
a GO:0048363 0.02057 mucilage pectin metabolic process
a GO:0031347 0.02062 regulation of defense response
a GO:0045088 0.02068 regulation of innate immune response
a GO:0010941 0.02105 regulation of cell death
a GO:0050776 0.02124 regulation of immune response
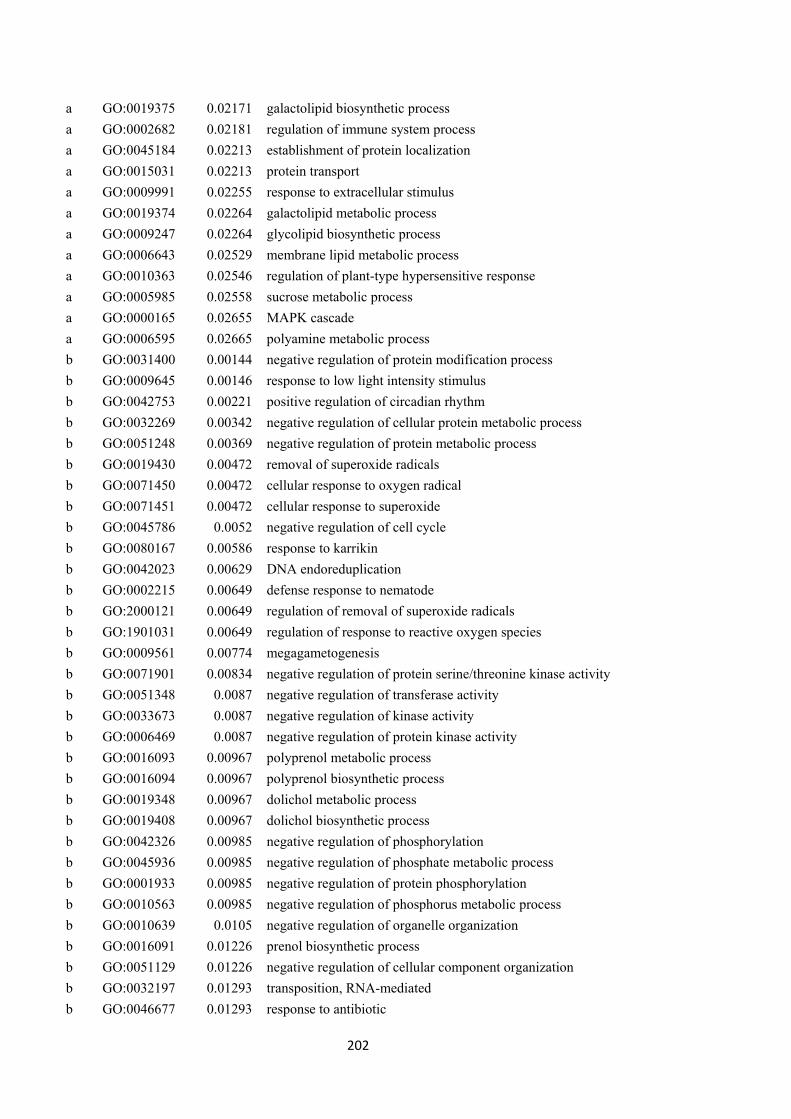
202
a GO:0019375 0.02171 galactolipid biosynthetic process
a GO:0002682 0.02181 regulation of immune system process
a GO:0045184 0.02213 establishment of protein localization
a GO:0015031 0.02213 protein transport
a GO:0009991 0.02255 response to extracellular stimulus
a GO:0019374 0.02264 galactolipid metabolic process
a GO:0009247 0.02264 glycolipid biosynthetic process
a GO:0006643 0.02529 membrane lipid metabolic process
a GO:0010363 0.02546 regulation of plant-type hypersensitive response
a GO:0005985 0.02558 sucrose metabolic process
a GO:0000165 0.02655 MAPK cascade
a GO:0006595 0.02665 polyamine metabolic process
b GO:0031400 0.00144 negative regulation of protein modification process
b GO:0009645 0.00146 response to low light intensity stimulus
b GO:0042753 0.00221 positive regulation of circadian rhythm
b GO:0032269 0.00342 negative regulation of cellular protein metabolic process
b GO:0051248 0.00369 negative regulation of protein metabolic process
b GO:0019430 0.00472 removal of superoxide radicals
b GO:0071450 0.00472 cellular response to oxygen radical
b GO:0071451 0.00472 cellular response to superoxide
b GO:0045786 0.0052 negative regulation of cell cycle
b GO:0080167 0.00586 response to karrikin
b GO:0042023 0.00629 DNA endoreduplication
b GO:0002215 0.00649 defense response to nematode
b GO:2000121 0.00649 regulation of removal of superoxide radicals
b GO:1901031 0.00649 regulation of response to reactive oxygen species
b GO:0009561 0.00774 megagametogenesis
b GO:0071901 0.00834 negative regulation of protein serine/threonine kinase activity
b GO:0051348 0.0087 negative regulation of transferase activity
b GO:0033673 0.0087 negative regulation of kinase activity
b GO:0006469 0.0087 negative regulation of protein kinase activity
b GO:0016093 0.00967 polyprenol metabolic process
b GO:0016094 0.00967 polyprenol biosynthetic process
b GO:0019348 0.00967 dolichol metabolic process
b GO:0019408 0.00967 dolichol biosynthetic process
b GO:0042326 0.00985 negative regulation of phosphorylation
b GO:0045936 0.00985 negative regulation of phosphate metabolic process
b GO:0001933 0.00985 negative regulation of protein phosphorylation
b GO:0010563 0.00985 negative regulation of phosphorus metabolic process
b GO:0010639 0.0105 negative regulation of organelle organization
b GO:0016091 0.01226 prenol biosynthetic process
b GO:0051129 0.01226 negative regulation of cellular component organization
b GO:0032197 0.01293 transposition, RNA-mediated
b GO:0046677 0.01293 response to antibiotic
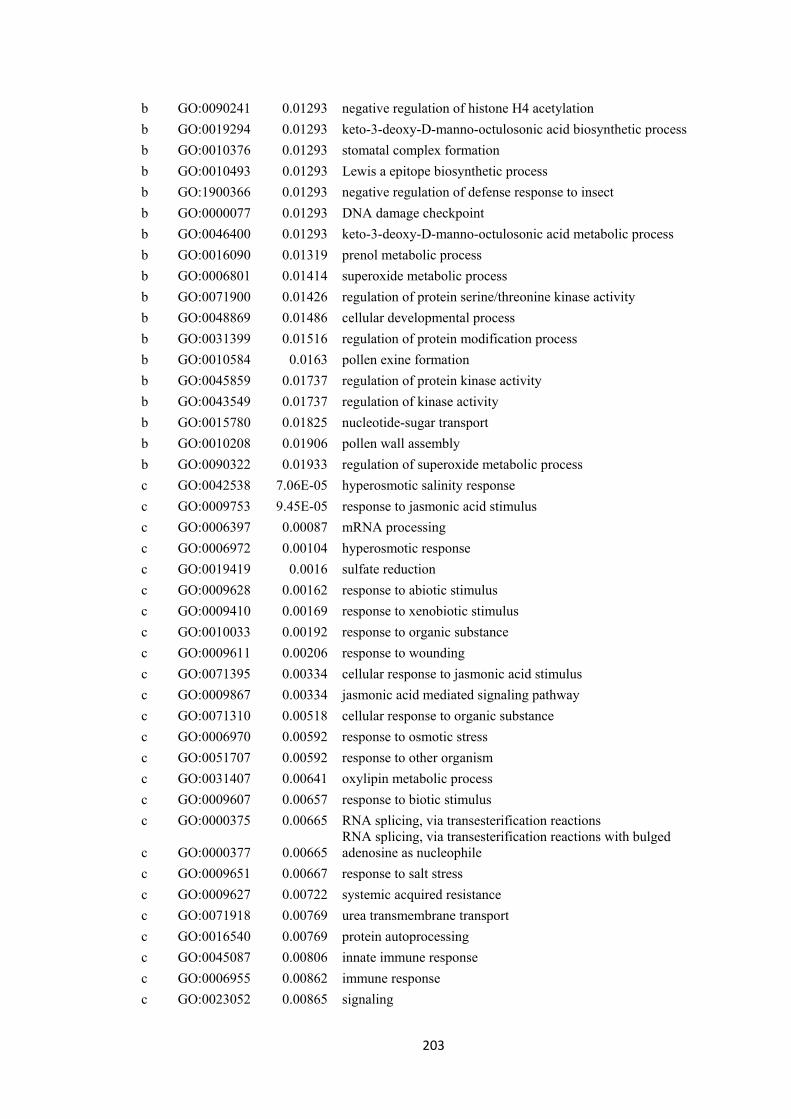
203
b GO:0090241 0.01293 negative regulation of histone H4 acetylation
b GO:0019294 0.01293 keto-3-deoxy-D-manno-octulosonic acid biosynthetic process
b GO:0010376 0.01293 stomatal complex formation
b GO:0010493 0.01293 Lewis a epitope biosynthetic process
b GO:1900366 0.01293 negative regulation of defense response to insect
b GO:0000077 0.01293 DNA damage checkpoint
b GO:0046400 0.01293 keto-3-deoxy-D-manno-octulosonic acid metabolic process
b GO:0016090 0.01319 prenol metabolic process
b GO:0006801 0.01414 superoxide metabolic process
b GO:0071900 0.01426 regulation of protein serine/threonine kinase activity
b GO:0048869 0.01486 cellular developmental process
b GO:0031399 0.01516 regulation of protein modification process
b GO:0010584 0.0163 pollen exine formation
b GO:0045859 0.01737 regulation of protein kinase activity
b GO:0043549 0.01737 regulation of kinase activity
b GO:0015780 0.01825 nucleotide-sugar transport
b GO:0010208 0.01906 pollen wall assembly
b GO:0090322 0.01933 regulation of superoxide metabolic process
c GO:0042538 7.06E-05 hyperosmotic salinity response
c GO:0009753 9.45E-05 response to jasmonic acid stimulus
c GO:0006397 0.00087 mRNA processing
c GO:0006972 0.00104 hyperosmotic response
c GO:0019419 0.0016 sulfate reduction
c GO:0009628 0.00162 response to abiotic stimulus
c GO:0009410 0.00169 response to xenobiotic stimulus
c GO:0010033 0.00192 response to organic substance
c GO:0009611 0.00206 response to wounding
c GO:0071395 0.00334 cellular response to jasmonic acid stimulus
c GO:0009867 0.00334 jasmonic acid mediated signaling pathway
c GO:0071310 0.00518 cellular response to organic substance
c GO:0006970 0.00592 response to osmotic stress
c GO:0051707 0.00592 response to other organism
c GO:0031407 0.00641 oxylipin metabolic process
c GO:0009607 0.00657 response to biotic stimulus
c GO:0000375 0.00665 RNA splicing, via transesterification reactions
c GO:0000377 0.00665 RNA splicing, via transesterification reactions with bulged adenosine as nucleophile
c GO:0009651 0.00667 response to salt stress
c GO:0009627 0.00722 systemic acquired resistance
c GO:0071918 0.00769 urea transmembrane transport
c GO:0016540 0.00769 protein autoprocessing
c GO:0045087 0.00806 innate immune response
c GO:0006955 0.00862 immune response
c GO:0023052 0.00865 signaling

204
c GO:0009615 0.00906 response to virus
c GO:0031408 0.00961 oxylipin biosynthetic process
c GO:0016070 0.01092 RNA metabolic process
c GO:0043412 0.0114 macromolecule modification
c GO:0009725 0.01143 response to hormone stimulus
c GO:0006952 0.01157 defense response
c GO:0016071 0.01188 mRNA metabolic process
c GO:0002376 0.01212 immune system process
c GO:0009719 0.01222 response to endogenous stimulus
c GO:0009814 0.01235 defense response, incompatible interaction
c GO:0044260 0.01281 cellular macromolecule metabolic process
c GO:0042221 0.01321 response to chemical stimulus
c GO:0043455 0.01421 regulation of secondary metabolic process
c GO:0034976 0.01433 response to endoplasmic reticulum stress
c GO:0006464 0.01444 cellular protein modification process
c GO:0036211 0.01444 protein modification process
c GO:0043687 0.0147 post-translational protein modification
c GO:0070887 0.01499 cellular response to chemical stimulus
c GO:0009639 0.0153 response to red or far red light
c GO:0035279 0.01532 mRNA cleavage involved in gene silencing by miRNA
c GO:0031328 0.01571 positive regulation of cellular biosynthetic process
c GO:0009891 0.01571 positive regulation of biosynthetic process
c GO:0006950 0.01622 response to stress
c GO:0007165 0.01673 signal transduction
c GO:0000103 0.01693 sulfate assimilation
d GO:0009627 2.50E-05 systemic acquired resistance
d GO:0009753 3.72E-05 response to jasmonic acid stimulus
d GO:0030522 0.00013 intracellular receptor signaling pathway
d GO:0009785 0.00013 blue light signaling pathway
d GO:0002376 0.00013 immune system process
d GO:0071483 0.00023 cellular response to blue light
d GO:0010941 0.00023 regulation of cell death
d GO:0034976 0.00028 response to endoplasmic reticulum stress
d GO:0009150 0.00032 purine ribonucleotide metabolic process
d GO:0009814 0.00032 defense response, incompatible interaction
d GO:0050896 0.00035 response to stimulus
d GO:0010363 0.00048 regulation of plant-type hypersensitive response
d GO:0070727 0.00053 cellular macromolecule localization
d GO:0043067 0.00053 regulation of programmed cell death
d GO:0045087 0.00056 innate immune response
d GO:0006952 0.00059 defense response
d GO:0006955 0.00061 immune response
d GO:0080135 0.00061 regulation of cellular response to stress
d GO:0051707 0.00065 response to other organism

205
d GO:0016265 0.00068 death
d GO:0008219 0.00068 cell death
d GO:0034613 0.0007 cellular protein localization
d GO:0006612 0.00073 protein targeting to membrane
d GO:0010033 0.00075 response to organic substance
d GO:0009607 0.00076 response to biotic stimulus
d GO:0046700 0.00092 heterocycle catabolic process
d GO:0044270 0.00093 cellular nitrogen compound catabolic process
d GO:0006950 0.00104 response to stress
d GO:0006886 0.00104 intracellular protein transport
d GO:0033554 0.00105 cellular response to stress
d GO:0009626 0.00109 plant-type hypersensitive response
d GO:0034050 0.00113 host programmed cell death induced by symbiont
d GO:0006163 0.00146 purine nucleotide metabolic process
d GO:0010244 0.00148 response to low fluence blue light stimulus by blue low-fluence system
d GO:0045184 0.00158 establishment of protein localization
d GO:0015031 0.00158 protein transport
d GO:0045088 0.00168 regulation of innate immune response
d GO:0008104 0.00171 protein localization
d GO:0050776 0.00175 regulation of immune response
d GO:0002682 0.00183 regulation of immune system process
d GO:0012501 0.00184 programmed cell death
d GO:0007165 0.00199 signal transduction
d GO:0071258 0.00206 cellular response to gravity
d GO:0009144 0.0021 purine nucleoside triphosphate metabolic process
d GO:0009205 0.0021 purine ribonucleoside triphosphate metabolic process
d GO:0009199 0.0022 ribonucleoside triphosphate metabolic process
d GO:0042221 0.00233 response to chemical stimulus
d GO:0009738 0.00234 abscisic acid mediated signaling pathway
d GO:0009141 0.00235 nucleoside triphosphate metabolic process
d GO:0044281 0.00235 small molecule metabolic process

206
Supplementary Table S3: Top 50 enriched gene ontology (GO) terms of biological process
from differentially expressed genes (DEGs) uniquely identified in drought-senstive (DS) accession
at 4h time point.
No. GOBPID P-value Term 1 GO:0010417 0.00104858 glucuronoxylan biosynthetic process
2 GO:0048511 0.0010696 rhythmic process
3 GO:0007623 0.0010696 circadian rhythm
4 GO:0031323 0.001369 regulation of cellular metabolic process
5 GO:0042023 0.0016869 DNA endoreduplication
6 GO:0042325 0.00182559 regulation of phosphorylation
7 GO:0051171 0.00262472 regulation of nitrogen compound metabolic process
8 GO:0010565 0.00274221 regulation of cellular ketone metabolic process
9 GO:0051174 0.00304169 regulation of phosphorus metabolic process
10 GO:0019220 0.00304169 regulation of phosphate metabolic process
11 GO:0009410 0.00337487 response to xenobiotic stimulus
12 GO:0006661 0.00345257 phosphatidylinositol biosynthetic process
13 GO:0009640 0.00362276 photomorphogenesis
14 GO:0006086 0.00365509 acetyl-CoA biosynthetic process from pyruvate
15 GO:0009567 0.00378992 double fertilization forming a zygote and endosperm
16 GO:0080090 0.00436447 regulation of primary metabolic process
17 GO:0043647 0.00467889 inositol phosphate metabolic process
18 GO:0009889 0.00497446 regulation of biosynthetic process
19 GO:0031326 0.00503249 regulation of cellular biosynthetic process
20 GO:2000243 0.00512276 positive regulation of reproductive process
21 GO:0019219 0.00517679 regulation of nucleobase-containing compound metabolic process
22 GO:0001932 0.00526728 regulation of protein phosphorylation
23 GO:0045876 0.00551994 positive regulation of sister chromatid cohesion
24 GO:0007063 0.00551994 regulation of sister chromatid cohesion
25 GO:0046916 0.00551994 cellular transition metal ion homeostasis
26 GO:0051983 0.00551994 regulation of chromosome segregation
27 GO:0055076 0.00551994 transition metal ion homeostasis
28 GO:2001141 0.00600125 regulation of RNA biosynthetic process
29 GO:0006355 0.00600125 regulation of transcription, DNA-dependent
30 GO:0009566 0.00605982 fertilization
31 GO:0051252 0.00622258 regulation of RNA metabolic process
32 GO:0046488 0.00626899 phosphatidylinositol metabolic process
33 GO:0006914 0.00756862 autophagy
34 GO:0031399 0.00766549 regulation of protein modification process
35 GO:0006085 0.00851664 acetyl-CoA biosynthetic process
36 GO:2000112 0.00868607 regulation of cellular macromolecule biosynthetic process
37 GO:0010556 0.00868607 regulation of macromolecule biosynthetic process
38 GO:0045859 0.00885197 regulation of protein kinase activity

207
39 GO:0043549 0.00885197 regulation of kinase activity
40 GO:0009416 0.0101959 response to light stimulus
41 GO:0042326 0.01115123 negative regulation of phosphorylation
42 GO:0045936 0.01115123 negative regulation of phosphate metabolic process
43 GO:0001933 0.01115123 negative regulation of protein phosphorylation
44 GO:0010563 0.01115123 negative regulation of phosphorus metabolic process
45 GO:0006351 0.01127667 transcription, DNA-dependent
46 GO:0043433 0.01142202 negative regulation of sequence-specific DNA binding transcription factor activity
47 GO:0032774 0.01159939 RNA biosynthetic process
48 GO:0070647 0.01170401 protein modification by small protein conjugation or removal
49 GO:0042593 0.01261231 glucose homeostasis
50 GO:0048573 0.01322932 photoperiodism, flowering
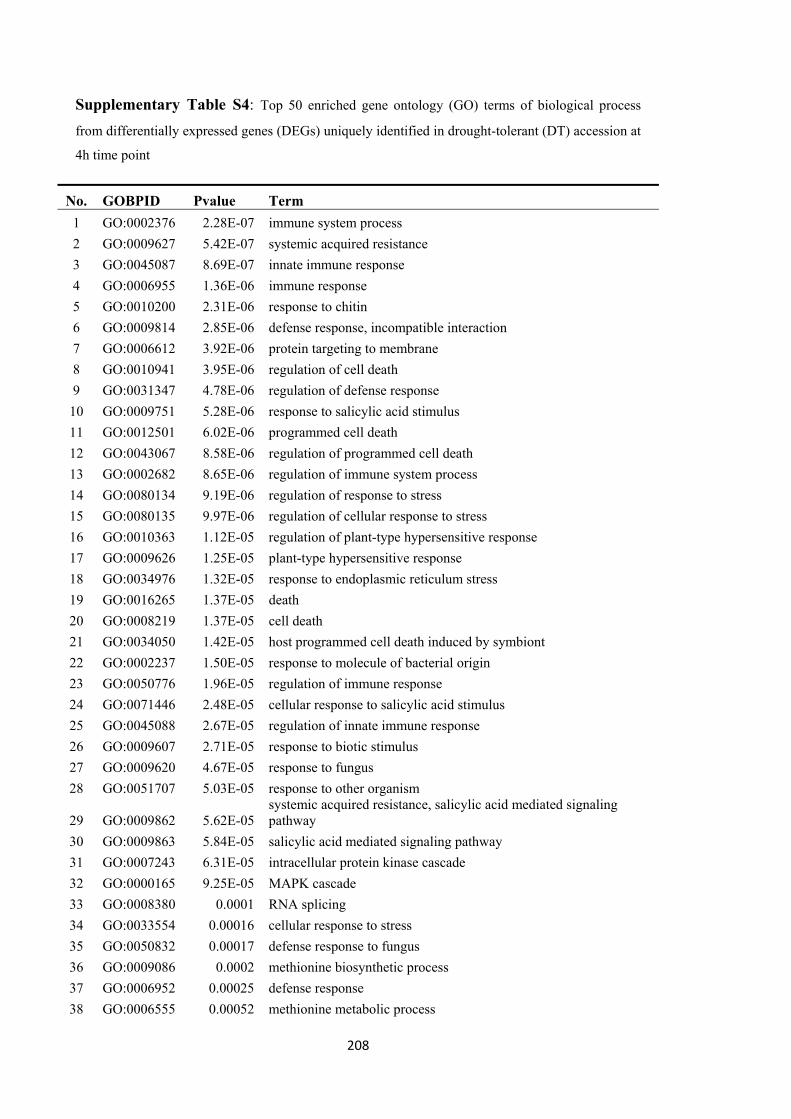
208
Supplementary Table S4: Top 50 enriched gene ontology (GO) terms of biological process
from differentially expressed genes (DEGs) uniquely identified in drought-tolerant (DT) accession at
4h time point
No. GOBPID Pvalue Term 1 GO:0002376 2.28E-07 immune system process
2 GO:0009627 5.42E-07 systemic acquired resistance
3 GO:0045087 8.69E-07 innate immune response
4 GO:0006955 1.36E-06 immune response
5 GO:0010200 2.31E-06 response to chitin
6 GO:0009814 2.85E-06 defense response, incompatible interaction
7 GO:0006612 3.92E-06 protein targeting to membrane
8 GO:0010941 3.95E-06 regulation of cell death
9 GO:0031347 4.78E-06 regulation of defense response
10 GO:0009751 5.28E-06 response to salicylic acid stimulus
11 GO:0012501 6.02E-06 programmed cell death
12 GO:0043067 8.58E-06 regulation of programmed cell death
13 GO:0002682 8.65E-06 regulation of immune system process
14 GO:0080134 9.19E-06 regulation of response to stress
15 GO:0080135 9.97E-06 regulation of cellular response to stress
16 GO:0010363 1.12E-05 regulation of plant-type hypersensitive response
17 GO:0009626 1.25E-05 plant-type hypersensitive response
18 GO:0034976 1.32E-05 response to endoplasmic reticulum stress
19 GO:0016265 1.37E-05 death
20 GO:0008219 1.37E-05 cell death
21 GO:0034050 1.42E-05 host programmed cell death induced by symbiont
22 GO:0002237 1.50E-05 response to molecule of bacterial origin
23 GO:0050776 1.96E-05 regulation of immune response
24 GO:0071446 2.48E-05 cellular response to salicylic acid stimulus
25 GO:0045088 2.67E-05 regulation of innate immune response
26 GO:0009607 2.71E-05 response to biotic stimulus
27 GO:0009620 4.67E-05 response to fungus
28 GO:0051707 5.03E-05 response to other organism
29 GO:0009862 5.62E-05 systemic acquired resistance, salicylic acid mediated signaling pathway
30 GO:0009863 5.84E-05 salicylic acid mediated signaling pathway
31 GO:0007243 6.31E-05 intracellular protein kinase cascade
32 GO:0000165 9.25E-05 MAPK cascade
33 GO:0008380 0.0001 RNA splicing
34 GO:0033554 0.00016 cellular response to stress
35 GO:0050832 0.00017 defense response to fungus
36 GO:0009086 0.0002 methionine biosynthetic process
37 GO:0006952 0.00025 defense response
38 GO:0006555 0.00052 methionine metabolic process
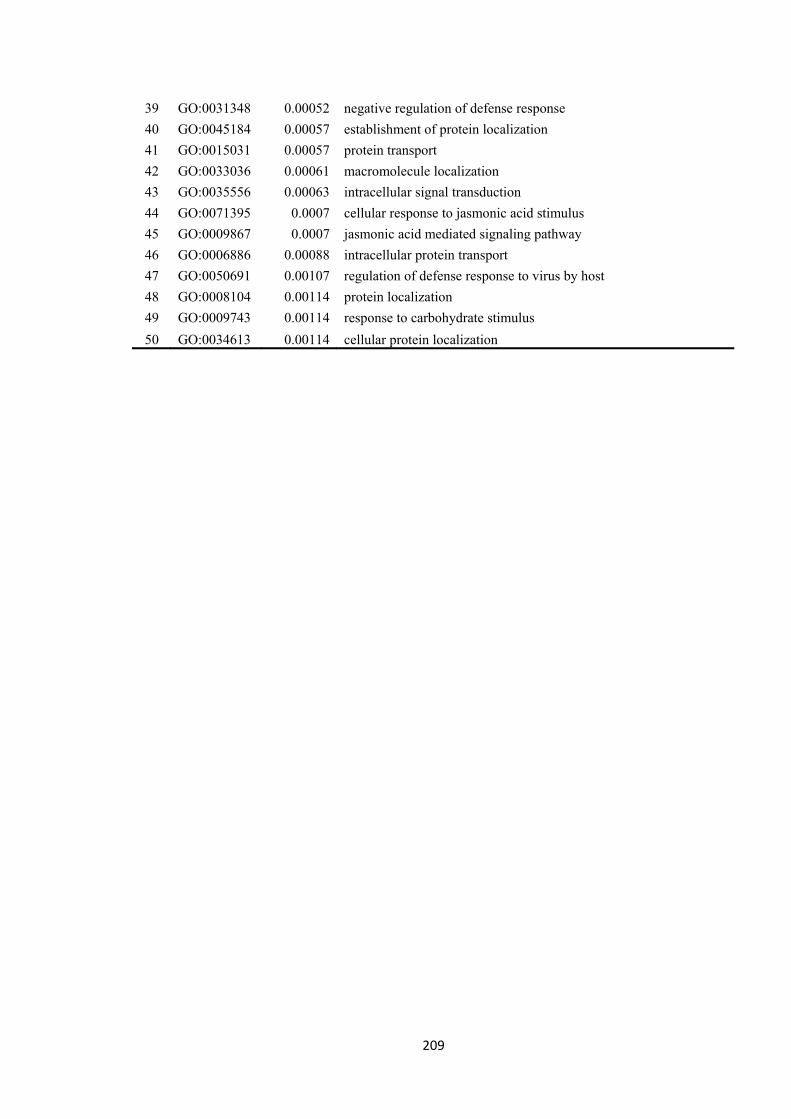
209
39 GO:0031348 0.00052 negative regulation of defense response
40 GO:0045184 0.00057 establishment of protein localization
41 GO:0015031 0.00057 protein transport
42 GO:0033036 0.00061 macromolecule localization
43 GO:0035556 0.00063 intracellular signal transduction
44 GO:0071395 0.0007 cellular response to jasmonic acid stimulus
45 GO:0009867 0.0007 jasmonic acid mediated signaling pathway
46 GO:0006886 0.00088 intracellular protein transport
47 GO:0050691 0.00107 regulation of defense response to virus by host
48 GO:0008104 0.00114 protein localization
49 GO:0009743 0.00114 response to carbohydrate stimulus
50 GO:0034613 0.00114 cellular protein localization
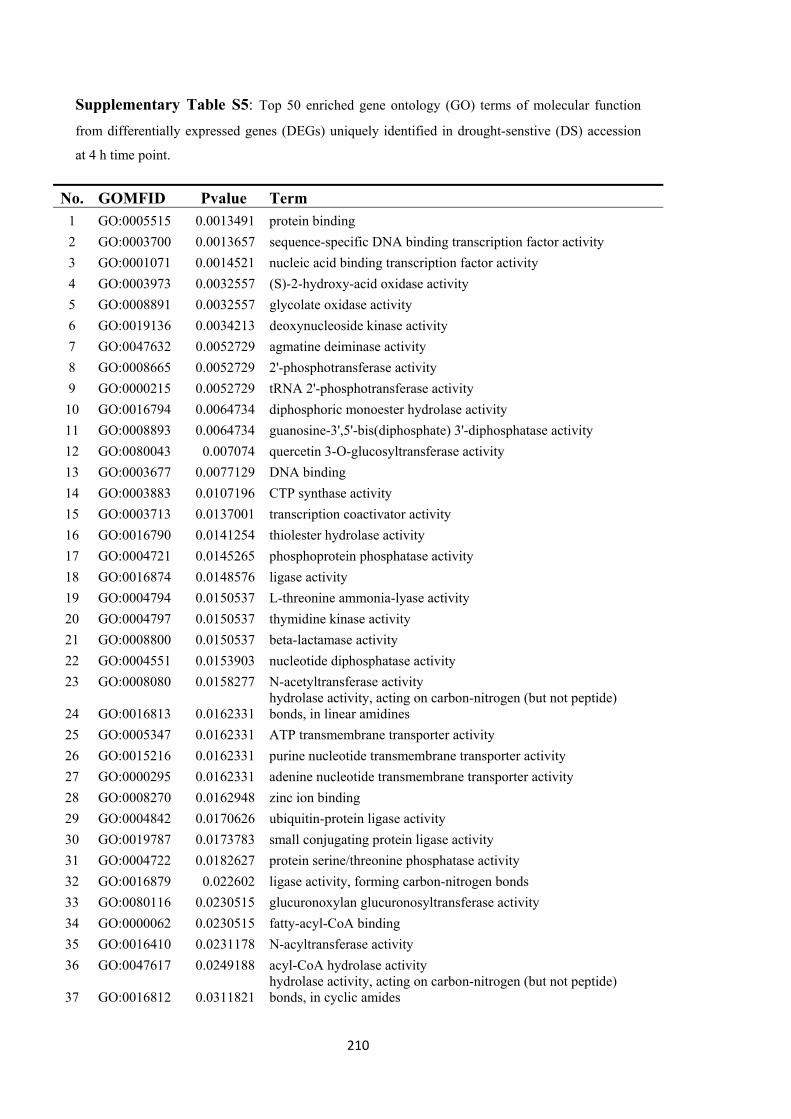
210
Supplementary Table S5: Top 50 enriched gene ontology (GO) terms of molecular function
from differentially expressed genes (DEGs) uniquely identified in drought-senstive (DS) accession
at 4 h time point.
No. GOMFID Pvalue Term 1 GO:0005515 0.0013491 protein binding
2 GO:0003700 0.0013657 sequence-specific DNA binding transcription factor activity
3 GO:0001071 0.0014521 nucleic acid binding transcription factor activity
4 GO:0003973 0.0032557 (S)-2-hydroxy-acid oxidase activity
5 GO:0008891 0.0032557 glycolate oxidase activity
6 GO:0019136 0.0034213 deoxynucleoside kinase activity
7 GO:0047632 0.0052729 agmatine deiminase activity
8 GO:0008665 0.0052729 2'-phosphotransferase activity
9 GO:0000215 0.0052729 tRNA 2'-phosphotransferase activity
10 GO:0016794 0.0064734 diphosphoric monoester hydrolase activity
11 GO:0008893 0.0064734 guanosine-3',5'-bis(diphosphate) 3'-diphosphatase activity
12 GO:0080043 0.007074 quercetin 3-O-glucosyltransferase activity
13 GO:0003677 0.0077129 DNA binding
14 GO:0003883 0.0107196 CTP synthase activity
15 GO:0003713 0.0137001 transcription coactivator activity
16 GO:0016790 0.0141254 thiolester hydrolase activity
17 GO:0004721 0.0145265 phosphoprotein phosphatase activity
18 GO:0016874 0.0148576 ligase activity
19 GO:0004794 0.0150537 L-threonine ammonia-lyase activity
20 GO:0004797 0.0150537 thymidine kinase activity
21 GO:0008800 0.0150537 beta-lactamase activity
22 GO:0004551 0.0153903 nucleotide diphosphatase activity
23 GO:0008080 0.0158277 N-acetyltransferase activity
24 GO:0016813 0.0162331 hydrolase activity, acting on carbon-nitrogen (but not peptide) bonds, in linear amidines
25 GO:0005347 0.0162331 ATP transmembrane transporter activity
26 GO:0015216 0.0162331 purine nucleotide transmembrane transporter activity
27 GO:0000295 0.0162331 adenine nucleotide transmembrane transporter activity
28 GO:0008270 0.0162948 zinc ion binding
29 GO:0004842 0.0170626 ubiquitin-protein ligase activity
30 GO:0019787 0.0173783 small conjugating protein ligase activity
31 GO:0004722 0.0182627 protein serine/threonine phosphatase activity
32 GO:0016879 0.022602 ligase activity, forming carbon-nitrogen bonds
33 GO:0080116 0.0230515 glucuronoxylan glucuronosyltransferase activity
34 GO:0000062 0.0230515 fatty-acyl-CoA binding
35 GO:0016410 0.0231178 N-acyltransferase activity
36 GO:0047617 0.0249188 acyl-CoA hydrolase activity
37 GO:0016812 0.0311821 hydrolase activity, acting on carbon-nitrogen (but not peptide) bonds, in cyclic amides
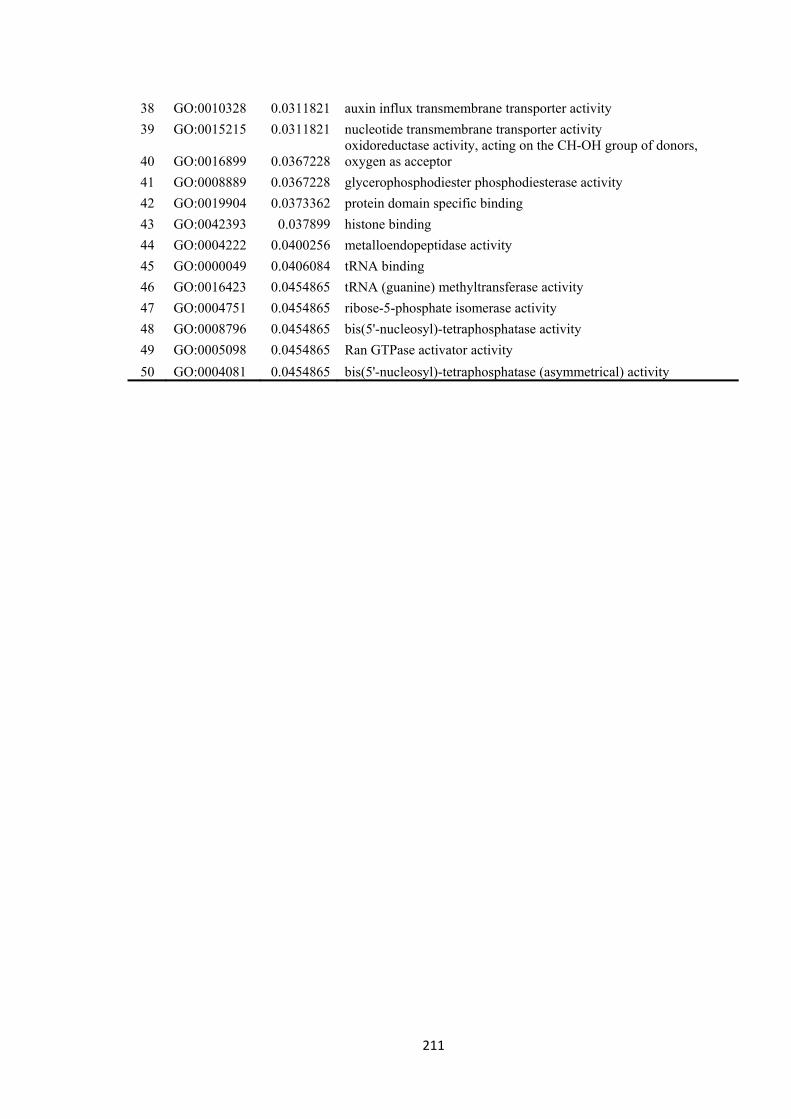
211
38 GO:0010328 0.0311821 auxin influx transmembrane transporter activity
39 GO:0015215 0.0311821 nucleotide transmembrane transporter activity
40 GO:0016899 0.0367228 oxidoreductase activity, acting on the CH-OH group of donors, oxygen as acceptor
41 GO:0008889 0.0367228 glycerophosphodiester phosphodiesterase activity
42 GO:0019904 0.0373362 protein domain specific binding
43 GO:0042393 0.037899 histone binding
44 GO:0004222 0.0400256 metalloendopeptidase activity
45 GO:0000049 0.0406084 tRNA binding
46 GO:0016423 0.0454865 tRNA (guanine) methyltransferase activity
47 GO:0004751 0.0454865 ribose-5-phosphate isomerase activity
48 GO:0008796 0.0454865 bis(5'-nucleosyl)-tetraphosphatase activity
49 GO:0005098 0.0454865 Ran GTPase activator activity
50 GO:0004081 0.0454865 bis(5'-nucleosyl)-tetraphosphatase (asymmetrical) activity
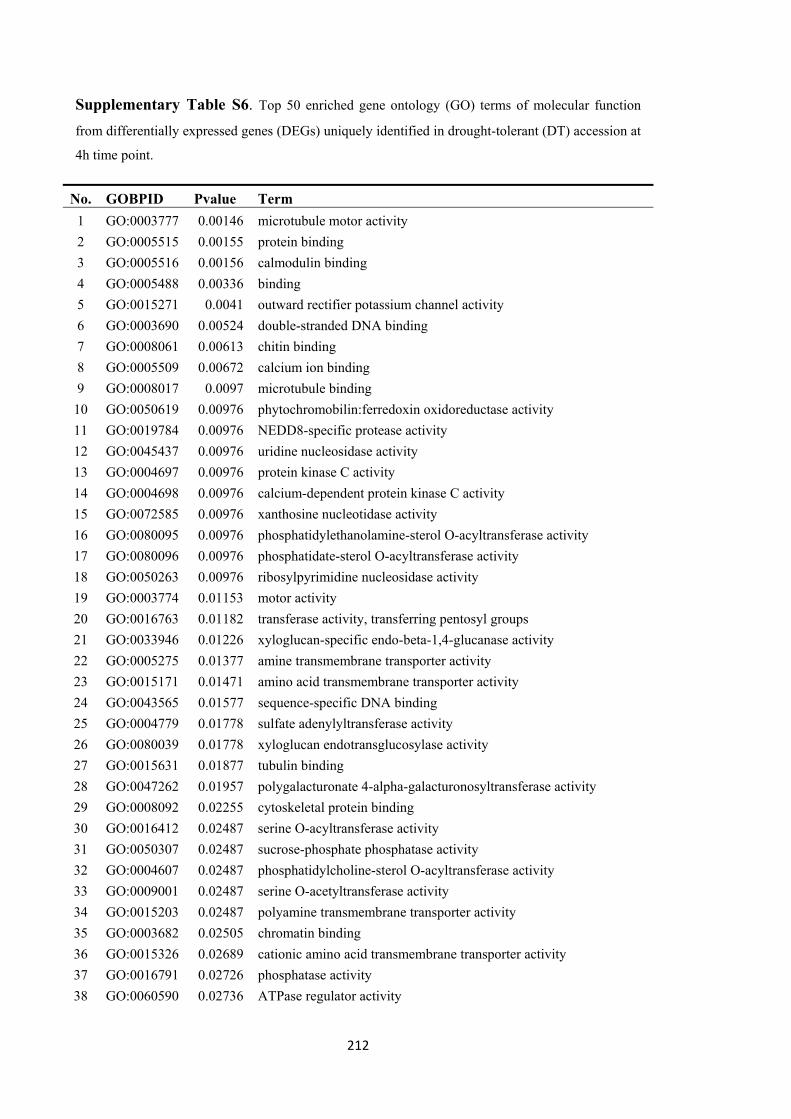
212
Supplementary Table S6. Top 50 enriched gene ontology (GO) terms of molecular function
from differentially expressed genes (DEGs) uniquely identified in drought-tolerant (DT) accession at
4h time point.
No. GOBPID Pvalue Term 1 GO:0003777 0.00146 microtubule motor activity
2 GO:0005515 0.00155 protein binding
3 GO:0005516 0.00156 calmodulin binding
4 GO:0005488 0.00336 binding
5 GO:0015271 0.0041 outward rectifier potassium channel activity
6 GO:0003690 0.00524 double-stranded DNA binding
7 GO:0008061 0.00613 chitin binding
8 GO:0005509 0.00672 calcium ion binding
9 GO:0008017 0.0097 microtubule binding
10 GO:0050619 0.00976 phytochromobilin:ferredoxin oxidoreductase activity
11 GO:0019784 0.00976 NEDD8-specific protease activity
12 GO:0045437 0.00976 uridine nucleosidase activity
13 GO:0004697 0.00976 protein kinase C activity
14 GO:0004698 0.00976 calcium-dependent protein kinase C activity
15 GO:0072585 0.00976 xanthosine nucleotidase activity
16 GO:0080095 0.00976 phosphatidylethanolamine-sterol O-acyltransferase activity
17 GO:0080096 0.00976 phosphatidate-sterol O-acyltransferase activity
18 GO:0050263 0.00976 ribosylpyrimidine nucleosidase activity
19 GO:0003774 0.01153 motor activity
20 GO:0016763 0.01182 transferase activity, transferring pentosyl groups
21 GO:0033946 0.01226 xyloglucan-specific endo-beta-1,4-glucanase activity
22 GO:0005275 0.01377 amine transmembrane transporter activity
23 GO:0015171 0.01471 amino acid transmembrane transporter activity
24 GO:0043565 0.01577 sequence-specific DNA binding
25 GO:0004779 0.01778 sulfate adenylyltransferase activity
26 GO:0080039 0.01778 xyloglucan endotransglucosylase activity
27 GO:0015631 0.01877 tubulin binding
28 GO:0047262 0.01957 polygalacturonate 4-alpha-galacturonosyltransferase activity
29 GO:0008092 0.02255 cytoskeletal protein binding
30 GO:0016412 0.02487 serine O-acyltransferase activity
31 GO:0050307 0.02487 sucrose-phosphate phosphatase activity
32 GO:0004607 0.02487 phosphatidylcholine-sterol O-acyltransferase activity
33 GO:0009001 0.02487 serine O-acetyltransferase activity
34 GO:0015203 0.02487 polyamine transmembrane transporter activity
35 GO:0003682 0.02505 chromatin binding
36 GO:0015326 0.02689 cationic amino acid transmembrane transporter activity
37 GO:0016791 0.02726 phosphatase activity
38 GO:0060590 0.02736 ATPase regulator activity
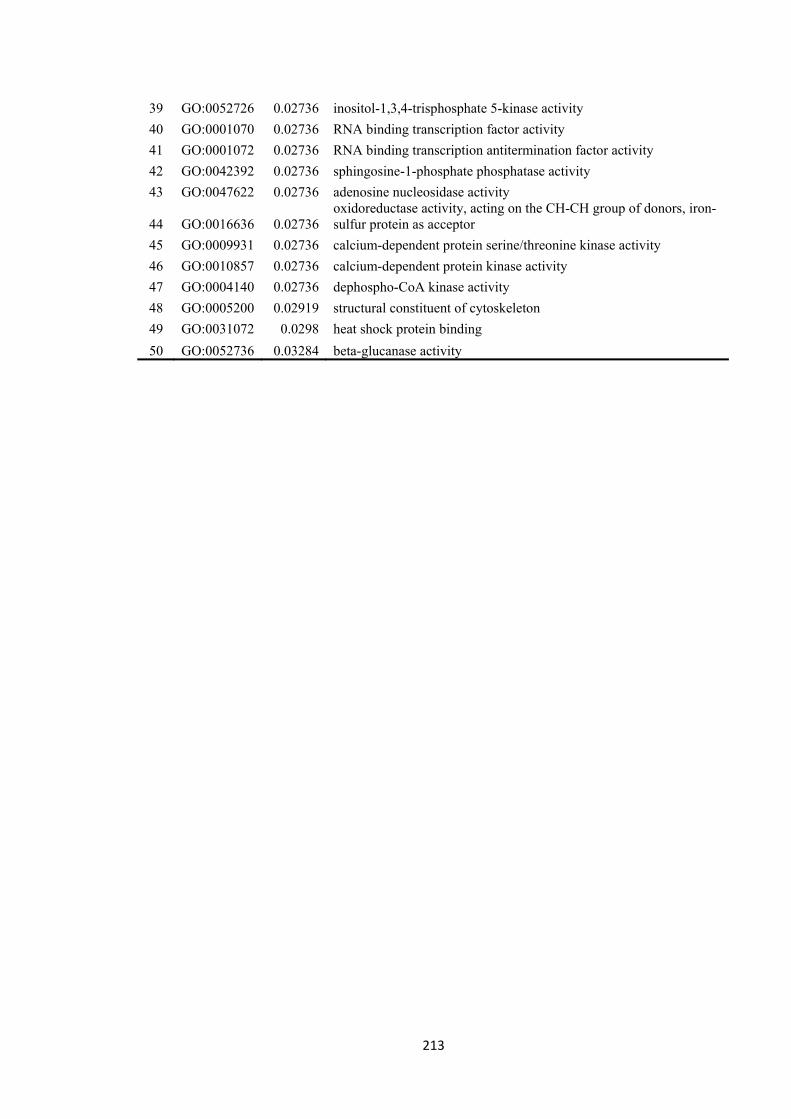
213
39 GO:0052726 0.02736 inositol-1,3,4-trisphosphate 5-kinase activity
40 GO:0001070 0.02736 RNA binding transcription factor activity
41 GO:0001072 0.02736 RNA binding transcription antitermination factor activity
42 GO:0042392 0.02736 sphingosine-1-phosphate phosphatase activity
43 GO:0047622 0.02736 adenosine nucleosidase activity
44 GO:0016636 0.02736 oxidoreductase activity, acting on the CH-CH group of donors, iron-sulfur protein as acceptor
45 GO:0009931 0.02736 calcium-dependent protein serine/threonine kinase activity
46 GO:0010857 0.02736 calcium-dependent protein kinase activity
47 GO:0004140 0.02736 dephospho-CoA kinase activity
48 GO:0005200 0.02919 structural constituent of cytoskeleton
49 GO:0031072 0.0298 heat shock protein binding
50 GO:0052736 0.03284 beta-glucanase activity

214
Suppementary Table S7: Selected 238 differentially expressed genes (DEGs) from gene function category as "response to stimulus" which closely related to
responding to osmotic stress
Note: This table has been broken into two sub-tables as it is too big to list all content in one table in word
No. GeneID Goterm Description DS_4h DS_8h DS_12h DT_4h DT_8h DT_12h
1 Bra005853 GO:0009738 abscisic acid mediated signaling 0 0 0 -2.82419 0 ` 2 Bra009113 GO:0009738 abscisic acid mediated signaling 2.287103 0 0 1.681422 1.321253 -3.1422 3 Bra033267 GO:0009738 abscisic acid mediated signaling 4.054084 -0.08409 -3.28344 0.865464 1.504122 0 4 Bra023863 GO:0009738 abscisic acid mediated signaling -1.31242 -0.07678 1.576995 1.872991 1.648033 -0.63443 5 Bra026782 GO:0003993 acid phosphatase activity -1.10551 -0.0792 0 1.914756 2.12858 2.746652 6 Bra017740 GO:0009734 auxin mediated signaling pathway 0 0 0 0 -2.77503 0 7 Bra037248 GO:0009734 auxin mediated signaling pathway 3.355185 0 0 -1.88229 0 0 8 Bra001900 GO:0009734 auxin mediated signaling pathway 0.21641 1.240616 -0.74277 1.868321 1.196304 -2.0843 9 Bra033886 GO:0009734 auxin mediated signaling pathway 0.578759 0.918885 -1.06479 -0.54652 0.932956 -4.14615
10 Bra033076 GO:0009734 auxin mediated signaling pathway 0 0 -2.83632 -1.54858 2.052176 3.253079 11 Bra000267 GO:0009742 brassinosteroid mediated signaling -0.59693 0.33888 -1.55259 0.043559 1.30346 -1.63574 12 Bra017615 GO:0009931 calcium-dependent protein serine/threonine kinase 0.557621 1.728996 2.919475 0.67872 1.928488 -0.21608 13 Bra026551 GO:0009738 abscisic acid mediated signaling 0.513773 0.807344 0.844327 -0.02077 1.319003 -1.6155 14 Bra000340 GO:0009742 brassinosteroid mediated signaling -2.70757 0 0 0 2.165729 0 15 Bra037667 GO:0009742 brassinosteroid mediated signaling 0 0 0 -2.71447 0 -3.03305 16 Bra031042 GO:0006995 cellular response to nitrogen starvation -3.35219 3.154935 2.251362 1.573166 2.796027 1.377106 17 Bra031046 GO:0006995 cellular response to nitrogen starvation 0 0 0 1.792925 -3.67004 1.69993 18 Bra027707 GO:0016036 cellular response to phosphate starvation -0.96872 -0.14342 1.3423 -0.96302 -0.47921 -3.28127 19 Bra000376 GO:0009267 cellular response to starvation 1.159735 1.077176 -1.73742 -0.79608 5.770287 -1.92333 20 Bra003310 GO:0009267 cellular response to starvation -3.98398 -0.09275 0 -4.50709 4.033326 0 21 Bra016423 GO:0043617 cellular response to sucrose starvation 0.823374 0 -1.64506 -0.12745 0 -1.69195 22 Bra000302 GO:0042631 cellular response to water deprivation -1.58859 -0.08333 2.428526 -2.88229 -0.97036 0 23 Bra007309 GO:0009742 brassinosteroid mediated signaling 0.403125 -1.07621 -2.6962 -0.12641 -1.71883 1.364357

215
24 Bra014208 GO:0006995 cellular response to nitrogen starvation -0.28224 1.201677 -1.24878 -0.18883 1.079274 -1.37774 25 Bra040669 GO:0006995 cellular response to nitrogen starvation -0.15602 -0.07668 1.636966 0.610072 0.589399 -2.01451 26 Bra023219 GO:0009734 auxin mediated signaling pathway -2.53845 -1.42296 0 1.763301 1.390607 0 27 Bra033869 GO:0009734 auxin mediated signaling pathway 1.446981 2.431192 0 1.850143 0.929477 -1.31139 28 Bra001220 GO:0043617 cellular response to sucrose starvation -0.08133 0.659921 -2.32977 1.550795 1.189406 -3.42258 29 Bra018035 GO:0009738 abscisic acid mediated signaling -1.81791 -0.07738 2.425274 0.997908 -0.39502 -3.93207 30 Bra003883 GO:0009873 ethylene mediated signaling pathway 0 0 0 1.355738 0.990178 -1.81673 31 Bra031208 GO:0009873 ethylene mediated signaling pathway -0.91662 1.506874 0 -0.12835 1.783675 1.368331 32 Bra006690 GO:0009873 ethylene mediated signaling pathway -0.58985 -0.08225 2.251362 2.189284 -3.5982 0.377106 33 Bra038265 GO:0009873 ethylene mediated signaling pathway -1.5332 -0.07817 0.84069 0.913386 0.039217 -2.09094 34 Bra031165 GO:0009873 ethylene mediated signaling pathway -1.99385 -3.78527 -0.159 1.870903 -3.39271 1.369854 35 Bra004550 GO:0009873 ethylene mediated signaling pathway -1.59465 -0.75621 3.579518 0.746075 0.606192 1.368412 36 Bra024059 GO:0009742 brassinosteroid mediated signaling -1.59466 1.243817 -0.7443 1.871613 2.529431 -2.62816 37 Bra007772 GO:0009738 abscisic acid mediated signaling -2.0356 0 2.520699 1.839694 0 0 38 Bra001697 GO:0009740 gibberellic acid mediated signaling -0.17892 1.506238 1.450602 -0.12901 0.607154 -3.23953 39 Bra022277 GO:0009740 gibberellic acid mediated signaling 1.406312 -0.49399 -0.15894 0.192685 2.066953 -0.95178 40 Bra010485 GO:0009740 gibberellic acid mediated signaling 0.410513 -2.29068 0 2.626278 1.265107 0 41 Bra013822 GO:0009740 gibberellic acid mediated signaling 0 2.078664 0 0 0 -1.9579 42 Bra020490 GO:0009740 gibberellic acid mediated signaling 2.59283 0 2.665184 0 0 0 43 Bra036536 GO:0009740 gibberellic acid mediated signaling 0 0 -3.36034 -2.0721 0 0 44 Bra023513 GO:0009740 gibberellic acid mediated signaling 0.013424 1.317475 -7.7478 -0.73475 -0.07908 -7.84675 45 Bra026122 GO:0009740 gibberellic acid mediated signaling 1.272262 0 -2.09268 -0.80538 -1.69657 0 46 Bra002075 GO:0009740 gibberellic acid mediated signaling 0.140672 1.730638 0.255031 -1.44886 1.603908 0.780454 47 Bra003435 GO:0009740 gibberellic acid mediated signaling 0.40915 1.503573 -2.32769 -0.64634 2.518363 -0.20965 48 Bra009868 GO:0009740 gibberellic acid mediated signaling 2.404023 0.507978 -0.74484 0.358211 -0.81069 1.366001 49 Bra010592 GO:0009740 gibberellic acid mediated signaling 2.203411 0 3.279792 1.608322 0.234207 0 50 Bra035120 GO:0009740 gibberellic acid mediated signaling 1.724618 0.509129 0 0.552047 -1.3975 0.101974 51 Bra036140 GO:0009740 gibberellic acid mediated signaling -1.16984 -4.89386 5.852124 2.801585 -2.64324 1.163703 52 Bra012409 GO:0009873 ethylene mediated signaling pathway -3.35146 0 0 -2.28966 3.825755 0
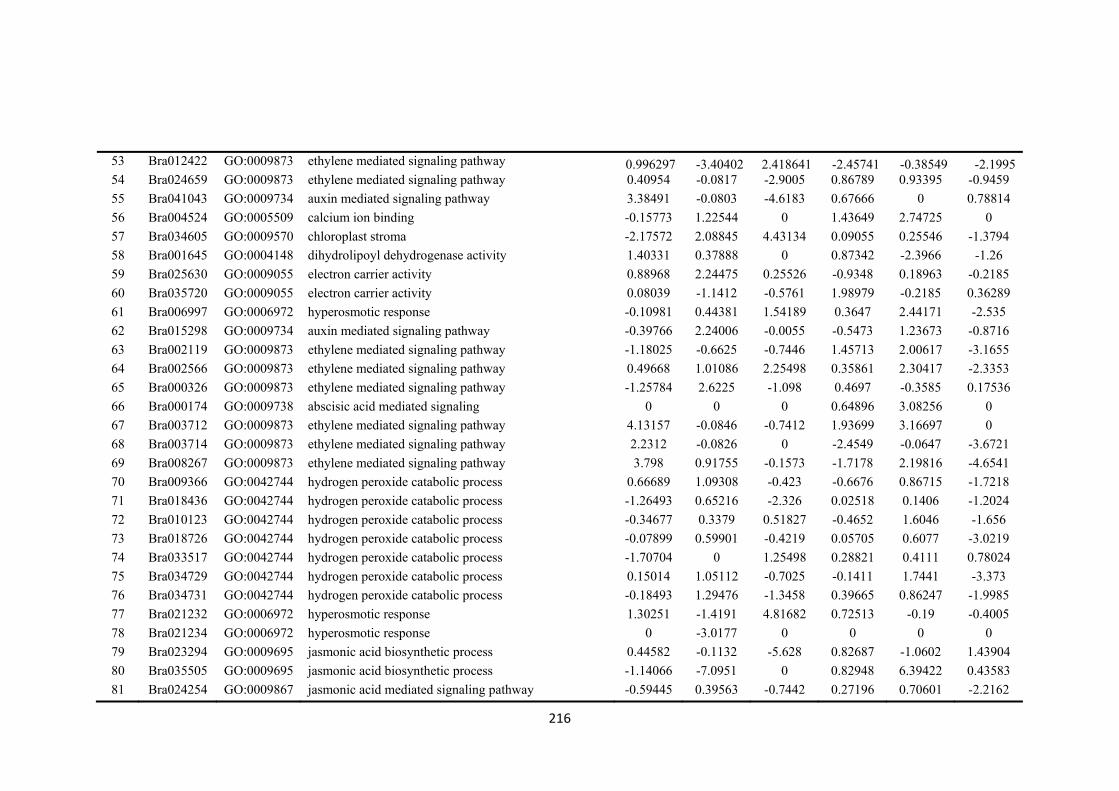
216
53 Bra012422 GO:0009873 ethylene mediated signaling pathway 0.996297 -3.40402 2.418641 -2.45741 -0.38549 -2.1995 54 Bra024659 GO:0009873 ethylene mediated signaling pathway 0.40954 -0.0817 -2.9005 0.86789 0.93395 -0.9459
55 Bra041043 GO:0009734 auxin mediated signaling pathway 3.38491 -0.0803 -4.6183 0.67666 0 0.78814
56 Bra004524 GO:0005509 calcium ion binding -0.15773 1.22544 0 1.43649 2.74725 0
57 Bra034605 GO:0009570 chloroplast stroma -2.17572 2.08845 4.43134 0.09055 0.25546 -1.3794
58 Bra001645 GO:0004148 dihydrolipoyl dehydrogenase activity 1.40331 0.37888 0 0.87342 -2.3966 -1.26
59 Bra025630 GO:0009055 electron carrier activity 0.88968 2.24475 0.25526 -0.9348 0.18963 -0.2185
60 Bra035720 GO:0009055 electron carrier activity 0.08039 -1.1412 -0.5761 1.98979 -0.2185 0.36289
61 Bra006997 GO:0006972 hyperosmotic response -0.10981 0.44381 1.54189 0.3647 2.44171 -2.535
62 Bra015298 GO:0009734 auxin mediated signaling pathway -0.39766 2.24006 -0.0055 -0.5473 1.23673 -0.8716
63 Bra002119 GO:0009873 ethylene mediated signaling pathway -1.18025 -0.6625 -0.7446 1.45713 2.00617 -3.1655
64 Bra002566 GO:0009873 ethylene mediated signaling pathway 0.49668 1.01086 2.25498 0.35861 2.30417 -2.3353
65 Bra000326 GO:0009873 ethylene mediated signaling pathway -1.25784 2.6225 -1.098 0.4697 -0.3585 0.17536
66 Bra000174 GO:0009738 abscisic acid mediated signaling 0 0 0 0.64896 3.08256 0
67 Bra003712 GO:0009873 ethylene mediated signaling pathway 4.13157 -0.0846 -0.7412 1.93699 3.16697 0
68 Bra003714 GO:0009873 ethylene mediated signaling pathway 2.2312 -0.0826 0 -2.4549 -0.0647 -3.6721
69 Bra008267 GO:0009873 ethylene mediated signaling pathway 3.798 0.91755 -0.1573 -1.7178 2.19816 -4.6541
70 Bra009366 GO:0042744 hydrogen peroxide catabolic process 0.66689 1.09308 -0.423 -0.6676 0.86715 -1.7218
71 Bra018436 GO:0042744 hydrogen peroxide catabolic process -1.26493 0.65216 -2.326 0.02518 0.1406 -1.2024
72 Bra010123 GO:0042744 hydrogen peroxide catabolic process -0.34677 0.3379 0.51827 -0.4652 1.6046 -1.656
73 Bra018726 GO:0042744 hydrogen peroxide catabolic process -0.07899 0.59901 -0.4219 0.05705 0.6077 -3.0219
74 Bra033517 GO:0042744 hydrogen peroxide catabolic process -1.70704 0 1.25498 0.28821 0.4111 0.78024
75 Bra034729 GO:0042744 hydrogen peroxide catabolic process 0.15014 1.05112 -0.7025 -0.1411 1.7441 -3.373
76 Bra034731 GO:0042744 hydrogen peroxide catabolic process -0.18493 1.29476 -1.3458 0.39665 0.86247 -1.9985
77 Bra021232 GO:0006972 hyperosmotic response 1.30251 -1.4191 4.81682 0.72513 -0.19 -0.4005
78 Bra021234 GO:0006972 hyperosmotic response 0 -3.0177 0 0 0 0
79 Bra023294 GO:0009695 jasmonic acid biosynthetic process 0.44582 -0.1132 -5.628 0.82687 -1.0602 1.43904
80 Bra035505 GO:0009695 jasmonic acid biosynthetic process -1.14066 -7.0951 0 0.82948 6.39422 0.43583
81 Bra024254 GO:0009867 jasmonic acid mediated signaling pathway -0.59445 0.39563 -0.7442 0.27196 0.70601 -2.2162

217
82 Bra008975 GO:0009867 jasmonic acid mediated signaling pathway 1.08501 -0.2721 -2.3286 -1.1298 1.30884 -5.1556
83 Bra005125 GO:0009867 jasmonic acid mediated signaling pathway -1.59586 2.33568 0.83971 -2.1273 1.37764 3.3662
84 Bra017130 GO:0009867 jasmonic acid mediated signaling pathway -0.33282 -0.662 -2.0667 2.19461 -0.3955 -3.2198
85 Bra012341 GO:0009867 jasmonic acid mediated signaling pathway -2.08925 0.91568 -4.9009 -0.1348 3.12195 3.73503
86 Bra020030 GO:0009867 jasmonic acid mediated signaling pathway 0.32633 0.74646 -0.9313 0.02904 1.92149 -0.5901
87 Bra028186 GO:0009867 jasmonic acid mediated signaling pathway 0.72636 0.67403 -1.584 0.96764 1.42045 -2.4242
88 Bra001202 GO:0009867 jasmonic acid mediated signaling pathway 0 -1.62 3.21787 0.9595 1.58885 0
89 Bra005390 GO:0009867 jasmonic acid mediated signaling pathway -2.05566 -1.9512 1.06241 -0.1941 0.18894 -4.6459
90 Bra005860 GO:0009867 jasmonic acid mediated signaling pathway -1.59454 -1.2764 1.28877 -2.1285 2.24322 -2.6636
91 Bra007937 GO:0009867 jasmonic acid mediated signaling pathway 0.24803 0.50413 -1.743 -0.5906 0.68096 -4.3503
92 Bra008033 GO:0009867 jasmonic acid mediated signaling pathway -1.39969 -0.5396 -0.3283 -0.268 1.77934 -5.3088
93 Bra010794 GO:0009867 jasmonic acid mediated signaling pathway 0 0 -4.057 -2.7682 -0.3722 4.48131
94 Bra016056 GO:0009867 jasmonic acid mediated signaling pathway 0.04507 -0.4951 -0.7434 -0.2235 0.19432 -3.6019
95 Bra016193 GO:0009867 jasmonic acid mediated signaling pathway 0.40854 1.91913 0.25702 -1.4267 -0.6524 -5.232
96 Bra016604 GO:0009867 jasmonic acid mediated signaling pathway -0.59224 0.50475 1.84164 -1.7155 1.00186 -1.4346
97 Bra021281 GO:0009867 jasmonic acid mediated signaling pathway -3.21691 1.92151 -0.7441 -1.2442 0.9287 -2.2158
98 Bra021923 GO:0009867 jasmonic acid mediated signaling pathway 0 0 0 2.88181 2.55624 0
99 Bra022254 GO:0009867 jasmonic acid mediated signaling pathway 0.05818 0.55865 -0.2846 0.09332 2.51413 -1.8001
100 Bra025977 GO:0009867 jasmonic acid mediated signaling pathway -2.454 0 0 -2.3927 2.89479 -2.7227
101 Bra030986 GO:0009867 jasmonic acid mediated signaling pathway -1.17804 2.42303 -0.0067 0.37271 -0.3916 0.37125
102 Bra032362 GO:0009867 jasmonic acid mediated signaling pathway 0 0 0 0 3.23588 0.39411
103 Bra040274 GO:0009867 jasmonic acid mediated signaling pathway 0 1.45243 0 0.87136 0 -2.3326
104 Bra000962 GO:0009742 brassinosteroid mediated signaling 0.0256 1.6599 -2.5779 -0.1273 -0.3955 -0.6338
105 Bra013274 GO:0009742 brassinosteroid mediated signaling -1.18088 -2.077 -0.7448 2.19467 0.4789 0.78114
106 Bra025014 GO:0009742 brassinosteroid mediated signaling 0.40414 -0.8278 -1.5845 -0.7123 1.77443 -0.6338
107 Bra024337 GO:0009868 jasmonic acid and ethylene-dependent systemic 0.4039 -2.3988 -2.7449 -0.9345 -0.3958 -0.2192
108 Bra007828 GO:0009867 jasmonic acid mediated signaling pathway 0.40436 -2.4976 0.92462 1.25468 -0.1222 1.3666
109 Bra011584 GO:0042744 hydrogen peroxide catabolic process -2.59613 3.64 0.2551 -0.628 -0.0112 -0.9562
110 Bra003222 GO:0009970 cellular response to sulfate starvation 3.20404 -2.2637 0 0.45216 3.55976 3.43775
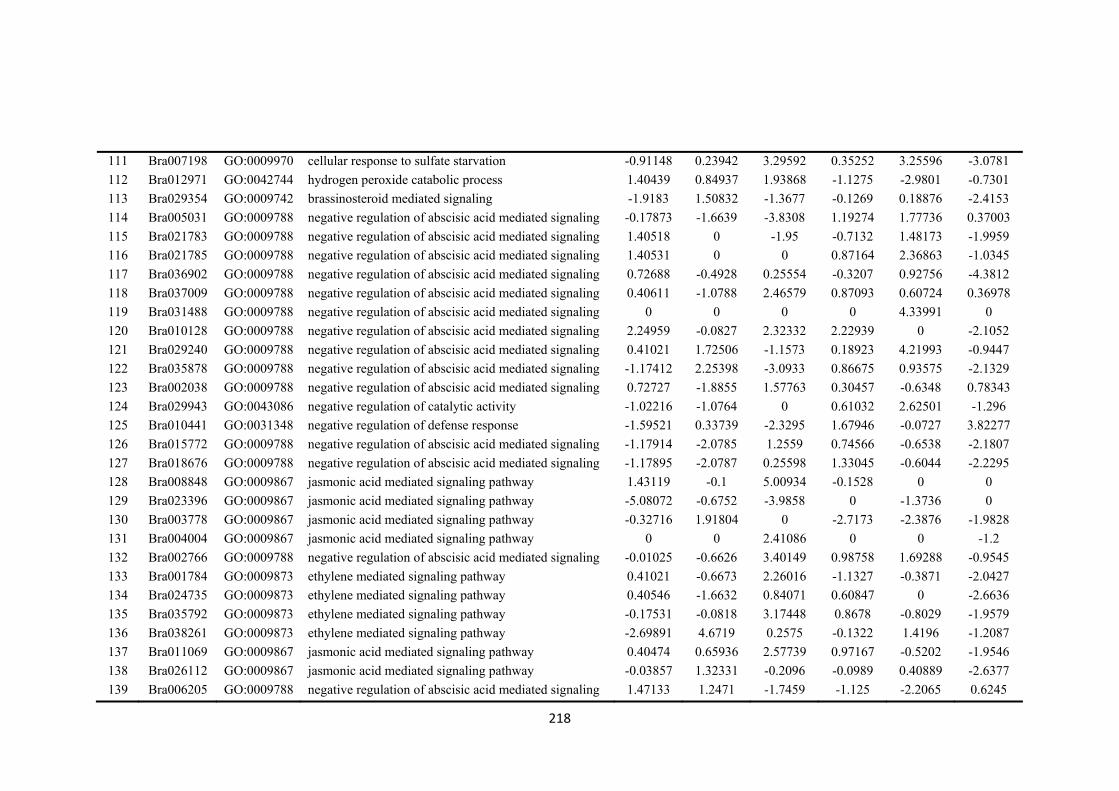
218
111 Bra007198 GO:0009970 cellular response to sulfate starvation -0.91148 0.23942 3.29592 0.35252 3.25596 -3.0781
112 Bra012971 GO:0042744 hydrogen peroxide catabolic process 1.40439 0.84937 1.93868 -1.1275 -2.9801 -0.7301
113 Bra029354 GO:0009742 brassinosteroid mediated signaling -1.9183 1.50832 -1.3677 -0.1269 0.18876 -2.4153
114 Bra005031 GO:0009788 negative regulation of abscisic acid mediated signaling -0.17873 -1.6639 -3.8308 1.19274 1.77736 0.37003
115 Bra021783 GO:0009788 negative regulation of abscisic acid mediated signaling 1.40518 0 -1.95 -0.7132 1.48173 -1.9959
116 Bra021785 GO:0009788 negative regulation of abscisic acid mediated signaling 1.40531 0 0 0.87164 2.36863 -1.0345
117 Bra036902 GO:0009788 negative regulation of abscisic acid mediated signaling 0.72688 -0.4928 0.25554 -0.3207 0.92756 -4.3812
118 Bra037009 GO:0009788 negative regulation of abscisic acid mediated signaling 0.40611 -1.0788 2.46579 0.87093 0.60724 0.36978
119 Bra031488 GO:0009788 negative regulation of abscisic acid mediated signaling 0 0 0 0 4.33991 0
120 Bra010128 GO:0009788 negative regulation of abscisic acid mediated signaling 2.24959 -0.0827 2.32332 2.22939 0 -2.1052
121 Bra029240 GO:0009788 negative regulation of abscisic acid mediated signaling 0.41021 1.72506 -1.1573 0.18923 4.21993 -0.9447
122 Bra035878 GO:0009788 negative regulation of abscisic acid mediated signaling -1.17412 2.25398 -3.0933 0.86675 0.93575 -2.1329
123 Bra002038 GO:0009788 negative regulation of abscisic acid mediated signaling 0.72727 -1.8855 1.57763 0.30457 -0.6348 0.78343
124 Bra029943 GO:0043086 negative regulation of catalytic activity -1.02216 -1.0764 0 0.61032 2.62501 -1.296
125 Bra010441 GO:0031348 negative regulation of defense response -1.59521 0.33739 -2.3295 1.67946 -0.0727 3.82277
126 Bra015772 GO:0009788 negative regulation of abscisic acid mediated signaling -1.17914 -2.0785 1.2559 0.74566 -0.6538 -2.1807
127 Bra018676 GO:0009788 negative regulation of abscisic acid mediated signaling -1.17895 -2.0787 0.25598 1.33045 -0.6044 -2.2295
128 Bra008848 GO:0009867 jasmonic acid mediated signaling pathway 1.43119 -0.1 5.00934 -0.1528 0 0
129 Bra023396 GO:0009867 jasmonic acid mediated signaling pathway -5.08072 -0.6752 -3.9858 0 -1.3736 0
130 Bra003778 GO:0009867 jasmonic acid mediated signaling pathway -0.32716 1.91804 0 -2.7173 -2.3876 -1.9828
131 Bra004004 GO:0009867 jasmonic acid mediated signaling pathway 0 0 2.41086 0 0 -1.2
132 Bra002766 GO:0009788 negative regulation of abscisic acid mediated signaling -0.01025 -0.6626 3.40149 0.98758 1.69288 -0.9545
133 Bra001784 GO:0009873 ethylene mediated signaling pathway 0.41021 -0.6673 2.26016 -1.1327 -0.3871 -2.0427
134 Bra024735 GO:0009873 ethylene mediated signaling pathway 0.40546 -1.6632 0.84071 0.60847 0 -2.6636
135 Bra035792 GO:0009873 ethylene mediated signaling pathway -0.17531 -0.0818 3.17448 0.8678 -0.8029 -1.9579
136 Bra038261 GO:0009873 ethylene mediated signaling pathway -2.69891 4.6719 0.2575 -0.1322 1.4196 -1.2087
137 Bra011069 GO:0009867 jasmonic acid mediated signaling pathway 0.40474 0.65936 2.57739 0.97167 -0.5202 -1.9546
138 Bra026112 GO:0009867 jasmonic acid mediated signaling pathway -0.03857 1.32331 -0.2096 -0.0989 0.40889 -2.6377
139 Bra006205 GO:0009788 negative regulation of abscisic acid mediated signaling 1.47133 1.2471 -1.7459 -1.125 -2.2065 0.6245

219
140 Bra000052 GO:0009738 abscisic acid mediated signaling 3.84384 0 0 -1.1331 -0.8014 -3.1144
141 Bra005115 GO:0009738 abscisic acid mediated signaling 0 0 0 0 -3.3515 0
142 Bra025370 GO:0009734 auxin mediated signaling pathway 0.76946 1.92054 -0.7437 0.87024 -1.3917 -3.7655
143 Bra020675 GO:0010438 cellular response to sulfur starvation 1.4668 3.76522 4.3438 6.11502 4.70983 8.19557
144 Bra036158 GO:0010438 cellular response to sulfur starvation 2.43339 5.97219 8.3342 6.18612 6.59136 6.99574
145 Bra017712 GO:0009740 gibberellic acid mediated signaling -1.18123 -0.0767 -2.4109 -1.127 2.20338 -2.0434
146 Bra031037 GO:0009740 gibberellic acid mediated signaling 0.9875 1.09422 -0.7455 0.04403 0.47675 -2.7932
147 Bra009443 GO:0042744 hydrogen peroxide catabolic process 2.72589 1.92307 -2.3298 0.4578 0.41162 1.95085
148 Bra016803 GO:0042744 hydrogen peroxide catabolic process 0.40801 -0.8878 -1.4802 0.32868 4.54637 -1.2117
149 Bra028784 GO:0042744 hydrogen peroxide catabolic process 0.78195 -0.2464 0.51795 0.65091 0.3405 3.2748
150 Bra006585 GO:0009788 negative regulation of abscisic acid mediated signaling 0.69998 3.55961 -2.6391 0.23888 -0.0743 -0.0615
151 Bra037520 GO:0007231 osmosensory signaling pathway -1.33463 -1.7385 -1.4825 1.09668 0.70154 -1.807
152 Bra015513 GO:0009867 jasmonic acid mediated signaling pathway 1.25358 1.23906 0 3.19331 0.1915 -1.1195
153 Bra025192 GO:0009873 ethylene mediated signaling pathway 0.08212 -2.1139 0.80388 0.45773 -1.1524 -2.1808
154 Bra029307 GO:0009738 abscisic acid mediated signaling 0 0 0 5.10649 0 0
155 Bra018000 GO:0042744 hydrogen peroxide catabolic process -1.37356 1.12463 -0.44 0.00401 1.80078 0.78108
156 Bra019584 GO:0042744 hydrogen peroxide catabolic process 1.40426 2.50778 -1.1598 0.57302 0.87768 -2.093
157 Bra011649 GO:0007231 osmosensory signaling pathway -0.59517 2.58641 1.0913 0.87207 2.85239 0.36746
158 Bra017737 GO:0007231 osmosensory signaling pathway 0 0 0 2.7544 2.37884 0
159 Bra037250 GO:0007231 osmosensory signaling pathway 1.25823 0 0 0 0.19152 2.49299
160 Bra021506 GO:0042744 hydrogen peroxide catabolic process 0.71942 0.64196 -1.714 -1.2927 0.29186 -3.7523
161 Bra027403 GO:0042744 hydrogen peroxide catabolic process 0.59606 0.78681 -1.4021 -1.2441 -0.0498 -1.8931
162 Bra015666 GO:0009873 ethylene mediated signaling pathway -0.4329 -3.2241 0.91416 -0.1275 -1.3952 0
163 Bra024333 GO:0009873 ethylene mediated signaling pathway 0 0.81458 -3.2335 0.16205 -0.5879 1.78154
164 Bra031896 GO:0009873 ethylene mediated signaling pathway -1.42597 0.50773 1.06264 0.56441 0.64037 -1.3339
165 Bra011617 GO:0009740 gibberellic acid mediated signaling 2.40442 3.18189 1.57725 0.19436 1.48756 -0.7407
166 Bra029693 GO:0009740 gibberellic acid mediated signaling -2.17939 2.24361 -2.7442 0.31198 1.97573 -1.9531
167 Bra011043 GO:0009789 positive regulation of abscisic acid mediated signaling 0 0 0.30101 -0.6117 1.60294 -2.4165
168 Bra035834 GO:0009789 positive regulation of abscisic acid mediated signaling 1.13892 -0.3971 -0.5233 0.45959 -2.3985 -0.3039
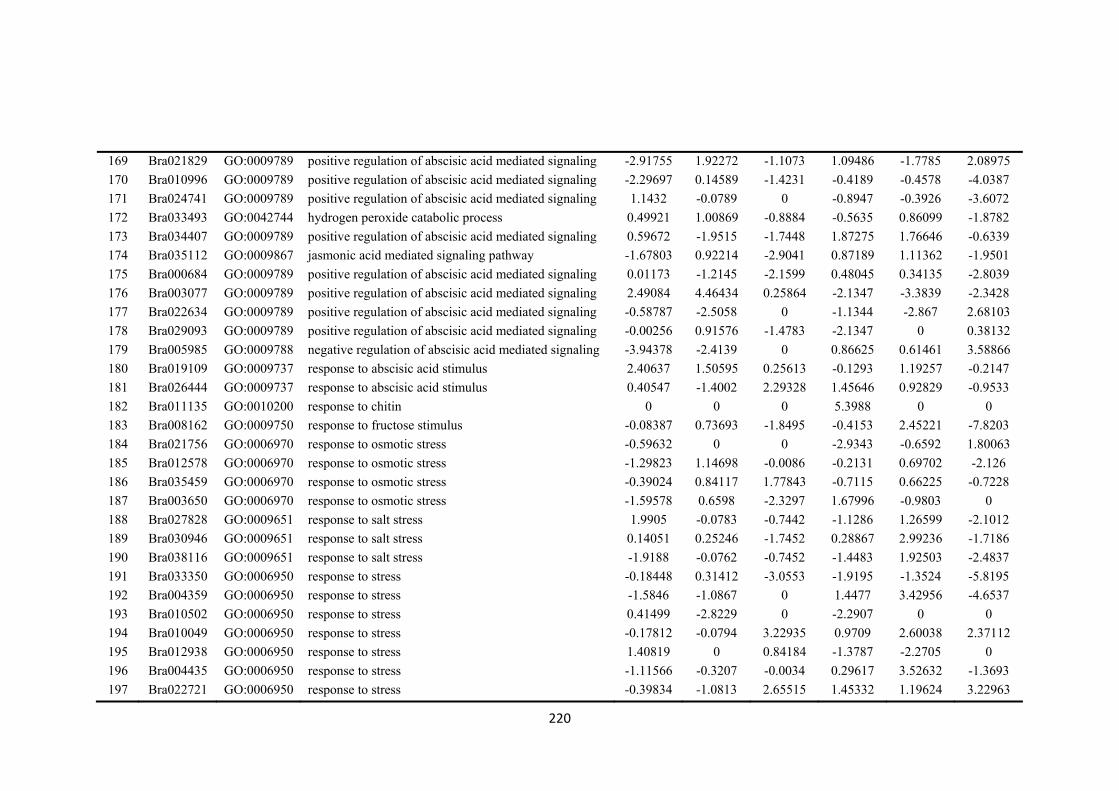
220
169 Bra021829 GO:0009789 positive regulation of abscisic acid mediated signaling -2.91755 1.92272 -1.1073 1.09486 -1.7785 2.08975
170 Bra010996 GO:0009789 positive regulation of abscisic acid mediated signaling -2.29697 0.14589 -1.4231 -0.4189 -0.4578 -4.0387
171 Bra024741 GO:0009789 positive regulation of abscisic acid mediated signaling 1.1432 -0.0789 0 -0.8947 -0.3926 -3.6072
172 Bra033493 GO:0042744 hydrogen peroxide catabolic process 0.49921 1.00869 -0.8884 -0.5635 0.86099 -1.8782
173 Bra034407 GO:0009789 positive regulation of abscisic acid mediated signaling 0.59672 -1.9515 -1.7448 1.87275 1.76646 -0.6339
174 Bra035112 GO:0009867 jasmonic acid mediated signaling pathway -1.67803 0.92214 -2.9041 0.87189 1.11362 -1.9501
175 Bra000684 GO:0009789 positive regulation of abscisic acid mediated signaling 0.01173 -1.2145 -2.1599 0.48045 0.34135 -2.8039
176 Bra003077 GO:0009789 positive regulation of abscisic acid mediated signaling 2.49084 4.46434 0.25864 -2.1347 -3.3839 -2.3428
177 Bra022634 GO:0009789 positive regulation of abscisic acid mediated signaling -0.58787 -2.5058 0 -1.1344 -2.867 2.68103
178 Bra029093 GO:0009789 positive regulation of abscisic acid mediated signaling -0.00256 0.91576 -1.4783 -2.1347 0 0.38132
179 Bra005985 GO:0009788 negative regulation of abscisic acid mediated signaling -3.94378 -2.4139 0 0.86625 0.61461 3.58866
180 Bra019109 GO:0009737 response to abscisic acid stimulus 2.40637 1.50595 0.25613 -0.1293 1.19257 -0.2147
181 Bra026444 GO:0009737 response to abscisic acid stimulus 0.40547 -1.4002 2.29328 1.45646 0.92829 -0.9533
182 Bra011135 GO:0010200 response to chitin 0 0 0 5.3988 0 0
183 Bra008162 GO:0009750 response to fructose stimulus -0.08387 0.73693 -1.8495 -0.4153 2.45221 -7.8203
184 Bra021756 GO:0006970 response to osmotic stress -0.59632 0 0 -2.9343 -0.6592 1.80063
185 Bra012578 GO:0006970 response to osmotic stress -1.29823 1.14698 -0.0086 -0.2131 0.69702 -2.126
186 Bra035459 GO:0006970 response to osmotic stress -0.39024 0.84117 1.77843 -0.7115 0.66225 -0.7228
187 Bra003650 GO:0006970 response to osmotic stress -1.59578 0.6598 -2.3297 1.67996 -0.9803 0
188 Bra027828 GO:0009651 response to salt stress 1.9905 -0.0783 -0.7442 -1.1286 1.26599 -2.1012
189 Bra030946 GO:0009651 response to salt stress 0.14051 0.25246 -1.7452 0.28867 2.99236 -1.7186
190 Bra038116 GO:0009651 response to salt stress -1.9188 -0.0762 -0.7452 -1.4483 1.92503 -2.4837
191 Bra033350 GO:0006950 response to stress -0.18448 0.31412 -3.0553 -1.9195 -1.3524 -5.8195
192 Bra004359 GO:0006950 response to stress -1.5846 -1.0867 0 1.4477 3.42956 -4.6537
193 Bra010502 GO:0006950 response to stress 0.41499 -2.8229 0 -2.2907 0 0
194 Bra010049 GO:0006950 response to stress -0.17812 -0.0794 3.22935 0.9709 2.60038 2.37112
195 Bra012938 GO:0006950 response to stress 1.40819 0 0.84184 -1.3787 -2.2705 0
196 Bra004435 GO:0006950 response to stress -1.11566 -0.3207 -0.0034 0.29617 3.52632 -1.3693
197 Bra022721 GO:0006950 response to stress -0.39834 -1.0813 2.65515 1.45332 1.19624 3.22963
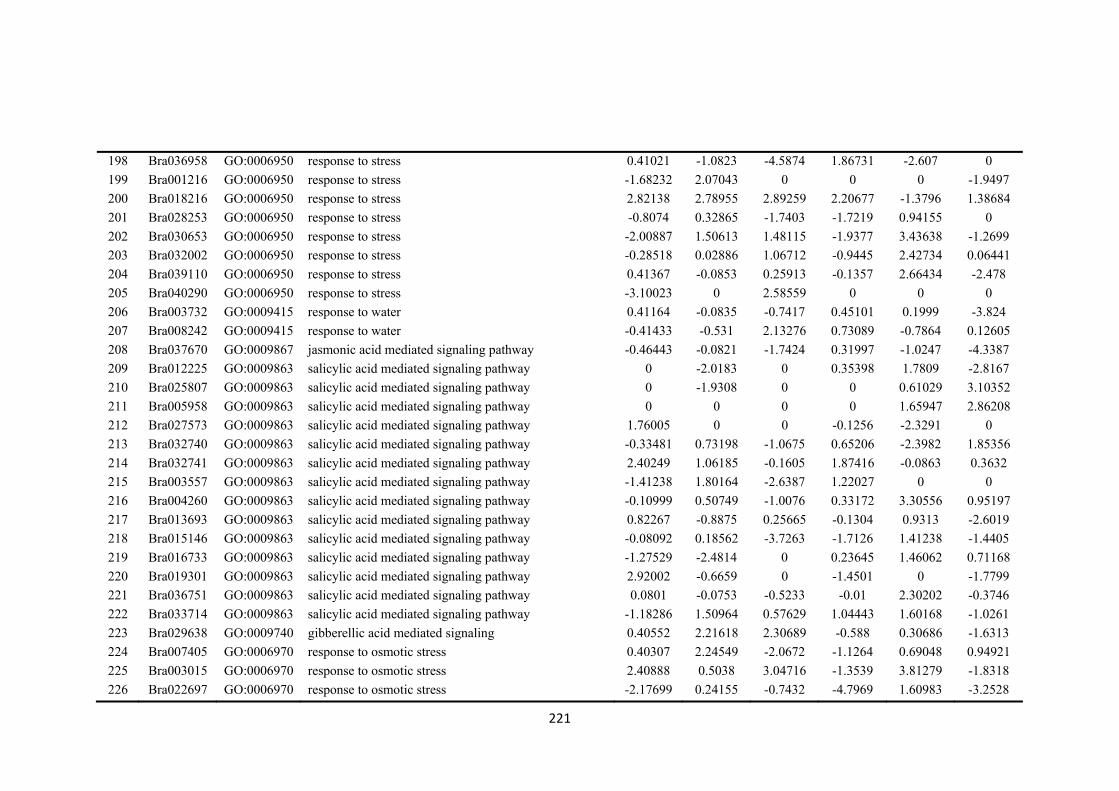
221
198 Bra036958 GO:0006950 response to stress 0.41021 -1.0823 -4.5874 1.86731 -2.607 0
199 Bra001216 GO:0006950 response to stress -1.68232 2.07043 0 0 0 -1.9497
200 Bra018216 GO:0006950 response to stress 2.82138 2.78955 2.89259 2.20677 -1.3796 1.38684
201 Bra028253 GO:0006950 response to stress -0.8074 0.32865 -1.7403 -1.7219 0.94155 0
202 Bra030653 GO:0006950 response to stress -2.00887 1.50613 1.48115 -1.9377 3.43638 -1.2699
203 Bra032002 GO:0006950 response to stress -0.28518 0.02886 1.06712 -0.9445 2.42734 0.06441
204 Bra039110 GO:0006950 response to stress 0.41367 -0.0853 0.25913 -0.1357 2.66434 -2.478
205 Bra040290 GO:0006950 response to stress -3.10023 0 2.58559 0 0 0
206 Bra003732 GO:0009415 response to water 0.41164 -0.0835 -0.7417 0.45101 0.1999 -3.824
207 Bra008242 GO:0009415 response to water -0.41433 -0.531 2.13276 0.73089 -0.7864 0.12605
208 Bra037670 GO:0009867 jasmonic acid mediated signaling pathway -0.46443 -0.0821 -1.7424 0.31997 -1.0247 -4.3387
209 Bra012225 GO:0009863 salicylic acid mediated signaling pathway 0 -2.0183 0 0.35398 1.7809 -2.8167
210 Bra025807 GO:0009863 salicylic acid mediated signaling pathway 0 -1.9308 0 0 0.61029 3.10352
211 Bra005958 GO:0009863 salicylic acid mediated signaling pathway 0 0 0 0 1.65947 2.86208
212 Bra027573 GO:0009863 salicylic acid mediated signaling pathway 1.76005 0 0 -0.1256 -2.3291 0
213 Bra032740 GO:0009863 salicylic acid mediated signaling pathway -0.33481 0.73198 -1.0675 0.65206 -2.3982 1.85356
214 Bra032741 GO:0009863 salicylic acid mediated signaling pathway 2.40249 1.06185 -0.1605 1.87416 -0.0863 0.3632
215 Bra003557 GO:0009863 salicylic acid mediated signaling pathway -1.41238 1.80164 -2.6387 1.22027 0 0
216 Bra004260 GO:0009863 salicylic acid mediated signaling pathway -0.10999 0.50749 -1.0076 0.33172 3.30556 0.95197
217 Bra013693 GO:0009863 salicylic acid mediated signaling pathway 0.82267 -0.8875 0.25665 -0.1304 0.9313 -2.6019
218 Bra015146 GO:0009863 salicylic acid mediated signaling pathway -0.08092 0.18562 -3.7263 -1.7126 1.41238 -1.4405
219 Bra016733 GO:0009863 salicylic acid mediated signaling pathway -1.27529 -2.4814 0 0.23645 1.46062 0.71168
220 Bra019301 GO:0009863 salicylic acid mediated signaling pathway 2.92002 -0.6659 0 -1.4501 0 -1.7799
221 Bra036751 GO:0009863 salicylic acid mediated signaling pathway 0.0801 -0.0753 -0.5233 -0.01 2.30202 -0.3746
222 Bra033714 GO:0009863 salicylic acid mediated signaling pathway -1.18286 1.50964 0.57629 1.04443 1.60168 -1.0261
223 Bra029638 GO:0009740 gibberellic acid mediated signaling 0.40552 2.21618 2.30689 -0.588 0.30686 -1.6313
224 Bra007405 GO:0006970 response to osmotic stress 0.40307 2.24549 -2.0672 -1.1264 0.69048 0.94921
225 Bra003015 GO:0006970 response to osmotic stress 2.40888 0.5038 3.04716 -1.3539 3.81279 -1.8318
226 Bra022697 GO:0006970 response to osmotic stress -2.17699 0.24155 -0.7432 -4.7969 1.60983 -3.2528
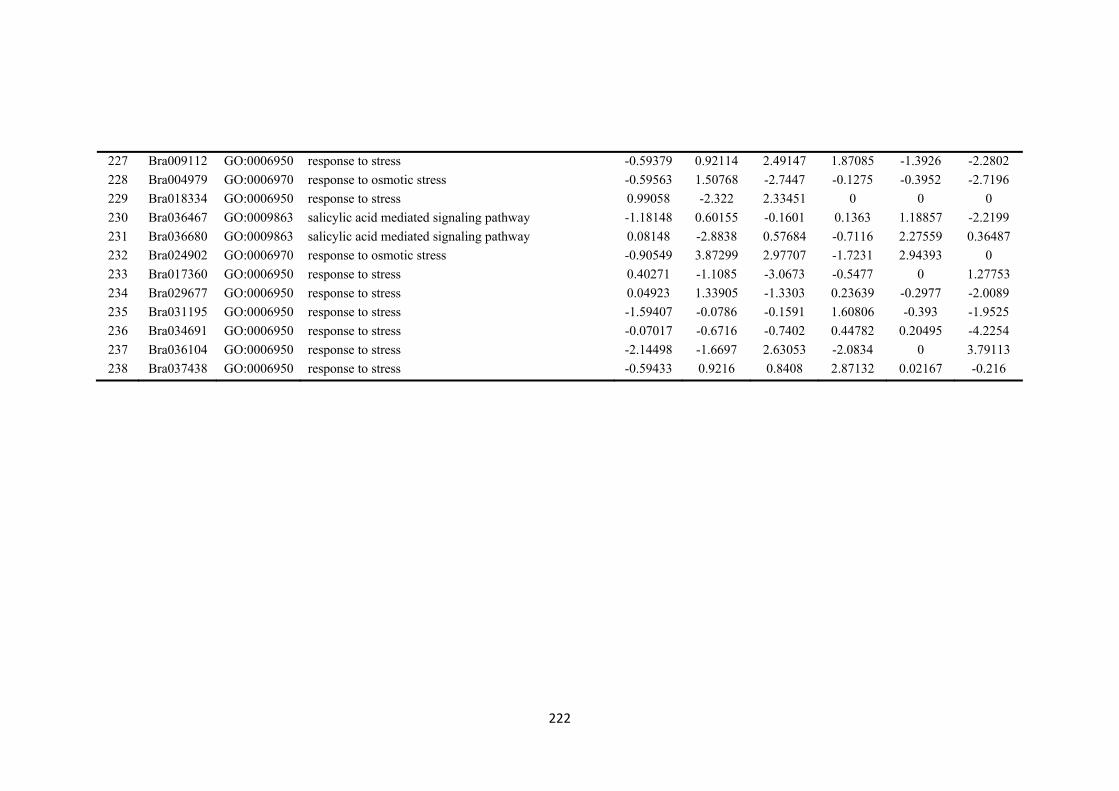
222
227 Bra009112 GO:0006950 response to stress -0.59379 0.92114 2.49147 1.87085 -1.3926 -2.2802
228 Bra004979 GO:0006970 response to osmotic stress -0.59563 1.50768 -2.7447 -0.1275 -0.3952 -2.7196
229 Bra018334 GO:0006950 response to stress 0.99058 -2.322 2.33451 0 0 0
230 Bra036467 GO:0009863 salicylic acid mediated signaling pathway -1.18148 0.60155 -0.1601 0.1363 1.18857 -2.2199
231 Bra036680 GO:0009863 salicylic acid mediated signaling pathway 0.08148 -2.8838 0.57684 -0.7116 2.27559 0.36487
232 Bra024902 GO:0006970 response to osmotic stress -0.90549 3.87299 2.97707 -1.7231 2.94393 0
233 Bra017360 GO:0006950 response to stress 0.40271 -1.1085 -3.0673 -0.5477 0 1.27753
234 Bra029677 GO:0006950 response to stress 0.04923 1.33905 -1.3303 0.23639 -0.2977 -2.0089
235 Bra031195 GO:0006950 response to stress -1.59407 -0.0786 -0.1591 1.60806 -0.393 -1.9525
236 Bra034691 GO:0006950 response to stress -0.07017 -0.6716 -0.7402 0.44782 0.20495 -4.2254
237 Bra036104 GO:0006950 response to stress -2.14498 -1.6697 2.63053 -2.0834 0 3.79113
238 Bra037438 GO:0006950 response to stress -0.59433 0.9216 0.8408 2.87132 0.02167 -0.216
Copyright © 2022 FDOKUMEN