Screening for drought tolerance in Brassica rapa L. - the UWA ...
Upload
khangminh22Category
view
0download
0
The Influence of Migration, Ethnicity and Acculturation
on the Risk of Stillbirth, Preterm Birth and Low
Birthweight in Western Australia
Maryam Mozooni, MD
This thesis is presented for the degree of Doctor of Philosophy
of The University of Western Australia
School of Population and Global Health
Faculty of Health and Medical Science
2020

PAGE | i
THESIS DECLARATION
I, Maryam Mozooni, certify that:
This thesis has been substantially accomplished during enrolment in this degree.
This thesis does not contain material which has been submitted for the award of any other degree
or diploma in my name, in any university or other tertiary institution.
In the future, no part of this thesis will be used in a submission in my name, for any other degree
or diploma in any university or other tertiary institution without the prior approval of The
University of Western Australia and where applicable, any partner institution responsible for the
joint-award of this degree.
This thesis does not contain any material previously published or written by another person,
except where due reference has been made in the text and, where relevant, in the Authorship
Declaration that follows.
This thesis does not violate or infringe any copyright, trademark, patent, or other rights
whatsoever of any person.
The research involving human data reported in this thesis was assessed and approved by the
Human Research Ethics Committee of the WA Department of Health (2015/23). The University of
Western Australia Human Research Ethics Committee recognised the existing approval of the non-
UWA ethics committee with no need for completion of its own ethics review process. Approval #:
RA/4/1/7602. Written patient consent was not required to conduct the study due to the use of
non-identifiable routinely collected linked administrative health data for the whole population in
this thesis.
Third party editorial assistance was provided in preparation of final version of this thesis by Tweak
Editing.
This thesis contains published work and/or work prepared for publication, some of which has been
co-authored.
Signature:
Date: 09/09/2020

PAGE | ii
ABSTRACT
BACKGROUND
Adverse reproductive outcomes and racial disparities in the risk of pregnancy outcomes are still
observed in high-income countries despite the availability of high-standard pregnancy care and
perinatal interventions. Previous studies have indicated significant differences among migrants
and resettlement countries’ populations in terms of the utilisation of reproductive services and
reproductive outcomes. However, the findings are inconsistent across jurisdictions. Immigration is
the principal component of population growth in Australia; in 2016, 35% of residents had been
born overseas, and one-third of women who give birth annually were not born in Australia.
Western Australia (WA) recorded the highest population growth of all Australian states and
territories from 2006–2016 (24.8% increase), and most Western Australians have at least one
overseas-born parent. Yet, the influences of immigration and ethnicity on health service utilisation
and pregnancy outcomes of migrants are not well investigated or understood.
OBJECTIVES
This thesis investigated the influence of migration and ethnicity on the patterns of utilisation of
pregnancy-related healthcare services and selected pregnancy outcomes in WA from 2005 to
2013. The specific aims were:
Aim 1: To investigate prevalence proportion and the risk of antepartum and intrapartum
stillbirth in WA with respect to maternal country of birth and ethnic origin.
Aim 2: To investigate the pattern of healthcare utilisation among migrant women and its
relationship with the risk of stillbirth (antepartum and intrapartum) in WA.
Aim 3: To investigate the influence of acculturation on disparities observed in the risk of
stillbirth between migrant and Australian-born populations in WA.

PAGE | iii
Aim 4: To investigate ethnic disparities in the risk of low birthweight (LBW) and preterm
birth (PTB), spontaneous and medically indicated, between migrant and Australian-born
populations from diverse ethnic backgrounds in WA.
Aim 5: To investigate the influence of acculturation on disparities observed in the risk of
PTB and LBW between migrant and Australian-born populations from diverse ethnic backgrounds
in WA.
METHODS AND RESULTS
A retrospective cohort analysis was undertaken of de-identified, linked, routinely collected
Midwives, Births, Deaths, Hospital and Birth Defects data for all births to non-Indigenous women
in WA from 2005–2013. A range of descriptive and analytical analyses was undertaken, including
Pearson X2 and Fisher exact tests, univariable and multivariable, binary and multinomial, logistic
regression modelling.
This thesis illustrated a broad, yet detailed, picture of health service utilisation and pregnancy
outcomes of women from migrant and diverse ethnic backgrounds who gave birth in WA from
2005–2013. Disparities in the risk of stillbirth (antepartum and intrapartum) and modifiable
individual- and system-related factors to prevent these deaths were identified. It also
demonstrated the ethnic disparities in the risk of LBW and PTB among the migrant and Australian-
born population in WA and the influence of acculturation on these outcomes. Key findings were as
follows:
No significant differences between Australian-born women with white and non-white
backgrounds for any type of stillbirth; however, non-white migrant women were more likely to
have stillbirth, both antepartum and intrapartum, than white migrants. Antepartum stillbirths
were more common among African, Indian and ‘other’ non-white migrants while intrapartum

PAGE | iv
stillbirths were higher among African and ‘other’ non-white migrants than the Australian-born
population.
When migrant groups were stratified by timing of first antenatal visit, the odds of
antepartum stillbirth increased in those who commenced antenatal care later than 14 weeks
gestation in women from Indian, Māori and other non-white ethnicities. With midwife-only
intrapartum care, the odds of intrapartum stillbirth for viable births in African and other non-white
migrants (combined) were more than three times that of Australian-born women; however, with
multidisciplinary intrapartum care, the odds were similar to that of the Australian-born group.
Using interpreter services was associated with a lower risk of stillbirth in migrants than the
Australian-born population. Women from African, Indian and Asian backgrounds who gave birth in
the first two years after arrival in Australia experienced the highest risk of stillbirth. Except for
African women, this association attenuated with an increase in the length of residence in other
migrant groups. Having an Australian-born partner was associated with 20% lower odds of
stillbirth in migrants.
All non-Māori ethnic groups, regardless of their place of birth, had higher adjusted odds of
term-LBW than the white Australian-born population. Migrant Asian and Indian had higher and
white, Māori and African migrants had lower risk of specific types of PTB than white Australian-
born women. Australian-born women from ‘other’ ethnicity had a higher risk of medically
indicated PTB than their white Australian-born counterparts.
The least acculturated non-white non-Māori women had twice as high, and the most
acculturated had the same risk of term-LBW as the Australian-born women. The odds of PTB were
significantly lower in the least acculturated and significantly higher in the most acculturated
migrant women than their Australian-born counterparts.

PAGE | v
CONCLUSION
This project demonstrated that migrant status, ethnicity and acculturation are associated with
specific patterns of service utilisation and certain pregnancy outcomes. These variables are crucial
factors for consideration in policy development, on public health agenda, and in pregnancy and
obstetrics care provision to prevent adverse pregnancy outcomes, especially in populations from
migrant and culturally and linguistically diverse backgrounds, to improve health outcomes in
Australian society.
PAGE | vi
ACKNOWLEDGEMENTS
“Yesterday I was clever, so I wanted to change the world. Today I am wise, so I am changing myself”
“What you seek is seeking you” Rumi
I started my PhD with so much passion for evidence-based practice, public health and medical
discovery after a few years of working as a physician. Little did I know that what I stepped into was
going to be my odyssey, a long journey of profound self-discovery and transformation. First and
foremost, I wish to express my immense gratitude for the given opportunity, strength and
knowledge to undertake this research and to persevere until its completion: I sought and I found.
My profound appreciation to Professor David Preen and Professor Craig Pennell, my PhD
supervisors, for their generous and patient guidance, encouragement, and advice through deep
waters of my entire journey. Working with you was a blessing. I cannot thank you enough for
sharing your wisdom and insight with me, and for your constructive criticism which made this
thesis possible.
My heartfelt gratitude to Dr Judy Straton, my mentor of nine years, for her time, support, and
patience. Thank you for being there for me all the way. I will always cherish your support.
My deepest gratitude to my family; to my wonderful husband Arash: thanks for your patience,
love and for accommodating my academic endeavour amidst building a new life after immigration.
To my amazing children Elya and Elina: giving birth to you, raising you and experiencing life with
you were the wind in my sails throughout this voyage, thanks for the joy you brought to my life
and for your understanding; I hope witnessing mummy’s determination and perseverance inspired
you to follow your dreams no matter what. To my lovely mum and dad, sister and brother: my
warmest thanks to you for always believing in me and for your unwavering support.
A special thanks to Associate Professor Gavin Pereira for his kind advice and comments in the final
year of this PhD research.
I also wish to thank the staff at the Western Australian Data Linkage Branch, the Data Custodians
at WA Department of Health, and the people of Western Australia for the data used in this study.
This research was supported by the Australian Government Research Training Program (RTP)
scholarship, a UWA Postgraduate Award and UWA top-up scholarship and from July 2016 to Dec
2016 by a Gordon King top-up scholarship.
This research was funded by a Red Nose (formerly SIDS and Kids) grant (0060/2017).

PAGE | vii
AUTHORSHIP DECLARATION: CO-AUTHORED PUBLICATIONS
This thesis contains work that has been published and/or submitted for publication.
Details of the work: Stillbirth in Western Australia, 2005-2013: the influence of maternal migration and ethnic origin
Location in thesis: Chapter 4
Student contribution to work: 95%: Acquisition of ethics approval, feasibility letter and data from Department of Health, conceptualising the study, analysing data, interpreting results, drafting the manuscript, acquiring pre-submission approvals from the Data Linkage Branch (DLB) and data custodians, revising the paper according to the advice of DLB, data custodians, supervisors and journal’s reviewers and completing the process of submission to journals.
Co-author signatures and dates:
David Preen
Craig Pennel
Details of the work: Healthcare factors associated with the risk of antepartum and intrapartum stillbirth in migrants in Western Australia (2005–2013)
Location in thesis: Chapter 5
Student contribution to work: 95%: Acquisition of ethics approval, feasibility letter, and data from the Department of Health, conceptualising the study, analysing data, interpreting results, drafting the manuscript, acquiring pre-submission approvals from the Data Linkage Branch (DLB) and data custodians, revising the paper according to the advice of DLB, data custodians, supervisors and journal’s reviewers and completing the process of submission to journals.
Co-author signatures and dates:
Craig Penn
David Pree

PAGE | viii
Details of the work: The influence of acculturation on the risk of stillbirth in migrant women residing in Western Australia
Location in thesis: Chapter 6
Student contribution to work: 95%: Acquisition of ethics approval, feasibility letter and data from Department of Health, conceptualising the study, analysing data, interpreting results, drafting the manuscript, acquiring pre-submission approvals from the Data Linkage Branch (DLB) and data custodians, revising the paper according to the advice of DLB, data custodians, supervisors and journal’s reviewers and completing the process of submission to journals.
Co-author signatures and dates:
David Pre
Craig Pen
Details of the work: Migration, ethnicity and the risk of low birthweight and preterm birth in Australia
Location in thesis: Chapter 7
Student contribution to work: 95%: Acquisition of ethics approval, feasibility letter and data from Department of Health, conceptualising the study, analysing data, interpreting results, drafting the manuscript, acquiring pre-submission approvals from the Data Linkage Branch (DLB) and data custodians, revising the paper according to the advice of DLB, data custodians, supervisors and journal’s reviewers and completing the process of submission to journals.
Co-author si
David Preen
Gavin Pereir
Craig Penne

PAGE | ix
Details of the work: Acculturation, preterm birth and low birthweight in Western Australia
Location in thesis: Chapter 8
Student contribution to work: 95%: Acquisition of ethics approval, feasibility letter and data from Department of Health, conceptualising the study, analysing data, interpreting results, drafting the manuscript, acquiring pre-submission approvals from the Data Linkage Branch (DLB) and data custodians, revising the paper according to the advice of DLB, data custodians, supervisors and journal’s reviewers and completing the process of submission to journals.
Co-author signatures and dates:
David Pree
Gavin Perei
Craig Penn
Student signatureDate:16/08/2020
I, David Preen, certify that the student’s statements regarding their contribution to each of the works listed above are correct.
Coordinating supervisor signatuDate: 17/08/2020

PAGE | x
OUTPUTS ARISING FROM THIS THESIS
PUBLISHED JOURNAL ARTICLES
1. Mozooni M, Preen DB, Pennell CE. Stillbirth in Western Australia, 2005–2013: the influence of
maternal migration and ethnic origin. Med J Aust. 2018;209(9):394–400. PubMed PMID:
30282563.
2. Mozooni M, Pennell CE, Preen DB. Healthcare factors associated with the risk of antepartum
and intrapartum stillbirth in migrants in Western Australia (2005–2013): A retrospective
cohort study. PLoS Med Journal Translated Name PLoS Medicine. 2020;17(3):e1003061. doi:
https://doi.org/10.1371/journal.pmed.1003061
3. Mozooni M, Preen DB, Pennell CE. The influence of acculturation on the risk of stillbirth in
migrant women residing in Western Australia. PLoS One. 2020;15(4):e0231106. doi:
10.1371/journal.pone.0231106. PubMed PMID: 32240255
SUBMITTED JOURNAL ARTICLES
4. Mozooni M, Pereira G, Preen DB, Pennell CE. Migration, ethnicity and the risk of low
birthweight and preterm birth in Australia: A linked health data study. International Journal of
Epidemiology. Under Review (submitted: May 2020)
5. Mozooni M, Pereira G, Preen DB, Pennell CE. The influence of acculturation on the risk of
preterm birth and low birthweight in Western Australia. PLoS One (Submitted: Sep 2020)
PUBLISHED JOURNAL ABSTRACTS
6. Mozooni, M., Preen, D., & Pennell, C. (2018). The ‘Healthy Migrant Phenomenon’: how long
does it last? European Journal of Public Health, 28(suppl_1), cky047.001.
https://doi.org/10.1093/eurpub/cky047.001
7. Mozooni, M., Preen, D., & Pennell, C. (2018). Modifiable factors for increased risk of
antepartum and intrapartum stillbirth in migrants and non‐Caucasian ethnicities. Journal of
Paediatrics and Child Health, 54(S1), 37–37.
8. Mozooni, M., Preen, D. & Pennell, C., 2018, Risk of preterm birth and low birthweight in first
and later generations of migrants. Journal of Paediatrics and Child Health, 54(S1), 95–95.
9. Mozooni, M., Pennell, C. & Preen, D. (2014). Ethnicity and intrapartum stillbirth in Western
Australia. Journal of Paediatrics and Child Health, 50(Suppl 1), 24.
PAGE | xi
CONFERENCE PRESENTATIONS
10. WA Social Research Network, Insights to Action, Perth, 2019
11. Australasian Epidemiological Association Annual Meeting, Perth, 2018
12. 1st World Congress on Migration, Ethnicity, Race and Health, Edinburgh, 2018
13. Perinatal Society of Australia and New Zealand Congress, Auckland, 2018 (oral)
14. Perinatal Society of Australia and New Zealand Congress, Auckland, 2018 (Poster)
15. World Congress on Public Health, Melbourne, 2017
16. Perinatal Society of Australia and New Zealand Congress, Perth, 2014
PUBLISHED PODCAST
17. Swannell C. Stillbirth and ethnic origin, with Dr Maryam Mozooni. In: MJA Podcasts Episode
85, editor. Medical Journal of Australia. 2018.
INVITED GUEST SPEAKER PRESENTATIONS
18. UWA School of Biomedical Sciences: IMED2208 Issues in Women's Reproductive Health-Guest
Lecturer, Perth, 2020
19. UWA School of Social Sciences: Social Research and Health, Health Update Forum, Perth, 2019
20. Department of Nursing and Midwifery Education and Research- King Edward Memorial
Hospital, Perinatal Loss Study Day, Perth, 2019
21. Centre for Research Excellence in Stillbirth- National Stillbirth Forum, Brisbane, 2019
22. Department of Nursing and Midwifery Education and Research- King Edward Memorial
Hospital, Cultural Diversity Study Day, Perth, 2019
23. UWA School of Social Sciences: Migrant and Refugee Health and Mental Health:
Contemporary Social Issues, Contemporary Responses, Perth, 2019
24. Red Nose Inaugural Research Series, Melbourne, 2018
25. Preterm Birth International Collaborative Meeting, Florence Italy, 2016
26. Preterm Birth International Collaborative Meeting, Florence Italy, 2015
27. King Edward Memorial Hospital Community Advisory Council Meeting, Perth, 2013

PAGE | xii
AWARDS/FUNDING RELATED TO THIS THESIS
28. Stillbirth Centre of Research Excellence Travel Funding: Guest speaker at National Stillbirth
Forum & Refugee and Migrant Advisory Group Meeting Aug 2019
29. Research Impact Grant, The University of Western Australia, Dec 2018
30. Red Nose Travel Funding: Guest speaker at Inaugural Red Nose Research Series Dec 2018
31. Australasian Epidemiology Association Student Award (AEA) Oct 2018
32. Group of Eight and Australian Council of Social Service (ACOSS) Bursary Oct 2017
33. Red Nose & Cure Kids research grant: Migration, acculturation and the risk of stillbirth in
Western Australia 2017-2019
34. Professor Gordon King travel funding for attending World Congress on Public Health 2017
35. UWA-Graduate Research School travel award for attending Preterm Birth International
Collaborative 2016
36. Professor Gordon King Scholarship, Women and Infants Research Foundation July 2016
ADVOCACY WORK RELATED TO THIS THESIS
37. Submission to the Australian Government National Stillbirth Action and Implementation Plan-
Public Consultation
38. Rapid Response: Leaving no one behind: Where are 2.6 million stillbirths? 08 Feb 2020 in BMJ.
Available from https://www.bmj.com/content/368/bmj.l6986/rr
39. Workshop organised for health professionals: Preventing Stillbirth in Migrant and CaLD
Population of Western Australia, Oct 2019
40. RED NOSE. Researcher spotlight: my vision for a future with zero stillbirth. Aug 2019.
Interview with Dr Maryam Mozooni. Available from: https://rednose.org.au/news/researcher-
spotlight-my-vision-for-a-future-with-zero-stillbirth.
41. Submission (No.40) to the Australian Senate Inquiry into stillbirth, Jul 2018. Available from
https://www.aph.gov.au/Parliamentary_Business/Committees/Senate/Stillbirth_Research_an
d_Education/Stillbirth/Submissions
42. Blog Post: Maryam Mozooni. Stillbirth, Migration and Ethnicity: The Bells Toll For Thee,
Healthy Newborn Network, Oct 2017. Available from
https://www.healthynewbornnetwork.org/blog/stillbirth-migration-ethnicity-bells-toll-thee/

PAGE | xiii
MEDIA COVERAGE RELATED TO THIS THESIS
43. Jess Reid, Migrant women at risk of stillbirth during first two years in Australia. University
News. 3 April 2020 http://www.news.uwa.edu.au/2020040311967/research/migrant-women-
risk-stillbirth-during-first-two-years-australia
44. Jess Reid, Early care key to preventing stillbirth in migrant women. Medical Xpress. 18 March
2018 https://medicalxpress.com/news/2020-03-early-key-stillbirth-migrant-women.html
45. Jess Reid, Study finds migrant women are more at risk of stillbirth. Medical Xpress. 8 October
2018 https://medicalxpress.com/news/2018-10-migrant-women-stillbirth.html
46. Cate Swannell, Stillbirth more common in non-white migrant women. The MJA, Oct 2018
https://www.mja.com.au/system/files/2018-10/FINAL%208%20OCT%20STILLBIRTHS%20.pdf
47. Charlotte Mitchell, Stillbirths high for migrant women, MJA InSight Plus. Issue 39 / October
2018 https://insightplus.mja.com.au/2018/39/stillbirths-high-for-migrant-women/

PAGE | xiv
TABLE OF CONTENTS
THESIS DECLARATION I
ABSTRACT II
ACKNOWLEDGEMENTS VI
AUTHORSHIP DECLARATION: CO-AUTHORED PUBLICATIONS VII
OUTPUTS ARISING FROM THIS THESIS X
TABLE OF CONTENTS XIV
LIST OF TABLES XIX
LIST OF FIGURES XXI
LIST OF ABBREVIATIONS XXIII
CHAPTER 1. INTRODUCTION 1
OVERVIEW AND RATIONALE 1 1.1
SIGNIFICANCE OF THE STUDY 3 1.2
AIMS AND OBJECTIVE OF THIS THESIS 3 1.3
ROLE OF THE PHD CANDIDATE IN THE PROJECT 4 1.4
STRUCTURE OF THE THESIS 5 1.5
CHAPTER 2. REVIEW OF THE LITERATURE 6
EPIDEMIOLOGY OF PERINATAL MORTALITY, PRETERM BIRTH AND LOW BIRTHWEIGHT 6 2.1
Perinatal mortality 7 2.1.1
2.1.1.1 Stillbirth 9
2.1.1.2 Neonatal death 12
Preterm birth 13 2.1.2
Low birthweight 16 2.1.3
MIGRATION, ACCULTURATION AND ETHNICITY 19 2.2
Assimilation and acculturation 20 2.2.1
2.2.1.1 Language 21
2.2.1.2 Age on arrival 22
2.2.1.3 Length of residence 22
2.2.1.4 Intermarriage 22
Migrant populations in Australia and WA 23 2.2.2
Ethnic origin in WA 24 2.2.3
HEALTHCARE USE AND HEALTH OUTCOMES OF MIGRANT 25 2.3
Pregnancy and childbirth outcomes of migrant populations 27 2.3.1
Pattern of health service utilisation 31 2.3.2
Acculturation and pregnancy outcomes 38 2.3.3
SUMMARY 42 2.4
CHAPTER 3. GENERAL METHODS 45
DATA SOURCES 45 3.1
Routinely collected administrative health data 45 3.1.1
Data linkage 45 3.1.2

PAGE | xv
WA DATA LINKAGE SYSTEM 46 3.2
History 47 3.2.1
Strength of the WA Data Linkage System 48 3.2.2
Record linkage, extraction and data release process 48 3.2.3
Privacy and security 51 3.2.4
Data collections 51 3.2.5
Geocoding 52 3.2.6
Genealogical linkage 54 3.2.7
DATA APPLICATION AND PROJECT MANAGEMENT 55 3.3
Feasibility assessment 56 3.3.1
Ethical review and approval for data release 56 3.3.2
Datasets used for this study 57 3.3.3
3.3.3.1 Midwives Notification System 58
3.3.3.2 Birth & death registrations and family connections 59
3.3.3.3 Hospital Morbidity Data System 59
3.3.3.4 WA Register of Developmental Anomalies 60
3.3.3.5 Indigenous status flag 60
Exposures ascertainment 61 3.3.4
Outcomes ascertainment 62 3.3.5
Sample size and power 63 3.3.6
Ethics approval 63 3.3.7
Data analysis 64 3.3.8
CHAPTER 4. STILLBIRTH, MIGRATION AND ETHNIC ORIGIN IN WESTERN AUSTRALIA 65
ABSTRACT 66 4.1
INTRODUCTION 66 4.2
METHODS 67 4.3
Study design and participants 67 4.3.1
Data sources and linkage 67 4.3.2
Exposures 68 4.3.3
Outcomes 68 4.3.4
Statistical analysis 69 4.3.5
Ethics approval 69 4.3.6
RESULTS 70 4.4
DISCUSSION 79 4.5
Limitations 81 4.5.1
Conclusion 81 4.5.2
CHAPTER 5. HEALTHCARE USE AND STILLBIRTH IN MIGRANTS IN WESTERN AUSTRALIA 82
ABSTRACT 83 5.1
INTRODUCTION 84 5.2
METHODS 85 5.3
Study Design and Participants 85 5.3.1
Data Sources and Linkage 85 5.3.2
PAGE | xvi
Exposures 86 5.3.3
Outcomes 87 5.3.4
Other variables 87 5.3.5
Statistical analysis 88 5.3.6
Sensitivity analyses 89 5.3.7
Ethics approval 90 5.3.8
RESULTS 90 5.4
Antepartum stillbirth 97 5.4.1
Intrapartum stillbirth 97 5.4.2
Antenatal care 103 5.4.3
Birth attendant and intrapartum care 104 5.4.4
Interpreter service 105 5.4.5
Controlling for the effect of LBW and PTB 106 5.4.6
Private health Insurance 106 5.4.7
Sensitivity analysis 106 5.4.8
DISCUSSION 106 5.5
Other findings 109 5.5.1
Generalisability and clinical relevance 110 5.5.2
Strength 110 5.5.3
Limitations 110 5.5.4
Conclusion 111 5.5.5
ACKNOWLEDGMENTS 112 5.6
CHAPTER 6. ACCULTURATION AND STILLBIRTH IN WESTERN AUSTRALIA 113
ABSTRACT 114 6.1
INTRODUCTION 115 6.2
METHODS 116 6.3
Study Design and Participants 116 6.3.1
Data Sources 116 6.3.2
Exposure and outcome variables 117 6.3.3
Statistical analysis 117 6.3.4
RESULTS 118 6.4
The overall level of acculturation 126 6.4.1
DISCUSSION 127 6.5
Strength and limitations 130 6.5.1
Implications and generalisability 130 6.5.2
CHAPTER 7. PRETERM BIRTH AND LOW BIRTHWEIGHT IN RELATION TO MIGRATION AND ETHNICITY IN WESTERN AUSTRALIA 132
ABSTRACT 133 7.1
INTRODUCTION 134 7.2
METHODS 135 7.3
Study population and data sources 135 7.3.1
Variables 136 7.3.2

PAGE | xvii
Statistical methods 137 7.3.3
RESULTS 138 7.4
Sensitivity analysis 147 7.4.1
DISCUSSION 147 7.5
Low birthweight 147 7.5.1
Preterm birth 148 7.5.2
Strengths and limitations 149 7.5.3
CHAPTER 8. ACCULTURATION, PRETERM BIRTH AND LOW BIRTHWEIGHT IN WESTERN AUSTRALIA 151
ABSTRACT 152 8.1
INTRODUCTION 153 8.2
METHODS 154 8.3
Study population and data sources 154 8.3.1
Variables 154 8.3.2
Statistical methods 156 8.3.3
RESULTS 156 8.4
Descriptive analysis 156 8.4.1
Acculturative factors 157 8.4.2
Level of acculturation 164 8.4.3
DISCUSSION 165 8.5
Low birthweight 165 8.5.1
Preterm birth 167 8.5.2
Strengths and limitations 169 8.5.3
CHAPTER 9. DISCUSSION AND FUTURE DIRECTION 171
FINDINGS 171 9.1
Stillbirth 171 9.1.1
Preterm birth 174 9.1.2
Low birthweight 176 9.1.3
STRENGTHS AND LIMITATIONS 177 9.2
IMPLICATIONS FOR POLICY AND PRACTICE 178 9.3
RESEARCH TRANSLATION, IMPACT AND DIRECTION FOR FUTURE RESEARCH 180 9.4
REFERENCES 183
APPENDICES 211
APPENDIX 1. PROJECT FEASIBILITY APPROVAL 212
APPENDIX 2. ETHICAL APPROVAL 214
APPENDIX 3. FINAL PROJECT APPROVAL 216
APPENDIX 4. UWA NOTIFICATION OF ETHICS APPROVAL FROM ANOTHER ETHICS COMMITTEE 217
APPENDIX 5. PUBLISHED PAPER 1 (CHAPTER 4) 218
APPENDIX 6. PAPER 1- ONLINE APPENDIX 225
APPENDIX 7. PUBLISHED PAPER 2 (CHAPTER 5) 227
APPENDIX 8. PAPER 2- SUPPORTING INFORMATION 252
APPENDIX 9. PUBLISHED PAPER 3 (CHAPTER 6) 255

PAGE | xviii
APPENDIX 10. MIDWIVES NOTIFICATIONS DATA APPLICATION VARIABLE LISTS 271
APPENDIX 11. BIRTH DATA APPLICATION VARIABLE LIST 277
APPENDIX 12. MORTALITY DATA APPLICATION VARIABLE LIST 280
APPENDIX 13. HOSPITAL MORBIDITY DATA APPLICATION VARIABLE LIST 285
APPENDIX 14. WARDA BIRTH DEFECTS DATA APPLICATION VARIABLE LIST 290
APPENDIX 15. FAMILY CONNECTIONS APPLICATION FORM 293

PAGE | xix
LIST OF TABLES
TABLE 2.1 CRITERIA FOR REGISTRATION OF BIRTH AND PERINATAL DEATH INTERNATIONALLY 9
TABLE 2.2 PSYCHOSOCIAL IMPACTS IN EACH STAGE OF MIGRATION 20
TABLE 2.3 AUSTRALIA'S POPULATION BY COUNTRY OF BIRTH - 2019A 23
TABLE 3.1 DATASETS AND VARIABLES 58
TABLE 4.1 PREGNANCY OUTCOMES FOR 260 997 LIVE AND STILLBIRTHS IN WESTERN AUSTRALIA, 2005–
2013, BY MATERNAL ETHNIC ORIGIN 71
TABLE 4.2 CHARACTERISTICS OF MOTHERS FOR 260 997 LIVE AND STILLBIRTHS IN WESTERN AUSTRALIA,
2005–2013, BY MATERNAL ETHNIC ORIGIN 73
TABLE 4.3 PREVALENCE OF STILLBIRTHS IN WESTERN AUSTRALIA, 2005–2013, BY ETHNIC ORIGIN OF
MOTHER AND TYPE OF STILLBIRTH 76
TABLE 4.4 STILLBIRTH IN WESTERN AUSTRALIA, 2005–2013: COMPARISON OF MIGRANT WOMEN, BY
ETHNIC ORIGIN, WITH AUSTRALIAN-BORN WOMEN 77
TABLE 5.1 DEMOGRAPHIC CHARACTERISTICS OF THE STUDY POPULATION 91
TABLE 5.2 OBSTETRIC CHARACTERISTICS OF THE STUDY POPULATION 94
TABLE 5.3 LOGISTIC REGRESSION MODEL AND THE FACTORS ASSOCIATED WITH ANTESB (2005–2013) 98
TABLE 5.4 LOGISTIC REGRESSION MODEL AND THE FACTORS ASSOCIATED WITH INTRASB (2005–2013) 100
TABLE 5.5 COMPARISON OF ANTEPARTUM STILLBIRTH IN MIGRANT WOMEN, STRATIFIED BY ETHNICITY
AND TIMING OF 1ST ANTENATAL CARE VISIT, WITH AUSTRALIAN-BORN WOMEN (2010–2013) 104
TABLE 6.1 CHARACTERISTICS OF THE POPULATION OF THE STUDY 120
TABLE 6.2 ABSOLUTE NUMBERS, RATES, AND UNADJUSTED ODDS RATIOS OF STILLBIRTH FOR MIGRANTS,
STRATIFIED BY ACCULTURATIVE FACTORS, COMPARED WITH THE AUSTRALIAN-BORN
POPULATION 123
TABLE 6.3 LENGTH OF RESIDENCE AND THE ODDS OF STILLBIRTH IN MIGRANTS FROM SPECIFIC ETHNIC
BACKGROUNDS COMPARED TO THE AUSTRALIAN-BORN POPULATION 124
TABLE 7.1 DEMOGRAPHIC CHARACTERISTICS OF THE STUDY POPULATION 139
TABLE 7.2 CUMULATIVE INCIDENCE OF LBW AND PTB FOR BIRTHS TO AUSTRALIAN-BORN WOMEN AND
BIRTHS TO OVERSEAS-BORN WOMEN STRATIFIED BY ETHNIC BACKGROUND (2005–2013) 141
TABLE 7.3 ODDS OF PTB AND TERM-LBW IN AUSTRALIAN-BORN AND MIGRANT WOMEN FROM NON-WHITE
BACKGROUNDS COMPARED TO WHITE AUSTRALIAN-BORN WOMEN (2005–2013) 143
TABLE 7.4 RISK OF SPONTANEOUS AND MEDICALLY INDICATED PTB IN MIGRANTS FROM DIVERSE ETHNIC
BACKGROUNDS COMPARED TO THE WHITE AUSTRALIAN-BORN POPULATION (2005–2013) 144
TABLE 7.5 RISKS OF TERM-LBW AND PTB FOR MIGRANTS COMPARED WITH AUSTRALIAN-BORN
POPULATION FROM THE SAME ETHNIC GROUP 146
TABLE 8.1 CHARACTERISTICS OF THE STUDY POPULATION 159
TABLE 8.2 COMPARISON OF TERM-LBW AND PTB IN MIGRANTS, STRATIFIED BY ACCULTURATIVE FACTORS,
WITH AUSTRALIAN-BORN WOMEN 162
TABLE 8.3 COMPARISON OF TERM-LBW AND PTB IN MIGRANT AND AUSTRALIAN-BORN WOMEN
ACCORDING TO THE ACCULTURATION LEVEL OF MIGRANT WOMEN 164

PAGE | xx
PAGE | xxi
LIST OF FIGURES
FIGURE 2.1 DEFINITION OF THE PERINATAL PERIOD AND PERINATAL DEATH 6
FIGURE 2.2 INFANT MORTALITY RATES IN WESTERN AUSTRALIA 13
FIGURE 2.3 OBSTETRIC PRECURSORS OF PRETERM BIRTH 15
FIGURE 2.4 LOW BIRTH WEIGHT TREND IN WA 18
FIGURE 2.5 MAIN DETERMINANTS OF HEALTH 26
FIGURE 3.1 PERSON-BASED LINKAGES 47
FIGURE 3.2 DATA LINKAGE PROCESS 49
FIGURE 3.3 DATA EXTRACTION PROCESS 50
FIGURE 3.4 DATA COLLECTIONS (AS OF SEPTEMBER 2014) 52
FIGURE 3.5 GEOCODING AT THE WA DATA LINKAGE BRANCH 53
FIGURE 3.6 WA FAMILY CONNECTIONS SYSTEM 55
FIGURE 3.7 INDIGENOUS STATUS FLAG 61
FIGURE 4.1 PRETERM (20–36 WEEKS) STILLBIRTHS IN WESTERN AUSTRALIA, 2005–2013, BY ETHNIC ORIGIN
OF MOTHER 78
FIGURE 4.2 TERM AND POST-TERM (≥37 WEEKS) STILLBIRTHS IN WESTERN AUSTRALIA, 2005–2013, BY
ETHNIC ORIGIN OF MOTHER 79
FIGURE 5.1 GEOGRAPHICAL LOCATION OF THE PRIVATE AND PUBLIC HOSPITALS IN WESTERN AUSTRALIA. 86
FIGURE 5.2 GESTATIONAL AGE AT FIRST ANTENATAL CARE VISIT FOR SPECIFIED ETHNICITY GROUPS IN
COMPARISON TO THE AUSTRALIAN-BORN POPULATION (2010–2013) 103
FIGURE 5.3 CUMULATIVE INCIDENCE RATE OF INTRAPARTUM STILLBIRTH (POST 23 WEEKS GESTATION) BY
ACCOUCHEUR PROVIDING INTRAPARTUM CARE (2005–2013). 105
FIGURE 5.4 CUMULATIVE INCIDENCE RATE OF OVERALL STILLBIRTH ACCORDING TO INTERPRETER SERVICE
USE (2005–2013) 105
FIGURE 6.1 LENGTH OF RESIDENCE IN RELATION TO UTILISATION OF INTERPRETER, HAVING AN AUSTRALIAN-
BORN PARTNER, SMOKING IN PREGNANCY AND RATE OF STILLBIRTH IN THE MIGRANT
POPULATION OF WESTERN AUSTRALIA (2005–2013) 123
FIGURE 6.2 LENGTH OF RESIDENCE IN AUSTRALIA AND PERCENTAGE OF HAVING PRIVATE HEALTH
INSURANCE FOR MIGRANT WOMEN FROM SPECIFIC ETHNIC BACKGROUNDS DELIVERED IN WA
(2005–2013) 125
FIGURE 6.3 LENGTH OF RESIDENCE IN AUSTRALIA AND PERCENTAGE OF HAVING AN AUSTRALIAN-BORN
PARTNER FOR MIGRANT WOMEN FROM SPECIFIC ETHNIC BACKGROUNDS DELIVERED IN WA
(2005–2013) 126
FIGURE 6.4 LENGTH OF RESIDENCE IN AUSTRALIA AND THE PERCENTAGE OF UTILISATION OF INTERPRETER
FOR MIGRANT WOMEN FROM SPECIFIC ETHNIC BACKGROUNDS DELIVERED IN WA (2005–2013) 126
FIGURE 8.1 TERM-LBW RATE BY ETHNICITY OF MIGRANTS AND LENGTH OF RESIDENCE IN AUSTRALIA (2005–
2013) 163
FIGURE 8.2 ALL PTB RATE BY ETHNICITY OF MIGRANTS AND LENGTH OF RESIDENCE IN AUSTRALIA (2005–
2013) 163

PAGE | xxii

PAGE | xxiii
LIST OF ABBREVIATIONS
ANC antenatal care
AnteSB antepartum stillbirth
aOR adjusted odds ratio
ARIA Accessibility/Remoteness Index of Australia
BMI body mass index
CaLD Culturally and Linguistically Diverse
CS caesarean section
DLB data linkage branch
FGR fetal growth restriction
HIC high-income country
HMDC Hospital Morbidity Data Collection
IntraSB intrapartum stillbirth
IRSD Index of Relative Socioeconomic Disadvantage
LBW low birthweight
LMIC low- to middle-income country
MNS Midwives Notification System
MDG Millennium Development Goals
NPDC National Perinatal Data Collection
OR odds ratio
PPROM preterm pre-labour rupture of membranes
PTB preterm birth
RRR Relative Risk Ratio
SB stillbirth
SEIFA Socio-Economic Indexes For Areas
UK United Kingdom
US United States
WA Western Australia
WADLS WA Data Linkage System
WARDA WA Registry of Developmental Anomalies
WHO World Health Organization

CHAPTER 1. INTRODUCTION
PAGE | 1
CHAPTER 1. INTRODUCTION
OVERVIEW AND RATIONALE 1.1
Differences in access to reproductive health services across countries are well known.1-6 Low- and
middle-income countries often report suboptimal reproductive health indicators, such as maternal
and perinatal mortality, which have been attributed to a lack of access to quality obstetric care
and interventions.7,8 However, adverse reproductive outcomes and ethnic disparities in the risk of
such outcomes are still observed in high-income countries despite the availability of high-standard
pregnancy care and perinatal interventions.9-11
The United Nations (UN) International Migration Report 2013 indicated that there were 232
million international migrants in 2013, of whom almost 60% lived in developed countries.12
Previous research also revealed significant differences among migrants and resettlement
countries’ populations in terms of utilisation of reproductive services and reproductive outcomes;
however, findings are inconsistent across jurisdictions.11,13
The evidence suggests that service availability and access are not the only determinants of optimal
health outcomes and the utilisation of such services could be influenced by different
circumstances and decision making of both health professionals and patients.9,14-17 Such decision
making could be influenced by a range of sociocultural factors that are subsequently associated
with clinical outcomes.16,17
The level of health service engagement could affect the incidence of various reproductive
outcomes. For example, medically indicated induction of labour and caesarean section (CS) are
two medical procedures that have the potential to reduce mortality (maternal or infant) in some
situations; however, these procedures have been associated with an increased rate of preterm
birth.18 Anecdotal evidence and research from the United States (US) suggest that such obstetric

CHAPTER 1. INTRODUCTION
PAGE | 2
services are viewed differently by women from different ethnic backgrounds, which has the
potential to influence the risk of outcomes from provision (or lack) of such services.19
Reproductive health is vital to the sustainable development of societies worldwide. However,
disparities are conspicuous and achieving universal access has been aimed and repeatedly
emphasised by the World Health Organization (WHO).
The pregnancy period is especially an important window in an individual’s life, during which health
status, events and infant genetic programming may determine the later status of health and
disease experienced along the lifespan.20 Pregnancy-related health service utilisation and prenatal
care, as such, are pivotal for both mother’s and the offspring’s health and to ensure sustainable
development of the population, society, and economy.
Immigration is the principal component of population growth in Australia, and one-third of
Australian women who give birth are born overseas.21,22 Yet, ethnicity as a predictor of pregnancy
outcomes has received limited attention to date, and the status of reproductive health in migrants
in Australia has not been explored thoroughly.
According to figures released in December 2013 by the Australian Bureau of Statistics, one-third of
Western Australia (WA)’s population was born overseas—the highest proportion of any Australian
state or territory—and this population has increased by 39% since 2006.21
Most of the literature from WA, on ethnicity and pregnancy outcomes, pre-dated 200523-25 and
arguably do not represent the current composition of the Australian population given the changes
in demographic profile across time. Much of this work focused primarily on disparities among
Aboriginal and non-Aboriginal populations,25 and considered only a small number of ethnicities or
a small number of outcomes.26 Consequently, the association between major adverse pregnancy

CHAPTER 1. INTRODUCTION
PAGE | 3
outcomes such as preterm birth (PTB), low birthweight (LBW), and perinatal mortality and migrant
status or ethnicity is not very well known in Australia and completely unknown in WA settings.
SIGNIFICANCE OF THE STUDY 1.2
Using the WA Data Linkage System (WADLS)—which facilitates the capture of health service
contact, events and outcomes through multiple datasets across the WA—this project
comprehensively investigated the current utilisation of health services and pregnancy outcomes of
women in an Australian setting in relation to migrant status and ethnicity.
This study determined the current status of reproductive health, disparities in pregnancy
outcomes across ethnic groups, usage of pregnancy-related services and their impact on
pregnancy outcomes in different communities in the WA population. The availability of such
information will enhance targeting of modifiable factors, planning of appropriate policies and
implementation of required preventive measures or interventions to improve outcomes in these
populations and, consequently, the overall reproductive health of the population. Eventually, this
work will reduce the burden of adverse pregnancy outcomes and pregnancy-related healthcare
expenditure in the community.
AIMS AND OBJECTIVE OF THIS THESIS 1.3
This study explored the patterns of utilisation of pregnancy-related medical services, pregnancy
care, procedures and treatments in association with pregnancy and perinatal outcomes in WA
with a focus on migrants from 2005 onwards. The specific aims were:
Aim 1: To investigate prevalence rates and the risk of antepartum and intrapartum stillbirth
in WA with respect to maternal country of birth and ethnic origin.
Aim 2: To investigate the pattern of healthcare utilisation among migrant women and its
relationship with the risk of stillbirth (antepartum and intrapartum) in WA.

CHAPTER 1. INTRODUCTION
PAGE | 4
Aim 3: To investigate the influence of acculturation on disparities observed in the risk of
stillbirth between migrant and Australian-born populations in WA.
Aim 4: To investigate ethnic disparities in the risk of low birthweight (LBW) and preterm
birth (PTB), spontaneous and medically indicated, between migrant and Australian-born
populations from diverse ethnic backgrounds in WA.
Aim 5: To investigate the influence of acculturation on disparities observed in the risk of
PTB and LBW between migrant and Australian-born populations from diverse ethnic backgrounds
in WA.
The three hypotheses tested were that: (1) migrant women, especially those from non-English-
speaking countries, use available pregnancy-related health services in WA at lower rates than
Australian-born women; (2) migrant women have poorer perinatal outcomes than their
Australian-born counterparts; and (3) acculturation (i.e. age on arrival, length of residence in
Australia, language proficiency and inter-racial partnership) can mitigate these effects.
ROLE OF THE PHD CANDIDATE IN THE PROJECT 1.4
This project was entirely a PhD research project conceptualised by the PhD candidate and refined
according to the feedback and advice received from the supervisors. All tasks for developing the
study, acquiring the required approvals and funding, and completing the processes involved from
initial liaison with the DLB and data custodians, completion of application forms, provision of data,
data analyses, writing manuscripts to publishing manuscripts were done solely by the PhD
candidate with guidance and direction from the supervisors. The manuscripts were finalised
according to supervisor feedback, comments from data linkage staff and data custodians, and
eventually in response to the comments received from the journal’s editors and reviewers.

CHAPTER 1. INTRODUCTION
PAGE | 5
STRUCTURE OF THE THESIS 1.5
This thesis is written as a series of papers. The main analyses are presented in separate chapters
as published/submitted original research journal articles following the literature review and
general methods chapters. The findings are summarised and discussed at the end of the thesis.
The literature review (Chapter 2) explores the body of knowledge for the three main themes of
this study: (1) Epidemiology of adverse pregnancy outcomes including stillbirth, preterm birth and
low birthweight; (2) Migration, acculturation and ethnicity of the population, especially in high-
income countries and Australia; and (3) Healthcare use and health outcomes in migrants.
The General Methods (Chapter 3) outlines the sources of data and processes involved in data
acquisition. It details the WA Data Linkage System, its history, techniques used, and procedures
followed for extraction, linkage and provision of data and to maintain privacy.
Chapters 4–8 comprise five papers published or submitted to journals for publication. Each paper
explores one aim of this thesis and includes an Abstract, Introduction, Methods, Results and
Discussion sections.
Chapter 9 draws together the main findings of the thesis and synthesises the significance of the
results. It discusses findings, strengths and limitations, implications for policy and practice,
research translation, impact and direction for future research.
References and Appendices follow the chapters and include the resources used, a copy of each
published paper, the documents and application forms completed, and approvals acquired.

CHAPTER 2. LITERATURE REVIEW
PAGE | 6
CHAPTER 2. REVIEW OF THE LITERATURE
Literature relevant to the main themes of the thesis are explored and critiqued, including adverse
pregnancy outcomes, pregnancy-related medical services, patterns of care, migration and
acculturation, and relevant policies. This chapter also identifies knowledge gaps for further
research.
EPIDEMIOLOGY OF PERINATAL MORTALITY, PRETERM BIRTH AND LOW BIRTHWEIGHT 2.1
According to the Registration of Births, Deaths and Marriages Act 1963, the expulsion or extraction
of a child from its mother can be registered as a birth in Australia, if gestational age is at least 20
weeks or birthweight is at least 400 grams.27 The Australian Institute of Health and Welfare
collates data on all births in collaboration with state and territory health departments for the
National Perinatal Data Collection (NPDC).28 The NPDC covers both live births and stillbirths, where
gestational age is at least 20 weeks or birthweight is at least 400 grams (Figure 2.1). However, in
Victoria and Western Australia, births are included if gestational age is at least 20 weeks or, if it
cannot be reliably established whether the child’s period of gestation is more or less than 20
weeks, birthweight is at least 400 grams.28-30
FIGURE 2.1 DEFINITION OF THE PERINATAL PERIOD AND PERINATAL DEATH
Source: Australian Institute of Health and Welfare 2020. Stillbirths and neonatal deaths in Australia. Cat. no. PER 107.
CHAPTER 2. LITERATURE REVIEW
PAGE | 7
PERINATAL MORTALITY 2.1.1
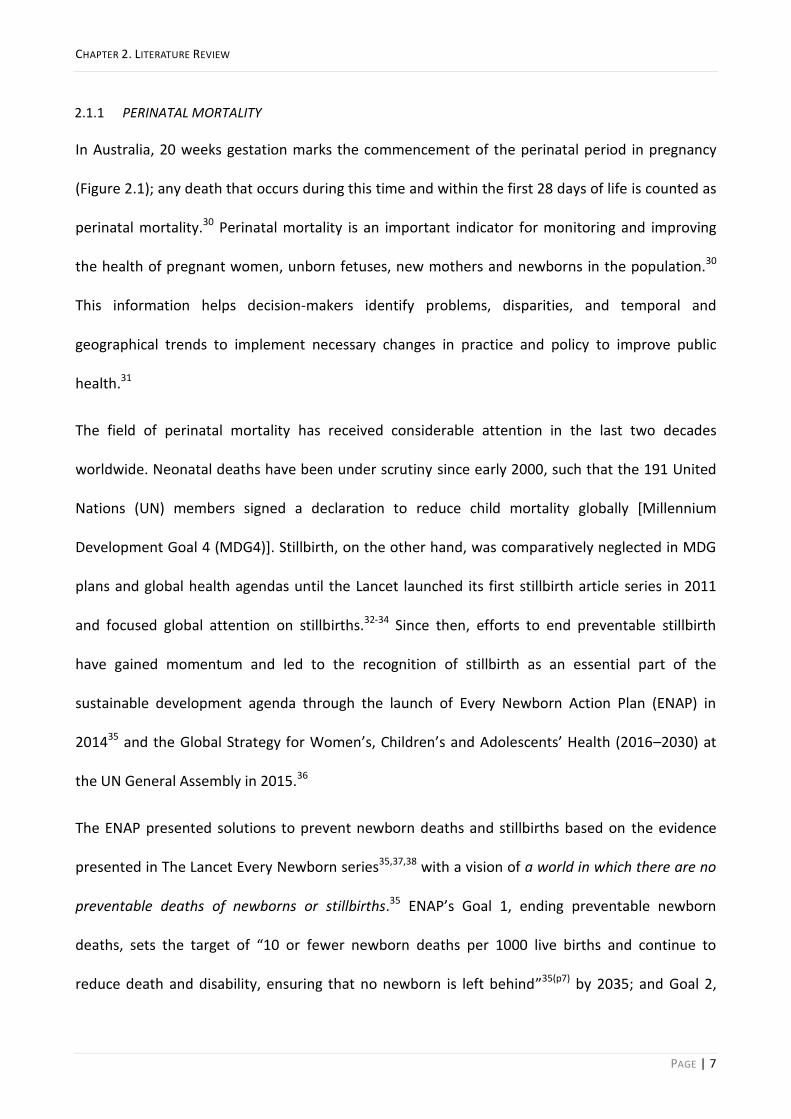
In Australia, 20 weeks gestation marks the commencement of the perinatal period in pregnancy
(Figure 2.1); any death that occurs during this time and within the first 28 days of life is counted as
perinatal mortality.30 Perinatal mortality is an important indicator for monitoring and improving
the health of pregnant women, unborn fetuses, new mothers and newborns in the population.30
This information helps decision-makers identify problems, disparities, and temporal and
geographical trends to implement necessary changes in practice and policy to improve public
health.31
The field of perinatal mortality has received considerable attention in the last two decades
worldwide. Neonatal deaths have been under scrutiny since early 2000, such that the 191 United
Nations (UN) members signed a declaration to reduce child mortality globally [Millennium
Development Goal 4 (MDG4)]. Stillbirth, on the other hand, was comparatively neglected in MDG
plans and global health agendas until the Lancet launched its first stillbirth article series in 2011
and focused global attention on stillbirths.32-34 Since then, efforts to end preventable stillbirth
have gained momentum and led to the recognition of stillbirth as an essential part of the
sustainable development agenda through the launch of Every Newborn Action Plan (ENAP) in
201435 and the Global Strategy for Women’s, Children’s and Adolescents’ Health (2016–2030) at
the UN General Assembly in 2015.36
The ENAP presented solutions to prevent newborn deaths and stillbirths based on the evidence
presented in The Lancet Every Newborn series35,37,38 with a vision of a world in which there are no
preventable deaths of newborns or stillbirths.35 ENAP’s Goal 1, ending preventable newborn
deaths, sets the target of “10 or fewer newborn deaths per 1000 live births and continue to
reduce death and disability, ensuring that no newborn is left behind”35(p7) by 2035; and Goal 2,
CHAPTER 2. LITERATURE REVIEW
PAGE | 8
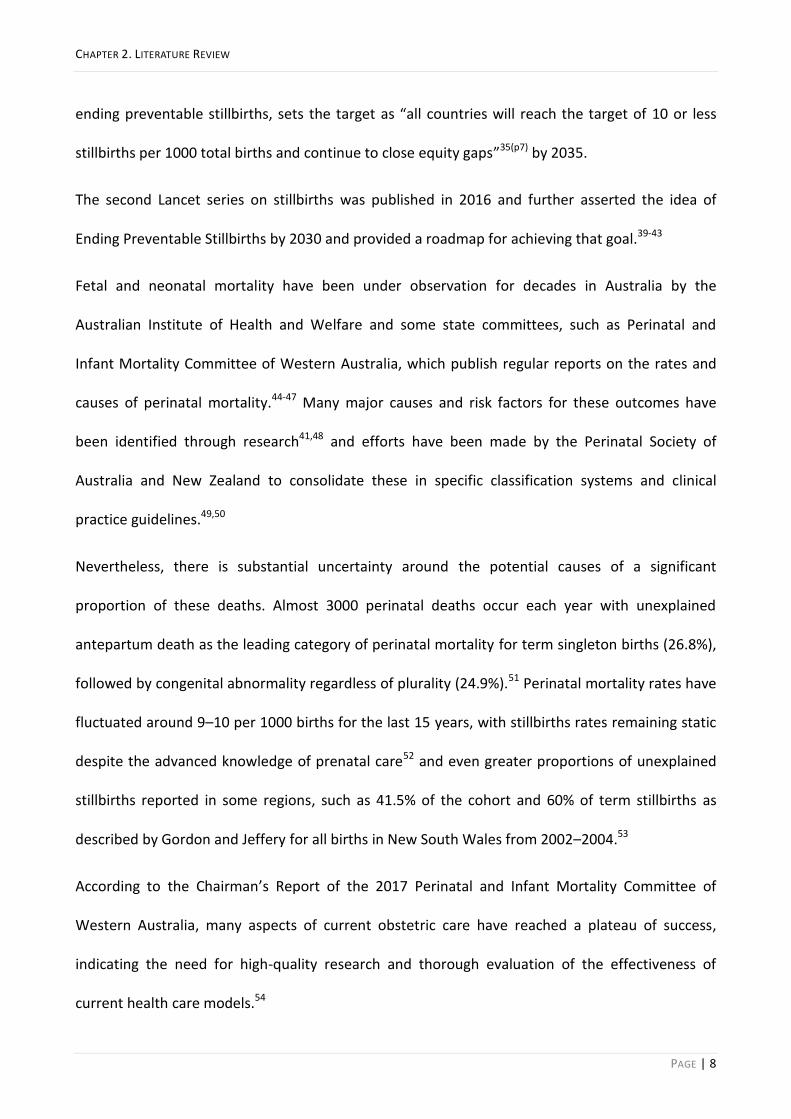
ending preventable stillbirths, sets the target as “all countries will reach the target of 10 or less
stillbirths per 1000 total births and continue to close equity gaps”35(p7) by 2035.
The second Lancet series on stillbirths was published in 2016 and further asserted the idea of
Ending Preventable Stillbirths by 2030 and provided a roadmap for achieving that goal.39-43
Fetal and neonatal mortality have been under observation for decades in Australia by the
Australian Institute of Health and Welfare and some state committees, such as Perinatal and
Infant Mortality Committee of Western Australia, which publish regular reports on the rates and
causes of perinatal mortality.44-47 Many major causes and risk factors for these outcomes have
been identified through research41,48 and efforts have been made by the Perinatal Society of
Australia and New Zealand to consolidate these in specific classification systems and clinical
practice guidelines.49,50
Nevertheless, there is substantial uncertainty around the potential causes of a significant
proportion of these deaths. Almost 3000 perinatal deaths occur each year with unexplained
antepartum death as the leading category of perinatal mortality for term singleton births (26.8%),
followed by congenital abnormality regardless of plurality (24.9%).51 Perinatal mortality rates have
fluctuated around 9–10 per 1000 births for the last 15 years, with stillbirths rates remaining static
despite the advanced knowledge of prenatal care52 and even greater proportions of unexplained
stillbirths reported in some regions, such as 41.5% of the cohort and 60% of term stillbirths as
described by Gordon and Jeffery for all births in New South Wales from 2002–2004.53
According to the Chairman’s Report of the 2017 Perinatal and Infant Mortality Committee of
Western Australia, many aspects of current obstetric care have reached a plateau of success,
indicating the need for high-quality research and thorough evaluation of the effectiveness of
current health care models.54

CHAPTER 2. LITERATURE REVIEW
PAGE | 9
There is significant variation in the inclusion criteria for the registration of fetal death, birth and
the perinatal period among jurisdictions worldwide, which makes the comparison of relevant vital
statistics difficult to some extent (Table 2.1).
TABLE 2.1 CRITERIA FOR REGISTRATION OF BIRTH AND PERINATAL DEATH INTERNATIONALLY
Institution Perinatal death
Fetal death/Stillbirth Neonatal deaths Birthweight Gestational age
World Health Organisation55
International comparison 1000 g 28 weeks <7 days
National reporting 500 g 22 weeks <7 days
Australia and the United States of America52 400 g 20 weeks <28 days
Perinatal health monitoring in Europe56 <7 days
France, Finland and the Netherlands (civil reg.)56
500 g 22 weeks
Denmark56 – 22 Weeks
Germany56 500 g –
United Kingdom57 – 24 weeks
Italy and Spain56 – 25 weeks and 5 days
Sweden and Greece56 – 28 weeks
Norway56 – 12 weeks
Netherlands (Perinatal register)56 16 weeks
2.1.1.1 Stillbirth
The International Classification of Diseases, 10th revision (ICD-10) defines stillbirth as “death prior
to the complete expulsion or extraction from its mother of a product of conception, irrespective of
the duration of pregnancy; the death is indicated by the fact that after such separation the fetus
does not breathe or show any other evidence of life, such as beating of the heart, pulsation of the
umbilical cord, or definite movement of voluntary muscles”.58
According to the WHO, for international comparisons, a birthweight cut-off value of 1000 grams is
recommended; when birthweight is not known, a gestational age threshold of 28 weeks should be
considered. However, exclusion of births with a birthweight less than 1000 grams (1000 grams

CHAPTER 2. LITERATURE REVIEW
PAGE | 10
threshold instead of 28 weeks gestation) can underestimate the health burden of stillbirth,
especially in high-income countries.59,60
Further, stillbirths are classified according to time of death and proximity to the commencement
of labour, being antepartum stillbirth for death of baby before commencement of labour, or
intrapartum stillbirth for death of baby after labour started.61
Global estimates showed that around 2.6 million stillbirths occurred in 2009, with a worldwide
rate of 18.9 stillbirths per 1000 births.34 The highest stillbirth rates were observed in South Asia
and Sub-Saharan Africa.34 India, Pakistan, Nigeria, China, Bangladesh, the Democratic Republic of
the Congo, Ethiopia, Indonesia, Tanzania and Afghanistan accounted for around 70% of the total
deaths, including almost 2 million stillbirths.34 Finland, Singapore, Denmark and Norway reported
the lowest rates of stillbirth in 2009, with about 2 per 1000 births.34
An estimated 2.6 million babies were stillborn in the third trimester of pregnancy in 2015,61 with
98% of all stillbirths occurring in low- and middle-income countries (77% in South Asia and Sub-
Saharan Africa). The trend showed a slow decline from previous observations with the slowest
progress reported in Sub-Saharan Africa.42 Variations in late-gestation stillbirth rates across high-
income countries ranged from 1.3 to 8.8 per1000 births, suggesting that rates can be further
reduced in countries such as Australia.62
Stillbirths account for more than 2000 deaths in Australia annually; the national fetal death rate of
7 per 1000 births has not decreased for decades.41,63,64 The fetal death rate in WA in 2013–2014
was 6.6 per 1000 births, which is slightly less than the reported national rates.63 However, this rate
also indicates a significant increase from the 4.91 per 1000 total births reported from 1980–1983
in WA.25 The evidence suggests that such an increase should be attributed to legislative and
clinical practice changes related to the diagnosis of congenital anomalies and pregnancy

CHAPTER 2. LITERATURE REVIEW
PAGE | 11
terminations; thus the actual stillbirth rate has remained static.65 Further, some researchers have
recently indicated, upon exploration of the national published reports from 1994-2015, that the
trend in the rate of stillbirth has been different at different stages of pregnancy.66 Hence,
reporting the overall risk, rather than the stage-specific risk, masks the gains achieved in reduction
of stillbirth.66
According to Alessandri et al, almost 65% of stillbirths were antepartum, 25% were intrapartum
and 10% had an unknown time of death.25 No more recent study on timing of stillbirth is available
to compare Alessandri and colleagues’ findings in 1980 to. However, global estimates published in
the Lancet, using State Statistical Office data, reported that 14.0% of stillbirths in Australia were
intrapartum in 2015, with a rate of 0.4 per 1000 births.61
Risk factors widely suggested for stillbirth include demographic and obstetric characteristics, such
as advanced maternal age,6,48,67-71 not-married status,69,72,73 socioeconomic disadvantage,70,71,73-75
remoteness,25,46,67,75,76 smoking during pregnancy,69,70,74,77,78 nulliparity,6,67,68,70 pre-existing
medical conditions (such as overweight and obesity,70,71,74,79 diabetes41,77,80 and/or essential
hypertension73,74), history of previous stillbirth,70,74,80 multiple pregnancy6,70,73 and male sex of
baby.80,81
Major etiologic factors for stillbirth in low- and middle-income countries are not similar to the
etiology of stillbirth in high-income countries. Prolonged and obstructed labour, preeclampsia,
infection, lack of antenatal care and maternal socioeconomic disadvantage accounted for most
stillbirths in low- and middle-income countries.82,83Across high-income countries, maternal
overweight and obesity, advanced age and smoking were the most prevalent modifiable risk
factors.41,71 Small size for gestational age and abruption, which are indications of placental

CHAPTER 2. LITERATURE REVIEW
PAGE | 12
pathology, and pre-existing diabetes and hypertension are the most important factors observed
among the disadvantaged populations in these countries.41
According to Alessandri et al., the cause of death for most (52%) stillbirths in WA was either
unknown or associated with lethal congenital malformations (13%), antepartum haemorrhage
(12%) or maternal hypertension (8%).25 Some ethnic minority groups,9,13,67,80,84-86 including women
born in South Asia and Africa, were suggested to be at higher risk for stillbirth; however, the only
study available on the influence of race and place of birth on stillbirth in WA is that of Alessandri
et al., which was published in 1988 and limited to a comparison of Aboriginal women and their
non-Aboriginal counterparts.25 Thus, the risk of antepartum and intrapartum stillbirth in non-
Indigenous ethnic minorities and migrant women remains unexplored.
2.1.1.2 Neonatal death
The neonatal period is defined as the first 28 complete days after birth and is subdivided into the
early neonatal period (0–6 days) and late neonatal period (7–27days). Death of an infant during
this period is defined accordingly as early or late neonatal death.87
In 2005, it was estimated that more than four million neonates die globally each year.88 More than
80% of these deaths were attributed to infection, complications of preterm birth, and intrapartum
problems. Despite an improvement in the outcomes over the last decade and the decline in the
number of deaths worldwide (2.9 million annual neonatal deaths),38 the least progress has been
made in controlling intrapartum and preterm birth related etiologies.89 Low coverage of skilled
birth attendance (<50%), significant lack of skilled human resources (<0.9 per 1000 population)
and low fund allocation (< 20 USD per capita per year) have been blamed for most intrapartum-
related deaths in high mortality regions.7 It is estimated that 71% of these deaths are preventable
by providing essential interventions.37
CHAPTER 2. LITERATURE REVIEW
PAGE | 13
In Australia, neonatal mortality rates in 2013–2014 were highest in the Northern Territory (5.4 per
1000 live births) and lowest in northern Sydney, New South Wales (1.2 per 1000 live births) and
northern Perth, WA (1.4 per 1000 live births).46 In WA, the neonatal death rate significantly
decreased from 3.9 per 1000 live births in 1990–1992 to 1.7 per 1000 live births in 2013–2014,
which was the lowest rate among all states and territories.54
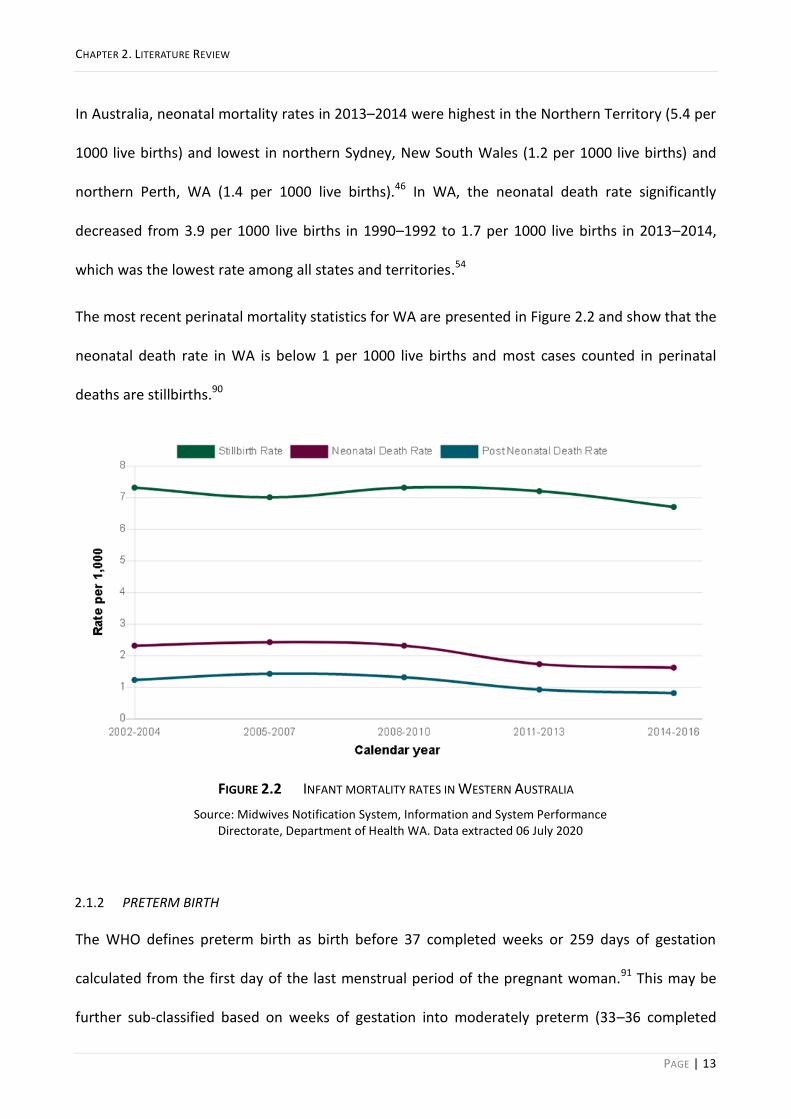
The most recent perinatal mortality statistics for WA are presented in Figure 2.2 and show that the
neonatal death rate in WA is below 1 per 1000 live births and most cases counted in perinatal
deaths are stillbirths.90
FIGURE 2.2 INFANT MORTALITY RATES IN WESTERN AUSTRALIA
Source: Midwives Notification System, Information and System Performance Directorate, Department of Health WA. Data extracted 06 July 2020
PRETERM BIRTH 2.1.2
The WHO defines preterm birth as birth before 37 completed weeks or 259 days of gestation
calculated from the first day of the last menstrual period of the pregnant woman.91 This may be
further sub-classified based on weeks of gestation into moderately preterm (33–36 completed
CHAPTER 2. LITERATURE REVIEW
PAGE | 14
weeks of gestation), very preterm (<32 weeks) and extremely preterm (<28 weeks),92 or based on
etiology as spontaneous or medically indicated preterm birth.93,94
Spontaneous PTB consists of idiopathic PTB: when labour commences before term, or preterm
pre-labour rupture of membrane (PPROM), when the amniotic sac is ruptured without established
labour, and prior to 37 completed weeks of pregnancy.93,94
Medically indicated PTBs are those that occur due to induction of labour or caesarean delivery
without prior PROM or spontaneous onset of labour. These are also known as iatrogenic PTB and
are mainly due to maternal or fetal disorders or health conditions that indicate premature delivery
of baby to save the life of the mother, the baby, or both.93,94 Around 30–35% of PTBs are medically
indicated, 40–45% are idiopathic, and 25–30% follow PPROM (Figure 2.3).95
It is estimated that almost 15 million babies are born preterm globally each year, comprising more
than 11% of all live births worldwide96 and that more than one million deaths occur as a result of
complications of preterm birth among under-five children.96,97 More than 60% of preterm births
occur in South Asia and Sub-Saharan Africa, where 52% of the global live births occur.98 In 2014,
the preterm birth proportion from all live births was around 8.7% in Europe99,100and around 11% in
North America.99,101

CHAPTER 2. LITERATURE REVIEW
PAGE | 15
FIGURE 2.3 OBSTETRIC PRECURSORS OF PRETERM BIRTH
Source: Goldenberg RL, Culhane JF, Iams JD, Romero R. Epidemiology and causes of preterm birth. Lancet. 2008;371(9606):75–84.
Slight variation in the normal length of the gestational period and probability of natural survival of
preterm-born neonates has been observed among different ethnicities.102,103 However, with
increasing availability and use of sophisticated intensive care equipment for preterm babies, the
survival gap between those who have and those who do not have access to such care is
widening.104
Various country-based reproductive health policies and medical practices, especially those related
to infertility treatment and indicated deliveries, multiple pregnancies, maternal age, body mass
index (BMI), smoking, and some ethnic backgrounds, such as non-Hispanic Black race in the US,
history of previous spontaneous preterm birth, short cervix, short interpregnancy interval, and
uterine anomalies are identified as risk factors for preterm birth.105,106
In Australia, about 9% of babies are born preterm, according to the latest Australia’s Mothers and
Babies reports, and preterm birth is more common in multiple births (66.0% of twins and 98.2% of

CHAPTER 2. LITERATURE REVIEW
PAGE | 16
all other multiples compared with 7% of singleton births), babies of Indigenous mothers (5.7%
more than non-Indigenous), mothers who smoked during pregnancy (5.5% more than those who
did not smoke), women residing in very remote areas (5.1% more than those residing in major
cities) and babies of <20 and ≥40 years old mothers (2.8% and 4.6% more prevalent than in those
20–39 years old).30,63
Increase in the singleton PTB rates, driven by an increase in medically indicated PTB, has been
reported in South Australia from 1986 to 2014 with a reduction in preterm stillbirths and in
Victoria from 2007 to 2017 with no improvement in outcomes.107,108 In WA, from 1984–2006, the
prevalence of idiopathic PTB was reportedly 2.6%, with 1.5% and 2.0% from PPROM and medically
indicated PTB, respectively.109 According to Hammond et al., non-Caucasian ethnicity is a risk
factor for spontaneous PTM, but not PPROM or medically indicated PTB, among the non-
Aboriginal population of WA.109 However, this population has not been further stratified by
specific ethnic backgrounds such as Asian, Indian or African.
There has been substantial interest in safely lowering the rate of PTB in WA, which led to the
recent launch of the WA Preterm Birth Prevention Initiative.110,111 This program aims to lower the
rates through the implementation of a multifaceted state-wide program that includes introducing
evidence-based clinical guidelines, a dedicated Preterm Birth Prevention Clinic based at King
Edward Memorial Hospital, and raising public awareness by targeting women and families of
WA.110
LOW BIRTHWEIGHT 2.1.3
Birthweight has been a key indicator and an important determinant of health in infancy and adult
life for a long time.112 Low birthweight (LBW) is the first weight of a fetus or newborn—measured
during the first hour after birth—which is less than 2500 grams, regardless of gestational age, and
caused by a preterm birth or restriction of fetal growth in the uterus.113 It contributes to the

CHAPTER 2. LITERATURE REVIEW
PAGE | 17
etiology of perinatal mortality and predisposes individuals to the development of several
morbidities and non-communicable diseases, including diabetes mellitus and cardiovascular
diseases, later in life and in adulthood.20,113
Small-for-gestational age (SGA), fetal growth restriction (FGR) or intrauterine growth retardation
(IUGR), sometimes used interchangeably in various contexts, pertain to birthweights less than the
10th percentile for gestational age, less than 2500 grams for gestational age greater than or equal
to 37 weeks, and less than two standard deviations below the mean value for gestational age.112
An estimated 20.5 million live births were LBW globally in 2015.114 More than 90% of LBW births
were reported in low- and middle-income countries, mainly from southern Asia (48%) and Sub-
Saharan Africa (24%).The estimated worldwide LBW prevalence was around 14.6% which showed
a reduction in comparison to the 17.5% estimates in 2000.113,114
According to the Australian Institute of Health and Welfare (AIHW), 1 in 15 live-born babies has
LBW in Australia.30 As illustrated in Figure 2.4, the proportion of LBW live-born babies in WA from
2006–2013 was consistently very close to that of Australia (around 6.1–6.3%).115 The proportion of
LBW babies in Australia did not changed much from 2007 to 2017, remaining between 6.1% and
6.7% and close to the OECD average (6.5%).30
Female babies, multiple pregnancies, babies of women who smoked in pregnancy, women living in
remote or disadvantaged areas, and those from Indigenous ethnicity had a higher proportion of
LBW in Australia. In comparison, women born overseas had a lower proportion of LBW (5.9%) than
Australian-born women (6.5%).30 The overseas-born population, however, were not stratified by
maternal country/region of birth or specific ethnic background.

CHAPTER 2. LITERATURE REVIEW
PAGE | 18
FIGURE 2.4 LOW BIRTH WEIGHT TREND IN WA
Source: Australian Institute of Health and Welfare. Children’s Headline Indicators [Internet]. Canberra: Australian Institute of Health and Welfare, 2018 [cited 2020
Sep. 7]. Available from: https://www.aihw.gov.au/reports/children-youth/childrens-headline-indicators
CHAPTER 2. LITERATURE REVIEW
PAGE | 19
MIGRATION, ACCULTURATION AND ETHNICITY 2.2
Mobility is an inherent characteristic of all populations. The process of social change by which an
individual, either alone or accompanied by others, leaves one geographical area for a prolonged
stay or permanent settlement in another geographical region is called ‘migration’, regardless of
the reason behind such a movement—economic betterment, political upheaval, education or any
other purpose.116
Migration is a global phenomenon: today, there are more than one billion migrants globally,
representing one-seventh of the world’s population,117 and comprising more than 244 million
international migrants118 and 763 million internal migrants.119 To put these numbers into
perspective, the entire populations of the United Kingdom, France, Germany and Spain equate to
the number of international migrants, and that of Europe to the internal migrants. This level of
human mobility is unprecedented and foreseen to rise at a rapid rate due to ongoing conflicts and
climate change.120
From the 244 million international migrants, nearly half are female, women and girls mostly in
reproductive age,118 and their experience of migration and vulnerabilities can substantially differ
from those of male migrants.
Depending on the circumstances experienced in the country of origin (pre-migration phase), the
migratory route (migration phase), and the country of destination (post-migration phase), the
extent of the physical, psychosocial and environmental stressors that migrants are exposed to can
vary considerably (Table 2.2).121 Experiences of forced immigration due to war and political turmoil
or natural disasters, especially those of pre-migration and migration phases, often profoundly
impact the psychosocial wellbeing of migrants121; however, this pathway comprises a small
fraction of international migration worldwide, and nearly two-thirds of the population of

CHAPTER 2. LITERATURE REVIEW
PAGE | 20
international migrants are labour immigrants who also experience many stressors especially in
post-migration phase.118,122,123
Skill Stream, Family Stream, and Special Eligibility Stream constitute the majority of Australia's
permanent immigration program. According to Australian Bureau of Statistics (ABS), the Skill
Stream, Family Stream, and Special Eligibility Stream accounted for 50%, 26% and 0.3%,
respectively, of the total permanent residencies in Australia in mid-2011, with only 7% of the total
migrant intake through the Humanitarian Program in 2010–11.124 Thus, most of the migrant
population in Australia are from non-refugee backgrounds.
TABLE 2.2 PSYCHOSOCIAL IMPACTS IN EACH STAGE OF MIGRATION
Pre-migration Migration Post-migration
Discrimination Forced and stressful travel Loss of previous social capital
Feeling of insecurity Fear and anxiety Cultural diversity
Fear and anxiety Powerlessness Language barrier
Uncertain future Unknown future Feeling of not belonging
Social and professional regression
Discrimination
Financial instability
Environment or climate
ASSIMILATION AND ACCULTURATION 2.2.1
Immigration often entails a substantial change in community ties, the loss of support networks
and familiar bonds, and social and psychological challenges for settlement in an unfamiliar
environment to fit in a new culture and system of meaning, and to develop ties with the new
country. To describe the process of change to people’s attitudes, beliefs and practices as a result
of integration into another population over time, sociologists mostly use the word assimilation.
Anthropologists, on the other hand, prefer the term acculturation, given that their field of work is
more concerned with culture. This can be seen in the literature as early as the 1920s and 1930s—
CHAPTER 2. LITERATURE REVIEW
PAGE | 21
Park and Burgess, two American sociologists, initially described and then Redfield, Linton and
Herskovits, distinguished American anthropologists, addressed such phenomena.125,126
Assimilation is the process of sharing and acquiring attitude and history and experience with the
other interacting population, which results in integration in a common cultural life among
people.125 Acculturation encompasses those phenomena that result when populations from two
different cultures come into continuous first-hand interaction with each other, which
subsequently modifies the patterns of original culture of either or both groups involved.126
Milton Gordon presents the most comprehensive and methodical account of the assimilation
process in his book ‘Assimilation in American Life,’ published in 1964. He described seven
sequential steps in the process of assimilation: cultural, structural, marital, identity, prejudice,
discrimination, and civic. The first step, acculturation, involves the gradual adoption of the cultural
habits of the ‘core sub-society’ by the migrants.125,127 In this thesis, we use the term ‘acculturation’
to describe the consequential effects migrants experience, after settling in the new environment,
in relation to the possession of characteristics that are representative of their level of assimilation
and integration; these characteristics include language, age on arrival, length of residence and
intermarriage that will be used to determine the level of acculturation in migrants.
2.2.1.1 Language
Adoption of the English language is one of the most common indicators of acculturation used in
the literature.127 Proficiency in language and mother-tongue shift in the first and later generations
are phenomena commonly observed in the acculturation process.128,129 Adoption of the English
language by the first-generation followed by a strong preference for English in later generations
usually happens after embracing the cultural norms of the main society.127

CHAPTER 2. LITERATURE REVIEW
PAGE | 22
2.2.1.2 Age on arrival
It is believed that the inevitable exposure of children to the host society during learning ages by
attending school and attaining education leads to a greater degree of absorption of its cultural
patterns than adults.127,130 However, it is worth noting that English language proficiency and
socioeconomic status can in themselves be influential factors in this process.130 In other words,
those from higher socioeconomic backgrounds and those who speak English better have more
opportunities to intermingle with the new society and therefore a greater degree of acculturation
follows as a result.
2.2.1.3 Length of residence
Length of stay in the host country is commonly used as another measure of acculturation in the
literature.127,128 Longer lengths of stay provide potentially more opportunities for migrants to
interact with the destination society by obtaining accommodation, learning a language, attaining
education and employment, and establishing social relationships.129
2.2.1.4 Intermarriage
The amalgamation of the population also happens through intermarriage, resulting in marital
assimilation: the third step of assimilation described by Gordon, which occurs after acculturation
has taken place.131 Intermarriage is a strong predictor of integration in a multicultural society.132
Thus, there are two ways to measure assimilation in a population due to marriage, either through
exploring the ethnicity of ancestors of the individual in following generations, or by investigating
the ethnicity of their spouse among the first generation of migrants.131 In this thesis, the latter is
considered a proxy to acculturation.

CHAPTER 2. LITERATURE REVIEW
PAGE | 23
MIGRANT POPULATIONS IN AUSTRALIA AND WA 2.2.2
Australia has historically encouraged immigration and permanent settlement on a significant scale
for the country’s founding and development. Migrants, mostly born in the UK and New Zealand,
have constituted a substantial proportion of the Australian population; however, this picture is
changing. Statistics show that the proportion of residents born in the UK decreased from 5.6% in
2004 to 3.9% in 2019, while those born in China and India have more than doubled (1.0–2.7%) and
tripled (0.7–2.6%) over the last decade, respectively.21,133 The cultural and linguistic diversity of
Australian residents is consequently increasing; the most recent ABS publication indicated that the
proportion of the population born in China, India and Philippines (6.5%) exceeded the population
born in England and New Zealand (6.1%) in 2019 (Table 2.3).133 It is also worth noting that in 2011
there were 128,430 individuals living in Australia who identified as Māori, the Indigenous
population of New Zealand, with 17.1% of the New Zealand-born population residing in Australia,
and exceeding the proportion of this ethnic group in New Zealand.134
TABLE 2.3 AUSTRALIA'S POPULATION BY COUNTRY OF BIRTH - 2019A
Country of birthb '000 %c
England 986 3.9
China 677 2.7
India 660 2.6
New Zealand 570 2.2
Philippines 294 1.2
Vietnam 263 1.0
South Africa 194 0.8
Italy 183 0.7
Malaysia 176 0.7
Sri Lanka 140 0.6
All overseas-born 7 530 29.7
Australia-born 17 836 70.3 aEstimates are preliminary.
bAs at 30 June 2019.
cProportion of the total population of Australia.
Source: Australian Bureau of Statistics. Cat. No: 3412.0-Migration, Australia, 2018–19.

CHAPTER 2. LITERATURE REVIEW
PAGE | 24
Western Australia accommodates a unique racial and ethnic composition of the Australian
population, with the highest proportion of overseas-born residents (33.4%) and the only state with
more migrant families (319 900) than non-migrant families (314 700) in 2013.21 There were also
twice as many Indian-born individuals than Chinese-born individuals, and WA had the highest
proportion of people born in South Africa (1.7%) and Malaysia (1.2%).135 This state also had
around 11% UK-born residents, the highest proportion among all states, and more than twice the
national figure for this country of origin (5.4%).21 According to the 2016 Census, 61.7% of the WA
population had at least one overseas-born parent, a 2.7% increase from 2011.136
Furthermore, between 2006 and 2011, the Māori population in WA increased by 87%, and it was
estimated that WA would become the second-most populous state for Māori after Queensland134,
probably due to the influx of Māori workers seeking employment in the WA mines.137
ETHNIC ORIGIN IN WA 2.2.3
Ethnicity is defined broadly based on a shared understanding of history, geographic origins of an
ethnic community and on specific cultural characteristics such as language and/or religion.
Therefore, the UN recommendations encourage acquiring information on ethnicity through self-
declaration with the option of indicating multiple ethnic affiliations. 138Self-reported ethnic origin
is recorded by WA midwives for all birth in WA and, since 1998, has been classified as Caucasian,
Aboriginal and/or Torres Strait Islander, Asian, Indian, African, Polynesian, Maori and Other.139
Surprisingly, this information has not been explored or used in published research yet despite the
availability of some evidence from New Zealand140 and other countries.102,141
However, it is important to note that cultural and language diversity is widely influenced by
immigration142 and there is no consensus on classification of ethnicity across nations and
worldwide. This is particularly imperative to be considered when making comparisons. For
example, the ethnic affiliation known as Asian in the UK includes individuals from Indian, Pakistani,

CHAPTER 2. LITERATURE REVIEW
PAGE | 25
Bangladeshi, Chinese backgrounds143, but in Australia this ethnic origin includes who self-report
their ethnic origin as Asian including people of Asia, Japan and South East Asian origin i.e. Chinese,
Japanese, Vietnamese, Cambodian etc. However, there is another distinct ethnic origin as Indian
for those who self-report their ethnicity as Indian or descendants of people originating in the area
of the Indian subcontinent, Pakistan etc.
HEALTHCARE USE AND HEALTH OUTCOMES OF MIGRANT 2.3
Considering migrant status, ethnic origin and culture in a health context is imperative due to their
association with economic, social and environmental circumstances and health literacy among the
population—collectively known as the social determinants of health, and ‘causes of the causes’
(Figure 2.5).144,145This is evident and described in ‘healthy immigrant effect’ that suggests
migrants, on their arrival, have better health outcomes than the general population of the host
countries due to the selective process of immigration; however, they lose that advantage
gradually and their outcomes converge slowly to the host population levels over time .146-148
The circumstances in which one grows, lives and works are key drivers of one’s health according to
the WHO.149 Many aspects of lifestyle and health behaviours, such as diet, alcohol and drug use,
smoking, physical activity, and traditional medicine use, are determined by one’s upbringing,
culture, social class, education and religion, which can impact the likelihood of utilisation of
healthcare services.127,150,151 Migrant status and ethnic background often imply major
socioeconomic disadvantages, such as social exclusion, unsafe working conditions or
unemployment;144 hence, migrants’ lives that were shaped by social determinants in their country
of origin are confronted with new social, economic and political conditions beyond their control in
destination countries. This distinctive feature suggests that migration is a social determinant of
health.152

CHAPTER 2. LITERATURE REVIEW
PAGE | 26
FIGURE 2.5 MAIN DETERMINANTS OF HEALTH
Source: Dahlgren G, Whitehead M. Policies and strategies to promote social equity in health. Background document to WHO—strategy paper for Europe. Stockholm,
Sweden: Institute for Future Studies. 1991.
The healthcare system, with its regulated provision of services, also acts as a social determinant of
health that not just influences other determinants but is also influenced by them.153 For example,
in Australia, despite the availability of a universal health insurance scheme covering all Australian
citizens and permanent residents (Medicare), depending on the type of visa (Humanitarian visas
are excluded), a two- to four-year waiting period is applied before immigrants become eligible to
benefit from some health and social security services, including the Newstart/Jobseeker Allowance
(income support while looking for employment) and Healthcare Concession Card to get
medications and services at a cheaper rate.154 This is despite reports that recent migrants on a
permanent visa had an unemployment rate of 8.8% compared with 5.4% for the Australian-born
population, and 3.3% for migrants with Australian citizenship (those migrants who have lived in
Australia for at least four years) according to the 2016 survey.155

CHAPTER 2. LITERATURE REVIEW
PAGE | 27
Given the above, investigating migration, the acculturation process and their interrelationship
with health services and health outcomes of individuals is pivotal for addressing any health issue
and identifying the policy/intervention needs of the multicultural population of Australia.
PREGNANCY AND CHILDBIRTH OUTCOMES OF MIGRANT POPULATIONS 2.3.1
Risk factors and causes of adverse pregnancy outcomes differ in low- and middle-income versus
high-income countries, due partially to an inadequate level of access to pregnancy and obstetric
care in low- and middle-income nations.7,92Notwithstanding, ethnic disparities in the risks of these
outcomes are also reported in many high-income countries, despite the availability and access to
high-standard prenatal care.84 Genetic predisposing factors, such as more prevalent congenital
anomalies due to consanguinity in some ethnicities, may play a role.84,156 However, the evidence
suggests that religious beliefs, cultural expectations and misconceptions about interventions, such
as caesarean delivery, may impact pregnant women's decision making, and result in delayed care-
seeking, non-compliance and underutilisation of health services in some ethnicities, even when
the procedure is clinically indicated.19,157,158
Small et al. investigated the pregnancy outcomes of Somali women after immigration in six
resettlement countries—Australia (NSW and Victoria), Belgium, Canada, Finland, Norway and
Sweden—between 1997 and 2004, and showed significantly higher odds of stillbirth for this ethnic
group (OR 1.86, 95% CI 1.38–2.51) than the native population of the resettlement countries in the
pooled analysis.13 Drysdale et al. assessed the rate of late-pregnancy antepartum stillbirth in
Australian women born in different regions of Asia, through a cross-sectional study of all singleton
births at 37–42 weeks gestation over ten years, and concluded that those born in South Asia were
almost 2.5-times more likely to have a late-pregnancy stillbirth than women born in Australia.159
Although these studies show disparities in the risk of stillbirth by ethnicity, they were limited to
specific population groups, Asian or Somali women, did not adjust the analysis for confounders

CHAPTER 2. LITERATURE REVIEW
PAGE | 28
that can influence the risk of stillbirth, or used country of origin to determine the ethnic
background rather than self-reported ethnicity. More recently, Davies-Tuck, Davey and Wallace
investigated the maternal region of birth in association with the risk of stillbirth in a larger study;
they included all non-Indigenous singleton births at 24 or more weeks gestational age from 2000–
2011 in Victoria in their analysis and adjusted the analysis for many confounders.74 They
concluded that maternal region of birth is an independent risk factor for stillbirth.74 Despite these
investigations, the risk of stillbirth concerning time of death (antepartum or intrapartum) and
specific ethnic groups, such as African and Māori populations, remains unexplored due to the
limitations of the data registries used. Moreover, migration is a selective process and the
population of overseas-born residents across the states and territories of Australia can differ in
size, the composition of countries of origin, and their English language fluency and length of
residence. As such, there are considerable uncertainties and gaps in knowledge that need to be
investigated. As Flenady et al. stated in their “Stillbirth: recall to action in high-income countries”
in the Lancet series, the findings are not consistent in the literature and, where increased ethnic
vulnerability is evident, the challenge remains as to why we observe an excess risk of stillbirth in
women from some racial and ethnic backgrounds and how we address such risk within routine and
comprehensive antenatal care.62
In New Zealand, Craig and colleagues analysed Birth Registration data from 1 194 895 births
(including 1 189 120 singleton live births and 5775 stillbirths) from 1980–2001 and showed that
from 1980–1994, the rates of late fetal death declined by 49% for all three ethnic groups studied,
Māori, Pacific and European/other ethnicities.160 On the other hand, they observed a 30% increase
in the rate of preterm birth for European/other populations while the rates of preterm birth
slightly declined for the other two ethnic groups.160 It was not clear whether the increased PTB
rate among this ethnic group, which constitutes most residents in New Zealand, was in the

CHAPTER 2. LITERATURE REVIEW
PAGE | 29
spontaneous PTB category or medically-induced births. An increase in medically induced PTB could
have been explained by a change in practice and to prevent stillbirth. The authors discussed the
potential effect of maternal age, obesity, or the growing population of Asian/Indian/other women
that were included in the European/other category but were not convinced that the observed
increase in PTB rate could be attributed to these factors.160
Compared with European-born women in New Zealand and despite adjusting for BMI, maternal
age, parity, smoking, social deprivation, diabetes, chronic hypertension and relevant pre-existing
medical conditions, Anderson et al. observed an independent reduced risk of preeclampsia in
Chinese women (adjusted OR 0.56, 95% CI 0.41–0.76) and 51% increased risk in Māori women
(adjusted OR 1.51, 95% CI 1.16–1.96).161
Dahlen et al. investigated the rates of obstetric intervention during birth and selected maternal
and perinatal outcomes for low-risk women born in Australia compared to those born overseas in
NSW. In their study population, 28% were non-Australian-born women mostly from New Zealand
(2.5%), England (2.2%), China (2.1%), Vietnam (2.0%), Lebanon (1.8%), Philippines (1.4%) and India
(1.2%).162 They showed that women born in the Philippines had the highest rate of preterm birth
(7.1%). Gestational diabetes was the highest among women born in China (13.8%) and Vietnam
(11.4%), being almost four times the rate of their Australian-born counterparts (3.1%). Lebanese
women had the highest rate of stillbirth (7.2/1000) followed by Indians, who also had the highest
rate of assisted vaginal delivery (16.3%). Women born in China had the highest rate of
instrumental birth (26.4%).162
In WA, Newnham et al. showed that the rate of preterm birth was significantly lower in women
born in China than in other Western Australians (4.4 vs 8.2%, P<0.0001) but higher than native
Chinese living in mainland China (Jiangsu province). In contrast, Australian-Asians and

CHAPTER 2. LITERATURE REVIEW
PAGE | 30
India/Pakistan-born Indians had a higher prevalence of preterm birth than Caucasian
Australians.163 They concluded that the differences between traditional Chinese and contemporary
Western lifestyles, including sexual practices, may explain this finding.163
Higher rates of congenital abnormalities have been reported in the birth outcomes of migrant
populations in Europe.164-166 Findings from a previous study in Australia are not consistent with
those in Europe, and non-Caucasian non-Indigenous women in WA had a lower risk of major
malformations.167 This is probably due to the differential distribution of migrants among the
receiving countries and the variation in countries of birth of the immigrant women studied.
European studies particularly reported these adverse outcomes in Pakistani and Turkish
immigrants and blamed consanguinity, inadequate or late first prenatal care, and reluctance to
terminate after diagnosis of malformation due to religious or social challenges.165,166 In contrast,
the lower rates of congenital abnormalities in WA have been studied in immigrants from East Asia,
mostly the Vietnamese population.167
Thomas, Beckmann, and Gibbons investigated the risk of adverse pregnancy and neonatal
outcomes (stillbirth, preterm birth, CS, postpartum haemorrhage ≥1000 ml, eclampsia,
intrauterine growth restriction, LBW, admission to nursery, congenital abnormality and 3rd/4th
degree perineal trauma) related to immigrant characteristics, including country of birth, race,
primary language spoken, need for an interpreter and refugee status in Mater Mothers’ Hospital,
Queensland. They found no significant relationship between adverse outcomes and refugee status
(P=0.863) but concluded that using an interpreter (P=0.015) and/or being born outside
Australia/New Zealand (P<0.001) reduced the likelihood of an adverse outcome when at least one
adverse outcome had occurred.168 Their study population, however, comprised 4751 women
(including 461 women using an interpreter and 1046 non-Caucasian and 117 women identifying as
CHAPTER 2. LITERATURE REVIEW
PAGE | 31
refugees) and did not have enough power to study the associations for less frequent outcomes,
such as stillbirth with a rate of 7 per 1000 total births.
PATTERN OF HEALTH SERVICE UTILISATION 2.3.2
The pregnancy-related health services discussed in the literature are mostly concerned with
prenatal/antenatal care visits and assisted birth, including induction of labour, instrumental birth,
or CS.
Reime et al. sought to understand the role of prenatal care on the risk of stillbirth among women
with migration background in Germany by studying singleton births in 1990, 1995 and 1999. They
reported inconsistent association patterns between stillbirth, region of origin and utilisation of
prenatal care.169 In their population, underutilisation of prenatal care among Mediterranean
women (OR 3.00, 95% CI 1.71–5.26) was associated with a higher risk for stillbirth; however,
women with adequate utilisation of prenatal care from Central and Eastern Europe (OR 1.74, 95%
CI 1.33–2.29) and the Middle East (OR 1.98, 95% CI 1.64–2.39) were also at higher risk for
stillbirths despite adjusting for age, parity, smoking, interpregnancy interval, employment status
and year of observation.169 The study used perinatal data for 182 444 births that were collected by
obstetricians and midwives during pregnancy and after birth and controlled the analyses for a
number of confounders, and thus provided good insight into the relationship between healthcare
utilisation and stillbirth among migrants in Germany. However, the study was limited in their
ability to adjust for socioeconomic status and to examine the influence of language barriers,
length of stay in Germany, and other indicators of acculturation, which may explain the
differences between these three groups of migrants and why central/Eastern European and
Middle Eastern women, despite adequate utilisation of prenatal care services, were still at higher
risk of stillbirth.169
CHAPTER 2. LITERATURE REVIEW
PAGE | 32
It is well known that perceptions of health and disease differ among different populations, and
may determine or influence individuals’ help-seeking behaviour.162 Garcia-Subirats et al. alluded
that Chinese residing in Western countries access healthcare services only when their disease is
serious, since they usually try their own traditional medicine for treatment of their illnesses first,
and Moroccans and Pakistanis access healthcare services when their disease is in more advanced
stages because they prioritise their work and financial matters superior to their health, while
South Americans seem to use the channels established for accessing healthcare services more
effectively and timely.170
The utilisation of reproductive health services, as health behaviour, follows a similar pattern.
Sudanese women, for instance, tend to avoid instrumental and surgical assistance with labour as
they believe that giving birth is a natural process and should not be intervened.26 In some cultures,
the power of decision making for when to attend the clinic or birthing suites lies with someone
other than the pregnant women in the household, the husband or a co-resident mother-in-law,
according to Shafiei, Small and McLachlan.171 Further, having a male doctor, lack of an interpreter
when one is needed, religious dietary requirements (halal food for Muslim women) and
perceptions around hospital food guidelines not complying with those requirements may be
barriers to healthcare utilisation for some ethnic groups.171 Burmese refugees described the lack
of interpreting services in Australian hospitals and the absence of personal/communal care as they
expected, making their experience of childbirth confusing and distressing.172 The socioeconomic
status of the migrants, unfamiliarity with the healthcare system, and location of the facilities can
be other influential factors.162 Refugees are usually settled in outer city suburbs, while the
healthcare services are mostly located in central regions and inner suburbs. Thus, the need for
complex travel arrangements and transportation expenses can contribute to lower utilisation of
services.173,174

CHAPTER 2. LITERATURE REVIEW
PAGE | 33
Language barriers, lack of culturally appropriate services, such as the preference of female
practitioner or interpreter in some migrant populations,174-177 and doctors’ preconceived attitudes
towards some cultural practices or traditions can negatively affect women’s experiences of their
interaction with the healthcare system.178-180 On the other hand, the staff’s compassionate
attitude,171 continuity of care and building trust between women and their interpreter, midwives,
and staff are positive factors reported by migrant women.173,176,177 The unfamiliarity of healthcare
practitioners with the conditions and/or endemic diseases that immigrants may have and the
consequent difficulty in diagnosis of the ailment, and the lack or cost of appropriate diagnostic
procedures or treatments resulting in lack of confidence in Australian-trained practitioners have
been expressed.174,179-181
More than 20% of the population of women who gave birth in Queensland (QLD) were born in
countries other than Australia. Hennegan, Redshaw and Miller investigated the labour and
childbirth experiences of overseas-born women who speak languages other than English at home
with those of English-speaking native-born women in this state.182 They reported that overseas-
born women giving birth in QLD were less likely to report care during labour as provided by
midwives, obstetricians or general practitioners and had 61% (95% CI 1.29–2.01) higher odds of
being cared for by nurses than their Australian-born counterparts after adjustment for
socioeconomic status, maternal age, remoteness and type of facility.182 Whether
misunderstanding of job titles, caregiver shortage, differential treatment by staff and women's
own choice in preferring a female nurse to a male obstetrician result in such disparities remain
unknown. However, the report of such disparities was not limited to QLD. Small et al. also showed
that only 27% of Vietnamese, 39% of Filipinos and 48% of Turkish rated their intrapartum care as
‘very good’ in Victoria in a study conducted in 2002.183 In another study undertaken by Shafei,
Small and McLachlan in 2012, 70% of Afghan women rated their intrapartum care as very good.171

CHAPTER 2. LITERATURE REVIEW
PAGE | 34
Lack of professional caregivers and birthing facilities in Afghanistan and the organisation of care
and hospital environment in Australia with more resources, sympathy and provision of pain
management and medications were the reasons for such ratings among Afghan women.171
In the same study by Hennegan, Redshaw and Miller, overseas-born women, despite higher odds
of having one carer through labour and birth, were 32% more likely to report that they were not
looked after very well, were rushed or hurried by staff, and were twice as likely to report the need
for greater privacy in labour and birth environments than their native-born counterparts.182 While
this may imply discriminatory behaviour, it could also be an indication of the late attendance of
women to the birthing facility and genuine effort by staff to provide timely and medically indicated
care as soon as possible. Lack of trust in healthcare providers and the western health system, non-
compliance with the recommendations, and late booking or late arrival at the facility in an attempt
to avoid intervention have been expressed by healthcare providers who cared for women from
migrant backgrounds, especially for Somali women, both anecdotally in Australia and the
literature, including those from other jurisdictions internationally.179,180
Von Katterfeld et al. revealed that overseas-born women from culturally and linguistically diverse
(CaLD) backgrounds in WA were, on average, less likely to be induced and more likely to use fetal
monitoring during labour; women from Oceania, North Africa and the Middle East, in particular,
were less likely to have assisted delivery or episiotomy than their Australian-born counterparts.24
In contrast, Hennegan et al. showed that in QLD, where the East Asian population was the
predominant study population, showed that the odds of experiencing an episiotomy or perineal
trauma were significantly higher in overseas-born women (i.e. 2.43 and 1.69, respectively) and
they were less likely to be induced (adj. OR 0.72, 95% CI 0.55–0.96) despite 80% higher odds of
constant monitoring with belt or clip (95% CI 1.32–2.46) during labour.182 These may be
indications for being at higher risk of fetal distress due to attendance or admission to the birthing
CHAPTER 2. LITERATURE REVIEW
PAGE | 35
facility at later stages of labour. In contrast, Dahlen et al., using NSW’s Midwives Data Collection,
showed a different picture with Indian women experiencing high rates of CS (31%), instrumental
birth (16%) and episiotomy (32%).162 In WA, 50% of Afghan participants delivered their babies by
CS.26 Indeed, the prevalence of CS is higher in certain migrant groups; this may, to some extent,
reflect a cooperative behaviour among some ethnic groups, or lack thereof, with healthcare
provider’s recommendations. For example, Chinese, Vietnamese and Burmese were happy to let
their doctors decide for them whether they need to undergo an intervention, but Sudanese
participants' consider childbirth a normal process that should occur naturally, without any medical
intervention; as such, they asserted their reluctance to undergo CS even if clinically indicated.26
The generalisability of these findings is, however, questionable given the very small size of the
sample—39 women from Afghanistan, Burma, China, Sudan and Vietnam—studied in WA.
Also, Carolan and Cassar investigated antenatal care perceptions of 18 pregnant African women
attending maternity services in Melbourne through in-depth qualitative interviews and reported
difficulties experienced by women attending antenatal care for the first time in Australia:
understanding the different approaches offered and confused/surprised by the attention while
childbearing is a ‘normal process’. Participants were reluctant to undergo induction of labour as
they viewed it as a disruption to a normal event that should be initiated by the ‘baby’ when he/she
is ‘ready to come’, and hence feared any interruption.184 Although the participants did not see the
value in regular antenatal visits early on, they later described the advice received on self-care,
diet, breastfeeding and contraception helpful and valuable. However, they struggled to comply if
the advice was contradictory to their cultural beliefs.184 Stapleton and colleagues also reported
similar challenges faced by refugee women who gave birth in a tertiary hospital setting and their
expectation to submit to a highly medicalised practice of childbirth that challenges their traditional
beliefs and customs.173 It is important to note that these findings are from a small qualitative study

CHAPTER 2. LITERATURE REVIEW
PAGE | 36
and are prone to bias by reflecting the opinion of a small group of migrants; yet, the insight into
the diverse attitudes, challenges and needs of migrants from various backgrounds is of extreme
value to researchers, policymakers and practitioners and is consistent with other reports.179,180
Migrants born in New Zealand comprise a considerable population in Australia and those from
Māori background are an over-represented and fast-growing community within this
population.134,137 However, little research data on their reproductive health is available other than
those studies conducted in New Zealand. Harris et al. investigated the link between CS and
ethnicity in New Zealand from 1997–2001 and found that although high-risk pregnancy is more
prevalent among Māori women, emergency and elective CS rates were significantly higher among
non-Māori women (total CS, 21% vs 13%, P<0.0001).185 Anderson and colleagues compared a
broader range of ethnicities in New Zealand, distinguishing the non-Māori population as Pacific,
Chinese and Indians, with Europeans from 2006 to 2009; the authors showed that Pacific and
Chinese women had lower odds of elective CS (adjusted OR 0.42, 95% CI 0.24–0.73 and 0.68, 0.49–
0.94, respectively) and Indian women had higher odds of emergency CS (adjusted OR 1.54, 95% CI
1.26–1.88). Other ethnicities' rates of CS did not differ from those of Europeans.186
In Norway, where free maternal care is universally available, and all births occur within the public
health system, substantial variation in the utilisation of CS among different ethnicities has been
reported.187,188 Vangen et al. observed that the Vietnamese population had the lowest prevalence
of CS delivery (around 10%), while more than 20% of women born in Sri Lanka/India, Philippines,
Somalia/Eritrea/Ethiopia, and Chile/Brazil delivered through CS from 1986–1995.187 However,
Turks/Moroccans and Pakistanis had similar results to Norwegians (12%). Filipinos and
Chilean/Brazilians had the highest rates of elective CS, mostly due to feto-pelvic disproportion,
while Sri Lanka/India and Somalia/Eritrea/Ethiopia born women had higher rates of emergency CS
due to fetal distress and prolonged labour.187 Similarly, in Australia, von Katterfeld et al. studied

CHAPTER 2. LITERATURE REVIEW
PAGE | 37
the obstetric profile of migrants and showed that in WA from 1998–2006, the odds of elective
caesarean delivery was significantly higher in women from north-western Europe and Americas
and significantly lower in those from North Africa and the Middle East, Oceania and North-East
Asia compared to non-Indigenous Australian-born women; however, the proportion of emergency
CS was more common in most of the foreign-born populations including Asian, Sub-Saharan Africa
and American-born women than non-Indigenous Australians.24 High rates of elective CS may rule
out the possibility of a tendency to avoid CS or instrumental birth in a population while the high
rate of emergency CS in the other groups may be a consequence of reluctance to undergo assisted
procedures until it is too late.
With that said, there are some inconsistencies in the findings reported from Australia that are
worth discussing. Ma and Bauman studied the obstetric profile and pregnancy outcomes of
immigrant women in NSW from 1990–1992 and showed that African, Asian and American-born
women were 20% more likely, and Middle Eastern born women were 25% less likely to have CS
delivery than their Australian-born counterparts.189
In another study conducted later in NSW, Dahlen et al. stratified the migrant population by
country of birth and found that Indian women had the highest rates of CS delivery (30.7%) from
2000–2008.162 These discrepancies may be due to differences in the classification of ethnic origins
or the outcomes of interest in the literature, or changes in the composition of the population or
migrant intakes from specific origins. For instance, Ma and Bauman did not differentiate between
Indian and East Asian origin and categorised any maternal country of birth from these regions as
the ‘Asian’ population. They also did not distinguish the delivery method by type of CS, elective or
emergency, in their study.

CHAPTER 2. LITERATURE REVIEW
PAGE | 38
ACCULTURATION AND PREGNANCY OUTCOMES 2.3.3
Proficiency in language and communication in English is often considered a proxy to acculturation
in studies concerning migrant populations.190-192 The relationship between the level of
acculturation and pregnancy outcomes has not been studied in Australia, but some aspects of that
have been explored, such as proficiency in English or use of interpreter indicating similar or even
favourable pregnancy outcomes among the less acculturated migrant women from low- and
middle-income countries compared with the Australian-born population. In QLD, non-Caucasian
women from non-English-speaking countries who used interpreter services experienced no
greater adverse pregnancy outcomes than their Caucasian English‐speaking Australian-born
women.168 Newnham et al. also showed that the rate of PTB in WA in Chinese-born women who
did not require an interpreter, and were considered more westernised, was almost double those
of Chinese-born women who required an interpreter and similar to Chinese-born women living in
China.163 The need for an interpreter may indicate a lower level of acculturation; however, it is not
clear whether the reported lower rates of adverse pregnancy outcomes were due to the
protective effects gained from using an interpreter or the inherent lower rates of those outcomes
among migrants with lower levels of acculturation. Further, it is not possible to conclude from this
study that less acculturated women were at lower risk of PTB because the rates were unadjusted,
and the less acculturated women could have had other characteristics, such as younger age, that
act as confounding factors explaining their lower rates.
A longer length of residence may also indicate a higher level of acculturation among the
immigrants.129,130 In Canada, Urquia and colleagues studied 83 233 singleton newborns of
immigrant mothers and 314 237 newborns of non-immigrant mothers from 2002–2007. The
investigation was a linkage study of a database of immigrants acquiring permanent residency in
Ontario, Canada, from 1985–2000 with mother-infant hospital records; and showed that recent
CHAPTER 2. LITERATURE REVIEW
PAGE | 39
immigrants were at lower risk of PTB, but the risk was higher in those with >10 years length of
residence than their Canadian-born counterparts, showing that a 5-year increase in Canadian
residence was associated with 14% (95% CI 1.10–1.19) higher odds of PTB in migrants.193 This was
a retrospective population-based, data-linkage, cross-sectional study from a validated database,
adjusted for maternal age and parity at delivery; the sensitivity analyses examined the potential
effect of other variables, including infant sex, maternal morbidity during pregnancy, induction of
labour, CS, neighbourhood deprivation, year of arrival and year of birth of baby, and did not find
any substantial differences with the reported result. Thus, this study provides robust evidence that
longer length of residence is associated with a higher risk of PTB.
In Europe, Ekeus and colleagues conducted a population-based register study with data from the
Swedish Medical Birth Register and socioeconomic variables from national income and population
registers, including singleton births from 1992 to 2005, 219 832 births to foreign-born women and
1 094 146 births to Swedish-born women, and adjusted for confounding factors including parity,
disposable income in quintiles, urban/rural place of residence and maternal age, height and
obesity. The risk of stillbirth was higher among migrants with a length of residence <5 years than
those with longer residence periods (adjusted OR 1.21, 95% CI 1.05–1.40) in Sweden.67 In contrast,
Vik et al. conducted a nationwide population-based study including births to primiparous and
multiparous migrant women (N=198 520) and non-migrant women (N=1 156 444) in Norway from
1990–2013, and adjusted the analysis for year of birth, parity, maternal age, marital status,
mother’s income, level of education and consanguinity; the authors reported that stillbirth was
not associated with length of residence.194 The discrepancy in reports from these two Nordic
studies, with relatively comparable populations and health systems, is probably due to differences
in the definition of outcome in these countries or the confounders adjusted for in these two
studies. The Swedish study defined stillbirth as the death of a baby of at least 28 completed weeks

CHAPTER 2. LITERATURE REVIEW
PAGE | 40
of gestation while the other study used a lower limit of 22 weeks gestation. The Norwegian study
did not adjust for overweight/obesity and smoking, although smoking is a well-established risk
factor for stillbirth and previous research suggested that the prevalence of smoking in pregnancy
among the migrant population increases with longer length of residence.195,196
Intermarriage could be an important indication of integration and acculturation for migrants.132
Lower risk of stillbirth for migrant women with a non-migrant partner has been reported in
Norway and the US as well as a lower risk of SGA in Chinese-American women with white or Black
partners in the US.194,197,198 In Canada, Bartsch et al. showed that, compared with couples with
both parents being Canadian-born, the adjusted odds of stillbirth was higher when parents were
both overseas-born, from the same country or different countries, and the risk was highest when
parents were from the same country with a high domestic stillbirth rate (aOR 1.60, 95% CI 1.30–
1.97), concluding that paternal country of birth matters.197
Lower age at the time of immigration could be an indicator of a higher likelihood of acculturation.
Martinson, Tienda and Teitler, using nationally representative samples and birth cohort surveys
from Australia, the UK, and the US from early 2000, sought to investigate whether, how and why
rates of low birthweight differ between natives and immigrants.199 They did not find any
association between LBW and mothers’ age at immigration in Australia. In their study, the odds of
LBW were the same for mothers who arrived as children and as adults (OR 0.99, P>0.05 and OR
1.08, P>0.05, respectively).199 In the UK group, age at arrival was not associated with the likelihood
of having an LBW baby while recent arrivals were less likely to have an LBW baby than the UK-born
population (OR 0.57, P<0.05); similarly, arrivals in the US also had lower odds of LBW than the US-
born population (OR 0.64, P<0.05).199 They adjusted their models for child sex, maternal age,
parity, marital status, maternal education, family income tercile, and smoking; however, the
sample size for the Australian survey, an analytic sample of only 3372 births, and the inability to

CHAPTER 2. LITERATURE REVIEW
PAGE | 41
stratify this sample by race/ethnicity were important limitations of this investigation, affecting the
generalisability of the study and reducing its power to make reliable conclusions.
Furthermore, there are some reports of an increase in caesarean deliveries with length of
residence in the literature. In the US, Zlot, Jackson and Korenbrot defined acculturation based on
maternal country of birth and language spoken and studied its association with CS among 2102
low-risk Latinas in San Diego County, stratified by their parity, and showed that multiparous US-
born Latinas were more than twice as likely to have CS than multiparous Spanish-speaking women
born in Mexico, but the result was reversed for primiparous women.200 They concluded that in the
primiparous group (those who had never given birth to a live infant), acculturation appeared
protective while it was a risk factor in the multiparous group; the authors examined the effect
modification of prior CS delivery for the multiparous category and did not note any difference in
the results. The study population comprised low-income, low-risk Latinas and hence excluded
those with private/military payment plans, and adjusted for factors that could influence clinical
discretion in performing CS. It is important to note that they did not separate the method of
delivery by emergency or elective CS, did not consider the length of residence and other
acculturation factors in their analysis, and low-acculturated Latinas outnumbered high-
acculturated Latinas.
In Norway, Sørbye et al. studied the risk of CS delivery from 1990–2009 among immigrants
according to the length of residence.188 They used population-based birth registry data linked to
immigration data for first deliveries among 23 147 immigrants from 10 countries and 385 306 non-
immigrants from 1990–2009 and grouped countries of origin as having low or high CS levels. They
reported that planned CS was independently associated with longer length of residence in Norway
among the lower CS group. Immigrants with a history of 2–5 years of residence had a 70% higher
risk of elective CS than those who had less than one-year length of stay in the country, and more

CHAPTER 2. LITERATURE REVIEW
PAGE | 42
than six years length of residence doubled the risk. Compared with non-immigrants, planned CS
was lower in those with <2 years residency and the risk converged by 2–5 years of residence in
Norway.188 This was a large study with the analysis adjusted for maternal age, year of delivery,
year of arrival, age at immigration, level of birth facility, multiple delivery, gestational age, pre-
gestational diabetes, preeclampsia, placenta previa, abruptio placentae (only for CS and
emergency CS), SGA (5 percentile) and large-for-gestational-age (95 percentile). The authors did
not have data on BMI or level of education to adjust their analyses for these factors; however, the
origins of the immigrants in the study population were closer to that of Australian society (Iraq,
Pakistan, Poland, Turkey, Yugoslavia, Vietnam, the Philippines, Somalia, Sri Lanka, Thailand) and
the study presented a reasonably robust analysis to conclude that acculturation is probably
associated with changes in the utilisation of elective CS as reported.
SUMMARY 2.4
Each year, millions of lives are lost worldwide due to mortality and morbidities attributed to
stillbirth, preterm birth and low birthweight. Most of these outcomes happen in low- and middle-
income countries due to the lack of access to prenatal and obstetric care and appropriate
interventions where indicated. However, some high-income countries, such as Australia, despite
having a universal health insurance scheme covering all Australian citizens and permanent
residents (Medicare), coupled with the provision of high-quality antenatal and obstetric care by
the public healthcare system, have reached a plateau of success; the prevalence of these adverse
outcomes has not decreased in the population in the last couple of decades.
Many maternal characteristics, such as age, pre-existing medical conditions, and smoking during
pregnancy, are now established risk factors for adverse pregnancy outcomes in the current body
of literature. There is some evidence that demographic characteristics, such as ethnicity, migrant
status, and even level of integration into the new society as social determinants of health, may be

CHAPTER 2. LITERATURE REVIEW
PAGE | 43
associated with these adverse outcomes. However, findings are not consistent in all jurisdictions,
and the extent of the influence of these determinants depends not only on an individual’s
characteristics but a combination of those with the health service provider’s approach,
government policies and nationwide regulations within each jurisdiction.
In Australia, immigration is the main driver of population growth, and overseas-born residents
constitute almost one-third of the total population, with those born in China, India, and Philippine
exceeding those born in England and New Zealand. Despite the remarkable diversity and the influx
of immigrants from low- and middle-income countries, the effect of ethnicity, migrant status,
integration and acculturation of migrants on pregnancy outcomes of stillbirth, preterm birth and
low birthweight have not been investigated enough. This issue is even more relevant in WA where
migrant families outnumber non-migrants. Studies available are either old or limited to one or two
specific populations and, in general, lack the depth and breadth required for answering such
research questions. While qualitative studies can be insightful, they do not have the power and
completeness of data required to examine any association with adverse pregnancy outcomes and
to draw clinically and statistically meaningful conclusions. The most robust and reliable studies in
the literature, which have successfully addressed aspects of pregnancy outcomes in migrants in
relation to ethnicity and acculturation with sufficient statistical power, are population-based
studies conducted using administrative health registries and data linkage. Nordic countries have a
long tradition of using such nationwide and complete registries containing virtually all the
residents in those countries using unified identification.201 In Australia, the first resource of this
kind was formally established in WA in 1995 and has been a pioneer of innovation in data linkage
techniques and surrounding processes and protocols.202 Thus, the advanced data linkage system
available in WA, which links routinely collected administrative health data and a variety of non-

CHAPTER 2. LITERATURE REVIEW
PAGE | 44
health datasets, provides the unique opportunity for a whole-population investigation with
enough power to investigate this thesis objective.

CHAPTER 3. GENERAL METHODS
PAGE | 45
CHAPTER 3. GENERAL METHODS
This chapter explains the general methodology used to address the research questions covered by
this thesis, including the design of the project, data sources, study population and variables
considered. Furthermore, the role of the PhD candidate and the tasks undertaken to develop and
deliver the project are described.
DATA SOURCES 3.1
Linked routinely collected administrative health and registry data for the state of WA were used in
this thesis.
ROUTINELY COLLECTED ADMINISTRATIVE HEALTH DATA 3.1.1
Administrative health and medical records are rich resources of information that are routinely
collected in the health system for monitoring service management, provision, delivery and
outcomes, and have significant research potential.
DATA LINKAGE 3.1.2
Data linkage is defined as the process of bringing together records related to the same entity from
two or more different data sources.203,204 This process can be performed at a population level and
has numerous advantages for observational research. Figure 3.1 shows how data linkage can be
used to provide a picture of someone’s health history. Given the possibility of accessing health the
health records of the parents, the health picture can cover a period from before birth to death.
Prospective epidemiological studies are prone to selection bias. In other words, the population
selected for such studies may not represent the target population. This could happen during the
recruitment phase of the study, either as a result of the procedures considered for the selection of
the subjects in the design and/or implementation stage or arising from factors influencing the

CHAPTER 3. GENERAL METHODS
PAGE | 46
participation of the individuals.205,206Population-based record linkage helps to reduce the
likelihood of such bias as the whole population is studied, and the selection phase is omitted.
It is believed that diseased participants tend to remember the possible exposures or risk factors
better than healthy counterparts, which is known as recall bias.206 The probability of such bias can
also be avoided as data are usually collected at the time of the event, before the outcome or
regardless of the outcome, and is not influenced by memory or choice of answer by study
participants.207
Cost-effectiveness is another advantage, as the data can address many hypotheses and/or public
health questions without conducting several cohort studies.204,207 Maintaining patient privacy is
also possible as researchers can use merged data without personal identifiers.204 Large sample
sizes, with increased power, facilitate the monitoring of marginal changes in the outcomes due to
changes in a policy or practice; generalisability of the results and rapid analysis are other
advantages of data linkage.208
Using routinely collected administrative health data can be challenging depending on the process
of generating data and factors influencing what items are and are not recorded.207,208 Such
influences could result from what the healthcare system; practitioner or even the patients
themselves choose and may lead to a poor data record or missing information on primary
exposure, which can confound or affect modification variables.209 Linkage may be helpful in such
instances by providing more resources for inter-dataset examination of information and
consequently alleviating concerns regarding the accuracy and reliability of the variables.
WA DATA LINKAGE SYSTEM 3.2
The WA Data Linkage System (WADLS) is one of the first few systematic health data linkages in the
world. It was established in 1995 to connect all available health and related information for the

CHAPTER 3. GENERAL METHODS
PAGE | 47
WA population and includes a range of statutory and other data collections, some of which
contain records from as early as 1966.204 There has been growing interest within Australia over the
last few years to use the experience and leverage the expertise gained over decades of linkage in
WA and extend the infrastructure across the whole country. As such, WADLS has been used as a
successful model for the development of similar systems more recently, with support and funding
from the government and academic partners.210
FIGURE 3.1 PERSON-BASED LINKAGES
Source: WA Data Linkage website: https://www.datalinkage-wa.org.au/wp-content/uploads/2019/02/DLB-Public-Slides-2017-02-About-Data-Linkage.png
HISTORY 3.2.1
The need and potential for a systematic approach to record linkage in WA were first proposed by
Professor Michael Hobbs in 1970; however, the initial scheme that began in the 1970s remained
limited to specific purposes.204 The WA Maternal and Child Health Research Database was created
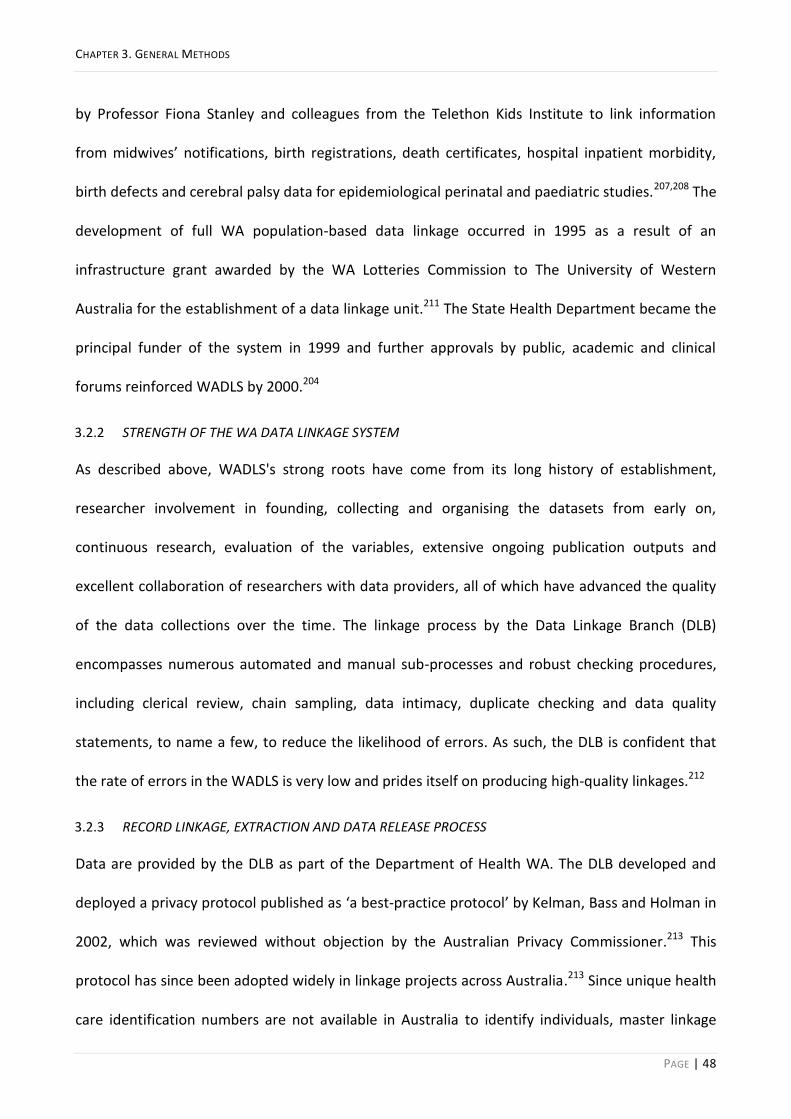
CHAPTER 3. GENERAL METHODS
PAGE | 48
by Professor Fiona Stanley and colleagues from the Telethon Kids Institute to link information
from midwives’ notifications, birth registrations, death certificates, hospital inpatient morbidity,
birth defects and cerebral palsy data for epidemiological perinatal and paediatric studies.207,208 The
development of full WA population-based data linkage occurred in 1995 as a result of an
infrastructure grant awarded by the WA Lotteries Commission to The University of Western
Australia for the establishment of a data linkage unit.211 The State Health Department became the
principal funder of the system in 1999 and further approvals by public, academic and clinical
forums reinforced WADLS by 2000.204
STRENGTH OF THE WA DATA LINKAGE SYSTEM 3.2.2
As described above, WADLS's strong roots have come from its long history of establishment,
researcher involvement in founding, collecting and organising the datasets from early on,
continuous research, evaluation of the variables, extensive ongoing publication outputs and
excellent collaboration of researchers with data providers, all of which have advanced the quality
of the data collections over the time. The linkage process by the Data Linkage Branch (DLB)
encompasses numerous automated and manual sub-processes and robust checking procedures,
including clerical review, chain sampling, data intimacy, duplicate checking and data quality
statements, to name a few, to reduce the likelihood of errors. As such, the DLB is confident that
the rate of errors in the WADLS is very low and prides itself on producing high-quality linkages.212
RECORD LINKAGE, EXTRACTION AND DATA RELEASE PROCESS 3.2.3
Data are provided by the DLB as part of the Department of Health WA. The DLB developed and
deployed a privacy protocol published as ‘a best-practice protocol’ by Kelman, Bass and Holman in
2002, which was reviewed without objection by the Australian Privacy Commissioner.213 This
protocol has since been adopted widely in linkage projects across Australia.213 Since unique health
care identification numbers are not available in Australia to identify individuals, master linkage

CHAPTER 3. GENERAL METHODS
PAGE | 49
files are created using computerised probabilistic matching of identifiers, such as medical record
number (unique only to metropolitan public hospitals), surname, first given name, initial, date of
birth, sex and address as the principal matching fields.211 Soundex and NYSIIS name compression
algorithms and clerical checking of additional information are applied to the process.211 A
systematic review on the accuracy of probabilistic record linkage found the sensitivity of linkage
using such an approach ranged from 74–98% and specificity ranged from 99–100%.214
Duplication errors and other technical glitches in WA health records have been corrected by
application of systematic data linkage and resulted in greater accuracy of recording at an
administrative level; previous experience with the WA core datasets suggests a reasonably high
level of data accuracy.204,215The linkage processes are illustrated in Figures 3.2.
FIGURE 3.2 DATA LINKAGE PROCESS
Source: WA Data Linkage website available from https://www.datalinkage-wa.org.au/wp-content/uploads/2019/02/DLB-Public-Slides-2017-05-Data-Linkage-Process.png

CHAPTER 3. GENERAL METHODS
PAGE | 50
DLB provides customised project specific linkage keys extracted by encrypting the “linkage key” for
each chain of records. Once the study population is defined, the Linkage Team extracts the
encrypted linkage keys for each requested dataset. The requested content data from each data
collection will be attached to the linkage keys. This process is arranged by Data Custodians. The
encrypted and password-protected data will then be released to the applicants via secure online
transfer by the DLB Client Services Team after quality assurance and checking that the data match
the request. Data extraction processes are illustrated in Figure 3.3.
FIGURE 3.3 DATA EXTRACTION PROCESS
Source: WA Data Linkage website available from https://www.datalinkage-wa.org.au/wp-content/uploads/2019/02/DLB-Public-Slides-2017-06-Linked-Data-Extraction-Process.png

CHAPTER 3. GENERAL METHODS
PAGE | 51
PRIVACY AND SECURITY 3.2.4
The Department of Health WA provides multiple layers of privacy protection to the original data.
The ‘best-practice protocol’ protects privacy by restricting access to personal identifying
information to a specialised Linkage Team that provide encrypted “linkage keys” to Data
Custodians who then can add them to content data for a specific project and release only de-
identified information to approved data applicants.213 The DLB has created a culture among its
staff that values the protection of individual privacy, which is maintained by employing Linkage
Officers under the Public Sector Management Act (1994) that is bound by privacy and
confidentiality provisions, undertaking Criminal Record Screening, signing confidentiality
acknowledgments, and providing staff with regular training about their obligations.216 The
approved applicants also sign data usage and confidentiality agreements whilst separate projects
receive data with a unique set of project identifier which make it impossible for researchers to join
together two linked data sets created for different projects.213
Physical and technological security layers are also applied by the Department of Health, including
locating servers in a secured room within a restricted area on a restricted access floor of the
building that is monitored and audited and requires separately authorised permission for DLB staff
to access. Furthermore, several layers of network security and monitoring, encrypting linkage
keys, performing data transfer through secure encrypted portals or by hand delivery, and
protecting the local intranet by an additional layer of monitored firewalling are some additional
strategies used to secure data.217
DATA COLLECTIONS 3.2.5
The WA Data Linkage System comprises many core datasets as well as satellite linkages to other
agencies' data collections in WA. Figure 3.4 shows the core datasets and some infrastructure
‘satellite’ linkages as of September 2014 when this project was being designed. Over the last few

CHAPTER 3. GENERAL METHODS
PAGE | 52
years, the linkage coverage has expanded and more data collections are now accessible through
the system.
FIGURE 3.4 DATA COLLECTIONS (AS OF SEPTEMBER 2014)
Source: WA Data Linkage website available from https://www.datalinkage-wa.org.au/
GEOCODING 3.2.6
Geocoding is the process of transforming a description of a location to a location on the earth's
surface. Figure 3.5 shows the process of Geocoding and its use at WADLS. Geocoding is performed
by converting an address into a latitude/longitude, using a set of reference data, and placing this
map point within spatial boundaries such as the Statistical Area Levels 1 and 2 (SA1 and SA2,
respectively) and Local Government Area (LGA). The Socio-Economic Indexes for Areas (SEIFA) and
Remoteness Area (RA) are derived by DLB from these boundaries by assigning the boundaries and
indices using mapping and concordance tables created by the Australian Bureau of Statistics
(ABS).218,219Remoteness Areas divide Australia into 5 classes of remoteness on the basis of a

CHAPTER 3. GENERAL METHODS
PAGE | 53
measure of relative access to services. Access to services are measured using the
Accessibility/Remoteness Index of Australia (ARIA)220 which is a geographical index defining
remoteness based on accessibility to goods, services and opportunities for social interaction across
Australia based on road distance from populated towns.220This index was produced by the Hugo
Centre for Migration and Population Research at the University of Adelaide, sponsored by the
Department of Health and Aged Care, and as a standard classification divides the whole country
into five categories of highly accessible, accessible, moderately accessible, remote and very
remote, that are used for making comparison and undertaking relevant statistical analysis.221,222
FIGURE 3.5 GEOCODING AT THE WA DATA LINKAGE BRANCH
Source: WA Data Linkage website available from https://www.datalinkage-wa.org.au/wp-content/uploads/2019/02/DLB-Public-Slides-2017-07-Geocoding.png
The four indices in SEIFA are (1) Index of Relative Socio-economic Disadvantage, derived from
Census variables related to disadvantages, such as low income, low educational attainment,

CHAPTER 3. GENERAL METHODS
PAGE | 54
unemployment, and dwellings without motor vehicles, (2) Index of Relative Socio-economic
Advantage and Disadvantage, a continuum of advantage to disadvantage derived from Census
variables related to both advantage and disadvantage, like households with low income and
people with a tertiary education, (3) Index of Economic Resources, derived from Census variables
like the income, housing expenditure and assets of households, and (4) Index of Education and
Occupation; including Census variables relating to the educational and occupational characteristics
of communities, like the proportion of people with a higher qualification or those employed in a
skilled occupation.219 In this project, the Index of Relative Socio-economic Disadvantage (IRSD) was
used.
GENEALOGICAL LINKAGE 3.2.7
The Family Connection Genealogical Register of the WADLS was initiated in 2002 to store family
links between genealogically-related individuals.204 It created additional systems of links that
represent genealogical relationships for the WA population, primarily using information from
births, deaths and marriage registrations. It allows identification of family relationships in multiple
generations and assesses the degree of relatedness.223 This was a substantial advancement for the
WADLS and brought about a unique opportunity to investigate the inheritance of human ailments,
the impact of familial factors in health and disease, and for risk assessment.204,223Figure 3.6
illustrates the processes involved in creating family connections and genealogical linkage at
WADLS.

CHAPTER 3. GENERAL METHODS
PAGE | 55
FIGURE 3.6 WA FAMILY CONNECTIONS SYSTEM
Source: WA Data Linkage website available from https://www.datalinkage-wa.org.au/wp-content/uploads/2019/02/DLB-Public-Slides-2017-08-Family-Connections.png
DATA APPLICATION AND PROJECT MANAGEMENT 3.3
Data application from WADLS involved many thorough assessment and review processes. A copy
of all the approvals and the data variable lists can be found in the Appendices.

CHAPTER 3. GENERAL METHODS
PAGE | 56
FEASIBILITY ASSESSMENT 3.3.1
Before applying for Department of Health WA Human Research Ethics Committee approval, all
data applicants were required to submit a draft Application for Data with three modules:
Module 1: A completed Application for Data Form.
Module 2: Data Services, including completing and submitting application forms for Linkage,
Extraction, Geocoding, Family Connections, Matched Comparison Group Selection, and
Aboriginal and/or Torres Strait Islander Flag.
Module 3: Variable Lists, involving completing the variable list, with separate lists for mothers
and/or babies as appropriate, for each dataset required in the study. In the case of this
project, the variable list forms included those for Birth Registrations, Death Registrations,
Midwives Notification System, Hospital Morbidity Data Collections, and WA Register of
Developmental Anomalies – Birth Defects.
The feasibility assessment phase allowed data custodians and the DLB to familiarise themselves
with the project, provide advice on the request and identify any issues that need correction before
work begins. This process involved liaison with all parties involved, responding to queries received
or issues raised, including the need to take an alternative methodological approach to maintain
the standards required by the Department of Health. After receiving this preliminary approval,
ethics approval could be sought.
ETHICAL REVIEW AND APPROVAL FOR DATA RELEASE 3.3.2
The Human Research Ethics Committee of the WA Department of Health is responsible for
overseeing the use and disclosure of personal health information held in the data collections used
by the WADLS. The Committee is registered with the National Health and Medical Research
Council (NHMRC) and ensures compliance with the 2007 NHMRC National Statement on Ethical

CHAPTER 3. GENERAL METHODS
PAGE | 57
Conduct in Human Research. If the project involves investigation of Aboriginal and Torres Strait
Islander people data, ethics approval must also be sought from the Western Australian Aboriginal
Health Ethics Committee (WAAHEC); however, as this project focused on migrants, data from this
population was not requested, and consequently, approval from WAAHEC was not sought.
All paperwork submitted for feasibility approval, including the research protocol and data
application forms, accompanied the completed Ethics Application form submitted to the Human
Research Ethics Committee of the WA Department of Health for review and approval.
DLB issued the final approval once the ethics approval was granted allowing the commencement
of linkage and extraction of data as specified in the data application.
DATASETS USED FOR THIS STUDY 3.3.3
The datasets used for this thesis included four core datasets—Midwives Notification System, Birth
Registrations, Hospital Morbidity Data Collection and Death Registrations. An additional WA
Health dataset, the WA Register of Developmental Anomalies, was linked to these datasets, and
Family Connections was used for the genealogical linkage to identify the children of the women in
the study. De-identified unit record level data was acquired from the DLB.
A brief overview of each dataset used for this doctoral research is provided below. A detailed list
of variables is presented in Table 3.1. A copy of the data application form for each dataset is
available in the Appendices.

CHAPTER 3. GENERAL METHODS
PAGE | 58
TABLE 3.1 DATASETS AND VARIABLES
Data collection Variables
Birth Registrations Child’s sex, date of birth, birthweight, born alive, plurality, gestation period, maternal age, mother and father’s place of birth, year mother and father arrived in Australia
Midwives Notification System (MNS)
Maternal age, height, marital status, ethnic origin, previous pregnancies and outcomes, previous caesarean, caesarean last delivery, previous multiple birth, smoking during pregnancy, complications of pregnancy, medical conditions, procedures/treatments, intended place of birth at onset of labour, labour details including onset of labour, augmentation, induction, analgesia (during labour), delivery details including, duration of labour 1st stage, duration of labour 2nd stage, anaesthesia (during delivery), complications of labour and delivery, perineal status, baby details including born before arrival, baby number, presentation, method of birth, accoucheur(s), gender, status of baby at birth, infant weight, length of baby (cm), head circumference, time to establish unassisted regular breathing, resuscitation, Apgar score at 1 minute, Apgar score at 5 minutes, estimated gestation. SEIFA
Hospital Morbidity Data Collection (HMDC)
Hospital category, length of stay, funding source, days of qualified newborn care, days of hospital-in-the-home care, mode of separation, all diagnosis and procedure codes
Mortality Register Age of person, country of birth, born overseas flag, time resident in Australia (years and/or months), cause of death, date of death
WA Register of Developmental Anomalies (Birth Defects)
Birth outcome (live birth, stillbirth, termination of pregnancy), date of death, gestational age, diagnosis code, diagnosis description, Is major, diagnosis time
3.3.3.1 Midwives Notification System
The WA Health Act 1911 requires that midwives report information on all births they attend in
WA.224 All births—where the infant is 20 weeks or more gestational age or 400 grams or more
birthweight if gestation is unknown have been routinely reported to the Midwives Notification
System (MNS) since 1974. The information that must be reported is specified on the Midwives
Notifications Form 2.139
Information about the mother is reported from conception to 24 hours following the birth or
death, discharge or transfer from the birth site, whichever is soonest. This includes the history of
previous pregnancy outcomes and medical conditions diagnosed before conception and present
during this pregnancy.135

CHAPTER 3. GENERAL METHODS
PAGE | 59
Information about the infant is reported from the time of birth to the time of discharge or transfer
from the birth site, or death, whichever is soonest. 135
3.3.3.2 Birth & death registrations and family connections
The Western Australian Registry of Births, Deaths and Marriages, which is a division of the WA
Department of the Attorney General, creates and preserves an accurate, permanent and
confidential record of births, deaths and marriages in WA in accordance with the Births, Deaths
and Marriages Registration Act 1998.225 This Act requires that a child's birth to be registered within
60 days of the birth and that both parents complete and sign a Birth Registration Form supplied by
the hospital or midwife who delivers the baby.
Death for all people in WA is registered within 14 days of the date of death by statutory
requirements.221 The date of death, as well as principal and contributing causes of death, is
available in this data collection.
3.3.3.3 Hospital Morbidity Data System
The Hospital Morbidity Data System (HMDS) contains information related to all inpatient discharge
summary data from all public and private hospitals in WA. The HMDS is a key information source
used throughout the Department of Health, public and private hospitals to meet the mandatory
and statutory reporting requirements. It is one of the largest data collections and comprises more
than 22 000 000 electronic inpatient records dating back to 1970.226 For each record there are
more than 200 data elements captured; most of these correspond with National Minimum Data
Set requirements and are based on the National Health Data Dictionary, as defined by the
Australian Institute of Health and Welfare.227 All admitting diagnoses (principal and secondary)
and procedures performed in a hospital are recorded in the HMDS.222

CHAPTER 3. GENERAL METHODS
PAGE | 60
3.3.3.4 WA Register of Developmental Anomalies
The WA Register of Developmental Anomalies (WARDA) covers two registers, the WA Birth
Defects Registry and the WA Cerebral Palsy Register, to record and monitor developmental
anomalies before six years of age in WA. This information has been collected in WA for more than
30 years. However, reporting of developmental anomalies became mandatory in 2011 by the State
Government.224The Chief Executive Officer of the hospital in which the diagnosis of such anomaly
is made and/or the doctor making the diagnosis or caring for the patient diagnosed are
responsible for notifying the Register. This is required within six months of the diagnosis. Further
details will be gathered by Register staff from medical records and/or doctors if required.228
3.3.3.5 Indigenous status flag
The Indigenous status flag was derived to systematically remove Indigenous births from the
dataset before the provision of data, and procedures performed in a hospital, because the project
focused on comparing migrant ethnic groups with the non-Indigenous Australian-born population,
as well as the need for an additional ethics approval procedure to be completed before working
with data inclusive of Indigenous data. As this study focused on migrants, data were excluded for
women of Aboriginal or Torres Strait Islander heritage, among whom the prevalence of stillbirth is
twice that of non-Indigenous Australians.229 This way, non-differential misclassification bias
towards the null hypothesis was avoided. The process of deriving Indigenous status is illustrated in
Figure 3.7.
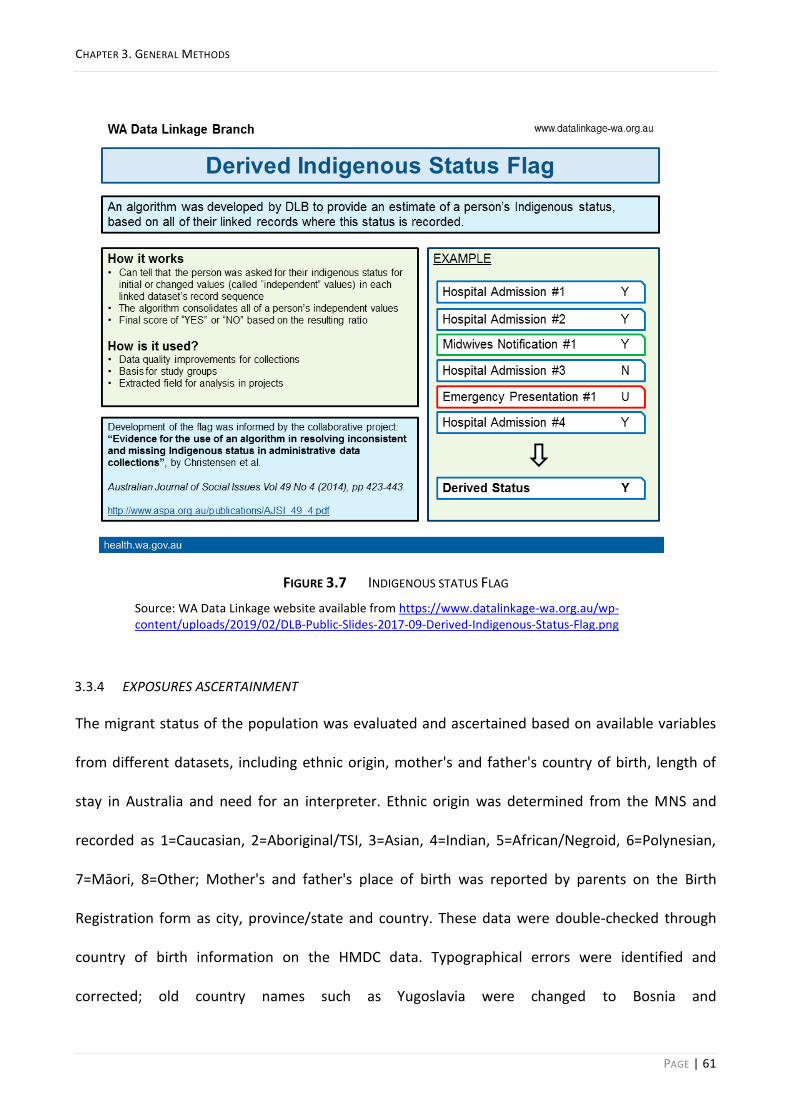
CHAPTER 3. GENERAL METHODS
PAGE | 61
FIGURE 3.7 INDIGENOUS STATUS FLAG
Source: WA Data Linkage website available from https://www.datalinkage-wa.org.au/wp-content/uploads/2019/02/DLB-Public-Slides-2017-09-Derived-Indigenous-Status-Flag.png
EXPOSURES ASCERTAINMENT 3.3.4
The migrant status of the population was evaluated and ascertained based on available variables
from different datasets, including ethnic origin, mother's and father's country of birth, length of
stay in Australia and need for an interpreter. Ethnic origin was determined from the MNS and
recorded as 1=Caucasian, 2=Aboriginal/TSI, 3=Asian, 4=Indian, 5=African/Negroid, 6=Polynesian,
7=Māori, 8=Other; Mother's and father's place of birth was reported by parents on the Birth
Registration form as city, province/state and country. These data were double-checked through
country of birth information on the HMDC data. Typographical errors were identified and
corrected; old country names such as Yugoslavia were changed to Bosnia and

CHAPTER 3. GENERAL METHODS
PAGE | 62
Herzegovina/Serbia/Montenegro/Kosovo, based on the city and province of place of birth, if
available. Missing countries of birth for mothers were also retrieved from the HMDC. Length of
stay in Australia was calculated by subtracting the year of birth of the baby (recorded on MNS)
from the year mother arrived in Australia (recorded on Birth Registration dataset), and need for an
interpreter was ascertained using the variable interpreter used (yes/no) that was available for all
births in hospital (99.0% of total births in WA) through the HMDC.
OUTCOMES ASCERTAINMENT 3.3.5
Stillbirth in Australia is defined as death of a baby of at least 20 completed weeks of gestation
before the complete expulsion or extraction from the mother.28 If death occurred before the
commencement of labour, it is recorded as antepartum stillbirth, and after labour started is
considered an intrapartum stillbirth.61 Type of stillbirth (antepartum/intrapartum), recorded on
the MNS from 2005 onwards, was available through the status of baby at birth. For stillbirths that
had not been reported by type, information on the presence or absence of the fetal heartbeat at
the commencement of labour was sought from death certificates. Terminations of pregnancies,
recorded as stillbirth, were identified through WARDA and death records, and were excluded.
Preterm birth was defined as birth before 37 completed weeks of gestation230 and was classified
as spontaneous (spontaneous onset) or medically indicated (premature birth after medical
intervention: induction of labour or elective CS). Spontaneous preterm birth was further
subdivided into idiopathic (spontaneous labour with intact fetal membranes) and preterm pre-
labour rupture of membranes (PPROM) where labour began spontaneously after
PPROM.93,94Estimated gestational age at time of birth (completed weeks), onset of labour
(spontaneous, induced, elective caesarean) and complications of pregnancy (data on pre-labour
rupture of membrane) from MNS were used to identify and classify these outcomes.

CHAPTER 3. GENERAL METHODS
PAGE | 63
Low birthweight (LBW) was defined as birthweight less than 2500 grams at the time of birth28, and
the infant’s weight (in grams) information on MNS was used to identify this outcome. Term-LBW
cases were identified by further consideration of the estimated gestational age at time of birth (in
completed weeks).
SAMPLE SIZE AND POWER 3.3.6
The overall design of the project was a retrospective cohort study comprising all births to non-
Indigenous women from 2005–2013. We initially estimated the sample size required based on an
unexposed (Australian-born mothers) to exposed (Overseas-born mothers) ratio of 2:1 to ensure
that studying the nine-year population cohort had an appropriate statistical power to detect a
significant result, if present. The sample size required was based on one of the least prevalent
outcomes of interest (i.e. intrapartum stillbirth) to ensure that the study had enough power to
detect possible disparities in the risk of such an outcome. The odds of experiencing stillbirth in
overseas-born women from African and/or South Asian backgrounds have been estimated at
around twice that of Australian-born women.13,159 The expected annual incidence of intrapartum
stillbirth in the unexposed population in WA is 0.0016. Therefore, to detect a relative risk of 1.5
with 95% confidence and 80% power with a 1:2 exposed: non-exposed ratio required a study
sample of 146 862 participants or 48 954 exposed (i.e. migrant) and 97 908 non-exposed (i.e.
Australian-born) participants. Thus, a cohort of all births to non-Indigenous women from 2005–
2013, with a population study of more than 250 000 births, was deemed to have enough power
for this study.
ETHICS APPROVAL 3.3.7
This study was approved by the Human Research Ethics Committee of the WA Department of
Health (2015/23). Due to the use of non-identifiable linked routinely collected administrative
health data for the whole population, written consent was not required to conduct the study.

CHAPTER 3. GENERAL METHODS
PAGE | 64
Further, The University of Western Australia Human Ethics Office was notified of this review and
approval, which recognised the existing approval of the non-UWA ethics committee with no need
for the completion of its ethics review process (RA/4/1/7602).
DATA ANALYSIS 3.3.8
Chapters 4-8 comprise five studies and the statistical analyses undertaken for this thesis and the
Methods section in each chapter contains the details of the specific analysis carried out to answer
the research questions in each study. This includes the efforts carried out to retrieve missing data
from various data sources and the sensitivity analyses undertaken.

CHAPTER 4. STILLBIRTH, MIGRATION AND ETHNIC ORIGIN IN WA
PAGE | 65
CHAPTER 4. STILLBIRTH, MIGRATION AND ETHNIC ORIGIN IN WESTERN
AUSTRALIA
This chapter comprises a paper, published in the Medical Journal of Australia, which explores the
risk of antepartum and intrapartum stillbirth in migrants from white, Asian, Indian, African, Māori
and ‘other’ non-white ethnic backgrounds. The risk of stillbirth among the population groups was
explored in preterm (<37 weeks gestation) as well as term and post-term (≥37 weeks gestation)
periods separately. This study relates to the first objective of the thesis: To investigate prevalence
proportion and the risk of antepartum and intrapartum stillbirth in WA with respect to maternal
country of birth and ethnic origin.
The citation details for this paper are as follows and a copy of the paper is available in the
Appendices:
Mozooni M, Preen DB, Pennell CE. Stillbirth in Western Australia, 2005-2013: the influence of
maternal migration and ethnic origin. Med J Aust. 2018;209(9):394-400. PubMed PMID: 30282563.

CHAPTER 4. STILLBIRTH, MIGRATION AND ETHNIC ORIGIN IN WA
PAGE | 66
ABSTRACT 4.1
Objective: To investigate prevalence rates and the risk of antepartum and intrapartum stillbirth in
Western Australia with respect to maternal country of birth and ethnic origin.
Design, setting and participants: Whole-population retrospective cohort analysis of de-identified,
linked routinely collected birth, perinatal and mortality data for all births to non-Indigenous
women in WA from 2005–2013.
Main outcome measures: Crude and adjusted odds ratios (aORs) with 95% confidence intervals
were estimated, using logistic regression controlling for confounding factors, for all stillbirths,
antepartum stillbirths and intrapartum stillbirths, stratified by migrant status and ethnic
background (white, Asian, Indian, African, Māori, other).
Results: Women born overseas were more likely to have a stillbirth than Australian-born women
(aOR 1.26, 95% CI 1.09–1.37). No significant differences occurred for any type of stillbirth between
Australian-born women of white and non-white backgrounds, but non-white migrant women were
more likely than white migrants to have a stillbirth (OR 1.42, 95% CI 1.19–1.70). Compared with
Australian-born women, migrants of Indian (aOR 1.71, 95% CI 1.17–2.47), African (aOR 2.12, 95%
CI 1.46–3.08), and ‘other’ ethnic origin (aOR 1.43, 95% CI 1.06–1.93) were more likely to have an
antepartum stillbirth; women of African (aOR 5.08, 95% CI 3.14–8.22) and ‘other’ (aOR 1.86, 95%
CI 1.15–3.00) origin were more likely to have an intrapartum stillbirth.
Conclusions: Immigrants of African or Indian background appear to be at greater risk of
antepartum and intrapartum stillbirth in WA. Specific strategies will reduce the prevalence of
stillbirth in these communities.
INTRODUCTION 4.2
More than 2.6 million stillbirths were reported around the world in 2015.42 Stillbirth challenges
families, societies, practitioners and health care systems,231,232 but its scientific investigation only
recently gained momentum, after the Lancet launched two stillbirth article series in 2011 and
2016.34,39 Almost 98% of stillbirths are in low- and middle-income countries, but they also occur in
high-income countries where socioeconomic factors influence the prevalence of stillbirth.61,62
International migration is at its highest level since the Second World War, and 64% of migrants live
in high-income countries.118 Migrants and women from non-white ethnic backgrounds generally
have more stillbirths than white migrants and non-migrant women.13,74,77,159,233

CHAPTER 4. STILLBIRTH, MIGRATION AND ETHNIC ORIGIN IN WA
PAGE | 67
Immigration is the principal component of population growth in Australia; in 2016, 35% of
residents had been born overseas,124 and 33% of women who gave birth in 2015 had been born
overseas.28 Western Australia recorded the greatest population growth of all Australian states and
territories from 2006–2016 (24.8% increase),234 and 62% of Western Australians have at least one
overseas-born parent.136
About 50% of stillbirths worldwide are intrapartum stillbirths, deemed preventable by good
obstetric care. The prevalence of intrapartum stillbirths is lower in high-income countries, but
constitutes almost 20% of stillbirths in some of these countries; this is significant, as this
prevalence is related to quality of care.61 Women of non-white ethnic background, particularly
African and Asian women, are at greater risk of antepartum stillbirth than white women.13,159,233
However, the only published study of intrapartum stillbirth was a prospective study that found
higher crude rates and odds of intrapartum stillbirth for Black women in the United Kingdom
(1988–2000).9 Data on the timing of death is scarce, posing significant challenges for preventive
strategies in clinical practice.62
This study estimated ethnic group-specific prevalence rates to determine the association between
maternal country of birth and ethnic origin and the risk of antepartum and intrapartum stillbirth in
a whole-population sample of WA births (2005–2013).
METHODS 4.3
STUDY DESIGN AND PARTICIPANTS 4.3.1
A whole-population retrospective cohort analysis was undertaken using de-identified, linked
routinely collected data for all births to non-Indigenous women in WA from 1 January 2005 to 31
December 2013.
DATA SOURCES AND LINKAGE 4.3.2
The Western Australia Data Linkage System (WADLS) applies probabilistic matching based on full
name and address, phonetic compression algorithms, and other identifiers to link data from a
variety of health and other administrative datasets.211 Geocoding with address parsing software
assigns residential addresses to Census statistical areas to determine their Index of Relative Socio-
economic Disadvantage (IRSD), an Australian Bureau of Statistics-developed measure of
socioeconomic status that summarises a range of information about the economic and social
conditions of people and households in an area.219 The estimated frequency of invalid or missed

CHAPTER 4. STILLBIRTH, MIGRATION AND ETHNIC ORIGIN IN WA
PAGE | 68
links based on evaluation of linked chains is very low (0.11%) and the linkage procedures are
widely accepted as best practice.204,213
The primary data source was the Midwives’ Notification System (MNS), a highly reliable statutory
data collection of demographic, pregnancy and delivery information for all births in WA.235 The
MNS data were supplemented by data from other WA statutory data collections: the Hospital
Morbidity Data Collection (information related to inpatient discharges from all hospitals), the WA
Registry of Developmental Anomalies (WARDA; developmental anomalies identified by six years of
age, including in fetuses of terminated pregnancies), and Birth and Death Registrations.
Genealogical linkage was also undertaken by the WADLS Family Connections Linkage Facility.
EXPOSURES 4.3.3
Maternal ethnic background (‘ethnic origin’: the ethnic background with which the woman
identifies) is recorded by the MNS as Caucasian (white), Aboriginal/Torres Strait Islander, Asian,
Indian, African, Māori, Polynesian, or other. As our study focused on migrants, data for women of
Aboriginal or Torres Strait Islander heritage, among whom the prevalence of stillbirth is twice that
of non-Indigenous Australians,44 were excluded to avoid non-differential misclassification bias
towards the null hypothesis. Women of Polynesian origin (289 women, 0.1%) were included in the
‘other’ group.
‘Migrant status’ (Australian- or overseas-born) was based on the mother’s place of birth (complete
for 99% of the births) in the Birth Registration data; this information was merged with MNS data.
‘Country of birth’ in the mother’s hospital record was also used for validation and to retrieve
missing values. The migrant group was stratified by ethnic origin, complete for 99.99% of the
population.
OUTCOMES 4.3.4
Stillbirth is defined as death of a baby of at least 20 completed weeks gestation before complete
expulsion or extraction from the mother.28 Death before labour commences is termed antepartum
stillbirth, and after labour commences, intrapartum stillbirth.61 ‘Status of baby at birth’ (MNS data)
was used to identify live births and stillbirths. Type of stillbirth was reported as antepartum or
intrapartum for 80% of stillbirths in MNS data; information on the presence or absence of the fetal
heartbeat at the start of labour was obtained from death certificates. Consequently, the type of

CHAPTER 4. STILLBIRTH, MIGRATION AND ETHNIC ORIGIN IN WA
PAGE | 69
stillbirth was available for 99.98% of stillbirths. Terminations of pregnancy, identified in WARDA
and death records, were excluded (433 cases).
STATISTICAL ANALYSIS 4.3.5
All analyses were performed in Stata 13.1 (StataCorp). Demographic and obstetric characteristics
were tabulated by ethnic group and Pearson X2 or Fisher exact tests employed as appropriate in
descriptive analyses. Prevalence rates per 1000 total births of at least 20 weeks gestational age of
overall, antepartum and intrapartum stillbirths from 2005–2013 were calculated; specifically,
prevalence rates per 10 000 total births were calculated for term and post-term stillbirths. Migrant
populations of women—stratified into white, Asian, Indian, African, Māori, and ‘other’—were
compared with the Australian-born population. Crude odds ratios (ORs) with 95% confidence
intervals (CIs) were estimated by univariate logistic regression for overall, antepartum and
intrapartum stillbirths; P<0.05 was deemed statistically significant. Covariates—established and
clinically plausible risk factors significant in the univariate analysis—were selected a priori.
Multivariable logistic regression analysis was adjusted for previous stillbirth, year of birth,
maternal age group, sex of baby, marital status, pregnancy complications, medical conditions,
smoking during pregnancy, parity, plurality, and IRSD. IRSD data were missing for 3.3% of women,
who were categorised as a separate subgroup to retain all the cases in the analysis. Migrant
countries of birth were further assigned to United Nations geographic regions—South Asia (India,
Pakistan, Sri Lanka, Afghanistan, Bangladesh), South-East and East Asia (Vietnam, Malaysia,
Indonesia, China, Japan), Middle East (Iraq, Israel, Jordan, Turkey, Yemen, Cyprus), other Asia,
Oceania, Africa, Europe and the Americas—and data for these regions compared with the
combined data for Australia and New Zealand.
Two sensitivity analyses were undertaken: the first excluded women with more than one birth
record in the dataset to examine the effect of non-independence that can affect the analysis of
large perinatal datasets;74 the second excluded stillbirths of fetuses with major congenital
anomalies, as the mortality associated with congenital anomalies is higher for babies of women
from some ethnic backgrounds, perhaps due to restricted access or differing attitudes to screening
and termination of pregnancy.84
ETHICS APPROVAL 4.3.6
The Human Research Ethics Committee of the WA Department of Health approved this study
(reference, 2015/23).
CHAPTER 4. STILLBIRTH, MIGRATION AND ETHNIC ORIGIN IN WA
PAGE | 70
RESULTS 4.4
There were 260 997 live and stillbirths to non-Indigenous women in WA from 2005–2013,
including 172 571 births (66.1%) to Australian-born and 88 395 (33.9%) to migrant mothers (Table
4.1).
Most migrant mothers were slightly older than the Australian-born women; the proportion who
smoked during pregnancy greater among Australian-born mothers (14%) than most migrant
groups (1–9%; exception: Māori women, 39%). The proportion of women who were multiparous
was highest for African migrants (43.9%), as were the proportions of extremely preterm (20–27
weeks) births (1.3%) and post-term (≥42 weeks) pregnancies (2.1%). The proportions of women in
the least disadvantaged IRSD quintile were largest for migrant women with white and Asian
backgrounds (Table 4.2). About 24% of stillbirths were intrapartum stillbirths (Table 4.1).
Among Australian-born women there were 4.7 stillbirths (3.5 antepartum, 1.1 intrapartum) per
1000 births; among overseas-born women, there were 5.7 stillbirths (4.0 antepartum, 1.5
intrapartum) per 1000 births. The highest prevalence of stillbirth was among African migrant
women (12.3 stillbirths, 7.5 antepartum stillbirths, 4.8 intrapartum stillbirths per 1000 total births)
(Table 4.3).

CHAPTER 4. STILLBIRTH, MIGRATION AND ETHNIC ORIGIN IN WA
PAGE | 71
TABLE 4.1 PREGNANCY OUTCOMES FOR 260 997 LIVE AND STILLBIRTHS IN WESTERN AUSTRALIA, 2005–2013, BY MATERNAL ETHNIC ORIGIN
Australian-born women
Migrant women All women P
White Asian Indian African Māori Other
All births (proportion of all births)
172 571 (66.1%)
48 546 (18.6%)
18 212 (7.0%)
5503 (2.1%)
4155 (1.6%)
2941 (1.1%)
9038 (3.5%)
260 997
Pregnancy outcomes
Live birth 171 759 (99.5%)
48 315 (99.5%)
18 117 (99.5%)
5464 (99.3%)
4104 (98.8%)
2923 (99.4%)
8972 (99.3%)
259 684 (99.5%)
0.001
Stillbirth (total) 812 (0.5%)
231 (0.5%)
95 (0.5%)
39 (0.7%)
51 (1.2%)
18 (0.6%)
66 (0.7%)
1313 (0.5%)
0.001
Antepartum 605 (0.4%)
162 (0.3%)
69 (0.4%)
31 (0.6%)
31 (0.8%)
15 (0.5%)
47 (0.5%)
960 (0.4%)
0.002
Intrapartum 185 (0.1%)
57 (0.1%)
24 (0.1%)
<10 (<0.1%)
20 (0.5%)
<10 (<0.1%)
19 (0.2%)
317 (0.1%)
0.001
Undefined 22 (<0.1%)
12 (<0.1%)
<10 (<0.1%)
0 0 0 0 36 (<0.1%)
0.06
Sex of baby 0.98
Boy 88 307 (51.2%)
24 720 (50.9%)
9466 (52.0%)
2813 (51.1%)
2131 (51.3%)
1490 (50.7%)
4608 (51.0%)
133 549 (51.2%)
Girl 84 252 (48.8%)
23 821 (49.1%)
8745 (48.0%)
2690 (48.9%)
2023 (48.7%)
1451 (49.3%)
4429 (49.0%)
127 428 (48.8%)
Undetermined 12 (<0.1%)
<10 (<0.1%)
<10 (<0.1%)
0 <10 (<0.1%)
0 <10 (<0.1%)
20 (<0.1%)
Plurality 0.025
Singleton 167 481 (97.1%)
47 075 (97.0%)
17 822 (97.9%)
5389 (97.9%)
4031 (97.0%)
2883 (98.0%)
8725 (96.5%)
253 435 (97.1%)
Multiple 5090 (2.9%)
1471 (3.0%)
390 (2.1%)
114 (2.1%)
124 (3.0%)
58 (2.0%)
313 (3.5%)
7562 (2.9%)
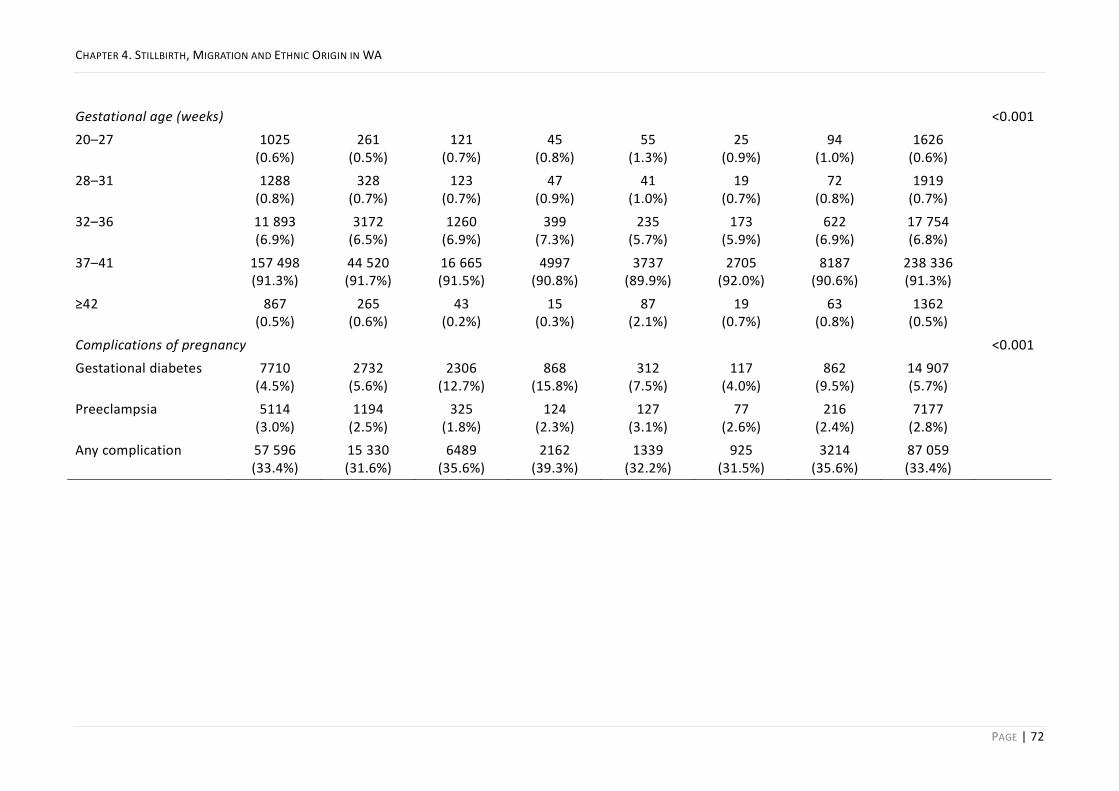
CHAPTER 4. STILLBIRTH, MIGRATION AND ETHNIC ORIGIN IN WA
PAGE | 72
Gestational age (weeks) <0.001
20–27 1025 (0.6%)
261 (0.5%)
121 (0.7%)
45 (0.8%)
55 (1.3%)
25 (0.9%)
94 (1.0%)
1626 (0.6%)
28–31 1288 (0.8%)
328 (0.7%)
123 (0.7%)
47 (0.9%)
41 (1.0%)
19 (0.7%)
72 (0.8%)
1919 (0.7%)
32–36 11 893 (6.9%)
3172 (6.5%)
1260 (6.9%)
399 (7.3%)
235 (5.7%)
173 (5.9%)
622 (6.9%)
17 754 (6.8%)
37–41 157 498 (91.3%)
44 520 (91.7%)
16 665 (91.5%)
4997 (90.8%)
3737 (89.9%)
2705 (92.0%)
8187 (90.6%)
238 336 (91.3%)
≥42 867 (0.5%)
265 (0.6%)
43 (0.2%)
15 (0.3%)
87 (2.1%)
19 (0.7%)
63 (0.8%)
1362 (0.5%)
Complications of pregnancy <0.001
Gestational diabetes 7710 (4.5%)
2732 (5.6%)
2306 (12.7%)
868 (15.8%)
312 (7.5%)
117 (4.0%)
862 (9.5%)
14 907 (5.7%)
Preeclampsia 5114 (3.0%)
1194 (2.5%)
325 (1.8%)
124 (2.3%)
127 (3.1%)
77 (2.6%)
216 (2.4%)
7177 (2.8%)
Any complication 57 596 (33.4%)
15 330 (31.6%)
6489 (35.6%)
2162 (39.3%)
1339 (32.2%)
925 (31.5%)
3214 (35.6%)
87 059 (33.4%)

CHAPTER 4. STILLBIRTH, MIGRATION AND ETHNIC ORIGIN IN WA
PAGE | 73
TABLE 4.2 CHARACTERISTICS OF MOTHERS FOR 260 997 LIVE AND STILLBIRTHS IN WESTERN AUSTRALIA, 2005–2013, BY MATERNAL ETHNIC ORIGIN
Australian-born women
Migrant women All women P
White Asian Indian African Māori Other
Total number 172 571 48 546 18 212 5503 4155 2941 9038 260 997
Marital status <0.001
Never married 18 016 (10.4%)
3026 (6.2%)
701 (3.9%)
99 (1.8%)
543 (13.1%)
570 (19.4%)
611 (6.8%)
23 568 (9.0%)
Divorced/separated 1554 (0.9%)
360 (0.7%)
160 (0.9%)
17 (0.3%)
109 (2.6%)
33 (1.1%)
132 (1.5%)
2366 (0.9%)
Married/de facto 151 831 (88.0%)
44 693 (92.1%)
17 107 (93.9%)
5327 (96.8%)
3449 (83.0%)
2268 (77.1%)
8214 (90.9%)
232 917 (89.2%)
Other 1170 (0.7%)
467 (1.0%)
244 (1.3%)
60 (1.1%)
54 (1.3%)
70 (2.4%)
81 (0.9%)
2146 (0.8%)
Parity <0.001
Nulliparous 73 456 (42.6%)
21 205 (43.7%)
8759 (48.1%)
3204 (58.2%)
1217 (29.3%)
955 (32.5%)
3532 (39.1%)
112 340 (43.0%)
Primiparous 60 403 (35.1%)
17 243 (35.5%)
6485 (35.6%)
1817 (33.0%)
1113 (26.8%)
792 (26.9%)
2695 (29.8%)
90 561 (34.7%)
Multiparous 38 712 (22.5%)
10 098 (20.8%)
2968 (16.3%)
482 (8.8%)
1825 (43.9%)
1194 (40.6%)
2811 (31.1%)
58 096 (22.3%)
Maternal age (years) <0.001
Mean (SD) 29.5 (5.6)
31.5 (5.3)
31.2 (4.9)
29.5 (4.4)
28.8 (5.7)
26.8 (6.0)
29.9 (5.6)
30.0 (5.6)
<20 7474 (4.3%)
724 (1.5%)
131 (0.7%)
17 (0.3%)
197 (4.7%)
300 (10.2%)
200 (2.2%)
9045 (3.5%)
20–24 27 516 (16.0%)
4364 (9.0%)
1401 (7.7%)
638 (11.6%)
826 (19.9%)
889 (30.2%)
1477 (16.3%)
37 115 (14.2%)

CHAPTER 4. STILLBIRTH, MIGRATION AND ETHNIC ORIGIN IN WA
PAGE | 74
25–29 49 076 (28.4%)
11 423 (23.5%)
5208 (28.6%)
2288 (41.6%)
1254 (30.2%)
786 (26.7%)
2631 (29.1%)
72 673 (27.8%)
30–34 54 744 (31.7%)
17 464 (36.0%)
6937 (38.1%)
1869 (34.0%)
1169 (28.1%)
599 (20.4%)
2714 (30.0%)
85 510 (32.8%)
35–39 28 412 (16.5%)
11 716 (24.1%)
3713 (20.4%)
581 (10.6%)
586 (14.1%)
290 (9.9%)
1612 (17.8%)
46 914 (18.0%)
40–44 5159 (3.0%)
2703 (5.6%)
785 (4.3%)
103 (1.9%)
112 (2.7%)
77 (2.6%)
389 (4.3%)
9328 (3.6%)
>44 190 (0.1%)
152 (0.3%)
37 (0.2%)
<10(0.1%) 11 (0.3%)
0 15 (0.2%)
412 (0.2%)
Medical conditions <0.001
Diabetes 1040 (0.6%)
285 (0.6%)
97 (0.5%)
53 (1.0%)
30 (0.7%)
15 (0.5%)
63 (0.7%)
1583 (0.6%)
Asthma 21 728 (12.6%)
4208 (8.7%)
642 (3.5%)
154 (2.8%)
85 (2.1%)
356 (12.1%)
440 (4.9%)
27 615 (10.6%)
Hypertension 2134 (1.2%)
579 (1.2%)
109 (1.6%)
28 (0.5%)
33 (0.8%)
31 (1.1%)
70 (0.8%)
2984 (1.1%)
Smoked while pregnant <0.001
Yes 24 097 (14.0%)
4161 (8.6%)
317 (1.7%)
40 (0.7%)
78 (1.9%)
1152 (39.2%)
494 (5.5%)
30 342 (11.6%)
No 148 474 (86.0%)
44 385 (91.4%)
17 895 (98.3%)
5463 (99.3%)
4077 (98.1%)
1789 (60.8%)
8544 (94.5%)
230 655 (88.4%)
Index of Relative Socio-economic Disadvantage (quintiles) <0.001
1 (most disadvantaged) 40 521 (23.5%)
6547 (13.5%)
2181 (12.0%)
663 (12.1%)
513 (12.4%)
800 (27.2%)
1276 (14.1%)
52 504 (20.1%)
2 34 062 (19.7%)
8343 (17.2%)
3526 (19.4%)
1137 (20.7%)
781 (18.8%)
895 (30.4%)
1882 (20.8%)
50 631 (19.4%)
3 38 893 (22.5%)
14 192 (29.2%)
5380 (29.5%)
1863 (33.9%)
1998 (48.10%)
645 (21.9%)
3098 (34.3%)
66 081 (25.3%)

CHAPTER 4. STILLBIRTH, MIGRATION AND ETHNIC ORIGIN IN WA
PAGE | 75
SD Standard deviation
4 22 519 (13.1%)
5666 (11.7%)
2939 (16.1%)
915 (16.6%)
441 (10.6%)
357 (12.1%)
1192 (13.2%)
34 031 (13.0%)
5 (least disadvantaged) 30 662 (17.8%)
12 337 (25.4%)
3615 (19.9%)
730 (13.3%)
295 (7.1%)
166 (5.6%)
1321 (14.6%)
49 132 (18.8%)

CHAPTER 4. STILLBIRTH, MIGRATION AND ETHNIC ORIGIN IN WA
PAGE | 76
TABLE 4.3 PREVALENCE OF STILLBIRTHS IN WESTERN AUSTRALIA, 2005–2013, BY ETHNIC ORIGIN OF MOTHER
AND TYPE OF STILLBIRTH
Ethnic origin of mother Rate (per 1000 births)
All stillbirths Antepartum stillbirths
Intrapartum stillbirths
Australian-born 4.7 3.5 1.1
Overseas-born 5.7 4.0 1.5
White (from United Kingdom, 43%; New Zealand, 15%) 4.8 3.3 1.2
Asian (from China, 14%; Vietnam, 14%; Malaysia, 13%; Indonesia, 11%; Philippines, 11%)
5.2 3.8 1.3
Indian (from India, 70%) 7.1 5.6 1.5
African (from Sudan, 28%; Somalia, 13%) 12.3 7.5 4.8
Māori (from New Zealand, 97%) 6.1 5.1 1.0
Other* (from Iraq, 9%; Afghanistan, 6%; Sudan, 3.5%; Somalia 2%; Saudi Arabia, 2%)
7.3 5.2 2.1
All women 5.0 3.7 1.2
The rates of antepartum and intrapartum stillbirth may not sum to that of all stillbirths because of the small proportion of undefined stillbirths. *71% of women in this category were born in Asia or Africa but did not declare their ethnic origin as Asian, Indian or African.
Non-white migrant women were more likely than white migrants to have stillbirths (OR 1.42, 95%
CI 1.19–1.70), antepartum stillbirths (OR 1.45, 95% CI 1.18–1.79) and intrapartum stillbirths (OR
1.58, 95% CI 1.12–2.24). There were no significant differences between Australian-born women
with white and non-white backgrounds for any type of stillbirth (Appendix 6, Table 1). Women
born overseas were more likely to have a stillbirth (adjusted odds ratio [aOR] 1.26, 95% CI 1.09–
1.37), antepartum stillbirth (aOR 1.20, 95% CI 1.02–1.33), or intrapartum stillbirth (aOR 1.38, 95%
CI 1.09–1.72) than Australian-born women (Table 4.4).
Antepartum stillbirths were more frequent for migrant women of African (aOR 2.12, 95% CI 1.46–
3.08), Indian (aOR 1.71, 95% CI 1.17–2.47) and ‘other’ ethnic origins (aOR 1.43, 95% CI 1.06–1.93)
than for Australian-born women after adjusting for a range of covariates. Intrapartum stillbirth
was five times as frequent among African migrants (aOR 5.08, 95% CI 3.14–8.22) and almost twice
as frequent among migrants of ‘other’ backgrounds (aOR 1.86, 95% CI 1.15–3.00) than Australian-
born women after adjusting for a range of covariates (Table 4.4).
The influence of African or Indian ethnic origin on the likelihood of stillbirth was similar in
sensitivity analyses (data not shown).

CHAPTER 4. STILLBIRTH, MIGRATION AND ETHNIC ORIGIN IN WA
PAGE | 77
TABLE 4.4 STILLBIRTH IN WESTERN AUSTRALIA, 2005–2013: COMPARISON OF MIGRANT WOMEN, BY ETHNIC ORIGIN, WITH AUSTRALIAN-BORN WOMEN
Ethnic origin All stillbirths Antepartum stillbirths Intrapartum stillbirths
OR (95%CI) aOR* (95%CI) OR (95%CI) aOR* (95%CI) OR (95%CI) aOR* (95%CI)
Australian-born 1 1 1 1 1 1
Overseas-born 1.20 (1.08–1.35) 1.26 (1.09–1.37) 1.15 (1.01–1.31) 1.20 (1.02–1.33) 1.38 (1.11–1.73) 1.38 (1.09–1.72)
White 1.01 (0.87–1.17) 1.07 (0.86–1.16) 0.95 (0.80–1.13) 1.01 (0.79–1.13) 1.10 (0.81–1.47) 1.11 (0.77–1.42)
Asian 1.11 (0.90–1.37) 1.17 (0.95–1.47) 1.08 (0.84–1.39) 1.15 (0.89–1.48) 1.23 (0.80–1.88) 1.20 (0.81–1.91)
Indian 1.51 (1.09–2.08) 1.58 (1.13–2.19) 1.61 (1.12–2.31) 1.71 (1.17–2.47) 1.36 (0.67–2.75) 1.25 (0.69–2.90)
African 2.63 (1.98–3.49) 2.74 (2.04–3.69) 2.14 (1.49–3.07) 2.12 (1.46–3.08) 4.51 (2.84–7.16) 5.08 (3.14–8.22)
Māori 1.30 (0.82–2.08) 1.27 (0.83–2.14) 1.46 (0.87–2.44) 1.39 (0.86–2.41) 0.95 (0.30–2.98) 1.00 (0.34–3.42)
Other 1.56 (1.21–2.00) 1.51 (1.17–1.96) 1.49 (1.10–2.00) 1.43 (1.06–1.93) 1.96 (1.22–3.15) 1.86 (1.15–3.00)
aOR=adjusted odds ratio; OR=odds ratio. *Adjusted for previous stillbirth, year of birth, maternal age group, sex of baby, marital status, pregnancy complication, medical
conditions, smoking during pregnancy, parity, plurality and Index of Relative Socio-economic Disadvantage.
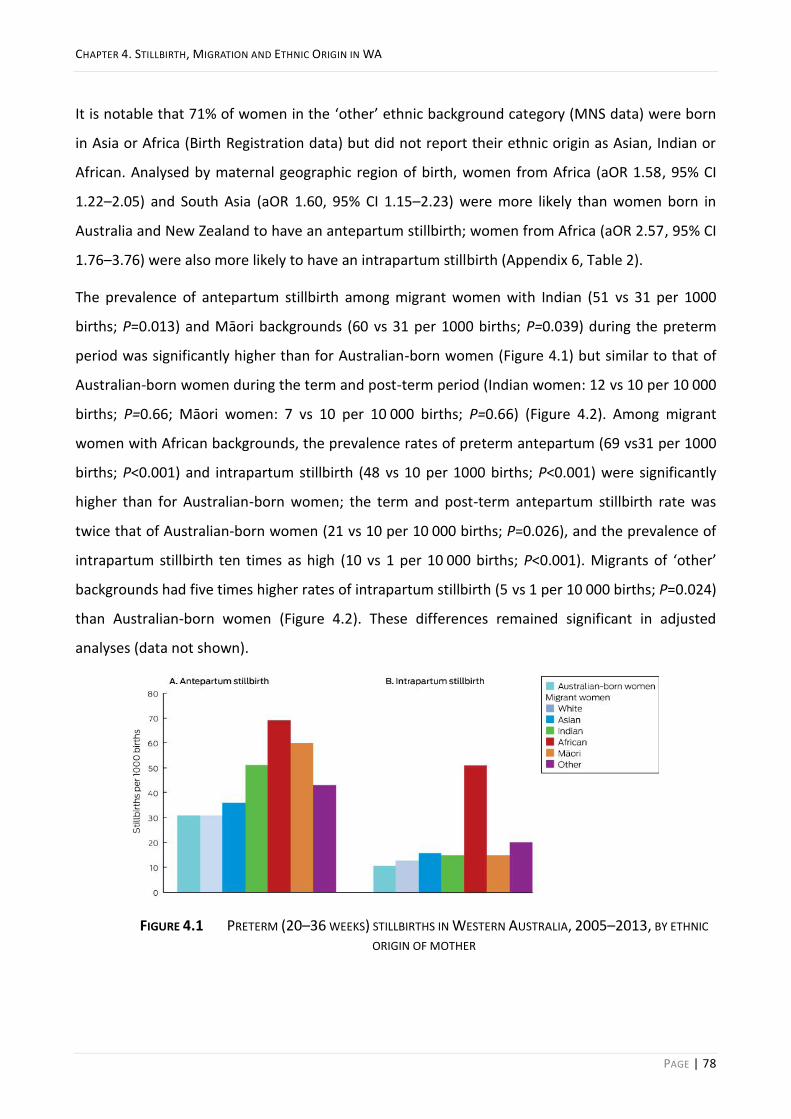
CHAPTER 4. STILLBIRTH, MIGRATION AND ETHNIC ORIGIN IN WA
PAGE | 78
It is notable that 71% of women in the ‘other’ ethnic background category (MNS data) were born
in Asia or Africa (Birth Registration data) but did not report their ethnic origin as Asian, Indian or
African. Analysed by maternal geographic region of birth, women from Africa (aOR 1.58, 95% CI
1.22–2.05) and South Asia (aOR 1.60, 95% CI 1.15–2.23) were more likely than women born in
Australia and New Zealand to have an antepartum stillbirth; women from Africa (aOR 2.57, 95% CI
1.76–3.76) were also more likely to have an intrapartum stillbirth (Appendix 6, Table 2).
The prevalence of antepartum stillbirth among migrant women with Indian (51 vs 31 per 1000
births; P=0.013) and Māori backgrounds (60 vs 31 per 1000 births; P=0.039) during the preterm
period was significantly higher than for Australian-born women (Figure 4.1) but similar to that of
Australian-born women during the term and post-term period (Indian women: 12 vs 10 per 10 000
births; P=0.66; Māori women: 7 vs 10 per 10 000 births; P=0.66) (Figure 4.2). Among migrant
women with African backgrounds, the prevalence rates of preterm antepartum (69 vs31 per 1000
births; P<0.001) and intrapartum stillbirth (48 vs 10 per 1000 births; P<0.001) were significantly
higher than for Australian-born women; the term and post-term antepartum stillbirth rate was
twice that of Australian-born women (21 vs 10 per 10 000 births; P=0.026), and the prevalence of
intrapartum stillbirth ten times as high (10 vs 1 per 10 000 births; P<0.001). Migrants of ‘other’
backgrounds had five times higher rates of intrapartum stillbirth (5 vs 1 per 10 000 births; P=0.024)
than Australian-born women (Figure 4.2). These differences remained significant in adjusted
analyses (data not shown).
FIGURE 4.1 PRETERM (20–36 WEEKS) STILLBIRTHS IN WESTERN AUSTRALIA, 2005–2013, BY ETHNIC
ORIGIN OF MOTHER

CHAPTER 4. STILLBIRTH, MIGRATION AND ETHNIC ORIGIN IN WA
PAGE | 79
FIGURE 4.2 TERM AND POST-TERM (≥37 WEEKS) STILLBIRTHS IN WESTERN AUSTRALIA, 2005–2013, BY ETHNIC
ORIGIN OF MOTHER
DISCUSSION 4.5
In this whole-population study, the prevalence of stillbirth among migrant women in WA was
lower than in their countries of origin,42 but the prevalence of antepartum stillbirth was higher
among migrant women with Indian, African, or ‘other’ origins than Australian-born women, and
the prevalence of intrapartum stillbirth was higher among migrant women with African or ‘other’
origins than Australian-born women.
Our results are consistent with previous observations that migrant women are at higher risk of
stillbirth than locally born women. We also report, for the first time in Australia, ethnic group-
specific differences in the prevalence of both antepartum and intrapartum stillbirth. Particularly
notable was that the prevalence of term stillbirth was much higher among migrants of African
origin than Australian-born women. That the intrapartum stillbirth rate was twice as high among
African women is especially worrying, as intrapartum stillbirth is regarded as preventable and
indicative of inadequate quality of care.61 This finding shows the critical value of the time of death
(antepartum or intrapartum) when designing public health programs for averting stillbirth.
Why is the prevalence of term stillbirth in WA higher for migrants of African background? The
proportion of pregnancies lasting 42 or more weeks was higher for African migrants (2.1%) than
for Australian-born women (0.5%) or Asian migrants (0.2%) (Table 4.1). Post-term pregnancy is a
recognised risk factor for stillbirth.236 The high proportion of post-term pregnancies among African
migrants in WA contrasts with reports that the median gestational age at spontaneous labour
among Black women in London was 39 weeks,102 similar to Australian-born women in Victoria.74

CHAPTER 4. STILLBIRTH, MIGRATION AND ETHNIC ORIGIN IN WA
PAGE | 80
Further, African Americans are less likely than white women to reach 40 weeks gestation (aOR
0.81, 95% CI 0.78–0.85).237 However, Black populations in overseas studies may not be directly
comparable with African migrants to Australia.
The greater proportion of post-term pregnancies among African women in WA may reflect their
lack of access to or uptake of obstetric interventions such as induction and caesarean delivery.
Many African women are reluctant to undergo obstetric interventions such as caesarean delivery
because they worry that multiple operations can lead to infertility or even death.19,238 It was
previously reported that Sub-Saharan African women in WA are significantly less likely than
Australian-born women to have induced labour (OR 0.74, 95% CI 0.69–0.79) and more likely to
have an emergency caesarean delivery (OR 1.22, 95% CI 1.12–1.32).24 In a qualitative study,
Sudanese women in WA emphasised their suspicions about assisted birth, believing that the
natural process should not be disturbed.26 These beliefs may inhibit their seeking routine
antenatal care during pregnancy, resulting in lost opportunities for medical interventions that
avert preterm birth and post-term pregnancy, each of which increases the risk of stillbirth. More
in-depth investigation of the patterns of health service use, pregnancy and labour care of migrant
women, particularly African migrants, is warranted. Culturally appropriate antenatal engagement
and educational programs about the risk of stillbirth and the indications for and safety of induction
and related interventions may be useful preventive strategies.
Consistent with previous reports, we found that women of Indian origin are more likely to have an
antepartum stillbirth than Australian-born women.74,159 These reports included data only on
antepartum stillbirth and maternal country of birth; by including information on the time of
stillbirth and ethnic background, we additionally reported that women from an Indian background
and those born in South Asia are not at increased risk of intrapartum stillbirth.
We also found that the rate of preterm (but not term) antepartum stillbirth among migrants of
Māori background was significantly higher than for Australian-born women even after adjusting
for several factors, including smoking. Māori women are a vulnerable population in New Zealand,
having greater difficulty with communication and access to maternity services than non-Māori
women, and with higher rates of adverse outcomes, including stillbirth.239 This migrant population
and their health service needs in Australia require further investigation.
The strength of our study was that type of stillbirth was available for 99.98% of stillbirths for a
complete population-based cohort. Further, the population of migrants was substantial (33.9%),

CHAPTER 4. STILLBIRTH, MIGRATION AND ETHNIC ORIGIN IN WA
PAGE | 81
and we included several ethnic origin categories in our analyses. Our linked health data
methodology and whole-population design reduced the risk of selection, participation and recall
biases.
LIMITATIONS 4.5.1
We analysed routinely collected linked data, not data specifically collected for answering our
research questions, and this may have led to some misclassification of exposures and outcomes;
despite the cross-source ascertainment we undertook to optimise accuracy, a residual risk of
misclassification remains. Another limitation arising from the analysis of large datasets is that
women may have had more than one birth or stillbirth during the study period, resulting in non-
independence in the dataset, but limiting our analyses to women with only one birth record did
not affect the results. Further, while our rich dataset made it possible to control for many factors,
residual confounding by covariates not available in the dataset (e.g. maternal weight, which may
be associated with increased risk of stillbirth)70,74,159 is possible.
CONCLUSION 4.5.2
This whole-population study explored the relationships between ethnic background and migration
and the prevalence of antepartum and intrapartum stillbirth. We identified ethnic groups in which
the risk of one or both types is particularly high. Our findings suggest that, to reduce the number
of preventable stillbirths, it is imperative to know the country of origin and ethnic makeup of the
local population and to target preventive strategies accordingly.

CHAPTER 5. HEALTHCARE USE AND STILLBIRTH IN MIGRANTS IN WA
PAGE | 82
CHAPTER 5. HEALTHCARE USE AND STILLBIRTH IN MIGRANTS IN WESTERN
AUSTRALIA
This chapter comprises a paper, published in PLoS Medicine, that explored the underlying
mechanisms and modifiable factors associated with the increased risk of antepartum and
intrapartum stillbirths in migrants from diverse ethnic backgrounds. This chapter builds on the
results in Chapter 4, in relation to the second objective of the thesis, to investigate the pattern of
healthcare utilisation among migrant women and its relationship with the risk of stillbirth
(antepartum and intrapartum) in WA. The specific abbreviations used throughout this chapter are
below:
The citation details for this paper are as follows and a copy of the paper is available in the
Appendices:
Mozooni M, Pennell CE, Preen DB. Healthcare factors associated with the risk of antepartum and
intrapartum stillbirth in migrants in Western Australia (2005-2013): A retrospective cohort study.
PLoS Med. 2020;17(3):e1003061. doi: https://doi.org/10.1371/journal.pmed.1003061.

CHAPTER 5. HEALTHCARE USE AND STILLBIRTH IN MIGRANTS IN WA
PAGE | 83
ABSTRACT 5.1
Background: Migrant women, especially from Indian and African ethnicity, have a higher risk of
stillbirth than native-born populations in high-income countries. Differential access or timing of
antenatal care and the uptake of other services may play a role. We investigated the pattern of
healthcare utilisation among migrant women and its relationship with the risk of stillbirth (SB),
antepartum (AnteSB) and intrapartum (IntraSB) in Western Australia (WA).
Methods and Findings: A retrospective cohort study using de-identified linked data from perinatal,
birth, death, hospital and birth-defects registrations through the WA Data Linkage System was
undertaken. All (N=260 997) non-Indigenous births (2005–2013) were included. Logistic regression
analysis was used to estimate odds ratios and 95% CI for AnteSB and IntraSB, comparing migrant
women from white, Asian, Indian, African, Māori and ‘other’ ethnicities with Australian-born
women controlling for risk factors and potential healthcare-related covariates.
Of all the births, 66.1% were to Australian-born women and 33.9% to migrant women. The mean
age (years) was 29.5 among the Australian-born mothers and 30.5 among the migrant mothers.
Nulliparous women comprised 42.3% of Australian-born women, 58.2% of Indian women and
29.3% of African women. Only 5.3% of Māori and 9.2% of African migrants had private health
insurance in contrast to 43.1% of Australian-born women. Among Australian-born women, 14%
had smoked in pregnancy, compared with 0.7% and 1.9% of migrants from Indian and African
backgrounds, respectively.
The odds of AnteSB was elevated in African (OR 2.22, 95% CI 1.48–2.13, P<0.001), Indian (OR 1.64,
95% CI 1.13–2.44, P=0.013) and other women (OR 1.46, 95% CI 1.07–1.97, P=0.016) while IntraSB
was higher in African (OR 5.24, 95% CI 3.22–8.54, P<0.001) and ‘other’ women (OR 2.18, 95% CI
1.35–3.54, P=0.002) compared to Australian-born women.
When migrants were stratified by timing of first antenatal visit, the odds of AnteSB increased in
those who commenced antenatal care later than 14 weeks gestation in women from Indian (OR
2.16, 95% CI 1.18–3.95, P=0.013), Māori (OR 3.03, 95% CI 1.43–6.45, P=0.004) and ‘other’ (OR
2.19, 95% CI 1.34–3.58, P=0.002) ethnicities.
With midwife-only intrapartum care, African and ‘other’ migrants (combined) had three times the
odds of IntraSB for viable births than Australian-born women (OR 3.43, 95% CI 1.28–9.19,
CHAPTER 5. HEALTHCARE USE AND STILLBIRTH IN MIGRANTS IN WA
PAGE | 84
P=0.014); however, with multidisciplinary intrapartum care, the odds were similar to that of
Australian-born group (OR 1.34, 95% CI 0.30–5.98, P=0.695).
Compared to Australian-born women, migrant women who used interpreter-services had a lower
risk of stillbirth (OR 0.51, 95% CI 0.27–0.96, P=0.035) and those who did not use interpreters had a
higher risk of stillbirth (OR 1.20, 95% CI 1.07–1.35, P<0.001).
Covariates that were partially available in the dataset comprised the main limitation of the study.
Conclusion: Late commencement of antenatal care, underutilisation of interpreter service and
midwife-only intrapartum care are associated with increased risk of stillbirth in migrant women.
Education to improve early engagement with antenatal care, better uptake of interpreter services,
and the provision of a multidisciplinary-team intrapartum care to women specifically from African
and ‘other’ backgrounds may reduce the risk of stillbirth in migrants.
INTRODUCTION 5.2
Despite the availability of quality antenatal and obstetric care in most developed nations,
disparities in rates of stillbirth within and between countries continue to be reported.61,62 Where
similar health systems exist, different ethnic compositions may explain some of this variation
between countries.240
In Australia, migrant women are at increased risk of stillbirth compared with Australian-born
women, despite having access to the same health resources.74,159,241 Specifically, we observed an
increased rate of antepartum stillbirth (AnteSB) in migrant women from African, Indian, and
‘other’ non-white ethnic backgrounds.241 Further, we reported an increased rate of intrapartum
stillbirth (IntraSB) in African and ‘other’ non-white migrant ethnicities despite adjusting for several
well-established risk factors for stillbirth.241 This warranted investigation for additional factors that
may explain the higher risk of stillbirth in migrant populations. Targeting such specific factors in
these at-risk populations is imperative for evidence-based practice and a precise public health plan
for reducing the risk of stillbirth in migrants. The evidence suggests that the risk profile of migrants
differs from that of the native-born population241,242 and strategies that are effective in their
native-born counterparts, such as lowering alcohol or tobacco consumption in pregnancy, may not
yield similar effects at a population level due to a considerably low prevalence of those habits
among them.241,242 In contrast, communication barriers,157 factors such as access to or timing of

CHAPTER 5. HEALTHCARE USE AND STILLBIRTH IN MIGRANTS IN WA
PAGE | 85
antenatal-care157,243 and uptake of other services, due to unfamiliarity, socioeconomic or private
health insurance status, may play a greater role in these groups.242-244
Thus, we hypothesised that healthcare factors might explain the disparities observed in the risk of
stillbirth between migrant and Australian-born populations. We investigated whether the pattern
of healthcare utilisation among migrant women in WA differs from that of the Australian-born
population and whether the differences influence the risk of stillbirth. We specifically investigated
the relationship between stillbirth and timing of antenatal care, using interpreter service, health
insurance status, and type of intrapartum care.
METHODS 5.3
STUDY DESIGN AND PARTICIPANTS 5.3.1
A retrospective cohort study using routinely collected administrative health data was undertaken.
We examined de-identified data for the entire non-Indigenous population of births occurred in WA
from 1 January 2005 to 31 December 2013 using the WA Data Linkage System (WADLS) of the WA
Department of Health. No separate protocol for this study is available other than the previous
study published from the same project.241
DATA SOURCES AND LINKAGE 5.3.2
WADLS was formally established in 1995 as a collaboration between the WA Department of Health
and researchers mainly for population health research purposes. It has a highly successful history
of linking data, dating back to the 1970s and only in its first ten years of operation has supported
more than 400 studies contributed to policy, practice and wellbeing of the population.204
WADLS applies probabilistic matching based on full name and address, phonetic compression
algorithms, and other identifiers to link data from a variety of health and other administrative
datasets.211 The frequency of invalid or missed links based on evaluation of linked chains is
estimated to be very low (0.11%), and the linkage procedures are widely known as best
practice.204,211,213
Data for this study were accessed from multiple data collections. We primarily used the Midwives
Notification System (MNS), a statutory highly reliable data collection of demographic, pregnancy
and delivery information for all births in WA. The MNS adheres to strict quality assurance
processes ensuring data completeness, validity and reporting compliance.215 To supplement the
MNS data, other WA statutory data collections were used: the Hospital Morbidity Data Collection

CHAPTER 5. HEALTHCARE USE AND STILLBIRTH IN MIGRANTS IN WA
PAGE | 86
(HMDC) containing data related to inpatient discharges from all private and public hospitals,245 the
WA Registry of Developmental Anomalies (WARDA), a database of developmental anomalies
identified by six years of age, including fetuses of terminated pregnancies228 and Birth and Death
Registrations.29. These data collections are key information sources for meeting the mandatory
and statutory reporting requirements in WA. Further, genealogical linkage through the Family
Connections Linkage Facility of WADLS was used to link women with child outcomes.223
Figure 5.1 shows the geographical location, number, and distribution of hospitals across WA.246
Additional information can be found in the S1 WA Health System.
FIGURE 5.1 GEOGRAPHICAL LOCATION OF THE PRIVATE AND PUBLIC HOSPITALS IN WESTERN AUSTRALIA.
Base image by OpenClipart-Vectors from Pixabay
EXPOSURES 5.3.3
Migrant status for mothers, defined as country of birth other than Australia, was ascertained
through mother’s place of birth variable from Birth Registration data or country of birth from
mother’s HMDC records. Mother’s place of birth variable included city, province, and country of
birth as reported by parents on the Birth Registration Form. Using this variable, a new variable was
created to classify the population as Australian-born or migrant. Place of birth from Birth
Registration data was merged with MNS data, which was complete for 99.0% of the births.
CHAPTER 5. HEALTHCARE USE AND STILLBIRTH IN MIGRANTS IN WA
PAGE | 87
Country of birth from mother’s hospital record was used to ascertain mother’s place of birth and
to retrieve missing values. Thus, maternal migrant status achieved 99.99% completeness for the
population of study.
The migrant population was further stratified by self-reported ethnicity using the variable ethnic
origin, which was 100% complete (MNS data), as white (Caucasian), Asian, Indian, African, Māori
and ‘other’, and compared with Australian-born women from any ethnicity. For this comparison, a
categorical variable with values assigned as Australian-born, white, Asian, Indian, African, Māori
and ‘other’ was created. We did not stratify the Australian-born population by ethnicity as we had
previously reported that the proportion of non-white Australian-born women was very small
(3.3%); their risk of stillbirth was similar to that of white Australian-born women,241 with no
stillbirths in Australian-born women from Indian or African backgrounds.
Since this project focused on migrants, any data for women of Aboriginal or Torres Strait Islander
background were excluded by design. This also eliminates the risk of non-differential
misclassification bias towards the null hypothesis74,241 as the prevalence of stillbirth among this
population is twice that of non-Indigenous Australians.247
OUTCOMES 5.3.4
According to the Australian Institute of Health and Welfare and the National Perinatal Data
Collection, stillbirth is defined as the death of a baby of at least 20 completed weeks of gestation,
or 400 grams or more birthweight if the gestation is unknown, before the complete expulsion or
extraction from its mother.28 We further categorised stillbirth as antepartum (death before
commencement of labour) or intrapartum (death after labour started).61 Data on type of stillbirth
was available for 99.98% of stillbirths by cross-source checking the status of baby at birth (MNS)
and presence or absence of the fetal heart beat at the commencement of labour (death
certificates). Any termination of pregnancy, identified through WARDA and death records, were
excluded (N=433).
OTHER VARIABLES 5.3.5
Hospital type (tertiary, metro-public, metro-private and rural-private/public), as well as interpreter
use (yes/no), indicating if an official paid interpreter service was used, and private health
insurance-status (yes/no), indicating whether the patient had hospital insurance, were available
for all births in hospital (99.0%). The two variables, interpreter use and health insurance status,

CHAPTER 5. HEALTHCARE USE AND STILLBIRTH IN MIGRANTS IN WA
PAGE | 88
were used to investigate the potential influences of access to healthcare services and
communication barriers on the risk of stillbirth in ethnic migrant groups.
Data on intrapartum-care provider were reported as accoucheur (birth-attendant/supervisor) on
MNS and was available for all births, coded as obstetrician, other medical practitioner, midwife,
student, self/no attendant and other; each case could contain single or multiple values. For
analyses, this variable was categorised as midwife, doctor, mix (team) and self/no-care. Also, a
dichotomous variable, midwife-only (yes/no), was created.
Gestational age at first antenatal care (ANC) visit, recorded in MNS since 2010, was used to stratify
the population (2010–2013) by timing of commencement of ANC (late booking: first visit after
week 14)244,248 in a subgroup analysis.
Low birthweight (LBW), defined as birthweight less than 2500 g114, and preterm birth (PTB),
defined as birth before 37 weeks gestation98, are considered intermediate variables and not
confounders; adjusting for them in perinatal mortality analyses can create bias.249 Therefore,
instead of adjusting for these two variables, adjusting for their risk is suggested.249,250 Hence, the
predicted probability of LBW or PTB above the 95th percentile,250 titled ‘high-risk-of-LBW’ and
‘high-risk-of-PTB’, respectively, were calculated and used in the analyses.
The Index of Relative Socio-economic Disadvantage (IRSD), summarising several disadvantage
measures including low income, low education, high unemployment and unskilled occupations,219
and the Accessibility/Remoteness Index of Australia (ARIA)220 were derived and provided by
geocoding using address parsing software by WADLS. ARIA is a geographical index defining
remoteness based on accessibility to goods, services and opportunities for social interaction across
Australia based on road distance from populated towns.220 A missing subgroup was created for
ARIA and IRSD for missing data (3.3%) to keep all the cases in the analysis.
STATISTICAL ANALYSIS 5.3.6
Demographic and obstetric characteristics of study groups were tabulated. Pearson χ2 or Fisher
exact tests were used as appropriate for descriptive analyses. Independent sample t-tests were
used to compare means for continuous variables. Cumulative incidence rates of stillbirth (overall,
AnteSB, IntraSB), stratified by ethnicity, were calculated throughout the study, with denominators
determined by 10 000 total births (live and stillbirth).
CHAPTER 5. HEALTHCARE USE AND STILLBIRTH IN MIGRANTS IN WA
PAGE | 89
Univariable logistic regression analysis, for the whole study population, was used to examine the
association between risk factors and each type of stillbirth and to calculate the crude odds ratio
(OR) and 95% confidence interval (CI). Multivariable logistic regression for all analyses included
established (ethnicity,9,13,67,80,84-86 year of birth,6,67,68,80,86,194 marital status,69,72,73 maternal age
group,6,48,67-69 parity,6,67,68 plurality,6,73,241 pre-existing diabetes,41,77,80 essential
hypertension,73,74,241 previous stillbirth,74,80,241 sex of baby,80,81,241 socioeconomic disadvantage,73-
75,241 accessibility/remoteness25,46,67,75,76 and smoking during pregnancy69,74,77,78) and potential
(health insurance251 and interpreter utilization157) factors associated with stillbirth to determine
the adjusted OR (aOR). An additional intrapartum-related co-variate, only-midwife accoucheur,
was specifically added to the IntraSB analysis. A P-value < 0.05 was considered significant;
variables with P-values > 0.1 were removed from the final models.252 In order to investigate the
relationship between stillbirth and timing of antenatal care, using interpreter service, health
insurance status and type of intrapartum care in more depth, the migrant population was further
stratified according to factors of interest as follows: interpreter utilisation (yes/no) for analysing all
stillbirths combined, timing of commencement of ANC (first visit before/after week 14) and private
health insurance status for AnteSB analysis, and by type of intrapartum care (midwife-only/team)
for IntraSB analysis in women from African and ‘other’ ethnic backgrounds combined, the only
population at-risk of IntraSB . We also limited the intrapartum care analysis to viable births;
gestational age at birth >23 completed weeks.
To explore whether the increased risk of AnteSB and/or IntraSB in migrant women is mediated by
LBW and PTB, the predicted probabilities of LBW and PTB were estimated from a logistic
regression model based on baseline covariates,249,250 including ethnicity, marital status, maternal
age group, parity, plurality, presence of a medical condition or pregnancy complication, smoking
during pregnancy and socioeconomic disadvantage; the new binary variables (yes/no), ‘high-risk-
of-LBW’ and ‘high-risk-of-PTB’, were defined as the predicted probability of LBW and PTB,
respectively, above the 95th percentile250 and used as additional covariates in the analyses.
SENSITIVITY ANALYSES 5.3.7
Analyses were undertaken by excluding stillbirths with major anomalies from the analysis, due to
potential restricted access or differing attitudes to screening or termination of pregnancy reported
for some ethnic backgrounds.84,156

CHAPTER 5. HEALTHCARE USE AND STILLBIRTH IN MIGRANTS IN WA
PAGE | 90
Further, to examine the effect of non-independence, which can arise in the analysis of large
population data when women have more than one birth during the study, we limited the
population of women to those with just one birth record in the dataset. Also, in response to peer
review comments, the cluster effect was fitted using the ‘cluster’ option in the Stata package.
Analyses were performed using Stata (version 13·1; StataCorp LP, College Station, Texas).
ETHICS APPROVAL 5.3.8
This study was approved by the Human Research Ethics Committee of the WA Department of
Health (2015/23). Due to the use of non-identifiable routinely collected linked administrative
health data for the whole population, written consent was not required to conduct the study.
RESULTS 5.4
From 260 997 live and stillbirths in non-Indigenous WA women from 2005–2013, 99.0% were
delivered in hospital (258 296); 66.1% to Australian-born women and 33.9% to migrant women.
Non-white migrants predominantly used tertiary and public hospitals, whereas white migrants and
Australian-born women had more private hospital separations (Table 5.1).
Among migrant populations, women from African backgrounds had the lowest proportion of
nulliparous women, the highest proportion of interpreter service use (15.7%) at the hospital and
resided in very accessible areas in WA (92.2%). Māori women had the highest proportion of
socioeconomic disadvantage (27.2%), never married (19.4%) and smoking in pregnancy (39.2%).
Migrant women from Indian background had the highest proportion of nulliparous women (58.2%)
and experienced the highest prevalence of complications of pregnancy (39.3%) and labour (73.0%)
and emergency CS (24.4%) (Table 5.2).
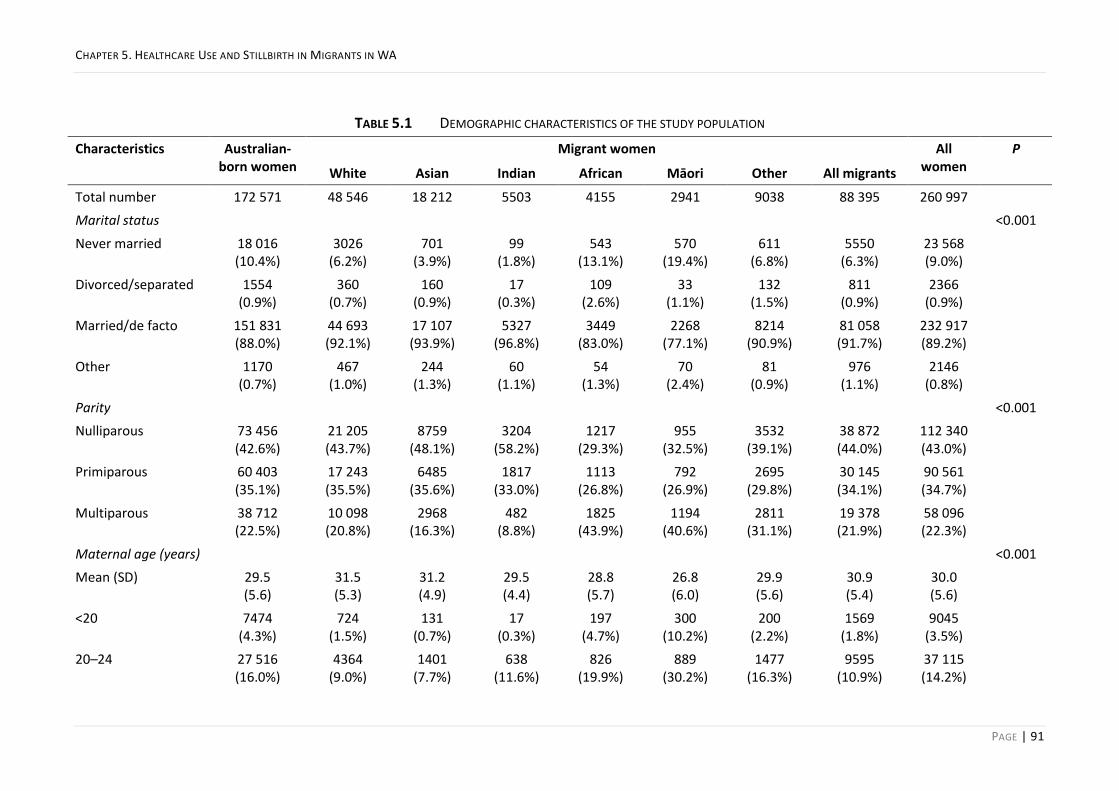
CHAPTER 5. HEALTHCARE USE AND STILLBIRTH IN MIGRANTS IN WA
PAGE | 91
TABLE 5.1 DEMOGRAPHIC CHARACTERISTICS OF THE STUDY POPULATION
Characteristics Australian-born women
Migrant women All women
P
White Asian Indian African Māori Other All migrants
Total number 172 571 48 546 18 212 5503 4155 2941 9038 88 395 260 997
Marital status <0.001
Never married 18 016 (10.4%)
3026 (6.2%)
701 (3.9%)
99 (1.8%)
543 (13.1%)
570 (19.4%)
611 (6.8%)
5550 (6.3%)
23 568 (9.0%)
Divorced/separated 1554 (0.9%)
360 (0.7%)
160 (0.9%)
17 (0.3%)
109 (2.6%)
33 (1.1%)
132 (1.5%)
811 (0.9%)
2366 (0.9%)
Married/de facto 151 831 (88.0%)
44 693 (92.1%)
17 107 (93.9%)
5327 (96.8%)
3449 (83.0%)
2268 (77.1%)
8214 (90.9%)
81 058 (91.7%)
232 917 (89.2%)
Other 1170 (0.7%)
467 (1.0%)
244 (1.3%)
60 (1.1%)
54 (1.3%)
70 (2.4%)
81 (0.9%)
976 (1.1%)
2146 (0.8%)
Parity <0.001
Nulliparous 73 456 (42.6%)
21 205 (43.7%)
8759 (48.1%)
3204 (58.2%)
1217 (29.3%)
955 (32.5%)
3532 (39.1%)
38 872 (44.0%)
112 340 (43.0%)
Primiparous 60 403 (35.1%)
17 243 (35.5%)
6485 (35.6%)
1817 (33.0%)
1113 (26.8%)
792 (26.9%)
2695 (29.8%)
30 145 (34.1%)
90 561 (34.7%)
Multiparous 38 712 (22.5%)
10 098 (20.8%)
2968 (16.3%)
482 (8.8%)
1825 (43.9%)
1194 (40.6%)
2811 (31.1%)
19 378 (21.9%)
58 096 (22.3%)
Maternal age (years) <0.001
Mean (SD) 29.5 (5.6)
31.5 (5.3)
31.2 (4.9)
29.5 (4.4)
28.8 (5.7)
26.8 (6.0)
29.9 (5.6)
30.9 (5.4)
30.0 (5.6)
<20 7474 (4.3%)
724 (1.5%)
131 (0.7%)
17 (0.3%)
197 (4.7%)
300 (10.2%)
200 (2.2%)
1569 (1.8%)
9045 (3.5%)
20–24 27 516 (16.0%)
4364 (9.0%)
1401 (7.7%)
638 (11.6%)
826 (19.9%)
889 (30.2%)
1477 (16.3%)
9595 (10.9%)
37 115 (14.2%)

CHAPTER 5. HEALTHCARE USE AND STILLBIRTH IN MIGRANTS IN WA
PAGE | 92
25–29 49 076 (28.4%)
11 423 (23.5%)
5208 (28.6%)
2288 (41.6%)
1254 (30.2%)
786 (26.7%)
2631 (29.1%)
23 590 (26.7%)
72 673 (27.8%)
30–34 54 744 (31.7%)
17 464 (36.0%)
6937 (38.1%)
1869 (34.0%)
1169 (28.1%)
599 (20.4%)
2714 (30.0%)
30 752 (34.8%)
85 510 (32.8%)
35–39 28 412 (16.5%)
11 716 (24.1%)
3713 (20.4%)
581 (10.6%)
586 (14.1%)
290 (9.9%)
1612 (17.8%)
18 498 (20.9%)
46 914 (18.0%)
40–44 5159 (3.0%)
2703 (5.6%)
785 (4.3%)
103 (1.9%)
112 (2.7%)
77 (2.6%)
389 (4.3%)
4169 (4.7%)
9328 (3.6%)
>44 190 (0.1%)
152 (0.3%)
37 (0.2%)
<10 (0.1%)
11 (0.3%)
0 (0.0%)
15 (0.2%)
222 (0.3%)
412 (0.2%)
Maternal height (cm) <0.001
Mean (SD) 165.8 (6.7)
165.1 (6.8)
158.6 (6.0)
159.3 (6.0)
164.5 (7.1)
165.8 (6.0)
161.7 (6.8)
163.0 (7.2)
164.9 (7.0)
Medical conditions <0.001
Pre-existing diabetes mellitus
1040 (0.6%)
285 (0.6%)
97 (0.5%)
53 (1.0%)
30 (0.7%)
15 (0.5%)
63 (0.7%)
543 (0.6%)
1583 (0.6%)
Hypertension 2134 (1.2%)
579 (1.2%)
109 (1.6%)
28 (0.5%)
33 (0.8%)
31 (1.1%)
70 (0.8%)
850 (1.0%)
2984 (1.1%)
Smoked in pregnancy
24 097 (14.0%)
4161 (8.6%)
317 (1.7%)
40 (0.7%)
78 (1.9%)
1152 (39.2%)
494 (5.5%)
6242 (7.1%)
30 342 (11.6%)
<0.001
Private health insurance
73 774 (43.1%)
19 247 (40.2%)
5495 (30.2%)
1379 (25.0%)
380 (9.2%)
153 (5.3%)
1471 (16.3%)
59 374 (32.1%)
101 902 (39.4%)
<0.001
Hospital category <0.001
Tertiary 26 337 (15.4%)
8081 (16.9%)
5425 (29.8%)
1956 (35.5%)
1682 (40.7%)
524 (18.1%)
4271 (47.6%)
21 796 (24.9%)
48 278 (18.7%)
Public metropolitan 39 285 (23.0%)
10 681 (22.3%)
6268 (34.5%)
2262 (41.1%)
2028 (49.0%)
1424 (49.1%)
2660 (29.6%)
25 320 (29.0%)
64 611 (25.0%)
Rural public/private 33 401 (19.5%)
4834 (10.1%)
1286 (7.1%)
224 (4.1%)
177 (4.3%)
718 (24.7%)
675 (7.5%)
7910 (9.0%)
41 317 (16.0%)

CHAPTER 5. HEALTHCARE USE AND STILLBIRTH IN MIGRANTS IN WA
PAGE | 93
Private metropolitan 72 061 (42.1%)
24 326 (50.8%)
5201 (28.6%)
1067 (19.4%)
251 (6.1%)
237 (8.2%)
1367 (15.2%)
32 446 (37.1%)
104 513 (40.4%)
Interpreter service used
19 (0.0%)
306 (0.6%)
1779 (9.8%)
232 (4.2%)
651 (15.7%)
0 (0.0%)
931 (10.4%)
3896 (4.5%)
3918 (1.5%)
<0.001
Socioeconomic disadvantage <0.001
Most disadvantaged 40 521 (23.5%)
6547 (13.5%)
2181 (12.0%)
663 (12.1%)
513 (12.4%)
800 (27.2%)
1276 (14.1%)
11 980 (13.6%)
52 504 (20.1%)
Remaining population
124 940 (73.0%)
40 013 (83.5%)
15 433 (84.9%)
4652 (84.4%)
3496 (84.5%)
2035 (70.1%)
7436 (82.9%)
73 053 (83.4%)
198 013 (76.5%)
Accessibility/remoteness index of Australia <0.001
Highly accessible 124 890 (72.4%)
40 836 (84.1%)
16 160 (88.7%)
5035 (91.5%)
3830 (92.2%)
2060 (70.0%)
7948 (87.9%)
75 869 (85.8%)
200 778 (76.9%)
Accessible 15 736 (9.1%)
2390 (4.9%)
474 (2.6%)
78 (1.4%)
51 (1.2%)
224 (7.6%)
205 (2.3%)
3422 (3.9%)
19 162 (7.3%)
Moderately accessible
16 125 (9.34%)
2162 (4.5%)
514 (2.8%)
102 (1.9%)
85 (2.1%)
414 (14.1%)
293 (3.2%)
3570 (4.0%)
19 699 (7.6%)
Remote 7844 (4.6%)
1282 (2.6%)
396 (2.2%)
70 (1.3%)
39 (0.9%)
116 (3.9%)
231 (2.6%)
2134 (2.4%)
9979 (3.8%)
Very remote 2062 (1.2%)
415 (0.9%)
97 (0.5%)
23 (0.4%)
23 (0.6%)
49 (1.7%)
92 (1.1%)
699 (0.8%)
2761 (1.1%)

CHAPTER 5. HEALTHCARE USE AND STILLBIRTH IN MIGRANTS IN WA
PAGE | 94
TABLE 5.2 OBSTETRIC CHARACTERISTICS OF THE STUDY POPULATION
Australian-born
women
Migrant women All women P
White Asian Indian African Māori Other All migrants
All births 172 571 (66.1%)
48 546 (18.6%)
18 212 (7.0%)
5503 (2.1%)
4155 (1.6%)
2941 (1.1%)
9038 (3.5%)
88 395 (33.9%)
260 997 (100%)
1st ANC visit*
Median (IQRs)
Mean (SD)
10 (8)
12.6 (7.4)
12 (10)
13.5 (7.5)
11 (12)
13.8 (8.0)
11 (13)
13.4 (7.9)
15 (15)
16.2(8.9)
14 (16)
16.4 (9.7)
15 (14)
15.9 (8.8)
12 (12)
14.0 (8.0)
11 (10)
13.1(7.7)
Plurality 0.025
Singleton 167 481 (97.1%)
47 075 (97.0%)
17 822 (97.9%)
5389 (97.9%)
4031 (97.0%)
2883 (98.0%)
8725 (96.5%)
85 925 (97.2%)
253 435 (97.1%)
Multiple 5090 (2.9%)
1471 (3.0%)
390 (2.1%)
114 (2.1%)
124 (3.0%)
58 (2.0%)
313 (3.5%)
2470 (2.8%)
7562 (2.9%)
Pregnancy complications <0.001
Gestational diabetes 7710 (4.5%)
2732 (5.6%)
2306 (12.7%)
868 (15.8%)
312 (7.5%)
117 (4.0%)
862 (9.5%)
7197 (8.1%)
14 907 (5.7%)
Preeclampsia 5114 (3.0%)
1194 (2.5%)
325 (1.8%)
124 (2.3%)
127 (3.1%)
77 (2.6%)
216 (2.4%)
2063 (2.3%)
7177 (2.8%)
Any complication 57 596 (33.4%)
15 330 (31.6%)
6489 (35.6%)
2162 (39.3%)
1339 (32.2%)
925 (31.5%)
3214 (35.6%)
29 459 (33.3%)
87 059 (33.4%)
Onset of labour <0.001
Spontaneous 83 237 (48.3%)
23 800 (49.0%)
10 804 (59.3%)
2921 (53.1%)
2585 (62.2%)
1975 (67.2%)
5084 (56.3%)
47 169 (53.4%)
130 428 (50.0%)
Induced 51 443 (29.8%)
13 356 (27.5%)
3824 (21.0%)
1527 (27.8%)
1037 (25.0%)
680 (23.1%)
2273 (25.2%)
22 697 (25.7%)
74 147 (28.4%)
Elective Caesarean 37 891 (22.0%)
11 390 (23.5%)
3584 (19.7%)
1055 (19.2%)
533 (12.8%)
286 (9.7%)
1681 (18.6%)
18 529 (21.0%)
56 422 (21.6%)

CHAPTER 5. HEALTHCARE USE AND STILLBIRTH IN MIGRANTS IN WA
PAGE | 95
Complication of labour/delivery
106 318 (61.6%)
30 258 (62.3%)
12 249 (67.3%)
4016 (73.0%)
2833 (68.2%)
1700 (57.8%)
6301 (69.7%)
57 357 (64.9%)
163 691 (62.7%)
Mode of delivery <0.001
Spontaneous vaginal 88 492 (51.3%)
23 187 (47.8%)
8400 (46.1%)
2058 (37.4%)
2531 (60.9%)
2148 (73.0%)
4719 (52.2%)
43 043 (48.7%)
131 558 (50.4%)
Instrumental vaginal 24 796 (14.4%)
7452 (15.4%)
3307 (18.2%)
1252 (22.8%)
386 (9.3%)
237 (8.1%)
1225 (13.6%)
13 859 (15.7%)
38 660 (14.8%)
Caesarean 59 283 (34.4%)
17 907 (36.9%)
6505 (35.7%)
2193 (39.9%)
1238 (29.8%)
556 (18.9%)
3094 (34.2%)
31 493 (35.6%)
90 779 (34.8%)
Emergency Caesarean 26 144 (15.2%)
7954 (16.4%)
3484 (19.1%)
1340 (24.4%)
844 (20.3%)
331 (11.3%)
1756 (19.4%)
15 709 (17.8%)
41 855 (16.0%)
<0.001
Accoucheur <0.001
Obstetrician 58 780 (34.1%)
16 888 (34.8%)
5070 (27.8%)
1131 (20.6%)
370 (8.9%)
254 (8.6%)
1426 (15.8%)
25 139 (28.4%)
83 926 (32.2%)
Other medical practitioners
27 837 (16.1%)
9255 (19.1%)
3342 (18.4%)
1422 (25.8%)
1010 (24.3%)
362 (12.3%)
2011 (22.3%)
17 402 (19.7%)
45 243 (17.3%)
Midwife 49 508 (28.7%)
12 903 (26.6%)
4364 (24.0%)
1081 (19.6%)
1362 (32.8%)
1448 (49.2%)
2470 (27.3%)
23 628 (26.7%)
73 153 (28.0%)
Mix (team) 36 196 (21.0%)
9429 (19.4%)
5406 (29.7%)
1866 (33.9%)
1399 (33.7%)
864 (29.4%)
3112 (34.4%)
22 076 (25.0%)
58 274 (22.3%)
Self/No one 250 (0.1%)
71 (0.2%)
30 (0.2%)
<10 14 (0.3%)
13 (0.4%)
19 (0.2%)
150 (0.2%)
401 (0.2%)
Sex of baby 0.980
Boy 88 307 (51.2%)
24 720 (50.9%)
9466 (52.0%)
2813 (51.1%)
2131 (51.3%)
1490 (50.7%)
4608 (51.0%)
45 228 (51.2%)
133 549 (51.2%)
Gestational age (weeks) <0.001
20–27 1025 (0.6%)
261 (0.5%)
121 (0.7%)
45 (0.8%)
55 (1.3%)
25 (0.9%)
94 (1.0%)
601 (0.7%)
1626 (0.6%)
28–31 1288 328 123 47 41 19 72 630 1919
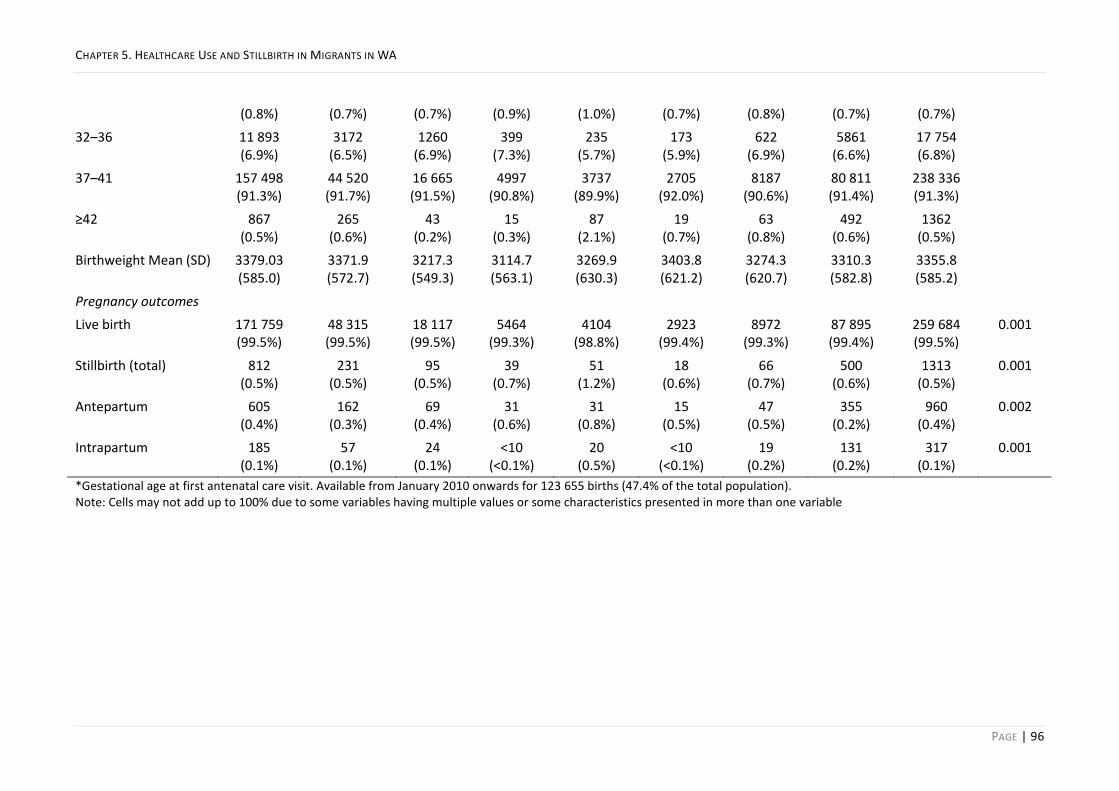
CHAPTER 5. HEALTHCARE USE AND STILLBIRTH IN MIGRANTS IN WA
PAGE | 96
(0.8%) (0.7%) (0.7%) (0.9%) (1.0%) (0.7%) (0.8%) (0.7%) (0.7%)
32–36 11 893 (6.9%)
3172 (6.5%)
1260 (6.9%)
399 (7.3%)
235 (5.7%)
173 (5.9%)
622 (6.9%)
5861 (6.6%)
17 754 (6.8%)
37–41 157 498 (91.3%)
44 520 (91.7%)
16 665 (91.5%)
4997 (90.8%)
3737 (89.9%)
2705 (92.0%)
8187 (90.6%)
80 811 (91.4%)
238 336 (91.3%)
≥42 867 (0.5%)
265 (0.6%)
43 (0.2%)
15 (0.3%)
87 (2.1%)
19 (0.7%)
63 (0.8%)
492 (0.6%)
1362 (0.5%)
Birthweight Mean (SD) 3379.03 (585.0)
3371.9 (572.7)
3217.3 (549.3)
3114.7 (563.1)
3269.9 (630.3)
3403.8 (621.2)
3274.3 (620.7)
3310.3 (582.8)
3355.8 (585.2)
Pregnancy outcomes
Live birth 171 759 (99.5%)
48 315 (99.5%)
18 117 (99.5%)
5464 (99.3%)
4104 (98.8%)
2923 (99.4%)
8972 (99.3%)
87 895 (99.4%)
259 684 (99.5%)
0.001
Stillbirth (total) 812 (0.5%)
231 (0.5%)
95 (0.5%)
39 (0.7%)
51 (1.2%)
18 (0.6%)
66 (0.7%)
500 (0.6%)
1313 (0.5%)
0.001
Antepartum 605 (0.4%)
162 (0.3%)
69 (0.4%)
31 (0.6%)
31 (0.8%)
15 (0.5%)
47 (0.5%)
355 (0.2%)
960 (0.4%)
0.002
Intrapartum 185 (0.1%)
57 (0.1%)
24 (0.1%)
<10 (<0.1%)
20 (0.5%)
<10 (<0.1%)
19 (0.2%)
131 (0.2%)
317 (0.1%)
0.001
*Gestational age at first antenatal care visit. Available from January 2010 onwards for 123 655 births (47.4% of the total population). Note: Cells may not add up to 100% due to some variables having multiple values or some characteristics presented in more than one variable

CHAPTER 5. HEALTHCARE USE AND STILLBIRTH IN MIGRANTS IN WA
PAGE | 97
ANTEPARTUM STILLBIRTH 5.4.1
In the multivariable analysis, primiparity, living in remote areas, private health insurance and using
interpreter services were associated with a lower risk of AnteSB (Table 5.3), while age>35 years,
multiple pregnancy, pre-existing diabetes and smoking were associated with increased risk of
AnteSB. However, controlling for these factors did not attenuate the odds of AnteSB in African,
Indian and ‘other’ migrant populations; if anything, the OR increased after adjusting for these
covariates (Table 5.3).
INTRAPARTUM STILLBIRTH 5.4.2
Female offspring, parity and socioeconomic disadvantage were associated with a lower risk of
IntraSB. Conversely, multiple pregnancy, pre-existing diabetes, age>35 years, living in very remote
areas, smoking, and midwife-only accoucheur were associated with a higher risk of IntraSB;
however, controlling for these factors did not explain and even increased the effect measure for
IntraSB in women from African and ‘other’ ethnic backgrounds (Table 5.4). When the analysis was
undertaken in viable birth (>23 weeks gestation), the higher odds of IntraSB remained significant
in women from African background (aOR 4.78, 95% CI 1.86–12.30 ) but lost significance in women
from ‘other’ ethnic backgrounds (aOR 1.96, 95% CI 0.78–4.97).

CHAPTER 5. HEALTHCARE USE AND STILLBIRTH IN MIGRANTS IN WA
PAGE | 98
TABLE 5.3 LOGISTIC REGRESSION MODEL AND THE FACTORS ASSOCIATED WITH ANTESB (2005–2013)
Variables N Rates1 OR (Univariable) 95% CI aOR (Multivariable) 95% CI
Migrant status and ethnicity
Australian-born (Reference) 605 35 1.00 1.00
Overseas-born 355 40
White 162 33 0.95 0.80–1.13 0.94 0.78–1.12
Asian 69 38 1.08 0.84–1.39 1.21 0.93–1.56
Indian 31 56 1.61 1.12–2.31 1.64 1.13–2.44
African 31 75 2.14 1.49–2.07 2.22 1.48–2.13
Māori 15 51 1.46 0.87–2.44 1.24 0.74–2.08
Other 47 52 1.49 1.10–2.00 1.46 1.07–1.97
Previous SB 3.06 2.18–4.29 2.67 1.87–3.81
Maternal age group
20–24 (Reference) 1.00
<20 1.03 0.73–1.47 0.90 0.62–1.29
25–29 0.73 0.60–0.90 0.81 0.65–1.00
30–34 0.82 0.67–1.00 1.02 0.83–1.27
35–39 1.01 0.82–1.25 1.22 0.97–1.53
40–44 1.26 0.91–1.74 1.45 1.05–2.07
≥45 1.75 0.56–5.51 1.20 0.30–4.90
Parity
Nulliparous 1.00
Primiparous 0.78 0.68–0.90 0.76 0.65–0.88
Multiparous 1.10 0.94–1.29 0.89 0.75–1.06
Plurality

CHAPTER 5. HEALTHCARE USE AND STILLBIRTH IN MIGRANTS IN WA
PAGE | 99
Singleton pregnancy 1.00
Multiple pregnancy 3.98 3.23–4.90 3.99 3.24–4.95
Medical conditions/pregnancy complications
Pre-existing diabetes mellitus 2.08 1.18–3.69 1.90 1.07–3.38
Essential hypertension 1.66 1.04–2.64 1.53 0.95–2.48
Smoked in pregnancy 1.40 1.17–1.68 1.30 1.07–1.56
Socioeconomically disadvantaged2 1.18 1.01–1.37 1.16 0.98–1.38
Accessibility/remoteness index of Australia
Highly accessible 1.00 1.00
Accessible 1.07 0.85–1.36 1.06 0.83–1.35
Moderately accessible 1.17 0.93–1.46 1.06 0.82–1.36
Remote 0.68 0.45–1.00 0.65 0.44–0.98
Very remote 0.88 0.46–1.70 0.90 0.46–1.74
Private health insurance 0.64 0.56–0.74 0.68 0.58–0.79
Interpreter service used 0.43 0.21–0.92 0.33 0.16–0.71 1Cumulative incidence rates are per 10 000 total births.
2The bottom 20% of the Index of Relative Socioeconomic Disadvantage was compared with the remaining population.
Bold values are P<0.05. Note: Factors in the table are those that have been included in the multivariable (adjusted model) analysis. These factors are not mutually exclusive and might coincide in the same woman. Abbreviations: AnteSB, antepartum stillbirth; aOR, adjusted odds ratio; OR, odds ratio; SB, stillbirth

CHAPTER 5. HEALTHCARE USE AND STILLBIRTH IN MIGRANTS IN WA
PAGE | 100
TABLE 5.4 LOGISTIC REGRESSION MODEL AND THE FACTORS ASSOCIATED WITH INTRASB (2005–2013)
Variables N Rates1 OR (Univariable) 95% CI aOR (Multivariable) 95% CI
Migrant status and ethnicity
Australian-born (reference) 185 11 1.00 1.00
Overseas-born 131 15
White 57 12 1.10 0.81–1.47 1.00 0.74–1.36
Asian 24 13 1.23 0.80–1.88 1.36 0.93–2.24
Indian <10 15 1.36 0.67–2.75 1.60 0.78–3.30
African 20 48 4.51 2.84–7.16 5.24 3.35–8.91
Māori <10 10 0.95 0.30–2.98 0.75 0.24–2.36
Other 19 21 1.96 1.22–3.15 2.18 1.34–3.54
Previous SB 4.32 2.61–7.15 6.51 3.79–11.20
Year of birth
2005 (reference)
2006 1.58 0.93–2.68 1.62 0.96–2.76
2007 1.63 0.97–2.74 1.74 1.03–2.94
2008 1.31 0.76–2.25 1.34 0.78–2.30
2009 1.37 0.80–2.33 1.44 0.84–2.46
2010 1.09 0.62–1.91 1.22 0.70–2.14
2011 1.36 0.80–2.31 1.44 0.85–2.46
2012 1.64 0.99–2.72 1.69 1.01–2.82
2013 1.19 0.70–2.04 1.22 0.71–2.10
Baby sex
Female 0.77 0.61–0.96 0.74 0.59–0.93
Maternal age group
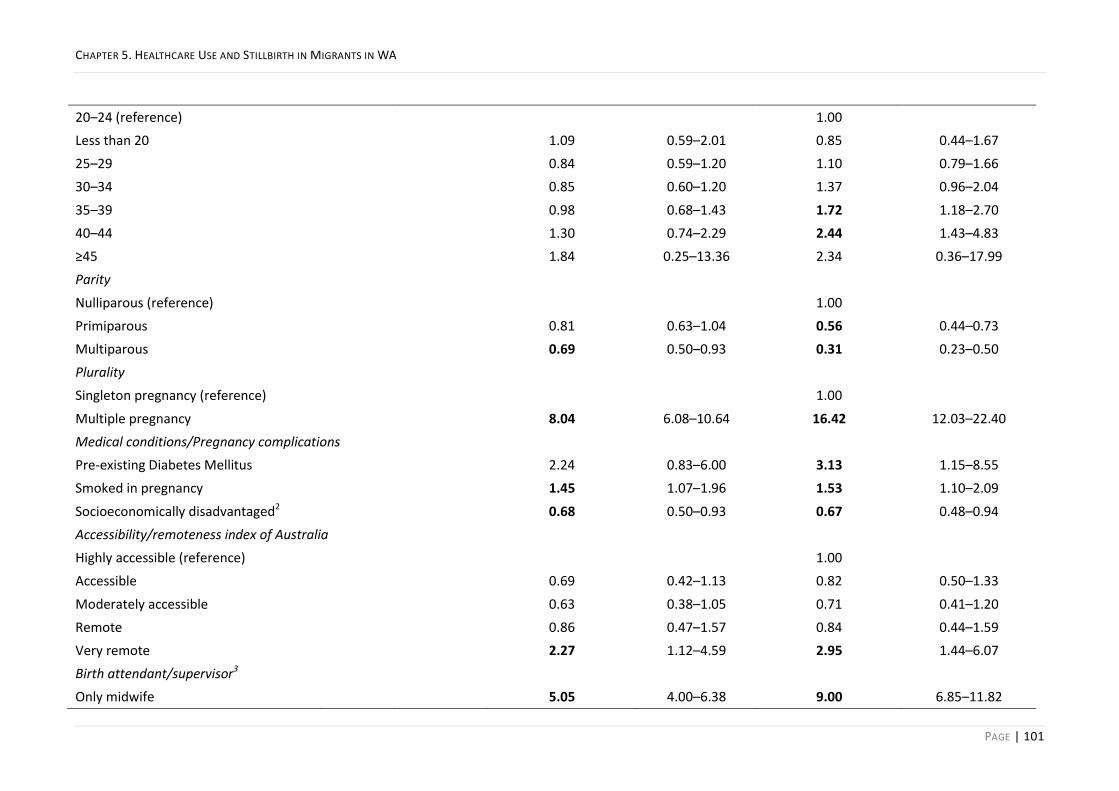
CHAPTER 5. HEALTHCARE USE AND STILLBIRTH IN MIGRANTS IN WA
PAGE | 101
20–24 (reference) 1.00
Less than 20 1.09 0.59–2.01 0.85 0.44–1.67
25–29 0.84 0.59–1.20 1.10 0.79–1.66
30–34 0.85 0.60–1.20 1.37 0.96–2.04
35–39 0.98 0.68–1.43 1.72 1.18–2.70
40–44 1.30 0.74–2.29 2.44 1.43–4.83
≥45 1.84 0.25–13.36 2.34 0.36–17.99
Parity
Nulliparous (reference) 1.00
Primiparous 0.81 0.63–1.04 0.56 0.44–0.73
Multiparous 0.69 0.50–0.93 0.31 0.23–0.50
Plurality
Singleton pregnancy (reference) 1.00
Multiple pregnancy 8.04 6.08–10.64 16.42 12.03–22.40
Medical conditions/Pregnancy complications
Pre-existing Diabetes Mellitus 2.24 0.83–6.00 3.13 1.15–8.55
Smoked in pregnancy 1.45 1.07–1.96 1.53 1.10–2.09
Socioeconomically disadvantaged2 0.68 0.50–0.93 0.67 0.48–0.94
Accessibility/remoteness index of Australia
Highly accessible (reference) 1.00
Accessible 0.69 0.42–1.13 0.82 0.50–1.33
Moderately accessible 0.63 0.38–1.05 0.71 0.41–1.20
Remote 0.86 0.47–1.57 0.84 0.44–1.59
Very remote 2.27 1.12–4.59 2.95 1.44–6.07
Birth attendant/supervisor3
Only midwife 5.05 4.00–6.38 9.00 6.85–11.82
CHAPTER 5. HEALTHCARE USE AND STILLBIRTH IN MIGRANTS IN WA
PAGE | 102
1Cumulative incidence rates are per 10 000 total births.
2The bottom 20% of the Index of Relative Socioeconomic Disadvantage was compared with the remaining population.
Bold values are P<0.05. Note: Factors in the table are those that have been included in the multivariable (adjusted model) analysis. These factors are not mutually exclusive and might coincide in the same woman. Abbreviations: AnteSB, antepartum stillbirth; aOR, adjusted odds ratio; OR, odds ratio; SB, stillbirth

CHAPTER 5. HEALTHCARE USE AND STILLBIRTH IN MIGRANTS IN WA
PAGE | 103
ANTENATAL CARE 5.4.3
Migrant women commenced antenatal-care visits (ANC visit) 1.5 weeks later (P<0.001) than
Australian-born women (Table 5.2). African and ‘other’ migrant women, specifically, commenced
ANC five weeks later than Australian-born women (P<0.001): more than 50% had their first visit
after week 14 of pregnancy (Table 5.2 & Figure 5.2).
FIGURE 5.4 GESTATIONAL AGE AT FIRST ANTENATAL CARE VISIT FOR SPECIFIED ETHNICITY GROUPS IN COMPARISON
TO THE AUSTRALIAN-BORN POPULATION (2010–2013)
When the population was stratified by late ANC-booking, the increased risk of AnteSB was
confined to those who booked late in Indian (OR 1.49, 95% CI 0.85–2.60 vs Late OR 2.16, 95% CI
1.18–3.95), Māori (OR 0.90, 95% CI 0.29–2.81 vs Late OR 3.03, 95% CI 1.43–6.44) and ‘other’
migrant women (OR 1.08, 95% CI 0.57–2.04 vs Late OR 2.19, 1.34–3.58). This finding was not
observed in migrant women from African backgrounds and remained the same in the adjusted
analysis (Table 5.5).

CHAPTER 5. HEALTHCARE USE AND STILLBIRTH IN MIGRANTS IN WA
PAGE | 104
TABLE 5.5 COMPARISON OF ANTEPARTUM STILLBIRTH IN MIGRANT WOMEN, STRATIFIED BY ETHNICITY AND TIMING
OF 1ST ANTENATAL CARE VISIT, WITH AUSTRALIAN-BORN WOMEN (2010–2013)
Characteristics AnteSB
Australian-born (Ref)1 (N=76 875) 1.00
First ANC visit in pregnancy
Migrant women (N) At any time (all)
aOR (95% CI)2
At/before week 14
aOR (95% CI)2
After week 14
aOR (95% CI)2
White (23 162) 1.06 (0.83–1.36) 1.05 (0.82–1.35) 0.89 (0.58–1.37)
Asian (10 514) 1.30 (0.93–1.83) 1.41 (0.96–2.10) 1.05 (0.58–1.91)
Indian (4069) 1.91 (1.25–2.94) 1.66 (0.94–2.92) 2.27 (1.23–4.21)
African (2303) 1.95 (1.16–3.26) 2.52 (1.36–4.67) 1.29 (0.56–2.16)
Māori (1681) 1.42 (0.75–2.69) 0.73 (0.23–2.30) 2.33 (1.09–5.01)
Other (5047) 1.53 (1.02–2.29) 1.03 (0.52–1.92) 2.09 (1.26–3.46) 1The reference group comprised all Australian-born women regardless of ethnicity and timing of first ANC visit.
2Adjusted for previous stillbirth, maternal age group, parity, plurality, socioeconomic status, remoteness/accessibility,
pre-existing diabetes mellitus, smoking in pregnancy, interpreter use and private health insurance status Bold values indicate P<0.05. Abbreviations: aOR, adjusted odds ratio; AnteSB, antepartum stillbirth
BIRTH ATTENDANT AND INTRAPARTUM CARE 5.4.4
When the birth attendant was a midwife, with no accompanying doctor, the odds of IntraSB in
African and ‘other’ women were more than three times that of Australian-born women (OR 3.43,
95% CI 1.28–9.19), which remained significant after adjusting for other factors. However, when
the intrapartum care was provided by mix attendants (team), the odds were the same (OR 1.34,
95% CI 0.30–5.98) with no difference after adjustment. For viable births (>23 weeks gestation),
intrapartum care with a midwife, mix (team) and doctor attendants showed similar IntraSB rates in
Australian-born women (Figure 5.3). In contrast, the IntraSB rate was more than 3-fold (P=0.009)
higher in African and ‘other’ migrants than Australian-born women with midwife-only attendants.
No difference in IntraSB rates of migrant and Australian-born women was observed with
intrapartum care by a doctor or by mix (team) attendants (Figure 5.3). No IntraSB was observed in
African or ‘other’ women when birth was attended by an obstetrician (N=1793).

CHAPTER 5. HEALTHCARE USE AND STILLBIRTH IN MIGRANTS IN WA
PAGE | 105
FIGURE 5.3 CUMULATIVE INCIDENCE RATE OF INTRAPARTUM STILLBIRTH (POST 23 WEEKS GESTATION) BY
ACCOUCHEUR PROVIDING INTRAPARTUM CARE (2005–2013).
Note: medical birth attendant/supervisor indicates that birth was attended by an obstetrician and/or other medical practitioners whereas mix (team) attendant/supervisor refers to occasions when both medical and midwifery accoucheur were present at birth
INTERPRETER SERVICE 5.4.5
The rate of overall SB was lower (26 vs 58 per 10 000 births, P=0.011) in migrant women who used
interpreter services from those who did not, especially among African women (31 vs 141 per
10 000 births, P=0.034; Figure 5.4). Compared with Australian-born women, migrants who used
interpreter service had lower odds of SB (OR 0.51, 95% CI 0.27–0.96), whereas their counterparts
who did not have an interpreter had higher odds (OR 1.20, 95% CI 1.07–1.35).
FIGURE 5.4 CUMULATIVE INCIDENCE RATE OF OVERALL STILLBIRTH ACCORDING TO INTERPRETER SERVICE USE
(2005–2013)
CHAPTER 5. HEALTHCARE USE AND STILLBIRTH IN MIGRANTS IN WA
PAGE | 106
CONTROLLING FOR THE EFFECT OF LBW AND PTB 5.4.6
High-risk-for-LBW and high-risk-for-PTB were both strongly associated with higher odds of AnteSB
(OR 4.47, 95% CI 3.80–5.25 and OR 4.13, 95% CI 3.50–4.88, respectively) and IntraSB (OR 7.01,
95% CI 5.46–8.99 and OR 6.34, 95% CI 4.92–8.19, respectively). Adjusting for high-risk-for-LBW
attenuated the increased risk of AnteSB for Indian women (aOR 1.16, 95% CI 0.77–1.73) but not
for African (aOR 2.02, 95% CI 1.39–2.95) or ‘other’ (aOR 1.41, 95% CI 1.04–1.91) women. Adjusting
for high-risk-for-PTB did not alter the odds of AnteSB or IntraSB for any ethnicity.
PRIVATE HEALTH INSURANCE 5.4.7
Compared to Australian-born women, women from an Indian background who had private health
insurance did not experience increased odds of AnteSB (aOR 1.14, 95% CI 0.47–2.77), whereas
those who did not have private health insurance showed higher odds (aOR 2.04, 95% CI 1.35–
3.09).
SENSITIVITY ANALYSIS 5.4.8
Removing stillbirths with major anomalies or limiting the population of study to women with only
one birth record in the dataset did not result in any appreciable differences in the primary
findings.
DISCUSSION 5.5
In this linked data study, we showed that having private health insurance and using interpreter
services were associated with a lower risk of AnteSB and that midwife-only accoucheur was
associated with a higher risk of IntraSB. However, controlling for these factors, in addition to other
factors, did not wholly explain the increased risk of either AnteSB in Indian, African and ‘other’
ethnic migrants or IntraSB in African and ‘other’ migrants. In further stratified analyses, late
commencement of ANC visits and lack of access to or uptake of intrapartum care by doctors
emerged as underlying factors for the increased risk of SB in at-risk groups of migrants. Migrant
women from an Indian background who had private health insurance did not experience increased
odds of AnteSB, and those from African and ‘other’ backgrounds who had a doctor–midwife team
intrapartum care did not have a higher rate of IntraSB compared with Australian-born women.
Indian migrants, as a population, commenced ANC visits early, and 25% had private health
insurance, yet they had a high rate of AnteSB. Stratifying the population by the timing of ANC visit
in the analysis confirmed that the increased AnteSB was unique to Indian women who booked
CHAPTER 5. HEALTHCARE USE AND STILLBIRTH IN MIGRANTS IN WA
PAGE | 107
late. Being high-risk-for-LBW regardless of cause, PTB or fetal growth restriction (FGR)73,77 had a
great impact on AnteSB in Indian migrants. This suggests that early engagement with the
healthcare system may reduce the number of SBs, perhaps through interventions that prevent PTB
and/or FGR, particularly in this group. Contrary to reports from the United States253, having private
health insurance was associated with a reduced risk of SB in this group in our study. Perinatal
mortality disparities between public and private care, though not stratified by ethnicity, have been
reported in Queensland, Australia.251
Detecting third-trimester FGR is challenging; clinical assessment misses approximately one-third of
cases254, ultrasound assessment is costly, and the most appropriate ultrasound biometry charts to
use, especially for non-white ethnic minorities and naturally short-stature, are controversial.255-257
It is of note that migrant women of Asian ethnicity, despite having similar height to Indian women,
did not have a high rate of AnteSB in our study. However, a larger proportion had private health
insurance, an obstetrician accoucheur, and delivered at a private hospital, which may indicate
better access to ultrasound during pregnancy. The finding that controlling for high-risk-for-LBW
status attenuated the increased odds of AnteSB in women from Indian background may also
indicate the difficulty with detecting FGR, especially in those who commence ANC visits late.
Universal third-trimester ultrasonography in the United Kingdom tripled detection of small-for-
gestational-age infants at risk of adverse perinatal outcomes.258 Thus, improving access to more
frequent ultrasound surveillance during pregnancy and third trimester for migrant women of
Indian ethnicity in public settings may afford a simple intervention to reduce the rate of AnteSB in
this high-risk group.
Stratifying by the timing of the first ANC visit also showed that, in women from ‘other’
backgrounds, the odds of AnteSB increased in those who commenced ANC later than 14 weeks.
Further, by removing pre-viable births, the increased odds of IntraSB in this group attenuated.
Timing of first ANC visit is important for ensuring optimal pregnancy outcomes and late booking
may result in loss of opportunity for potential comorbidity diagnosis and intervention.248,259
Moreover, interventions with demonstrated success in preventing PTB in some women (such as
aspirin, progesterone and cervical cerclage) are only effective when started early in pregnancy,
especially for pre-viable PTB prevention.260,261 Interventions can only be offered if women engage
early with ANC.
CHAPTER 5. HEALTHCARE USE AND STILLBIRTH IN MIGRANTS IN WA
PAGE | 108
Migrant women who used interpreter services had lower odds of SB than those who did not,
particularly in women of African ethnicity. Interpreter use among Chinese-born women residing in
WA was associated with lower rates of PTB and close to the rate of PTB reported in China;163 to
our knowledge, this is the first time that this factor has been examined in relation to the risk of SB.
We were surprised by the lower rates of SB in migrants who used an interpreter as most non-
white migrants in WA are from regions with high rates of SB.241 Variation in the rates of interpreter
use between migrant groups may reflect differences in English comprehension, willingness to use
interpreters and/or culture; evidence shows that in some ethnic groups, the husband acts as the
interpreter or insists on providing language support for women even when accredited interpreters
are available.157 The relationship between no-interpreter service used and higher rates of stillbirth
is concerning; it is not clear whether this group had enough English language proficiency or did not
use an interpreter due to the lack of/reluctance to access such services. The finding that migrant
women who used an interpreter had a lower rate of stillbirth may indicate the provision of a more
culturally responsive healthcare service; thus, this may be an opportunity for intervention to
reduce the rate of stillbirth.
Experts have expressed concern over the lack of access to interpreter services, often due to
unfamiliarity of migrants with the Australian health system and lack of awareness of their
entitlement to nationwide interpreter services free of charge.262-264 The Doctors Priority Line, run
through the Department of Immigration and Citizenship’s Translating and Interpreting Service,
links interpreters in over 160 languages, 24 h per day, seven days per week to doctors by
telephone within three minutes of their call, and can arrange on-site interpreters.264 Yet, the use
of family members instead of professional interpreters was reported in at least 49% of patients
during their inpatient stay in a study.263 Although it is well-established that language barriers are
linked to lower quality of care, misconceptions about the use of an interpreter being costly, time-
consuming or threatening confidentiality, or even uncertainty about the responsibility for
contacting interpreter service by healthcare providers, may also play a role in low uptake of this
national fee-free service which is unique in the Anglophone world.264-266
In this study, midwife-only accoucheur was associated with increased IntraSB even after removing
pre-viable births. To date, this area has not been thoroughly evaluated due to the large sample
size required for adequate statistical power. In New Zealand, where the majority of births are
delivered by midwives, an unexplained excess in adverse birth outcomes with midwife-led births

CHAPTER 5. HEALTHCARE USE AND STILLBIRTH IN MIGRANTS IN WA
PAGE | 109
compared with medical-led births was reported.267 Despite 244 047 pregnancies, that study was
underpowered to evaluate stillbirth (321 stillbirths) and could not differentiate the type of
stillbirth.267 Further, the study did not control for confounders such as place of residence.268 We
had a substantially larger sample size (1313 stillbirths), adjusted for accessibility/remoteness and
socioeconomic disadvantage and knew the type of stillbirth; midwife-only intrapartum care was
associated with increased risk of IntraSB after 23 weeks gestation in migrants but not in
Australian-born population. The exact mechanism for this is unclear and warrants further research
as IntraSB rates in African and ‘other’ migrants with doctor–midwife (team) intrapartum care were
similar to Australian-born women. Of note, African women also had four-fold higher rates of post-
term pregnancy compared to Australian-born women. Whether this indicates a ‘preference’ for a
model of care for African and other ethnic women in choosing midwife-only care, reluctance to
undergo medical interventions (e.g. instrumental/caesarean delivery)19,26 or lack of access to
doctors due to logistics or timing of reaching facilities is not understood. Future investigation is
required to understand this difference and to develop strategies to reduce IntraSB in this at-risk
migrant group.
OTHER FINDINGS 5.5.1
Stillbirth rates are reportedly higher in remote and very remote areas in Australia;46 in this study,
we found that the rate of AnteSB in remote areas was lower than highly accessible areas. This
observation may be due to previous studies reporting all stillbirths, whereas we dichotomised into
AnteSB and IntraSB. Further, in WA, high-risk pregnancies are typically transferred to regional
centres or tertiary hospitals in the state capital; hence the population remaining in remote and
very remote areas are, by design, at low risk of AnteSB.25,269,270 In contrast, the increased rate of
IntraSB in very remote areas may indicate a lack of timely access to emergency intervention, due
to late arrival at the facility or long decision-delivery interval in obstetric emergencies for which
we did not have data.271,272 Additional information about the WA healthcare system and the
current model of care to improve rural perinatal outcomes is provided in the S1 WA Health. It
should be noted, however, that most migrant women lived in highly accessible areas and major
cities in our population. Thus, these findings cannot be used to draw inferences for specific ethnic
groups’ risk of stillbirth in relation to remoteness due to very small numbers. Thus, the observed
decreased and increased risk of AnteSB and IntraSB in remote and very remote regions,

CHAPTER 5. HEALTHCARE USE AND STILLBIRTH IN MIGRANTS IN WA
PAGE | 110
respectively, effectively shows such risk in the non-Indigenous Australian-born population living in
those regions relative to those living in highly accessible regions.
The socioeconomic disadvantage being protective of IntraSB was an unexpected finding and may
be due to factors that we were unable to adjust for, such as (lower) Body Mass Index (BMI)79 or
healthcare options available to these women such as doctor–midwife (team) care. It was noted
that 23.5% of Australian-born versus 13.5% of the migrant population was in this socioeconomic
disadvantage category.
GENERALISABILITY AND CLINICAL RELEVANCE 5.5.2
The reported findings can be generalised to high-income settings serving migrant residents from
similar ethnic backgrounds, including other states of Australia, Europe and Canada. These findings
are of particular relevance to clinical practice. Primary healthcare services can be used to improve
health literacy and familiarity with the health system for migrant women, including information on
the necessity of early engagement with antenatal care program, crucial role of communication and
effective use of interpreter services, and value of doctor–midwife (team) intrapartum care.
Developing tools and guidelines for healthcare providers to assess their patient’s sufficient ability
to communicate in English is crucial for ensuring mutual understanding and effective transfer of
information.
STRENGTH 5.5.3
This is the most comprehensive stillbirth study on pregnancy outcomes of migrants from diverse
ethnic backgrounds in Australia. Access to a variety of databases and numerous variables made
cross-source ascertainment of exposure and outcomes possible and optimised accuracy and
completeness of data. The ability to differentiate type of stillbirth for 99.98% stillbirths to
investigate intrapartum factors, not previously undertaken, can guide appropriate policy and
practice to reduce IntraSBs in migrants and very remote areas.
LIMITATIONS 5.5.4
The main limitation of this study was that gestational age at first ANC visit was only recorded from
2010 onwards and was available for four years of our study period. Thus, the related analyses
reported were only possible for almost half of the whole study population.
We used whole-population linked data for this study. One limitation with analysis of large
population datasets can be the non-independence of data arising from occasions where women

CHAPTER 5. HEALTHCARE USE AND STILLBIRTH IN MIGRANTS IN WA
PAGE | 111
have had more than one birth or stillbirth during the study period. In this study, accounting for
clustering or limiting the analyses to women with only one birth record did not affect the results.
Another limitation is the risk of misclassification due to the use of linked administrative health
data that have not been collected for this specific research. We conducted cross-source
ascertainment through multiple datasets; however, a residual risk of misclassification towards the
null hypothesis for the analyses used ethnicity (the variable only available from MNS) may remain.
For example, Indian women with a high risk of AnteSB have been misclassified as Asian. In such a
case, the actual risk of AnteSB could be higher than reported. However, such risk is very low as a
validation study of MNS confirmed the reliability of this database with a Proportion Records
Correct of 94.1% for the variable ethnicity.235
Also, the standard of care may change over time and create bias. We have adjusted the analysis
for year of birth to avoid such bias in our study.
Moreover, confounding due to covariates not available in the dataset (i.e. BMI given that obesity is
associated with increased risk of stillbirth) may also be present.77,79 However, we have adjusted
the analyses for many covariates, including pre-existing diabetes mellitus and essential
hypertension that are associated with high BMI.
Further, in the LBW/PTB analysis, the predictive power of LBW/PTB depends on the size of the
baseline covariates. Thus, a larger set of variables may change the estimates obtained to designate
‘high-risk’ status.250
Also, ARIA may not show intra-city difficulties that individuals may face for accessing services. The
accoucheur variable only records the birth attendant; neither the antenatal-care provider nor the
time from seeking intrapartum care to delivery was known.
Finally, despite the use of a large whole-population dataset, it should be noted that in the
interpretation of findings, multiple comparisons such as those in the adjusted intrapartum-related
analyses may have led to small numbers of samples in those analyses.
Considering the above, the results should be interpreted with caution.
CONCLUSION 5.5.5
This retrospective cohort study showed that the pattern of healthcare and service utilisation in
pregnant migrant women differs from that of Australian-born women and may contribute to the
increased risk of stillbirth in African, Indian, Māori and ‘other’ ethnic populations in WA. Thus, to

CHAPTER 5. HEALTHCARE USE AND STILLBIRTH IN MIGRANTS IN WA
PAGE | 112
reduce stillbirth rates in the migrant population, modifying both women’s attitudes towards the
health system and certain aspects of health services are required.
Raising awareness of the importance of proactively seeking ANC and using/offering interpreter
services for migrant women of reproductive age is vital. For healthcare providers and
policymakers, this strategy has the potential to be used as an intervention to reduce the risk of
stillbirth. Culture-oriented educational programs/campaigns may help to address the concerns of
this at-risk group and facilitate greater engagement with the healthcare system early in pregnancy.
Improving access to doctor–midwife (team) intrapartum care for African and ‘other’ migrant
populations, as well as the provision of routine third-trimester ultrasound surveillance for migrant
women from an Indian background, to monitor fetal growth, may also reduce the rates of
stillbirth.
The length of residence in Australia, age on arrival and intermarriage can give an indication of
familiarity with the health system and along with competency in English language and ability to
communicate, as proxies to acculturation, influence health service utilisation in migrant women.
Given that findings of this paper highlight the influence of service utilisation on the risk of
stillbirth, an investigation of acculturation-related factors on the risk of stillbirth is warranted.
ACKNOWLEDGMENTS 5.6
We thank the staff at the Western Australian Data Linkage Branch, and the Data Collections staff
and Data Custodians of the Midwives Notification System, the Hospital Morbidity Data Collection
and the WA Registry of Births, Deaths, and Marriages, and the Western Australia Register of
Developmental Anomalies. We gratefully acknowledge the support of Red Nose as we work
together to prevent stillbirth.
CHAPTER 6. ACCULTURATION AND STILLBIRTH IN WA
PAGE | 113
CHAPTER 6. ACCULTURATION AND STILLBIRTH IN WESTERN AUSTRALIA
This chapter comprises a paper, published in PLoS One, exploring the influence of acculturation on
the risk of stillbirth in migrants from diverse ethnic backgrounds in WA. This chapter advances the
understanding of factors associated with the increased risk of stillbirth beyond the current
established influential factors. It links the risk of stillbirth to emerging sociocultural characteristics
that are often overlooked when migrants are cared for during pregnancy and childbirth. This
investigation is related to the third objective of this thesis, to investigate the influence of
acculturation on disparities observed in the risk of stillbirth between migrant and Australian-born
populations in WA.
The citation details for this paper are as follows and a copy of the paper is available in the
Appendices:
Mozooni M, Preen DB, Pennell CE. The influence of acculturation on the risk of stillbirth in migrant
women residing in Western Australia. PLoS One. 2020;15(4):e0231106. doi:
10.1371/journal.pone.0231106. PubMed PMID: 32240255.

CHAPTER 6. ACCULTURATION AND STILLBIRTH IN WA
PAGE | 114
ABSTRACT 6.1
Objective: To investigate the influence of acculturation, demonstrated by age on arrival, length of
residence, interpreter use and having an Australian-born partner, on disparities observed in the
risk of stillbirth between migrant and Australian-born populations in Western Australia (WA).
Methods: A retrospective cohort study using linked administrative health data for all non-
Indigenous births in WA from 2005–2013 was performed. Logistic regression analysis was used to
estimate odds ratios (OR) and 95% confidence intervals (CI). Adjusted odds ratios (aOR) for
stillbirth in migrants from six ethnicities of white, Asian, Indian, African, Māori and ‘other’ with
different levels of acculturation were compared with Australian-born women using multivariable
logistic regression analysis and marital status, maternal age group, socioeconomic status, parity,
plurality, previous stillbirth, any medical conditions, any pregnancy complications, sex of baby and
smoking during pregnancy as the covariates.
Results: From all births studied, 172 571 (66%) were to Australian-born women and 88 395 (34%)
to migrant women. Women from African, Indian and Asian backgrounds who gave birth in the first
two years after arrival in Australia experienced the highest risk of stillbirth (aOR 3.32, 95% CI 1.70–
6.47; aOR 2.71, 95% CI 1.58–4.65; aOR 1.93, 95% CI 1.21–3.05, respectively) compared with
Australian-born women. This association attenuated with an increase in the length of residence in
Asian and Indian women, but the risk of stillbirth remained elevated in African women after five
years of residence (aOR 1.96, 95% CI 1.10–3.49). Interpreter use and an Australian-born partner
were associated with 56% and 20% lower odds of stillbirth in migrants (P<0.05), respectively.
Conclusions: Acculturation is a multidimensional process and may lower the risk of stillbirth
through better communication and service utilisation and elevate such risk through an increase in
the prevalence of smoking in pregnancy; the outcome depends on how these factors are in play in
a population. It is noteworthy that in women of African background, risk of stillbirth remained
elevated for longer periods after immigrating to Australia extending beyond five years. For
migrants from Asian and Indian backgrounds, access to services, in the first two years of residence,
may be more relevant. Enhanced understanding of barriers to accessing health services and
factors influencing and influenced by acculturation may help developing interventions to reduce
the burden of stillbirth in identified at-risk groups.

CHAPTER 6. ACCULTURATION AND STILLBIRTH IN WA
PAGE | 115
INTRODUCTION 6.2
The majority of international migrants live in high-income countries (HICs).118 According to the
United Nations’ International Migration Report 2015, 28% of the total population in Australia were
migrants, representing a greater proportion than in countries such as the United States (US) (14%),
Canada (22%) and New Zealand (23%).118 Migrants are considered a vulnerable population given
the social, economic, environmental and occupational disadvantages to which they are often
exposed; yet, in some settings, they are healthier than the host country’s population.273 However,
research also shows that foreign-born women and ethnic minorities in the US,274 Europe84,275 and
Australia74,241 have a higher risk of stillbirth than their native-born counterparts. The fetal
mortality rate for non-Hispanic Black women in the US was more than twice the rate for non-
Hispanic white women,274 the risk of stillbirth among Turkish mothers in Europe was 1.6-times that
of the native-born Europeans275 and for African women more than twice that of Australian-born
women.241
Stillbirth profoundly impacts families, society and healthcare systems232 and efforts to reduce the
stillbirth rate have recently gained momentum globally.39,62,276 For migrant women, unfamiliarity
with new healthcare systems, language barriers, sociocultural factors and health habits may
contribute to the risk of stillbirth.169,241 Acculturation is the cultural, psychological and behavioural
changes experienced by migrants as a result of interactions with the host community over time.129
Variables such as country of birth, ethnic identification, proficiency in language and length of
residence in the new country have been used as proxies to measure acculturation in relation to
health outcomes among migrants in other settings.190,195,277 Evidence from the US and Europe
suggests that acculturation, perhaps through lifestyle modification,195,277 may improve birthweight
and gestational age in some migrant populations190 but can negatively impact these outcomes in
others.191 Further, a lower risk of stillbirth was reported in migrant women whose baby was
registered with a Norwegian-born father than those with foreign-born fathers, suggesting a
potential benefit from acculturation for stillbirth risk.194 Similar research is limited in Australia and
the impact of acculturation on stillbirth risk is poorly understood; we have previously shown that
the migrant population, compared with the Australian-born population, use healthcare services
differently. Late commencement of antenatal-care visits and lack of access to or uptake of doctor-
provided intrapartum care as well as absence of private health insurance emerged as underlying
factors for increased risk of stillbirth in specific ethnic groups in WA.278 However, it is not clear

CHAPTER 6. ACCULTURATION AND STILLBIRTH IN WA
PAGE | 116
whether the risk of stillbirth persists the longer migrants live and interact with the community in
Australia.
We investigated the influence of acculturation on disparities observed in the risk of stillbirth
between migrants from diverse ethnic backgrounds and Australian-born populations in WA from
2005 to 2013. Specifically, the effect of length of residence, age on arrival, interpreter use and
having an Australian-born partner were explored as proxies for acculturation.
METHODS 6.3
STUDY DESIGN AND PARTICIPANTS 6.3.1
De-identified administrative health data for all non-Indigenous births in WA, from 1 January 2005
to 31 December 2013, linked through the WA Data Linkage System (WADLS) of WA Department of
Health,204,279 were used for this retrospective cohort study.
DATA SOURCES 6.3.2
WADLS was established in 1995, mainly for population health research purposes as a collaborative
work between the WA Department of Health and researchers. It has successfully linked data
dating back to the 1970s and has provided support for more than 400 studies in its first ten years
of operation.204 The linkage procedures used are widely known as ‘best practice’.204,213 Using
numerous automated and manual sub-processes specifically designed to reduce the likelihood of
errors, WADLS prides itself on the highest quality of the linkages it produces.212,215
For this study, a range of statutory data collections was used, including the Midwives’ Notification
System (MNS), the Hospital Morbidity Data Collection (HMDC), Birth and Death Registrations and
the WA Registry of Developmental Anomalies (WARDA). Genealogical linkage through the Family
Connections Linkage Facility of the WADLS223 was used to link mothers with child records. The
details of the datasets used were described elsewhere.241,278
Data from MNS, Birth Registration and HMDC records on the country of birth and ethnicity of
mothers and their migrant status (migrant=overseas-born) were available for 99.99% of women
through cross-source checking. The migrant population was further stratified by self-reported
maternal ethnicity (from MNS) as white (Caucasian), Asian, Indian, African, Māori and ‘other’,
which was available for the entire population of the study. It is worth noting that in Australia,
women born in India or those from an Indian background born elsewhere are categorised

CHAPTER 6. ACCULTURATION AND STILLBIRTH IN WA
PAGE | 117
separately and are not classified within the Asian group, of which the majority were born in China,
Vietnam, Malaysia or Indonesia.241
EXPOSURE AND OUTCOME VARIABLES 6.3.3
Stillbirth (defined as the death of a baby of at least 20 completed weeks of gestation, or 400 grams
or more birthweight, before the complete expulsion or extraction from the mother)28 was the
outcome of interest and was recorded in the status of the baby at birth (MNS data). Terminations
of pregnancy, identified and ascertained through WARDA and Death Registrations data, were
excluded (N=433).
We used length of residence, age on arrival, interpreter use and having an Australian-born partner
as proxies for acculturation.280-282 Interpreter used (yes/no) was available (from HMDC) for all
births in hospital (and 99.0% of total births in WA). Partner’s country of birth, through Birth
Registration, was available for 96.8% of women. Length of residence (years) was calculated by
subtracting year arrived in Australia (from Birth Registration) from year of birth of the baby (from
MNS) with 5.7% missing data (on mother’s arrival year). Age on arrival was calculated by
subtracting women’s length of residence from their age at time of birth (from MNS). Arriving as an
adult, using interpreter service, not having an Australian-born partner, and residing in Australia for
less than five years are considered indicators of being less acculturated.280-282
Private health insurance status (yes/no) was also available for all births in hospital (from HMDC).
Index of Relative Socioeconomic Disadvantage (IRSD), an area-based measure of socioeconomic
status developed by the Australian Bureau of Statistics summarising several disadvantage
measures including low income, low education, high unemployment and unskilled
occupations,219,283 was available for 96.7% of women through multiple datasets.
Missing data were categorised as a separate subgroup to retain all cases in the analysis.
STATISTICAL ANALYSIS 6.3.4
Demographic and obstetric characteristics of the study groups were tabulated. The cumulative
incidence rate of stillbirth was calculated throughout the study, stratified by ethnicity with
denominators determined by 10 000 total birth (live and stillbirth). Univariate logistic regression
was initially used to examine the crude association of stillbirth with acculturative factors
(interpreter use, length of residence, age on arrival and Australian-born partner) at the P<0.05
level. To determine the adjusted odds ratios (aORs) and 95% CIs of stillbirth, multivariable logistic
CHAPTER 6. ACCULTURATION AND STILLBIRTH IN WA
PAGE | 118
regression analysis was performed for each specific ethnicity with Australian-born as the reference
group, adjusting for marital status, maternal age group, socioeconomic status, parity, plurality,
previous stillbirth, any medical conditions, any pregnancy complications, sex of baby and smoking
during pregnancy. Where stratifying the analysis by specific ethnic groups was not possible due to
small numbers, the whole population of migrants was compared with the Australian-born group,
but ethnicity was added to the multivariable regression model as a co-variable to control for the
effect of ethnicity.
An exploratory analysis was undertaken by combining the Asian and Indian populations and
adding private health insurance, as a measure of access to services, to the multivariable model.
Sensitivity analysis was performed by excluding stillbirths with major anomalies.
All analyses were performed using Stata (version 13·1; StataCorp LP, College Station, Texas).
Ethics approval for this study was granted by the Human Research Ethics Committee of the WA
Department of Health (reference, 2015/23). Written consent from participants was not required
to conduct the study due to the use of non-identifiable routinely collected linked administrative
health data for the whole population.
RESULTS 6.4
Demographic data for the study population are presented in Table 6.1. From 260 997 total non-
Indigenous births, 172 571 births (66%) were to Australian-born women and 88 395 births (34%)
were to migrant women. Migrant women were, on average, slightly older than Australian-born
women (mean age 30.9 years vs 29.5 years, respectively), and more likely to be married (91.7% vs
88.0%), non-smokers (7.1% vs 14.0%) and nulliparous (44.0% vs 42.6%), but less likely to have
private health insurance (32.1% vs 43.1%). In contrast, the proportion of migrant women
categorised as the most socioeconomically disadvantaged (using IRSD quintiles) was 12% less than
Australian-born women (P<0.001). Most migrants arrived in Australia as an adult, aged ≥18 years
old, and almost 12% of the whole population of migrant women gave birth before completing two
years of residence in Australia (Table 6.1). Among the migrant population, 30.0% had an
Australian-born partner, with African and Indian women having the lowest (4.5% and 4.8%,
respectively) and Māori and Asian women having the highest (23.4% and 19.7%, respectively)
percentage of Australian-born partners after white migrants (41.6%). African women had the

CHAPTER 6. ACCULTURATION AND STILLBIRTH IN WA
PAGE | 119
highest proportion of interpreter utilisation (15.7%), followed by ‘other’ (10.4%) and Asian (9.8%)
women, while no woman from Māori background used such services.
The ‘<2 years of residence’ had the highest odds of stillbirth in migrant women (OR 1.35, 95% CI
1.05–1.74) compared to the Australian-born women (Table 6.2). The odds were 14% higher among
migrant women who immigrated as an adult than Australian-born population, although it did not
reach statistical significance (OR 1.14, 95% CI 1.00–1.30). Compared to Australian-born women,
the non-white non-Māori migrant women who did not use an interpreter were at higher odds of
stillbirth (OR 1.55, 95% CI 1.34–1.79), while those who did have an interpreter had lower risk of
stillbirth (OR 0.47, 95% CI 0.24–0.95) (Table 6.2).
When stratified by ethnicity, the most significant association with lack of utilisation of interpreter
services was seen in African (aOR 3.16, 95% CI 2.34–4.26), followed by women from ‘other’ (aOR
1.65, 95% CI 1.27–2.14) and Indian (aOR 1.58, 95% CI 1.13–2.22) ethnic backgrounds.
The cumulative rate of stillbirth in migrant women steadily decreased, reaching the same rate as
Australian-born women when the length of residence was greater than 10 years (Figure 6.1).
Parallel to that, the proportion of smoking in pregnancy, having an Australian-born partner or
private health insurance increased among migrant women (Figure 6.1).

CHAPTER 6. ACCULTURATION AND STILLBIRTH IN WA
PAGE | 120
TABLE 6.1 CHARACTERISTICS OF THE POPULATION OF THE STUDY
Characteristics Australian-born women
Migrant women All women
White Asian Indian African Māori Other All migrants
Total births 172 571 48 546 18 212 5503 4155 2941 9038 88 395 260 997
Stillbirths 812 (0.5%)
231 (0.5%)
95 (0.5%)
39 (0.7%)
51 (1.2%)
18 (0.6%)
66 (0.7%)
500 (0.6%)
1313 (0.5%)
Marital status
Never married 18 016 (10.4%)
3026 (6.2%)
701 (3.9%)
99 (1.8%)
543 (13.1%)
570 (19.4%)
611 (6.8%)
5550 (6.3%)
23 568 (9.0%)
Divorced/separated 1554 (0.9%)
360 (0.7%)
160 (0.9%)
17 (0.3%)
109 (2.6%)
33 (1.1%)
132 (1.5%)
811 (0.9%)
2366 (0.9%)
Married/de facto 151 831 (88.0%)
44 693 (92.1%)
17 107 (93.9%)
5327 (96.8%)
3449 (83.0%)
2268 (77.1%)
8214 (90.9%)
81 058 (91.7%)
232 917 (89.2%)
Other 1170 (0.7%)
467 (1.0%)
244 (1.3%)
60 (1.1%)
54 (1.3%)
70 (2.4%)
81 (0.9%)
976 (1.1%)
2146 (0.8%)
Australian-born Partner 118 401 (71.8)
19 503 (41.6%)
3535 (19.7%)
264 (4.8%)
178 (4.5%)
633 (23.4%)
1540 (17.6%)
25 652 (30.0%)
144 053 (57.5%)
Age on arrival
<18 years old NA 20 273 (43.9%)
4233 (24.7%)
433 (8.4%)
604 (16.1%)
1016 (36.8%)
2068 (24.8%)
28 627 (34.4%)
NA
18 or older NA 25 909 (56.1%)
12 904 (75.3%)
4741 (91.6%)
3140 (83.9%)
1749 (63.3%)
6257 (75.2%)
54 700 (65.6%)
NA
Length of residence
0–1 year NA 4048 (8.3%)
2361 (13.0%)
1299 (23.6%)
729 (17.6%)
527 (17.9%)
1571 (17.4%)
10 535 (11.9%)
10537 (4.0%)
2–5 year NA 11 380 (23.4%)
5399 (29.7%)
2613 (47.5%)
1595 (38.4%)
857 (29.0%)
2787 (30.8%)
24 631 (27.9%)
24 634 (9.4%)
>5 NA 30 769 9384 1262 1419 1382 3968 48 184 48 188

CHAPTER 6. ACCULTURATION AND STILLBIRTH IN WA
PAGE | 121
(63.4%) (51.5%) (22.9%) (34.2%) (47.0%) (43.9%) (54.5%) (18.5%)
Unknown NA 2349 (4.8%)
1068 (5.9%)
329 (6.0%)
412 (9.9%)
175 (6.0%)
712 (7.9%)
5045 (5.7%)
5082 (2.0%)
Maternal age (years)
Mean (SD) 29.5 (5.6)
31.5 (5.3)
31.2 (4.9)
29.5 (4.4)
28.8 (5.7)
26.8 (6.0)
29.9 (5.6)
30.9 (5.4)
30.0 (5.6)
<20 7474 (4.3%)
724 (1.5%)
131 (0.7%)
17 (0.3%)
197 (4.7%)
300 (10.2%)
200 (2.2%)
1569 (1.8%)
9045 (3.5%)
20–24 27 516 (16.0%)
4364 (9.0%)
1401 (7.7%)
638 (11.6%)
826 (19.9%)
889 (30.2%)
1477 (16.3%)
9595 (10.9%)
37 115 (14.2%)
25–29 49 076 (28.4%)
11 423 (23.5%)
5208 (28.6%)
2288 (41.6%)
1254 (30.2%)
786 (26.7%)
2631 (29.1%)
23 590 (26.7%)
72 673 (27.8%)
30–34 54 744 (31.7%)
17 464 (36.0%)
6937 (38.1%)
1869 (34.0%)
1169 (28.1%)
599 (20.4%)
2714 (30.0%)
30 752 (34.8%)
85 510 (32.8%)
35–39 28 412 (16.5%)
11 716 (24.1%)
3713 (20.4%)
581 (10.6%)
586 (14.1%)
290 (9.9%)
1612 (17.8%)
18 498 (20.9%)
46 914 (18.0%)
40–44 5159 (3.0%)
2703 (5.6%)
785 (4.3%)
103 (1.9%)
112 (2.7%)
77 (2.6%)
389 (4.3%)
4169 (4.7%)
9328 (3.6%)
>44 190 (0.1%)
152 (0.3%)
37 (0.2%)
<10 (0.1%)
11 (0.3%)
0 (0.0%)
15 (0.2%)
222 (0.3%)
412 (0.2%)
Smoked in pregnancy 24 097 (14.0%)
4161 (8.6%)
317 (1.7%)
40 (0.7%)
78 (1.9%)
1152 (39.2%)
494 (5.5%)
6242 (7.1%)
30 342 (11.6%)
Interpreter service used 19 (0.0%)
306 (0.6%)
1779 (9.8%)
232 (4.2%)
651 (15.7%)
0 (0.0%)
931 (10·4%)
3896 (4.5%)
3918 (1.5%)
Socioeconomically* most disadvantaged
40 521 (23.5%)
6547 (13.5%)
2181 (12.0%)
663 (12.1%)
513 (12.4%)
800 (27.2%)
1276 (14.1%)
11 980 (13.6%)
52 504 (20.1%)
Private health insurance 73 774 (43.1%)
19 247 (40.2%)
5495 (30.2%)
1379 (25.0%)
380 (9.2%)
153 (5.3%)
1471 (16.3%)
59 374 (32.1%)
101 902 (39.4%)
Parity

CHAPTER 6. ACCULTURATION AND STILLBIRTH IN WA
PAGE | 122
Nulliparous 73 456 (42.6%)
21 205 (43.7%)
8759 (48.1%)
3204 (58.2%)
1217 (29.3%)
955 (32.5%)
3532 (39.1%)
38 872 (44.0%)
112 340 (43.0%)
Primiparous 60 403 (35.1%)
17 243 (35.5%)
6485 (35.6%)
1817 (33.0%)
1113 (26.8%)
792 (26.9%)
2695 (29.8%)
30 145 (34.1%)
90 561 (34.7%)
Multiparous 38 712 (22.5%)
10 098 (20.8%)
2968 (16.3%)
482 (8.8%)
1825 (43.9%)
1194 (40.6%)
2811 (31.1%)
19 378 (21.9%)
58 096 (22.3%)
Any medical condition 60 602 (35.4%)
14 748 (30.8%)
4889 (26.9%)
2095 (38.0%)
1567 (37.9%)
993 (34.2%)
3299 (36.8%)
27 590 (31.5%)
60 603 (35.3%)
Previous stillbirth 2011 (1.2%)
575 (1.2%)
179 (1.0%)
73 (1.3%)
149 (3.6%)
53 (1.8%)
182 (2.0%)
1211 (1.4%)
3222 (1.3%)
Any pregnancy complication 57596 (33.4%)
15 330 (31.6%)
6489 (35.6%)
2162 (39.3%)
1339 (32.2%)
925 (31.5%)
3214 (35.6%)
29 459 (33.3%)
87 059 (33.4%)
Plurality
Singleton 167 481 (97.1%)
47 075 (97.0%)
17 822 (97.9%)
5389 (97.9%)
4031 (97.0%)
2883 (98.0%)
8725 (96.5%)
85 925 (97.2%)
253 435 (97.1%)
Multiple 5090 (3.0%)
1471 (3.0%)
390 (2.1%)
114 (2.1%)
124 (3.0%)
58 (2.0%)
313 (3.5%)
2470 (2.8%)
7544 (2.9%)
*The socioeconomically most disadvantaged group is comprised of the bottom 20% of IRSD.
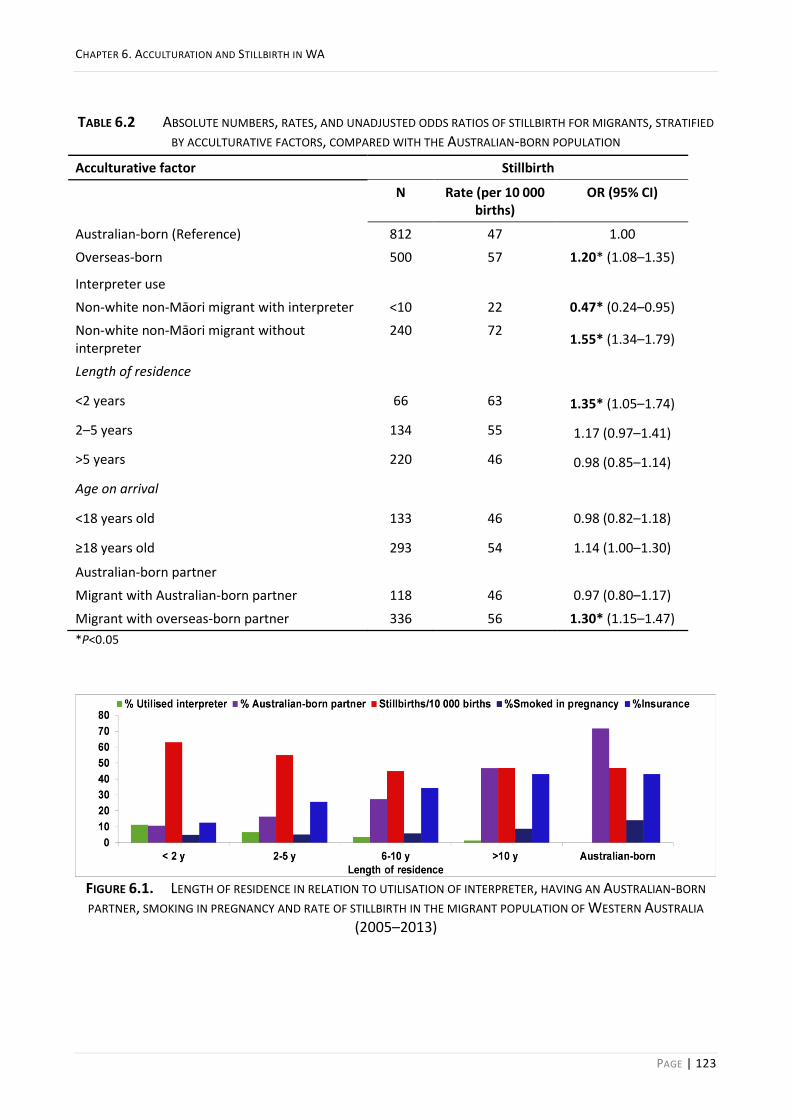
CHAPTER 6. ACCULTURATION AND STILLBIRTH IN WA
PAGE | 123
TABLE 6.2 ABSOLUTE NUMBERS, RATES, AND UNADJUSTED ODDS RATIOS OF STILLBIRTH FOR MIGRANTS, STRATIFIED
BY ACCULTURATIVE FACTORS, COMPARED WITH THE AUSTRALIAN-BORN POPULATION
Acculturative factor Stillbirth
N Rate (per 10 000 births)
OR (95% CI)
Australian-born (Reference) 812 47 1.00
Overseas-born 500 57 1.20* (1.08–1.35)
Interpreter use
Non-white non-Māori migrant with interpreter <10 22 0.47* (0.24–0.95)
Non-white non-Māori migrant without interpreter
240 72 1.55* (1.34–1.79)
Length of residence
<2 years 66 63 1.35* (1.05–1.74)
2–5 years 134 55 1.17 (0.97–1.41)
>5 years 220 46 0.98 (0.85–1.14)
Age on arrival
<18 years old 133 46 0.98 (0.82–1.18)
≥18 years old 293 54 1.14 (1.00–1.30)
Australian-born partner
Migrant with Australian-born partner 118 46 0.97 (0.80–1.17)
Migrant with overseas-born partner 336 56 1.30* (1.15–1.47)
*P<0.05
FIGURE 6.1. LENGTH OF RESIDENCE IN RELATION TO UTILISATION OF INTERPRETER, HAVING AN AUSTRALIAN-BORN
PARTNER, SMOKING IN PREGNANCY AND RATE OF STILLBIRTH IN THE MIGRANT POPULATION OF WESTERN AUSTRALIA
(2005–2013)

CHAPTER 6. ACCULTURATION AND STILLBIRTH IN WA
PAGE | 124
When the migrant population was stratified by ethnicity, length of residence was not associated
with stillbirth in Māori or white migrant women compared to Australian-born women; however,
women from Asian and Indian backgrounds had significantly increased odds of stillbirth in their
first two years of residence in Australia (aOR 1.93, 95% CI 1.21–3.05; aOR 2.71, 95% CI 1.58–4.65;
respectively) which resolved with longer periods of residence. Women from African backgrounds
had more than three times higher odds of stillbirth than their Australian-born counterparts (aOR
3.32, 95% CI 1.70–6.47) in their first two years of residence. Although the risk of stillbirth
decreased with longer residence in these women, it remained significantly higher than Australian-
born women after five years of residing in Australia (aOR 1.96; 95% CI 1.10–3.49). This risk
persisted after adjusting for other stillbirth risk factors (Table 6.3).
TABLE 6.3 LENGTH OF RESIDENCE AND THE ODDS OF STILLBIRTH IN MIGRANTS FROM SPECIFIC ETHNIC
BACKGROUNDS COMPARED TO THE AUSTRALIAN-BORN POPULATION
Study population Length of residence
<2 years 2–5 years >5 years
Australian-born (Reference) 1.00 1.00 1.00
Migrant
White OR (95% CI) 0.73 (0.43–1.25) 0.99 (0.75–1.31) 0.94 (0.78–1.13)
aOR(95% CI) 0.88 (0.52–1.50) 1.20 (0.90–1.59) 1.02 (0.84–1.23)
Asian OR (95% CI) 1.71* (1.09–2.71) 0.90 (0.60–1.37) 1.00 (0.73–1.35)
aOR(95% CI) 1.93* (1.21–3.05) 1.01 (0.66–1.53) 1.06 (0.77–1.44)
Indian OR (95% CI) 2.30* (1.35–3.91) 1.22 (0.73–2.04) 0.67 (0.25–1.79)
aOR(95% CI) 2.71* (1.58–4.65) 1.38 (0.82–2.32) 0.67 (0.25–1.80)
African OR (95% CI) 2.64* (1.36–5.11) 2.41* (1.51–3.85) 1.80* (1.01–3.19)
aOR(95% CI) 3.32* (1.70–6.47) 2.77* (1.70–4.52) 1.96* (1.10–3.49)
Māori OR (95% CI) 0.80 (0.20–3.22) 1.74 (0.82–3.66) 1.07 (0.51–2.26)
aOR(95% CI) 0.75 (0.19–3.03) 1.71 (0.70–3.62) 1.07 (0.51–2.28)
Other OR (95% CI) 1.08 (0.54–2.17) 1.53 (0.98–2.38) 1.07 (0.69–1.67)
aOR(95% CI) 1.23 (0.61–2.49) 1.63* (1.04–2.56) 1.08 (0.74–1.80) aOR: Adjusted for marital status, maternal age group, socioeconomic status, parity, plurality, previous stillbirth, medical conditions, pregnancy complications, sex of baby and smoking during pregnancy. *P<0.05
The increase in the proportion of the migrant population with private health insurance was most
evident among women from white (15.8% in <2 years of residence to 34.4% in 2–5 years of
residence), Asian (12.2% in <2 years of residence to 21.6% in 2–5 years of residence) and Indian
(12.8% in <2 years of residence to 22.7% in 2–5 years of residence) backgrounds (Figure 6.2). It is

CHAPTER 6. ACCULTURATION AND STILLBIRTH IN WA
PAGE | 125
worth noting that migrant women from these ethnic backgrounds, who lived in Australia for >10
years, had a higher percentage of private health insurance than Australian-born women (46.2%,
45.1% and 53.8%, respectively).
FIGURE 6.2 LENGTH OF RESIDENCE IN AUSTRALIA AND PERCENTAGE OF HAVING PRIVATE HEALTH INSURANCE FOR
MIGRANT WOMEN FROM SPECIFIC ETHNIC BACKGROUNDS DELIVERED IN WA (2005–2013)
In a further exploratory analysis, including ‘having private health insurance’ in the multivariable
model resulted in a 33% reduction in the odds of stillbirth in Asian and Indian (combined) women
with less than two years length of residence (from aOR 2.18, 95% CI 1.52–3.10 to aOR 1.85, 95% CI
1.29–2.65).
The proportion of the population with an Australian-born partner is illustrated in Figure 6.3 for
each specific ethnic group. Overall, 71.8% of Australian-born and 30% of migrant women had an
Australian-born partner. The proportion of migrant women with an Australian-born partner
increased with a longer length of residence for all migrant groups; however, the rate varied for
each specific ethnicity with Indian women having the highest surge after ten years of residing in
Australia.
The proportion of interpreter utilisation was the highest in the first two years of residence in
Australia and gradually decreased with longer length of residence, albeit at various rates among
different ethnic groups of migrants (Figure 6.4).

CHAPTER 6. ACCULTURATION AND STILLBIRTH IN WA
PAGE | 126
FIGURE 6.3 LENGTH OF RESIDENCE IN AUSTRALIA AND PERCENTAGE OF HAVING AN AUSTRALIAN-BORN PARTNER FOR
MIGRANT WOMEN FROM SPECIFIC ETHNIC BACKGROUNDS DELIVERED IN WA (2005–2013)
FIGURE 6.4 LENGTH OF RESIDENCE IN AUSTRALIA AND THE PERCENTAGE OF UTILISATION OF INTERPRETER FOR
MIGRANT WOMEN FROM SPECIFIC ETHNIC BACKGROUNDS DELIVERED IN WA (2005–2013)
THE OVERALL LEVEL OF ACCULTURATION 6.4.1
Migrant women with an overseas-born partner who did not use an interpreter were the most at-
risk group among new migrants residing in Australia for less than five years. While their migrant
counterparts who used an interpreter had 62% lower odds of stillbirth (aOR 0.38, 95% CI 0.15–
0.95), these women had a 31% higher odds of stillbirth (aOR 1.31, 95% CI 1.03–1.65) than
Australian-born women. No significant difference was observed in those with a length of residence
of >5 years. Non-white non-Māori migrant women with an overseas-born partner who did not use
an interpreter were particularly at risk with 86% higher odds of stillbirth (aOR 1.86, 95% CI 1.50–
2.32) than Australian-born women.
Sensitivity analyses, excluding stillbirths with major congenital anomalies, did not affect the
findings.

CHAPTER 6. ACCULTURATION AND STILLBIRTH IN WA
PAGE | 127
DISCUSSION 6.5
We found that longer length of residence, using an interpreter, and having an Australian-born
partner were all associated with a lower risk of stillbirth in migrants. Further, we showed that
migrant women with an overseas-born partner, who did not use an interpreter, were the most at-
risk group among migrants residing in Australia for less than five years. Giving birth in the first two
years after arrival in Australia had the highest risk of stillbirth for migrant women from African,
Asian and Indian backgrounds. However, the increased risk disappeared beyond the first two years
of residence among women from Asian and Indian backgrounds.
A longer length of residence in Australia was associated with a lower risk of stillbirth in migrants in
this study, consistent with a previous nationwide study in Sweden where the risk of stillbirth was
higher in foreign-born women with <5 years of residence.67 In contrast, a recently published
nationwide population-based study from Norway did not find an association between length of
residence and stillbirth in immigrant women.194 The discrepancy in these two Nordic studies, with
seemingly comparable populations and health system, is probably due to differences in the
definition of outcome or lack of adjustments for potential confounders such as smoking and body
mass index in the Norwegian study. Sweden defines stillbirth as the death of a baby of at least 28
weeks gestation while Norway uses a lower limit of 22 weeks gestation. Smoking is a well-
established risk factor for stillbirth.78 In our study, the more acculturated women (as indicated by
having an Australian-born partner and longer length of residence) were more likely to smoke while
pregnant. Elevated rates of smoking in pregnant Hispanic women with a higher level of
acculturation have been reported in the US196 and among Turkish women residing in Europe.195
Given that smoking is a risk factor for stillbirth, the protective effect of longer length of residence
on stillbirth may have been counteracted and underestimated due to the simultaneous increase in
the prevalence of smoking in more acculturated women.
Of note, adjusting for private health insurance status reduced the odds of stillbirth by 33% in Asian
and Indian women residing in Australia for less than two years in our study. This may suggest that
rather than acculturative factors, unfamiliarity with the health system or other barriers to access
may influence the risk of stillbirth in newly arrived migrants from these ethnic backgrounds. In
Australia, despite the availability of a universal health insurance scheme covering all Australian
citizens and permanent residents (Medicare), depending on the type of visa (humanitarian visas
are excluded), a two- to four-year waiting period is applied before immigrants become eligible to

CHAPTER 6. ACCULTURATION AND STILLBIRTH IN WA
PAGE | 128
benefit from some health and social security services, including Newstart/Jobseeker Allowance
and Healthcare Concession Card.154 Whether this operates as a barrier to service utilisation and is
associated with the observed disparities in the rate of stillbirth among migrant women who gave
birth before completed two years of residence needs further investigation.
Effective communication is vital for navigating the health system and for optimal care. Language
discordance has been highlighted as a barrier to access health services for migrants and refugees
in Australian and to compromise the quality of care.174,262,263 In our study, migrant women who
used an interpreter had a significantly lower risk of stillbirth than those who did not. Given that
the majority of migrants who used an interpreter were from regions with higher rates of stillbirth
than Australia and had a residence length of <5 years in Australia, this may be evidence of a
‘healthy migrant paradox’.146 This paradox entails observing health outcomes better than the host
population among the newly arrived migrants, despite the disadvantages that migrants encounter,
that slowly converges to the host population levels over time.146 Not using an interpreter was a
particularly strong risk factor for non-white non-Māori migrant women who had an overseas-born
partner and delivered during the first five years of residing in Australia, suggesting lower levels of
acculturation. Anecdotal evidence and qualitative studies suggest that a reasonable proportion of
women who did not use an interpreter service was not competent in the language. Previous
reports from Australia and Europe indicated that despite the difficulty in communication, migrant
women from some ethnic backgrounds might not request an interpreter or their partners may
insist on acting as the translator which can compromise the care received.157,263,264 Despite the
availability of a unique fee-free rapid-access telephone interpreter service (Doctors Priority Line) in
Australia, it was estimated that this service was used for less than 1% of private general practice
consultations for patients with poor English proficiency.264 Further, qualitative studies have shown
that doctors tend to over-investigate and act on the results rather than organising an interpreter
and attending to patients’ symptoms.263 Thus, our findings may indicate a lack of communication
and mutual understanding between pregnant women and clinicians in those who did not use the
interpreter service, if the interpreter was required but not requested or offered. Using an
interpreter in our data may be an indicator that a culturally sensitive healthcare plan was in effect.
Mutual accommodation is required for healthy and successful integration of migrants; adopting
the basic values of the host country by migrants and adapting the healthcare and education
systems to meet the needs of all population groups appropriately.129 Hence, the lower rate of

CHAPTER 6. ACCULTURATION AND STILLBIRTH IN WA
PAGE | 129
stillbirth in migrants who used interpreter services may signify the success of a culturally sensitive
healthcare practice.
Our data suggest a slower acculturation rate in some ethnic groups, particularly those of African
descent. The rate of stillbirth in African migrant women decreased with longer duration of
residence but remained significantly higher than Australian-born women. Slower acculturation
may be a sign of marginalisation or segregation, rather than healthy integration, potentially due to
discrimination, which can be detrimental to the wellbeing of individuals and the community.129
This can be more prevalent in those whose physical features (e.g. skin colour or clothing) set them
apart from the majority population.129 A negative association between length of residence and
level of stress has been reported in African migrants in the US.284 Among Somali refugees residing
in the US, interpreter service use increased with longer length of residence while lower rates of
interpreter utilisation were associated with poorer birth outcomes.285 In our population, African
women had the highest utilisation of interpreters among all migrant ethnic groups. Despite this,
our findings suggest their ‘need’ for interpreters may be higher than currently being met and
captured by our data. Addressing the underutilisation of interpreters may be a simple strategy for
addressing the increased risk of stillbirth in this population. This finding also warrants further
investigation of whether racial discrimination, a risk factor for adverse birth outcomes 286, also
plays a role.
Consistent with the Norwegian study,194 having an Australian-born partner reduced the risk of
stillbirth in migrant women in WA. Intermarriage is considered one of the most powerful
indicators of integration.132 Having an Australian-born partner may result in more interaction
within the community, competency in English, and familiarity with the health system when
navigating pregnancy care.194,197
In conclusion, migrant populations are diverse, and the processes of immigration and
acculturation are complex. Leaving family and friends behind, lack of support in the new country,
isolation and experience of discrimination may impact the physical and mental health of
migrants284 and consequently be detrimental to the health of their babies. Thus, understanding
the effect of migration and acculturation on the health of immigrants and their babies is vital for
identifying disparities and targeting at-risk groups with a culturally responsive healthcare system
and ethnic-specific preventive strategies. Furthermore, investigating the social, cultural,

CHAPTER 6. ACCULTURATION AND STILLBIRTH IN WA
PAGE | 130
behavioural and other determinants of lower/slower acculturation is warranted to identify
opportunities for intervention and prevention of marginalisation.
STRENGTH AND LIMITATIONS 6.5.1
We used de-identified linked administrative health data in this study to investigate stillbirth in a
large population of migrant women. Such a method reduced the risk of selection, participation
and recall biases, enhanced accuracy through cross-source checking of data from multiple
databases, and consequently strengthened the reliability of findings; however, this method has
limitations due to the extent of variables available or classification of variables, and some
misclassification towards the null hypothesis may exist. Residual confounding due to the
covariates not recorded in the datasets (e.g. maternal body mass index)287, despite controlling for
a range of potential risk factors, may remain. Also, the duration of residence may result in
different levels of integration and acculturation whether the migrant arrived as an adult or as a
child.288 However, in our study, the majority of non-white non-Māori migrants (75.2–91.6%)
arrived in Australia as an adult, and the association of this factor with stillbirth was not statistically
significant. Further, we assessed acculturation in a multidimensional manner by considering
additional acculturative factors, such as interpreter use and partner’s country of birth. Given the
prevalence of stillbirth in Australia, a large population of participants is required to explore the
influence of migration, ethnicity and acculturation on the risk of stillbirth. We acknowledge that,
similar to other population studies, we have investigated the effect of acculturation using proxy
measures described in detail in this paper. An in-depth interview with participants may provide a
thorough and more accurate understanding of psychological, cultural and behavioural changes
they experience; given the sample size required for such a study and other considerations
necessary to interview bereaved parents from diverse backgrounds, this would not be practically
feasible. Thus, a population-based linked-data study, such as that undertaken here, is the only
feasible method for investigation and still provides useful insight into the influences of these
factors on stillbirth. Nevertheless, population data collections may be strengthened by linking
Census data with additional acculturation-related information, such as the language spoken at
home or sociocultural preferences or their shifts over time.
IMPLICATIONS AND GENERALISABILITY 6.5.2
Acculturation may elevate the risk of stillbirth by increasing the prevalence of unhealthy habits,
such as smoking, and decrease the risk by empowering migrants to better use health services and
CHAPTER 6. ACCULTURATION AND STILLBIRTH IN WA
PAGE | 131
effective communication. Thus, the resultant outcome will depend on how these underlying
factors interplay in populations over time. According to our findings and previous studies in other
settings, acculturation is emerging as an important factor to consider when providing health care
to immigrant populations. Therefore, the findings of this study have important implications for
policy and practice—a national educational program to familiarise migrants with the health
system, their risks, rights and entitlements to healthcare programs before, during and after
pregnancy, and a culturally responsive healthcare system to improve access to and utilisation of
interpreter and other services, especially in recently arrived migrants that are at greater risk, may
help to reduce the rate of stillbirth. It is particularly crucial to investigate and address the
underlying mechanisms for the increased risk of stillbirth in the first two years after the arrival in
Australia. Until then, pregnant women from non-white non-Māori ethnic backgrounds with a
length of residence <2 years may benefit from being treated as high risk for stillbirth.
Our findings can be generalised to other populations hosting migrants from similar ethnic
backgrounds in Australia and New Zealand, European countries and Canada; nevertheless,
interpretation should be with caution due to factors such as different immigration laws,
healthcare systems, cultures and lifestyle norms in host countries.
CHAPTER 7. PRETERM BIRTH AND LOW BIRTHWEIGHT IN RELATION TO MIGRATION AND ETHNICITY IN WA
PAGE | 132
CHAPTER 7. PRETERM BIRTH AND LOW BIRTHWEIGHT IN RELATION TO
MIGRATION AND ETHNICITY IN WESTERN AUSTRALIA
This chapter comprises a paper submitted as an article to the International Journal of
Epidemiology (May 2020) for publication and is currently under review. The research explored the
influence of migration and ethnicity on the risk of different types of preterm birth and term low
birthweight in the population of WA. It further investigated outcomes among the Australian-born
population from different ethnic backgrounds. The study is related to the fourth aim of the thesis:
“to investigate ethnic disparities in the risk of low birthweight (LBW) and preterm birth (PTB),
spontaneous and medically indicated, between migrant and Australian-born populations in WA.”

CHAPTER 7. PRETERM BIRTH AND LOW BIRTHWEIGHT IN RELATION TO MIGRATION AND ETHNICITY IN WA
PAGE | 133
ABSTRACT 7.1
Background: Preterm birth (PTB) and low birthweight (LBW) are associated with short- and long-
term adverse health outcomes. The evidence suggests that migrant status and ethnicity are
influential factors in these conditions. We investigated the effect of migration and ethnicity on the
risk of PTB and term-LBW.
Methods: This retrospective cohort study examined the association between migrant status and
ethnicity with birth outcomes for all non-Indigenous singleton live births in Western Australia
(WA) from 2005–2013. Regression analyses determined the risk/odds of PTB [idiopathic,
premature pre-labour rupture of membrane (PPROM) and medically indicated] and term-LBW
comparing migrants and Australian-born women from white, Asian, African, Indian, Māori and
‘other’ ethnicities.
Results: All non-Māori ethnic groups—migrant and Australian-born—had higher odds of term-
LBW than the white Australian-born group, with aORs ranging from 1.12 (CI 1.01–1.23) to 4.10 (CI
3.51–4.80). Migrant Indians had a higher risk of idiopathic, PPROM and medically indicated PTB
(aRRR 1.26, 95% CI 1.06–1.50; aRRR 1.28, CI 1.03–1.60; aRRR 1.21, CI 1.03–1.42, respectively) and
migrant Asians had a higher risk of idiopathic PTB (aRRR 1.20, CI 1.09–1.31). Migrant white and
African women had a lower risk of idiopathic PTB (aRRR 0.87, CI 0.80–0.93; aRRR 0.75, CI 0.59–
0.95, respectively) and PPROM PTB (aRRR 0.90, CI 0.83–0.99; aRRR 0.70, CI 0.51–0.96,
respectively), while migrant Māori had lower risk of medically indicated PTB (aRRR 0.75, CI 0.56–
0.97).
Conclusion: While ethnicity and migrant status were associated with increased risk of term-LBW,
only specific ethnic groups had a higher risk of PTB than white Australian-born women. This
warrants further investigation of influential factors in specified ethnic groups to develop
appropriate policies and preventive strategies to reduce term-LBW and PTB in the population.

CHAPTER 7. PRETERM BIRTH AND LOW BIRTHWEIGHT IN RELATION TO MIGRATION AND ETHNICITY IN WA
PAGE | 134
INTRODUCTION 7.2
Preterm birth (PTB), birth before 37 completed weeks of gestation230, and low birthweight (LBW),
birthweight less than 2500 grams regardless of the gestational age of the newborn28, are adverse
pregnancy outcomes associated with higher rates of mortality and morbidity not only in childhood
but throughout life.289 The short-term and long-term burden of these conditions and the resulting
financial costs imposed on families and healthcare systems are substantial.96,290
Recent reports indicate that more than 20 million babies were born alive with LBW worldwide in
2015; 91% from low- to middle-income (LMIC) countries, 48% from southern Asia and 24% from
Sub-Saharan Africa.114 Similar global reports have indicated that approximately 15 million live-born
babies were born premature in 2010 and PTB rates are increasing globally.96
High-income countries are home to more than 60% of international migrants.118 Australia, with
26% of its population born overseas, has a higher proportion of migrant residents than the United
States (US) (14%), Canada (22%), New Zealand (23%) and the United Kingdom (13%).291 Western
Australia has experienced the fastest population growth among all Australian states or territories
over the last decade, with the number of migrant families exceeded non-migrants,136,234 providing
an ideal population laboratory to study the impact of ethnicity and migration on adverse
pregnancy outcomes.
The evidence suggests that migrant status, region of birth and ethnicity are all influential factors
for birth outcomes.199,241,292 We previously reported ethnic disparities in the risk of antepartum
and intrapartum stillbirths between the Australian-born population and migrants from diverse
ethnic backgrounds.241,278 However, such disparities have not been investigated for PTB and LBW
between migrants and Australian-born populations.

CHAPTER 7. PRETERM BIRTH AND LOW BIRTHWEIGHT IN RELATION TO MIGRATION AND ETHNICITY IN WA
PAGE | 135
The aim of this study was to investigate disparities in the risk of term-LBW and PTB between
migrant and Australian-born women.
METHODS 7.3
STUDY POPULATION AND DATA SOURCES 7.3.1
A retrospective cohort study was conducted using routinely collected administrative data from the
Department of Health WA, linked through the WA Data Linkage System (WADLS). We examined
de-identified data for the entire non-Indigenous population of singleton live births in WA from 1
January 2005 to 31 December 2013.
The WADLS, established in 1995, uses best-practice probabilistic matching, based on full name and
address, phonetic compression algorithms and other identifiers, to link data from a variety of
health and other administrative datasets.204,211,213 Additionally, numerous automated and manual
sub-processes have been designed specifically to reduce the likelihood of linkage error—the
details of which are reported in linkage quality statements elsewhere.212,215
We primarily sourced data from the Midwives Notification System (MNS), a statutory database of
pregnancy, birth and infant information collected by attending midwives for all births of at least 20
weeks gestation or at least 400 grams in weight (if unknown gestational age). The MNS includes
maternal, pregnancy and infant characteristics as well as infant outcomes. Data from the MNS
were supplemented with additional variables linked from the WA Birth Register, including
maternal, paternal and infant demographic characteristics for all registered births in WA, and the
Hospital Morbidity Data Collection (HMDC), which contains information related to all inpatient
discharges from all WA hospitals. The Family Connections Linkage Facility223 of the WADLS was
used to link migrant women with their child outcomes.

CHAPTER 7. PRETERM BIRTH AND LOW BIRTHWEIGHT IN RELATION TO MIGRATION AND ETHNICITY IN WA
PAGE | 136
VARIABLES 7.3.2
PTB was defined as birth before 37 completed weeks of gestation230, and LBW as birthweight less
than 2500 grams at the time of birth.28
PTBs were classified as spontaneous PTB (spontaneous onset) and medically indicated PTB (PTB
after medical intervention: induction of labour or elective caesarean section). Spontaneous PTB
was further subdivided into idiopathic PTB (spontaneous labour with intact fetal membranes) and
preterm pre-labour rupture of membranes (PPROM) where labour began spontaneously after
PPROM.93,94,293,294
Birth status (live birth, stillbirth), plurality (number of babies in this birth), infant weight (grams),
estimated gestational age at time of birth (completed weeks), onset of labour (spontaneous,
induced, elective caesarean) and complications of pregnancy (data on pre-labour rupture of
membrane) from MNS were used to identify the population of study and classify the outcomes of
interest.
Migrant status (Australian- or overseas-born), using mother’s place/country of birth (from Birth
Registrations/HMDC) and ethnic origin (from MNS) were used to group the study population into
white, Asian, Indian, African, Māori or other ethnic backgrounds.241
Year of birth, maternal age (grouped as <20, 20–24, 25–29, 30–34, 35–39, 40–44, >44), marital
status (never married, divorced/separated, married/de facto, other), smoking in pregnancy (yes,
no), any medical condition (yes, no), gestational diabetes (yes, no), preeclampsia (yes, no), sex of
baby (female, male), fertility treatment (yes/no) and socioeconomic disadvantage (using Index of
Relative Socioeconomic Disadvantage: IRSD) were extracted from the MNS data. Private health
insurance (yes, no) was extracted from HMDC.
CHAPTER 7. PRETERM BIRTH AND LOW BIRTHWEIGHT IN RELATION TO MIGRATION AND ETHNICITY IN WA
PAGE | 137
STATISTICAL METHODS 7.3.3
The demographic and obstetric characteristics of the study population were summarised and
tabulated. The cumulative incidence of the outcomes of interest was reported as the percentage
of births with LBW or PTB from all singleton live births recorded during the study period. Logistic
regression was used to calculate the odds ratios (OR) and 95% confidence intervals (CI) for
associations with term-LBW and PTB. Multinomial logistic regression was used to estimate the
Relative Risk Ratios (RRR) of spontaneous (idiopathic and PPROM) and medically indicated PTB
relative to term birth, among migrant women from white, Asian, Indian, African, Māori and ‘other’
ethnic backgrounds compared to Australian-born women from a white background. We also
compared migrants and Australian-born populations from the same ethnic groups. Analyses were
adjusted for year of birth, maternal age group, marital status, parity, socioeconomic disadvantage,
infertility treatment, smoking in pregnancy, any pre-existing medical condition and sex of the
baby.293,294
In the sensitivity analyses, gestational diabetes and preeclampsia were added to the adjusted
model to test the potential confounding effect of these pregnancy complications while avoiding
possible collider bias due to including intermediate variables in main analyses.249 We also
examined the effect of having private health insurance on the risk of medically indicated PTB by
adding this variable to the adjusted model. In a further exploratory analysis, we separated
Chinese-born women from other overseas-born Asian women to calculate their specific risk of PTB
compared with the white Australian-born population as previous research indicated that Chinese-
born women had lower rates of PTB than Australian-born women.163
Missing data were low (3.3% for IRSD) and were considered missing at random, and complete case
analysis was undertaken.
All analyses were performed using Stata (version 13·1; StataCorp LP, College Station, Texas).

CHAPTER 7. PRETERM BIRTH AND LOW BIRTHWEIGHT IN RELATION TO MIGRATION AND ETHNICITY IN WA
PAGE | 138
Ethics approval for this study was granted by the Human Research Ethics Committee of the WA
Department of Health (2015/23).
RESULTS 7.4
Ethnic background and migrant status were complete for 99.99% of the mothers. The study
population comprised 252 256 singleton live births; 66.1% to Australian-born women (64.0% from
white and 2.1% from non-white ethnic backgrounds) and 33.9% to migrant women (18.6% from
white and 14.3% from non-white ethnic backgrounds).
Proportions of married (91.7% vs 88.0%), as well as nulliparous (44.0 vs 42.6%) women, were
higher among migrants than the Australian-born population. Migrants also had lower proportions
who smoked during pregnancy (7.1% vs 14.0%) and who were in the most disadvantaged group
(13.6% vs 23.5%) (Table 7.1).
Among all population groups, migrant women from Indian background had the lowest (0.3%), and
those from Māori background had the highest (10.4%) proportions of teenage pregnancies, while
white migrant women had the highest proportion of giving birth over 35 years of age (30.2%).

CHAPTER 7. PRETERM BIRTH AND LOW BIRTHWEIGHT IN RELATION TO MIGRATION AND ETHNICITY IN WA
PAGE | 139
TABLE 7.1 DEMOGRAPHIC CHARACTERISTICS OF THE STUDY POPULATION
Characteristics Australian-born women Migrant women All women
White Asian Indian African Māori Other All White Asian Indian African Māori Other All
Live & singleton births
161 387 (64.0%)
1279 (0.5%)
296 (0.1%)
55 (0%)
239 (0.1%)
3519 (1.4%)
166 775 (66.1%)
46 878 (18.6%)
17 734 (7.0%)
5352 (2.1%)
3985 (1.6%)
2867 (1.1%)
8665 (3.4%)
85 481 (33.9%)
252 256 (100%)
PTB 10 115 (6.3%)
86 (6.7%)
18 (6.8%)
<10 (1.8%)
<10 (3.8%)
288 (8.2%)
10 517 (6.3%)
2699(5.8%) 1177 (6.6%)
387 (7.2%)
227 (5.7%)
169 (5.9%)
564 (6.5%)
5223 (6.1%)
15 741 (6.2%)
LBW 6539 (4.1%)
18 (6.1%)
79 (6.2%)
<10 (1.8%)
<10 (2.1%)
225 (6.4%)
6539 (4.1%)
1830 (3.9%)
962 (5.4%)
429 (8.0%)
221 (5.6%)
136 (4.7%)
477 (5.5%)
4055 (4.7%)
10 923 (4.3%)
Marital status
Never married 16 505 (10.2%)
138 (10.8%)
23 (7.8%)
18 (32.7%)
54 (22.6%)
643 (18.3%)
17 381 (10.4%)
2933 (6.2%)
689 (3.9%)
99 (1.8%)
515 (13.1%)
554 (19.4%)
586 (6.8%)
5376 (6.3%)
22 759 (9.0%)
Divorced/
separated
1431 (0.9%)
<10 (0.6%)
<10 (0.7%)
<10 (1.8%)
<10 (1.3%)
48 (1.4%)
1492 (0.9%)
347 (0.7%)
154 (0.9%)
17 (0.3%)
102 (2.6%)
31 (1.1%)
122 (1.5%)
773 (0.9%)
2266 (0.9%)
Married/de facto
142 355 (88.2%)
1124 (87.9%)
266 (89.9%)
36 (65.5%)
179 (74.9%)
2805 (79.7%)
146 765 (88.0%)
43 144 (92.1%)
16 647 (93.4%)
5176 (96.7%)
3317 (83.2%)
2214 (77.2%)
7876 (90.1%)
78374 (91.7%)
225 164 (89.3%)
Other 1096 (0.7%)
10 (0.8%)
<10 (1.7%)
0 (0.0%)
<10 (1.3%)
23 (0.7%)
1137 (0.7%)
454 (1.0%)
244 (1.4%)
60 (1.1%)
51 (1.3%)
68 (2.4%)
81 (0.9%)
958 (1.1%)
2095 (0.8%)
Parity
Nulliparous 68 501 (42.5%)
655 (51.2%)
137 (46.3%)
28 (50.9%)
116 (48.5%)
1559 (44.3%)
70 996 (42.6%)
20 466 (43.7%)
8519 (48.0%)
3114 (58.2%)
1175 (29.5%)
932 (32.5%)
3360 (38.8%)
37 566 (44.0%)
108 571 (43.0%)
Primiparous 56 711 (35.1%)
408 (31.9%)
106 (35.8%)
16 (29.1%)
60 (25.1%)
1174 (33.4%)
58 475 (35.1%)
16 658 (35.5%)
6326 (35.7%)
1768 (33.0%)
1069 (26.8%)
770 (26.9%)
2619 (29.8%)
29210 (34.2%)
87 691 (34.8%)
Multiparous 36 175 (22.4%)
216 (16.9%)
53 (17.1%)
11 (20.0%)
63 (26.4%)
786 (22.3%)
37 304 (22.4%)
9754 (20.8%)
2889 (16.3%)
470 (8.8%)
1741 (43.7%)
1165 (40.6%)
2686 (31.0%)
18 705 (21.9%)
56 015 (22.2%)
Maternal age
Mean (SD) 29.5 (5.6)
28.2 (5.6)
29.4 (4.7)
27.5 (5.1)
23.9 (5.2)
28.2 (6.0)
29.5 (5.6)
31.5 (5.3)
31.2 (4.9)
29.5 (4.4)
28.8 (5.7)
26.8 (6.0)
29.9 (5.6)
30.9 (5.4)
30.0 (5.6)

CHAPTER 7. PRETERM BIRTH AND LOW BIRTHWEIGHT IN RELATION TO MIGRATION AND ETHNICITY IN WA
PAGE | 140
<20 6918 (4.3%)
85 (6.7%)
<10 (3.0%)
<10 (5.5%)
45 (18.8%)
252 (7.2%)
7312 (4.4%)
703 (1.5%)
131 (0.7%)
17 (0.3%)
188 (4.7%)
297 (10.4%)
193 (2.2%)
1529 (1.8%)
8842 (3.5%)
20–24 25 642 (15.9%)
272 (21.3%)
38 (12.8%)
12 (21.8%)
107 (44.8%)
778 (22.1%)
26 849 (16.1%)
4254 (9.1%)
1383 (7.8%)
629 (11.8%)
793 (20.0%)
862 (30.1%)
1439 (16.6%)
9365 (11.0%)
36 216 (14.4%)
25–29 46 061 (28.5%)
371 (29.0%)
95 (32.1%)
22 (40.0%)
50 (20.9%)
1003 (28.5%)
47 602 (28.5%)
11 150 (23.8%)
5099 (28.8%)
2228 (41.6%)
1209 (30.3%)
766 (26.7%)
2546 (29.4%)
22 998 (26.9%)
70 607 (28.0%)
30–34 51 274 (31.7%)
385 (30.1%)
116 (39.2%)
14 (25.4%)
24 (10.0%)
927 (26.3%)
52 740 (31.6%)
16874 (36.0%)
6751 (38.1%)
1816 (33.4%)
1116 (28.0%)
591 (20.6%)
2590 (29.9%)
29 738 (34.8%)
82 492 (32.7%)
35–39 26 536 (16.4%)
144 (11.3%)
34 (11.5%)
<10 (5.5%)
11 (4.6%)
444 (12.6%)
27 172 (16.3%)
11184 (23.9%)
3587 (20.2%)
557 (10.4%)
556 (14.0%)
277 (9.6%)
1522 (17.6%)
17 683 (20.7%)
44 859 (17.8%)
40–44 4790 (3.0%)
20 (1.6%)
<10 (1.4%)
<10 (1.8%)
<10 (0.8%)
112 (3.2%)
4929 (2.3%)
2590 (5.5%)
754 (4.3%)
101 (1.9%)
107 (2.7%)
74 (2.6%)
360 (4.2%)
3986 (4.7%)
8915 (3.5%)
>44 166 (0.1%)
<10 (0.2%)
0 (0.0%)
0 (0.0%)
0 (0.0%)
<10 (0.1%)
171 (0.1%)
123 (0.3%)
29 (0.2%)
<10 (0.1%)
11 (0.3%)
0 (0.0%)
15 (0.2%)
182 (0.2%)
353 (0.1%)
Any medical condition
56 106 (34.8%)
413 (32.3%)
107 (36.2%)
19 (3.6%)
74 (31.0%)
1666 (47.3%)
58 385 (35.0%)
14 255 (30.4%)
4744 (26.8%)
2038 (38.1%)
1489 (37.4%)
974 (34.0%)
3163 (36.5%)
26 663 (31.2%)
85 054 (33.7%)
Infertility treatment
4987 (3.1%)
28 (2.2%)
<10 (3.0%)
0 (0.0%)
<10 (0.8%)
82 (2.3%)
5108 (3.1%)
1608 (3.4%)
395 (2.2%)
120 (2.2%)
33 (0.8%)
15 (0.5%)
153 (1.8%)
2324 (2.7%)
7432 (3.0%)
Smoked 22 502 (13.9%)
82 (6.4%)
21 (7.0%)
<10 (10.9%)
85 (35.6%)
614 (17.5%)
23 310 (14.0%)
4010 (8.6%)
313 (1.8%)
40 (0.8%)
70 (1.8%)
1125 (39.2%)
465 (5.4%)
6023 (7.1%)
29 336 (11.6%)
Most disadvantaged*
38 120 (23.6%)
215 (16.8%)
37 (12.5%)
12 (2.8%)
90 (37.7%)
768 (21.8%)
39 242 (23·5%)
6326 (13·5%)
2140 (12·1%)
642 (12·0%)
491 (12·3%)
777 (27·1%)
1237 (14·3%)
11 613 (13.6%)
50 858 (20·2%)
Gestational diabetes
6984 (4.3%)
88 (6.9%)
17 (5.7%)
<10 (12.7%)
<10 (2.5%)
214 (6.1%)
7316 (4.4%)
2612 (5.6%)
2243 (12.7%)
834 (15.6%)
297 (7.5%)
115 (4.0%)
822 (9.5%)
6931 (8.1%)
14 239 (5.6%)
Preeclampsia 4482 (2.3%)
37 (2.9%)
<10 (2.7%)
<10 (1.8%)
<10 (2.5%)
116 (3.3%)
4650 (2.8%)
1053 (2.3%)
298 (1.7%)
119 (2.2%)
116 (2.9%)
73 (2.6%)
198 (2.3%)
1857 (2.2%)
6507 (2.6%)
Sex of baby
Male 82 479 (51.1%)
677 (52.9%)
144 (48.7%)
25 (45.5%)
127 (53.1%)
1833 (52.1%)
85 285 (51.1%)
23 882 (51.0%)
9207 (51.9%)
2729 (51.0%)
2055 (51.6%)
1450 (50.6%)
4435 (51.2%)
43 758 (51.2%)
129 057 (51.2%)
*The bottom 20% of IRSD

CHAPTER 7. PRETERM BIRTH AND LOW BIRTHWEIGHT IN RELATION TO MIGRATION AND ETHNICITY IN WA
PAGE | 141
Cumulative incidence of LBW during the period of study was higher for migrants (4.7%) than the
Australian-born population (4.1%) whereas, for PTB, migrants had slightly (0.2%) lower cumulative
incidence (Table 7.2). When the migrant population was stratified by ethnicity, the rate of LBW
was diverse with women from an Indian background having the highest proportion (3.9%) of term-
LBW, three times that in Australian-born women (Table 7.2).
TABLE 7.2 CUMULATIVE INCIDENCE OF LBW AND PTB FOR BIRTHS TO AUSTRALIAN-BORN WOMEN AND BIRTHS TO
OVERSEAS-BORN WOMEN STRATIFIED BY ETHNIC BACKGROUND (2005–2013)
Migrant status and ethnicity
Cumulative incidence
Low birthweight Preterm birth
All LBW
(%)
Term-LBW
(%)
All PTB
(%)
Idiopathic PTB (%)
PPROM
(%)
Medically indicated PTB (%)
Australian-born 4.1 1.3 6.3 2.4 1.4 2.5
White 4.1 1.3 6.3 2.4 1.4 2.5
Asian 6.2 2.2 6.7 3.1 1.1 1.5
Indian 6.1 2.9 6.1 2.0 1.4 2.7
African 1.8 0 1.8 0 1.8 0
Māori 2.1 0.9 3.8 1.7 1.3 0.8
Other 6.4 2.3 8.2 2.8 1.6 3.8
Migrant 4.7 1.8 6.1 2.3 1.3 2.5
White 3.9 1.3 5.8 2.1 1.3 2.4
Asian 5.4 2.1 6.6 2.9 1.4 2.3
Indian 8.0 3.9 7.2 2.6 1.6 3.0
African 5.6 2.2 5.7 1.8 1.0 2.9
Māori 4.7 2.0 5.9 3.0 1.1 1.9
Other 5.5 1.9 6.5 2.4 1.4 2.8
All 4.3 1.5 6.2 2.4 1.4 2.5
Apart from white migrants, whose unadjusted odds of term-LBW were similar to that of the white
Australian-born population, all other migrant ethnic groups showed higher odds of term-LBW than
the white Australian-born group (Table 7.3). Migrant women from white and Māori backgrounds
had lower adjusted odds of PTB (aOR 0.93, 95% CI 0.89–0.98; aOR 0.85, 95% CI 0.73–1.00,
respectively, P=0.049), while women from Asian and Indian backgrounds had higher adjusted odds
than white Australian-born women (aOR 1.16, 95% CI 1.09–1.24; aOR 1.24, 95% CI 1.12–1.38,
respectively) (Table 7.3).

CHAPTER 7. PRETERM BIRTH AND LOW BIRTHWEIGHT IN RELATION TO MIGRATION AND ETHNICITY IN WA
PAGE | 142
Australian-born women from Indian (OR 2.69, 95% CI 1.32–5.46), ‘other’ (OR 1.70, 95% CI 1.34–
2.15) and Asian (OR 1.98, 95% CI 1.34–2.93) backgrounds had higher odds of LBW than their
counterparts from a white background. Australian-born women from ‘other’ ethnic backgrounds,
when compared to white Australian-born women, had 33% higher odds of PTB (OR 1.33, 95% CI
1.18–1.51), which attenuated after adjusting for covariates (aOR 1.22, 95% CI 1.08–1.39) (Table
7.3).
Among Australian-born women, non-white women had 34% higher risk (RRR 1.34, 95% CI1.15–
1.56) of medically indicated PTB. This effect was limited to Australian-born women from ‘other’
ethnic backgrounds (RRR 1.57, 95% CI 1.32–1.88) and remained the same after adjusting for
covariates (Table 7.4).
Among migrant women, the higher risk of PTB in Asian women was confined to idiopathic PTB
(aRRR 1.39, 95% CI 1.26–1.59), whereas in Indian migrant women, higher risks of PTB were seen
for idiopathic PTB, PPROM and medically indicated PTB (Table 7.4). Migrant women from African
and white backgrounds had a lower risk of idiopathic PTB than the white Australian-born
population; only in the African group, the observed association remained the same after
adjustment (aRRR 0.79, 95% CI 0.62–1.00, Table 7.4). Similarly, migrant women of Māori and
white backgrounds had a lower risk of medically indicated PTB than white Australian-born women
(aRRR 0.74, 95% CI 0.56–0.98; aRRR 0.93, 95% CI 0.87–1.00, respectively). The lower risk of
PPROM in migrant women of African and white backgrounds did not remain the same after
adjusting for covariates (Table 7.4).
In stratified analyses, migrant women from non-white backgrounds had lower odds of PTB (OR
0.87, 95% CI 0.78–0.97, P=0.011) than their non-white Australian-born counterparts; this finding
did not hold after adjusting for confounders (Table 7.5). The differential lower odds of PTB was
restricted to migrant women of ‘other’ ethnic background (OR 0.78, 95% CI 0.67–0.91, P=0.001)
and was due to lower risk of medically indicated PTB (aRRR 0.74, 95% CI 0.59–0.93).

CHAPTER 7. PRETERM BIRTH AND LOW BIRTHWEIGHT IN RELATION TO MIGRATION AND ETHNICITY IN WA
PAGE | 143
TABLE 7.3 ODDS OF PTB AND TERM-LBW IN AUSTRALIAN-BORN AND MIGRANT WOMEN FROM NON-WHITE BACKGROUNDS COMPARED TO WHITE AUSTRALIAN-BORN WOMEN
(2005–2013)
Ethnicity and migrant status
N (%) Term-LBW PTB
OR (95% CI) P aOR (95% CI)** P OR (95% CI) P aOR(95% CI)** P
White Australian-born (Reference)
161 387 (64.0%)
1.00 – 1.00 – 1.00 – 1.00 –
All non-white Australian-born
5388 (2.1%) 1.76 (1.45–2.14) 0.000 1.71 (1.43–2.12) 0.000 1.21 (1.09–1.34) 0.000 1.15 (1.04–1.28) 0.011
Asian 1279 (0.5%) 1.74 (1.18–2.57) 0.006 1.98 (1.36–2.99) 0.000 1.08 (0.87–1.34) 0.503 1.13 (0.89–1.40) 0.316
Indian 296 (0.1%) 2.31 (1.14–4.68) 0.020 2.69 (1.32–2.45) 0.006 0.97 (0.60–1.56) 0.895 1.01 (0.63–1.66) 0.959
African 55 (0.0%) – – – – 0.28 (0.04–2.00) 0.204 0.28 (0.04–2.00) 0.199
Māori 239 (0.1%) 0.69 (0.17–2.76) 0.594 0.48 (0.12–1.97) 0.312 0.59 (0.30–1.14) 0.115 0.56 (0.28–1.06) 0.066
Other 3519 (1.4%) 1.83 (1.45–2.31) 0.000 1.70 (1.34–2.15) 0.000 1.33 (1.18–1.51) 0.000 1.22 (1.07–1.37) 0.001
All migrant 85 481 (33.9%) 1.35 (1.27–1.45) 0.000 1.56 (1.45–1.68) 0.000 0.98 (0.95–1.01) 0.123 1.01 (0.99–1.06) 0.873
White 46 878 (18.6%) 1.02 (0.92–1.12) 0.736 1.12 (1.01–1.23) 0.025 0.91 (0.87–0.95) 0.000 0.93 (0.90–0.99) 0.002
Asian 17 734 (7.0%) 1.70 (1.51–1.90) 0.000 2.16 (1.91–2.43) 0.000 1.06 (1.00–1.13) 0.055 1.16 (1.09–1.24) 0.000
Indian 5352 (2.1%) 3.17 (2.73–3.69) 0.000 4.10 (3.51–4.80) 0.000 1.17 (1.05–1.30) 0.004 1.24 (1.08–1.34) 0.000
African 3985 (1.6%) 1.74 (1.39–2.18) 0.000 2.34 (1.87–2.94) 0.000 0.90 (0.79–1.03) 0.141 0.92 (0.82–1.08) 0.293
Māori 2867 (1.1%) 1.59 (1.21–2.09) 0.001 1.15 (0.86–1.50) 0.356 0.94 (0.80–1.10) 0.414 0.85 (0.71–1.00) 0.044
Other 8665 (3.4%) 1.49 (1.26–1.76) 0.000 1.80 (1.53–2.15) 0.000 1.04 (0.95–1.14) 0.367 1.06 (0.96–1.15) 0.200
**Adjusted for the year of birth, maternal age group, marital status, parity, socioeconomic disadvantage, smoking, any medical condition, infertility treatment, and sex of the baby

CHAPTER 7. PRETERM BIRTH AND LOW BIRTHWEIGHT IN RELATION TO MIGRATION AND ETHNICITY IN WA
PAGE | 144
TABLE 7.4 RISK OF SPONTANEOUS AND MEDICALLY INDICATED PTB IN MIGRANTS FROM DIVERSE ETHNIC BACKGROUNDS COMPARED TO THE WHITE AUSTRALIAN-BORN
POPULATION (2005–2013)
Population N (%) Spontaneous PTB Medically indicated
Idiopathic PPROM
RRR (95% CI)
P aRRR (95% CI)*
P RRR (95% CI)
P aRRR (95% CI)*
P RRR (95% CI)
P aRRR (95% CI)*
P
White Australian-born (Reference)
161,387 (64.0)
1.00 1.00 1.00 1.00 1.00 1.00
Non-white Australian-born
5388 (2.1)
1.17 (0.95–1.29)
0.774 1.11 (0.94–1.31)
0.211 1.03 (0.86–1.30)
0.066 1.00 (0.80–1.27)
0.974 1.34 (1.15–1.56)
0.000 1.27 (1.09–1.48)
0.002
Asian 1279 (0.5)
1.30 (0.99–1.38)
0.103 1.36 (0.98–1.86)
0.063 0.79 (0.46–1.33)
0.371 0.83 (0.47–1.37)
0.490 1.02 (0.85–1.05)
0.891 1.07 (0.78–1.52)
0.712
Indian 296 (0.1)
0.84 (0.37–1.88)
0.667 0.89 (0.40–2.03)
0.801 0.96 (0.36–2.59)
0.941 1.01 (0.38–2.71)
0.986 1.10 (0.54–2.22)
0.791 1.12 (0.55–2.26)
0.757
African 55 (0.0)
– – – 1.24 (0.18–8.97)
0.831 1.16 (0.16–8.57)
0.869 – – – –
Māori 239 (0.1)
0.68 (0.25–1.82)
0.436 0.53 (0.20–1.43)
0.210 0.87 (0.28–2.73)
0.816 0.80 (0.26–2.51)
0.702 0.33 (0.08–1.34)
0.121 0.36 (0.09–1.44)
0.149
Other 3519 (1.4)
1.20 (0.98–1.47)
0.074 1.11 (0.91–1.36)
0.297 1.14 (0.87–1.49)
0.341 1.07 (0.82–1.41)
0.611 1.57 (1.32–1.88)
0.000 1.42 (1.19–1.69)
0.000
Migrant 85 481 (33.9)
0.96 (0.91–1.01)
0.240 1.04 (0.98–1.10)
0.107 0.94 (0.88–1.02)
0.094 0.98 (0.91–1.05)
0.748 0.99 (0.93–1.09)
0.924 0.98 (0.93–1.04)
0.370
White 46 878 (18.6)
0.87 (0.80–0.93)
0.000 0.93 (0.87–1.00)
0.053 0.90 (0.83–0.99)
0.028 0.94 (0.89–1.08)
0.151 0.97 (0.90–1.03)
0.327 0.93 (0.87–1.00)
0.049
Asian 17 734 (7.0)
1.20 (1.09–1.31)
0.000 1.39 (1.26–1.59)
0.000 1.03 (0.90–1.17)
0.686 1.14 (1.00–1.30)
0.051 0.95 (0.85–1.05)
0.292 0.97 (0.88–1.08)
0.673
Indian 5352 (2.1)
1.10 (0.92–1.30)
0.300 1.26 (1.06–1.50)
0.008 1.19 (0.95–1.46)
0.118 1.28 (1.03–1.60)
0.020 1.22 (1.04–1.44)
0.014 1.21 (1.03–1.42)
0.018
African 3985 0.75 0.018 0.79 0.052 0.70 0.025 0.78 0.149 1.17 0.103 1.10 0.205

CHAPTER 7. PRETERM BIRTH AND LOW BIRTHWEIGHT IN RELATION TO MIGRATION AND ETHNICITY IN WA
PAGE | 145
(1.6) (0.59–0.95) (0.62–1.00) (0.51–0.96) (0.57–1.07) (0.97–1.41) (0.96–1.40)
Māori 2867 (1.1)
1.22 (0.98–1.52)
0.071 1.01 (0.82–1.27)
0.872 0.77 (0.54–1.10)
0.150 0.72 (0.50–1.01)
0.069 0.75 (0.56–0.97)
0.040 0.74 (0.56–0.98)
0.033
Other 8665 (3.4)
0.98 (0.85–1.13)
0.806 1.05 (0.91–1.21)
0.516 0.98 (0.82–1.18)
0.862 1.06 (0.88–1.25)
0.532 1.13 (0.99–1.29)
0.066 1.10 (0.96–1.25)
0.205
*Adjusted for: year of birth, maternal age, marital status, parity, socioeconomic disadvantage, infertility treatment, smoking, any medical condition, sex of the baby.

CHAPTER 7. PRETERM BIRTH AND LOW BIRTHWEIGHT IN RELATION TO MIGRATION AND ETHNICITY IN WA
PAGE | 146
TABLE 7.5 RISKS OF TERM-LBW AND PTB FOR MIGRANTS COMPARED WITH AUSTRALIAN-BORN POPULATION FROM THE SAME ETHNIC GROUP
Ethnicity Term-LBW PTB
OR (95% CI) P aOR (95% CI)* P OR (95% CI) P aOR (95% CI)* P
Australian-born ethnicity** (Reference)
1.00 1.00 1.00 1.00
All non-white migrants 1.05 (0.86–1.27) 0.642 1.11 (0.90–1.36) 0.283 0.87 (0.78–0.97) 0.011 0.92 (0.83–1.03) 0.178
Asian 0.97 (0.65–1.46) 0.902 1.04 (0.68–1.56) 0.852 0.99 (0.79–1.24) 0.904 1.07 (0.85–1.35) 0.579
Indian 1.37 (0.67–2.81) 0.387 1.30 (0.62–2.71) 0.451 1.20 (0.74–1.96) 0.456 1.21 (0.73–2.00) 0.468
African 0 – 0 – 3.26 (0.45–23.68) 0.242 3.55 (0.46–24.90) 0.216
Māori 2.33 (0.56–9.61) 0.243 2.26 (0.54–2.53) 0.265 1.60 (0.81–3.17) 0.178 1.37 (0.68–2.74) 0.364
Other 0.82 (0.62–1.08) 0.155 1.10 (0.75–1.37) 0.963 0.78 (0.67–0.91) 0.001 0.86 (0.74–1.02) 0.071
*Adjusted for the year of birth, maternal age group, marital status, parity, SES, smoking, any medical condition, sex of the baby **Migrant population from each ethnic group was compared to the Australian-born population from the same ethnic group

CHAPTER 7. PRETERM BIRTH AND LOW BIRTHWEIGHT IN RELATION TO MIGRATION AND ETHNICITY IN WA
PAGE | 147
SENSITIVITY ANALYSIS 7.4.1
For Chinese-born women (N=2487), unadjusted odds of PTB were lower than the Australian-born
population (OR 0.78; 95% CI 0.65-0.94; P=0.009), however, adjusting for covariates attenuated the
OR to 0.87 (95% CI 0.73-1.05; P=0.133). In multinomial regression analysis, only the risk of
medically-indicated PTB was lower among Chinese-born women (aRRR 0.61; 95% CI 0.44-0.85;
P=0.003) compared to white Australian-born women.
Adding private health insurance to the adjusted analysis made the association of medically indicated
PTB with Australian-born from ‘other’ and migrant-born from Indian ethnic backgrounds stronger.
However, adding gestational diabetes and preeclampsia to the multivariable regression analyses, did
not result in any appreciable difference.
DISCUSSION 7.5
To our knowledge, this is the first study reporting the effect of ethnicity and migration status on
the risk of term-LBW, spontaneous and medically indicated PTB in Australia to explore differences
between non-white migrants from diverse ethnic backgrounds to their corresponding Australian-
born counterparts.
In this population-based linked data study, we showed that migrants from diverse ethnic
backgrounds had higher odds of term-LBW than the Australian-born white population. We also
reported that Australian-born women from Asian, Indian and ‘other’ backgrounds were at higher
risk of term-LBW than their white Australian-born counterparts. Further, migrant women from
Asian and Indian backgrounds had higher odds of PTB and migrant women with white ethnicity
had lower odds of PTB than Australian-born white women. Migrant women from African
backgrounds were at lower risk of idiopathic PTB, and those from Māori and Chinese-born
backgrounds were at lower risk of medically indicated PTB than their white Australian-born
counterparts. Among non-white Australian-born women, those from ‘other’ backgrounds had
higher odds of medically indicated PTB than white Australian-born women.
LOW BIRTHWEIGHT 7.5.1
Consistent with national reports,28 the cumulative incidence of LBW was 4.3% in our study
population comprising of all singleton non-Indigenous live births. Both ethnicity and migration
influenced the risk of term-LBW in our study. The risk was higher in migrants and the non-white

CHAPTER 7. PRETERM BIRTH AND LOW BIRTHWEIGHT IN RELATION TO MIGRATION AND ETHNICITY IN WA
PAGE | 148
Australian-born population from Asian, Indian and ‘other’ ethnic descent than their white
Australian-born counterparts.
Racial and ethnic disparities in the rate of LBW have been well documented in the US,295-297 where
the odds of LBW for US- and foreign-born blacks were 2.5-times that of US-born whites.295 African
American women had a greater prevalence of LBW, even at the highest educational levels,
indicating disparities influenced by ethnicity and race.297 For migrant women, however, research
findings have been conflicting. Juarez and Revuelta-Eugercios found a 13–35% lower risk of
delivering LBW for most migrant groups compared to the non-migrant population in Spain.298
Similar to our study, they also investigated term-LBW separately but reported higher odds of term-
LBW only for women from Sub-Saharan Africa. Martinson, Tienda, and Teitler found that migrants
from LMICs in Australia, and those from Asian countries in the United Kingdom (UK) and the US
had higher odds of LBW than those born in the destination countries.13 Further, the second
generation of migrants, especially those of South Asian descent, had notably higher odds of LBW
in the UK and the US than their first-generation counterparts.299
Taken together, this evidence suggests that the rate of LBW among immigrants and ethnic
minorities is country-specific. The rate may be influenced by country of origin, socioeconomic
status and access to health services in destination countries, or immigration-related policies,
processes or circumstances in both countries of origin and destination.199,299,300 Our results suggest
that migrant status and ethnicity may be independent predictors of LBW or proxies for other
influential factors, such as diet or sociocultural experiences, not recorded in the dataset. These
findings may also show the intergenerational effect of disadvantage experienced by the first
generation of migrants300 and emphasise the need for investigation, intervention and prevention
to ameliorate short- and long-term impacts of LBW on individuals, populations and the health
system.
PRETERM BIRTH 7.5.2
Incidence of PTB in migrant women was slightly lower than the Australian-born white population
in our study; however, stratified analysis by ethnic background revealed a higher risk of PTB for
Asian and Indian migrants and lower rates for migrants from white, Māori and Chinese
backgrounds than the Australian-born group. Our findings were consistent with previous studies
that reported lower rates of PTB for women from migrant backgrounds than the non-migrant
population in Australia, Canada and the US.13,163,301 Almeida et al. reported a lower risk of PTB for
CHAPTER 7. PRETERM BIRTH AND LOW BIRTHWEIGHT IN RELATION TO MIGRATION AND ETHNICITY IN WA
PAGE | 149
migrants from white backgrounds than the non-migrants in the US.295 Women born in China and
Somalia had lower rates of PTB than Australian-born women.13,163 Chinese-born women also
showed lower rates of PTB than their US-born counterparts.198 On the other hand, Gagnon et al.
reported that Asian and Sub-Saharan African migrants were at greater risk of PTB in a systematic
review.11 Furthermore, we studied the influence of ethnicity on the risk of PTB among the
Australian-born population and showed a higher risk for non-white Australian-born women from
the ‘other’ ethnic background. These data highlight the heterogeneity of the population and the
importance of considering both country of birth and ethnicity in the analysis to identify at-risk
groups.
We note that in some of our results, the adjusted effect estimates are larger, and the relationship
stronger than the crude ratios. This may be explained by the ‘healthy migrant effect’,302 given that
migrants in our population had collectively lower prevalence of risk factors, such as smoking and
socioeconomic disadvantage, than the Australian-born group.303 Where a study group had a higher
prevalence of those risk factors, such as the case with Māori women, adjusting resulted in smaller
effect measures.
STRENGTHS AND LIMITATIONS 7.5.3
Our study was a population-based cohort with a substantial proportion of migrants (33.9%), which
allowed stratification by both country of birth and ethnicity. We differentiated the type of PTB by
spontaneous and medically indicated birth and identified population groups affected by each type
of PTB. Moreover, we reported term-LBW, which is an outcome comparable globally. The design
and linked health data methodology reduced the risk of selection, participation and recall biases.
Cross-source ascertainment optimised the reliability of data and accuracy of findings.
Our findings are generalisable to other countries hosting migrants from similar ethnic
backgrounds; however, interpretation should be made with caution due to differences in health
services, the proportion of countries of origin and immigration policies as well as some limitations.
We used administrative health data that were not primarily collected to answer the research
questions of our study; although cross-source ascertainment reduced such risk, a small risk of
misclassification bias towards the null hypothesis may exist. We also had small population sizes for
some ethnic groups of the Australian-born women that may have reduced the statistical power
and the ability to detect any appreciable difference in the odds for sub-types of PTB in the
Australian-born ethnic groups.

CHAPTER 7. PRETERM BIRTH AND LOW BIRTHWEIGHT IN RELATION TO MIGRATION AND ETHNICITY IN WA
PAGE | 150
In conclusion, there is evidence of lower risk of PTB in migrant women of some ethnicities; in
others, migrant women had increased rates of PTB. Ethnicity impacts the rates of term-LBW with
migrant status, further increasing the risk in women of some ethnic backgrounds. Our findings
warrant further investigation of risk as well as protective factors in specified population groups to
develop appropriate policies and preventive strategies to reduce these adverse pregnancy
outcomes. Investigating the role of acculturation, for example, through age arrived in Australia
and/or length of residence may provide a clearer picture of the pathways influencing these
outcomes.304
CHAPTER 8. ACCULTURATION, PRETERM BIRTH AND LOW BIRTHWEIGHT IN WA
PAGE | 151
CHAPTER 8. ACCULTURATION, PRETERM BIRTH AND LOW BIRTHWEIGHT IN
WESTERN AUSTRALIA
This chapter comprises a paper submitted to PLoS One (September 2020) for publication. This
chapter builds on the findings of the studies presented in previous chapters and explores the risk
of preterm birth and low birthweight in relation to the emerging sociocultural factors specific to
migrant populations, including but not limited to communication barriers, length of residence and
potential opportunity for integration through marriage/partnership or young age on arrival. This
investigation is related to the fifth objective of this thesis, to investigate the influence of
acculturation on disparities observed in the risk of preterm birth and low birthweight between
migrant and Australian-born populations from diverse ethnic backgrounds in WA.

CHAPTER 8. ACCULTURATION, PRETERM BIRTH AND LOW BIRTHWEIGHT IN WA
PAGE | 152
ABSTRACT 8.1
Background: The risk of preterm birth (PTB) and low birthweight (LBW) may change over time
after immigrants have settled in high-income countries. We studied the influence of acculturation
through age on arrival, length of residence, interpreter use and having an Australian-born partner
on the risk of these outcomes in Australia.
Methods: A retrospective cohort study was undertaken using linked health data for all non-
Indigenous births from 2005–2013 in Western Australia. Adjusted odds ratios (aOR) for PTB and
term-LBW in migrants from six ethnicities of white, Asian, Indian, African, Māori and ‘other’ with
different levels of acculturation, compared with Australian-born population, were calculated using
multivariable logistic regression analysis.
Results: Migrant women had 49% higher odds of term-LBW (aOR 1.49, 95% CI 1.39–1.60) than
Australian-born women. The least acculturated non-white non-Māori women had twice the risk of
term-LBW, and the most acculturated had the same risk as Australian-born women. The odds of
PTB was 42% lower (aOR 0.58, 95% CI 0.46–0.73) in the least acculturated and 40% higher (aOR
1.40, 95% CI 1.18–1.66) in the most acculturated women than their Australian-born counterparts.
Conclusion: Acculturation emerged as an important factor when considering appropriate care for
the prevention of PTB and LBW in migrants. Overall, acculturation may improve the risk of term-
LBW and worsen the risk of PTB in migrant women residing in Western Australia; however, the
effect can vary in different ethnic groups and warrants further investigation to understand the
processes involved.

CHAPTER 8. ACCULTURATION, PRETERM BIRTH AND LOW BIRTHWEIGHT IN WA
PAGE | 153
INTRODUCTION 8.2
Preterm birth (PTB), birth before 37 completed weeks of pregnancy,230 and low birthweight (LBW),
birthweight less than 2500 grams regardless of the gestational age of the newborn28, are more
common among some migrant groups than the non-migrant population in high-income countries
(HICs), such as Australia, the United Kingdom (UK) and the United States (US).11,199 These adverse
pregnancy outcomes are associated with considerable financial costs imposed on families and
healthcare systems96,290 and result in higher rates of mortality and morbidity in childhood and
throughout life.289
Culture can affect the quality of diet,305 smoking in pregnancy,195,196 and physical activity277 that
are associated with birthweight and other adverse pregnancy outcomes,306-308 while one’s culture,
and these factors as a result, can be influenced by the environment and change due to encounters
with other cultures after immigration; this is known as ‘acculturation’.129 Mounting evidence from
the US and Europe suggests that acculturation may influence the risk of adverse pregnancy
outcomes.190,191,196,309-312 We previously investigated the influence of acculturation on the risk of
stillbirth;304 however, the effect of acculturation on the risk of LBW and PTB in migrant
populations is not well understood in Australia.
We studied the influence of age on arrival, length of residence, using an interpreter and having an
Australian-born partner, as the proxies to integration and acculturation, on disparities observed in
the risk of PTB and term-LBW between Australian- and overseas-born populations from diverse
ethnic backgrounds.

CHAPTER 8. ACCULTURATION, PRETERM BIRTH AND LOW BIRTHWEIGHT IN WA
PAGE | 154
METHODS 8.3
STUDY POPULATION AND DATA SOURCES 8.3.1
Routinely collected administrative health and Registry data from the Department of Health WA
linked through the WA Data Linkage System (WADLS) was used to undertake a retrospective
cohort study. Non-identifiable data for the entire non-Indigenous population of singleton live
births in WA from 1 January 2005 to 31 December 2013 were used.
The WADLS links data from a variety of health and other administrative datasets using best-
practice probabilistic matching based on full name and address, phonetic compression algorithms
and other identifiers.204,211,213 Further, it has designed and uses numerous automated and manual
sub-processes specifically to reduce the likelihood of linkage error—the details of which are
reported in linkage quality statements published elsewhere.212,215
Primarily, data were sourced from the Midwives Notification System (MNS). The MNS is a
statutory database, including maternal, pregnancy, birth and newborn information collected by
attending midwives for all births of at least 20 weeks gestation or at least 400 grams in weight (if
gestational age was unknown). We supplemented the data from the MNS with additional variables
linked from the WA Birth Register, including maternal, paternal and infant demographic
characteristics for all registered births in WA, and also from the Hospital Morbidity Data Collection
(HMDC) which contains information related to inpatient separations from all WA private and
public hospitals.245 We used the Family Connections Linkage Facility223 of the WADLS to link
migrant women with their child outcomes.
VARIABLES 8.3.2
PTB was defined as birth before 37 completed weeks of gestation,230 and LBW as birthweight less
than 2500 grams at the time of birth.28

CHAPTER 8. ACCULTURATION, PRETERM BIRTH AND LOW BIRTHWEIGHT IN WA
PAGE | 155
Birth status (live birth, stillbirth), plurality (number of babies in this birth), infant weight (grams)
and estimated gestational age at time of birth (completed weeks), all extracted from MNS data,
were used to identify live singleton births and LBW and PTB outcomes.
Migrant status (Australian- or overseas-born), using mother’s place/country of birth (99.0% from
Birth Registrations and 1.0% from HMDC), and ethnic origin (100% from MNS) were used to group
the study population into Australian-born and migrant from white, Asian, Indian, African, Māori or
other ethnic backgrounds.241
Year of birth, maternal age (<20, 20–24, 25–29, 30–34, 35–39, 40–44, >44), marital status (never
married, divorced/separated, married/de facto, other), smoking in pregnancy (yes/no), history of
pre-existing medical conditions (yes/no), gestational diabetes, preeclampsia, fertility treatment
(yes/no), sex of baby and socioeconomic disadvantage (using IRSD quintiles) were extracted from
the MNS. Length of residence and age on arrival were calculated using mother’s year of arrival in
Australia (with 4.5% missing values) and baby’s year of birth, and status of having an Australian-
born partner (yes/no) from father’s place of birth from Birth Registration data (with 3.3% missing
values). Interpreter utilisation (yes/no) and private health insurance (yes/no) were retrieved from
HMDC records that were available for 99.0% of the whole population of births in WA.
Acculturation level was first examined by creating a new variable that had the following five
values: 0=Australian-born women, 1=migrant women with overseas-born partner and interpreter,
2=migrant women with overseas-born partner but no interpreter, 3=migrant women with
Australian-born partner and 4=others. The ‘least acculturated’ migrant women were defined as
non-white non-Māori women with a length of residence of <5 years who had an overseas-born
partner, immigrated as an adult and used an interpreter when navigating the healthcare system.
The non-white non-Māori women who lived in Australia >10 years, immigrated as a child, had an
Australian-born partner and did not have an interpreter in hospital were considered ‘the most
CHAPTER 8. ACCULTURATION, PRETERM BIRTH AND LOW BIRTHWEIGHT IN WA
PAGE | 156
acculturated’ migrant women. This was examined in a separate analysis by creating a new
variable, acculturated, with the following values: 0=Australian-born, 1=the least acculturated,
2=the most acculturated and 3=other migrants.
STATISTICAL METHODS 8.3.3
The demographic and obstetric characteristics of the study populations were summarised and
reported by percentage. Logistic regression was used to calculate the odds ratios (OR) and 95%
confidence intervals (CI) for associations with term-LBW and PTB. Analyses were adjusted for year
of birth, maternal age group (<20, 20–24, 25–29, 30–34, 35–39, 40–44, >44), marital status (never
married, divorced/separated, married/de facto, other), parity (nulliparous, primiparous,
multiparous), socioeconomic disadvantage (using IRSD quintiles), infertility treatment (yes/no),
pre-existing medical condition (yes/no), private health insurance (yes/no), sex of the baby, and
smoking in pregnancy (yes/no).293,294 P<0.05 was considered significant and variables with P>0.1
were removed from the final adjusted model. When specific ethnic groups were investigated, due
to the small numbers, the analyses were only adjusted for age and smoking.
RESULTS 8.4
DESCRIPTIVE ANALYSIS 8.4.1
From the 252 256 live singleton births studied, 33.9% belonged to migrant mothers and 66.1% to
women born in Australia (Table 8.1). Migrant women were slightly older than the Australian-born
group (mean age in years: 30.9 vs 29.5) and had a higher proportion of married women than the
Australian-born population (91.7% vs 88.0%). Migrant women were less likely to smoke in
pregnancy (7.1% vs 14.0%), fall in the most socioeconomically disadvantaged category (13.6% vs
23.5%) or have pre-existing medical conditions (31.2% vs 35.0%), but were more likely to
experience gestational diabetes (8.1% vs 4.4%) than their Australian-born counterparts. Among
the migrant women, 30% had an Australian-born partner, 55.0% arrived in Australia as an adult,
CHAPTER 8. ACCULTURATION, PRETERM BIRTH AND LOW BIRTHWEIGHT IN WA
PAGE | 157
and 40.3% gave birth in their first five years of residence, including 12.1% who gave birth in the
first two years after immigrating to Australia.
ACCULTURATIVE FACTORS 8.4.2
Less than five years length of residence in Australia, immigrating as an adult and having an
Australian-born partner were slightly associated with lower odds of PTB and using the interpreter
service was strongly associated with lower odds of this outcome. However, the only factor that
remained significant after adjusting for covariates was using the interpreter service (aOR 0.65,
95% CI 0.55–0.77). Using an interpreter had the most protective effect among women from
African background (OR 0.31, 95% CI 0.18–0.54).
Migrant women had 49% higher odds of term-LBW (aOR 1.49, 95% CI 1.39–1.60) than Australian-
born women. The odds of term-LBW in migrant women with an Australian-born partner was
similar to that of the Australian-born women and the odds of term-LBW reduced in migrants with
longer length of residence (Table 8.2).
While the rate of term-LBW decreased with longer length of residence in women from African and
other ethnic backgrounds, it followed a U-shape pattern in births to Asian and Indian women and
increased among Māori women residing in Australia for more than five years (Figure 8.1).
Compared to Australian-born women, migrant women from Indian (OR 3.13, 95% CI 2.61–3.76),
African (OR 2.07, 95% CI 1.55–2.76), Asian (OR 1.74, 95% CI 1.46–2.08) and ‘other’ (OR 1.49, 95%
CI 1.17–1.91) backgrounds had significantly higher odds of term-LBW in the first five years of
residence. Among those with 5–10 years residence, women from Indian and Māori backgrounds
had higher odds of term-LBW (OR 2.64; 95% CI1.85–3.76, OR 1.78; 95% CI 1.03–3.09 respectively)
than Australian-born women. For those with >10 years residence, women from Indian (OR 3.57;
95% CI 1.85–3.76), Māori (OR 1.79; 95% CI 1.15–2.80) and Asian (OR 1.70; 95% CI 1.42–2.04)
backgrounds had higher odds of term-LBW outcome than their Australian-born counterparts.

CHAPTER 8. ACCULTURATION, PRETERM BIRTH AND LOW BIRTHWEIGHT IN WA
PAGE | 158
Adjusting for age and smoking significantly attenuated the odds of term-LBW solely in women
from Māori background (aOR 1.20, 95% CI 0.76–1.87) but not in other groups.

CHAPTER 8. ACCULTURATION, PRETERM BIRTH AND LOW BIRTHWEIGHT IN WA
PAGE | 159
TABLE 8.1 CHARACTERISTICS OF THE STUDY POPULATION
Characteristics
Australian-born women
Migrant women
All women
All White Asian Indian African Māori Other All
Live & singleton births 166 775 (66.1%)
46 878 (18.6%)
17 734 (7.0%)
5352 (2.1%)
3985 (1.6%)
2867 (1.1%)
8665 (3.4%)
85 481 (33.9%)
252 256 (100%)
PTB 10 517 (6.3%)
2699 (5.8%)
1177 (6.6%)
387 (7.2%)
227 (5.7%)
169 (5.9%)
564 (6.5%)
5223 (6.1%)
15 741 (6.2%)
LBW 6539
(4.1%) 1830
(3.9%) 962
(5.4%) 429
(8.0%) 221
(5.6%) 136
(4.7%) 477
(5.5%) 4055
(4.7%) 10 923 (4.3%)
Marital status
Never married 17 381 (10.4%)
2933 (6.2%)
689 (3.9%)
99 (1.8%)
515 (13.1%)
554 (19.4%)
586 (6.8%)
5376 (6.3%)
22 759 (9.0%)
Divorced/separated 1492
(0.9%) 347
(0.7%) 154
(0.9%) 17
(0.3%) 102
(2.6%) 31
(1.1%) 122
(1.5%) 773
(0.9%) 2266
(0.9%)
Married/de facto 146 765 (88.0%)
43 144 (92.1%)
16 647 (93.4%)
5176 (96.7%)
3317 (83.2%)
2214 (77.2%)
7876 (90.1%)
78 374 (91.7%)
22 5164 (89.3%)
Other 1137
(0.7%) 454
(1.0%) 244
(1.4%) 60
(1.1%) 51
(1.3%) 68
(2.4%) 81
(0.9%) 958
(1.1%) 2095
(0.8%)
Parity
Nulliparous 70 996 (42.6%)
20 466 (43.7%)
8519 (48.0%)
3114 (58.2%)
1175 (29.5%)
932 (32.5%)
3360 (38.8%)
37 566 (44.0%)
108 571 (43.0%)
Primiparous 58 475 (35.1%)
16 658 (35.5%)
6326 (35.7%)
1768 (33.0%)
1069 (26.8%)
770 (26.9%)
2619 (29.8%)
29 210 (34.2%)
87 691 (34.8%)
Multiparous 37 304 (22.4%)
9754 (20.8%)
2889 (16.3%)
470 (8.8%)
1741 (43.7%)
1165 (40.6%)
2686 (31.0%)
18 705 (21.9%)
56 015 (22.2%)
Maternal age

CHAPTER 8. ACCULTURATION, PRETERM BIRTH AND LOW BIRTHWEIGHT IN WA
PAGE | 160
Mean (SD) 29.5 (5.6)
31.5 (5.3)
31.2 (4.9)
29.5 (4.4)
28.8 (5.7)
26.8 (6.0)
29.9 (5.6)
30.9 (5.4)
30.0 (5.6)
<20 7312
(4.4%) 703
(1.5%) 131
(0.7%) 17
(0.3%) 188
(4.7%) 297
(10.4%) 193
(2.2%) 1529
(1.8%) 8842
(3.5%)
20–24 26 849 (16.1%)
4254 (9.1%)
1383 (7.8%)
629 (11.8%)
793 (20.0%)
862 (30.1%)
1439 (16.6%)
9365 (11.0%)
36 216 (14.4%)
25–29 47 602 (28.5%)
11 150 (23.8%)
5099 (28.8%)
2228 (41.6%)
1209 (30.3%)
766 (26.7%)
2546 (29.4%)
22 998 (26.9%)
70 607 (28.0%)
30–34 52 740 (31.6%)
16 874 (36.0%)
6751 (38.1%)
1816 (33.4%)
1116 (28.0%)
591 (20.6%)
2590 (29.9%)
29 738 (34.8%)
82 492 (32.7%)
35–39 27 172 (16.3%)
11 184 (23.9%)
3587 (20.2%)
557 (10.4%)
556 (14.0%)
277 (9.6%)
1522 (17.6%)
17 683 (20.7%)
44 859 (17.8%)
40–44 4929
(2.3%) 2590
(5.5%) 754
(4.3%) 101
(1.9%) 107
(2.7%) 74
(2.6%) 360
(4.2%) 3986
(4.7%) 8915
(3.5%)
>44 171
(0.1%) 123
(0.3%) 29
(0.2%) <10
(0.1%) 11
(0.3%) 0
(0.0%) 15
(0.2%) 182
(0.2%) 353
(0.1%)
Australian-born Partner 115 463 (71.8%)
19 130 (41.7%)
3454 (19.7%)
257 (4.8%)
168 (4.4%)
627 (23.5%)
1482 (17.6%)
25 118 (30.0%)
140 581 (57.5%)
Age on arrival
<18 years old NA 22 516
(48.0) 6021
(34.0%) 675
(12.6%) 1087
(27.3%) 1499
(52.3%) 2850
(32.9%) 34 648 (40.5%)
NA
18 or older NA 22 744
(48.5%) 10 793 (60.9%)
4420 (82.6%)
2569 (64.5%)
1226 (42.8%)
5277 (60.9)
47 029 (55.0%)
NA
Length of residence
<2years NA 3961
(8.5%) 2316
(13.1%) 1282
(24.0%) 712
(17.9%) 519
(18.1%) 1543
(17.8%) 10 333 (12.1%)
NA
2–5 years NA 11 162
(23.8%) 5302
(29.9%) 2570
(48.0%) 1556
(39.1%) 839
(29.3%) 2710
(31.3%) 24 139 (28.2%)
NA
>5 years NA 30 123 9192 1243 1383 1367 3872 47 180 NA

CHAPTER 8. ACCULTURATION, PRETERM BIRTH AND LOW BIRTHWEIGHT IN WA
PAGE | 161
(64.3%) (51.8%) (23.2%) (34.7%) (47.7%) (44.7%) (55.2%)
Unknown NA 1632
(3.5%) 924
(5.2%) 257
(4.8%) 334
(8.4%) 142
(5.0%) 540
(6.2%) 3829
(4.5%) NA
Any medical condition 58 385 (35.0%)
14 255 (30.4%)
4744 (26.8%)
2038 (38.1%)
1489 (37.4%)
974 (34.0%)
3163 (36.5%)
26 663 (31.2%)
85 054 (33.7%)
Infertility treatment 5108
(3.1%) 1608
(3.4%) 395
(2.2%) 120
(2.2%) 33
(0.8%) 15
(0.5%) 153
(1.8%) 2324
(2.7%) 7432
(3.0%)
Smoked 23 310 (14.0%)
4010 (8.6%)
313 (1.8%)
40 (0.8%)
70 (1.8%)
1125 (39.2%)
465 (5.4%)
6023 (7.1%)
29 336 (11.6%)
Most disadvantaged* 39 242 (23·5%)
6326 (13·5%)
2140 (12·1%)
642 (12·0%)
491 (12·3%)
777 (27·1%)
1237 (14·3%)
11 613 (13.6%)
50 858 (20·2%)
Gestational diabetes 7316
(4.4%) 2612
(5.6%) 2243
(12.7%) 834
(15.6%) 297
(7.5%) 115
(4.0%) 822
(9.5%) 6931
(8.1%) 14 239 (5.6%)
Preeclampsia 4650
(2.8%) 1053
(2.3%) 298
(1.7%) 119
(2.2%) 116
(2.9%) 73
(2.6%) 198
(2.3%) 1857
(2.2%) 6507
(2.6%)
Sex of baby
Male 85 285 (51.1%)
23 882 (51.0%)
9207 (51.9%)
2729 (51.0%)
2055 (51.6%)
1450 (50.6%)
4435 (51.2%)
43 758 (51.2%)
129 057 (51.2%)
*The bottom 20% of IRSD

CHAPTER 8. ACCULTURATION, PRETERM BIRTH AND LOW BIRTHWEIGHT IN WA
PAGE | 162
TABLE 8.2 COMPARISON OF TERM-LBW AND PTB IN MIGRANTS, STRATIFIED BY ACCULTURATIVE FACTORS, WITH AUSTRALIAN-BORN WOMEN
Acculturative factor N (%) Term-LBW All PTB
OR (95% CI) aOR (95% CI)** OR (95% CI) aOR (95% CI)**
Australian-born (Reference) 1.00 1.00 1.00 1.00
Overseas-born 1.35*(1.27–1.45) 1.49*(1.39–1.60) 0.98 (0.95–1.01) 0.98 (0.95–1.02)
Interpreter use
Non-white non-Māori migrant with interpreter
3493 (9.8) 1.58*(1.24–2.01) 2.03*(1.58–2.60) 0.64*(0.55–0.76) 0.65*(0.55–0.77)
Non-white non-Māori migrant without interpreter
32 066 (90.2) 1.85*(1.70–2.02) 2.24*(2.05–2.46) 1.09*(1.04–1.14) 1.13*(1.07–1.19)
Length of residence
<5 years 29 392 (34.4) 1.51*(1.37–1.66) 1.67*(1.51–1.85) 0.93*(0.88–0.98) 0.95 (0.91–1.01)
5–10 years 17 844 (20.9) 1.22*(1.07–1.39) 1.39*(1.22–1.58) 0.95 (0.89–1.01) 0.97 (0.91–1.04)
>10 years 34 416 (40.3) 1.22*(1.11–1.35) 1.32*(1.20–1.46) 1.00 (0.95–1.05) 1.00 (0.95–1.05)
Age on arrival
≥18 years old 53 555 (65.6) 1.38*(1.27–1.49) 1.30*(1.17–1.45) 0.94*(0.90–0.98) 1.00 (0.95–1.06)
<18 years old 28 074 (34.4) 1.25*(1.12–1.39) 1.61*(1.48–1.75) 1.00(0.95–1.05) 0.97 (0.93–1.01)
Australian-born partner
Migrant with overseas-born partner 60 363 (70.6) 1.49*(1.39–1.61) 1.69*(1.57–1.83) 0.96*(0.92–1.00) 0.98 (0.94–1.02)
Migrant with Australian-born partner 25 118 (29.4) 1.03 (0.91–1.16) 1.07 (0.95–1.21) 0.99 (0.93–1.05) 1.00 (0.94–1.05)
*P<0.05; **Adjusted for insurance status, age group, sex of baby, pre-existing medical conditions, infertility treatment, socioeconomic disadvantage, parity and smoking in pregnancy.

CHAPTER 8. ACCULTURATION, PRETERM BIRTH AND LOW BIRTHWEIGHT IN WA
PAGE | 163
FIGURE 8.1 TERM-LBW RATE BY ETHNICITY OF MIGRANTS AND LENGTH OF RESIDENCE IN AUSTRALIA (2005–2013)
Rate of PTB increased with longer length of residence in Australia for all migrants, except for those
from Māori and African backgrounds (Figure 8.2). Among migrant women who had resided in
Australia for more than ten years, the age and smoking adjusted odds of PTB in Māori women
were 32% lower (aOR 0.68, 95% CI 0.50–0.92) while for women from Asian, other and Indian
backgrounds the odds were 15%, 26% and 50% higher (aOR 1.15, 95% CI 1.04–1.2; aOR 1.26, 95%
CI 1.083–1.46; aOR 1.50, 95% CI 1.137–1.98, respectively) than the Australian-born population.
FIGURE 8.2 ALL PTB RATE BY ETHNICITY OF MIGRANTS AND LENGTH OF RESIDENCE IN AUSTRALIA (2005–2013)

CHAPTER 8. ACCULTURATION, PRETERM BIRTH AND LOW BIRTHWEIGHT IN WA
PAGE | 164
LEVEL OF ACCULTURATION 8.4.3
When acculturation was examined in a multidimensional manner considering many factors
simultaneously, migrant women with an overseas-born partner who used an interpreter had
significantly higher odds of term-LBW and lower odds of PTB than Australian-born women. In
contrast, for migrant women with an Australian-born partner, the odds of term-LBW and PTB were
similar to those of Australian-born women (Table 8.3). For the least acculturated women, the odds
of term-LBW was twice as high as Australian-born women (aOR 2.00, 95% CI 1.45–2.74) while the
odds of PTB was 42% lower (aOR 0.58, 95% CI 0.46–0.73). In contrast, the most acculturated
women had 40% increased odds of PTB and similar odds of term-LBW compared with their
Australian-born counterparts (Table 8.3).
TABLE 8.3 COMPARISON OF TERM-LBW AND PTB IN MIGRANT AND AUSTRALIAN-BORN WOMEN ACCORDING TO
THE ACCULTURATION LEVEL OF MIGRANT WOMEN
*P<0.05; **Adjusted for insurance status, age group, sex of baby, pre-existing medical conditions, infertility
treatment, socioeconomic status, parity and smoking in pregnancy; ***Least acculturated: non-white non-Māori
women lived in Australia <5 years, had an overseas-born partner, immigrated as an adult and, used interpreter
service; ****Most acculturated: non-white non-Māori women, lived in Australian >10 years, immigrated as a child,
had an Australian-born partner and did not use interpreter service.
Population Term-LBW PTB
OR (95% CI) aOR (95% CI)** OR (95% CI) aOR (95% CI)**
Australian-born 1.00 1.00 1.00 1.00
Migrant women with overseas-born partner and interpreter
1.60* (1.26–2.02)
2.03* (1.59–2.58)
0.62* (0.52–0.73)
0.62* (0.53–0.74)
Migrant women with overseas-born partner but no interpreter
1.49* (1.38–1.61)
1.68* (1.55–1.81)
0.98 (0.94–1.02)
1.00 (0.96–1.04)
Migrant women with Australian-born partner
1.04 (0.92–1.17)
1.07 (0.95–1.21)
0.98 (0.93–1.04)
0.99 (0.94–1.09)
Least acculturated*** 1.54*
(1.13–2.11) 2.00*
(1.45–2.74) 0.56*
(0.44–0.70) 0.58*
(0.46–0.73)
Most acculturated**** 1.16
(0.77–1.74) 1.29
(0.86–1.93) 1.37*
(1.15–1.62) 1.40*
(1.18–1.66)

CHAPTER 8. ACCULTURATION, PRETERM BIRTH AND LOW BIRTHWEIGHT IN WA
PAGE | 165
DISCUSSION 8.5
In this whole-population linked data study, we showed that disparities in the risk of PTB and term-
LBW between migrant and Australian-born women differed according to the acculturative
characteristics of the population. Migrant women who used the interpreter service, did not have
an Australian-born partner, and had been in Australia <5 years (less acculturated) had lower odds
of PTB than the Australian-born population. All migrants had a higher risk of term-LBW than the
Australian-born women except for those with an Australian-born partner. Acculturation was
associated with an increased risk of PTB but decreased risk of term-LBW in non-white non-Māori
migrant women.
LOW BIRTHWEIGHT 8.5.1
We found that immigrants, regardless of their length of residence in Australia or whether they
arrived as a child or adult, had a higher risk of LBW than the Australian-born group; however, the
difference was higher in those who had been in Australia for <5 years and/or immigrated as adults.
This finding is similar to previous observations in Australia, but findings from other nations are to
some extent, equivocal.199,313 Hyman and Dussault in 1996 reported increased odds of term-LBW
for Asian women and decreased odds for Italian and Greek migrant women living in Canada,
implying that higher odds were associated with a higher level of acculturation.313,314 Martinson,
Tienda and Teitler in 2017 reported that foreign-born status (collectively) protected against LBW
among migrants residing for ≤5 years in the US and the UK but observed an increased odds of LBW
(OR=1.29), although non-significant (P>0.1), among migrants residing in Australia for ≤5 years.199
They reported that the the three countries studied had a similar overall pattern of LBW by
duration of residence and in their final multivariable analysis, the risk was highest during the first
two years following resettlement. Notwithstanding, the results differed for migrants from
different ethnic backgrounds; African and Asian migrant women resettled in the UK had 3.9–4.3
CHAPTER 8. ACCULTURATION, PRETERM BIRTH AND LOW BIRTHWEIGHT IN WA
PAGE | 166
times higher odds of having an LBW baby than immigrant mothers from English-speaking countries
(P<0.05), while in Australia, women from Asian and other low-income countries had 4.5–7.2 times
higher odds of LBW babies than their counterparts from Anglophone nations (P<0.05). It is worth
noting that this study was based on a sample of 3732 participants from the Australian population,
without knowing the ethnicity of the population; unlike our study population (N=252 256) with
100% completeness for ethnicity. Thus, the small sample size may be a reason for the low
statistical power to detect an effect similar to what we detected. The higher risk of LBW in the first
few years after immigration may be a result of stressors related to immigration, acculturative and
financial instabilities experienced by migrants.296
With a longer length of residence, the rate of term-LBW decreased among women from African
and other ethnic backgrounds in our study, increased among Māori women residing in Australia
for more than five years, and followed a U-shape pattern in births to Asian and Indian women.
Similarly, a U-shaped pattern for associations of LBW with length of residence for immigrant
groups in Denmark315 and with time since naturalisation for immigrants residing in Belgium316 was
reported in Europe. Teitler, Hutto and Reichman have also reported a curvilinear association
pattern in infants’ birthweight by maternal duration of residence in the US for both immigrants
overall, and for Hispanic immigrants in particular.317 This finding suggests that the ‘healthy migrant
paradox’, which implies better initial health outcomes for migrants than the host population that
deteriorate with time302,191 may not be applicable for LBW risk to all migrant groups, and the
change in the risk of LBW over time may not be linear in either direction (improves or declines).
The initial decrease observed in the risk may be explained by an improvement in employment and
financial status in the short term. We previously reported a considerable rise in the proportion of
those with private health insurance in migrant women from white, Asian and Indian ethnic
backgrounds in our population.304 On the other hand, deterioration in the long run may be due to

CHAPTER 8. ACCULTURATION, PRETERM BIRTH AND LOW BIRTHWEIGHT IN WA
PAGE | 167
the accumulation of stressors related to discrimination, acculturation and unhealthy lifestyle
choices, such as smoking, among migrants.304,316
We also showed that having an Australian-born partner was significantly associated with a lower
risk of LBW in migrants. A lower risk of stillbirth for migrant women with a non-migrant partner
than those with overseas-born partners has been reported in Australia, Norway and the US, as
well as a lower risk of small-for-gestational-age in Chinese-American women with white or Black
partners in the US, compared to those with Chinese-American partners.194,197,198,304 Paternal
genetic impact,318,319 fathers’ lifelong socioeconomic position320 and/or factors determining
maternal environmental and lifestyle circumstances, including stress or social support and dietary
or smoking habits,309,314 influenced by integration and acculturation, all may play a role. Given that
intermarriage is a strong predictor of integration in a multicultural society,132 migrant women with
an Australian-born partner may experience enhanced social support and, thus, a favourable
environment compared to their migrant counterparts who have an overseas-born partner.
Previous studies have highlighted the impact of acculturative stress, lack of support and the
increased likelihood of experiencing marriage conflict and even domestic violence for migrant
women with migrant partners.321-323
PRETERM BIRTH 8.5.2
Migrant women who immigrated as a child, women who had ≥5-year length of residence, and
women with an Australian-born partner did not differ from the Australian-born population in the
risk of PTB. When the migrant population were stratified by ethnicity among Asian, Indian and
‘other’ migrants, the risk of PTB was significantly higher in those with longer length of residence.
Further, when level of acculturation, among the non-white non-Māori migrant women collectively,
was determined by considering all proxies simultaneously, acculturation was associated with a
higher risk of PTB. Similarly, in Canada, recent immigrants were at lower risk of PTB, but the risk

CHAPTER 8. ACCULTURATION, PRETERM BIRTH AND LOW BIRTHWEIGHT IN WA
PAGE | 168
was higher in those with >10 years of stay than their Canadian-born counterparts.193 A higher level
of acculturation was significantly associated with higher odds of preterm birth in the US.280,311 The
influence of acculturation on the risk of PTB among migrant groups may be explained by the
stressors experienced and/or the change of health behaviours in migrant populations. The
evidence suggests that women with higher levels of cortisol are at higher risk of experiencing
PTB.324Cortisol secretion is influenced by stress, and researchers have investigated the relationship
between acculturative stress and cortisol levels in migrants.325,326 Ruiz et al. showed that the more
acculturated women were more likely than the less acculturated women to exhibit higher stress
responses measured by cortisol in blood samples.325 Nicholson et al. showed, through diurnal
cortisol response measured by AUC analysis and using salivary samples, a higher level of
proficiency in English in former Soviet immigrants residing in the US produced an increased
cortisol response.326 Higher levels of acculturation were also associated with attenuation of the
cortisol awakening response in Mexican-American adults.327 A flattened or blunted cortisol
awakening response has been reported in Indigenous participants and is believed to be associated
with chronic experience of stress.328 Furthermore, progesterone is an important hormone for
maintaining pregnancy and decreased levels have been linked to preterm birth.95 On the other
hand, greater English proficiency in Hispanic women, hence more acculturation, has been linked to
a decrease in progesterone levels and predicted lower gestational age.311 Thus, we believe that
hormonal alterations in response to acculturative stress may explain the findings we observed in
this study.
In conclusion, our data provided evidence that recent migrants had a higher risk of term-LBW and
lower risk of PTB than the Australian-born population in their first few years after immigration. We
also showed that acculturation had positive effects on the risk of term-LBW but was associated
with a higher risk of PTB in migrant women in Australia collectively. This pattern, however, may

CHAPTER 8. ACCULTURATION, PRETERM BIRTH AND LOW BIRTHWEIGHT IN WA
PAGE | 169
differ in specific ethnic groups. Nevertheless, our findings suggest that acculturation level and
related characteristics are emerging as important factors that should be considered in pregnancy
care of migrant women. This emphasises the need for understanding acculturation-related factors
to plan the interventions required for the prevention of PTB and LBW in migrants and ethnic
minorities at risk.
STRENGTHS AND LIMITATIONS 8.5.3
Our study is the first and the most comprehensive investigation to explore the influence of
acculturation on the risk of PTB and term-LBW in migrants from diverse ethnic backgrounds in
Australia. The large size of the study—including all migrants and non-Indigenous Australian-born
women giving birth—having access to numerous variables from many linked databases and
registries, and the methodology of a whole-population retrospective cohort design, which
eliminates the risk of selection, participation and recall biases, strengthened the robustness of the
study and the reliability of our findings.
We acknowledge, however, that our study has some limitations. We used routinely collected
administrative health data that had not been collected specifically to answer the research
questions of this specific study. Nevertheless, WADLS was originally established as a result of a
collaboration between the WA Department of Health and researchers, mainly for population
health research.204 WADLS prides itself on the quality of the linkages and very low frequency of
errors.212,215 High reliability of MNS data and the variables we used have been validated before.235
Further, acculturation is a dynamic process, and its influence on health behaviour and outcomes is
multifactorial. While we examined acculturation effect using proxies and not through interview or
survey, similar to other population studies, efforts were made to undertake the investigation in a
multidimensional manner using multiple variables, self-reported ethnicity, language proficiency,
age on arrival, intermarriage and length of residence. This approach helped to provide useful

CHAPTER 8. ACCULTURATION, PRETERM BIRTH AND LOW BIRTHWEIGHT IN WA
PAGE | 170
information for a large and diverse population of migrants and can be used to inform policy and
practice and further investigation.
Our findings can be generalised to other populations hosting migrants from similar ethnic
backgrounds; however, care should be taken with interpretation of the results due to factors such
as different immigration and citizenship laws, healthcare systems, cultures and lifestyle norms in
host countries.
CHAPTER 9. DISCUSSION AND FUTURE DIRECTION
PAGE | 171
CHAPTER 9. DISCUSSION AND FUTURE DIRECTION
This thesis was proposed at a time when stillbirth was still in the shadows. There was a lack of
awareness about its prevalence and disparities in risk among different ethnic population groups. In
WA, no study on this topic had been undertaken since 1988, when only Aboriginal and non-
Aboriginal ethnicities were compared with regard to the risk of stillbirth.25 More recently, in other
Australian states, studies examining the relationship between ethnicity and stillbirth were based
on country of birth and limited to specific population groups.13,159
Over the last few years, while this project was ongoing, the topic of stillbirth has received
substantial attention. Public awareness, government consideration and advocate efforts for
collaboration and planning have created a momentum for change to end preventable stillbirth.
This PhD thesis and research project, with numerous presentations and three in-depth analytic
studies on stillbirth, has enhanced the knowledge on the influence of migration, ethnicity,
healthcare utilisation and acculturation through both scholarly contributions and advocacy efforts.
This work has been cited by many other research studies and informed guidelines and policies to
manage and prevent stillbirth more effectively in migrants, specific ethnic groups and specific
regional areas. Further, it has expanded the knowledge and evidence-based understanding of
associations between migration and ethnicity with LBW and PTB. These pregnancy outcomes are
precursors to non-communicable diseases, such as obesity, diabetes and cardiovascular disease,
the leading causes of premature death worldwide.329-331
This chapter summarises and discusses the findings of the research presented in Chapters 4–8, the
strength and limitations of the investigation, the implications for policy and practice, and
suggestions for future research based on this body of work.
FINDINGS 9.1
STILLBIRTH 9.1.1
Chapters 4–6 investigated the pregnancy outcomes of stillbirth among diverse migrant
populations in WA. This research showed that the prevalence of stillbirth among migrant women
in WA was lower than reported in their countries of origin; however, consistent with previous
reports, migrant women were at higher risk of stillbirth than locally born women.241 Further, this
project demonstrated the ethnic group-specific differences in the prevalence of both antepartum
and intrapartum stillbirth for the first time in Australia. The prevalence of antepartum stillbirth

CHAPTER 9. DISCUSSION AND FUTURE DIRECTION
PAGE | 172
was higher among migrant women with Indian, African or ‘other’ origins than Australian-born
women. Further, the prevalence of intrapartum stillbirth was higher among migrant women with
African or ‘other’ origins than Australian-born women. Moreover, we noted that the prevalence of
term stillbirth among the migrants of African origin was 2.6 times that of Australian-born women.
The rate of intrapartum stillbirth was twice as high among African women, potentially indicative of
poor quality of care at the time of birth.
The prevalence of post-term pregnancy, a recognised risk factor for stillbirth,236 was significantly
higher among African migrants (2.1%) than Australian-born women (0.5%) and Asian migrants
(0.2%). This was despite previous reports that the median gestational age of spontaneous labour
among women of African origin was less than 40 weeks in populations from London, Victoria
(Australia) and the US.74,102,237 Further investigation of the WA data demonstrated an association
between midwife-only accoucheur and increased rate of intrapartum stillbirth, even after
restricting the study to viable births after 23 completed weeks of gestation.278 This risk of
intrapartum stillbirth in African women who had a mixed model of care (i.e. both medical and
midwifery teams) was similar to Australian-born women. The Australian-born group had the same
risk of stillbirth, whether they had midwife-only accoucheur or mixed-model team intrapartum
care providers. Our quantitative population-based research design did not allow us to investigate
this further to determine whether this observation indicated a patient-driven ‘choice’ or
preference for midwife-only care or a system-driven lack or shortage of staff. Preference of a
model of care for African women choosing midwife-only rather than the mixed model of care is
suspected due to the frequent reluctance of African women to undergo medical interventions (e.g.
induction of labour and instrumental or caesarean delivery).19,26 This was demonstrated in the
African population in WA who had four-fold higher rates of post-term pregnancy than Australian-
born women. However, lack of access to medical care due to logistics or timing of reaching the
birthing facilities or other reasons cannot be ruled out based on our data and warrants further
investigation.
Moreover, this project demonstrated a late commencement of antenatal care visits as an
underlying factor for the increased risk of antepartum stillbirth observed in migrant women from
Indian, Māori and ‘other’ non-white ethnic backgrounds. Migrant women from an Indian
background had the same risk of antepartum stillbirth as Australian-born women if they had
private health insurance, while those who did not have this privilege experienced a two-fold
CHAPTER 9. DISCUSSION AND FUTURE DIRECTION
PAGE | 173
increase in the risk of stillbirth. It was noted that being ‘high-risk-for-LBW’, regardless of cause,
PTB or fetal growth restriction, was associated with antepartum stillbirth in Indian migrants. This
suggests that early engagement with the healthcare system may reduce the number of stillbirths,
perhaps by implementing interventions that prevent PTB and/or growth restriction, particularly in
this group. Māori women also had a significantly higher rate of preterm (but not term) antepartum
stillbirth than Australian-born women, even after adjusting for several factors including
smoking;241 further investigation revealed that it could be due to their late commencement of
antenatal-care visits.278
This thesis further investigated the effect of level of acculturation—determined through the length
of residence, age arrived in Australia, English language competency, and having an Australian-born
partner—on the risk of stillbirth.304 A longer length of residence, history of using an interpreter
when navigating the health system, and having an Australian-born partner were all associated
with a lower risk of stillbirth in migrants. Migrant women with an overseas-born partner, who did
not use an interpreter, were the most at-risk group among migrants residing in Australia for <5
years. Giving birth in the first two years after arrival was associated with the highest risk of
stillbirth for migrant women from African, Asian and Indian backgrounds compared with
Australian-born women. Adjusting for private health insurance status in further stratified analysis
reduced the odds of stillbirth by 33% in Asian and Indian women who resided in Australia for <2
years. To our surprise, the increased risk of stillbirth disappeared beyond the first two years of
residence among women from Asian and Indian backgrounds. These findings suggest that
unfamiliarity with the healthcare system or other barriers to accessing it, rather than the
acculturative factors per se, may influence the risk of stillbirth in newly arrived migrants from
these two ethnic backgrounds. In Australia, despite the availability of a universal health insurance
scheme covering all Australian citizens and permanent residents (Medicare), depending on the
type of visa (Humanitarian visas are excluded), a two- to four-year waiting period is applied before
immigrants become eligible to benefit from some health and social security services including
Newstart/Jobseeker Allowance and Healthcare Concession Card.154
Surprisingly, women with an overseas-born partner who gave birth in the first two years after
arrival had 62% lower odds of stillbirth if they used an interpreter service and 31% increased odds
of this outcome if they did not use an interpreter than Australian-born women. Language
discordance has been highlighted as a barrier to accessing health services for migrants and

CHAPTER 9. DISCUSSION AND FUTURE DIRECTION
PAGE | 174
refugees in Australia and to compromising the quality of care by over-investigation and acting on
the results rather than on patient’s symptoms.174,262,263 Given that most migrants who used an
interpreter were from regions with higher rates of stillbirth than Australia and had a residence
length of <5 years in Australia, this may be evidence of a ‘healthy migrant paradox’.146,303 This
implies newly arrived migrants have initially better health outcomes than the host population,
despite the disadvantages migrants may encounter, which slowly converges on host population
levels over time.146
Although one may argue that women who did not use the interpreter service could have been
competent in English, anecdotal evidence and qualitative studies suggest otherwise. Previous
reports from Australia and Europe indicated that despite the difficulty in communication, migrant
women from some ethnic backgrounds might not request an interpreter or their partners may
insist on acting as the translator, which can compromise the care received.157,158,263,264 Phillips and
Travaglia estimated that less than 1% of private general practice consultations for patients with
poor English proficiency used the Doctors Priority Line, a unique fee-free rapid-access telephone
interpreter service in Australia.264 Thus, our findings indicate a lack of communication and mutual
understanding between pregnant women and clinicians in those who did not use the interpreter
service, if the interpreter was required but not requested or offered. Using an interpreter in our
data may be an indicator that a culturally sensitive healthcare plan was in effect.
The finding that women who had an Australian-born partner had a lower risk of stillbirth may be
another clue that these women had more interactions within the wider community, were more
competent in English, and more familiar with the healthcare system when navigating their
pregnancy care.
The findings of this thesis demonstrate the critical value of determining the time of stillbirth
(antepartum or intrapartum) given the underlying factors for stillbirth may vary according to the
type of stillbirth. Further, the findings suggest that specific demographics, ethnic and acculturative
status of pregnant women can influence their risk of stillbirth. Thus, to end preventable stillbirths,
it is imperative to consider the identified factors in public health planning, policy design and
provision of obstetrics and pregnancy care, especially for recently immigrated women.
PRETERM BIRTH 9.1.2
Chapters 7 and 8 were dedicated to investigating the influence of ethnicity, migration and
acculturation on the risk of PTB in the WA population. This work identified that migrant women

CHAPTER 9. DISCUSSION AND FUTURE DIRECTION
PAGE | 175
from Asian and Indian backgrounds had higher adjusted odds of PTB (aOR 1.16, 95% CI 1.09–1.24;
aOR 1.24, 95% CI 1.12–1.38, respectively) whereas migrant women with white and Māori
backgrounds had lower adjusted odds of PTB (aOR 0.93, 95% CI 0.89–0.98; aOR 0.85, 95% CI 0.71–
1.00, P=0.044) than Australian-born white women. Migrant women from African backgrounds
were at lower risk of idiopathic PTB, and those from Māori and Chinese-born backgrounds were at
lower risk of medically indicated PTB than their white Australian-born counterparts. Among non-
white Australian-born women, those from ‘other’ backgrounds had higher odds of medically
indicated PTB than white Australian-born women.
Previous studies have similarly observed a lower rate of PTB for migrant women301 from white,295
Chinese163,332 and Somali backgrounds13 than the non-migrant populations in Australia, Canada
and the US, while a greater risk of PTB in migrants from Asian and Sub-Saharan African
backgrounds has been reported in a systematic review.11 We have presented a comprehensive
analysis of the risk in several migrant population groups and further shown a higher risk for non-
white Australian-born women from ‘other’ ethnic backgrounds by studying the influence of
ethnicity on the risk of PTB among the Australian-born population from different ethnic
backgrounds.
Moreover, this research showed that migrant women who immigrated as a child, women who had
a ≥5 year length of residence, and women with an Australian-born partner at the time of giving
birth had a similar risk of PTB to the Australian-born population. When the migrant population was
stratified by ethnicity, among Asian, Indian and ‘other’ migrants, the risk of PTB was significantly
higher in those with longer length of residence. Thus, among the non-white non-Māori migrant
women assessed collectively, acculturation was associated with a higher risk of PTB than the
Australian-born population. This finding is consistent with previous research from Canada and the
US reporting that recent immigrants were at lower risk of PTB, but the risk was higher in those
with >10 years of residence than their Canadian-born counterparts193 and that higher levels of
acculturation were associated with higher odds of preterm birth in the US.280,311
The stressors experienced and/or the change of health behaviours in migrant populations may
explain why the more acculturated women are at higher risk of PTB than less acculturated women.
Altered patterns of hormone secretion, especially cortisol and progesterone, which have an
important role in maintaining pregnancy, have been linked to acculturative stress in the US.324-327

CHAPTER 9. DISCUSSION AND FUTURE DIRECTION
PAGE | 176
These data and the generated evidence highlight the heterogeneity of the population and the
importance of considering both country of birth and ethnicity, as well as the level of acculturation
in the analysis, obstetric practice, and in public health planning to identify and target at-risk
groups.
LOW BIRTHWEIGHT 9.1.3
Chapters 7 and 8 in this thesis explored the influence of ethnicity, migration and acculturation on
the risk of LBW. For the first time in Australia, this research showed that migrants from six
different ethnic backgrounds had higher odds of term-LBW than the Australian-born white
population. The cumulative incidence of LBW was 4.3% among all singleton non-Indigenous live
births, and both ethnicity and migration influenced the risk of term-LBW. The risk was higher in
migrants and the non-white Australian-born population from Asian, Indian and ‘other’ ethnic
descents than their white Australian-born counterparts. Also, the Australian-born women from
Asian, Indian and ‘other’ backgrounds were at higher risk of term-LBW than their white Australian-
born counterparts.
Martinson, Tienda and Teitler reported in 2017 that foreign-born status was protective against
LBW among migrants residing in the US and the UK for ≤5 years but had non-significant increased
odds of LBW (OR=1.29) among migrants residing in Australia for ≤5 years.199 However, they
reported that the three countries studied had a similar overall pattern of LBW by duration of
residence and, in their final multivariable analysis, the risk was highest during the first two years
following resettlement. Notwithstanding, in the same study, African and Asian migrant women
resettled in the UK had 3.9–4.3-times higher odds of having a LBW baby than immigrant mothers
from English-speaking countries, while in Australia women from Asian and other low-income
countries had 4.5–7.2 times higher odds of LBW than their counterparts from Anglophone nations.
This thesis demonstrated that immigrants, regardless of their length of residence in Australia or
whether they arrived as a child or adult, had a higher risk of LBW than the Australian-born group;
however, the difference was higher in those who had been in Australia for <5 years and/or
immigrated as adults. The stressors related to immigration, acculturative and financial instabilities
experienced by migrants may explain the higher risk of LBW in the first few years after
immigration.296
These results suggest that migrant status and ethnicity may be independent predictors of LBW or
proxies for other influential factors, such as diet or sociocultural experiences, not recorded in the

CHAPTER 9. DISCUSSION AND FUTURE DIRECTION
PAGE | 177
dataset. The intergenerational effect of disadvantage experienced by the first generation of
migrants may explain some of these findings and emphasise the need for investigation,
intervention and prevention to ameliorate the short- and long-term impacts of LBW on individuals,
populations and the health system.
STRENGTHS AND LIMITATIONS 9.2
The research submitted in this thesis represents the most comprehensive quantitative study on
the effect of migration, ethnicity and acculturation on pregnancy outcomes of stillbirth, PTB and
LBW in Australia. The migrant population in this study was substantial (88 395 births, 33.9% of the
total study population), and multiple ethnic origins were included in the analyses. The linked
health data methodology and whole-population design reduced the risk of selection, participation,
reporting and recall biases and enabled greater precision and the ability to detect even marginal
shifts in practice or outcomes. The variety of variables available made it possible to link
sociocultural concepts, such as immigration and acculturation, with health outcomes through an
innovative approach.
An additional strength of the study was the ability to examine the specific type of stillbirth
(antepartum or intrapartum) with data available for 99.98% of stillbirths for a complete population
cohort. PTB was also investigated as an overall outcome and by sub-types, spontaneous or
medically indicated. Further, separating preterm births from cases of LBW and studying only term-
LBW made the interpretation of findings more accurate and valid as the impact of gestational age
on birthweight was ruled out systematically.
Analysing routinely collected linked data, rather than data mainly collected for answering specific
research questions, has its limitations and may have led to some misclassification of exposures.
We conducted extensive cross-source ascertainment through multiple datasets to minimise this
potential issue. For example, maternal country of birth was accessible through Birth Registrations
and hospital discharge records. Stillbirth was recorded on MNS, HMDC, Birth and Death
Registrations. However, despite all these efforts, a small risk of misclassification may have biased
the results, towards the null hypothesis, for the analyses that used the ethnicity variable, given
that the self-reported ethnic origin data was only available from MNS. For example, Indian women
with a high risk of antepartum stillbirth may have been misclassified as Asian (population with a
lower risk of stillbirth) given that India is located in Asia and the UK, Indian and Pakistani women
are classified under Asian ethnicity. In such cases, the actual risk of antepartum stillbirth in Indian

CHAPTER 9. DISCUSSION AND FUTURE DIRECTION
PAGE | 178
women can be even higher than what we reported. However, such risk is very low, as a validation
study of MNS confirmed the reliability of this database with a Proportion Records Correct of 94.1%
for the variable ethnicity.235
Another potential limitation arising from the analysis of large datasets is that women may have
had more than one birth or stillbirth during the study period, resulting in non-independence of
data. In this thesis, limiting analyses to women with only one birth record or accounting for
clustering in the analyses did not affect the results. Further, the nine-year observation period used
in this thesis can act as both a strength and limitation; if the standard of care changed over time,
this may create bias. Thus, we adjusted the analyses for year of birth to limit the potential impact
of this issue.
While our rich dataset made it possible to control for many factors, residual confounding is still
possible due to covariates not being available—data on maternal weight70,74,159 or interpregnancy
interval105,106 for example—in the dataset. It is noteworthy, however, that we adjusted the
analyses for pre-existing diabetes mellitus and essential hypertension that are associated with
high BMI. Further, recent evidence suggests that short interpregnancy interval, although
associated with PTB, may not explain the risk disparities observed according to Lonhart et al. who
studied the risk of PTB between non-Hispanic White and non-Hispanic Black women in the US.333
Also, Swaminathan and colleagues, who studied the reproductive histories of women from 2002–
18 and identified live births and stillbirths in the preceding five years using Demographic and
Health Surveys from 58 LMICs, reported that associations observed in the first interpregnancy
intervals of less than 12 months with increased risk of stillbirth might not be causal because these
effects attenuated when second and third intervals were considered.
Finally, the gestational age at first ANC visit was not recorded in WADLS until 2010; hence, this
information was only available for four years of the study period. Thus, the related analyses
reported were limited to almost half of the whole study population.
IMPLICATIONS FOR POLICY AND PRACTICE 9.3
It is estimated that 272 million migrants (3.5% of the world’s population) live globally, and nearly
two-thirds of them live in high-income countries.122 International migration is at its highest level
since the Second World War,118 and the proportion of international migrants is already ahead of
some projections made for the year 2050 (2.6% or 230 million).122

CHAPTER 9. DISCUSSION AND FUTURE DIRECTION
PAGE | 179
The findings reported in this thesis may be of use to other high-income communities serving
migrant residents from similar ethnic backgrounds and countries of origin. These include other
states of Australia, European and American countries such as the UK’s and Canadian population
given some similarity in their healthcare systems and being in the top ten destinations for
international migration.122
The findings of this thesis are of particular relevance to clinical practice. Engaging women with
ANC early in pregnancy, offering interpreter service proactively, providing more frequent
ultrasound surveillance, and involving a team (both doctor and midwife) for care during birth for
specific at-risk groups may reduce the risk of stillbirth. A culturally responsive health system can
meet the educational and healthcare needs of at-risk ethnic groups, and enhanced data records on
obesity, antenatal and intrapartum care information can strengthen future studies to further
inform policy and practice. Primary healthcare services can be used to educate and improve health
literacy and familiarity with the healthcare system, including the promotion of early engagement
with antenatal care, use of interpreter services and the value of medical-midwifery (team)
intrapartum care among the migrant population.
This investigation has further shown that acculturation may elevate the risk of stillbirth by
increasing the prevalence of unhealthy behaviours, such as smoking during pregnancy, and
decrease the risk through better utilisation of health services and effective communication. Thus,
the resultant outcome would depend on how these underlying factors interplay in populations
over time. According to the current findings, and studies in other jurisdictions,190,280 acculturation
status has presented as an important factor to consider when providing health care to immigrant
populations. Mutual accommodation is required for healthy and successful integration of all
migrant groups, by adopting the basic values of the host country by migrants as well as adapting
the healthcare and education systems to meet the needs of all population groups appropriately.129
Therefore, these findings emphasise the value of national educational programs to familiarise
migrants with the health system and inform them of their risks, rights and entitlements to
healthcare programs, before, during and after pregnancy. The need for a culturally responsive
healthcare system to improve access to and utilisation of interpreter and other services is
highlighted to help reduce the rates of stillbirth, preterm birth and low birthweight. This is
especially necessary for recently arrived migrants who are at greater risk of stillbirth. It is
particularly crucial to investigate and address the underlying mechanisms for the increased risk of

CHAPTER 9. DISCUSSION AND FUTURE DIRECTION
PAGE | 180
stillbirth among non-white non-Māori migrant women in the first two years after their arrival. In
the absence of such additional data, pregnant women from these ethnic backgrounds with a
length of residence less than two years may benefit from being treated as high risk for stillbirth
and LBW. For those with longer length of residence, raising awareness of the slightly increased risk
of PTB and preventive strategies is strongly recommended.
RESEARCH TRANSLATION, IMPACT AND DIRECTION FOR FUTURE RESEARCH 9.4
The work in this thesis has resulted in more than 40 outputs, including publications and
local/national/international presentations (please refer to pages x–xiii). This project has
substantially advanced knowledge in this important area of research and communicated
disparities in the risk of adverse pregnancy outcomes in the WA population. Further, it has
identified many underlying risk factors involved in experiencing these outcomes among
community members and proposed potential strategies for improving pregnancy outcomes in the
population. For example, these findings have been considered and cited in a position statement of
the Perinatal Society of Australia and New Zealand and Centre of Research Excellence in Stillbirth
on Improving decision-making about the timing of birth for women with risk factors for
stillbirth;334 in clinical practice guidelines for perinatal bereavement care, models of maternity and
postpartum care;335 and in risk prediction models for stillbirths336 by prominent professional
societies and leading peak organisations. The findings have also been submitted to The Australian
Government, Department of Health, through the “National Stillbirth Action and Implementation
Plan - Public Consultation” to further contribute to informing policy and practice for prevention of
stillbirth.
Through the distinguished and instrumental platforms of the Red Nose Foundation
(www.rednose.org.au) and National Centre for Research Excellence in Stillbirth, this project has
distributed its message to far-reaching audiences and widely advocated for the health of migrants
and ethnic minorities. Given the strong political interest and bipartisan support that helped raise
the profile of stillbirth in Australia, the evidence provided by this project on stillbirth in migrant
and non-white ethnic groups has been particularly timely and relevant in its contribution to
improving population health in that area.
This investigation identified certain aspects of the health behaviours and the healthcare system
that are not currently routinely captured in Australian data registries but are likely to influence the
risk of adverse pregnancy outcomes in the population. One of these aspects was the pattern of

CHAPTER 9. DISCUSSION AND FUTURE DIRECTION
PAGE | 181
health service utilisation that differed between migrant and non-migrant Australian women.278 It
was not clear whether an individual’s perceptions, knowledge and beliefs were the reason for this
difference and/or the healthcare providers’ perspectives and approach were the underlying basis.
It is believed that migrants, especially those from African backgrounds, have a different view
towards care and intervention in pregnancy and this influences their underutilisation of healthcare
services, which is linked to a higher risk of stillbirth.19Qualitative investigation on this issue may
help to enhance knowledge and guide the development of culturally appropriate preventive
strategies or interventions. This thesis also denoted that African women had a slower pace of
acculturation and, while other ethnic groups’ risk of stillbirth decreased over time, the risk in this
specific population remained high for an extended length of time beyond five years after arrival in
Australia.304 On the other hand, factors such as racism and discrimination have been linked to
adverse pregnancy outcomes in other nations.337
According to the Scanlon Foundation’s Mapping Social Cohesion 2019 report,338 among all
Australian states and territories, WA had the highest percentage (22%) of reported experience of
discrimination and the highest level of agreement (30%) with discrimination on the basis of race or
ethnicity in 2018–19. It is unknown, however, what implications this may have for the CaLD
population’s experience of pregnancy care and childbirth. For instance, anecdotal evidence
suggests that each stillbirth experienced by a member of some ethnic communities has an
immense ‘ripple effect’ on the attitude of other community members towards lower utilisation of
that specific healthcare provider or facility, which continues to remain in effect for a relatively long
time after the incident. Racism may also be associated with health service use outcomes such as
delaying/not getting healthcare and lack of adherence to treatment uptake.339 In this thesis, late
commencement of ANC was an underlying factor for higher risk of stillbirth in Indian, Māori and
‘other’ non-white migrant groups and those who started at or before week 14 of their pregnancy
had similar risks to Australian-born women.278 Although this did not hold for the African group and
they were at increased risk of stillbirth, regardless of the time of commencement of ANC, it is
worth noting that in 91% of cases, the African group did not have an obstetrician birth-
attendant.278 Thus, further in-depth investigation is recommended to uncover the mechanisms for
all these findings that this project did not have enough data to explore.
To conclude, this project demonstrated that migrant status, ethnicity and acculturation can be
associated with specific patterns of service utilisation and with certain pregnancy outcomes. These

CHAPTER 9. DISCUSSION AND FUTURE DIRECTION
PAGE | 182
data were highlighted as crucial factors for consideration in policy development, on public health
agendas, and in pregnancy and obstetric care provision to prevent adverse pregnancy outcomes,
especially in populations from migrant and CaLD backgrounds and to improve health outcomes in
Australian society.
Specific recommendations:
1. Provision of a culturally responsive healthcare service and interpreter as an intervention to
reduce the rate of stillbirth should be considered by healthcare providers.
2. For migrant women of Indian ethnicity, improving access to more frequent ultrasound
surveillance during pregnancy and third trimester in public settings as an intervention to
reduce the rate of antepartum stillbirth
3. A doctor–midwife (team) model of intrapartum care for women from African and ‘other’
ethnic backgrounds to reduce the rate of intrapartum stillbirth in this at-risk population.
4. Education of migrant population to commence antenatal care visits early, before week 14,
in pregnancy and to avoid post-term, beyond week 41, pregnancy through culturally
appropriate means.
5. Less than two years’ time since arrival in Australia should be considered as a risk factor for
stillbirth and LBW for migrants from culturally and linguistically diverse backgrounds.
6. Migrant women should be exempted from waiting period for benefiting from health and
social security services such as Newstart/Jobseeker Allowance and Healthcare Concession
Card that may restrict their access to health services during pregnancy.
7. For migrant women of Māori background strategies to assist with quitting smoking in
pregnancy may reduce the risk of term LBW. However, determinants of term LBW in
migrants from different ethnic backgrounds need more in-depth investigation.
REFERENCES
PAGE | 183
REFERENCES
1. Darmstadt GL, Yakoob M, Haws RA, Menezes EV, Soomro T, Bhutta ZA. Reducing stillbirths:
Interventions during labour. BMC Pregnancy Childbirth 2009; 9(SUPPL. 1).
2. Haws RA, Yakoob M, Soomro T, Menezes EV, Darmstadt GL, Bhutta ZA. Reducing stillbirths:
Screening and monitoring during pregnancy and labour. BMC Pregnancy Childbirth 2009; 9(SUPPL.
1).
3. Johnston T, Coory M. Reducing perinatal mortality among Indigenous babies in Queensland: Should
the first priority be better primary health care or better access to hospital care during confinement?
Aust New Zealand Health Policy URL http://wwwanzhealthpolicycom/content/2/1/11 2005; 2(1).
4. Kumar GA, Dandona R, Chaman P, Singh P, Dandona L. A population-based study of neonatal
mortality and maternal care utilization in the Indian state of Bihar. BMC Pregnancy Childbirth 2014;
14: 357.
5. Mathis A, Barnes PA, Moonesinghe R. Racial and Ethnic Disparities in Post-neonatal Mortality in
Florida. Florida Public Health Review 2012.
6. Naimy Z, Grytten J, Monkerud L, Eskild A. Perinatal mortality in non-western migrants in Norway as
compared to their countries of birth and to Norwegian women. BMC Public Health 2013; 13: 37.
7. Lawn JE, Kinney M, Lee AC, et al. Reducing intrapartum-related deaths and disability: can the health
system deliver? Int J Gynaecol Obstet 2009; 107 Suppl 1: S123-40, S40-42.
8. Bhutta ZA, Darmstadt GL, Haws RA, Yakoob MY, Lawn JE. Delivering interventions to reduce the
global burden of stillbirths: Improving service supply and community demand. BMC Pregnancy
Childbirth 2009; 9(SUPPL. 1).
9. Balchin I, Whittaker JC, Patel R, Lamont RF, Steer PJ. Racial variation in the association between
gestational age and perinatal mortality: Prospective study. Br Med J 2007; 334(7598): 833-5.
10. Cacciani L, Asole S, Polo A, et al. Perinatal outcomes among immigrant mothers over two periods in
a region of central Italy. BMC Public Health 2011; 11: 294.
11. Gagnon AJ, Zimbeck M, Zeitlin J, et al. Migration to western industrialised countries and perinatal
health: a systematic review. Soc Sci Med 2009; 69(6): 934-46.
12. United Nations, Department of Economic and Social Affairs, Population Division. The UN
International Migration Report 2013. available from

REFERENCES
PAGE | 184
http://www.un.org/en/development/desa/population/publications/pdf/migration/migrationreport2
013/Full_Document_final.pdf.
13. Small R, Gagnon A, Gissler M, et al. Somali women and their pregnancy outcomes postmigration:
Data from six receiving countries. BJOG Int J Obstet Gynaecol 2008; 115(13): 1630-40.
14. Bottoms SF, Paul RH, Iams JD, et al. Obstetric determinants of neonatal survival: Influence of
willingness to perform cesarean delivery on survival of extremely low-birth-weight infants. Am J
Obstet Gynecol 1997; 176(5): 960-6.
15. McNellis D, Medearis AL, Fowler S, et al. A clinical trial of induction of labor versus expectant
management in postterm pregnancy: The National Institute of Child Health and Human
Development Network of Maternal-Fetal Medicine Units. Am J Obstet Gynecol 1994; 170(3): 716-23.
16. Okonkwo NS, Ojengbede OA, Morhason-Bello IO, Adedokun BO. Maternal demand for cesarean
section: Perception and willingness to request by Nigerian antenatal clients. Int J Womens Health
2012; 4(1): 141-8.
17. Kornelsen J, Hutton E, Munro S. Influences on decision making among primiparous women choosing
elective caesarean section in the absence of medical indications: findings from a qualitative
investigation. J Obstet Gynaecol Can 2010; 32(10): 962-9.
18. Bettegowda VR, Dias T, Davidoff MJ, Damus K, Callaghan WM, Petrini JR. The Relationship Between
Cesarean Delivery and Gestational Age Among US Singleton Births. Clin Perinatol 2008; 35(2): 309-
23.
19. Brown E, Carroll J, Fogarty C, Holt C. "They get a C-section...they gonna die": Somali women's fears
of obstetrical interventions in the United States. J Transcult Nurs 2010; 21(3): 220-7.
20. Barker DJ. The fetal and infant origins of adult disease. BMJ 1990; 301(6761): 1111.
21. Australian Bureau of Statistics. Migration. Cat No:34120. Australia; 2013-14.
22. Australian Bureau of Statistics. Perspectives on Migrants. Cat No: 34160. Australia; March 2013.
23. von Katterfeld B, Li J, McNamara B, Langridge AT. Perinatal complications and cesarean delivery
among foreign-born and Australian-born women in Western Australia, 1998-2006. Int J Gynaecol
Obstet 2012; 116(2): 153-7.
24. von Katterfeld B, Li J, McNamara B, Langridge AT. Obstetric profiles of foreign-born women in
Western Australia using data linkage, 1998-2006. Aust N Z J Obstet Gynaecol 2011; 51(3): 225-32.
25. Alessandri LM, Stanley FJ, Waddell VP, Newnham J. Stillbirths in Western Australia 1980-1983:
influence of race, residence and place of birth. Aust N Z J Obstet Gynaecol 1988; 28(4): 284-92.

REFERENCES
PAGE | 185
26. von Katterfeld B. Motherhood after migration: perinatal health and wellbeing among culturally and
linguistically diverse foreign-born women in Western Australia. 2011. https://research-
repository.uwa.edu.au/en/publications/motherhood-after-migration-perinatal-health-and-
wellbeing-among-c.
27. REGISTRATION OF BIRTHS, DEATHS AND MARRIAGES ACT 1963.
https://www.legislation.gov.au/Details/C2015Q00223.
28. Australian Institute of Health and Welfare. Australia’s mothers and babies 2015—in brief.Perinatal
statistics series no. 33. 2017. https://www.aihw.gov.au/getmedia/728e7dc2-ced6-47b7-addd-
befc9d95af2d/aihw-per-91-inbrief.pdf.aspx?inline=true.
29. Government of Western Australia. Western Australia Births, Deaths and Marriages Registratio Act
1998.
https://www.slp.wa.gov.au/statutes/swans.nsf/%28DownloadFiles%29/Births+Deaths+and+Marriag
es+Registration+Act+1998.pdf/$file/Births+Deaths+and+Marriages+Registration+Act+1998.pdf.
30. Australian Institute of Health and Welfare 2019. Australia’s mothers and babies 2017—in brief.
Perinatal statistics series no. 35. Cat. no. PER 100. Canberra: AIHW.
https://www.aihw.gov.au/getmedia/2a0c22a2-ba27-4ba0-ad47-ebbe51854cd6/aihw-per-100-in-
brief.pdf.aspx?inline=true.
31. Ahman E, Zupan J, World Health Organization. Dept. of Making Pregnancy Safer. Neonatal and
perinatal mortality : country, regional and global estimates. Geneva: World Health Organization;
2007.
32. Goldenberg RL, McClure EM, Bhutta ZA, et al. Stillbirths: the vision for 2020. Lancet 2011; 377(9779):
1798-805.
33. Lawn JE, Blencowe H, Pattinson R, etal. Stillbirths: Where? When? Why? How to make the data
count? Lancet URL http://wwwjournalselseviercom/the-lancet/ 2011; 377(9775): 1448-63.
34. Cousens S, Blencowe H, Stanton C, et al. National, regional, and worldwide estimates of stillbirth
rates in 2009 with trends since 1995: A systematic analysis. Lancet URL
http://wwwjournalselseviercom/the-lancet/ 2011; 377(9774): 1319-30.
35. WHO, UNICEF. 2014. Every Newborn: an action plan to end preventable deaths. Geneva: World
Health Organization. 2014. https://www.who.int/docs/default-source/mca-documents/advisory-
groups/quality-of-care/every-new-born-action-plan-(enap).pdf?sfvrsn=4d7b389_2.
36. Every Woman Every Child. Global Strategy for Women’s, Children’s and Adolescents’ Health (2016–
2030). Every Woman Every Child; New York, 2015.

REFERENCES
PAGE | 186
37. Dickson KE, Simen-Kapeu A, Kinney MV, et al. Every Newborn: Health-systems bottlenecks and
strategies to accelerate scale-up in countries. Lancet URL http://wwwjournalselseviercom/the-
lancet/ 2014; 384(9941): 438-54.
38. Lawn JE, Blencowe H, Oza S, et al. Every Newborn: Progress, priorities, and potential beyond
Survival. Lancet URL http://wwwjournalselseviercom/the-lancet/ 2014; 384(9938): 189-205.
39. de Bernis L, Kinney MV, Stones W, et al. Stillbirths: ending preventable deaths by 2030. Lancet 2016;
387(10019): 703-16.
40. Easterly W, Freschi L. National, regional, and worldwide estimates of stillbirth rates. Lancet 2011;
378(9794): 873; author reply -4.
41. Flenady V, Koopmans L, Middleton P, et al. Major risk factors for stillbirth in high-income countries:
a systematic review and meta-analysis. Lancet 2011; 377(9774): 1331-40.
42. Blencowe H, Cousens S, Jassir FB, et al. National, regional, and worldwide estimates of stillbirth rates
in 2015, with trends from 2000: a systematic analysis. Lancet Glob Health 2016; 4(2): e98-e108.
43. Chou D, Daelmans B, Jolivet RR, Kinney M, Say L. Ending preventable maternal and newborn
mortality and stillbirths. BMJ 2015; 351: h4255.
44. Ballestas T. on behalf of the Perinatal and InfantMortality Committee of Western Australia. The 14th
report of the Perinatal and Infant Mortality Committeeof Western Australia for deaths in the
triennium2008-2010. Perth: Department of Health, WesternAustralia,. 2014.
https://ww2.health.wa.gov.au/%7E/media/Files/Corporate/Reports%20and%20publications/Perinat
al%20infant%20and%20maternal/12781_the_14th_perinatal_report.pdf.
45. Australian Institute of Health and Welfare. Australia’s mothers and babies 2013—in brief. Perinatal
statistics series no. 31. . Cat no PER 72 Canberra: AIHW; 2015.
46. Australian Institute of Health and Welfare 2018. Perinatal deaths in Australia: 2013–2014. Cat. no.
PER 94.Canberra: AIHW.; 2018.
47. Lancaster P, Huang J, Pedisich E. Australia’s mothers and babies 1991 (Perinatal statistics series
no.1). Canberra: Australian Institute of Health and Welfare. 1994.
48. O'Leary CM, Bower C, Knuiman M, Stanley FJ. Changing risks of stillbirth and neonatal mortality
associated with maternal age in Western Australia 1984-2003. Paediatr Perinat Epidemiol 2007;
21(6): 541-9.
49. Chan A, King JF, Flenady V, Haslam RH, Tudehope DI. Classification of perinatal deaths: development
of the Australian and New Zealand classifications. J Paediatr Child Health 2004; 40(7): 340-7.
REFERENCES
PAGE | 187
50. Perinatal Society of Australia and New Zealand Clinical Practice Guideline for Perinatal Mortality;
Second Edition, Version 2.2. Section 7: Perinatal Mortality Classifications; Appendix 1. 2009.
51. Laws PJ, Li Z, Sullivan EA. Australia’s mothers and babies 2008. Perinatal statistics series no 24 Cat
no PER 50 Canberra: AIHW; 2010.
52. Australian Bureau of Statistics 2009. Perinatal Deaths. Canberra: ABS; 2011.
53. Gordon A, Jeffery HE. Classification and description of stillbirths in New South Wales, 2002-2004.
Med J Aust 2008; 188(11): 645-8.
54. Ballestas T. on behalf of the Perinatal and Infant Mortality Committee of Western Australia (2017).
The 15th Report of the Perinatal and Infant Mortality Committee of Western Australia, 2011-2013.
Perth: Department of Health WA. https://ww2.health.wa.gov.au/-/media/Files/Corporate/Reports-
and-publications/Perinatal-infant-and-maternal/PIMC_Report_2011-2013.pdf.
55. World Health Organization. The WHO application of ICD-10 to deaths during pregnancy, childbirth
and puerperium: IDC MM (in IRIS). Geneva: World Health Organization; 2012.
56. Gissler M, Mohangoo AD, Blondel B, et al. Perinatal health monitoring in Europe: results from the
EURO-PERISTAT project. Inform Health Soc Ca 2010; 35(2): 64-79.
57. Office for National Statistics. Gestation-specific Infant Mortality in England and Wale, 2011, 2013.
58. International Statistical Classification of Diseases and Related Health Problems 10th revision. In: ICD
version:2016 [website]. Geneva: World Health Organization; 2016.
http://apps.who.int/classifications/icd10/browse/2016/en
59. Mohangoo AD, Blondel B, Gissler M, et al. International Comparisons of Fetal and Neonatal Mortality
Rates in High- Income Countries: Should Exclusion Thresholds Be Based on Birth Weight or
Gestational Age? Plos One 2013; 8(6).
60. Smith LK, Hindori-Mohangoo AD, Delnord M, et al. Quantifying the burden of stillbirths before 28
weeks of completed gestational age in high-income countries: a population-based study of 19
European countries. Lancet 2018; 392(10158): 1639-46.
61. Lawn JE, Blencowe H, Waiswa P, et al. Stillbirths: rates, risk factors, and acceleration towards 2030.
Lancet 2016; 387(10018): 587-603.
62. Flenady V, Wojcieszek AM, Middleton P, et al. Stillbirths: recall to action in high-income countries.
Lancet 2016; 387(10019): 691-702.

REFERENCES
PAGE | 188
63. Hilder L, Zhichao Z, Parker M, Jahan S, Chambers GM. Australia’s mothers and babies 2012. 2014.
http://www.aihw.gov.au/publication-detail/?id=60129550033.
64. Australian Institute of Health and Welfare 2020. Stillbirths and neonatal deaths in Australia . Cat. no.
PER 107. Canberra: AIHW. . 2020. https://www.aihw.gov.au/reports/mothers-babies/stillbirths-and-
neonatal-deaths-in-australia.
65. Farrant BM, Stanley FJ, Hardelid P, Shepherd CC. Stillbirth and neonatal death rates across time: the
influence of pregnancy terminations and birth defects in a Western Australian population-based
cohort study. BMC Pregnancy Childbirth 2016; 16: 112.
66. Hilder L, Flenady V, Ellwood D, Donnolley N, Chambers GM. Improving, but could do better: Trends
in gestation-specific stillbirth in Australia, 1994-2015. Paediatr Perinat Epidemiol 2018; 32(6): 487-
94.
67. Ekeus C, Cnattingius S, Essen B, Hjern A. Stillbirth among foreign-born women in Sweden. European
journal of public health 2011; 21(6): 788-92.
68. Sørbye IK, Vangen S, Juarez SP, et al. Birthweight of babies born to migrant mothers - What role do
integration policies play? SSM Popul Health 2019; 9: 100503.
69. Bjornholt SM, Leite M, Albieri V, Kjaer SK, Jensen A. Maternal smoking during pregnancy and risk of
stillbirth: results from a nationwide Danish register-based cohort study. Acta Obstet Gynecol Scand
2016; 95(11): 1305-12.
70. Cnattingius S, Stephansson O. The epidemiology of stillbirth. Semin Perinatol 2002; 26(1): 25-30.
71. Fretts RC. Etiology and prevention of stillbirth. Am J Obstet Gynecol 2005; 193(6): 1923-35.
72. Balayla J, Azoulay L, Abenhaim HA. Maternal marital status and the risk of stillbirth and infant death:
a population-based cohort study on 40 million births in the United States. Womens Health Issues
2011; 21(5): 361-5.
73. Hirst JE, Villar J, Victora CG, et al. The antepartum stillbirth syndrome: risk factors and pregnancy
conditions identified from the INTERGROWTH-21st Project. BJOG 2018; 125(9): 1145–53.
74. Davies-Tuck ML, Davey MA, Wallace EM. Maternal region of birth and stillbirth in Victoria, Australia
2000-2011: A retrospective cohort study of Victorian perinatal data. PLoS One 2017; 12(6):
e0178727.
75. Australian Institute of Health and Welfare 2019. Stillbirths and neonatal deaths in Australia 2015 and
2016: in brief. Perinatal statistics series no. 36. Cat. no. PER 102. Canberra: AIHW. 2019.

REFERENCES
PAGE | 189
https://www.aihw.gov.au/getmedia/12d0156d-b343-403f-ab62-8700861edeca/aihw-per-
102.pdf.aspx?inline=true.
76. Abdel-Latif ME, Bajuk B, Oei J, et al. Does rural or urban residence make a difference to neonatal
outcome in premature birth? A regional study in Australia. Arch Dis Child Fetal Neonatal Ed 2006;
91(4): F251-6.
77. Gardosi J, Madurasinghe V, Williams M, Malik A, Francis A. Maternal and fetal risk factors for
stillbirth: population based study. BMJ 2013; 346: f108.
78. Marufu TC, Ahankari A, Coleman T, Lewis S. Maternal smoking and the risk of still birth: systematic
review and meta-analysis. BMC Public Health 2015; 15: 239.
79. Cnattingius S, Villamor E. Weight change between successive pregnancies and risks of stillbirth and
infant mortality: A nationwide cohort study. Lancet URL http://wwwjournalselseviercom/the-lancet/
2016; 387(10018): 558-65.
80. Engel PJ, Smith R, Brinsmead MW, Bowe SJ, Clifton VL. Male sex and pre-existing diabetes are
independent risk factors for stillbirth. Aust N Z J Obstet Gynaecol 2008; 48(4): 375-83.
81. Mondal D, Galloway TS, Bailey TC, Mathews F. Elevated risk of stillbirth in males: systematic review
and meta-analysis of more than 30 million births. BMC Med 2014; 12: 220.
82. McClure EM, Saleem S, Pasha O, Goldenberg RL. Stillbirth in developing countries: a review of
causes, risk factors and prevention strategies. J Matern Fetal Neonatal Med 2009; 22(3): 183-90.
83. Di Mario S, Say L, Lincetto O. Risk factors for stillbirth in developing countries: a systematic review of
the literature. Sex Transm Dis 2007; 34(7 Suppl): S11-21.
84. Gissler M, Alexander S, MacFarlane A, et al. Stillbirths and infant deaths among migrants in
industrialized countries. Acta Obstet Gynecol Scand 2009; 88(2): 134-48.
85. Willinger M, Ko CW, Reddy UM. Racial disparities in stillbirth risk across gestation in the United
States. Am J Obstet Gynecol 2009; 201(5): 469 e1-8.
86. Sørbye IK, Stoltenberg C, Sundby J, Daltveit AK, Vangen S. Stillbirth and infant death among
generations of Pakistani immigrant descent: A population-based study. Acta Obstet Gynecol Scand
2014; 93(2): 168-74.
87. World Health Organization. Neonatal and perinatal mortality : country, regional and global
estimates. Geneva: World Health Organization; 2006.
88. Lawn JE, Cousens S, Zupan J. 4 Million neonatal deaths: When? Where? Why? Lancet 2005;
365(9462): 891-900.

REFERENCES
PAGE | 190
89. Lawn JE, Kerber K, Enweronu-Laryea C, Cousens S. 3.6 Million Neonatal Deaths-What Is Progressing
and What Is Not? Semin Perinatol 2010; 34(6): 371-86.
90. Maternal and Child Health Unit, Department of Health Western Australia. WA Midwives Notification
System. Western Australias Mothers and Babies summary information. 2019.
https://ww2.health.wa.gov.au/Reports-and-publications/Western-Australias-Mothers-and-Babies-
summary-information/data?report=mns_mort_y.
91. Steer P. The epidemiology of preterm labour. BJOG 2005; 112 Suppl 1: 1-3.
92. Lawn JE, Gravett MG, Nunes TM, Rubens CE, Stanton C, Grp GR. Global report on preterm birth and
stillbirth (1 of 7): definitions, description of the burden and opportunities to improve data. BMC
Pregnancy Childbirth 2010; 10.
93. Menon R. Spontaneous preterm birth, a clinical dilemma: etiologic, pathophysiologic and genetic
heterogeneities and racial disparity. Acta Obstet Gynecol Scand 2008; 87(6): 590-600.
94. National Institute for Health and Care Excellence (NICE). Preterm labour and birth (NICE Guideline
25). 2015. https://www.nice.org.uk/guidance/ng25/resources/preterm-labour-and-birth-pdf-
1837333576645 (accessed Nov 2019).
95. Goldenberg RL, Culhane JF, Iams JD, Romero R. Epidemiology and causes of preterm birth. Lancet
2008; 371(9606): 75-84.
96. Blencowe H, Cousens S, Chou D, et al. Born too soon: the global epidemiology of 15 million preterm
births. Reprod Health 2013; 10 Suppl 1: S2.
97. Liu L, Oza S, Hogan D, et al. Global, regional, and national causes of under-5 mortality in 2000-15: an
updated systematic analysis with implications for the Sustainable Development Goals. Lancet 2016;
388(10063): 3027-35.
98. Blencowe H, Cousens S, Oestergaard MZ, et al. National, regional, and worldwide estimates of
preterm birth rates in the year 2010 with time trends since 1990 for selected countries: a systematic
analysis and implications. Lancet 2012; 379(9832): 2162-72.
99. Chawanpaiboon S, Vogel JP, Moller AB, et al. Global, regional, and national estimates of levels of
preterm birth in 2014: a systematic review and modelling analysis. Lancet Glob Health 2019; 7(1):
e37-e46.
100. Zeitlin J, Szamotulska K, Drewniak N, et al. Preterm birth time trends in Europe: a study of 19
countries. BJOG 2013; 120(11): 1356-65.

REFERENCES
PAGE | 191
101. Witt WP, Cheng ER, Wisk LE, et al. Preterm birth in the United States: the impact of stressful life
events prior to conception and maternal age. Am J Public Health 2014; 104 Suppl 1: S73-80.
102. Patel R, Steer P, Doyle P, Little M, Elliott P. Does gestation vary by ethnic group? A London-based
study of over 122 000 pregnancies with spontaneous onset of labour. Int J Epidemiol 2004; 33(1):
107-13.
103. Allen MC, Alexander GR, Tompkins ME, Hulsey TC. Racial differences in temporal changes in
newborn viability and survival by gestational age. Paediatr Perinat Epidemiol 2000; 14(2): 152-8.
104. Lawn JE, Davidge R, Paul VK, et al. Born too soon: care for the preterm baby. Reprod Health 2013; 10
Suppl 1: S5.
105. Delnord M, Blondel B, Zeitlin J. What contributes to disparities in the preterm birth rate in European
countries? Curr Opin Obstet Gyn 2015; 27(2): 133-42.
106. Purisch SE, Gyamfi-Bannerman C. Epidemiology of preterm birth. Semin Perinatol 2017; 41(7): 387-
91.
107. Burger RJ, Temmink JD, Wertaschnigg D, et al. Trends in singleton preterm birth in Victoria, 2007 to
2017: A consecutive cross-sectional study. Acta Obstet Gynecol Scand 2020.
108. Verburg PE, Dekker GA, Venugopal K, et al. Long-term Trends in Singleton Preterm Birth in South
Australia From 1986 to 2014. Obstet Gynecol 2018; 131(1): 79-89.
109. Hammond G, Langridge A, Leonard H, et al. Changes in risk factors for preterm birth in Western
Australia 1984-2006. BJOG 2013; 120(9): 1051-60.
110. The Western Australian Preterm Birth Prevention Initiative. The Whole Nine Months-Lasts a Lifetime
2014. http://www.thewholeninemonths.com.au/wp-content/uploads/2014/11/Health-Professional-
Booklet-final-Nov14.pdf.
111. Newnham JP, White SW, Meharry S, et al. Reducing preterm birth by a statewide multifaceted
program: an implementation study. Am J Obstet Gynecol 2017; 216(5): 434-42.
112. Kramer MS. Determinants of low birth weight : methodological assessment and meta-analysis; 1987.
113. World Health Organization., UNICEF. Low birthweight : country, regional and global estimates.
Geneva: World Health Organization; 2004.
114. Blencowe H, Krasevec J, de Onis M, et al. National, regional, and worldwide estimates of low
birthweight in 2015, with trends from 2000: a systematic analysis. Lancet Glob Health 2019; 7(7):
e849-e60.

REFERENCES
PAGE | 192
115. Australian institute of Health and Welfare. Children’s Headline Indicators- 3. Low Birthweight. 2018.
https://www.aihw.gov.au/reports/children-youth/childrens-headline-indicators/contents/3-low-
birthweight.
116. Bhugra D. Migration, distress and cultural identity. Br Med Bull 2004; 69: 129-41.
117. World Economic Forum. Migration and Its Impact on Cities. Oct 2017.
http://www3.weforum.org/docs/Migration_Impact_Cities_report_2017_HR.pdf (accessed 30 Oct
2017.
118. United Nations, Department of Economic and Social Affairs, Population Division (2017). International
Migration Report 2017: Highlights (ST/ESA/SER.A/404).
http://www.un.org/en/development/desa/population/migration/publications/migrationreport/docs
/MigrationReport2015_Highlights.pdf).
119. United Nations Department of Economic and Social Affairs. Cross-national comparisons of internal
migration: An update on global patterns and trends. 2013.
http://www.un.org/en/development/desa/population/publications/pdf/technical/TP2013-1.pdf.
120. Watts N, Amann M, Ayeb-Karlsson S, et al. The Lancet Countdown on health and climate change:
from 25 years of inaction to a global transformation for public health. Lancet 2017.
121. Nabi F. The impact of the migration on psychosocial well-being: A study of Kurdish refugees in
resettlement country. J Community Med Health Educ 2014; 4: 273.
122. International Organization for Migration. World Migration Report 2020. 2019. https://www.un-
ilibrary.org/content/publication/b1710e30-en.
123. Bhugra D. Migration and mental health. Acta Psychiatr Scand 2004; 109(4): 243-58.
124. Australian Bureau of Statistics. Characteristics of Recent Migrants. Cat No: 62500. Australia; Nov
2010.
125. Gordon M. The Nature of Assimilation. Assimilation in American Life. New York: Oxford University
Press; 1964: 60-83.
126. Redfield R, Linton R, Herskov MJ. Memorandum for the study of acculturation. American
Anthropologist 1936; 38: 149-52.
127. Greenman E, Xie Y. Is Assimilation Theory Dead? The Effect of Assimilation on Adolescent Well-
Being. Soc Sci Res 2008; 37(1): 109-37.
128. Wallace PM, Pomery EA, Latimer AE, Martinez JL, Salovey P. A Review of Acculturation Measures
and Their Utility in Studies Promoting Latino Health. Hisp J Behav Sci 2010; 32(1): 37-54.

REFERENCES
PAGE | 193
129. Berry JW. Immigration, acculturation, and adaptation. Appl Psychol-Int Rev 1997; 46(1): 5-34.
130. Kuo BC, Roysircar G. Predictors of acculturation for Chinese adolescents in Canada: Age of arrival,
length of stay, social class, and English reading ability. Journal of Multicultural Counselling and
Development 2004; 32: 143-54.
131. Williams JA, Ortega ST. Dimensions of Ethnic-Assimilation - an Empirical Appraisal of Gordon
Typology. Soc Sci Quart 1990; 71(4): 697-710.
132. Siew-Ean K. Chapter 6: Intermarriage, Integration and Multiculturalism: A Demographic Perspective.
In: Clyne M, ed. Multiculturalism and Integration: A Harmonious Relationship
Canberra 2011.
133. Australian Bureau of Statistics. Cat. No: 3412.0-Migration, Australia, 2018-19. . 2020.
https://www.abs.gov.au/ausstats/[email protected]/Latestproducts/3412.0Main%20Features32018-
19?opendocument&tabname=Summary&prodno=3412.0&issue=2018-19&num=&view=.
134. Kukutai T, MPawar S. A Socio-demographic Profile of Maori in Australia, NIDEA Working PapersNo.3,
University of Waikato, National Institute of Demographic and Economic Analysis. 2013.
https://poseidon01.ssrn.com/delivery.php?ID=6771190210860980011110061141161270881270080
49065074002106110009027029109077123094073029003016045000030051091114080023125112
08405704209403507206500700412107308712403108903208602502210611907508708200509408
1093102088105096027004090080079102073107106106013&EXT=pdf.
135. Office of Multicultural Interests. Government of Western Australia. Cultural Diversity in Western
Australia: A Demographic Profile. 2013.
https://www.omi.wa.gov.au/Resources/Publications/Documents/Diversity/Cultural_Diversity_2013.
pdf.
136. Australian Bureau of Statistics. 2016 Census QuickStats: Western Australia. Updated July 2018.
http://www.censusdata.abs.gov.au/census_services/getproduct/census/2016/quickstat/5?opendoc
ument.
137. Hamer P. One in Six? The Rapid Growth of the Māori Population in Australia. New Zealand
Population Review 2008; 33/34: . 153-76.
138. Farkas L. Analysis and comparative review of equality data collection practices in the European
Union- Data collection in the field of ethnicity. 2017.
https://ec.europa.eu/newsroom/just/document.cfm?action=display&doc_id=45791.
139. Government of Western Australia. Guidelines for Midwives-Notification of Case Attended.How to
complete and submit Form 2 – Health (Notification by Midwives) Regulations 1994. 2015.

REFERENCES
PAGE | 194
https://ww2.health.wa.gov.au/~/media/Files/Corporate/general%20documents/Data%20collection/
PDF/Guidelines_Completion_of_NOCA_201607.pdf.
140. Mantell CD, Craig ED, Stewart AW, Ekeroma AJ, Mitchell EA. Ethnicity and birth outcome: New
Zealand trends 1980-2001: Part 2. Pregnancy outcomes for Maori women. Aust N Z J Obstet
Gynaecol 2004; 44(6): 537-40.
141. Schulpen TW, van Wieringen JC, van Brummen PJ, et al. Infant mortality, ethnicity, and genetically
determined disorders in The Netherlands. Eur J Public Health 2006; 16(3): 291-4.
142. Australian Bureau of Statistics. Cat. No:1200.0.55.009-Ancestry Standard 2014-Version 2.1.
https://www.abs.gov.au/ausstats/[email protected]/PrimaryMainFeatures/1200.0.55.009?OpenDocument.
143. The UK Government Statistical Service. GSS Harmonised Principle-Ethnic Group. 2017.
https://gss.civilservice.gov.uk/wp-content/uploads/2019/04/Ethnic-Group-June-17.pdf.
144. Australian Institute of Health and Welfare 2016. Australia’s health 2016. Australia’s health series no.
15. Cat. no. AUS 199. Canberra: AIHW. 2016. https://www.aihw.gov.au/getmedia/9844cefb-7745-
4dd8-9ee2-f4d1c3d6a727/19787-AH16.pdf.aspx?inline=true.
145. Braveman P, Gottlieb L. The social determinants of health: it's time to consider the causes of the
causes. Public Health Rep 2014; 129 Suppl 2: 19-31.
146. Juarez SP, Revuelta-Eugercios BA. Exploring the 'Healthy Migrant Paradox' in Sweden. A Cross
Sectional Study Focused on Perinatal Outcomes. J Immigr Minor Health 2016; 18(1): 42-50.
147. McDonald JT, Kennedy S. Insights into the 'healthy immigrant effect': health status and health
service use of immigrants to Canada. Soc Sci Med 2004; 59(8): 1613-27.
148. Miller LS, Robinson JA, Cibula DA. Healthy Immigrant Effect: Preterm Births Among Immigrants and
Refugees in Syracuse, NY. Maternal & Child Health Journal 2016; 20(2): 484-93.
149. Marmot M. Review of social determinants and the health divide in the WHO European Region: final
report. 2014.
150. Bhopal RS. MIGRATION, ETHNICITY, RACE AND HEALTH. MIGRATION, ETHNICITY, RACE AND HEALTH
IN MULTICULTURAL SOCIETIES, OXFORD UNIVERSITY Public Health Panorama; 2016. p. 548-59.
151. Stringhini S, Sabia S, Shipley M, et al. Association of socioeconomic position with health behaviors
and mortality. JAMA 2010; 303(12): 1159-66.
152. Castaneda H, Holmes SM, Madrigal DS, Young ME, Beyeler N, Quesada J. Immigration as a social
determinant of health. Annu Rev Public Health 2015; 36: 375-92.

REFERENCES
PAGE | 195
153. CSDH (2008). Closing the gap in a generation: health equity through action on the social
determinants of health. Final Report of the Commission on Social Determinants of Health. Geneva,
World Health Organization.
154. Australian Government Department of Human Services. Newly arrived resident's waiting period.
https://www.humanservices.gov.au/individuals/topics/newly-arrived-residents-waiting-
period/30726 (accessed 14 September 2019).
155. Australian Government Department of Employment. Australian Labour Market Update—July 2017.
https://docs.employment.gov.au/system/files/doc/other/july_2017_almu.pdf.
156. Nybo Andersen AM, Gundlund A, Villadsen SF. Stillbirth and congenital anomalies in migrants in
Europe. Best Pract Res Clin Obstet Gynaecol 2016; 32: 50-9.
157. Yelland J, Riggs E, Szwarc J, et al. Compromised communication: a qualitative study exploring Afghan
families and health professionals’ experience of interpreting support in Australian maternity care.
BMJ Quality & Safety 2016; 25(4): e1-e.
158. Esscher A, Binder-Finnema P, Bodker B, Hogberg U, Mulic-Lutvica A, Essen B. Suboptimal care and
maternal mortality among foreign-born women in Sweden: maternal death audit with application of
the 'migration three delays' model. BMC Pregnancy Childbirth 2014; 14: 141.
159. Drysdale H, Ranasinha S, Kendall A, Knight M, Wallace EM. Ethnicity and the risk of late-pregnancy
stillbirth. Med J Aust 2012; 197(5): 278-81.
160. Craig ED, Mitchell EA, Stewart AW, Mantell CD, Ekeroma AJ. Ethnicity and birth outcome: New
Zealand trends 1980-2001: Part 4. Pregnancy outcomes for European/other women. Aust N Z J
Obstet Gynaecol 2004; 44(6): 545-8.
161. Anderson NH, Sadler LC, Stewart AW, Fyfe EM, McCowan LM. Ethnicity, body mass index and risk of
pre-eclampsia in a multiethnic New Zealand population. Aust N Z J Obstet Gynaecol 2012; 52(6):
552-8.
162. Dahlen HG, Schmied V, Dennis CL, Thornton C. Rates of obstetric intervention during birth and
selected maternal and perinatal outcomes for low risk women born in Australia compared to those
born overseas. BMC Pregnancy Childbirth 2013; 13: 100.
163. Newnham JP, Sahota DS, Zhang CY, et al. Preterm birth rates in Chinese women in China, Hong Kong
and Australia - The price of Westernisation. Aust New Zealand J Obstet Gynaecol 2011; 51(5): 426-
31.

REFERENCES
PAGE | 196
164. Bollini P, Pampallona S, Wanner P, Kupelnick B. Pregnancy outcome of migrant women and
integration policy: a systematic review of the international literature. Soc Sci Med 2009; 68(3): 452-
61.
165. David M, Pachaly J, Vetter K. Perinatal outcome in Berlin (Germany) among immigrants from Turkey.
Arch Gynecol Obstet 2006; 274(5): 271-8.
166. Cornel M, Houwink E, Houwink P. Information should be given on consanguinity as a risk factor for
congenital malformations. Ned Tijdschr Geneeskd 2014; 158(5).
167. Kwon S, Bower C, English D. Birth defects in the offspring of non-Caucasian, non-Indigenous women
in Western Australia. Birth Defects Res A Clin Mol Teratol 2003; 67(7): 515-21.
168. Thomas PE, Beckmann M, Gibbons K. The effect of cultural and linguistic diversity on pregnancy
outcome. Aust N Z J Obstet Gynaecol 2010; 50(5): 419-22.
169. Reime B, Lindwedel U, Ertl KM, Jacob C, Schucking B, Wenzlaff P. Does underutilization of prenatal
care explain the excess risk for stillbirth among women with migration background in Germany?
Acta Obstet Gynecol Scand 2009; 88(11): 1276-83.
170. Garcia-Subirats I, Perez G, Rodriguez-Sanz M, Salvador J, Jane M. Recent immigration and adverse
pregnancy outcomes in an urban setting in Spain. Matern Child Health J 2011; 15(5): 561-9.
171. Shafiei T, Small R, McLachlan H. Women's views and experiences of maternity care: a study of
immigrant Afghan women in Melbourne, Australia. Midwifery 2012; 28(2): 198-203.
172. Niner S, Kokanovic R, Cuthbert D. Displaced mothers: birth and resettlement, gratitude and
complaint. Med Anthropol 2013; 32(6): 535-51.
173. Stapleton H, Murphy R, Correa-Velez I, Steel M, Kildea S. Women from refugee backgrounds and
their experiences of attending a specialist antenatal clinic. Narratives from an Australian setting.
Women Birth 2013; 26(4): 260-6.
174. Fozdar F, Hartley L. Refugees in Western Australia: Settlement and Integration. 2010.
http://library.bsl.org.au/jspui/bitstream/1/5051/1/FozdarF_Refugees-in-Western-Australia-
settlement-and-integration_MMRCI-2012.pdf.
175. Riggs E, Davis E, Gibbs L, et al. Accessing maternal and child health services in Melbourne, Australia:
reflections from refugee families and service providers. BMC Health Serv Res 2012; 12: 117.
176. Gibson-Helm M, Boyle J, Cheng IH, East C, Knight M, Teede H. Maternal health and pregnancy
outcomes among women of refugee background from Asian countries. Int J Gynecol Obstet 2015;
129(2): 146-51.

REFERENCES
PAGE | 197
177. Murray L, Windsor C, Parker E, Tewfik O. The experiences of African women giving birth in Brisbane,
Australia. Health Care Women Int 2010; 31(5): 458-72.
178. Yuan B, Qian X, Thomsen S. Disadvantaged populations in maternal health in China who and why?
Glob Health Action 2013; 6: 19542.
179. Binder P, Johnsdotter S, Essen B. Conceptualising the prevention of adverse obstetric outcomes
among immigrants using the 'three delays' framework in a high-income context. Soc Sci Med 2012;
75(11): 2028-36.
180. Suphanchaimat R, Kantamaturapoj K, Putthasri W, Prakongsai P. Challenges in the provision of
healthcare services for migrants: a systematic review through providers' lens. BMC Health Serv Res
2015; 15: 390.
181. Son J. Assimilation and health service utilization of Korean immigrant women. Qual Health Res 2013;
23(11): 1528-40.
182. Hennegan J, Redshaw M, Miller Y. Born in another country: Women's experience of labour and birth
in Queensland, Australia. Women Birth 2014; 27(2): 91-7.
183. Small RYJLJBSLP. Immigrant women's views about care during labor and birth: An Australian study of
Vietnamese, Turkish, and Filipino women. Birth 2002; 29(4): 266-77.
184. Carolan M, Cassar L. Antenatal care perceptions of pregnant African women attending maternity
services in Melbourne, Australia. Midwifery 2010; 26(2): 189-201.
185. Harris R, Robson B, Curtis E, Purdie G, Cormack D, Reid P. Maori and non-Maori differences in
caesarean section rates: a national review. N Z Med J 2007; 120(1250): U2444.
186. Anderson NH, Sadler LC, Stewart AW, Fyfe EM, McCowan LM. Ethnicity and risk of caesarean section
in a term, nulliparous New Zealand obstetric cohort. Aust N Z J Obstet Gynaecol 2013; 53(3): 258-64.
187. Vangen S, Stoltenberg C, Skrondal A, Magnus P, Stray-Pedersen B. Cesarean section among
immigrants in Norway. Acta Obstet Gynecol Scand 2000; 79(7): 553-8.
188. Sorbye IK, Daltveit AK, Sundby J, Stoltenberg C, Vangen S. Caesarean section by immigrants' length
of residence in Norway: a population-based study. European Journal of Public Health 2015; 25(1):
78-84.
189. Ma J, Bauman A. Obstetric profiles and pregnancy outcomes of immigrant women in New South
Wales, 1990-1992. Aust N Z J Obstet Gynaecol 1996; 36(2): 119-25.

REFERENCES
PAGE | 198
190. Barcelona de Mendoza V, Harville E, Theall K, Buekens P, Chasan-Taber L. Acculturation and Adverse
Birth Outcomes in a Predominantly Puerto Rican Population. Matern Child Health J 2016; 20(6):
1151-60.
191. Callister LC, Birkhead A. Acculturation and perinatal outcomes in Mexican immigrant childbearing
women: an integrative review. J Perinat Neonatal Nurs 2002; 16(3): 22-38.
192. English PB, Kharrazi M, Guendelman S. Pregnancy outcomes and risk factors in Mexican Americans:
the effect of language use and mother's birthplace. Ethn Dis 1997; 7(3): 229-40.
193. Urquia ML, Frank JW, Moineddin R, Glazier RH. Immigrants' duration of residence and adverse birth
outcomes: a population-based study. BJOG 2010; 117(5): 591-601.
194. Vik ES, Aasheim V, Schytt E, Small R, Moster D, Nilsen RM. Stillbirth in relation to maternal country
of birth and other migration related factors: a population-based study in Norway. BMC Pregnancy
Childbirth 2019; 19(1): 5.
195. Reiss K, Breckenkamp J, Borde T, Brenne S, David M, Razum O. Smoking during pregnancy among
Turkish immigrants in Germany-are there associations with acculturation? Nicotine Tob Res 2015;
17(6): 643-52.
196. Detjen MG, Nieto FJ, Trentham-Dietz A, Fleming M, Chasan-Taber L. Acculturation and cigarette
smoking among pregnant hispanic women residing in the United States. Am J Public Health 2007;
97(11): 2040-7.
197. Bartsch E, Park AL, Pulver AJ, Urquia ML, Ray JG. Maternal and paternal birthplace and risk of
stillbirth. J Obstet Gynaecol Can 2015; 37(4): 314-23.
198. Liu Y, Zhang J, Li Z. Perinatal outcomes in native Chinese and Chinese-American women. Paediatr
Perinat Epidemiol 2011; 25(3): 202-9.
199. Martinson ML, Tienda M, Teitler JO. Low birthweight among immigrants in Australia, the United
Kingdom, and the United States. Soc Sci Med 2017; 194: 168-76.
200. Zlot AI, Jackson DJ, Korenbrot C. Association of acculturation with cesarean section among Latinas.
Matern Child Health J 2005; 9(1): 11-20.
201. United Nations Economic Commission for Europe. Register-vi based statistics in the nordic countries,
review of best practice with focus on population and social statistics. 2007.
http://www.unece.org/fileadmin/DAM/stats/publications/Register_based_statistics_in_Nordic_cou
ntries.pdf.

REFERENCES
PAGE | 199
202. Data Linkage Branch- WA Department of Health. WA Data Linkage System. 2020.
https://www.datalinkage-wa.org.au/about/.
203. Bohensky MA, Jolley D, Sundararajan V, et al. Data linkage: a powerful research tool with potential
problems. BMC Health Serv Res 2010; 10: 346.
204. Holman CD, Bass AJ, Rosman DL, et al. A decade of data linkage in Western Australia: strategic
design, applications and benefits of the WA data linkage system. Aust Health Rev 2008; 32(4): 766-
77.
205. Delgado-Rodriguez M, Llorca J. Bias. J Epidemiol Community Health 2004; 58(8): 635-41.
206. Hammer GP, du Prel JB, Blettner M. Avoiding bias in observational studies: part 8 in a series of
articles on evaluation of scientific publications. Dtsch Arztebl Int 2009; 106(41): 664-8.
207. Stanley F, Croft M, Gibbins J, Read A. A population database for maternal and child health research
in Western Australia using record linkage. Paediatr Perinat Epidemiol 1994; 8(4): 433-47.
208. Stanley F, Read A, Kurinczuk J, Croft M, Bower C. A population maternal and child health research
database for research and policy evaluation in Western Australia. Semin Neonatol 1997; 2(3): 195-
201.
209. Deeny S, Steventon A. Making sense of the shadows: Priorities for creating a learning healthcare
system based on routinely collected data. BMJ Qual Saf 2015; 24(8): 505-15.
210. Boyd JH, Ferrante AM, O'Keefe CM, Bass AJ, Randall SM, Semmens JB. Data linkage infrastructure for
cross-jurisdictional health-related research in Australia. BMC Health Serv Res 2012; 12: 480.
211. Holman CD, Bass AJ, Rouse IL, Hobbs MS. Population-based linkage of health records in Western
Australia: development of a health services research linked database. Aust N Z J Public Health 1999;
23(5): 453-9.
212. WA Data Linkage Branch. Data linkage– making the right connections 2016.
https://www.datalinkage-wa.org.au/wp-content/uploads/2019/02/Data-Linkage-Branch-Linkage-
Quality.pdf.
213. Kelman C, Bass A, Holman C. Research use of linked health data - A best practice protocol. Aust New
Zealand J Public Health 2002; 26(3): 251-5.
214. Silveira DP, Artmann E. Accuracy of probabilistic record linkage applied to health databases:
systematic review. Rev Saude Publica 2009; 43(5): 875-82.
215. WA Data Linkage Branch. Midwives notifications: linkage quality statement. 2017.
https://www.datalinkage-wa.org.au/wp-content/uploads/2019/06/mns_quality.pdf.

REFERENCES
PAGE | 200
216. data Linkage Branch- WA Department of Health. Privacy. https://www.datalinkage-
wa.org.au/privacy-and-ethics/privacy.
217. Data Linkage Branch- WA Department of Health. Security. https://www.datalinkage-
wa.org.au/privacy-and-ethics/security.
218. data Linkage Branch- WA Department of Health. Geocoding. https://www.datalinkage-
wa.org.au/dlb-services/geocoding.
219. Pink B. An introduction to Socio-Economic Indexes for Areas (SEIFA)- Technical paper 2006. 2008.
https://www.ausstats.abs.gov.au/ausstats/subscriber.nsf/0/D729075E079F9FDECA2574170011B08
8/$File/20390_2006.pdf.
220. Department of Health and Aged Care. Occasional Papers: New Series No 14. Measuring Remoteness:
Accessibility/Remoteness Index of Australia (ARIA). October 2001.
http://www.health.gov.au/internet/main/publishing.nsf/Content/E2EE19FE831F26BFCA257BF0001F
3DFA/$File/ocpanew14.pdf
221. Department of Health and Aged Care. Measuring Remoteness: Accessibility/Remoteness Index of
Australia (ARIA). 2001.
https://www1.health.gov.au/internet/main/publishing.nsf/Content/E2EE19FE831F26BFCA257BF000
1F3DFA/$File/ocpanew14.pdf.
222. Australian bureau of Statistics. Australian Statistical Geography Standard (ASGS): Volume 5 -
Remoteness Structure (cat. no. 1270.0.55.005). 2016.
https://www.abs.gov.au/websitedbs/D3310114.nsf/home/remoteness+structure.
223. Glasson EJ, de Klerk NH, Bass AJ, Rosman DL, Palmer LJ, Holman CD. Cohort profile: The Western
Australian Family Connections Genealogical Project. Int J Epidemiol 2008; 37(1): 30-5.
224. Government of Western Australia. WA Health Act 1911-Reprint 16. 2013.
https://www.legislation.wa.gov.au/legislation/prod/filestore.nsf/FileURL/mrdoc_25565.pdf/$FILE/H
ealth%20Act%201911%20-%20%5B16-a0-01%5D.pdf?OpenElement.
225. Mahase E. An estimated one in seven babies is born with a low birthweight. BMJ 2019; 365: l2210.
226. Government of Western Australia Department of Health. Hospital Morbidity Data System
REFERENCE MANUAL PART A: Contacts, Hospital Responsibilities, Data Element Definitions.JULY
2017 V1.0
https://ww2.health.wa.gov.au/~/media/Files/Corporate/general%20documents/Clinical%20coding/
Guides%20and%20summaries/HMDS-REF-Manual-PartA.pdf.
REFERENCES
PAGE | 201
227. Australian Institute of Health and Welfare 2015. National Health Data Dictionary: version 16.2.
National Health Data Dictionary series. Cat. no.HWI 131. Canberra: AIHW.
228. Bower C, Rudy E, Quick J, Rowley A, Watson L, Cosgrove P. Report of the Western Australian Register
of Developmental Anomalies 1980-2012. ISSN 2200-8837: King Edward Memorial Hospital, 2014.
229. Ballestas T. ,on behalf of the Perinatal and Infant Mortality Committee of Western Australia.The
14th Report of the Perinatal and Infant Mortality Committee of Western Australia for deaths in the
triennium 2008-2010. Perth: Department of Health WA 2014.
https://ww2.health.wa.gov.au/~/media/Files/Corporate/Reports%20and%20publications/Perinatal
%20infant%20and%20maternal/12781_the_14th_perinatal_report.pdf.
230. WHO: recommended definitions, terminology and format for statistical tables related to the
perinatal period and use of a new certificate for cause of perinatal deaths. Modifications
recommended by FIGO as amended October 14, 1976. Acta Obstet Gynecol Scand 1977; 56(3): 247-
53.
231. Ogwulu CB, Jackson LJ, Heazell AEP, Roberts TE. Exploring the intangible economic costs of stillbirth.
BMC Pregnancy Childbirth 2015; 15(1): 188.
232. Heazell AE, Siassakos D, Blencowe H, et al. Stillbirths: economic and psychosocial consequences.
Lancet 2016; 387(10018): 604-16.
233. Khalil A, Rezende J, Akolekar R, Syngelaki A, Nicolaides KH. Maternal racial origin and adverse
pregnancy outcome: a cohort study. Ultrasound Obstet Gynecol 2013; 41(3): 278-85.
234. Australian Bureau of Statistics. Population Density, Cat. 3218.0 Regional Population Growth,
Australia 2016.
https://www.abs.gov.au/ausstats/[email protected]/Previousproducts/3218.0Main%20Features752016
(accessed December 2019).
235. Downey F. A validation study of the Western Australian Midwives’ Notification System. 2005 data.
Perth: Department of Health, Western Australia.;. 2007.
mhttps://ww2.health.wa.gov.au/~/media/Files/Corporate/general%20documents/Data%20collectio
n/PDF/Midwives_Validation_Study_2007.pdf (accessed June 2018.
236. Gulmezoglu AM, Crowther CA, Middleton P, Heatley E. Induction of labour for improving birth
outcomes for women at or beyond term. Cochrane Database Syst Rev 2012; (6): CD004945.
237. Caughey AB, Stotland NE, Washington AE, Escobar GJ. Who is at risk for prolonged and postterm
pregnancy? Am J Obstet Gynecol 2009; 200(6): 683 e1-5.

REFERENCES
PAGE | 202
238. Deyo NS. "Cultural Traditions and the Reproductive Health of Somali Refugees and Immigrants"
[Master's]: University of San Francisco; 2012.
239. Ratima M, Crengle S. Antenatal, Labour, and Delivery Care for Maori: Experiences, Location within a
Lifecourse Approach, and Knowledge Gaps*. 2013; 2013.
240. Pol LG, Thomas RK. The Demography of Health and Healthcare. 3rd ed. Dordrecht: Springer
Netherlands
2013.
241. Mozooni M, Preen DB, Pennell CE. Stillbirth in Western Australia, 2005-2013: the influence of
maternal migration and ethnic origin. Med J Aust 2018; 209(9): 394-400.
242. Jayaweera H, Quigley MA. Health status, health behaviour and healthcare use among migrants in the
UK: evidence from mothers in the Millennium Cohort Study. Soc Sci Med 2010; 71(5): 1002-10.
243. Chote AA, Koopmans GT, Redekop WK, et al. Explaining ethnic differences in late antenatal care
entry by predisposing, enabling and need factors in The Netherlands. The Generation R Study.
Matern Child Health J 2011; 15(6): 689-99.
244. Guevarra MV, Stubbs JM, Assareh H, Achat HM. Risk factors associated with late entry to antenatal
care visits in NSW in 2014. Aust N Z J Public Health 2017; 41(5): 543-4.
245. Government of Western Australia. Hospital Morbidity Data System. REFERENCE MANUAL PART A:
Contacts, Hospital Responsibilities,Data Element Definitions.V1.0. 2017.
246. Australian Institute of Health and Welfare. My Local Area Hospitals. 2019.
https://www.aihw.gov.au/reports-data/myhospitals/my-local-area/hospitals.
247. Gee V. Perinatal, Infant and Maternal Mortality in Western Australia, 2006-2010. 2013.
https://ww2.health.wa.gov.au/~/media/Files/Corporate/Reports%20and%20publications/Perinatal
%20infant%20and%20maternal/Perinatal_Infant_Maternal_Mortality_WA_2006-2010.pdf.
248. Moller AB, Petzold M, Chou D, Say L. Early antenatal care visit: a systematic analysis of regional and
global levels and trends of coverage from 1990 to 2013. Lancet Glob Health 2017; 5(10): e977-e83.
249. Ananth CV, Schisterman EF. Confounding, causality, and confusion: the role of intermediate
variables in interpreting observational studies in obstetrics. Am J Obstet Gynecol 2017; 217(2): 167-
75.
250. VanderWeele TJ, Mumford SL, Schisterman EF. Conditioning on intermediates in perinatal
epidemiology. Epidemiology 2012; 23(1): 1-9.

REFERENCES
PAGE | 203
251. Adams N, Tudehope D, Gibbons KS, Flenady V. Perinatal mortality disparities between public care
and private obstetrician-led care: a propensity score analysis. BJOG 2018; 125(2): 149-58.
252. Bursac Z, Gauss CH, Williams DK, Hosmer DW. Purposeful selection of variables in logistic regression.
Source Code Biol Med 2008; 3: 17.
253. Gould JB, Madan A, Qin C, Chavez G. Perinatal outcomes in two dissimilar immigrant populations in
the United States: a dual epidemiologic paradox. Pediatrics 2003; 111(6 Pt 1): e676-82.
254. Sparks TN, Cheng YW, McLaughlin B, Esakoff TF, Caughey AB. Fundal height: a useful screening tool
for fetal growth? J Matern Fetal Neonatal Med 2011; 24(5): 708-12.
255. Buck Louis GM, Grewal J, Albert PS, et al. Racial/ethnic standards for fetal growth: the NICHD Fetal
Growth Studies. Am J Obstet Gynecol 2015; 213(4): 449 e1- e41.
256. Anderson NH, Sadler LC, McKinlay CJD, McCowan LME. INTERGROWTH-21st vs customized
birthweight standards for identification of perinatal mortality and morbidity. Am J Obstet Gynecol
2016; 214(4): 509 e1- e7.
257. Villar J, Papageorghiou AT, Pang R, et al. The likeness of fetal growth and newborn size across non-
isolated populations in the INTERGROWTH-21st Project: the Fetal Growth Longitudinal Study and
Newborn Cross-Sectional Study. The lancet Diabetes & endocrinology 2014; 2(10): 781-92.
258. Sovio U, White IR, Dacey A, Pasupathy D, Smith GCS. Screening for fetal growth restriction with
universal third trimester ultrasonography in nulliparous women in the Pregnancy Outcome
Prediction (POP) study: a prospective cohort study. Lancet 2015; 386(10008): 2089-97.
259. Cresswell JA, Yu G, Hatherall B, et al. Predictors of the timing of initiation of antenatal care in an
ethnically diverse urban cohort in the UK. BMC Pregnancy Childbirth 2013; 13: 103.
260. Romero R, Nicolaides KH, Conde-Agudelo A, et al. Vaginal progesterone decreases preterm birth </=
34 weeks of gestation in women with a singleton pregnancy and a short cervix: an updated meta-
analysis including data from the OPPTIMUM study. Ultrasound Obstet Gynecol 2016; 48(3): 308-17.
261. Rolnik DL, Wright D, Poon LC, et al. Aspirin versus Placebo in Pregnancies at High Risk for Preterm
Preeclampsia. N Engl J Med 2017; 377(7): 613-22.
262. Reid C. Interpreter services essential for safe medical practice. Medicus 2017; 57(5): 34.
263. White J, Plompen T, Osadnik C, Tao L, Micallef E, Haines T. The experience of interpreter access and
language discordant clinical encounters in Australian health care: a mixed methods exploration. Int J
Equity Health 2018; 17(1): 151.
REFERENCES
PAGE | 204
264. Phillips CB, Travaglia J. Low levels of uptake of free interpreters by Australian doctors in private
practice: secondary analysis of national data. Aust Health Rev 2011; 35(4): 475-9.
265. Huang Y-T, Phillips C. Telephone interpreters in general practice: bridging the barriers to their use.
Australian Family Physician 2009; 38: 443–6.
266. Phillips C. Using interpreters - a guide for GPs. Australian Family Physician 2010; 39(4): 188-95.
267. Wernham E, Gurney J, Stanley J, Ellison-Loschmann L, Sarfati D. A Comparison of Midwife-Led and
Medical-Led Models of Care and Their Relationship to Adverse Fetal and Neonatal Outcomes: A
Retrospective Cohort Study in New Zealand. PLoS Med Journal Translated Name PLoS Medicine
2016; 13(9): e1002134.
268. Tracy SK. Study claims midwifery care harms babies: A critique of flawed research. Women Birth
2016; 29(6): 471-2.
269. Akl N, Coghlan EA, Nathan EA, Langford SA, Newnham JP. Aeromedical transfer of women at risk of
preterm delivery in remote and rural Western Australia: why are there no births in flight? Aust N Z J
Obstet Gynaecol 2012; 52(4): 327-33.
270. Department of Health Western Australia. Framework for the care of neonates in Western Australia.
2009.
https://ww2.health.wa.gov.au/~/media/Files/Corporate/general%20documents/Health%20Network
s/Womens%20and%20Newborns/Framework-for-the-Care-of-Neonates-in-WA.pdf (accessed
December 2019).
271. Neogi SB, Sharma J, Negandhi P, Chauhan M, Reddy S, Sethy G. Risk factors for stillbirths: how much
can a responsive health system prevent? BMC Pregnancy Childbirth 2018; 18(1): 33.
272. Heller G, Bauer E, Schill S, et al. Decision-to-Delivery Time and Perinatal Complications in Emergency
Cesarean Section. Dtsch Arztebl Int 2017; 114(35-36): 589-96.
273. Abubakar I, Aldridge RW, Devakumar D, et al. The UCL-Lancet Commission on Migration and Health:
the health of a world on the move. Lancet 2018; 392(10164): 2606-54.
274. MacDorman MF, Gregory EC. Fetal and Perinatal Mortality: United States, 2013. Natl Vital Stat Rep
2015; 64(8): 1-24.
275. Villadsen SF, Sievers E, Andersen AM, et al. Cross-country variation in stillbirth and neonatal
mortality in offspring of Turkish migrants in northern Europe. Eur J Public Health 2010; 20(5): 530-5.
276. Horton R, Samarasekera U. Stillbirths: ending an epidemic of grief. Lancet 2016; 387(10018): 515-6.

REFERENCES
PAGE | 205
277. Chang SJ, Im EO. Testing a Theoretical Model of Immigration Transition and Physical Activity. Res
Theory Nurs Pract 2015; 29(3): 177-88.
278. Mozooni M, Pennell CE, Preen DB. Healthcare factors associated with the risk of antepartum and
intrapartum stillbirth in migrants in Western Australia (2005-2013): A retrospective cohort study.
PLoS Med Journal Translated Name PLoS Medicine 2020; 17(3): e1003061.
279. Eitelhuber T, Davis G, Rosman D, Glauert R. Western Australia unveils advances in linked data
delivery systems. Aust N Z J Public Health 2014; 38(4): 397-8.
280. Premkumar A, Debbink MP, Silver RM, et al. Association of Acculturation With Adverse Pregnancy
Outcomes. Obstet Gynecol 2020; 135(2): 301-9.
281. Hoyt AT, Shumate CJ, Canfield MA, et al. Selected acculturation factors and birth defects in the
National Birth Defects Prevention Study, 1997-2011. Birth Defects Res 2019; 111(10): 598-612.
282. Chen L, Shi L, Zhang D, Chao SM. Influence of Acculturation on Risk for Gestational Diabetes Among
Asian Women. Prev Chronic Dis 2019; 16: E158.
283. Australian Bureau of Statistics. Socio-Economic Indexes for Areas (SEIFA) Technical Paper 2016.
https://www.ausstats.abs.gov.au/ausstats/subscriber.nsf/0/756EE3DBEFA869EFCA258259000BA74
6/$File/SEIFA%202016%20Technical%20Paper.pdf.
284. Ukiru JM. Acculturation experience of Africa Immigrants in the United States of America. 2002.
https://scholarworks.lib.csusb.edu/cgi/viewcontent.cgi?referer=https://www.google.com.au/&https
redir=1&article=3128&context=etd-project.
285. Flynn PM, Foster EM, Brost BC. Indicators of acculturation related to Somali refugee women's birth
outcomes in Minnesota. J Immigr Minor Health 2011; 13(2): 224-31.
286. Alhusen JL, Bower KM, Epstein E, Sharps P. Racial Discrimination and Adverse Birth Outcomes: An
Integrative Review. J Midwifery Womens Health 2016; 61(6): 707-20.
287. Delavari M, Sonderlund AL, Swinburn B, Mellor D, Renzaho A. Acculturation and obesity among
migrant populations in high income countries--a systematic review. BMC Public Health 2013; 13:
458.
288. Salant T, Lauderdale DS. Measuring culture: a critical review of acculturation and health in Asian
immigrant populations. Soc Sci Med 2003; 57(1): 71-90.
289. Rogers LK, Velten M. Maternal inflammation, growth retardation, and preterm birth: insights into
adult cardiovascular disease. Life Sci 2011; 89(13-14): 417-21.

REFERENCES
PAGE | 206
290. Murray CJ, Vos T, Lozano R, et al. Disability-adjusted life years (DALYs) for 291 diseases and injuries
in 21 regions, 1990-2010: a systematic analysis for the Global Burden of Disease Study 2010. Lancet
2012; 380(9859): 2197-223.
291. Australian Bureau of Statistics. Census of Population and Housing: Australia Revealed, 2016. Cat No:
2024.0. ABS. 2017. https://www.abs.gov.au/ausstats/[email protected]/mf/2024.0.
292. Garcia R, Ali N, Guppy A, Griffiths M, Randhawa G. Differences in the pregnancy gestation period and
mean birth weights in infants born to Indian, Pakistani, Bangladeshi and white British mothers in
Luton, UK: a retrospective analysis of routinely collected data. Bmj Open 2017; 7(8): e017139.
293. Pennell CE, Jacobsson B, Williams SM, et al. Genetic epidemiologic studies of preterm birth:
guidelines for research. Am J Obstet Gynecol 2007; 196(2): 107-18.
294. Henderson JJ, McWilliam OA, Newnham JP, Pennell CE. Preterm birth aetiology 2004-2008. Maternal
factors associated with three phenotypes: spontaneous preterm labour, preterm pre-labour rupture
of membranes and medically indicated preterm birth. J Matern Fetal Neonatal Med 2012; 25(6):
642-7.
295. Almeida J, Mulready-Ward C, Bettegowda VR, Ahluwalia IB. Racial/Ethnic and nativity differences in
birth outcomes among mothers in New York City: the role of social ties and social support. Matern
Child Health J 2014; 18(1): 90-100.
296. Almeida J, Becares L, Erbetta K, Bettegowda VR, Ahluwalia IB. Racial/Ethnic Inequities in Low Birth
Weight and Preterm Birth: The Role of Multiple Forms of Stress. Matern Child Health J 2018; 22(8):
1154-63.
297. Ratnasiri AWG, Parry SS, Arief VN, et al. Recent trends, risk factors, and disparities in low birth
weight in California, 2005-2014: a retrospective study. Matern Health Neonatol Perinatol 2018; 4:
15.
298. Juarez SP, Revuelta-Eugercios BA. Too heavy, too late: investigating perinatal health outcomes in
immigrants residing in Spain. A cross-sectional study (2009-2011). J Epidemiol Community Health
2014; 68(9): 863-8.
299. Ramraj C, Pulver A, Siddiqi A. Intergenerational transmission of the healthy immigrant effect (HIE)
through birth weight: A systematic review and meta-analysis. Soc Sci Med 2015; 146: 29-40.
300. Racape J, Schoenborn C, Sow M, Alexander S, De Spiegelaere M. Are all immigrant mothers really at
risk of low birth weight and perinatal mortality? The crucial role of socio-economic status. BMC
Pregnancy Childbirth 2016; 16: 75.
REFERENCES
PAGE | 207
301. Shah RR, Ray JG, Taback N, Meffe F, Glazier RH. Adverse pregnancy outcomes among foreign-born
Canadians. J Obstet Gynaecol Can 2011; 33(3): 207-15.
302. Wingate MS, Alexander GR. The healthy migrant theory: variations in pregnancy outcomes among
US-born migrants. Soc Sci Med 2006; 62(2): 491-8.
303. Mozooni M, Preen D, Pennell C. 1.1-O1The ‘Healthy Migrant Phenomenon’: how long does it last?
European Journal of Public Health 2018; 28(suppl_1): cky047.01-cky.01.
304. Mozooni M, Preen DB, Pennell CE. The influence of acculturation on the risk of stillbirth in migrant
women residing in Western Australia. PLoS One 2020; 15(4): e0231106.
305. Pestoni G, Krieger JP, Sych JM, Faeh D, Rohrmann S. Cultural Differences in Diet and Determinants of
Diet Quality in Switzerland: Results from the National Nutrition Survey menuCH. Nutrients 2019;
11(1).
306. Englund-Ogge L, Brantsaeter AL, Juodakis J, et al. Associations between maternal dietary patterns
and infant birth weight, small and large for gestational age in the Norwegian Mother and Child
Cohort Study. Eur J Clin Nutr 2019; 73(9): 1270-82.
307. Garay SM, Savory KA, Sumption L, Penketh R, Janssen AB, John RM. The Grown in Wales Study:
Examining dietary patterns, custom birthweight centiles and the risk of delivering a small-for-
gestational age (SGA) infant. PLoS One 2019; 14(3): e0213412.
308. El-Sayed AM, Galea S. Interethnic mating and risk for preterm birth among Arab-American mothers:
Evidence from the Arab-American Birth Outcomes Study. J Immigr Minor Healt 2011; 13(3): 445-52.
309. Cheng ER, Taveras EM, Hawkins SS. Paternal Acculturation and Maternal Health Behaviors: Influence
of Father's Ethnicity and Place of Birth. J Womens Health (Larchmt) 2018; 27(5): 724-32.
310. David M, Borde T, Brenne S, et al. Obstetric care quality indicators and outcomes based on the
degree of acculturation of immigrants-results from a cross-sectional study in Berlin. Arch Gynecol
Obstet 2018; 297(2): 313-22.
311. Ruiz RJ, Saade GR, Brown CEL, et al. The effect of acculturation on progesterone/estriol ratios and
preterm birth in Hispanics. Obstet Gynecol 2008; 111(2 Pt 1): 309-16.
312. Ruiz RJ, Trzeciakowski J, Moore T, Ayers KS, Pickler RH. Acculturation Predicts Negative Affect and
Shortened Telomere Length. Biol Res Nurs 2017; 19(1): 28-35.
313. Hyman I, Dussault G. The effect of acculturation on low birthweight in immigrant women. Can J
Public Health 1996; 87(3): 158-62.
REFERENCES
PAGE | 208
314. Hyman I, Dussault G. Negative consequences of acculturation on health behaviour, social support
and stress among pregnant Southeast Asian immigrant women in Montreal: an exploratory study.
Can J Public Health 2000; 91(5): 357-60.
315. Pedersen GS, Mortensen LH, Gerster M, Rich-Edwards J, Andersen AM. Preterm birth and
birthweight-for-gestational age among immigrant women in Denmark 1978-2007: a nationwide
registry study. Paediatr Perinat Epidemiol 2012; 26(6): 534-42.
316. Sow M, Schoenborn C, De Spiegelaere M, Racape J. Influence of time since naturalisation on
socioeconomic status and low birth weight among immigrants in Belgium. A population-based study.
PLoS One 2019; 14(8): e0220856.
317. Teitler JO, Hutto N, Reichman NE. Birthweight of children of immigrants by maternal duration of
residence in the United States. Soc Sci Med 2012; 75(3): 459-68.
318. Wells JC, Sharp G, Steer PJ, Leon DA. Paternal and maternal influences on differences in birth weight
between Europeans and Indians born in the UK. PLoS One 2013; 8(5): e61116.
319. Demetriou C, Abu-Amero S, Thomas AC, et al. Paternally expressed, imprinted insulin-like growth
factor-2 in chorionic villi correlates significantly with birth weight. PLoS One 2014; 9(1): e85454.
320. Collins JW, Jr., Rankin KM, David RJ. Paternal Lifelong Socioeconomic Position and Low Birth Weight
Rates: Relevance to the African-American Women's Birth Outcome Disadvantage. Matern Child
Health J 2016; 20(8): 1759-66.
321. Nilsson JE, Brown C, Russell EB, Khamphakdy-Brown S. Acculturation, partner violence, and
psychological distress in refugee women from Somalia. J Interpers Violence 2008; 23(11): 1654-63.
322. El-Murr A. Intimate partner violence in Australian refugee communities. 2018.
https://aifs.gov.au/cfca/sites/default/files/publication-
documents/50_intimate_partner_violence_in_australian_refugee_communities.pdf.
323. Khawaja NG, Milner K. Acculturation stress in South Sudanese refugees: Impact on marital
relationships. International Journal of Intercultural Relations 2012; (36): 624– 36.
324. Giurgescu C. Are maternal cortisol levels related to preterm birth? J Obstet Gynecol Neonatal Nurs
2009; 38(4): 377-90.
325. Ruiz RJ, Pickler RH, Marti CN, Jallo N. Family cohesion, acculturation, maternal cortisol, and preterm
birth in Mexican-American women. Int J Womens Health 2013; 5: 243-52.

REFERENCES
PAGE | 209
326. Nicholson LM, Miller AM, Schwertz D, Sorokin O. Gender differences in acculturation, stress, and
salivary cortisol response among former Soviet immigrants. J Immigr Minor Health 2013; 15(3): 540-
52.
327. Mangold D, Wand G, Javors M, Mintz J. Acculturation, childhood trauma and the cortisol awakening
response in Mexican-American adults. Horm Behav 2010; 58(4): 637-46.
328. Berger M, Leicht A, Slatcher A, et al. Cortisol Awakening Response and Acute Stress Reactivity in First
Nations People. Sci Rep 2017; 7: 41760.
329. Hjort R, Alfredsson L, Carlsson PO, et al. Low birthweight is associated with an increased risk of LADA
and type 2 diabetes: results from a Swedish case-control study. Diabetologia 2015; 58(11): 2525-32.
330. Markopoulou P, Papanikolaou E, Analytis A, Zoumakis E, Siahanidou T. Preterm Birth as a Risk Factor
for Metabolic Syndrome and Cardiovascular Disease in Adult Life: A Systematic Review and Meta-
Analysis. J Pediatr 2019; 210: 69-80 e5.
331. Tanz LJ, Stuart JJ, Williams PL, et al. Preterm Delivery and Maternal Cardiovascular Disease in Young
and Middle-Aged Adult Women. Circulation 2017; 135(6): 578-89.
332. Liu YH, Zhang J, Li Z. Perinatal outcomes in native Chinese and Chinese-American women. Paediatr
Perinat Epidemiol 2011; 25(3): 202-9.
333. Lonhart JA, Mayo JA, Padula AM, Wise PH, Stevenson DK, Shaw GM. Short interpregnancy interval as
a risk factor for preterm birth in non-Hispanic Black and White women in California. Journal of
perinatology : official journal of the California Perinatal Association 2019; 39(9): 1175-81.
334. Perinatal Society of Australia and New Zealand and Centre of Research Excellence Stillbirth. Position
statement: Improving decision-making about the timing of birth for women with risk factors for
stillbirth. . 2019 (accessed September 2019.
335. Rogers HJ, Hogan L, Coates D, Homer CSE, Henry A. Responding to the health needs of women from
migrant and refugee backgrounds-Models of maternity and postpartum care in high-income
countries: A systematic scoping review. Health Soc Care Community 2020.
336. Sexton J, Coory M, Kumar S, et al. Protocol for the development and validation of a risk prediction
model for stillbirths from 35 weeks gestation in Australia (Preprint). 2020.
https://www.researchsquare.com/article/rs-16494/latest.pdf.
337. Dominguez TP, Dunkel-Schetter C, Glynn LM, Hobel C, Sandman CA. Racial differences in birth
outcomes: the role of general, pregnancy, and racism stress. Health Psychol 2008; 27(2): 194-203.
REFERENCES
PAGE | 210
338. Markus A. Mapping Social Cohesion-THE SCANLON FOUNDATION SURVEYS. 2019.
https://scanlonfoundation.org.au/wp-content/uploads/2019/11/Mapping-Social-Cohesion-2019-
FINAL-3.pdf.
339. Ben J, Cormack D, Harris R, Paradies Y. Racism and health service utilisation: A systematic review and
meta-analysis. PLoS One 2017; 12(12): e0189900.
340. Australian Government Department of Human Services. About Medicare.
https://www.humanservices.gov.au/individuals/subjects/whats-covered-medicare/about-medicare.
341. Government of Western Australia. Overview of the WA Health System. 2019.
https://healthywa.health.wa.gov.au/Articles/N_R/Overview-of-the-WA-health-system.
342. Government of Western Australia. Department of Health. Hospital Information. 2019.
https://ww2.health.wa.gov.au/About-us/Hospital-Information.

APPENDICES
211
APPENDICES

APPENDICES
212
APPENDIX 1. PROJECT FEASIBILITY APPROVAL
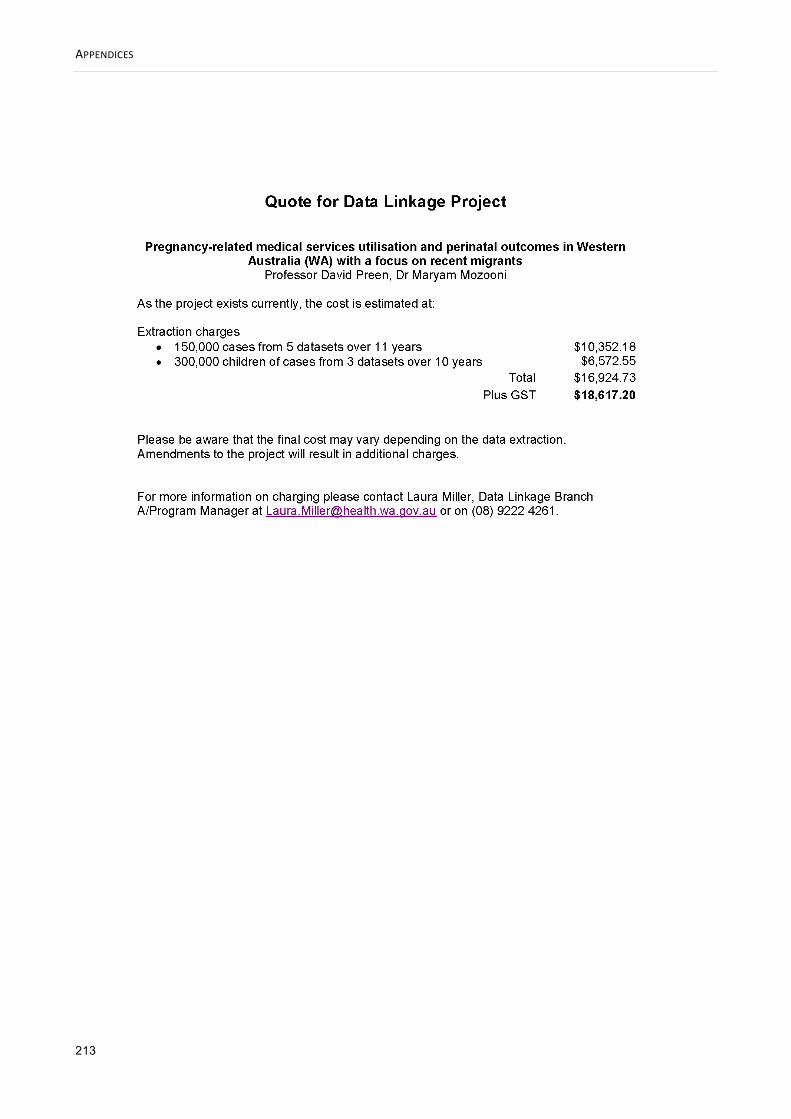
APPENDICES
213

APPENDICES
214
APPENDIX 2. ETHICAL APPROVAL

APPENDICES
215
APPENDICES
216
APPENDIX 3. FINAL PROJECT APPROVAL

APPENDICES
217
APPENDIX 4. UWA NOTIFICATION OF ETHICS APPROVAL FROM ANOTHER ETHICS
COMMITTEE

APPENDICES
218
APPENDIX 5. PUBLISHED PAPER 1 (CHAPTER 4)

APPENDICES
219
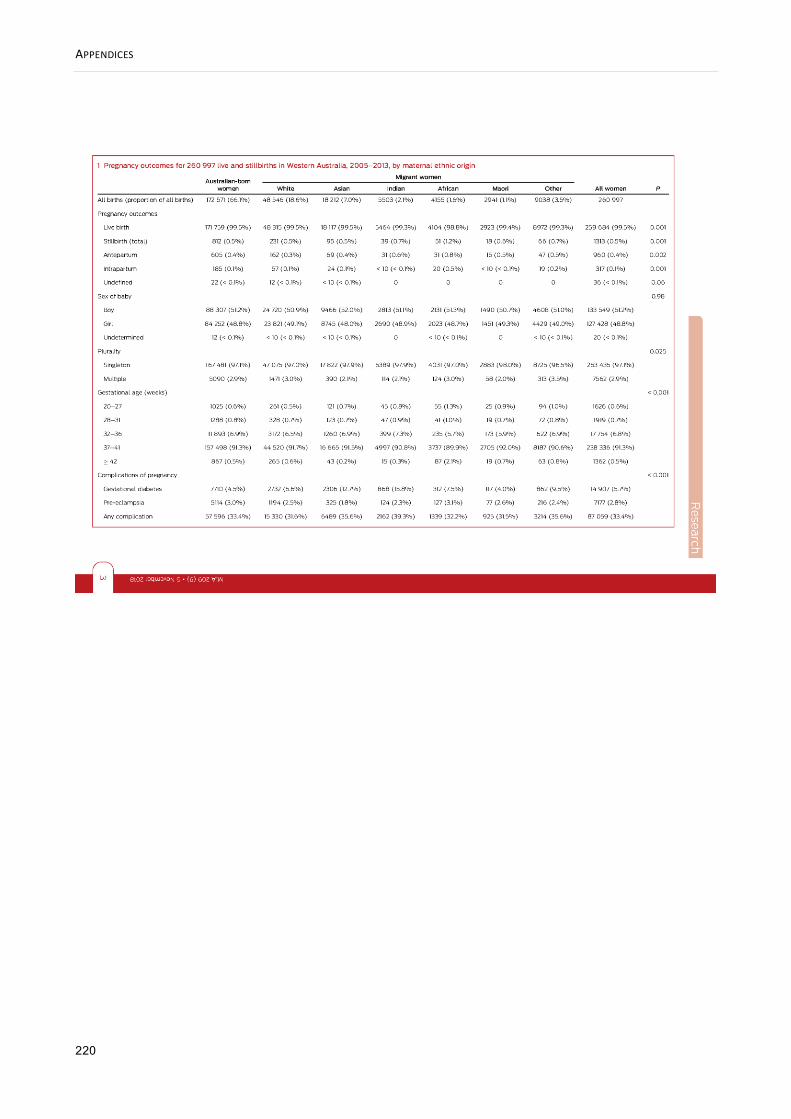
APPENDICES
220
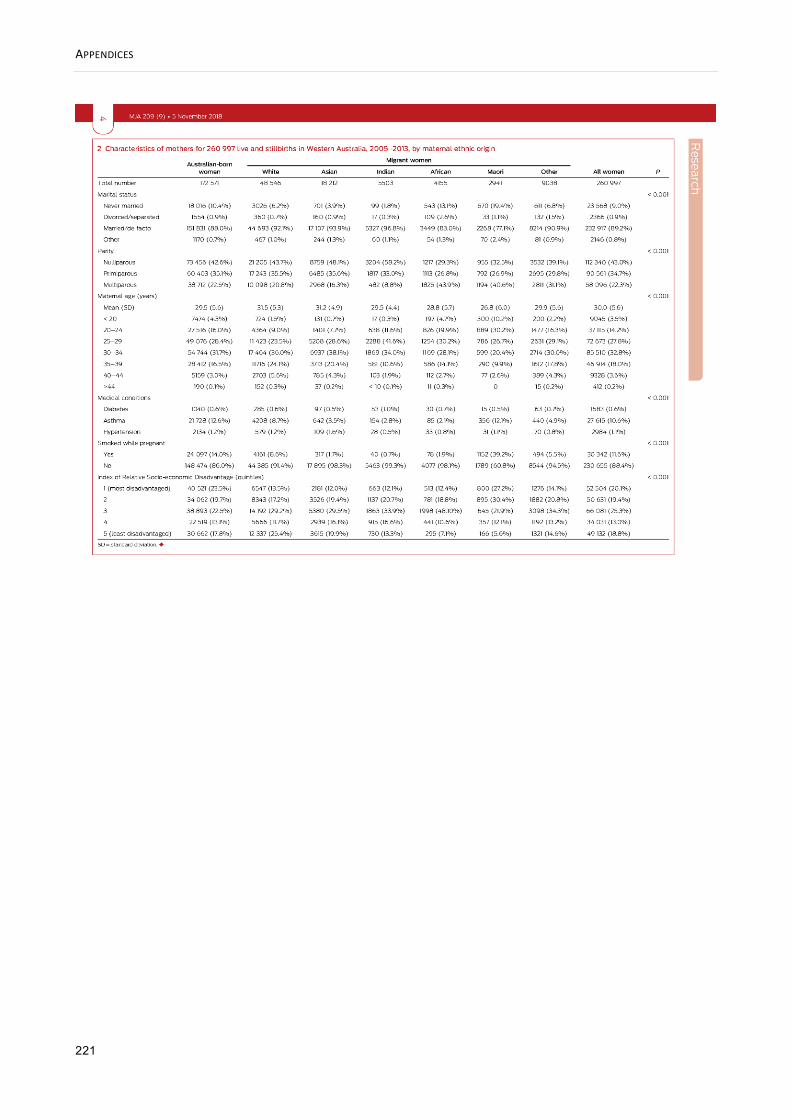
APPENDICES
221
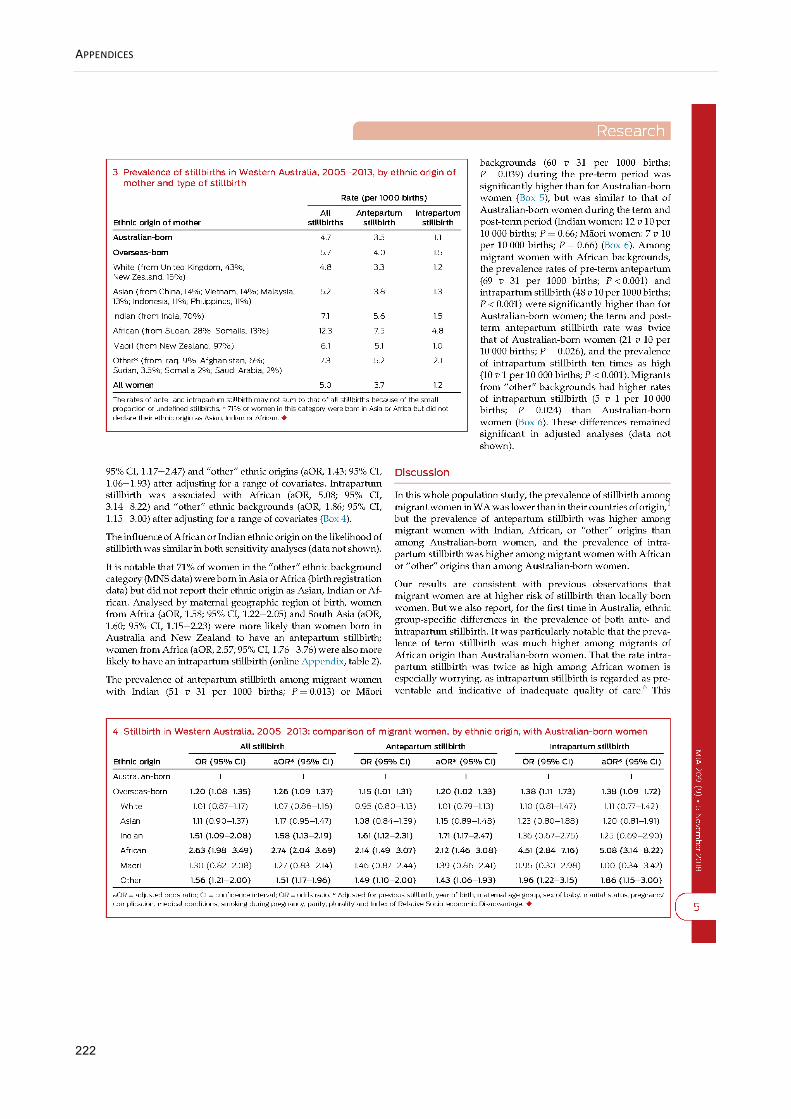
APPENDICES
222

APPENDICES
223
APPENDICES
224

APPENDICES
225
APPENDIX 6. PAPER 1- ONLINE APPENDIX

APPENDICES
226

APPENDICES
227
APPENDIX 7. PUBLISHED PAPER 2 (CHAPTER 5)
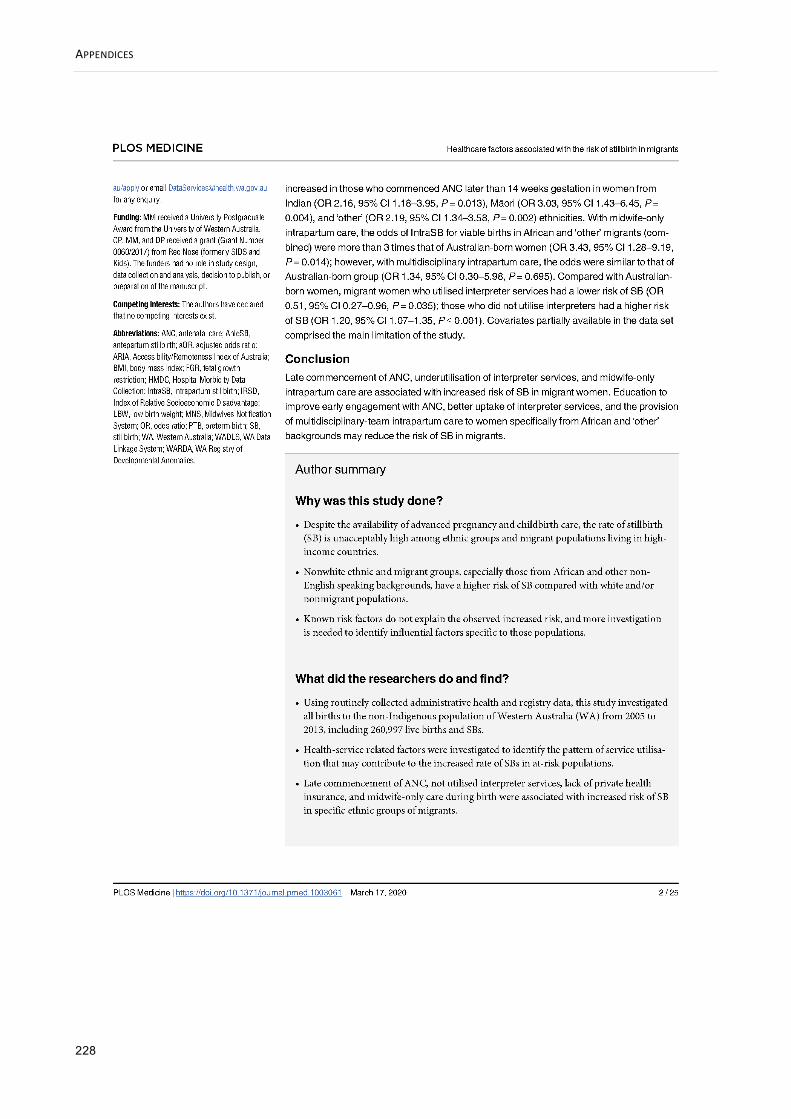
APPENDICES
228

APPENDICES
229
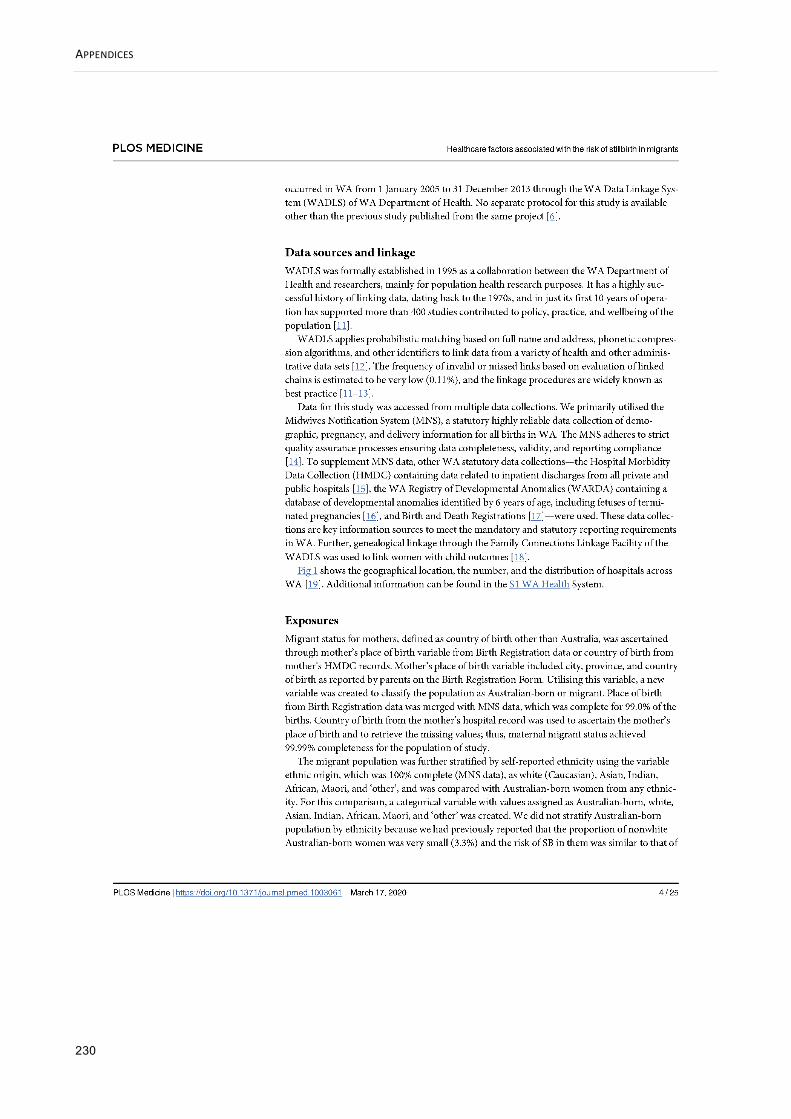
APPENDICES
230

APPENDICES
231

APPENDICES
232

APPENDICES
233
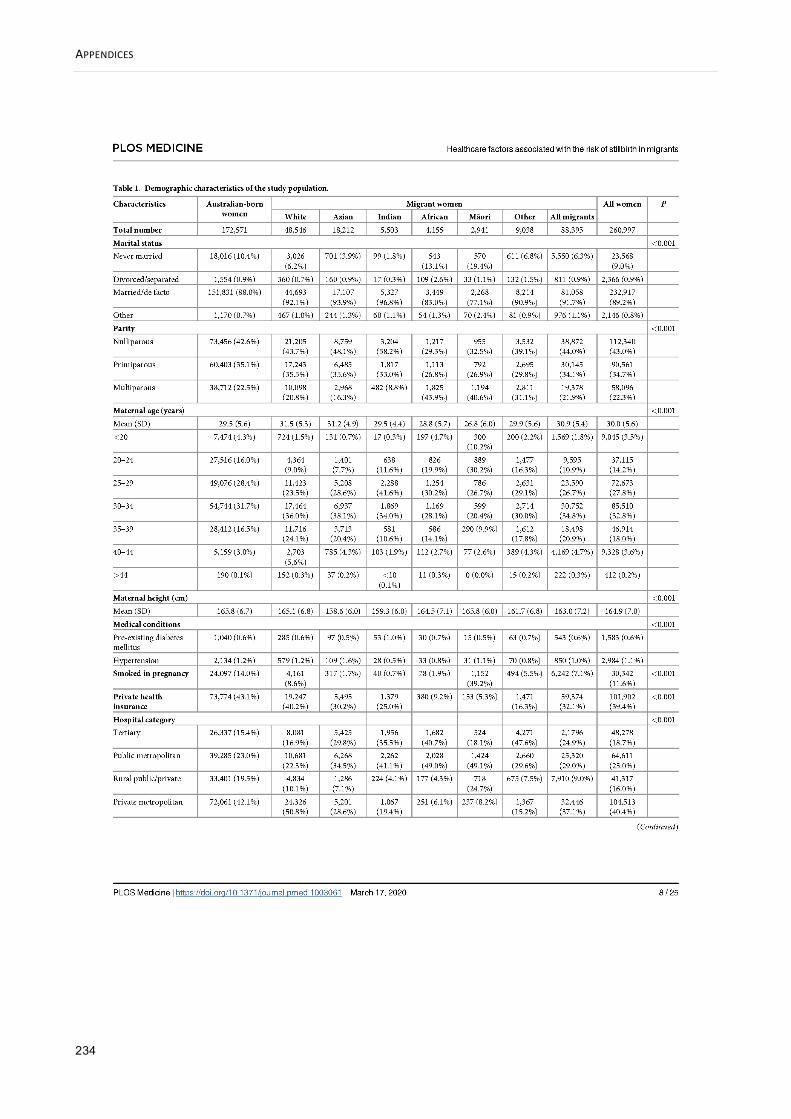
APPENDICES
234
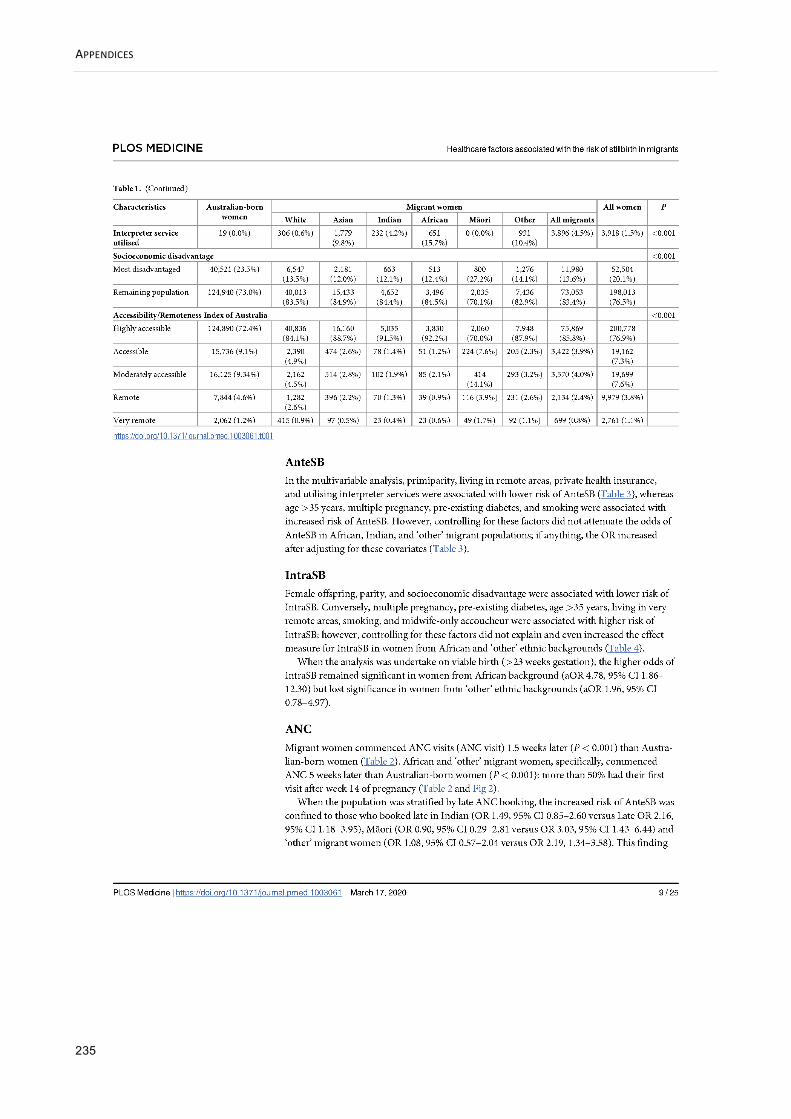
APPENDICES
235

APPENDICES
236

APPENDICES
237

APPENDICES
238

APPENDICES
239

APPENDICES
240

APPENDICES
241

APPENDICES
242

APPENDICES
243

APPENDICES
244

APPENDICES
245

APPENDICES
246

APPENDICES
247

APPENDICES
248

APPENDICES
249

APPENDICES
250

APPENDICES
251

APPENDICES
252
APPENDIX 8. PAPER 2- SUPPORTING INFORMATION
Health system in Western Australia
Australia’s universal health care system is called Medicare. The Australian government pays for
Medicare through the Medicare levy, which is paid by working Australians as part of their income
tax.340 Western Australia’s health system (WA Health) is a mix of services provided by the
Australian and State Governments and private healthcare providers. There are three types of
hospitals: public hospitals managed by WA Health, private hospitals managed by private
organisations, and public hospitals run in partnership with private organisations. An individual can
be admitted as either a public or private patient to a public hospital. Private patients in public
hospitals may choose their treating doctor where possible, while a private patient in a private
hospital can choose their doctor, hospital and when to be treated.341
WA Health has more than 80 hospitals spread across an area of 2.5 million square kilometres,
providing service to approximately 2.5 million people. There are six tertiary hospitals including the
sole tertiary perinatal centre with state-of-the-art medical facilities, four general and two
specialised non-teaching hospitals, nine large rural and numerous country hospitals, and three
Private Public Partnership hospitals delivering free public healthcare to the community.342
The HMDC is one of the largest data collections managed by WA Health and contains information
related to all inpatient discharge summary data from all public and private hospitals in WA.245 The
HMDC is a key information source for meeting mandatory and statutory reporting requirements. It
comprises more than 22 000 000 electronic inpatient records dating back to 1970 and increases
every year in line with population growth.245 Figure 1 shows the number and the distribution of
hospitals across WA.246

APPENDICES
253
Figure 1 The distribution of hospitals (public and private) in WA.
Base image by OpenClipart-Vectors from Pixabay
Remoteness in Western Australia
The Australian Statistical Geography Standard defines Remoteness Areas into five classes of
remoteness: Major Cities of Australia, Inner Regional Australia, Outer Regional Australia, Remote
Australia, and Very Remote Australia.222 This classification is intended to allow users to make
comparisons and undertake statistical analysis to inform research and policy development. The
Accessibility and Remoteness Index of Australia (ARIA), produced by the Hugo Centre for
Migration and Population Research at the University of Adelaide, is used to measure access to
services.222 This index is derived by measuring the road distance from a point to the nearest urban
centres and localities in five separate population ranges of highly accessible, accessible,
moderately accessible, remote and very remote. Some of the most remote areas in Australia,
albeit with low population density,234 are situated in WA.
Aeromedical transfer of high-risk pregnancies in WA
Complicated births to rural mothers are at a higher risk of stillbirth and neonatal mortality than
urban infants in Australia.25,76 To improve perinatal outcomes of WA rural population, women with
high-risk pregnancies, such as those at risk of preterm labour, have been transferred by Royal
Flying Doctor Service from rural areas to the sole tertiary perinatal centre, King Edward Memorial
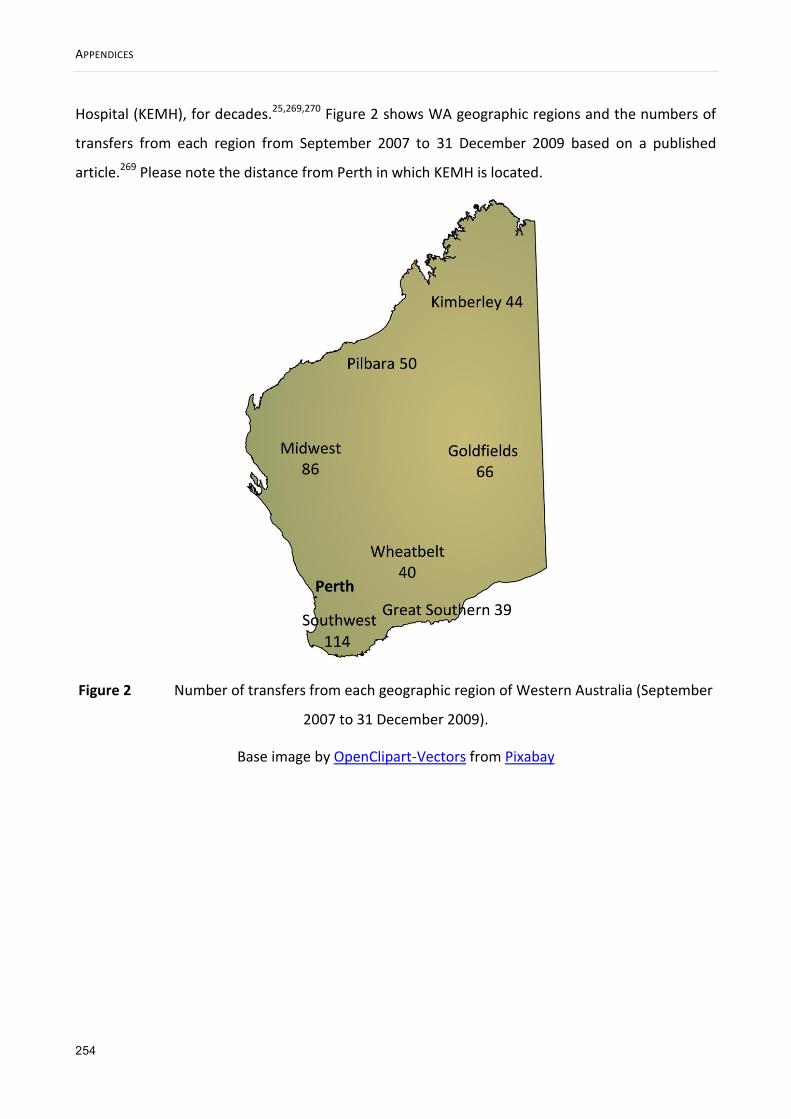
APPENDICES
254
Hospital (KEMH), for decades.25,269,270 Figure 2 shows WA geographic regions and the numbers of
transfers from each region from September 2007 to 31 December 2009 based on a published
article.269 Please note the distance from Perth in which KEMH is located.
Figure 2 Number of transfers from each geographic region of Western Australia (September
2007 to 31 December 2009).
Base image by OpenClipart-Vectors from Pixabay

APPENDICES
255
APPENDIX 9. PUBLISHED PAPER 3 (CHAPTER 6)

APPENDICES
256

APPENDICES
257

APPENDICES
258

APPENDICES
259

APPENDICES
260

APPENDICES
261

APPENDICES
262
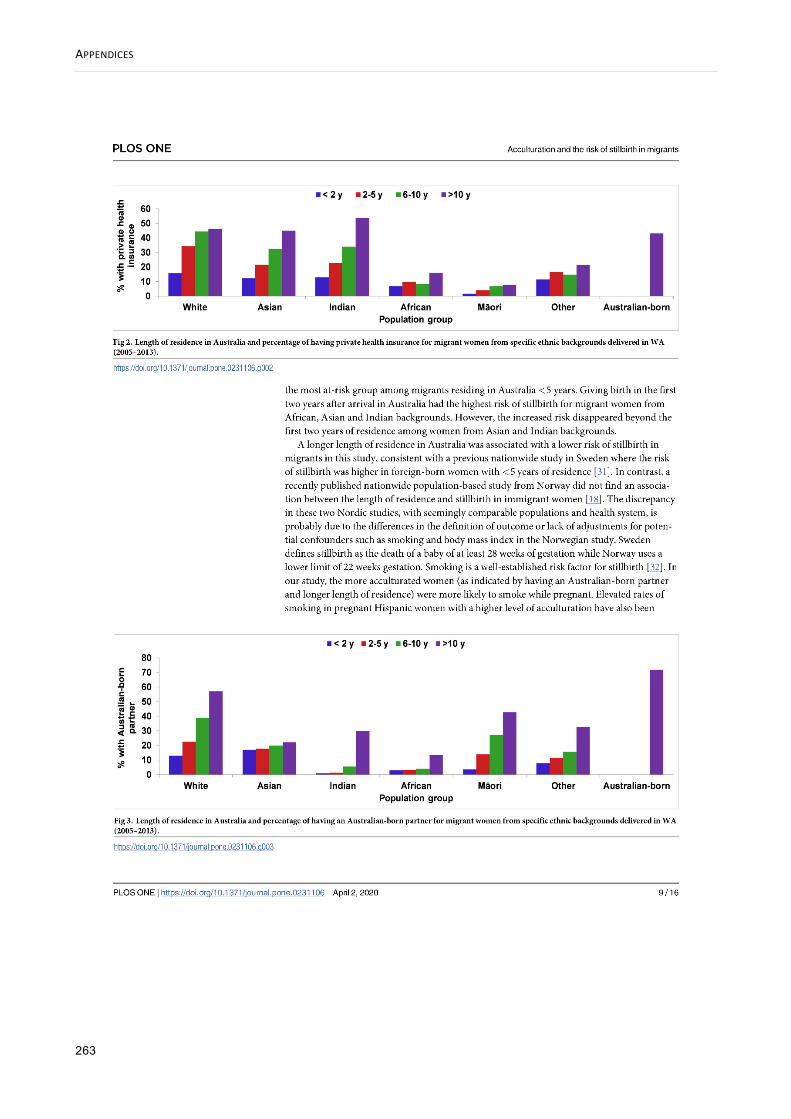
APPENDICES
263

APPENDICES
264
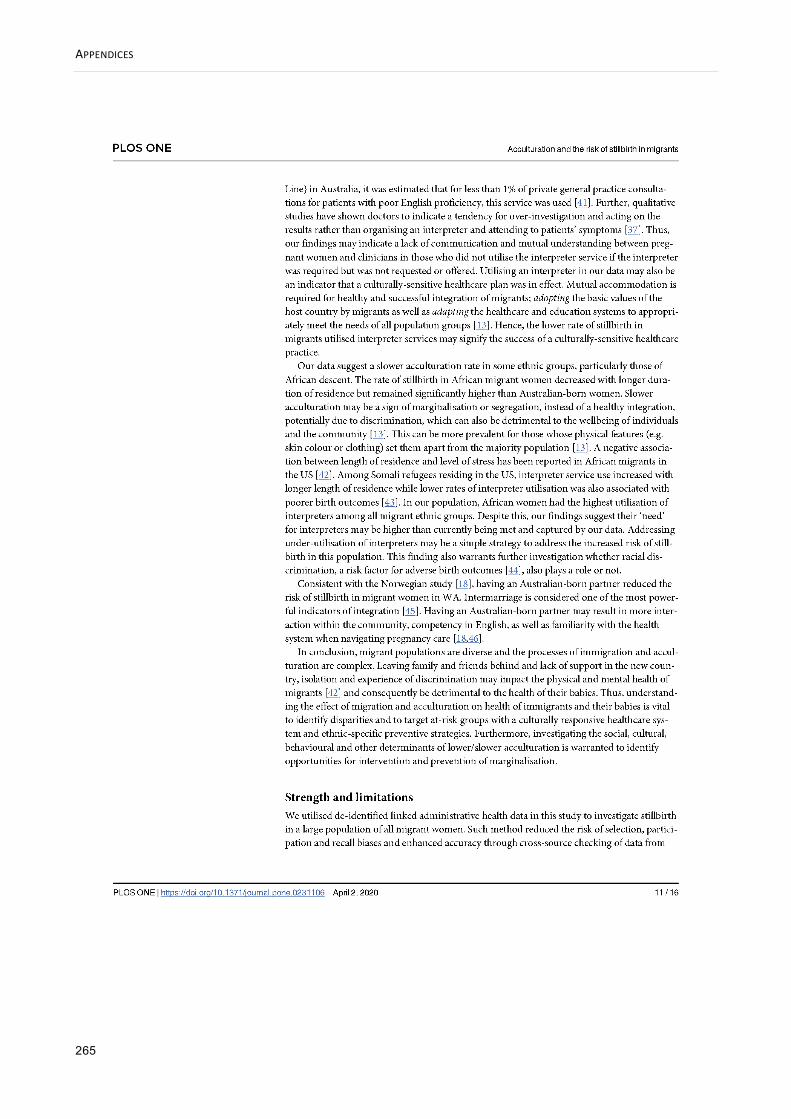
APPENDICES
265

APPENDICES
266

APPENDICES
267

APPENDICES
268

APPENDICES
269

APPENDICES
270

APPENDICES
271
APPENDIX 10. MIDWIVES NOTIFICATIONS DATA APPLICATION VARIABLE LISTS
Midwives Notifications Data
Every request for Midwives Notifications will be evaluated separately on its merit by the Data
Custodian. To prevent potential delays, it is strongly recommended applicants spend time
discussing their needs with the MNS Data Custodian before submitting an application for data. See
the contacts at:
http://www.health.wa.gov.au/healthdata/contact/index.cfm
Further information can be found in the Guidelines for Completion of the Notification of Case
Attended Health Act (Notification by Midwife) Regulations form No.2 at
http://www.health.wa.gov.au/publications/subject_index/p/Perinatal_infant_maternal.cfm
________________________________________________________________________
Request the variables you require below by clicking on the box on the left.
Request Variable Description
Mother’s Details
Subset date of birth MMYYYY
Subset date of birth YYYY
Maternal age
State
Height Mothers height in centimeters
Weight Available January 2012 onwards
Marital status

APPENDICES
272
Ethnic origin
The quality of this variable is improved by also
sourcing this from the inpatient birth record from
HMDC where available
Pregnancy Details
Previous pregnancies
Previous pregnancy outcomes Each baby recorded separately in multiple births.
Therefore this ≠ total previous pregnancies
Previous caesarean section
Number previous caesarean
sections Available January 2012 onwards
Caesarean last delivery
Previous multiple birth
Is the LMP date certain?
Basis of expected due date
Gestational Age at First AN Care
Visit
Available January 2010 onwards. Use with caution
as antenatal care models in WA make accurate
determination difficult.
Number of AN Visits
Available from July 2012 onwards. Use with
caution as antenatal care models in WA make
accurate determination difficult.
Smoking during pregnancy Yes/no
Number tobacco cigarettes
smoked each day in the first 20
weeks of pregnancy
Available January 2010 onwards
Number tobacco cigarettes
smoked each day after the first 20
weeks of pregnancy
Available January 2010 onwards

APPENDICES
273
Complications of pregnancy Tick box value supplied, not ICD code
Medical conditions Tick box value supplied, not ICD code
Procedures/treatments
Intended place of birth at onset of
labour
Labour Details
Onset of labour Method (e.g. induced)
Augmentation
Induction
Analgesia (during labour)
Delivery Details
Duration of labour 1st stage
Duration of labour 2nd stage
Anaesthesia (during delivery)
Complications of labour and
delivery Tick box value supplied, not ICD code
Perineal status
Baby Details
Indigenous Status Available January 2011 onwards
Born before arrival Yes/No
Subset date of birth MMYYYY
Subset date of birth YYYY
Plurality Number of babies in this birth
Baby number Order in delivery
Presentation Position (e.g. breech)

APPENDICES
274
Method of birth
Accoucheur(s) Person who delivered the baby
Gender
Status of baby at birth Alive/stillborn
Infant weight
Length of baby (cms)
Head circumference
Time to establish unassisted
regular breathing Recorded in minutes
Resuscitation Method used
Apgar score at 1 minute
Apgar score at 5 minutes
Estimated gestation Clinical estimation in weeks, available 1986
onwards
Baby separation date MMYYYY only
Baby length of stay in days Derived variable
Mode of separation E.g. transferred, went home
Number of Days in Special Care
Nursery at birth site
Other variables
The following variables are derived using the algorithms developed by Dr Eve Blair et al.
References:
(1) Blair, E.M., Liu, Y., de Klerk, N.H. & Lawrence, D.M. (2005) Optimal fetal growth for the Caucasian
singleton and assessment of appropriateness of fetal growth: an analysis of a total population
perinatal database. BMC Pediatrics, 5, 13-25.
(2) Blair, E.M., Liu, Y. & Cosgrove, P. (2004) Choosing the best estimate of gestational age from

APPENDICES
275
routinely collected population-based perinatal data. Paediatric and Perinatal Epidemiology, 18,
270-276.
POBW Percentage Optimal Birth Weight
POHC Percentage Optimal Head Circumference
POL Percentage Optimal Length
Estimate of Gestational Age Algorithmic Estimate of Gestational Age
Based on LMP, EDD, baby date of birth
Geocoding
Postcode
SEIFA Socioeconomic status
ARIA Accessibility/Remoteness Index
Local Government Area (ABS)
Statistical Local Area (ABS)
Radius (ABS) Should be requested with SEIFA & ARIA
Geocoding Information:
Collectors District is not usually supplied on data extracts. However the Data Linkage Branch offers
the service of assigning 1996, 2001 and 2006 Census SEIFA and/or ARIA codes to post-1993
records at CD and SLA level. Should you require CD on your extract for another purpose please
request this and provide written justification in the Sensitive Variables section of this document.
________________________________________________________________________
Sensitive Variables
All of the variables below have been determined as sensitive by the MNS Data Custodian and
therefore require written justification. Please provide this in the space in the table below. Items in
bold require DOHWA HREC approval.

APPENDICES
276
Request Variable Description
Full date of birth of mother DDMMYYYY
Requires DOHWA HREC approval
Enter justification here
Full date of birth of baby DDMMYYYY
Requires DOHWA HREC approval
Expected due date MMYYYY only
Enter justification here
Collectors District (ABS) Refer to geocoding information above
Enter justification here
Date of last menstrual period DDMMYYYY
Be careful with the reliability of this variable
Enter justification here
Baby transferred to
May require approvals from the Chief Executives of
the Area Health Services and/or private hospitals.
If requesting this variable, also request ‘mode of
separation’.
Enter justification here
Comments:

APPENDICES
277
APPENDIX 11. BIRTH DATA APPLICATION VARIABLE LIST
Birth Data
Every request for Birth data will be evaluated separately on its merit by the Data Custodian. To
prevent potential delays it is strongly recommended applicants spend time discussing their needs
with the Data Custodian, Diana Rosman ([email protected]) before submitting an
application for data.
Request the variables you require below by clicking on the box on the left.
Request Variable Description
Child’s details
Birth registration year Year event registered not necessarily same as year
of birth
Sex
Subset date of birth MMYYYY
Subset date of birth YYYY
ATI status 2007 onwards
Birth weight
Born alive
Plurality
Gestation period
Born in hospital Flag derived by DLU which indicates if the child was
born in hospital
Place of birth state

APPENDICES
278
Place of birth country
Mother’s details
Occupation
ATI status Not available on records prior to 1992
Place of birth
Age 1992 onwards
Year mother arrived in Australia 2002 onwards
Father’s details
Occupation
ATI status Not available on records prior to 1992
Place of birth
Age 1992 onwards
Year father arrived in Australia 2002 onwards
Other
Date of marriage Year only
Sensitive Variables
All of the variables below have been determined as sensitive by the Data Custodian and therefore
require written justification. Please provide this in the space in the table below.
Items in bold require DOHWA HREC approval.
Request Variable Description
Baby’s Full date of birth DDMMYYYY
Requires DOHWA HREC approval
Place of birth postcode Requires DOHWA HREC approval
May require approvals from Area Health Services.

APPENDICES
279
Please note that this is most often the postcode of
a hospital, not the residential postcode.
Enter justification here
Place of birth hospital
Requires DOHWA HREC approval
May require approvals from Area Health Services.
Numeric field
Enter justification here
Informant’s postcode
Requires DOHWA HREC approval
Please note that the parent is not always the
informant.
Enter justification here
Comments:

APPENDICES
280
APPENDIX 12. MORTALITY DATA APPLICATION VARIABLE LIST
Mortality Data
Every request for Mortality data will be evaluated separately on its merit by the Data Custodian.
To prevent potential delays it is strongly recommended applicants spend time discussing their
needs with the Mortality Data Custodian, Diana Rosman ([email protected]) before
submitting an application for data.
It is imperative applicants have referred to the online summary of Mortality data fields before
requesting data. See this document online at:
http://www.datalinkage-wa.org.au/downloads/data-collections
Request the variables you require below by clicking on the box on the left.
Request Variable Description
Registration year Year of the record
Sex
Died in hospital flag Flag derived by DLU
Subset date of birth MMYYYY
Subset date of birth YYYY
Age of the person
When requesting Age of the person, also request
Age text (below)
Age text Context in which the age can be quantified
ATI status Aboriginal or Torres Strait Islander descent
ATSI status (doctor) Aboriginal or Torres Strait Islander descent as
indicated by doctor

APPENDICES
281
Post mortem Whether a post mortem was/was not/is yet to be
carried out
Marital status
Date of death 1
YYYYMMDD
When requesting Date of death 1, also request
Date of death 2 and Date of death code (below)
Date of death 2 1983 onwards
Date of death code
Occupation
Occupation text 1984 onwards
Main task 2002 onwards
Occupation of the father of the
deceased
Occupation of the mother of the
deceased
Country of birth 2002 onwards
Born overseas flag 2002 onwards
Time resident in Australia (years
and/or months) 2002 onwards
Total time residency in
Australian states 1984 - 2001
Time of occupancy in Western
Australia 1984 - 2001
State unknown State of residence unknown
State of residence Up to 8 fields
1984 - 2001 Period of occupancy in state

APPENDICES
282
Deceased pregnant within 6
weeks of death These variables can be unreliable.
Deceased pregnant between 6
weeks and 12 months of death
ABS Variables
Unless otherwise stated, ABS coded variables are available from 1969 – 2011.
Aboriginal flag When requesting Aboriginal flag, also request
Registration year (top)
Post mortem code 1999 - 2006
Occupation code
Country of Birth code
Cause of death code
Multiple cause of death codes
Entity Axis data ICD codes as they appear on medical certificate
1997 to 2011.
Record Axis data
ICD codes as they appear on medical certificate-
cleaned data 1997 to 2011.
When requesting these also required is Cause of
Death code (ABS).
Multi cause of death format
type
Added by DLB. Indicates which format the multiple
cases of death data is in.
Place of occurrence code 1999-2002. Set for deaths due to or involving
external causes W00-Y34.
Activity code 1999-2002. Set for deaths due to external causes
V01-Y34.
Type of firearm used 1999-2002
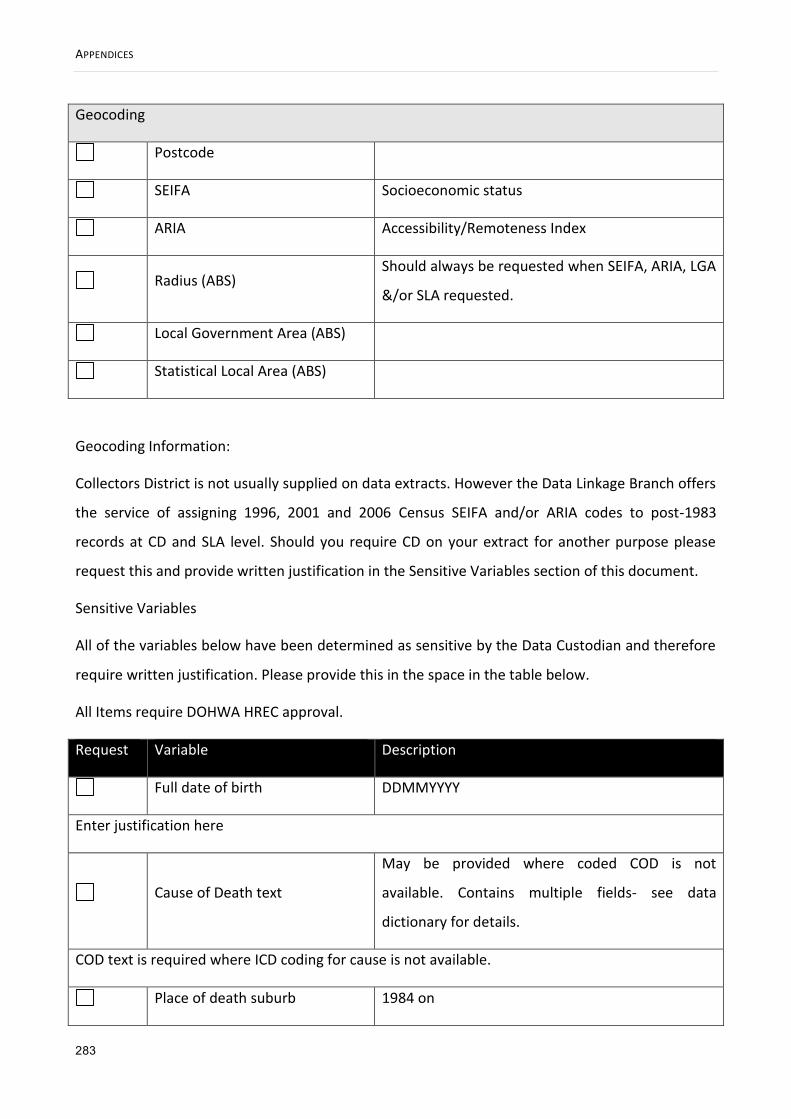
APPENDICES
283
Geocoding
Postcode
SEIFA Socioeconomic status
ARIA Accessibility/Remoteness Index
Radius (ABS) Should always be requested when SEIFA, ARIA, LGA
&/or SLA requested.
Local Government Area (ABS)
Statistical Local Area (ABS)
Geocoding Information:
Collectors District is not usually supplied on data extracts. However the Data Linkage Branch offers
the service of assigning 1996, 2001 and 2006 Census SEIFA and/or ARIA codes to post-1983
records at CD and SLA level. Should you require CD on your extract for another purpose please
request this and provide written justification in the Sensitive Variables section of this document.
Sensitive Variables
All of the variables below have been determined as sensitive by the Data Custodian and therefore
require written justification. Please provide this in the space in the table below.
All Items require DOHWA HREC approval.
Request Variable Description
Full date of birth DDMMYYYY
Enter justification here
Cause of Death text
May be provided where coded COD is not
available. Contains multiple fields- see data
dictionary for details.
COD text is required where ICD coding for cause is not available.
Place of death suburb 1984 on

APPENDICES
284
Not necessarily a residential address - may be the
suburb of a hospital.
Enter justification here
Place of death postcode Not necessarily a residential address - may be the
postcode of a hospital.
Enter justification here
Place of death hospital
This variable can be unreliable and will require
approvals from the CEOs of the Area Health
Services.
Enter justification here
Collectors District (ABS) Refer to geocoding information above
Enter justification here
Place of birth text
This variable can be unreliable and will require
approvals from the CEOs of the Area Health
Services.
Enter justification here
Comments:

APPENDICES
PAGE | 285
APPENDIX 13. HOSPITAL MORBIDITY DATA APPLICATION VARIABLE LIST
Hospital Morbidity Data
Every request for inpatient data will be evaluated separately on its merit by the HMDC Data
Custodian. To prevent potential delays it is strongly recommended applicants spend time
discussing their needs with the HMDC Data Custodian before submitting an application for data.
See the contacts at:
http://www.health.wa.gov.au/healthdata/contact/index.cfm
It is imperative applicants have referred to the online summary of HMDC data fields of the HMDC
reference manual before requesting data. These documents record the changes in HMDC data
collection practices/protocols over time and detail the HMDC variables. See these documents
online at:
http://www.datalinkage-wa.org.au/downloads/data-collections
For all requests, unless requested otherwise, typical exclusions include unqualified (healthy)
newborns, boarders, organ procurements, aged care residents, funding (duplicate) hospital cases
and residential aged care facilities.
Please note: Certain combinations of variables are potentially identifying and release of these
combinations will be at the discretion of the HMDC Data Custodian.
Request the variables you require below by clicking on the box on the left.
Request Variable Description
Patient Information
Admission age Age in years
Subset date of birth MMYYYY
Subset date of birth YYYY

APPENDICES
PAGE | 286
Sex
Indigenous status
Marital status
Be cautious about the reliability of these variables.
When selecting Interpreter Service, also select
Language
Employment status
Interpreter service
Language
Country/State of birth
Health Region of Hospital
OR (request only one)
Hospital Category
The 9 WA health regions (North & South Metro,
Goldfields, South-West, Great Southern,
Wheatbelt, Midwest, Pilbara, Kimberley).
Tertiary, public metro, private metro and rural
Subset admission date MMYYYY
Subset separation date MMYYYY
Length of stay Excludes days on leave
≠ Separation date – admission date.
Source of referral- location
Only available on data after July 2000 Source of referral- professional
Source of referral- transport
Source of referral Available on data prior to July 2000
Admission status Waitlist, non-waitlist or emergency. Variable is
unreliable from 1986-1989 and 1996-1998.
Infant weight/neonate
Funding source AHCA, private insurance, self funded, worker’s
compensation etc

APPENDICES
PAGE | 287
Insurance status
Care type Acute, rehab, palliative etc
Total leave days
Number of leave periods
Days of psychiatric care
Days of qualified newborn care
Days of Hospital in the Home
care
Days in ICU
Hours CVS
Mode of separation Transferred to another hospital, deceased,
discharged etc
Diagnosis Codes
Principal diagnosis
ICD code Co-diagnosis
Additional diagnoses
Procedure Codes
Principal procedure ICD code
Additional procedures
E-Codes
External cause of injury ICD code
Activity code
Place of occurrence
Geocoding
Postcode

APPENDICES
PAGE | 288
SEIFA Socioeconomic status
ARIA Accessibility/Remoteness Index
Local Government Area (ABS)
Statistical Local Area (ABS)
Radius (ABS) Request this if you need SEIFA
Geocoding Information:
Collectors District is not usually supplied on data extracts. However the Data Linkage Branch offers
the service of assigning 1996, 2001 and 2006 Census SEIFA and/or ARIA codes to post-1993
records at CD and SLA level. Should you require CD on your extract for another purpose please
request this and provide written justification in the Sensitive Variables section of this document.
Please note: Geocoding for HMDC data commenced in 1993. Prior to 1993 full address details
were not recorded in HMDC records.
Other Variables
All of the variables below require written justification. Please provide this in the space in the table
below. Items in bold require DOHWA HREC approval.
Hospital Establishment codes are considered identifying information, especially if they involve
private establishments. Provision of these codes requires DOHWA HREC approval and/or hospital
ethics approval. Approval from the Chief Executive of the area health service may also be required.
Request Variable Description
Full date of birth DDMMYYYY
Requires DOHWA HREC approval
Enter justification here
Age in days at admission
Enter justification here
Collectors District (ABS) Refer to geocoding information above
Enter justification here

APPENDICES
PAGE | 289
Admission date DDMMYYYY
Separation date DDMMYYYY
Principal procedure date DDMMYYYY
Enter justification here
Additional procedure dates DDMMYYYY
Can be incomplete
Enter justification here
Mental health legal status
Enter justification here
DRG Diagnostic Related Group
Available July 1993 onwards
MDC Major Diagnostic Category
Available July 1993 onwards
Enter justification here
Patient Identifier (UMRN) Requires DOHWA HREC and AHS CE approval
Enter justification here
Hospital Identifier Requires DOHWA HREC and AHS CE approval
Enter justification here
Comments:
Enter any extra comments here
APPENDICES
PAGE | 290
APPENDIX 14. WARDA BIRTH DEFECTS DATA APPLICATION VARIABLE LIST
WARDA Birth Defects Data
Every request for data from the WA Register of Developmental Anomalies will be evaluated
separately on its merits by the WARDA Data Custodian.
Before approval to obtain WARDA data will be given:
Researchers must discuss their project and their data needs with the WARDA Data
Custodian; and
Researchers must also provide a separate lay summary (~200 words) of their project to the
Data Custodian for consideration by the WARDA Consumer Reference Group.
The WARDA Data Custodians are:
Professor Carol Bower; phone: (08) 9340 2721; email: [email protected]
Dr Hugh Dawkins, phone (08) 9222 6888; email [email protected]
*Two of the variables below relate to tables in the Report of the Birth Defects Registry of Western
Australia 1980-2007. This document and other information may be found at:
http://kemh.health.wa.gov.au/services/register_developmental_anomalies/
Information on British Paediatric Association Coding used for WARDA can be found at
http://kemh.health.wa.gov.au/services/register_developmental_anomalies/diagnostic_codes_birt
h_defects.htm
Please note that all requests for WARDA data require DOHWA HREC approval.
Request the variables you require below by clicking on the box on the left.

APPENDICES
PAGE | 291
Request Variable Description
Child’s details
Subset date of birth MMYYYY
Subset date of birth YYYY
Sex
Weight
Race
Plurality
Birth Outcome Livebirth, stillbirth, termination of pregnancy
Date of Death Days at death
Multcode Whether birth defect is isolated or multiple
Gestational age
Mother’s details
Subset date of birth MMYYYY
Subset date of birth YYYY
Father’s details
Subset date of birth MMYYYY
Subset date of birth YYYY
Diagnosis Codes (1-10)
Diagnosis code ICD-9 coding. Britsh Paediatric Association.
ARDiagnosis Code ICD diagnosis coded to BDR Categories (Table 4*).
Diagnosis Description May contain minor variations within Diagnosis
code
Is Major Major or minor congenital malformation
Diagnosis time Coded time of diagnosis

APPENDICES
PAGE | 292
Notification codes (1-10)
ARNotification Code Coded source of notification. Coded to Annual
Report (Table 6*) categories.
Sensitive Variables
All of the variables below have been determined as sensitive by the Data Custodian and therefore
require written justification. Please provide this in the space in the table below. All items require
DOHWA HREC approval.
Request Variable Description
Baby’s Full date of birth DDMMYYYY
Mother’s Full date of birth DDMMYYYY
Enter justification here
Father’s Full date of birth DDMMYYYY
Enter justification here
Birth hospital
Enter justification here
Postcode Postcode of mother at time of birth/first
notification
Enter justification here
Comments:

APPENDICES
PAGE | 293
APPENDIX 15. FAMILY CONNECTIONS APPLICATION FORM
Family Connections
The WA Family Connections System contains links between individuals who are related, i.e.
biologically (by birth) or legally (such as by marriage). The links are created using information
recorded on original birth, death and marriage registrations as well as other sources. No
information is known about adoptions, including step, local or overseas adoptions.
Please note: Currently, the genealogy held by the Data Linkage Branch is primarily limited to
parents and siblings of people born in WA since 1974. However, extended family members
(including grandparents and other second-degree relatives) have been identified in many cases.
Genealogical data received from this application may differ from actual data collected from
families via questionnaires or other methods. Family structures may include individuals who have
been adopted (in or out), step-relatives, or recent deaths. It is important that any such
discrepancies should be treated with respect and sensitivity. If, though fieldwork, you learn that a
subject has been adopted, you will not be able to obtain additional linked data for that individual’s
biological relatives.
Family Relationships
Please provide a description of the family relationships you require.
E.g. Mother, father, grandparents OR first-degree relatives only
Do you have any restrictions on the information?
E.g. only full siblings needed, not half siblings
For Office Use Only
EOI# 2014.38
DL#

APPENDICES
PAGE | 294
Comments
Service data extraction
Please specify the datasets you require, the time period and any restrictions on which records you
need.
WA Cancer Registry: Please refer to the variable list for record scope. If you require specific
exclusions please list them in the comments section of that form.
Midwives Notification System: Please specify below whether you need records for the birth of a
person, records where they are the parent or both.
*Attach variable lists (Module 3) and specify which family group they relate to.
Restrictions
E.g. I am only interested in
records for colorectal cancer;
see attached ICD codes.
Copyright © 2022 FDOKUMEN