Comparison of a Brassica oleracea Genetic Map With the Genome of Arabidopsis thaliana
14
Copyright 2003 by the Genetics Society of America Comparison of a Brassica oleracea Genetic Map With the Genome of Arabidopsis thaliana Lewis Lukens,* ,1 Fei Zou, † Derek Lydiate, ‡ Isobel Parkin ‡ and Tom Osborn* *Department of Agronomy, University of Wisconsin, Madison, Wisconsin 53711, † Department of Biostatistics, University of North Carolina, Chapel Hill, North Carolina 27599 and ‡ Agriculture and Agri-Food Canada, Saskatoon Research Centre, Saskatoon, Saskatchewan S7N 0X2, Canada Manuscript received July 1, 2002 Accepted for publication January 25, 2003 ABSTRACT Brassica oleracea is closely related to the model plant, Arabidopsis thaliana. Despite this relationship, it has been difficult to both identify the most closely related segments between the genomes and determine the degree of genome replication within B. oleracea relative to A. thaliana. These difficulties have arisen in part because both species have replicated genomes, and the criteria used to identify orthologous regions between the genomes are often ambiguous. In this report, we compare the positions of sequenced Brassica loci with a known position on a B. oleracea genetic map to the positions of their putative orthologs within the A. thaliana genome. We use explicit criteria to distinguish orthologous from paralogous loci. In addition, we develop a conservative algorithm to identify collinear loci between the genomes and a permutation test to evaluate the significance of these regions. The algorithm identified 34 significant A. thaliana regions that are collinear with 28% of the B. oleracea genetic map. These regions have a mean of 3.3 markers spanning 2.1 Mbp of the A. thaliana genome and 2.5 cM of the B. oleracea genetic map. Our findings are consistent with the hypothesis that the B. oleracea genome has been highly rearranged since divergence from A. thaliana, likely as a result of polyploidization. O NE major goal of plant biologists is to compare cies and A. thaliana, whole-genome mapping studies have found that the order of loci in Brassica genetic the genomic information available from model species to other, nonmodel species for which genetic maps is only infrequently similar to the order of homolo- gous loci in the A. thaliana genome (Kowalski et al. maps are available. If genome structures are highly con- served, candidate genes in the model species that corre- 1994; Lagercrantz 1998; Lan et al. 2000). Comparative studies of smaller genomic intervals have revealed more spond to loci mapped in the nonmodel species can be evidence for collinearity, but extensive deletions and quickly identified. In addition, differences between the genome rearrangements are still evident. Cavell et al. nonmodel genome and model genome can be used to (1998) reported shared marker order and content be- infer the frequency of genome duplications and re- tween a 7.5-Mbp region of A. thaliana chromosome 4 arrangements over time. with B. napus, and Parkin et al. (2002) and Schranz et The genus Brassica is an excellent system with which al. (2002) have observed a high degree of collinearity to develop tools for genome comparison and to examine between A. thaliana chromosome 5 and three chromo- the divergence of genome structure. Brassica species somal regions of diploid Brassica species. The order of are closely related to the model plant species, Arabidopsis loci within one 10-cM region within B. oleracea is well thaliana. Both Brassica and Arabidopsis are classified conserved in A. thaliana (Ryder et al. 2001), and many within the same family, the Brassicaceae, and diverged genes within a 222-kb interval of A. thaliana chromo- 20 MYA (Koch et al. 2000). Brassica oleracea (including some 4 hybridize to the same or contiguous bacterial broccoli, cabbage, cauliflower, brussel sprouts, and artificial chromosomes (BACs) in B. oleracea (O’Neill kale) and its related crop species (including B. napus and Bancroft 2000). However, Ryder et al. (2001) and B. rapa) have also been extensively studied geneti- found that many regions of the B. oleracea genetic map cally, and several molecular maps for B. oleracea and did not have a clear relationship to the A. thaliana ge- other species within the genera have been published nome, and O’Neill and Bancroft (2000) found that (e.g., Kianin and Quiros 1992; Camargo et al. 1997; several genes within the 222-kb A. thaliana interval were Bohuon et al. 1998; Lan and Paterson 2000). not found in the homologous region of B. oleracea. Despite the close relationship between Brassica spe- The conserved and rearranged regions between Bras- sica and Arabidopsis genomes have been interpreted in different ways, leading to fundamental disagreements 1 Corresponding author: Department of Plant Agriculture, Crop Sci- about Brassica genome structure. Lagercrantz (1998) ence Bldg., University of Guelph, Guelph, ON N1G 2W1, Canada. E-mail: [email protected] suggested that the base diploid Brassica genome evolved Genetics 164: 359–372 (May 2003)
Transcript of Comparison of a Brassica oleracea Genetic Map With the Genome of Arabidopsis thaliana

Copyright 2003 by the Genetics Society of America
Comparison of a Brassica oleracea Genetic Map With the Genomeof Arabidopsis thaliana
Lewis Lukens,*,1 Fei Zou,† Derek Lydiate,‡ Isobel Parkin‡ and Tom Osborn*
*Department of Agronomy, University of Wisconsin, Madison, Wisconsin 53711, †Department of Biostatistics, University of North Carolina,Chapel Hill, North Carolina 27599 and ‡Agriculture and Agri-Food Canada, Saskatoon Research Centre, Saskatoon,
Saskatchewan S7N 0X2, Canada
Manuscript received July 1, 2002Accepted for publication January 25, 2003
ABSTRACTBrassica oleracea is closely related to the model plant, Arabidopsis thaliana. Despite this relationship, it
has been difficult to both identify the most closely related segments between the genomes and determinethe degree of genome replication within B. oleracea relative to A. thaliana. These difficulties have arisenin part because both species have replicated genomes, and the criteria used to identify orthologous regionsbetween the genomes are often ambiguous. In this report, we compare the positions of sequenced Brassicaloci with a known position on a B. oleracea genetic map to the positions of their putative orthologs withinthe A. thaliana genome. We use explicit criteria to distinguish orthologous from paralogous loci. Inaddition, we develop a conservative algorithm to identify collinear loci between the genomes and apermutation test to evaluate the significance of these regions. The algorithm identified 34 significant A.thaliana regions that are collinear with �28% of the B. oleracea genetic map. These regions have a meanof 3.3 markers spanning 2.1 Mbp of the A. thaliana genome and 2.5 cM of the B. oleracea genetic map.Our findings are consistent with the hypothesis that the B. oleracea genome has been highly rearrangedsince divergence from A. thaliana, likely as a result of polyploidization.
ONE major goal of plant biologists is to compare cies and A. thaliana, whole-genome mapping studieshave found that the order of loci in Brassica geneticthe genomic information available from model
species to other, nonmodel species for which genetic maps is only infrequently similar to the order of homolo-gous loci in the A. thaliana genome (Kowalski et al.maps are available. If genome structures are highly con-
served, candidate genes in the model species that corre- 1994; Lagercrantz 1998; Lan et al. 2000). Comparativestudies of smaller genomic intervals have revealed morespond to loci mapped in the nonmodel species can beevidence for collinearity, but extensive deletions andquickly identified. In addition, differences between thegenome rearrangements are still evident. Cavell et al.nonmodel genome and model genome can be used to(1998) reported shared marker order and content be-infer the frequency of genome duplications and re-tween a 7.5-Mbp region of A. thaliana chromosome 4arrangements over time.with B. napus, and Parkin et al. (2002) and Schranz etThe genus Brassica is an excellent system with whichal. (2002) have observed a high degree of collinearityto develop tools for genome comparison and to examinebetween A. thaliana chromosome 5 and three chromo-the divergence of genome structure. Brassica speciessomal regions of diploid Brassica species. The order ofare closely related to the model plant species, Arabidopsisloci within one 10-cM region within B. oleracea is wellthaliana. Both Brassica and Arabidopsis are classifiedconserved in A. thaliana (Ryder et al. 2001), and manywithin the same family, the Brassicaceae, and divergedgenes within a 222-kb interval of A. thaliana chromo-�20 MYA (Koch et al. 2000). Brassica oleracea (includingsome 4 hybridize to the same or contiguous bacterialbroccoli, cabbage, cauliflower, brussel sprouts, andartificial chromosomes (BACs) in B. oleracea (O’Neillkale) and its related crop species (including B. napusand Bancroft 2000). However, Ryder et al. (2001)and B. rapa) have also been extensively studied geneti-found that many regions of the B. oleracea genetic mapcally, and several molecular maps for B. oleracea anddid not have a clear relationship to the A. thaliana ge-other species within the genera have been publishednome, and O’Neill and Bancroft (2000) found that(e.g., Kianin and Quiros 1992; Camargo et al. 1997;several genes within the 222-kb A. thaliana interval wereBohuon et al. 1998; Lan and Paterson 2000).not found in the homologous region of B. oleracea.Despite the close relationship between Brassica spe-
The conserved and rearranged regions between Bras-sica and Arabidopsis genomes have been interpreted indifferent ways, leading to fundamental disagreements
1Corresponding author: Department of Plant Agriculture, Crop Sci-about Brassica genome structure. Lagercrantz (1998)ence Bldg., University of Guelph, Guelph, ON N1G 2W1, Canada.
E-mail: [email protected] suggested that the base diploid Brassica genome evolved
Genetics 164: 359–372 (May 2003)

360 L. Lukens et al.
Figure 1.—Gene duplications andloosely linked markers complicate com-parative mapping. (A) Hypotheticalgene (thin line) and species (thick line)phylogeny for Arabidopsis thaliana andBrassica oleracea. In this scenario, a dupli-cation event occurred prior to the diver-gence of both species (Lynch and Con-ery 2000; Koch et al. 2001). (B) IfBrassica sequences falsely detect A. thali-ana sequences as orthologous, regionsbetween the genomes (i.e., A1� and A2)can be falsely associated. (C) If intragen-omic paralogous sequences are mappedin B. oleracea, a single linkage group maybe incorrectly inferred to be ortholo-gous with different regions of A. thaliana.(D) Brassica sequences that are closelylinked may detect distantly linked se-quences in A. thaliana that are not trueorthologs.
from an ancient hexaploid with three highly rearranged when making genome comparisons can lead to misclas-sification of intergenomic relationships (BennetzenA. thaliana-like genomes. Lan et al. (2000), supporting
earlier cytogenetical studies (e.g., Haga 1938), found 2000; Gaut 2001). In published comparisons betweenthe Brassica and A. thaliana genomes, clear orthologousmuch stronger support for the hypothesis that the base
Brassica genome is largely composed of duplicated re- regions have been identified by the presence of severalshared loci that are closely linked within both species.gions.
Some of the difficulties in resolving intergenomic re- However, additional orthologous regions are inferredby a single marker or a small number of markers thatlationships and shared orthologous regions have arisen
because genome replication confounds orthologous and are linked in both genomes but lie far from each other(Figure 1D; e.g., Ryder et al. 2001). It is difficult toparalogous relationships between loci (Figure 1A). The
A. thaliana genome is partially duplicated (Arabidopsis evaluate whether such associations are due to chancealone.Genome Initiative 2000), and Brassica sequences can
detect paralogous A. thaliana duplicates (Parkin 2000). Here, we report on a comparison between a geneticmap of B. oleracea and the A. thaliana genome using ap-To identify the region from A. thaliana that most likely
has the same gene content as a region of B. oleracea, proaches that reduce the confounding effect of paralo-gous sequences. In addition, we developed an algorithmone must identify the orthologous, not paralogous, loci
within the A. thaliana genome (Figure 1B). Paralogy written in PERL that uses explicit criteria to identifyorthologous regions and to establish their significance.may further complicate genome comparisons because
a probe may hybridize and be mapped to an ancient, Consistent with previous reports, we found evidence forsubstantial genomic replication in B. oleracea as com-paralogous locus within the Brassica genome. If one
subsequently uses this probe for comparative mapping, pared to A. thaliana and found evidence that multiplechromosomal rearrangements have occurred since thethis probe will likely identify its ortholog, and one may
incorrectly associate two genome intervals. Although a species’ divergence. However, we also found that the B.oleracea genetic map and the A. thaliana genome se-single B. oleracea region may be orthologous to a single
region within Arabidopsis, the probes that identified quence share 34 significant, collinear regions. The aver-age putative orthologous segment has 3.3 markers corre-this region in B. oleracea may be orthologous to loci
in different, duplicated regions within the A. thaliana sponding to 2.1 Mbp in A. thaliana and 7.1 cM in B.oleracea. In total, the significant regions identified ingenome, giving the appearance of (nonexistent) ge-
nome rearrangements (Figure 1C; I. Parkin, unpub- this study cover well over one-fourth of the B. oleraceagenome. Of 22 previously published regions of pre-lished data).
Finally, the lack of explicit criteria when evaluating dicted orthology, our algorithm identified 20, 17 ofwhich were significant at P � 0.05.putative orthologous regions and the potential for bias
361Comparison of B. oleracea and A. thaliana
blastn. Low-complexity sequences were filtered in the blastOur data suggest three separate inferences. First, inanalysis, and default values for cost (mismatch cost � �3.0),general, published reports of collinear regions appearreward (match reward � 1.0), and word size (11 bp) wereto have sampled highly conserved areas between the selected. The default gap opening penalty (5.0) and the gap
Brassica and A. thaliana genomes. Second, different in- extension penalty (2.0) were also selected. We recorded theterpretations of Brassica genome structure may have bit score to evaluate sequence relationships. We did not align
A. thaliana and Brassica sequences by eye in order to calculatearisen because of different criteria used to define ho-additional sequence distances or other statistics. The numbermologous regions between Brassica and A. thaliana. Fi-of marker sequences and the number of detected homologsnally, differences in the genomic arrangements between in A. thaliana made such an approach impractical.
A. thaliana and B. oleracea appear to be due to the recent The results from the blastn analysis were parsed using ahistory of polyploidy in B. oleracea. spreadsheet and short PERL scripts that we wrote for this
purpose. From each “hit” to the A. thaliana BAC database bya Brassica query sequence, we retrieved the BAC name, thebit score, and the significance value. The nucleotide startMATERIALS AND METHODSposition of the BAC was used as the approximate position ofthe Brassica query sequence in the A. thaliana genome. If bothA. thaliana sequence information source and B. oleracea mapsequences from the same fragment detected the same BAC,source: The B. oleracea genetic map was developed by Bohuononly the highest scoring match was kept. Additional parsinget al. (1998) from a highly polymorphic cross between a dou-was done to remove redundant data. If a query sequence hadble-haploid (DH) line of B. oleracea ssp. italica with a DH linesignificant sequence similarity to BACs that overlapped (hadof B. oleracea ssp. alboglabra.overlapping base-pair intervals) or were immediately adjacentThe sequences of BACs used to assemble the A. thalianato each other (had shared beginning or ending nucleotidegenome sequence were downloaded from TIGR, http://www.positions), a single BAC that was assigned the lower nucleotidetigr.org, on May 20, 2001. The number of nucleotides withinposition in the chromosome was recorded. This procedureall BACs totaled 132,101,284 bp. Dr. Eva Huala (Arabidopsiswould cause local/tandem duplications of a single gene withinInformation Resource) kindly provided the order of BACsA. thaliana to be defined as a single locus. The raw and parsedand the estimated starting and ending position for each BACdata sets can be downloaded from http://www.plant.uoguelph.within the A. thaliana genome on February 15, 2001. Theca/faculty/llukens.nucleotide positions of BACs within the genome are estimates.
Collinearity analysis: “Conserved linkage” or “collinearity”Sequencing and plasmid insert information: Brassica DNAmapping fragments were cloned into a pUC18-derived plas- (Ehrlich et al. 1997; Gaut 2001), the conservation of bothmid, pIJ2925, and two sequences were obtained for each clone. synteny and order of orthologous loci between two species,Most of these clones contain PstI fragments of genomic DNA, can be used as a principle to compare the relatedness ofalthough a few pW clones contain EcoRI genomic DNA frag- genomes. We wrote PERL scripts to identify such collinearments, and all have been used in mapping experiments. They regions between B. oleracea and A. thaliana using two differentare present in low-copy number within the Brassica genome definitions of collinearity. The first, “strict” definition defineswith a mean of 1.8 polymorphic loci in B. oleracea. Sequencing two or more loci shared between genomes as collinear onlyreactions were performed using ABI Big-Dye Terminator cycle if the loci are found on the same linkage group within eachsequencing reagents. Reactions contained the ABI mix, species and if the order of loci is the same in both species. TheddH20, 500 ng of plasmid DNA, and 3.2 pmol of M13 forward second, “general” definition was proposed by Gaut (2001).or reverse primer to a final volume of 20 �l. The cycle-sequenc- Under the general definition, collinear segments are defineding conditions were as follows: 25 cycles for 10 sec at 95�, 5 as a series of uninterrupted markers within one chromosomesec at 50�, and 4 min at 60�. Unincorporated nucleotides were [or linkage group (LG)], the “standard,” that is found in aremoved by passing the reaction mixture through a Sephadex common orientation in the second chromosome (or LG), theG-50 column. Sequence reactions were analyzed with an auto- “tester.” In this case, the order of loci is not necessarily themated DNA sequencer (ABI model 377XL or 377-96) and same between the standard and the tester chromosome. In abase-pair calls were confirmed by visual inspection of chroma- comparison between B. oleracea LG 7 (designated O7) and A.tograms. thaliana chromosome (ch.) 5 (designated At5), the differences
To identify molecular markers that had similar sequences between the strict and general definitions can be seen (Figurebut different names, we used blastn (Altschul et al. 1997) 2A). Using the general definition, the identity of a collinearfrom the National Center for Biotechnology Information region may differ depending on which chromosome is the(NCBI; http://www.ncbi.nlm.nih.gov) to perform all pairwise standard and which is the tester (compare Figure 2A to 2B).comparisons between Brassica marker sequences. The follow- Our method to assess the significance of an observed collin-ing markers shared highly similar sequences: pW177 and ear region using both definitions is based on the approachpW148, pN3 and pW200, pN53 and pN96, and pW120 and outlined by Gaut (2001) but has major modifications (seepW101. If two or more similar markers were placed on the B. discussion). If a collinear region with n shared markers wasoleracea genetic map in the same or adjacent positions, one detected, it was scored. The scoring metric S(n) is defined asof the markers was removed from the analysis. Many of the the average distance (in centimorgans) between the loci withinmarker sequences were similar to putative coding sequences the collinear region: that is,within A. thaliana, and it is likely that a large portion of poten-tially orthologous noncoding sequences were omitted due to S(n) � (AR � B)/(2 (n � 1)).low blast scores (e.g., Quiros et al. 2001). A rigorous classifica-
A is the approximate distance (in kilobases) between the outer-tion of marker sequences as coding or noncoding from ourmost loci detected within a collinear region in A. thaliana. Thepreliminary sequence data was difficult because the B. oleraceaterm R is the mean ratio of genetic distance (centimorgans) togenome likely contains a large number of pseudogenes relativephysical distance (kilobases) for the A. thaliana chromosometo A. thaliana (e.g., Quiros et al. 2001).on which the segment lies. R is 135/29,000, 97/17,463, 101/BLAST analysis: To identify BACs with nucleotide se-
quences similar to the Brassica query sequences, we used 23,560, 125/22,140, 139/26,170 for chromosomes 1–5, respec-
362 L. Lukens et al.
two shared loci was 2.31 cM vs. 7.14 cM for three sharedloci. Collinear regions with more than four shared loci wereclaimed to be significant at the 5% level.
The comparative data between B. oleracea and A. thalianawere parsed in two ways before testing for significant collinearregions. Both manipulations tended to increase the numberof observed, collinear regions. First, if two or more markershad similarity to the same BAC in A. thaliana or shared thesame centimorgan location in B. oleracea, we assigned the orderof these markers or sequences relative to each other by eye.Second, in each pairwise comparison between a B. oleracealinkage group and A. thaliana chromosome, each locus on aB. oleracea linkage group was allowed a single position on theA. thaliana chromosome. Duplicates caused the algorithm toidentify unlikely collinear regions. For example, if one linkagegroup of B. oleracea contained three closely linked loci of whichtwo were recently duplicated, then this entire region wouldincorrectly be inferred to be collinear with a region definedby only two loci on an A. thaliana chromosome.
RESULTS
Identification of A. thaliana sequences putatively or-thologous to B. oleracea marker sequences: The A. thali-ana BAC database was queried with sequences from a
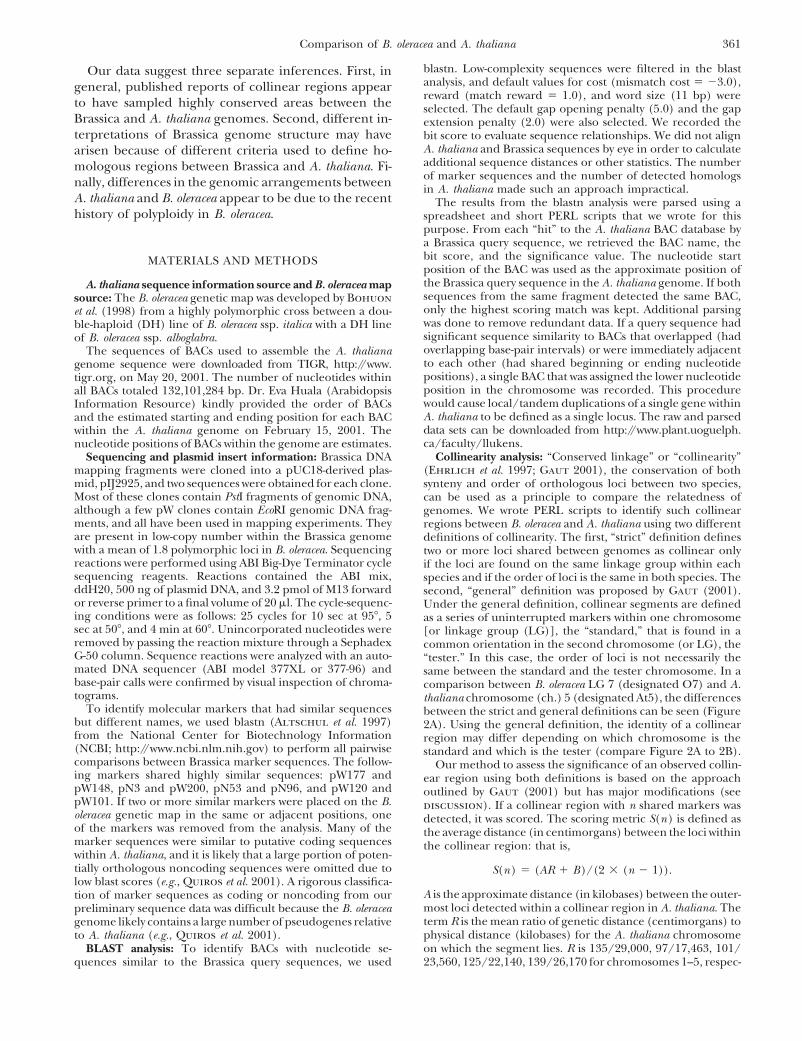
Figure 2.—Comparison of Brassica oleracea O7 and Arabi-total of 158 Brassica DNA probes using the nucleotidedopsis thaliana At5 showing characteristics of the strict andpattern-matching program blastn (Altschul et al.general (Gen.) collinearity definitions. Collinear regions are
identified by vertical lines. Nested collinear runs are identified 1997), and 18,007 BACs had substantial similarity (bitand evaluated by the algorithm but for clarity are not shown score �32) to these query sequences. A. thaliana se-here. (A) The physical order of the BACs within the “standard” quences detected within the initial database search mayA. thaliana chromosome is compared with the rank order of
be derived from ancient, duplicated regions or ancient,markers within the “tester” B. oleracea linkage group. (B) Theparalogous gene family members within the A. thalianagenetic order of the markers within the standard B. oleracea
linkage group is compared with the rank order of BACs within genome (Arabidopsis Genome Initiative 2000). Tothe tester A. thaliana chromosome. *, statistical significance reduce the number of these matches, we first reasonedat P 0.05; **, statistical significance at P 0.01. that Brassica query sequences would have low similarity
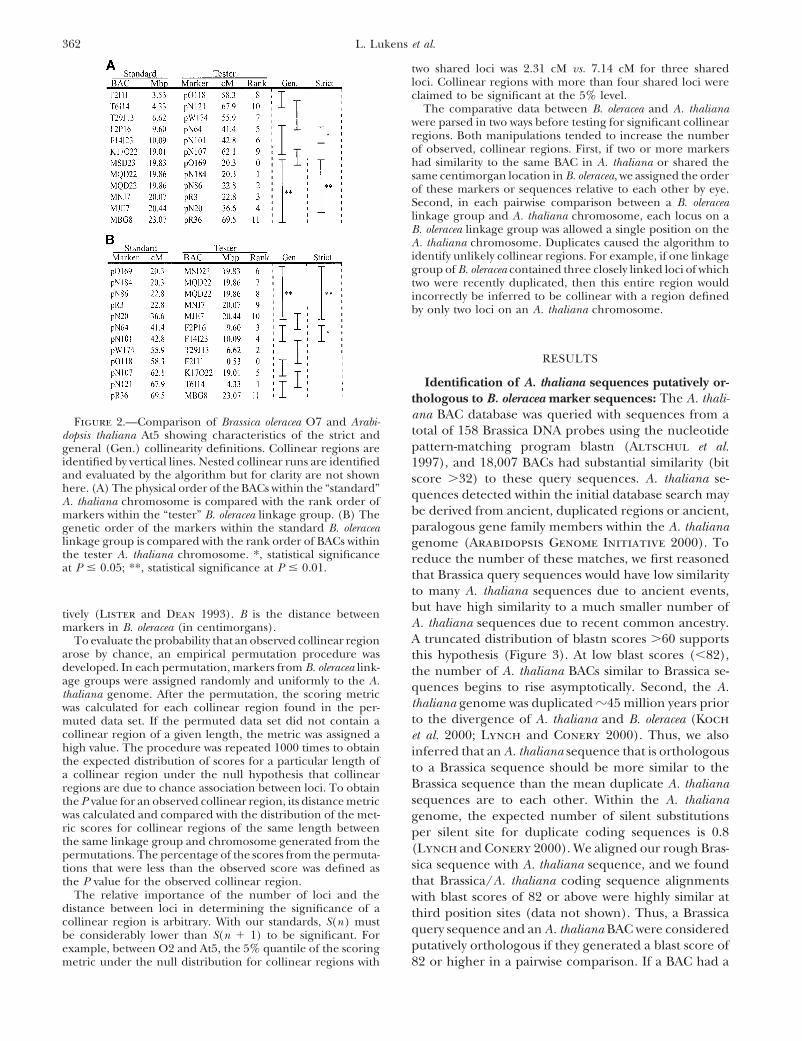
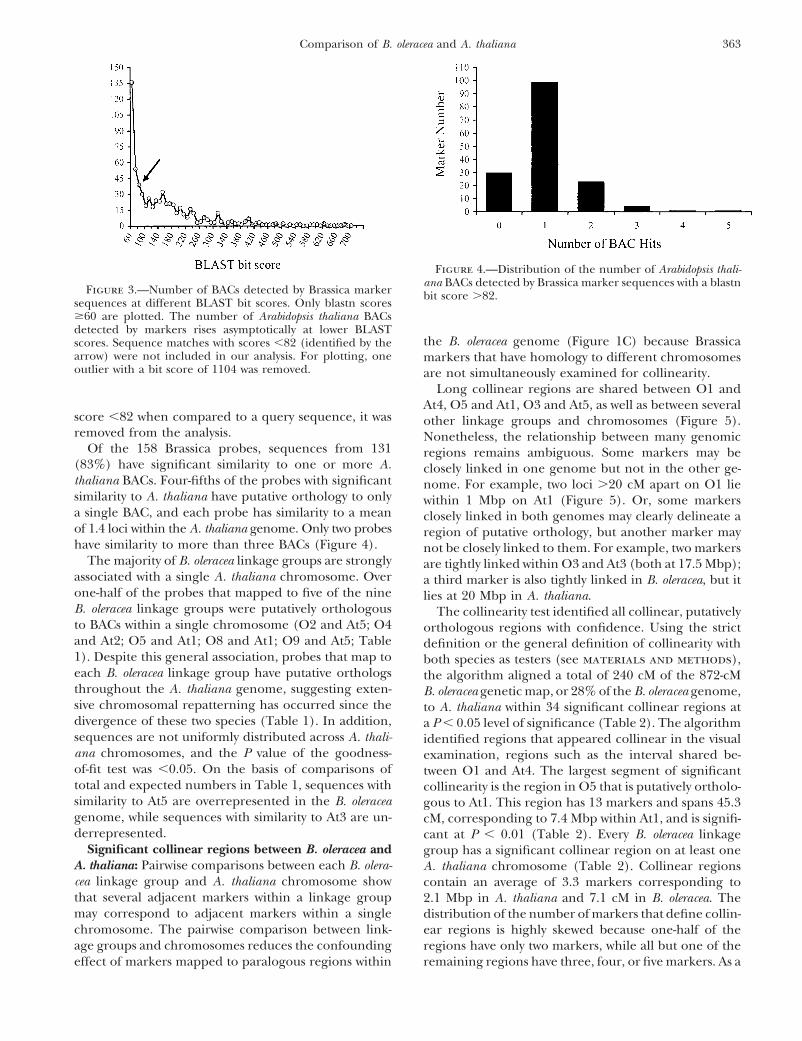
to many A. thaliana sequences due to ancient events,but have high similarity to a much smaller number oftively (Lister and Dean 1993). B is the distance betweenA. thaliana sequences due to recent common ancestry.markers in B. oleracea (in centimorgans).A truncated distribution of blastn scores �60 supportsTo evaluate the probability that an observed collinear region
arose by chance, an empirical permutation procedure was this hypothesis (Figure 3). At low blast scores (�82),developed. In each permutation, markers from B. oleracea link- the number of A. thaliana BACs similar to Brassica se-age groups were assigned randomly and uniformly to the A. quences begins to rise asymptotically. Second, the A.thaliana genome. After the permutation, the scoring metric
thaliana genome was duplicated �45 million years priorwas calculated for each collinear region found in the per-to the divergence of A. thaliana and B. oleracea (Kochmuted data set. If the permuted data set did not contain a
collinear region of a given length, the metric was assigned a et al. 2000; Lynch and Conery 2000). Thus, we alsohigh value. The procedure was repeated 1000 times to obtain inferred that an A. thaliana sequence that is orthologousthe expected distribution of scores for a particular length of to a Brassica sequence should be more similar to thea collinear region under the null hypothesis that collinear
Brassica sequence than the mean duplicate A. thalianaregions are due to chance association between loci. To obtainsequences are to each other. Within the A. thalianathe P value for an observed collinear region, its distance metric
was calculated and compared with the distribution of the met- genome, the expected number of silent substitutionsric scores for collinear regions of the same length between per silent site for duplicate coding sequences is 0.8the same linkage group and chromosome generated from the (Lynch and Conery 2000). We aligned our rough Bras-permutations. The percentage of the scores from the permuta-
sica sequence with A. thaliana sequence, and we foundtions that were less than the observed score was defined asthat Brassica/A. thaliana coding sequence alignmentsthe P value for the observed collinear region.
The relative importance of the number of loci and the with blast scores of 82 or above were highly similar atdistance between loci in determining the significance of a third position sites (data not shown). Thus, a Brassicacollinear region is arbitrary. With our standards, S(n) must
query sequence and an A. thaliana BAC were consideredbe considerably lower than S(n � 1) to be significant. Forputatively orthologous if they generated a blast score ofexample, between O2 and At5, the 5% quantile of the scoring
metric under the null distribution for collinear regions with 82 or higher in a pairwise comparison. If a BAC had a
363Comparison of B. oleracea and A. thaliana
Figure 4.—Distribution of the number of Arabidopsis thali-ana BACs detected by Brassica marker sequences with a blastn
Figure 3.—Number of BACs detected by Brassica marker bit score �82.sequences at different BLAST bit scores. Only blastn scores�60 are plotted. The number of Arabidopsis thaliana BACsdetected by markers rises asymptotically at lower BLAST
the B. oleracea genome (Figure 1C) because Brassicascores. Sequence matches with scores �82 (identified by thearrow) were not included in our analysis. For plotting, one markers that have homology to different chromosomesoutlier with a bit score of 1104 was removed. are not simultaneously examined for collinearity.
Long collinear regions are shared between O1 andAt4, O5 and At1, O3 and At5, as well as between several
score �82 when compared to a query sequence, it was other linkage groups and chromosomes (Figure 5).removed from the analysis. Nonetheless, the relationship between many genomic
Of the 158 Brassica probes, sequences from 131 regions remains ambiguous. Some markers may be(83%) have significant similarity to one or more A. closely linked in one genome but not in the other ge-thaliana BACs. Four-fifths of the probes with significant nome. For example, two loci �20 cM apart on O1 liesimilarity to A. thaliana have putative orthology to only within 1 Mbp on At1 (Figure 5). Or, some markersa single BAC, and each probe has similarity to a mean closely linked in both genomes may clearly delineate aof 1.4 loci within the A. thaliana genome. Only two probes region of putative orthology, but another marker mayhave similarity to more than three BACs (Figure 4). not be closely linked to them. For example, two markers
The majority of B. oleracea linkage groups are strongly are tightly linked within O3 and At3 (both at 17.5 Mbp);associated with a single A. thaliana chromosome. Over a third marker is also tightly linked in B. oleracea, but itone-half of the probes that mapped to five of the nine lies at 20 Mbp in A. thaliana.B. oleracea linkage groups were putatively orthologous The collinearity test identified all collinear, putativelyto BACs within a single chromosome (O2 and At5; O4 orthologous regions with confidence. Using the strictand At2; O5 and At1; O8 and At1; O9 and At5; Table definition or the general definition of collinearity with1). Despite this general association, probes that map to both species as testers (see materials and methods),each B. oleracea linkage group have putative orthologs the algorithm aligned a total of 240 cM of the 872-cMthroughout the A. thaliana genome, suggesting exten- B. oleracea genetic map, or 28% of the B. oleracea genome,sive chromosomal repatterning has occurred since the to A. thaliana within 34 significant collinear regions atdivergence of these two species (Table 1). In addition, a P � 0.05 level of significance (Table 2). The algorithmsequences are not uniformly distributed across A. thali- identified regions that appeared collinear in the visualana chromosomes, and the P value of the goodness- examination, regions such as the interval shared be-of-fit test was �0.05. On the basis of comparisons of tween O1 and At4. The largest segment of significanttotal and expected numbers in Table 1, sequences with collinearity is the region in O5 that is putatively ortholo-similarity to At5 are overrepresented in the B. oleracea gous to At1. This region has 13 markers and spans 45.3genome, while sequences with similarity to At3 are un- cM, corresponding to 7.4 Mbp within At1, and is signifi-derrepresented. cant at P � 0.01 (Table 2). Every B. oleracea linkage
Significant collinear regions between B. oleracea and group has a significant collinear region on at least oneA. thaliana: Pairwise comparisons between each B. olera- A. thaliana chromosome (Table 2). Collinear regionscea linkage group and A. thaliana chromosome show contain an average of 3.3 markers corresponding tothat several adjacent markers within a linkage group 2.1 Mbp in A. thaliana and 7.1 cM in B. oleracea. Themay correspond to adjacent markers within a single distribution of the number of markers that define collin-chromosome. The pairwise comparison between link- ear regions is highly skewed because one-half of theage groups and chromosomes reduces the confounding regions have only two markers, while all but one of the
remaining regions have three, four, or five markers. As aeffect of markers mapped to paralogous regions within

364 L. Lukens et al.
TABLE 1
Number of Arabidopsis thaliana genome sequences detected from Brassica oleracea marker sequences
No. Markers Total Mean loci/Brassica LG markersa with hitsb hitsc At1 At2 At3 At4 At5 marker
O1 24 19 28 3 5 4 9 7 1.5O2 31 28 36 3 6 5 2 20 1.3O3 54 42 56 8 11 12 9 16 1.3O4 26 22 42 9 12 5 7 9 1.9O5 28 26 31 17 2 8 2 2 1.2O6 14 12 19 8 3 2 2 4 1.6O7 33 27 39 7 7 4 8 13 1.4O8 27 22 25 13 2 4 3 3 1.1O9 36 31 44 9 2 3 6 24 1.4Total 273 229 320 77 50 47 48 98 1.4Expectedd 80 54 64 48 74
a Sequenced markers that were on the B. oleracea genetic map.b Markers that were highly similar to an A. thaliana BAC (BLAST bit score �82).c The number of BACs in the A. thaliana genome that are similar to the markers.d Expected number of total hits if Brassica markers were distributed equally on separate A. thaliana chromo-
somes in proportion to their physical length.
result, the median collinear region length is 2.5 markers some distance beyond the outermost loci detected here.An estimate of the true length of a particular segmentcorresponding to 695,000 bp and 2.5 cM. Marker density
may be an important factor in detecting collinear re- can be made using the equation from Nadeau andTaylor (1984). With this correction, the mean esti-gions. O6 has the fewest number of markers and only
a single significant collinear region. mated length of all significant collinear runs is 11.6 cM(median 5.1 cM) in B. oleracea and 3.8 Mbp (medianThe true length of each collinear region extends for
Figure 5.—Pairwise comparison between Brassica oleracea linkage groups and Arabidopsis thaliana chromosomes. The mapposition of B. oleracea probes (cM, y-axis) is plotted against the position of their putative orthologs within A. thaliana (Mbp, x-axis).

365Comparison of B. oleracea and A. thaliana
TABLE 2
Summary of significant collinear regions between Brassica oleracea and Arabidopsis thaliana
Run begin Run endB.o. A.t.LG Ch. Name cM bp BAC Name cM bp BAC S a N b Sig c
1 4 pW239 16.0 14.9 F4D11 pO43 21.3 14.2 T10C21 2.4 3 **1 4 pW105 27.2 10.6 T6K22 pN107 28.5 9.9 T16H5 2.5 2 *1 4 pN97 36.7 7.3 FCAALL pN152 41.4 7.3 FCAALL 2.4 2 *2 5 pW102 57.1 26.7 MXK3 pR34 61.7 21.6 MWD22 4.0 5 **2 5 pW135 68.5 18.1 MMG4 pW218 68.5 18.0 MBD2 0.2 2 **2 3 pR72 75.1 9.5 MPE11 pO125 75.1 9.8 MLJ15 0.7 2 *2 5 pW167 82.7 9.8 F21A20 pO120 83.4 10.0 T1G16 0.9 2 *3 5 pO111 16.3 4.7 T15N1 pN102 18.1 5.0 T20K14 1.8 2 *3 5 pO160 19.9 5.4 MTG13 pW152 28.9 7.4 T6G21 3.2 4 **3 2 pN22 41.9 14.2 F4P9 pN120 43.7 15.6 T2N18 1.7 4 **3 3 pR85 75.4 0.3 F1C9 pO12 81.8 2.2 F17A9 3.6 3 **3 3 pW188 90.1 20.7 T5N23 pO172 100.0 17.4 F12M12 6.1 3 *3 1 pW146 102.0 9.0 F2J7 pN107 131.0 11.2 T19E23 5.0 5 **4 1 pW137 25.3 19.6 F12M16 pO106 34.1 23.4 F2K11 6.6 3 *4 3 pO145 34.1 22.7 F27H5 pN59 57.5 19.6 T18N14 4.6 5 **4 2 pN66 57.5 13.8 T32F6 pO98 57.5 13.2 F7F1 1.6 2 *5 1 pN21 0.0 1.7 T20M3 pN47 45.3 9.1 F28B23 3.1 13 **5 3 pO128 47.0 6.2 MRC8 pN148 49.4 6.4 K24M9 1.6 2 *5 3 pN215 53.6 4.1 MGH6 pO153 53.6 4.1 MGH6 0.0 2 **6 5 pN180 4.8 3.9 MXC9 pR64 6.0 4.4 MXE10 2.1 2 *7 2 pW186 6.6 8.3 F19F24 pW194 6.6 9.0 F5H14 2.1 2 *7 5 pO169 20.3 19.8 MSD23 pN20 36.6 20.4 MJE7 2.4 5 **7 5 pN64 41.4 9.6 F2P16 pN101 42.8 10.1 F14I23 2.0 2 *7 3 pW104 55.8 19.7 ATEM1 pW174 55.9 19.8 T25B15 0.4 2 **7 4 pO29 57.2 2.1 F3E22 pN97 57.9 7.3 FCAALL 0.4 2 **8 4 pR54 0.7 6.7 T20K18 pR36 3.1 12.7 F10M23 9.0 3 *8 3 pN168 1.3 6.0 MKP6 pW205 36.7 21.4 T5P19 16.9 4 *8 1 pO159 14.0 5.7 F17F16 pW138 14.0 5.7 F6I1 0.1 2 **8 1 pW123 59.0 4.8 F7A19 pO92 71.8 2.1 F10K1 18.7 5 **9 4 pR116 0.0 0.0 F6N15 pN213 2.0 0.2 F6N23 1.6 2 *9 1 pO106 49.2 23.4 F2K11 pN173 51.2 21.1 T8L23 3.2 3 **9 5 pO168 54.8 23.9 MHM17 pW240 54.8 24.4 MQJ2 0.5 4 **9 5 pN180 60.7 6.6 T20D1 pR64 71.3 4.4 MXE10 2.7 5 **9 5 pO118 76.6 3.5 F2I11 pO7 77.2 3.6 F15N18 0.6 2 **
B.o., B. oleracea; A.t., Arabidopsis thaliana.a The estimated average distance in centimorgans between markers within a collinear region (the scoring
metric).b The number of markers shared between A. thaliana and B. oleracea within a collinear region.c Sig, statistical significance. *P � 0.05; **P � 0.01.
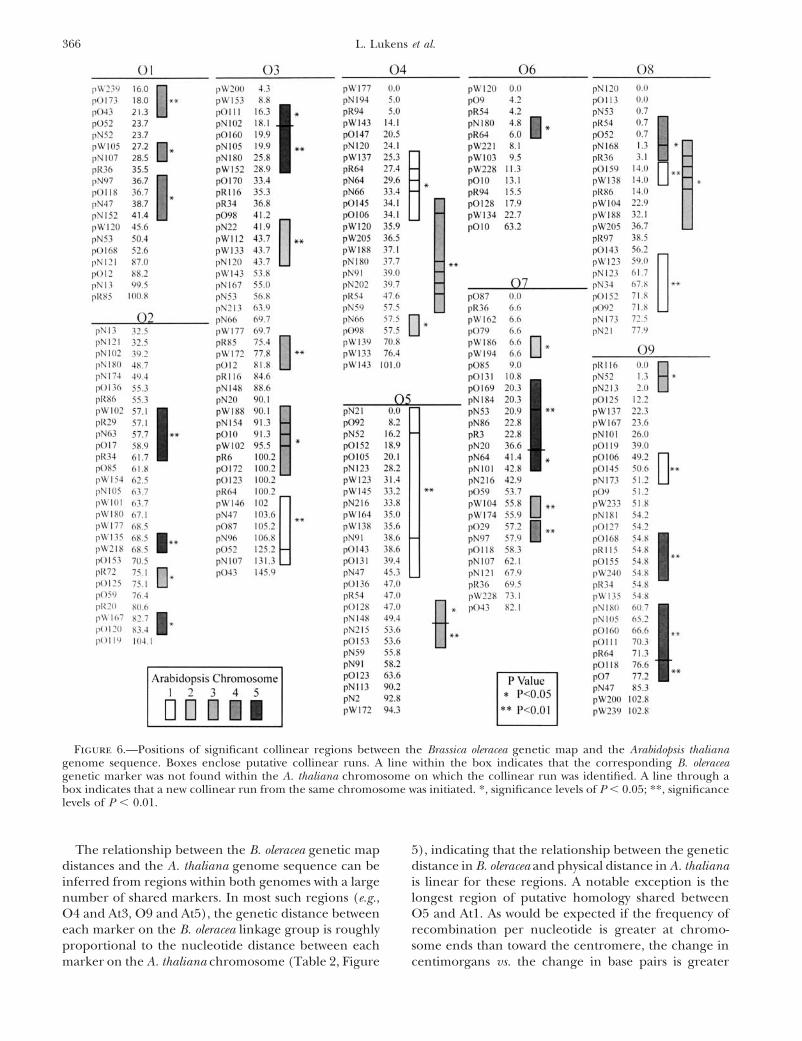
1.2 Mbp) in A. thaliana, accounting for 45% of the B. span 19.8–20.4 Mbp within At5 (Figure 6). Because nei-ther interval corresponds to the known duplicated seg-oleracea genome.
Seven of the nine B. oleracea linkage groups have re- ment within At5 (Arabidopsis Genome Initiative2000), this region likely defines an intrachromosomalgions that are collinear with more than one A. thaliana
chromosome (Figure 6), again suggesting that numer- rearrangement that has occurred since the divergenceof B. oleracea and A. thaliana. Additional collinear seg-ous translocations have occurred since the divergence
of the two species. In addition, closely linked regions ments that are contiguous on the genetic map and hy-bridize to the same A. thaliana chromosome are foundwithin a single B. oleracea linkage group may be collinear
to different segments within the same A. thaliana chro- on O3, O5, and O9. However, within these linkagegroups, neighboring markers on the genetic map havemosome, suggesting intrachromosomal rearrangements.
On O7, for example, one collinear region (pN64–pN101) similarity to the same general area within the A. thalianagenome, indicating either a local rearrangement ofspans 9.6–10.1 Mbp within At5. This region lies adjacent
to another region defined by pO169 and pN20 on the markers or that markers were misplaced on the B. olera-cea genetic map.genetic map, but putative orthologs to these markers
366 L. Lukens et al.
Figure 6.—Positions of significant collinear regions between the Brassica oleracea genetic map and the Arabidopsis thalianagenome sequence. Boxes enclose putative collinear runs. A line within the box indicates that the corresponding B. oleraceagenetic marker was not found within the A. thaliana chromosome on which the collinear run was identified. A line through abox indicates that a new collinear run from the same chromosome was initiated. *, significance levels of P � 0.05; **, significancelevels of P � 0.01.
The relationship between the B. oleracea genetic map 5), indicating that the relationship between the geneticdistance in B. oleracea and physical distance in A. thalianadistances and the A. thaliana genome sequence can be
inferred from regions within both genomes with a large is linear for these regions. A notable exception is thelongest region of putative homology shared betweennumber of shared markers. In most such regions (e.g.,
O4 and At3, O9 and At5), the genetic distance between O5 and At1. As would be expected if the frequency ofrecombination per nucleotide is greater at chromo-each marker on the B. oleracea linkage group is roughly
proportional to the nucleotide distance between each some ends than toward the centromere, the change incentimorgans vs. the change in base pairs is greatermarker on the A. thaliana chromosome (Table 2, Figure

367Comparison of B. oleracea and A. thaliana
between markers at the end of the linkage group than before or after the divergence of A. thaliana from B.oleracea.between markers in the center. At the top of the linkage
group, markers are distantly linked in B. oleracea but The degree of conservation inferred between ge-nomes depends on the cutoff score used to define puta-lie fairly close together on the A. thaliana chromosome.
The slope progressively declines toward the center of tive orthology. In this analysis, if sequence alignmentswith low blastn scores were considered orthologous, ad-the B. oleracea linkage group as the markers approach
the centromere of At1 located at �14 Mbp (Arabidop- ditional collinear regions would be identified. For exam-ple, the marker pW105 is positioned at 27 cM on B.sis Genome Initiative 2000). Markers that are closely
linked in the center of O5 lie very far apart on At1. oleracea LG 1 and is similar to a sequence at 10 Mbp inA. thaliana ch. 4 with a score of 119. Under less stringentcriteria, pW105 could be considered collinear with pR36,
DISCUSSIONa marker positioned at 35 cM on LG 1 and aligned toA. thaliana ch. 4 at 12 Mbp with a blastn score of 74.Sequence similarity and orthology between B. oleracea
and A. thaliana: Identification of orthologous regions Similarly, if only sequence alignments with high blastnscores were considered orthologous, some collinear re-between two genomes depends on correctly identifying
orthologous sequences that are shared between the ge- gions reported in this analysis, such as the region de-fined by markers pO125 and pR72 on LG 2, would notnomes (Figure 1). Orthology and the significance of a
relationship between two sequences are very difficult to be identified. Marker pO125 is positioned at 75 cM andis aligned to a sequence at 9 Mbp on A. thaliana ch. 3infer (Deken 1983; Yuan et al. 1998), especially when
searching a partially duplicated genome such as A. thali- with a blastn score of 234. Marker pR72 is positionedat 75 cM and is aligned to a sequence at 9 Mbp on A.ana (Arabidopsis Genome Initiative 2000). A priori
assumptions about the extent of sequence similarity that thaliana ch. 3 with a blastn score of 92. Finally, Brassicamarkers may be similar to a region of the A. thalianaindicates orthology are problematical for several rea-
sons. For example, two sequences may be considered genome to which other linked Brassica markers have nosimilarity. These singleton hits increase as the stringencyorthologous if they are matched with a high blast score
or significance level (e.g., Wolfe and Shields 1997). for orthology is reduced.Statistical test of collinearity: Probes may be closelyHowever, if the cutoff score is not high enough, se-
quence from one genome could have significant similar- linked in one genome while their orthologs are distantlylinked in another (Figures 1D and 5). In such a case,ity to anciently duplicated paralogs within the second
genome (see Figure 1B). In contrast, one can assume it is difficult to determine if the intervening region be-tween the probes is orthologous. This determinationthat a query sequence from one genome is orthologous
only to the other genome’s sequence to which it is most often depends on the researcher’s judgment, and or-thologous regions may be identified using very liberalsimilar (e.g., Grant et al. 2000). In this case, only a
single sequence from a recent duplication would be criteria (Bennetzen 2000). The collinearity methodpresented here identifies collinear regions between twodetected although both duplicates have the same ances-
tral relationship to the query sequence. genomes and calculates the probability that these re-gions occurred by chance alone. Our method is basedIn this study, we define criteria by which to accept or
reject A. thaliana sequences as likely orthologs to Bras- on the analysis outlined by Gaut (2001). Like Gaut’smethod, this method uses both the number of sharedsica sequences on the basis of the distribution of blastn
scores and the a priori knowledge of expected nucleotide probes between two linkage groups and the distancesbetween those probes as criteria to evaluate a metric ofdifferences between paralogous sequences within the
A. thaliana genome (Lynch and Conery 2000). We collinearity. In addition, this method, like Gaut’s, doesnot define an ad hoc number of probes or an ad hocestimated that the point at which underlying similarity
between two sequences is high enough to indicate re- distance between probes that is required for a collinearregion to be significant. Rather, the metric of an ob-cent common ancestry corresponds to a blastn score of
82. Over four-fifths of Brassica sequences with putative served collinear region is compared against the metricsof collinear regions that would be expected to occur byorthologs in the A. thaliana genome are similar to only
one BAC, indicating that the criteria eliminated an- chance. Finally, in each pairwise comparison betweenlinkage groups, only one copy of a locus and its putativeciently duplicated sequences within the Arabidopsis ge-
nome from the analysis. A few Brassica markers did ortholog may lie on each linkage group. The pairwisecomparisons and the requirement of a single shareddetect loci in duplicated regions of the A. thaliana ge-
nome. For example, pN102 lies on O2 at 39.2 cM and marker reduce the misleading effect of Brassica probesthat map to paralogous loci within the B. oleracea ge-has similarity to a duplicated region between the top of
At3 and At5 at �5 Mbp (Arabidopsis Genome Initia- nome (see Figure 1C).Despite these similarities, this collinearity approachtive 2000). Without an outgroup, it is difficult to infer
whether the small number of A. thaliana duplicated differs from Gaut’s approach in several major respects.First, the metric to evaluate collinear regions integratesloci detected as orthologous to Brassica sequences arose

368 L. Lukens et al.
physical distance from one genome with genetic dis- the number and length of collinear regions. Third, ineach permutation, Brassica probes are uniformly distrib-tance from the other. Second, the collinearity program
evaluates collinear regions nested within longer regions. uted within each Arabidopsis chromosome. However,low-copy sequences tend not to be associated with geno-This characteristic is important because a long collinear
region shared between linkage groups or chromosomes mic regions flanking the centromeres (Arabidopsis Ge-nome Initiative 2000). Finally, we assumed, like Gautmay not be significant, but nested collinear regions
within this long interval may be significant. Third, mark- (2001), that a large number of collinear probes sharedbetween linkage groups is strong evidence for an or-ers that lie at the end of one collinear region and at
the beginning of another collinear region are evaluated thologous region.Several published reports of genome comparisons be-in both positions (i.e., pN121 in Figure 2). Fourth, al-
though both models use empirical permutations to esti- tween A. thaliana and Brassica species were comparedto our results to test the utility of the collinearity algo-mate statistical significance, in each permutation of our
model, markers from each linkage group of one species rithm and the effect of these assumptions. If previouslyidentified collinear regions were among the significantare randomly and uniformly assigned a position within
the second species’ genome. Thus, to evaluate signifi- collinear regions identified by our analysis, then wejudged that our algorithm has high utility. We used twocance, the algorithm compares the metric of each collin-
ear region with the expected distribution of the metric distinct criteria to infer if previously reported homolo-gous/orthologous regions were among those identifiedunder the null hypothesis that collinear regions are due
to chance association between loci across genomes. In by the collinearity analysis. Under the first criterion, tworequirements had to be met. The region of A. thalianacontrast, in Gaut’s permutation, markers from each link-
age group are randomly and uniformly assigned to posi- identified in our analysis must overlap with a regiondetected in the previous analysis. In addition, the B.tions within every linkage group of the second species.
Finally, the algorithm can evaluate genomes for collin- oleracea region identified in our analysis must lie on alinkage group that was likely homologous or homeolo-ear regions using both general and strict definitions of
collinearity. gous to the Brassica linkage group reported previously.A second, less stringent criterion was used if relation-Under the general definition of collinearity, the iden-
tity of collinear regions may depend on which chromo- ships between linkage groups could not be inferredbecause of experimental design (i.e., O’Neill and Ban-some or linkage group is a tester and which is a standard
in the comparison (Figure 2). In this study, if a collinear croft 2000). In this case, we inferred that an observedcollinear region corresponded to previous reports if aregion was detected when a chromosome was used as
both a standard and a tester, it was recorded. Collinear region of A. thaliana within a significant collinear regionin our analysis overlapped with the region of the A.regions identified using the strict definition of collinear-
ity were also recorded. Under the general definition of thaliana genome previously reported as similar.The collinearity test identified almost all putative ho-collinearity, many collinear regions that were significant
when using one chromosome as the tester but not sig- mologous/orthologous regions reported in previousgenetic and/or physical comparative mapping studiesnificant when using the same chromosome as the stan-
dard did not correspond to orthologous intervals. For (Table 3). Out of 22 previously reported regions ofsimilarity, the collinearity test identified 20. In addition,example, the markers pO169 and pR36 define a signifi-
cant, collinear region between O7 and At5 where At5 the test identified several regions that have not beenreported previously and could be targets of future stud-is the standard (Figure 2A). However, within this region,
six markers lie between the last two markers (pN20 and ies. Of the 22 previously characterized regions, 17 werecollinear and significant at P � 0.05, and 3 additionalpR36) within the B. oleracea genetic map, and all six
markers have putative orthologs to different regions regions were collinear but not significant, reflecting theconservative nature of the test. Two published regionswithin At5 (Figure 2B).
Our method of scoring collinear regions, inferring were not identified by our analysis. Our collinearity anal-ysis assigned somewhat more than one-quarter of thecollinearity, and establishing significance is based on
several assumptions. First, when calculating the scoring B. oleracea genetic map to putatively orthologous regionswithin A. thaliana (see below). The fact that our analysismetric, the ratio between genetic distance and physical
distance is assumed to be constant over each A. thaliana identified over three-quarters of the previously reportedcollinear regions suggests both that comparative studieschromosome. Nonetheless, because the genetic dis-
tance and physical distance are known to vary across have not randomly sampled the Brassica genome forregions of collinearity and that long, conserved regionsA. thaliana chromosomes (Copenhaver et al. 1998),
each chromosome is assigned a different centimorgan- may be overrepresented in the literature.Analysis of the ancestral Brassica genome: Severalto-base-pair conversion factor. Second, in the B. oleracea
genetic map, probes are assumed to be in the correct studies have provided evidence that the base Brassicagenome is highly duplicated (Haga 1938; Robbelenorder. Because mapping errors do occur, the collinear-
ity algorithm is conservative and likely underestimates 1960; Truco et al. 1996; Lan et al. 2000). However,

369Comparison of B. oleracea and A. thaliana
TABLE 3
Comparison between published homologous regions and collinear regions
Reference A.t.Reference Brassica Reference Reference B.o. positionspecies position A.t. (ch.) A.t. (Mbp)a Citation LG (Mbp) Collinear
B. oleracea C7 1 27.4 Quiros et al. (2001) O3b 30 NoB. oleracea C4 4 12.3 Quiros et al. (2001) O9b 12.6 Yese
B. oleracea BAC contig 4 7.3 O’Neill and Bancroft (2000) O1c 7.3 YesB. oleracea BAC contig 4 7.3 O’Neill and Bancroft (2000) O7c 7.3 YesB. oleracea BAC contig 4 7.3 O’Neill and Bancroft (2000) O3c 7.3 Yese
B. oleracea BAC contig 5 20.0 O’Neill and Bancroft (2000) O7c 19.8 YesB. oleracea BAC contig 5 20.0 O’Neill and Bancroft (2000) O2c 18.1 YesB. oleracea BAC contig 5 20.0 O’Neill and Bancroft (2000) O9c 23.9 YesB. oleracea C1 3 19.6 Sadowski et al. (1996) O7c 19.8 YesB. oleracea C6 3 19.6 Sadowski et al. (1996) O7c 18.5 YesB. nigra G5 5 7.0 Lagercrantz (1998) O2d 9.8 YesB. nigra G8 5 7.0 Lagercrantz (1998) O3d 5.7 YesB. nigra G2 5 7.0 Lagercrantz (1998) O9d 6.6 YesB. nigra G8 2 14.0 Lagercrantz (1998) O3d 15.6 YesB. nigra G1 2 14.0 Lagercrantz (1998) O4d 13.2 YesB. nigra G6 2 14.0 Lagercrantz (1998) O4d 13.8 YesB. nigra G7 3 1.6 Lagercrantz (1998) O1d 1.3 NoB. nigra G7 3 1.6 Lagercrantz (1998) O3d 2.0 YesB. nigra G1 3 8.1 Lagercrantz (1998) O5d 6.4 YesB. napus N1, N11 4 8.0 Cavell et al. (1998) O1d 7.3 YesB. napus N3, N17 4 8.0 Cavell et al. (1998) O7d 7.3 YesB. napus N8, N18 4 8.0 Cavell et al. (1998) O3c 7.3 Yese
A.t., A. thaliana; B.o., B. oleracea.a The position of a previously reported region within A. thaliana that was similar to Brassica was estimated one of two ways.
An A. thaliana genetic marker(s) was identified within the region of Brassica-Arabidopsis homology, and the BAC location ofthe marker was acquired using Mapviewer (www.arabidopsis.org). Or, Brassica markers within the homologous region weresequenced and the homologous A. thaliana physical position was identified using blastn.
b Homology between the cited linkage group and our linkage group was determined using the relationships inferred by Huet al. (1998).
c Our B. oleracea linkage group and a B. oleracea BAC were considered homologous if both had similarity to the same positionwithin the A. thaliana genome.
d Homeology was determined using the relationships inferred by Lagercrantz and Lydiate (1996) and/or using markersshared in both studies.
e The region was detected by the collinearity algorithm as collinear, but it was not significant at P � 0.05.
Lagercrantz and Lydiate (1996) proposed that the 4). Inferences about whole-genome relationships cangreatly differ depending on the criteria used to inferBrassica genome is largely triplicated, and this hypothe-
sis has been supported by subsequent studies (Lager- those relationships. A future comparison between A.thaliana and a very high-density genetic or physical mapcrantz 1998; O’Neill and Bancroft 2000). This dis-
crepancy is likely due in large part to different criteria of Brassica will be able to resolve conclusively the ques-tion of ancient hexaploidy in Brassica.for inferring genome redundancy. In a visual examina-
tion of our comparative data, we found 15 segments Replication and rearrangements within the B. oleraceagenome: Our analysis does show that numerous chromo-within the A. thaliana genome that are similar but not
necessarily collinear to more than one region of the B. somal translocations, deletions, and duplications differ-entiate A. thaliana from B. oleracea. For example, differ-oleracea genome (Table 4). Of the 15 regions, 5 are
present in two copies, 8 are present in three copies, and ent regions of O3 have high similarity to all five A.thaliana chromosomes (Figure 3). In addition, Brassica2 are present in more than three copies (Table 4).
Because such a large number of A. thaliana regions are markers often have putative orthologs within a regionof the A. thaliana genome to which other linked Brassicafound in triplicate in B. oleracea, this visual inspection
is consistent with the hypothesis that the base diploid markers have no similarity (i.e., between O5 and At4),suggesting that relatively short sequences have trans-Brassica species have evolved from an ancient hexa-
ploid. However, the collinearity test offers little evidence ferred between chromosomes. Such events have beenidentified in the recent evolutionary history of humansfor triplication. The test finds that only 3 of the 15 A.
thaliana intervals are triplicated within B. oleracea (Table (O’Keefe and Eichler, 2000) and in plants (R. Schmidt,

370 L. Lukens et al.
TABLE 4
Putative duplicated regions of similarity shared between A. thaliana and B. oleracea
Interval (Mbp) B. oleracea linkage group
A.t. ch. Start End 1 2 3 4 5 6 7 8 9
1 1 5 � � �1 7 12 � � � �1 20 24 � � �2 10 17 � � �3 1 5 � � �3 4 9 � �3 17 21 � �3 21 23 � �4 0 1 � � �4 6 10 � � �4 12 15 � �5 1 3 � �5 3 7 � � � � � � �5 10 18 � � �5 20 29 � � �
� indicates that a region was identified using the collinearity test and by visual examination of the data. �indicates that a region was identified by visual examination alone.
personal communication). Finally, a putative intrachro- age and microcollinearity studies. The genomes of thegenus Brassica and that of A. thaliana likely divergedmosomal duplication can be seen on O4. Several Bras-
sica probes hybridize to both the top and the bottom �20–24 MYA (Koch et al. 2000, 2001). Although Capsellarubella and A. thaliana are �33% more similar at theof O4 and have putative orthologs within the same posi-
tion in A. thaliana At1, At2, and At4 (Figure 5). This nucleotide level than are B. oleracea and A. thaliana(Koch et al. 2000; Warwick and Black 1997), compari-duplication may be shared by all Brassica species;
Lagercrantz and Lydiate (1996) identified an intra- sons of several kilobases between A. thaliana and C.rubella have revealed perfect collinearity of genes (Ross-chromosomal duplication within the homeologous B.
nigra G6 linkage group. berg et al. 2001). In contrast, comparisons of intervalsbetween A. thaliana and Brassica species have been char-Although inferences about the rate of change within
two genomes require a third, outgroup genome for com- acterized by numerous gene rearrangements or dele-tions (e.g., Grant et al. 1998; Quiros et al. 2001). Inparison, we nonetheless suggest that most rearrange-
ments reported here occurred within the Brassica lin- addition, restriction fragment length polymorphismmarkers spanning most of A. thaliana chromosome 4eage since its divergence from the Brassica-Arabidopsis
common ancestor. If the A. thaliana genome has had are almost perfectly collinear with two C. rubella linkagegroups (Acarkan et al. 2000). This conservation ofmany duplications since its divergence from the Bras-
sica-Arabidopsis common ancestor, one would expect marker order contrasts with the extensive rearrange-ments between the Brassica and Arabidopsis genomes.that more than one region of the A. thaliana genome
would correspond to a single region within B. oleracea. This study does not rigorously substantiate the hypothe-sis that extensive genome rearrangements occurred onThis occurs infrequently (Figure 4), and only two re-
gions of the B. oleracea genome were found by the collin- the Brassica lineage because Capsella is more closelyrelated to Arabidopsis than is Brassica. As a result, it isearity test to be associated with more than one region
in A. thaliana (Figure 6). Likewise, if many large dele- possible (although unlikely) that the common ancestorof Arabidopsis/Capsella and Brassica had a Brassica-liketions have occurred in the A. thaliana genome since its
divergence from the Brassica-Arabidopsis common ances- genome structure.The large number of differences between the ge-tor, large portions of the B. oleracea genome would not
be similar to regions within the A. thaliana genome. nomes may in part have been the result of the recentpolyploidization of B. oleracea. Extensive repatterningWith the possible exception of the top of O6, all regions
of B. oleracea have similarity to A. thaliana regions (Table of a genome subsequent to polyploidization has beensuggested to account for the scattered, duplicate seg-1, Figure 5). The concept that genome change has oc-
curred predominantly during Brassica evolution (as op- ments within the yeast genome (Wolfe and Shields1997), and such repatterning has been observed withinposed to Arabidopsis) is also consistent with both link-

371Comparison of B. oleracea and A. thaliana
tance gene in Brassica and Arabidopsis. Proc. Natl. Acad. Sci. USAthe plant paleopolyploids Zea mays (Helentjaris et al.95: 15843–15848.
1988; Gaut 2001) and A. thaliana (Arabidopsis Ge- Haga, T., 1938 Relationship of genome to secondary pairing innome Initiative 2000). In both Brassica and wheat Brassica. Jpn. J. Genet. 13: 277–284.
Helentjaris, T., D. Weber and S. Wright, 1988 Identification of(Song et al. 1995; Liu et al. 1998; Shaked et al. 2001),the genomic locations of duplicate nucleotide sequences in maizepolyploidization has been shown to be accompanied by by analysis of restriction fragment length polymorphism. Genetics
rapid genome change. Nonetheless, genome evolution 118: 353–356.Hu, J., J. Sadowski, T. C. Osborn, B. S. Landry and C. F. Quiros,has been proposed to occur rapidly in diploids as well
1998 Linkage alignment from four independent Brassica oleraceaas polyploids (Brubaker et al. 1999). The structure of RFLP maps. Genome 41: 226–235.an outgroup genome such as Aethionema grandiflora Koch, M., B. Haubold, and T. Mitchell-Olds, 2000 Comparative
evolutionary analysis of chalcone synthase and alcohol dehydrogenase(Galloway et al. 1998) could be used to estimate theloci in Arabidopsis, Arabis, and related genera. Mol. Biol. Evol. 17:rate of change on the Brassica and Arabidopsis lineages 1482–1498.
and test the correlation between polyploidy and genome Koch, M., B. Haubold and T. Mitchell-Olds, 2001 Molecularsystematics of the Brassicaceae : evidence from coding plastidicchange.matK and nuclear chs sequences. Am. J. Bot. 88: 534–544.
We thank the Arabidopsis Genome Initiative for open access to the Kowalski, S., T. Lan, K. Feldmann and A. Paterson, 1994 Compar-sequence data. Financial support was provided by a National Science ative mapping of Arabidopsis thaliana and Brassica oleracea chromo-
somes reveal islands of conserved organization. Genetics 138:Foundation Postdoctoral Fellowship in Bioinformatics to L.L. and a499–510.National Science Foundation grant to T.O.
Lagercrantz, U., 1998 Comparative mapping between Arabidopsisthaliana and Brassica nigra indicates that Brassica genomes haveevolved through extensive genome replication accompanied bychromosome fustions and frequent rearrangements. GeneticsLITERATURE CITED150: 1217–1228.
Acarkan, A., M. Rossberg, M. Koch and R. Schmidt, 2000 Com- Lagercrantz, U., and D. Lydiate, 1996 Comparative genome map-parative genome analysis reveals extensive conservation of ge- ping in Brassica. Genetics 144: 1903–1910.nome organization for Arabidopsis thaliana and Capsella rubella. Lan, T., and A. Paterson, 2000 Comparative mapping of quantita-Plant J. 23: 55–62. tive trait loci sculpting the curd of Brassica oleracea. Genetics 155:
Altschul, S., T. Madden, A. Schaffer, J. Zhang, Z. Zhang et al., 1927–1954.1997 Gapped BLAST and PSI-BLAST: a new generation of pro- Lan, T., T. Delmonte, K. Reischmann, J. Hyman, S. Kowalski ettein database search programs. Nucleic Acids Res. 25: 3389–3402. al., 2000 An EST-enriched comparative map of Brassica oleracea
Arabidopsis Genome Initiative, 2000 Analysis of the genome se- and Arabidopsis thaliana. Genome Res. 10: 776–788.quence of the flowering plant Arabidopsis thaliana. Nature 408: Lister, C., and C. Dean, 1993 Recombinant inbred lines for map-796–812. ping RFLP and phenotypic markers in Arabidopsis thaliana. Plant
Bennetzen, J., 2000 Comparative sequence analysis of plant nuclear J. 4: 745–750.genomes: microcolinearity and its many exceptions. Plant Cell Liu, B., J. M. Vega and M. Feldman, 1998 Rapid genomic changes12: 1021–1029. in newly synthesized amphiploids of Triticum and Aegilops. II.
Bohuon, E. J. R., L. D. Ramsay, J. A. Craft, A. E. Arthur, D. F. Changes in low-copy coding DNA sequences. Genome 41: 535–Marshall et al., 1998 The association of flowering time quanti- 542.tative trait loci with duplicated regions and candidate loci in Lynch, M., and J. Conery, 2000 The evolutionary fate and conse-Brassica oleracea. Genetics 150: 393–401. quences of duplicate genes. Science 290: 1151–1155.
Brubaker, C. L., A. H. Paterson and J. F. Wendel, 1999 Compara- Nadeau, J., and B. Taylor, 1984 Lengths of chromosomal segmentstive genetic mapping of allotetraploid cotton and its diploid pro- conserved since divergence of man and mouse. Proc. Natl. Acad.genitors. Genome 42: 184–203. Sci. USA 81: 814–818.Camargo, L. E. A., L. Savides, G. Jung, J. Nienhuis and T. C. Osborn,O’Keefe, C., and E. Eichler, 2000 The pathological consequences1997 Location of the self-incompatability locus in an RFLP and
and evolutionary implications of recent human genetic duplica-RAPD map of B. oleracea. J. Hered. 88: 57–60.tions, pp. 29–46 in Comparative Genomics, edited by D. SankoffCavell, A. C., D. Lydiate, I. Parkin, C. Dean and M. Trick, 1998and J. H. Nadeau. Kluwer Academic Publishers, Dordrecht, TheCollinearity between a 30cM segment of Arabidopsis thaliana chro-Netherlands.mosome 4 and duplicated regions within the Brassica napus ge-
O’Neill, C., and I. Bancroft, 2000 Comparative physical mappingnome. Genome 41: 62–69.of the genome of Brassica oleracea var. alloglabra that are homeolo-Copenhaver, G., W. Browne and D. Preuss, 1998 Assaying ge-gous to sequenced regions of chromosome 4 and 5 of Arabidopsisnome-wide recombination and centromere functions with Arabi-thaliana. Plant J. 23: 233–243.dopsis tetrads. Proc. Natl. Acad. Sci. USA 95: 247–252.
Parkin, I., 2000 Unraveling crucifer genomes through comparativeDeken, J., 1983 Probabilistic behavior of longest common subse-mapping, pp. 425–437 in Comparative Genomics, edited by D. San-quence length, pp. 359–362 in Time Warps, String Edits, and Macro-koff and J. H. Nadeau. Kluwer Academic Publishers, Dordrecht,molecules: The Theory and Practice of Sequence Comparison, edited byThe Netherlands.D. Sankoff and J. Kruskal. Addison-Wesley, Reading, MA.
Parkin, I., D. J. Lydiate and M. Trick, 2002 Assessing the level ofEhrlich, J., D. Sankoff and J. Nadeau, 1997 Synteny conservationcollinearity between Arabidopsis thaliana and Brassica napus for A.and chromosome rearrangements during mammalian evolution.thaliana chromosome 5. Genome 45: 356–366.Genetics 147: 289–296.
Quiros, C. F., F. Grellet, J. Sadowski, T. Suzuki, G. Li et al., 2001Galloway, G. L., R. L. Malmberg and R. A. Price, 1998 Phyloge-Arabidopsis and Brassica comparative genomics: sequence, struc-netic utility of the nuclear gene arginine decarboxylase: an exam-ture and gene content in the ABI1-RPS2-Ck1 chromosomal seg-ple from Brassicaceae. Mol. Biol. Evol. 15: 1312–1320.ment and related regions. Genetics 157: 1321–1330.Gaut, B., 2001 Patterns of chromosomal duplication in maize and
Robbelen, G., 1960 Beitrage zur analyse des Brassica genomes. Chro-their implications for comparative maps of the grasses. Genomemosoma 11: 205–228.Res. 11: 55–66.
Rossberg, M., K. Theres, A. Acarkan, R. Herrero, T. Schmitt etGrant, D., P. Cregan and R. Shoemaker, 2000 Genome organiza-al., 2001 Comparative sequence analysis reveals extensive micro-tion in dicots: genome duplication in Arabidopsis and syntenycolinearity in the lateral suppressor regions of the tomato, Arabi-between soybean and Arabidopsis. Proc. Natl. Acad. Sci. USA 97:dopsis, and Capsella genomes. Plant Cell 13: 979–988.4168–4173.
Ryder, C. D., L. B. Smith, G. R. Teakle and G. J. King, 2001 Con-Grant, M., J. McDowell, A. Sharpe, M. de Torres Zabala, D.Lydiate et al., 1998 Independent deletions of a pathogen-resis- trasting genome organisation: two regions of the Brassica oleracea

372 L. Lukens et al.
genome compared with collinear regions of the Arabidopsis thali- intra-genomic homology of the Brassica genomes: implicationsfor their origin and evolution. Theor. Appl. Genet. 93: 1225–1233.ana genome. Genome 44: 808–817.
Schranz, M. E., P. Quijada, S. Sung, L. Lukens, R. Amasino et al., Warwick, S. I., and L. D. Black, 1997 Phylogenetic implications of2002 Characterization and effects of the replicated flowering chloroplast DNA restriction site variation in subtribes Raphaninaetime gene FLC in Brassica rapa. Genetics 162: 1457–1468. and Cakilinae (Brassicaceae, tribe Brassicieae). Can. J. Bot. 75:
Shaked, H., K. Kashkush, H. Ozkan, M. Feldman and A. Levy, 2001 960–973.Sequence elimination and cytosine methylation are rapid and Wolfe, K., and D. Shields, 1997 Molecular evidence for an ancientreproducible responses of the genome to wide hybridization and duplication of the entire yeast genome. Nature 387: 708–713.allopolyploidy in wheat. Plant Cell 13: 1749–1759. Yuan, Y., O. Eulenstein, M. Vingron and P. Bork, 1998 Toward
Song, K., P. Lu, K. Tang and T. Osborn, 1995 Rapid genome detection of orthologues in sequence databases. Bioinformaticschange in synthetic polyploids of Brassica and its implications for 14: 285–289.polyploid evolution. Proc. Natl. Acad. Sci. USA 92: 7719–7723.
Truco, M. J., J. Hu, J. Sadowski and C. F. Quiros, 1996 Inter- and Communicating editor: O. Savolainen