Dynamics of the Genetic Regulatory Network for Arabidopsis thaliana Flower Morphogenesis
13
J . theor . Biol . (1998) 193, 307–319 Article No . jt980701 0022–5193/98/140307 + 13 $30.00/0 7 1998 Academic Press Dynamics of the Genetic Regulatory Network for Arabidopsis thaliana Flower Morphogenesis L M E R. A-B* Lab . de Gene´tica Molecular y Evolucio´n , Instituto de Ecologı´a , UNAM, Ap . Postal 70-275, Coyoaca´ n , D.F. CP04510, Mexico (Received on 26 September 1997, Accepted in revised form on 3 March 1998) We present a network model and its dynamic analysis for the regulatory relationships among 11 genes that participate in Arabidopsis thaliana flower morphogenesis. The topology of the network and the relative strengths of interactions among these genes were based from published genetic and molecular data, mainly relying on mRNA expression patterns under wild type and mutant backgrounds. The network model is made of binary elements and we used a particular dynamic implementation for the network that we call semi-synchronic. Using this method the network reaches six attractors; four of them correspond to observed patterns of gene expression found in the floral organs of Arabidopsis (sepals, petals, stamens and carpels) as predicted by the ABC model of flower morphogenesis. The fifth state corresponds to cells that are not competent to flowering, and the sixth attractor predicted by the model is never found in wild-type plants, but it could be induced experimentally. We discuss the biological implications and the potential use of this network modeling approach to integrate functional data of regulatory genes of plant development. 7 1998 Academic Press 1. Introduction As experimental data on gene function and regulatory interactions accumulate in biological model systems, the need of formal and modeling paradigms for functional inference and integration of large data sets is becoming imminent. In this paper we put forward a first trial to apply dynamic analyses of a genetic regulatory network model to integrate molecular and genetic data of Arabidopsis thaliana genes involved in flowering morphogenesis. In contrast to cascade or hierarchical models of regulatory genes, that are widely used in molecular biology (see for example Kornfeld, 1997), models of genetic regulatory networks consider direct and indirect feedback regulatory relationships (Garzon, 1990). Such feed- back regulatory interactions are analogous to those present in metabolic routes, in which the product of a reaction regulates its own synthesis rate. The product of a certain gene might also regulate its own transcription rate directly or indirectly. Feedback loops make genetic regulatory network models dynamic systems, which may have fixed or periodic activity patterns. Moreover, feedback loops, charac- teristic of genetic regulatory networks, constitute the necessary mechanism to explain multiple equilibria and homeostasis of a given network (Thieffry et al ., 1995; Thomas, 1991; Thomas & D’Ari, 1990; Thomas et al ., 1995). Transcriptional and post-transcriptional regulation are central issues for understanding the origin of cellular differentiation. Each cell type can be identified by its molecular profile (i.e. by the pattern of all molecular markers present in the cell), and in theory the cellular identity might be determined by describing all the active genes in the cell (Kauffman, 1969, 1991, 1993). Gene activity, in turn, depends on * Present address: Department of Biology and Centre for Molecular Genetics, UCSD, La Jolla, CA 92037, U.S.A.
-
Upload
ingenieria110 -
Category
Documents
-
view
2 -
download
0
Transcript of Dynamics of the Genetic Regulatory Network for Arabidopsis thaliana Flower Morphogenesis

J. theor. Biol. (1998) 193, 307–319Article No. jt980701
0022–5193/98/140307+13 $30.00/0 7 1998 Academic Press
Dynamics of the Genetic Regulatory Network for Arabidopsis thalianaFlower Morphogenesis
L M E R. A-B*
Lab. de Genetica Molecular y Evolucion, Instituto de Ecologıa, UNAM, Ap. Postal 70-275,Coyoacan, D.F. CP04510, Mexico
(Received on 26 September 1997, Accepted in revised form on 3 March 1998)
We present a network model and its dynamic analysis for the regulatory relationships among 11 genesthat participate in Arabidopsis thaliana flower morphogenesis. The topology of the network and therelative strengths of interactions among these genes were based from published genetic and moleculardata, mainly relying on mRNA expression patterns under wild type and mutant backgrounds. Thenetwork model is made of binary elements and we used a particular dynamic implementation for thenetwork that we call semi-synchronic. Using this method the network reaches six attractors; four ofthem correspond to observed patterns of gene expression found in the floral organs of Arabidopsis(sepals, petals, stamens and carpels) as predicted by the ABC model of flower morphogenesis. The fifthstate corresponds to cells that are not competent to flowering, and the sixth attractor predicted by themodel is never found in wild-type plants, but it could be induced experimentally. We discuss thebiological implications and the potential use of this network modeling approach to integrate functionaldata of regulatory genes of plant development.
7 1998 Academic Press
1. Introduction
As experimental data on gene function and regulatoryinteractions accumulate in biological model systems,the need of formal and modeling paradigms forfunctional inference and integration of large data setsis becoming imminent. In this paper we put forwarda first trial to apply dynamic analyses of a geneticregulatory network model to integrate molecular andgenetic data of Arabidopsis thaliana genes involved inflowering morphogenesis. In contrast to cascade orhierarchical models of regulatory genes, that arewidely used in molecular biology (see for exampleKornfeld, 1997), models of genetic regulatorynetworks consider direct and indirect feedbackregulatory relationships (Garzon, 1990). Such feed-back regulatory interactions are analogous to those
present in metabolic routes, in which the product ofa reaction regulates its own synthesis rate. Theproduct of a certain gene might also regulate its owntranscription rate directly or indirectly. Feedbackloops make genetic regulatory network modelsdynamic systems, which may have fixed or periodicactivity patterns. Moreover, feedback loops, charac-teristic of genetic regulatory networks, constitute thenecessary mechanism to explain multiple equilibriaand homeostasis of a given network (Thieffry et al.,1995; Thomas, 1991; Thomas & D’Ari, 1990; Thomaset al., 1995).
Transcriptional and post-transcriptional regulationare central issues for understanding the origin ofcellular differentiation. Each cell type can beidentified by its molecular profile (i.e. by the patternof all molecular markers present in the cell), and intheory the cellular identity might be determined bydescribing all the active genes in the cell (Kauffman,1969, 1991, 1993). Gene activity, in turn, depends on
* Present address: Department of Biology and Centre forMolecular Genetics, UCSD, La Jolla, CA 92037, U.S.A.

. . . -308
the presence of one or several transcription factors,which are themselves gene products, creating in thisway a functional interdependence among a largegroup of genes. These groups of genes regulating theactivity of each other are known as genetic regulatorynetworks. Formal dynamic analyses of these net-works can be useful to explore the possible long-termgenetic activation patterns (called attractors) of agiven genotype. Such attractors have been identifiedwith the different cell types of an organism(Kauffman, 1993; Zuckerkandl, 1994), thus in orderto achieve cellular differentiation it would be sufficientto give a perturbation to the genetic regulatorynetwork to change from one attractor to another. Theperturbation might be in the form of a morphogen oran environmental factor, and the identification ofsuch signaling factors or molecules is a matter ofintensive experimental research (see Wolpert, 1996).
Many studies have explored the behavior of partialhypothetical regulatory networks (Kauffman, 1993;Clarket et al., 1993), but there are few publishedapplications of this dynamic approach to specificbiological systems. Most of the published applicationsare for Drosophila melanogaster (Burstein, 1995;Reinitz & Sharp, 1995; Spirov, 1996) for whichabundant genetic and molecular data has accumu-lated over the past few years. From this kind of modelit has been possible to acquire insights that could havenot been reached otherwise. For example, thesemodels have suggested that a small group of homeoticproteins are sufficient to coordinate morphogenesis(Burstein, 1995), that the connectivity of the networkdetermines a metabolic pathway (McAdams &Shapiro, 1995), or that it is possible to find acorrelation among biochemical regulators and mor-phogenesis even when the mechanism is notcompletely known (Mjolsness et al., 1991). Networkmodels have been useful to make inferences onthe evolutionary pathway of a group of regulatorygenes (Spirov, 1996), or even to suggest missingcomponents of a regulatory system (Loomis &Sternberg, 1995).
During recent years much has been learned aboutthe genetic and molecular basis of flower morphogen-esis in Arabidopsis thaliana (Coen, 1991; Weigel, 1995;Yanofsky, 1995). We used published genetic andmolecular data for 11 genes to construct a geneticregulatory network for Arabidopsis thaliana flowermorphogenesis and we provide analyses of thedynamic behavior of this network. To our knowledge,this is the first genetic regulatory network model fora plant, or part of a plant. We are particularlyinterested in the dynamics of the genetic regulatorynetwork and we explore the hypothesis that the
attractors of a network correspond to the activationstates of specific cell groups. In this paper, wespecifically addressed if the four gene activationstates predicted by the ABC model of Arabidopsisflower morphogenesis (Meyerowitz, 1994a; see later)can be recovered as stable activation states of theregulatory network model that we put forward. Wefound that the dynamics of the network predicts sixstable states: the four gene activation states of theABC model, an activation state of cells in vegetativetissue, and anactivation state not found in wild-typeplants.
1.1.
Flowers of Arabidopsis thaliana (hereafter Ara-bidopsis) are formed by four concentric whorls offlower organs made of, from outside to inside: foursepals (whorl 1), four petals (whorl 2), six stamens(whorl 3) and two fused carpels (whorl 4). Thisparticular organization can be disrupted by mutationsin different genes, and the analysis of such mutationshave led to the proposition of a combinatorial modelthat has been used extensively to describe themorphology of Arabidopsis flowers in wild-type andmutant plants (Fig. 1). The so-called ABC model(Coen & Meyerowitz, 1991; Meyerowitz 1994a)postulates the existence of three different activities (A,B and C) which are each active in two adjacentwhorls, and their combination determines the identityof the organs that develop in the flowers. Accordingto the model, the presence of activity A will determinethe differentiation of sepals, a combination ofactivities A and B will result in petals, while thepresence of both B and C will give rise to stamens, andfinally activity C alone results in the formation ofcarpels. Additionally, the ABC model postulates amutual inhibition between activities A and C, suchthat when function A is absent function C substitutesit and vice versa.
There are several specific genes related to the threeabove mentioned activities. APETALA1 (AP1) andAPETALA2 (AP2) have been considered A functiongenes (Bowman et al., 1991, 1993. In the Arabidopsisliterature, proteins are abbreviated using uppercaseletters, wild-type genes with uppercase italics, andmutated genes with lowercase italics), because plantsmutated in either gene yield flowers lacking sepals andpetals. However, while molecular data confirmed theexpected spatial distribution of AP1 mRNA accord-ing to the ABC model (Mandel et al., 1992), AP2mRNA is present throughout the flower and is alsopresent in non-floral organs (Jofuku et al., 1994).Even though AP2 might be regulated at a

Wild type
A–
B–
C–
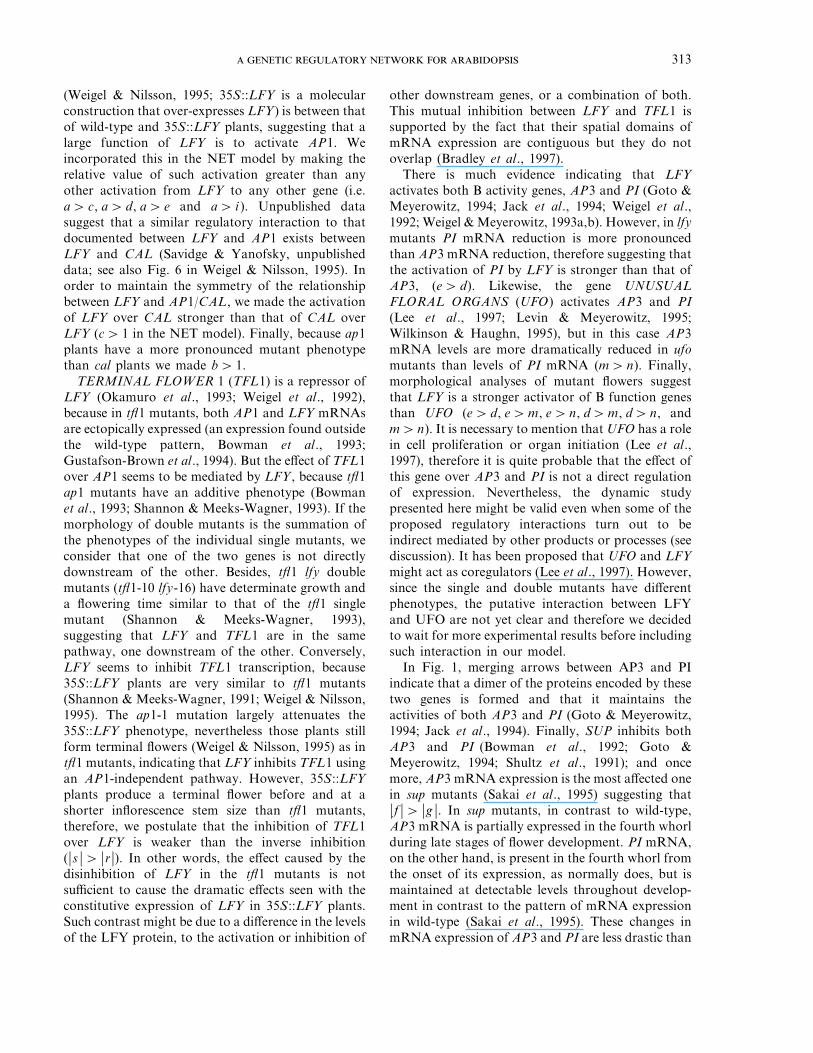
a>ba>ca>da>ea>ia>|o|b>lc>ld>|f |d>md>ne>de>ne>|g|| f |>|g|
|p|>|q||s|>|r|
|h|>i| j|>km>n
po h a
k
j sr
l
c g
d
mn
f
e
bi
q
309
F. 1. The ABC combinatorial model proposes that the fourdifferent floral organs are determined by the specific combinationof three different functions or activities. Activity A specifies sepals,activities A and B specify petals, activities B and C specify stamens,and activity C alone specifies carpels. Additionally, the ABC modelpostulates a mutual inhibition between activities A and C, such thatwhen the function A is absent function C takes its place and viceversa. The rightmost figures are schematic representations ofArabidopsis thaliana flowers, which in wild-type plants (top) arecomposed from the outside to the inside of four sepals, four petals,six stamens and two carpels. Mutants in genes that confer each ofthe three floral activities and their effect on floral morphology areshown. se= sepals, pe=petals, st= stamens, ca=carpels, se* =an iteration of sepals, petals and petals.
Meyerowitz, 1991; Ma, 1994; Meyerowitz, 1994a) andtransgenic plants (Krizek & Meyerowitz, 1996;Mizukami & Ma, 1992). Moreover, the molecular andgenetic mechanisms implied in this model seem to beconserved in virtually all angiosperms (Bowman,1997; but see Vergara & Alvarez-Buylla, 1997).
2. The Network Model
We reviewed the literature looking for molecularand/or morphological data that could reveal theregulatory interactions among 11 genes involved inflowering morphogenesis of Arabidopsis. Four ofthese genes are the ABC genes described above. Basedon this information we constructed the geneticregulatory network that we present as the NET modelin Fig. 2. Most of the postulated gene interactionsrepresent regulatory interactions at the transcrip-tional level. Each element in the network representsone gene with one exception: the element referred toas BFU in the network implementation denotes aprotein heterodimer formed by AP3 and PI, thiscomplex forms an active transcription factor (seelater), therefore this interaction is represented bymerging arrows acting over AP3 and PI. Further
F. 2. The NET model. Arrows represent activations andflat-end lines represent inhibitions. Genes included are EMBRY-ONIC FLOWER 1 (EMF1), TERMINAL FLOWER 1 (TFL1),LEAFY (LFY), APETALA1 (AP1), CAULIFLOWER (CAL),LEUNIG (LUG), UNUSUAL FLORAL ORGANS (UFO),APETALA3 (AP3), PISTILLATA (PI), and SUPERMAN (SUP).Lowercase letters indicate the weight of interactions whileinequalities at the left are the relative values inferred fromexperimental data. Absolute values represent the effect ofde-repression, for example vh v q i means that the absence of therepression of TFL1 has a stronger impact over AG expression thanits activation by LFY.
post-transcriptional level, for simplicity we willconsider AP1 as the only A function gene. On theother hand, it is known that APETALA3 (AP3) andPISTILLATA (PI) constitute the B activity (Krizek& Meyerowitz, 1996). Finally, AGAMOUS (AG) isthe only reported C function gene (Bowman et al.,1991; Sieburth et al., 1995; Yanofsky, 1995; Yanofskyet al., 1990). Even though some authors havesuggested minor modifications to the ABC model(Ma, 1994; Ray et al., 1994) based on new moleculardata, the model has been very robust for describingoverall flower morphology of mutant (Coen &
. . . -310
more, molecular data enabled us to obtain the sign ofeach interaction (activation or inhibition, arrow-heador dash-head, respectively), and the relative strengthof many interactions. We explain case by case thelogic that led us to each of these relative values.
2.1.
We wanted to know if the dynamics of the geneticregulatory network leads to attractors that corre-spond to the genetic activities proposed in the ABCmodel for each of the four floral organs. Despite thegreat advances in the studies of gene expression ofArabidopsis, the published molecular data is stillqualitative. Nevertheless, we have used this data toput forward the first network architecture and weexplore the final stable patterns of gene activity(attractors of the network).
We do not have data regarding rates oftranscription but rather know only if a gene is eitheractive or inactive at certain time intervals. Further-more, the spatial resolution of such data does notprovide information on the expression dynamics ofgenes inside individual cells. Therefore, we cannotconstruct a state transition diagram to infer thenetwork connectivity as has been achieved in somestudies of neural networks (Glass & Young, 1979), orbiochemical control networks (Glass & Kauffman,1973). However, the molecular data at hand provideenough information to establish gene connectivityand a first proposition of the relative effect of someinteractions (see later). Consequently, we decided touse a network realization that takes into account bothgene activation states and relative interaction weights,the implementation takes the form of a differenceequation:
xi (t+1)=H0sN
j=1
wijxj (t)− ui 1 (1)
where H is the Heaviside step function:
H(x)=61 if xq 00 if xE 0
The vector state indicating the activity of the nelements (genes) of the network is represented byX=(x1, x2, . . xn ) where xi $ 40, 15; meaning that agene can only be in either of two states, active (1,maximum transcription rate) or inactive (0). In thisnetwork implementation a gene xi becomes active ifthe weighted input of all the genes regulating itexceeds a certain activation threshold ui . Biologically,thresholds represent the amount of activators/inhibitors needed for turning on/off the transcription
of that gene. Since we do not have any experimentalevidence regarding the magnitude of such thresholds,we used integer values to keep computation simple,i.e. ui $ Z. A similar situation applies for the weights(wij s) of every interaction, thus wij $ Z. Regarding theweights or relative strengths of the interactions,however, we based their sign (positive for activationsand negative for inhibitions) and relative magnitudeson experimental data unless otherwise indicated (seenext section and inequalities in Fig. 2). The relativevalues that we propose here imply differences in thetranscription factors’ efficiency, concentration, orboth. Although we propose here a simple networkmodel with on–off elements, previous theoreticalwork has yielded maps to compare some shareddynamic features between continuous and discretenetworks (Glass, 1975; Glass & Kauffman, 1973).Therefore, the model we present here could be used,in principle, to construct more realistic continuousmodels, that should still keep the same long-termdynamic behaviors.
For our purposes, the thresholding behaviorimplied in eqn (1) was adequate because we were ableto obtain the gene expression patterns observed in theflower, namely, four stationary states correspondingto the four regions of the ABC model that give riseto the floral organs (see ahead). Nevertheless, suchimplementation does not allow for interactions likethose shown in Fig. 2 between the products of AP3and PI. To circumvent this problem we introduced anetwork element (BFU, for B function) receivinginputs only from AP3 and PI, in such a way that itbecomes active if and only if AP3 and PI are bothactive (this is a logical AND function, seeexperimental data later). Finally, we assigned numericvalues to all thresholds and interactions betweenelements of the network. In networks, however,different values might result in different dynamics,therefore we tried to find the lowest integer valuesthat result in the long-term activation patternsobserved in the Arabidopsis flower. Remember thatour objective is to evaluate if the architecture of thenetwork, rather than the specific values, is compatiblewith the observed experimental data. For thatreason, we used the lowest numerical values in ourmodel to avoid as much as possible hypotheses thatcannot be supported by experimental data at themoment.
All interactions among network elements depictedin Fig. 2 are presented in matrix W, where eachelement wij represents the weight of the interactionfrom gene xj to gene xi . Likewise, in vector u the ui srepresent the thresholds of activation for eachnetwork element xi . The order of the elements are

311
EMF1, TFL1, LFY, AP1, CAL, LUG, UFO, BFU,AG, AP3, PI and SUP.
K L K L0 0 0 0 0 0 0 0 0 0 0 0 0G G G G
1 0 −2 0 0 0 0 0 0 0 0 0 0G G G GG G G G−2 −1 0 2 1 0 0 0 0 0 0 0 3G G G G
−1 0 5 0 0 0 0 0 −1 0 0 0 −1G G G GG G G G0 0 2 0 0 0 0 0 0 0 0 0 1G G G G
0 0 0 0 0 0 0 0 0 0 0 0 0G G G GG G G GW=
0 0 0 0 0 0 0 0 0 0 0 0u=
0.
G G G G0 0 0 0 0 0 0 0 0 1 1 0 1G G G G
G G G G0 −2 1 −2 0 −1 0 0 0 0 0 0 −1G G G G
0 0 3 0 0 0 2 1 0 0 0 −2 0G G G GG G G G0 0 4 0 0 0 1 1 0 0 0 −1 0G G G G
0 0 0 0 0 0 0 0 0 0 0 0 0k l k l
The numerical values of matrix W and vector u
were obtained using a genetic algorithm. Weimplemented a program that used only mutations,where a particular value of wij or u i chosen at randomwas changed for another one that fulfilled thefollowing restrictions: (a) inequalities in Fig. 2; (b)network topology (i.e. no interactions were created ordisappeared); and (c) the sign of interactions in Fig. 2.Such procedure was done with a population of 20networks. After each mutation, every network wasstudied to examine if it had as stable states the fourgene activation patterns corresponding to the ABCmodel and to non-flowering. After this step, eachnetwork was assigned with a fitness value. The fitnessvalue was a linear function of the number of desiredfixed points. Finally, to avoid local maxima duringthe selection step, besides the network with thehighest fitness value, a randomly chosen network waskept. These two networks were used to replenish thenetwork population, and the cycle of mutation,assignment of fitness values and selection wererepeated until the population fitness reached amaximum.
The final issue regarding the implementation of theNET model concerns how to solve the transition fromthe vector state X(t) to X(t+1). The easiest way is thesynchronous approach (as in Kauffman, 1969, 1991)in which eqn (1) is applied to all network elements atthe same time. This dynamic description is problem-atic from the biological point of view, because itimplies the unlikely situation in which all the genesrespond exactly at the same time. Conversely, the
asynchronous approach (as in Thomas, 1991) consistsin solving eqn (1) for one network element ateach time step, once the order in which the elementsto be solved has been specified. This asynchronousapproach is also problematic for our purpose, becausethe order for solving eqn (1) might change the geneactivation pattern and the long term stable states,and there is still no experimental data on theprecise order of activation of individual genes. Wetherefore decided to introduce a combined, biologi-cally inspired approach, henceforth named semi-synchronic. In this method, the elements of thenetwork are divided into groups. Hence, eqn (1) issolved synchronically for elements within the samegroup, and asynchronically for elements in differentgroups (see Fig. 3). We used experimental data todecide the order of activation of the different groups.Therefore, we think that this method is moreappealing from the biological point of view, thanprevious ones.
Experimental biologists have grouped the genesrelated to flowering into a hierarchy of four sets ofgenes depending on their time of activation as thetransition to flowering and flower morphogenesisproceeds. For the genes included in our network,EMF1 and TFL1 belong to the first group of genesto become active, namely the group of early and latefloral genes (Coupland, 1995). The next set of genesto become active is the group of meristem identitygenes (Weigel et al., 1992), in which LFY, AP1 andCAL are included. Then, the so-called cadastral genesbecome active (Weigel & Meyerowitz, 1993a), from

t=0t=1t=2
t=0t=1t=2
t=3t=4
t=0t=1t=2t=3t=4
t=5t=6t=7
t=0t=1t=2
t=0t=1t=2t=3
t=3t=4
t=0t=1t=2t=3
t=5t=6t=7
. . . -312
F. 3. A sample of the network activation patterns. These are some of the initial states (marked by t=0) that eventually lead to oneof the six fixed points. Rectangles indicate the group of element to which eqn (1) is applied to obtain the following network activationstate. The order of the network elements here and throughout the text is from left to right EMF1, TFL1, LFY, AP1, CAL, LUG, UFO,BFU (B function, see text for details), AG, AP3, PI and SUP.
which LUG and UFO are representatives. It isimportant to mention that LUG and UFO areincluded in the same category due to their effect onflower morphology rather than to their spatial andtemporal expression patterns, since LUG is not yetcloned and UFO is active at all developmental stages(Lee et al., 1997). Finally, the ensemble of organidentity genes (Ma, 1994), represented in our modelby AG, AP3 and PI, become active. It is importantto say that SUP was first considered as a cadastralgene, but it becomes active after the organ identitygenes (Sakai et al., 1995). Based on these consider-ations, we have divided the 12 network elements intofive groups: the first containing EMF1 and TFL1; thesecond LFY, AP1 and CAL; the third LUG, UFO,and BFU; the fourth AG, AP3 and PI; and the fifthwith only SUP.
Another important biological consideration whileperforming the dynamic analysis, concerns the activa-tion state of EMF1. This gene is part of the proposedfloral repressor (Haughn et al., 1995; Weigel, 1995),which supposedly controls the transition fromvegetative to reproductive growth, and it is proposedto be under the influence of many upstream genes(Coupland, 1995). To incorporate such an external
influence, we decided to fix the activation state ofEMF1 (either 0 or 1) throughout each dynamic cycle.In this way, we simulated the effect of an externalfactor not incorporated in the network. We achievedthis by changing w1,1 from 0 to1.
2.2.
LEAFY (LFY) is known to be positively regulatedby AP1 and CAULIFLOWER (CAL), because itsmRNA is reduced in ap1 cal plants (Bowman et al.,1993; Kempin et al., 1995; Weigel & Nilsson, 1995).However, AP1 and CAL products are not neededsimultaneously to activate LFY because single anddouble mutants for these two genes have differentfloral morphologies and LFY mRNA levels (Bowmanet al., 1993; Gustafson-Brown et al., 1994). Therefore,AP1 and CAL regulations over LFY are part of twoindependent pathways. Conversely, AP1 mRNA(Weigel & Nilsson, 1995) onset is delayed in lfymutants. The relative reduction of AP1 mRNA in lfyplants is more pronounced than the reduction of LFYmRNA in ap1 plants. Therefore, we propose that theup-regulation of AP1 by LFY is stronger than theup-regulation of LFY by AP1 (aq b; see Fig. 2).Furthermore, the phenotype of 35S::LFY ap1 plants
313
(Weigel & Nilsson, 1995; 35S::LFY is a molecularconstruction that over-expresses LFY) is between thatof wild-type and 35S::LFY plants, suggesting that alarge function of LFY is to activate AP1. Weincorporated this in the NET model by making therelative value of such activation greater than anyother activation from LFY to any other gene (i.e.aq c, aq d, aq e and aq i ). Unpublished datasuggest that a similar regulatory interaction to thatdocumented between LFY and AP1 exists betweenLFY and CAL (Savidge & Yanofsky, unpublisheddata; see also Fig. 6 in Weigel & Nilsson, 1995). Inorder to maintain the symmetry of the relationshipbetween LFY and AP1/CAL, we made the activationof LFY over CAL stronger than that of CAL overLFY (cq 1 in the NET model). Finally, because ap1plants have a more pronounced mutant phenotypethan cal plants we made bq 1.
TERMINAL FLOWER 1 (TFL1) is a repressor ofLFY (Okamuro et al., 1993; Weigel et al., 1992),because in tfl1 mutants, both AP1 and LFY mRNAsare ectopically expressed (an expression found outsidethe wild-type pattern, Bowman et al., 1993;Gustafson-Brown et al., 1994). But the effect of TFL1over AP1 seems to be mediated by LFY, because tfl1ap1 mutants have an additive phenotype (Bowmanet al., 1993; Shannon & Meeks-Wagner, 1993). If themorphology of double mutants is the summation ofthe phenotypes of the individual single mutants, weconsider that one of the two genes is not directlydownstream of the other. Besides, tfl1 lfy doublemutants (tfl1-10 lfy-16) have determinate growth anda flowering time similar to that of the tfl1 singlemutant (Shannon & Meeks-Wagner, 1993),suggesting that LFY and TFL1 are in the samepathway, one downstream of the other. Conversely,LFY seems to inhibit TFL1 transcription, because35S::LFY plants are very similar to tfl1 mutants(Shannon & Meeks-Wagner, 1991; Weigel & Nilsson,1995). The ap1-1 mutation largely attenuates the35S::LFY phenotype, nevertheless those plants stillform terminal flowers (Weigel & Nilsson, 1995) as intfl1 mutants, indicating that LFY inhibits TFL1 usingan AP1-independent pathway. However, 35S::LFYplants produce a terminal flower before and at ashorter inflorescence stem size than tfl1 mutants,therefore, we postulate that the inhibition of TFL1over LFY is weaker than the inverse inhibition(vs v q vr v). In other words, the effect caused by thedisinhibition of LFY in the tfl1 mutants is notsufficient to cause the dramatic effects seen with theconstitutive expression of LFY in 35S::LFY plants.Such contrast might be due to a difference in the levelsof the LFY protein, to the activation or inhibition of
other downstream genes, or a combination of both.This mutual inhibition between LFY and TFL1 issupported by the fact that their spatial domains ofmRNA expression are contiguous but they do notoverlap (Bradley et al., 1997).
There is much evidence indicating that LFYactivates both B activity genes, AP3 and PI (Goto &Meyerowitz, 1994; Jack et al., 1994; Weigel et al.,1992; Weigel & Meyerowitz, 1993a,b). However, in lfymutants PI mRNA reduction is more pronouncedthan AP3 mRNA reduction, therefore suggesting thatthe activation of PI by LFY is stronger than that ofAP3, (eq d). Likewise, the gene UNUSUALFLORAL ORGANS (UFO) activates AP3 and PI(Lee et al., 1997; Levin & Meyerowitz, 1995;Wilkinson & Haughn, 1995), but in this case AP3mRNA levels are more dramatically reduced in ufomutants than levels of PI mRNA (mq n). Finally,morphological analyses of mutant flowers suggestthat LFY is a stronger activator of B function genesthan UFO (eq d, eqm, eq n, dqm, dq n, andmq n). It is necessary to mention that UFO has a rolein cell proliferation or organ initiation (Lee et al.,1997), therefore it is quite probable that the effect ofthis gene over AP3 and PI is not a direct regulationof expression. Nevertheless, the dynamic studypresented here might be valid even when some of theproposed regulatory interactions turn out to beindirect mediated by other products or processes (seediscussion). It has been proposed that UFO and LFYmight act as coregulators (Lee et al., 1997). However,since the single and double mutants have differentphenotypes, the putative interaction between LFYand UFO are not yet clear and therefore we decidedto wait for more experimental results before includingsuch interaction in our model.
In Fig. 1, merging arrows between AP3 and PIindicate that a dimer of the proteins encoded by thesetwo genes is formed and that it maintains theactivities of both AP3 and PI (Goto & Meyerowitz,1994; Jack et al., 1994). Finally, SUP inhibits bothAP3 and PI (Bowman et al., 1992; Goto &Meyerowitz, 1994; Shultz et al., 1991); and oncemore, AP3 mRNA expression is the most affected onein sup mutants (Sakai et al., 1995) suggesting thatvf v q vg v. In sup mutants, in contrast to wild-type,AP3 mRNA is partially expressed in the fourth whorlduring late stages of flower development. PI mRNA,on the other hand, is present in the fourth whorl fromthe onset of its expression, as normally does, but ismaintained at detectable levels throughout develop-ment in contrast to the pattern of mRNA expressionin wild-type (Sakai et al., 1995). These changes inmRNA expression of AP3 and PI are less drastic than
. . . -314
those observed in lfy mutants, where AP3 and PImRNAs are abolished completely, thereforesuggesting that eq vg v and dq vf v in Fig. 2. Hereagain, SUP seems to have a role in cell division (Sakaiet al., 1995) rather than a direct regulation of AP3and PI gene expression. Its inclusion in the NETmodel, however, reveals the possible existence ofanother, yet undiscovered, inhibitor of the B functiongenes (see Discussion).
The mechanism by which AP1 and AP2 (activityA) inhibit AG (activity C) is still uncertain, with theextra problem that most of the genetic analyses arereported for weak ap1 and ap2 alleles. It is knownthat AP2 is needed for the inhibition of AG in thewhorls that will give rise to sepals and petals, but notin those where stamens and carpels will arise eventhough AP2 messenger is expressed throughout theflower (Jofuku et al., 1994). However, since AP1mRNA is present in the two outer whorls (Mandelet al., 1992) many authors have suggested that acombination of both AP1 and AP2 are needed for theinhibition of AG (Bowman et al., 1993; Liu &Meyerowitz, 1995; Ma, 1994). Nevertheless, theseregulatory interactions are still controversial and themechanism is far from clear. However, our purposeis to investigate the dynamic properties of the geneticregulatory network, and AP2 seems to be aconstitutively expressed gene in the Arabidopsisflower. Therefore, for simplicity we will assume thatAP1 inhibits AG, keeping in mind that AP2 andperhaps other factors are also needed.
AG is activated by LFY (Weigel & Meyerowitz,1993c), and inhibited by LEUNIG (LUG; Liu &Meyerowitz, 1995; Meyerowitz, 1994b). However,single ap1 mutants have more severe floral transform-ations than single lug mutants (vp v q vq v). AG itselfprovides an important feedback regulation by meansof its inhibitory effect over AP1 (Gustafson-Brownet al., 1994). But the strongest regulation over AP1seems to come from LFY (rather than from AG)because flowers of 35S::AG plants (Mizukami & Ma,1992) start diverging morphologically from wild-typeflowers when LFY expression diminishes in the centerof the flower primordium (Weigel et al., 1992). Hencethe up-regulation of AP1 by LFY seems to bestronger than the down-regulation of AP1 by AG(aq vo v). An experimental way to test this hypothesisis to observe flower development in 35S::AG lfyplants, our model predicts that such flowers woulddiverge morphologically from wild-type earlier thantheir 35S::AG counterparts, since the former plantswould not have the activation of LFY over AP1,while the inhibition of AG over AP1 would always bepresent. There are other possible experiments of this
kind that might help to unravel genetic interactions,for example if 35S::AG ap1 plants start divergingfrom wild-type while LFY diminishes its expression inthe center of the flower, that would indicate that thereis another gene acting downstream of both AG andLFY but mainly regulated by LFY.
Finally, concerning AG, it seems that TFL1 inhibitsAG. Flowers of ap1 ap2 double mutants have aninflorescence-like morphology and also lack a propercentral pistil. For example, the fourth whorl of ap1-1ap2-2 (strong) mutants is formed by carpels that oftenfail to fuse and have sectors of stamen tissue[Bowman et al., 1993, see Fig. 8(c)], suggesting analteration of the C activity. However, tfl1 ap1 ap2mutant flowers do have pistil (Shannon & Meeks-Wagner, 1993), suggesting that the tfl1 mutationre-establishes the C activity. Given that AG is the onlyreported C function gene, we infer that the tfl1mutation causes an increase in AG mRNA, and hencein wild-type plants TFL1 would be normallyinhibiting AG. This inhibitory relationship is notmediated by LFY, because tfl1 lfy plants flower at thesame time as tfl1 plants do (Shannon & Meeks-Wagner, 1993), indicating that the LFY product is notneeded. Furthermore, lfy plants flower later and tfl1earlier than wild-type plants; then if tfl1 lfy plantsflower at the same time as tfl1 mutants, we can saythat AG expression is more severely affected by thelack of TFL1 product than by the lack of LFYproduct, thus establishing that vh v q i.
EMBRYONIC FLOWER 1 (EMF1) is the mostupstream gene we have considered. Actually, EMF1has not been cloned and we rely only onmorphological data of the mutant plants to makeinferences about possible regulatory interactionsinvolving this gene. EMF1 is considered as part of theso-called floral repressor (Haughn et al., 1995;Weigel, 1995), and it may fulfil such a function bytwo, non-excluding possibilities: either EMF1 inhibitsthe floral promoting genes (LFY and AP1) or itactivates the other floral repressing gene (TFL1). Themorphology of mutants suggests that both pathwaysmay be operating. First, lfy mutants grown undershort photoperiod have a stronger mutant phenotypethan the same plants grown under continuous light(Schultz & Haughn, 1993). Actually, lfy plants undershort photoperiods have hardly any flowers, just likelfy ap1 plants under long photoperiods (Haughnet al., 1995; Weigel et al., 1992). This suggests thatunder short photoperiods AP1 expression is absent orvery reduced in lfy plants, thus acquiring a lfyap1-like phenotype. This putative inhibition might becarried out by either EMF1 or TFL1, the late-flowering genes. However, TFL1 mRNA is found just
Basinsof
attraction
Correspondencewith the
ABC modelAttractors
None
None
315
below the inflorescence dome and absent in theregions that will give rise to flowers (Bradley et al.,1997), thus TFL1 mRNA is never present in theregions where AP1 mRNA eventually appears,making very unlikely that TFL1 would repress AP1.Such spatial considerations leaves only EMF1 thepossible repressor of AP1.
Indirect evidence suggests that EMF1 activatesTFL1. Long day grown emf1 tfl1 plants flower justlike tfl1 single mutants (Yang et al., 1995), suggestingthat TFL1 is directly downstream of EMF1.Additionally, pistils are the most prominent organs inemf1 flowers (Yang et al., 1995), suggesting that thosemutants over-express AG, presumably due to theabsence of the inhibitory effect of TFL1. Finally,EMF1 could also be directly inhibiting LFY, becauseemf1 lfy plants develop lfy-like flowers with leaf-likeorgans, but do not develop emf1-like flowers (Yanget al., 1995), again suggesting that LFY is directlydownstream of EMF1. Furthermore, it has beenshown that the gene CONSTANS (CO) activates LFY(Simon et al., 1996) mediated by the inhibition ofEMF1 (Coupland, 1995). This is, CO inhibits EMF1which in turn inhibits LFY. Finally, the emf1mutation causes an early flowering which is moresimilar to that presented by 35S::LFY than tfl1plants. This morphological evidence suggests that themorphology of emf1 plants is due to an over-acti-vation of LFY rather than to a lack of TFL1expression (v j v q k).
2.3.
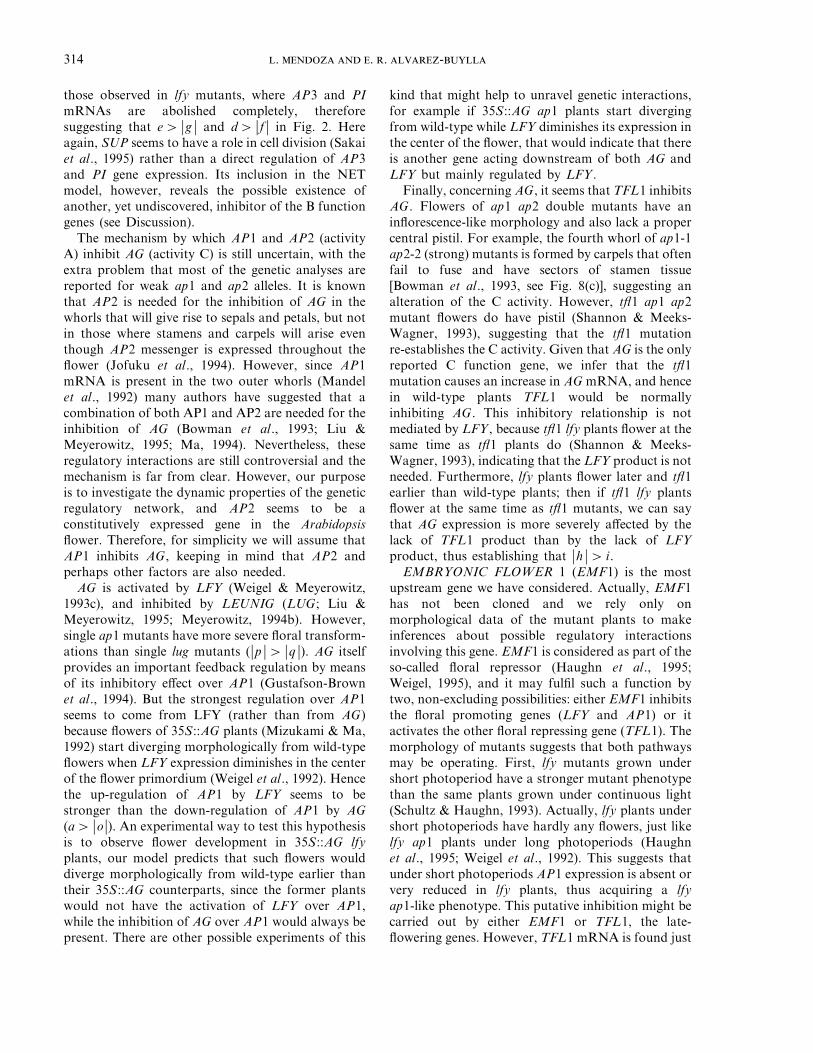
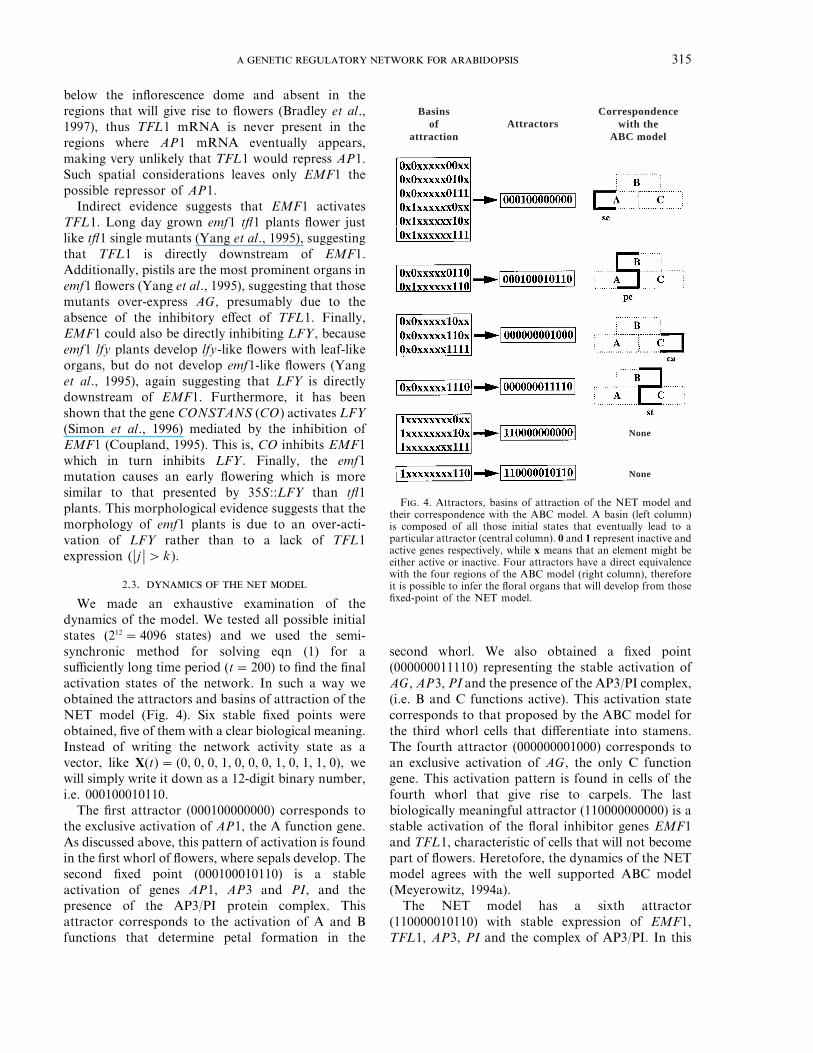
We made an exhaustive examination of thedynamics of the model. We tested all possible initialstates (212 =4096 states) and we used the semi-synchronic method for solving eqn (1) for asufficiently long time period (t=200) to find the finalactivation states of the network. In such a way weobtained the attractors and basins of attraction of theNET model (Fig. 4). Six stable fixed points wereobtained, five of them with a clear biological meaning.Instead of writing the network activity state as avector, like X(t)= (0, 0, 0, 1, 0, 0, 0, 1, 0, 1, 1, 0), wewill simply write it down as a 12-digit binary number,i.e. 000100010110.
The first attractor (000100000000) corresponds tothe exclusive activation of AP1, the A function gene.As discussed above, this pattern of activation is foundin the first whorl of flowers, where sepals develop. Thesecond fixed point (000100010110) is a stableactivation of genes AP1, AP3 and PI, and thepresence of the AP3/PI protein complex. Thisattractor corresponds to the activation of A and Bfunctions that determine petal formation in the
F. 4. Attractors, basins of attraction of the NET model andtheir correspondence with the ABC model. A basin (left column)is composed of all those initial states that eventually lead to aparticular attractor (central column). 0 and 1 represent inactive andactive genes respectively, while x means that an element might beeither active or inactive. Four attractors have a direct equivalencewith the four regions of the ABC model (right column), thereforeit is possible to infer the floral organs that will develop from thosefixed-point of the NET model.
second whorl. We also obtained a fixed point(000000011110) representing the stable activation ofAG, AP3, PI and the presence of the AP3/PI complex,(i.e. B and C functions active). This activation statecorresponds to that proposed by the ABC model forthe third whorl cells that differentiate into stamens.The fourth attractor (000000001000) corresponds toan exclusive activation of AG, the only C functiongene. This activation pattern is found in cells of thefourth whorl that give rise to carpels. The lastbiologically meaningful attractor (110000000000) is astable activation of the floral inhibitor genes EMF1and TFL1, characteristic of cells that will not becomepart of flowers. Heretofore, the dynamics of the NETmodel agrees with the well supported ABC model(Meyerowitz, 1994a).
The NET model has a sixth attractor(110000010110) with stable expression of EMF1,TFL1, AP3, PI and the complex of AP3/PI. In this
. . . -316
case we obtained the stable expression of theflowering inhibition genes at the same time asthe presence of floral B function genes and products.This attractor does not agree with any observedgene expression pattern in wild-type plants, but wethink that it can be experimentally induced. AP3and PI can be turned on despite the activation ofthe EMF1 and TFL1, because of the mutual positivefeedback present between AP3 and PI (see Fig. 2).If for any reason the AP3/PI dimer is present atany stage of development, and in the absence of aninhibitory signal (notice that SUP is inactive inthis basin of attraction), the B function genes willbe expressed. The model predicts, therefore, thatthe presence of the AP3/PI dimer will be enoughto originate and sustain their own expression aslong as the proteins do not diffuse or degrade.Nevertheless, flowers would not appear in thisputative region of induced AP3 and PI expressionbecause meristem identity genes (mainly LFY andAP1) will remain inactive. This type of experimenthas not been performed but plants over-expressingboth B function genes (Krizek & Meyerowitz, 1996)showed AP3 protein expression in some vegetativetissues.
3. Discussion
Many genes involved in Arabidopsis thalianaflowering and flower morphogenesis have been clonedin recent years (Weigel, 1995; Yanofsky, 1995).Messenger RNA expression patterns, altogether withtheir related phenotypes are accumulating fast andproviding valuable functional information regardingsuch genes. Some interesting pictures of the complexregulatory interactions established by these genes areslowly arising (see for example Theißen & Saedler,1995), but these schemes are mostly hierarchical andstatic. In this paper we provide a first example of hownonlinear dynamic models can help us understand themolecular mechanisms underlying flowering andflower morphogenesis.
The network presented here provides a firstprovisional architecture that yields as stable states theA, B and C activities and their combinations asproposed in the widely used ABC model (Fig. 1). Thisnetwork model is, therefore, a first proposition of atleast some of the molecular mechanisms underlyingthe ABC model. We do not claim that the NET modelincorporates all the important genes involved indetermining the cellular fate in flower morphogenesis.The inclusion of further genes would alter thenetwork topology but it could be possible to maintainthe four attractors that represent the activation states
characterizing the regions where sepals, petals,stamens or carpels differentiate.
In this work, our main goal was to know if themolecular data available for genes related toArabidopsis flower morphogenesis could be syn-thesized in a dynamic model compatible with theABC model. Our goal in the long run is, however, toobtain a more general dynamic model that includesthe ABC model as a particular case. In the meantime,the NET model provides with both a tool for furthertheoretical analysis, and a guide for future experimen-tal work. For example, we are currently looking forthe minimal network representation that still has thefour activation regions represented by the ABCmodel. This exercise might prove useful for theexperimental biologist working with Arabidopsis inorder to distinguish direct from indirect regulatoryrelationships among these genes. Further simulationson this NET model may be used also to identifyinteractions for which the quantitative value is criticalto recover the expected stable states. Special effortmight be put to obtain quantitative data for suchinteractions.
The attractors of the NET model (Fig. 4), showthat two types of elements can be distinguished: thosewhich initial states affect the attractor reached andthose which initial states do no affect the attractorreached. The former are EMF1, LFY, AG, AP3, PIand SUP, and those that do not affect the finalnetwork state are TFL1, AP1, CAL, LUG, UFO andthe AP3/PI complex (BFU). This could imply that aperturbation of one of the elements of the first groupmight be sufficient to change the fate of the cells in thedeveloping organ by altering the identity of theattractor. On the other hand, a perturbation in any ofthe elements of the second group would not alter thecell differentiation commitment. Moreover, if ourmodel turns out to be experimentally robust, it ispossible to predict that floral genes still to bediscovered most probably will either belong to thesecond group or connect to elements in that group. Inany case, the inclusion of such new genes in the NETmodel would alter the topology of the network butwould not modify its final attractors. Hence thecapacity of a network of absorbing perturbations dueto the inclusion or deletion of elements depends onthe connectivity of the whole network. Previoustheoretical statistical analyses (Wagner, 1996) havealso shown that the final activation pattern in anetwork might remain unchanged, or very slightlymodified, despite large deletions.
Genes belonging to each of these two groups mightbe prone to different evolutionary forces. We mayspeculate that network elements that are less critical

317
for the establishment of adequate activation patterns,might be more prone to neutral mutations, than thosethat are critical for maintaining the correct pattern.For example, if a mutation permanently ‘‘turns off’’a gene member of those genes that do not alter theattractors of the network, then the transientactivation pattern of the network might be altered,but the final activation state would remain un-changed. The reverse hypothesis can also bepostulated. Genes belonging to the group that affectthe attractors might be more sensible to mutations,and therefore the ratio of non-neutral to neutralmutations would be higher in these genes than inthose not involved in establishing the networkattractors. This bold hypothesis could be tested bymaking comparative analyses of sequence data ofgenes belonging to each of these two groups fromdifferent species
There is another way in which the addition of anewly discovered gene would not alter our results.Suppose that the inhibition of AG by LUG is not adirect one as depicted in Fig. 2 but is indirectlymediated by a still undiscovered gene X. Adding thisnew gene to the NET model would certainly modifythe topology of the network and might also alter thetransient dynamic behavior. However, since LUGbelongs to the group of genes that are not critical toreach the attained attractors, the activation state ofany gene that is exclusively controlled by LUG cannotaffect the attractors, because this imaginary gene Xwould be only a relay between LUG and AG.Therefore, we do not postulate that all the genesdirectly connected in our model have directinteractions in vivo. This has to be tested experimen-tally for most cases. We state, however, that manyintermediary genes might act only as relays and wouldnot affect the stable states reached. Nevertheless, notall possible alterations are of this kind, some geneinclusions might actually add new attractors to thedynamics of the network. These new attractors wouldnot invalidate our model, however. In this first modelwe are dealing only with four major regions of geneactivation as stated by the ABC model, but each floralwhorl contains different cell types. Therefore, futureexperimental results may be incorporated into largernetworks, ideally yielding as many attractors as celltypes are in the entire flower.
We want to make clear that the dynamic approachused here has clear advantages over a static analysis.This point can be illustrated by comparing, forexample, the activation state of AP3, PI and SUP inthe basins of attraction (last three values in everyvector, Fig. 4) to their activation in the correspondingattractors. Notice that those attractors in which the
B activity is present (AP3 and PI active) come frominitial states in which AP3 and PI are active but SUPis inactive. This means that the activity of SUPdetermines if the B activity will be present or not: ifduring the initial state SUP is active, the B activitywill not be established. This result indicates that agene inhibiting the B activity genes is absolutelynecessary to obtain a result compatible with the ABCmodel. However, SUP is probably acting at thecellular level regulating cell division rate rather thandirectly regulating the transcription of B genes. If thisproves to be the case, our dynamic model predictsthat there would be a still undiscovered gene thatinhibits AP3 and PI at the transcriptional level,because a negative transcriptional regulator of the Bgenes is required to yield some regions with and otherregions without the B activity.
One of the objectives of this study was to ask if thenetwork model could reach as stable states the fourpatterns of gene activation predicted for AP1, AP3,PI and AG in the ABC model. Although other genesmay be involved in determining the A and C functions(Bowman, 1997), the ABC model is the best globaldescription of the activities of flower organ identitygenes. Therefore, the numerical values of networkparameters that could not be estimated based oncurrent experimental results were obtained with agenetic algorithm using a fitness function definedaccording to the gene activation patterns proposed inthe ABC model. However, the topology of the NETmodel included more genes and more interactionsthan those included in the ABC model. Hence, thereis no a priori reason to expect that the dynamic modelproposed here should reach the same gene activationpatterns predicted by the combinatorial static ABCmodel. Furthermore, the NET model constitutes anew hypothesis regarding the molecular mechanismsunderlying the establishment of the ABC functions.
Although the dynamics of the NET model heavilydepends on the non-zero values of W and u, thetopology of the network imposes restrictions. Forexample, it was impossible to obtain values of W andu that yielded only the four floral stable states plus aunique non-floral state. The sixth stable pattern ofFig. 4, that does not have a biological interpretation,is therefore a restriction imposed by the topology ofthe network on its dynamic behavior. On the otherhand, certain network topologies never attain theABC activation patterns as stable states, no matterwhich numerical values of W and u are used(including those used here, results not shown).Therefore, the coincidence between the NET andABC models validates some of the assumptionsincorporated in both models. Simulations in progress

. . . -318
(Mendoza & Alvarez-Buylla, in prep.) and additionaltheoretical (Thieffry et al., 1995; Thomas, 1991;Thomas & D’Ari, 1990, Thomas et al., 1995) andexperimental work should help us elucidate which ofthese assumptions are valid and which are not.
How can we reconcile the use of the networkapproach with the temporal pattern of flowerdevelopment in Arabidopsis? In early flower primor-dia (stages 1 and 2, Smyth et al., 1990) before floralorgan primordia are apparent, the regulatory geneticnetwork of each cell forming the bud would be in thesame state, namely 110000000000 according to theNET model. As cell division proceeds and mediatedby still unknown cell–cell signaling cues andmechanisms, the stable activation pattern of thenetwork is changed only by turning off EMF1, forexample. This putative signal acting only on one genewould be enough to ensure commitment of cells todifferentiate into sepals, the organs of the outermostwhorl of floral organs. Such a perturbation wouldtake the network to the state 010000000000, that ispart of the attractor that eventually leads to the statein which only AP1 is on (000100000000) anddetermines sepal differentiation according to asimplification of the ABC model. As flowerdevelopment proceeds, the same or other putativesignals might prompt the genetic network to each ofthe other attractors for petals, stamens and carpels,thus completing flower development. This account islargely speculation, but it might be useful for thinkingabout the role that genetic regulatory networks playin the process of cellular differentiation anddevelopment of flowers.
Francisco Vergara contributed with some importantideas during the first stages of this work and his commentsto previous versions of the manuscript were very useful. Wethank Marty Yanofsky for detailed revisions and veryilluminating discussions, as well as for sharing variousunpublished results. Comments made by John Bowman,Caroline Burgeff, Alicia Gamboa, Liz Izquierdo, MedardNg, Rosalinda Tapia, Detlef Weigel, Elliot Meyerowitz andFrancois Parcy were also very useful. Pedro Miramontesand Denis Thieffry provided also very useful suggestionsregarding the mathematical aspects of this work. This workwas funded by an UNAM scholarship to L.M. andCONACYT and PSPA grants to E.A.B. as well as byfinancial support from the Institute of Ecology, UNAM,and a PEW fellowship to E.A.B.
REFERENCES
B, J. L. (1997). Evolutionary conservation of angiospermflower development at the molecular and genetic levels. J. Biosc.Rev. (in press).
B, J. L., S, D. R. & M, E. M. (1991). Geneticinteractions among floral homeotic genes of Arabidopsis.Development 112, 1–20.
B, J. L., S, H., J, T., W, D., M, U. &M, E. M. (1992). SUPERMAN, a regulator of floralhomeotic genes in Arabidopsis. Development 114, 599–615.
B, J. L., A, J., W, D., M, E. M. &S, D. R. (1993). Control of flower development inArabidopsis thaliana by APETALA1 and interacting genes.Development 119, 721–743.
B, D., R, O., V, C., C, R. & C,E. (1997). Inflorescence commitment and architecture inArabidopsis. Science 275, 80–83.
B, Z. (1995). A network model of developmental genehierarchy. J. theor. Biol. 174, 1–11.
C, B., M, J. E. & S, M. (1993). A model for theevolution of networks of genes. J. theor. Biol. 165, 269–289.
C, E. (1991). The role of homeotic genes in flower developmentand evolution. Annu. Rev. Plant Physiol. Plant Mol. Biol. 42,241–279.
C, E. S. & M, E. M. (1991). The war of the whorls:genetic interactions controlling flower development. Nature 353,31–37.
C, G. (1995). Genetic and enviromental control offlowering time in Arabidopsis. Trends Genet. 11, 393–397.
G, M. (1990). Cellular automata and discrete neuralnetworks. Physica D 45, 431–440.
G, L. (1975). Classification of biological networks by theirqualitative dynamics. J. theor. Biol. 54, 85–107.
G, L. & K, S. A. (1973). The logical analysis ofcontinuous, non-linear biochemical control networks. J. theor.Biol. 39, 103–129.
G, L. & Y, R. E. (1979). Structure and dynamics of neuralnetwork oscillators. Brain Res. 179, 207–218.
G, K. & M, E. M. (1994). Function and regulationof the Arabidopsis floral homeotic gene PISTILLATA. Genes &Dev. 8, 1548–1560.
G-B, C., S, B. & Y, M. F. (1994).Regulation of the Arabidopsis floral homeotic gene APETALA1.Cell 76, 131–143.
H, G. W., S, E. A. & M-Z, J. M.(1995). The regulation of flowering in Arabidopsis thaliana: meri-stems, morphogenesis and mutants. Can. J. Bot. 73, 959–981.
J, T., F, G. L. & M, E. M. (1994). Arabidopsishomeotic gene APETALA3 ectopic expression; transcriptionaland post-transcriptional regulation determine floral organidentity. Cell 76, 703–716.
J, K. D., B, B. G. W., V M, M. &O, J. K. (1994). Control of Arabidopsis flower and seeddevelopment by the homeotic gene APETALA2 Plant Cell 6,1211–1225.
K, S. A. (1969). Metabolic stability and epigenesis inrandomly constructed genetic nets. J. theor. Biol. 22, 437–467.
K, S. A. (1991). Antichaos and adaptation. Sci. Am. 265,64–71.
K, S. A. (1993). The Origins of Order: Self-organizationand Selection in Evolution. Oxford: Oxford University Press.
K, S. A., S, B. & Y, M. F. (1995). Molecularbasis of the cauliflower phenotype in Arabidopsis. Science 267,522–525.
K, K. (1997). Vulval development in Caenorhabditiselegans. Trends Genet. 13, 55–61.
K, B. A. & M, E. M. (1996). The Arabidopsishomeotic genes APETALA3 and PISTILLATA are sufficient toprovide the B class organ identity function. Development 122,11–22.
L, I., W, D. S., N, O. & W, D. (1997). A LEAFYco-regulator encoded by UNUSUAL FLORAL ORGANS. Curr.Biol. 7, 95–104.
L, J. Z. & M, E. M. (1995). UFO: An Arabidopsisgene involved in both floral meristem and floral organdevelopment. Plant Cell 7, 529–548.
L, Z. & M, E. M. (1995). LEUNIG regulatesAGAMOUS expression in Arabidopsis flowers. Development 121,975–991.

319
L, W. F. & S, P. W. (1995). Genetic networks.Science 269, 649.
M, H. (1994). The unfolding drama of flower development: recentresults from genetic and molecular analyses. Genes & Dev. 8,745–756.
M, M. A., G-B, C., S, B. & Y,M.F. (1992). Molecular characterization of the Arabidopsis floralhomeotic gene APETALA1. Nature 360, 273–277.
MA, H. H. & S, L. (1995). Circuit simulation ofgenetic networks. Science 269, 650–656.
M, E. M. (1994a). The genetics of flower development.Sci. Am. 271, 40–47.
M, E. M. (1994b). Flower development and evolution:New answers and new questions. Proc. Natl. Acad. Sci. U.S.A.91, 5735–5737.
M, Y. & M, H. (1992). Ectopic expression of the floralhomeotic gene AGAMOUS in transgenic Arabidopsis plantsalters floral organ identity. Cell 71, 119–131.
M, E., S, D. H. & R, J. (1991). A connectionistmodel of development. J. theor. Biol. 152, 429–453.
O, J. K., B, B. G. W. & J, K. D. (1993).Regulation of Arabidopsis flower development. Plant Cell 5,1183–1193.
R, A., R-B, K., R, S., B, S. C., L, J. D.,P, D., M, S. B. & G, C. S. (1994). Arabidopsisfloral homeotic gene BELL (BEL1). controls ovule developmentthrough negative regulation of AGAMOUS gene (AG). Proc.Natl. Acad. Sci. U.S.A. 91, 5761–5765.
R, J. & S, D. H. (1995). Mechanism of eve stripeformation. Mech. Dev. 49, 133–158.
S, H., M, L. J. & M, E. M. (1995). Role ofSUPERMAN in maintaining Arabidopsis floral whorl bound-aries. Nature 378, 199–203.
S, E. A. & H, W. (1993). Genetic analysis of the floralinitiation process (FLIP). in Arabidopsis. Development 110,745–765.
S, E. A., P, F. B. & H, G. W. (1991). TheFLO10 gene product regulates the expression domain ofhomeotic genes AP3 and PI in Arabidopsis flowers. Plant Cell 3,1221–1237.
S, S. & M-W, D. R. (1991). A mutation in theArabidopsis TFL1 gene affects inflorescence meristem develop-ment. Plant Cell 3, 877–892.
S, S. & M-W, D. R. (1993). Genetic interactionsthat regulate inflorescence development in Arabidopsis. PlantCell 5, 639–655.
S, L. E., R, M. P. & M, E. M. (1995).Genetic separation of third and fourth whorl function ofAGAMOUS. Plant Cell 7, 1249–1258.
S, R., I, M. I. & C, G. (1996). Activation of floralmeristem identity genes in Arabidopsis. Nature 384, 59–62.
S, D. R., B, J. L. & M, E. M. (1990). Earlyflower development in Arabidopsis. Plant Cell 2, 755–767.
S, A. V. (1996). Self-assemblage of gene nets in evolutionvia recruiting of new netters. CSTB bulletin—Spring 1996.(http://132.248.34.3/denis html/cstbspring96/CSTB-spring96-2.0.html).
Tß, G. & S, H. (1995). MADS-box genes in plantontogeny and phylogeny: Haekel’s ‘‘biogenetic law’’ revisited.Current Op. Gen. Dev. 5, 628–639.
T, D., S, E. H., R, J. & T, R. (1995).Positive loops and differentiation. J. Biol. Syst. 3, 457–466.
T, R. (1991). Regulatory networks seen as asynchronousautomata: a logical description. J. theor. Biol. 153, 1–23.
T, R. & D’A, R. (1990). Biological Feedback. Boca Raton,FL: CRC Press.
T, R., T, D. & K, M. (1995). Dynamicalbehaviour of biological regulatory networks—I. Biological roleof feedback loops and practical use of the concept of theloop-characteristic state. Bull. Math. Biol. 57(2), 247–276.
V, F. & A-B, E. (1997). Developmentalgenetic basis of the origin and evolution of the homeoticphenotype of Lacandonia schismatica, an endemic angiospermfrom Chiapas (Mexico). with inverted reproductive whorls.Keystone Symposium: Evolution of Plant Development, Taos,NM, p. 28.
W, A. (1996). Genetic redundancy caused by geneduplications and its evolution in networks of transcriptionalregulators. Biol. Cybern. 74, 557–567.
W, D. (1995). The genetics of flower development: from floralinduction to ovule morphogenesis. Annu. Rev. Genetics 29,19–39.
W, D., A, J., S, D., Y, M. F. &M, E. M. (1992). LEAFY controls floral meristemidentity in Arabidopsis. Cell 69, 843–859.
W, D. & M, E. M. (1993a). Genetic hierarchycontrolling flower development. In: Molecular Basis ofMorphogenesis, pp. 93–107. New York: Wiley-Liss.
W, D. & M, E. M. (1993b). LEAFY controlsmeristem identity in Arabidopsis. In: Cellular Communication inPlants (Amasino, R. M., ed.), pp. 115–122. New York: PlenumPress.
W, D. & M, E. M. (1993c). Activation of floralhomeotic genes in Arabidopsis. Science 261, 1723–1726.
W, D. & N, O. (1995). A developmental switch sufficientfor flower initiation in diverse plants. Nature 377, 495–500.
W, M. D. & H, G. W. (1995). UNUSUALFLORAL ORGANS controls meristem identity and organprimordia fate in Arabidopsis. Plant Cell 7, 1485–1499.
W, L. (1996). One hundred years of positional information.Trends Genet. 12, 359–364.
Y, C. H., C, L. J. & S, Z. R. (1995). Genetic regulationof shoot development in Arabidopsis, role of the EMF genes.Dev. Biology 169, 421–435.
Y, M. F. (1995). Floral meristems to floral organs: genescontrolling early events in Arabidopsis flower development.Annu. Rev. Plant Physiol. Plant Mol. Biol. 46, 167–188.
Y, M. F., M, H., B, J. L., D, G. N.,F, K. A. & M, E. M. (1990). The proteinencoded by the Arabidopsis homeotic gene agamous resemblestranscription factors. Nature 346, 35–40.
Z, E. (1994). Molecular pathways to parallelevolution: I. Gene nexuses and their morphological correlates.J. Mol. Evol. 39, 661–678.