Transition from back-arc rifting to oceanic arc associated Kuroko formation in late Cenozoic NE...
119
Report on Financial Analysis of Omni Services Incorporated
-
Upload
independent -
Category
Documents
-
view
1 -
download
0
Transcript of Transition from back-arc rifting to oceanic arc associated Kuroko formation in late Cenozoic NE...

Report on
Financial Analysis of Omni
Services Incorporated


Financial Analysis of Omni Services
Incorporated
Prepared for:M. Sadiqul Islam, Ph.D.
Course instructor
F-307: Analysis of Security Investment
Lecturer
Department of finance
University of Dhaka
Prepared by:
Zarin Tasnim 17-009
Tamanna Nigar
17-031
Fatema-Tuj-Johora Shorna
17-119
Samanta Haque
17-191

Date of Submission: February 18, 2014
Department of Finance
Faculty of Business StudiesUniversity of Dhaka
Acknowledgement
In the preparation of this report, we constantly meet many
stumbling blocks. However, the presence of various people helped
to simplify matters and hence made the completion of this report
possible.
Firstly, we would like to thank our course instructor, M. Sadiqul
Islam, Ph.D. (Professor of department of finance), who’s constant
presence and words of encouragement inspired us to do our very
best. Without his guidance and availability, this report would
not have been possible and gave the directions we needed to
prepare this report.
Secondly, we would also like to take this opportunity to
acknowledge the help provided to us by some personals of those we

surveyed for giving us time from their busy schedule, providing
us with information that was required to complete the report.
Finally, we would like to thank each individual group member and
the numerous people who offered us help and kindly answered all
the questions in our survey and gave advice and suggestions to
ensure that we provide an in-depth report on the analysis of
business environment of cement industry and its cost behavior.
18th February, 2014
M. Sadiqul Islam, Ph.D.
Professor
Department of Finance
Faculty of Business Studies
University of Dhaka

Subject: Submission of group report on “ Financial Analysis of Omni
Services Incorporated ”
Dear Sir:
Here is the group report on the “Financial Analysis of Omni
Services Incorporated” that you asked us to prepare as a part of
requirement of our BBA Program Analysis of Security Investment
course F-307. In presenting this report, we have tried our level
best to include all the relevant information and the examples to
make the report informative and comprehensive.
This report was assigned to us with a view to scrutinizing our
skill and flamboyance when it comes to banking know-how.
Moreover, the purpose of this term paper was to extract our inner
ability & enhance our banking related potentials.
The information of this paper is directly collected from thecase manuscript provided to us & our course textbook & should notgo beyond the norm.
We hope you will find the report in appropriate manner. Lookingforward to know your feedback.
Sincerely yours,
………………………….
Samanta Haque
(On behalf of the group)
B.B.A. 17th Batch
University of Dhaka

Executive summaryAs a course requirement for Analysis of Security Investment
course, F-307 the report is on a “Financial Analysis of Omni
Services Incorporated”, which is assigned to us by our honorable
course teacher, M. Sadiqul Islam, Ph.D., Professor, Department of
Finance, University of Dhaka.
The report deals with the study, and research we have done on thecase that was given to by our honorable course instructor. Thecase is on Omni Services Incorporation which is traditionallyconsidered to be a part of industrial laundry business but nowknown as textile lessors.
As Omni Services INC is an USA company at first the economicanalysis of the country is portrayed. After portraying theeconomic analysis company analysis is included following by anelaborate description of the company in question Omni ServicesINC. To understand the company better ratio analysis isincluded. The information was available in the case for ratioanalysis. We have done Dupont analysis to get a broader picture fthe return earned by the company. Then the SWOT analysis isprovided with the help of the industry analysis which we havedone in the earlier part.
We have prepared problem statement which is the most importantpart of the report. after studying the case thoroughly we came todetermine the problem faced by Omni Services INC. the problem wasto determine whether the company should go for merger with astrong French company also in rental linen business The SocieteGenerale de Location et Services Textiles (Textiles).
We have figured out the best possible solution for this problemby using valuation methods such as FCFF (free cash flow to firm),

FCFE ( free cash flow to equity) and DDM ( dividend discountmodel) to determine the price per share of Omni via the valuationof the firm. Income statement, balance sheet was given from theyear 1973 to 1979. But we had to calculate the price per share of1985 so we have prepared forecasted income statement, balancesheet from 1980 to 1985. We have assumed growth rate fromhistorical trends.
After describing elaborately the solution of the problems andalternative course of action we have given a recommendation forthe merger decision which according to us will benefit both theparties. We have come to the decision by calculating the shareprice of Omni.
In the recommendation we have provided the merger price for bothyear 1980 and 1985. And have calculated the prices of the totalshares. And justified our recommendation with proper explanation.

Table of Contents1. Introduction......................................................21.1. Origin of the Report...........................................2
1.2. Objective of the Report........................................21.3. Scope of the Report:...........................................3
1.4. Methodology:...................................................31.5. Limitations:...................................................3
2. Economic analysis of USA:.........................................6Trade & Investment:.................................................7
Unemployment:.......................................................8Inflation:..........................................................9
2.1. Financial industry crisis:.....................................92.2. Political fallout:............................................12
3. Company overview:................................................153.1. Management body of Omni:......................................15
3.2. Omni’s products and services:.................................153.3. Areas served by Omni Services INC:............................15
3.4. Location of Omni Subsidiaries:................................163.5. Specialty of Omni Services INC:...............................16
4. Industry analysis:...............................................184.1. Market characteristics:.......................................18
4.2. Porter five forces Model......................................194.3. PESTEL analysis:..............................................21
4.4. Key Players:..................................................244.5. Competitive Advantage:........................................26
5. Ratio Analysis...................................................285.1. Liquidity ratio:..............................................28
5.2. Solvency Ratio:...............................................30
9 | P a g e

5.3. Profitability Indicator Ratio:................................335.4. Debt Ratios:..................................................36
5.5. Operating Performance Ratios:.................................395.6. Cash-Flow Indicator Ratios:...................................41
5.7. DuPont Analysis...............................................425.8. SWOT Analysis of Omni Services:...............................43
6. Comparison of Omni Services INC with industry:...................477. Problem Statement:...............................................62
8. Solution to problem no 1:........................................658.1. Finding out the value of the firm:............................65
8.2. Finding out the value of Stock:...............................669. Solution to problem using FCFF ( Free cash flow to firm):........69
9.1. Finding out the value of the firm:............................6910. Alternative method (Using FCFE Method):........................74
11. Alternative method (Using Dividend Discount Model):............7712. Recommendations:...............................................79
13. Conclusion:....................................................8214. References:....................................................83
10 | P a g e

Chapter 1Introduction of report
Origin of the report
Objection of the report
Scope of the report
Methodology
Limitation
1 | P a g e

Financial Analysis of OmniServices Incorporated
1. IntroductionThe report attempts to explain the problems faced by Omni
Services Incorporated which is trying to survive the competitivemarket of industrial laundry business now known as textile lessors.
To survive this competitive market the company needs to implement some
strategies. There are some problems that Omni Services have faced and
our report requirement is to give solution for those problems
1.1. Origin of the ReportAs a course requirement for Analysis of Security Investment
course, F-307 the report is on the empirical analysis of Omni
Services INC. which is assigned to us by our honorable course
instructor, M. Sadiqul Islam, Ph.d. Professor, Department of
Finance, and University of Dhaka.
1.2. Objective of the ReportThe report deals with the study, and research we have done on the
case that was given to by our honorable course instructor. The
case is on Omni Services Incorporation which is traditionally
considered to be a part of industrial laundry business but now
known as textile lessors. We, the group members, are trying our
level best to obtain the precise and related facts. The
subsequent group report was assigned as a part of mandatory
2 | P a g e

requirement for F-307 course. Some more definite objectives of
the report were to:
To analyze the background and main features of
To depict an industry analysis to understand the position of
Omni Service in the industry
To point out the problems faced by the company in current
situations and giving solutions to the problems.
To provide sufficient data either in support of merging or
against with a French company called “the Societe Generale
de Location et Services Textiles”
To give an overall overview of the company’s position in
comparison with its competitors.
1.3. Scope of the Report:The report mainly examines the current financial position of Omni
Services Incorporation and gives solution to the problems faced
by the company.
1.4. Methodology:This report has been completed by taking information from
different relevant sources. However, this report also consists of
a significant amount of data obtained from both primary and
secondary sources. We have collected the data mainly from two
sources. These sources are given below:
i. Primary Data Source:
3 | P a g e

The case was given to us by our honorable course instructor M.
Sadiqul Islam, Ph.d, which is used as primary source. This case
deals with a textile lessors company named Omni Services,
Incorporated. The theoretical segments were mainly ascertained
from the textbooks suggested under this course.
ii. Secondary Data Source:
In addition to the aforementioned two sources of data, different
websites and related articles were taken into consideration for
preparing the report.
1.5. Limitations:The most important factor constraining our study was the
difficulty regarding getting the face to face data exclusive to
the risk factor. That’s why, despite our utmost efforts possible;
we couldn’t come up with satisfactory level of different data.
On the other hand Research work is very much comprehensive. It is
an accumulation of both information and estimation of different
factors. It requires a great effort and long sound planning to
make this report. It is true that we got help from many
responsible people. But still we faced some problem. Because of
some unavoidable reasons; we, sometime, face problem in some
portion of the report. But we tried our level best to overcome
this. The report was on financial planning of Omni Services INC.
we have prepared an elaborate company overview, industry overview
4 | P a g e

for this report. In this respect there may be some lacking in the
report because of our knowledge limitation. We tried to write the
report in a sequential way but there may be some problems in the
sequence of the report. But all these errors are totally
unintentional. At the end we are very happy to present this
report to the readers and its success will depend on the positive
response of the readers.
5 | P a g e

Chapter 2 Analysis of
Economy: USA
6 | P a g e

2. Economic analysis of USA: The economy of the United States is the world's largest singlenational economy. Its GDP at purchasing power parity is also thelargest of any single country in the world, approximately a fifthof the global total. The United States has a mixed economy and hasmaintained a stable overall GDP growth rate, a moderateunemployment rate, and high levels of research and capitalinvestment. Its five largest trading partners are Canada, China,Mexico, Japan, and Germany.
The recession which occurred in the early 1980's was the mostsevere and the most significant in terms of economic policy ofthe post-World War II recessions.
The economic upheaval of the 1970s had important politicalconsequences. The American people expressed their discontent withfederal policies by turning out Carter in 1980 and electingformer Hollywood actor and California governor Ronald Reagan aspresident.
The early 1980s recession was a severe recession in the UnitedStates which began in July 1981 and ended in November. Theprimary cause of the recession was a contractionary monetarypolicy established by the Federal Reserve System to control highinflation. The wake of the 1973 oil crisis and the 1979 energycrisis, stagflation began to afflict the economy of the UnitedStates
The real GDP from 1980 onward was fluctuating up and down and onaverage not trending in either direction. It is perhaps best torefer to this condition as an economic malaise rather than arecession because the economy was in difficulty more than a yearbefore it was officially an economic recession.
7 | P a g e

The immediate cause of the Great Depression of the 1930's was thecatastrophic collapse of investment purchases. There were priorcauses, such as the real interest rate stemming from restrictivemonetary policy, but it is in investment purchases that thesefactors have their effect.
The profile for mid-1981 to 1982 was especially disturbing. It isthe classic picture of a catastrophic collapse in progress.
What the GDP statistics show is that prior to 1979 the GDP hadbeen growing by about fifty to a hundred billion dollars perquarter. In 1979 the growth continues but at a slower rate, aboutthirty billion per quarter. Then after the second quarter of 1980there is an actual fall in GDP of about five billion and thenanother fall of nine billion in the next quarter. The economythen recovers in the fourth quarter of 1980 and adds a hundredbillion and another hundred billion in the first quarter of 1981.The economy then falls in the second quarter only to rise in thethird and fall in the fourth. The erratic pattern continues in1982 but in 1983 the economy commences to grow again.
Only part of the period would fit the notion of recession as aperiod of decline in GDP and even less of it would fit the strictdefinition of a recession as a period in which the GDP declinedfor two quarters or more. But clearly the whole period of 1980-82is one of an economic malaise and represents an episode ofeconomic difficulty. Although recessions are defined in terms ofoutput (GDP) they are felt in terms of the unemployment rate.
There was a perceptible rise in the unemployment rate in 1980.The unemployment rate rose as the period of no growth in outputpersisted while the labor force grew. The peak unemployment ratespersisted after the economy began to grow again in 1983 becauseof the backlog of unemployed workers that had accumulated duringthe period of no growth. Perhaps most important, after the
8 | P a g e

recovery of growth the unemployment rate stayed at a higher levelthan it had been at before the recession.
So far there has been no mention of the cause of the recession ormalaise or whatever one wants to call it. The cause clearly wasPaul Volcker's tight money policy which the Fed carried out tokill the chronic inflation that had developed in the U.S. economyduring the 1970's. The real interest rate is the key variablebecause it determines the level of investment. However, the levelof investment is an accumulation of work on past initiatedinvestment projects as well as the current ones so the level ofinvestment has a lagged response to the real interest rate.
A subsidiary issue is the impact of the Reagan administration'sfiscal policy. Some taxes were cut, government expenditures insome fields were also cut and the net impact has to be evaluated.There were record high levels of deficits, but macroeconomicanalysis indicates that governmental actions attempting tostimulate the economy will not be effective unless there aredeficits.
There was also a trade deficit that worried politicians. Thetrade deficit was an effect of the high value of the dollarrelative to other currencies and this in turn was the result ofthe high real interest rates in the U.S. compared to othercountries.
Trade & Investment:The key variable affected by the high real interest rates was thelevel of investment purchases. Investment purchases started todrop in the third quarter of 1979, the quarter in which thepolicy of more severe constraint on monetary growth wasannounced, and continued downward to the third quarter of 1980.From then there was a partial recovery until the third quarter of1981. Thereafter investment purchases turned downward andcontinued downward until the fourth quarter of 1982. By that
9 | P a g e

quarter investment purchases were off the previous peak of thesecond quarter of 1979 by almost $61 billion. Had there been nocompensating increases in the other components of aggregatedemand the GDP would have been down almost $134 billion. Thiswould have led to an unemployment rate of about 10.4 percentinstead of the 8 percent rate that prevailed.
Had there been no compensating increases in the other componentsof aggregate demand the levels of investment and GDP would havecontinued downward and there would have been a full blowndepression. But there were compensating changes. The mostpublicized was the Reagan Tax Cut. There were cuts in some fieldsof Federal government purchases but increases, notably indefense, in others.
The tax cut was justified in terms of Supply-side Economics butequally well could have been justified in terms of demand-sidestimulation of the economy. The increase in government purchasesalong with the tax cut led one economist to characterize theeconomic policy of the Reagan administration as being"Keynesianism on steroids." Regardless of how the policies werepublicized and characterized the end result is that they kept theanti-inflation policy of the Volcker Fed from recreating theconditions of 1929-1930 when the Fed precipitated the GreatDepression. For more on the role of Fed policies in creating theGreat Depression see Depression Money.
It is to be noted that the deficits of the Federal Government didnot "crowd out" private investment. On the contrary, theexpectations of economic recovery and growth induced higherlevels of investment purchases. In other words, private borrowingwas enticed in. Where did the funds come from for businesses toborrow? They came from the increased savings generated by therecovery of the economy. It is also to be noted that theincreased deficits of the Federal government did not lead toincreased inflation. On the contrary during the time of the
10 | P a g e

increased deficits the chronic inflation of the 1970's collapsedand did not re-emerge
The nation endured a deep recession throughout 1982. Businessbankruptcies rose 50 percent over the previous year. Farmers wereespecially hard hit, as agricultural exports declined, cropprices fell, and interest rates rose. But while the medicine of asharp slowdown was hard to swallow, it did break the destructivecycle in which the economy had been caught. By 1983, inflationhad eased, the economy had rebounded, and the United States begana sustained period of economic growth. The annual inflation rateremained under 5 percent throughout most of the 1980s and intothe 1990s.
Unemployment:Unemployment had risen from 5.1% in January 1974 to a high of9.0% in May 1975. Although it had gradually declined to 5.6% byMay 1979, unemployment began rising again thereafter. It jumpedsharply to 6.9% in April 1980 and to 7.5% in May 1980. A mildrecession from January to July 1980 kept unemployment high, butdespite economic recovery unemployment remained at historicallyhigh levels (about 7.5%) through the end of 1981. In mid-1982,Rockford, Illinois had the highest unemployment of all Metroareas with 25%. In September 1982, Michigan led the nation with14.5%. Alabama was second with 14.3% and West Virginia was thirdwith 14.0%. The Youngstown–Warren Metropolitan Area had an 18.7%rate, the highest of all Metro areas. Stamford, Connecticut hadthe lowest with 3.5% unemployment.
The peak of the recession was in November and December 1982, whenthe nationwide unemployment rate was 10.8%, highest since TheGreat Depression. As of 2013, it is still the highest since the1930s. In November, West Virginia and Michigan had the highestunemployment with 16.4%. Alabama was in third with 15.3%. SouthDakota had the lowest unemployment rate in the nation, with 5.6%.
11 | P a g e

Flint, Michigan had the highest unemployment rate of all Metroareas with 23.4%. In March 1983, West Virginia's unemploymentrate hit 20.1%. In the Spring of 1983, thirty states had doubledigit unemployment rates. When Reagan won re-election in 1984,the latest unemployment numbers (August 1984) showed WestVirginia still had the highest in the nation, 13.6%, withMississippi in second with 11.1%, and Alabama in third with10.9%.
Inflation:Inflation, which had averaged 3.2% annually in the post-warperiod, had more than doubled after the 1973 oil shock to a 7.7%annual rate. Inflation reached 9.1% in 1975, the highest ratesince 1947. Inflation declined to 5.8% the following year, butthen edged higher. By 1979, inflation reached a startling 11.3%and in 1980 soared to 13.5%. A brief recession occurred in 1980.Several key industries—including housing, steel manufacturing andautomobile production—experienced a downturn from which they didnot recover through the end of the next recession. Many of theeconomic sectors that supplied these basic industries were alsohard-hit. Each period of high unemployment was caused by theFederal Reserve, as it substantially increased interest rates toreduce high inflation; each time, once inflation fell andinterest rates were lowered, unemployment slowly fell.
Determined to wring inflation out of the economy, Federal Reservechairman Paul Volcker slowed the rate of growth of the moneysupply and raised interest rates. The federal funds rate, whichwas about 11% in 1979, rose to 20% by June 1981. The primeinterest rate, a highly important economic measure, eventuallyreached 21.5% in June 1982.
2.1. Financial industry crisis:
12 | P a g e

The recession had a severe effect on financial institutions suchas savings and loans and banks.
Banks:The recession came at a particularly bad time for banks due to arecent wave of deregulation. The Depository InstitutionsDeregulation and Monetary Control Act of 1980 had phased out anumber of restrictions on banks' financial practices, broadenedtheir lending powers, and raised the deposit insurance limit from$40,000 to $100,000 (raising the problem of moral hazard). Banksrushed into real estate lending, speculative lending, and otherventures just as the economy soured. By mid-1982, the number ofbank failures was rising steadily. Bank failures reached a post-depression high of 42 as the recession and high interest ratestook their toll. By the end of the year, the Federal DepositInsurance Corporation (FDIC) had spent $870 million to purchasebad loans in an effort to keep various banks afloat.In July 1982, Congress enacted the Garn–St. Germain DepositoryInstitutions Act of 1982 (Garn–St. Germain), which furtherderegulated banks as well as deregulating savings and loans. TheGarn–St. Germain act authorized banks to begin offering moneymarket accounts in an attempt to encourage deposit in-flows,removed additional statutory restrictions in real estate lending,and relaxed loans-to-one-borrower limits. The legislationencouraged a rapid expansion in real estate lending at a timewhen the real estate market was collapsing, increased theunhealthy competition between banks and savings and loans, andencouraged overbuilding of branches. The recession affected thebanking industry long after the economic downturn technicallyended in November 1982. In 1983, another 50 banks failed—easilybeating the Great Depression record of 43 failures set in 1940.The Federal Deposit Insurance Corporation (FDIC) listed another540 banks as "problem banks" on the verge of failure.
13 | P a g e

In 1984, the Continental Illinois National Bank and TrustCompany, the nation's seventh-largest bank (with $45 billion inassets), failed. The FDIC had long known of Continental Illinois'problems. The bank had first approached failure in July 1982 whenthe Penn Square Bank, which had partnered with ContinentalIllinois in a number of high-risk lending ventures, collapsed.But federal regulators were reassured by Continental Illinoisexecutives that steps were being taken to ensure the bank'sfinancial security. After Continental Illinois' collapse, federalregulators were willing to let the bank fail in order to reducemoral hazard and encourage other banks to rein in some of theirmore risky lending practices. But members of Congress and thepress felt Continental Illinois was "too big to fail." In May1984, federal banking regulators were forced to offer a $4.5billion rescue package to Continental Illinois.
Continental Illinois may not have been "too big to fail," but itscollapse could have caused the failure of some of the biggestbanks in the United States. The American banking system had beensignificantly weakened by the severe recession and the effects ofderegulation. Had other banks been forced to write off loans toContinental Illinois, institutions such as Manufacturers HanoverTrust Company, Bank of America and perhaps Citicorp would havebeen insolvent?
The S&L crisis:The recession also significantly worsened a crisis in the savingsand loan industry. In 1980, there were approximately 4,590 state-and federally chartered savings and loan institutions (S&Ls) withtotal assets of $616 billion. Beginning in 1979, S&Ls beganlosing money due to spiraling interest rates. Net S&L income,which totaled $781 million in 1980, fell to a loss of $4.6billion in 1981 and a loss of $4.1 billion in 1982. Tangible networth for the entire S&L industry was virtually zero. The FederalHome Loan Bank Board (FHLBB) regulated and inspected S&Ls, and
14 | P a g e

administered the Federal Savings and Loan Insurance Corporation(FSLIC), which insured deposits at S&Ls. But the FHLBB'senforcement practices were significantly weaker than those ofother federal banking agencies. Until the 1980s, savings andloans had limited lending powers. The FHLBB was, therefore, arelatively small agency overseeing a quiet, stable industry.Accordingly, the FHLBB's procedures and staff were inadequate tosupervise S&Ls after deregulation gave the financial institutionsa broad array of new lending powers. Additionally, the FHLBB wasunable to add to its staff because of stringent limits on thenumber of personnel it could hire and the level of compensationit could offer. These limitations were placed on the agency bythe Office of Management and Budget, and were routinely subjectto the political whims of that agency and political appointees inthe Executive Office of the President. In financial circles, theFHLBB and FSLIC were called "the doormats of financialregulation.
Because of its weak enforcement powers, the FHLBB and FSLICrarely forced S&Ls to correct poor financial practices. The FHLBBrelied heavily on its persuasive powers and the states to enforcebanking regulations. With only five enforcement lawyers, theFHLBB was in a poor position to enforce the law even had itwanted to.
One consequence of the FHLBB's lack of enforcement abilities wasthe promotion of deregulation and aggressive, expanded lending toforestall insolvency. In November 1980, the FHLBB lowered networth requirements for federally insured S&Ls from 5% of depositsto 4%. The FHLBB further lowered net worth requirements to 3% inJanuary 1982. Additionally, the agency only required S&Ls to meetthese requirements over a 20-year period. This phase-in rulemeant that S&Ls less than 20 years old had practically no capitalreserve requirements. This encouraged extensive chartering of new
15 | P a g e

S&Ls, because a $2 million investment could be leveraged into$1.3 billion in lending.
Congressional deregulation worsened the S&L crisis. The EconomicRecovery Tax Act of 1981 encouraged a boom in commercial realestate building projects. The passage of DIDMCA and the Garn–St.Germaine act expanded the authority of federally chartered S&Lsto make acquisition, development, and construction real estateloans and eliminated the statutory limit on loan-to-value ratios.These changes allowed S&Ls to make high-risk loans to developers.Beginning in 1982, many S&Ls rapidly shifted away fromtraditional home mortgage financing and into new, high-riskinvestment activities such as casinos, fast-food franchises, skiresorts, junk bonds, arbitrage schemes, and derivativeinstruments.
Federal deregulation also encouraged state legislatures toderegulate state-chartered S&Ls. Unfortunately; many of thestates which deregulated S&Ls were also soft on supervision andenforcement. In some cases, state-chartered S&Ls had closepolitical ties to elected officials and state regulators, whichfurther weakened oversight.
As the risk exposure of S&Ls expanded, the economy slid into therecession. Soon, hundreds of S&Ls were insolvent. Between 1980and 1983, 118 S&Ls with $43 billion in assets failed. The FederalSavings and Loan Insurance Corporation (FSLIC), the federalagency which insured the deposits of S&Ls, spent $3.5 billion tomake depositors whole again. The FSLIC pushed mergers as a way toavoid insolvency. From 1980 to 1982, there were 493 voluntarymergers and 259 forced mergers of savings and loans overseen bythe agency. Despite these failures and mergers, there were still415 S&Ls at the end of 1982 that were insolvent.
Federal action initially caused this problem by allowing theseinstitutions to get involved in creating wealth through unhealthy
16 | P a g e

fractional reserve practices, a.k.a. lending out much more moneythan they could ever afford to pay back out to customers if theycame to withdraw their money. This ultimately led to S&Lsfailure. Later, the government’s inaction worsened the industry'sproblems. Responsibility for handling the S&L crisis lay with theCabinet Council on Economic Affairs (CCEA), an intergovernmentalcouncil located within the Executive Office of the President. Atthe time, the CCEA was chaired by Treasury Secretary DonaldRegan. The CCEA pushed the FHLBB to refrain from re-regulatingthe S&L industry, and adamantly opposed any governmentalexpenditure to resolve the S&L problem. Furthermore, the Reaganadministration did not want to alarm the public by closing alarge number of S&Ls. These actions significantly worsened theS&L crisis.
The S&L crisis lasted well beyond the end of the economicdownturn. The crisis was finally quelled by passage of theFinancial Institutions Reform, Recovery and Enforcement Act of1989. The estimated total cost of resolving the S&L crisis wasmore than $160 billion.
2.2. Political fallout:The recession was nearly a year old before President RonaldReagan stated on October 18, 1981, that the economy was in a"slight recession". The recession, which has been termed the"Reagan recession’ coupled with budget cuts (which were enactedin 1981 but began to take effect in 1982), led many voters tobelieve that Reagan was insensitive to the needs of averagecitizens. In January 1983, Reagan's popularity rating fell to 35%—approaching levels experienced by Richard Nixon and Jimmy Carterat their most unpopular. Although his approval rating did notfall as low as Nixon's during the Watergate scandal, Reagan'sreelection seemed unlikely.
17 | P a g e

Pressured to counteract the increased deficit caused by therecession, Reagan agreed to a corporate tax increase in 1982.However, he refused to raise income taxes or cut defensespending. The Tax Equity and Fiscal Responsibility Act of 1982instituted a three-year, $100 billion tax hike—the largest taxincrease since World War II.
The 1982 mid-term Congressional elections were largely viewed asa referendum on Reagan and his economic policies. The electionresults proved to be a setback for Reagan and the Republicans.The Democrats gained 26 House seats, which at the time was themost for the party in any election since the "Watergate year" of1974. However, the net balance of power in the Senate wasunchanged.
The Size of the Government:The central theme of Reagan's national agenda, however, was hisbelief that the federal government had become too big andintrusive. In the early 1980s, while he was cutting taxes, Reaganwas also slashing social programs. Reagan also undertook acampaign throughout his tenure to reduce or eliminate governmentregulations affecting the consumer, the workplace, and theenvironment. At the same time, however, he feared that the UnitedStates had neglected its military in the wake of the Vietnam War,so he successfully pushed for big increases in defense spending.
The combination of tax cuts and higher military spendingoverwhelmed more modest reductions in spending on domesticprograms. As a result, the federal budget deficit swelled evenbeyond the levels it had reached during the recession of theearly 1980s. From $74,000 million in 1980, the federal budgetdeficit rose to $221,000 million in 1986. It fell back to$150,000 million in 1987, but then started growing again. Someeconomists worried that heavy spending and borrowing by thefederal government would re-ignite inflation, but the Federal
18 | P a g e

Reserve remained vigilant about controlling price increases,moving quickly to raise interest rates any time it seemed athreat. Under Chairman Paul Volcker and his successor, AlanGreenspan, the Federal Reserve retained the central role ofeconomic traffic cop, eclipsing Congress and the president inguiding the nation's economy.
19 | P a g e

Chapter 3 Company Overview: Omni Services Incorporation
Management body of Omni Omni’s products and services
Areas served by Omni Services INC
Location of Omni Subsidiaries
Specialty of Omni Services INC
20 | P a g e

3. Company overview:OMNI Services Inc. was a holding company for 12 companies. Eachof the subsidiaries was called Rental Uniform Service and waslocated in the eastern United States. Mr. Martin had learnedabout the business while working for an industrial laundry inCincinnati, Ohio. In 1954, he went into partnership with hisfather-in-law to operate a small uniform rental business inRoanoke, Virginia. In partnership with his father-in-law heopened the Culpeper plant in 1959, and Mr. Martin moved toCulpeper to operate it. It was quickly successful, and sales hadgrown at a rate of 20% almost every year since its founding. Theonly thing that seemed to stem growth of that operation had beenplan fire in 1974.
By 1968, Mr. Martin had started new operation in Hanover,Pennsylvania, and Morgantown, West Virginia. The three plants,each called Rental Uniform Service (RUS), were separatelyincorporated. Even though the shareholders and board members werevirtually identical, the internal Revenue Service had treatedthem as separate entities, and the combined taxes were thussomewhat lower. By 1972, nine RUSs had been added, the separateincorporation tax advantages had disappeared, and the 11 separateoperations had become subsidiaries of the newly formed OmniServices Inc.
3.1. Management body of Omni: Omni had a total of 48 investors, although three were of primaryimportance: N.B. Martin, the founder, president, and chairman ofthe board, with 56% of the stock; T.Y. Martin, N.B.’s brother,Omni’s secretary treasurer, and president of the Culpeper RUS,who held 23%, and the Omni ESOP with 12.5%.
3.2. Omni’s products and services:
21 | P a g e

Omni supplied industrial uniforms to 75000 people. Four days aweek, a total of 150 trucks left the plants operated by Omni’s 12rental uniform services. Each day every truck had an establishedroute in a nearby metropolitan area. The driver stopped at suchplaces as service stations, garages, and automobile dealershipsto deliver six packaged shirts and trousers delivered were thesame as those that the driver had picked up the previous week.The employees’ names, and often the names of the companies, werestitched on the shirts. The soiled uniforms were returned to theplant for washing or dry cleaning and mending. In addition, Omniprovided executive garments for office and management personnel,shop towels, walk mats, fender covers, and linen roll towels.
3.3. Areas served by Omni Services INC:Most of Omni’s business was located in large metropolitan areas,and 11 of its 12 subsidiaries were located on the fringes ofthose areas. The largest and oldest operation, the plant inCulpeper, served the Washington, D.C area as well as several lesspopulated areas- Culpeper, Charlottesville, and Lynchburg,Virginia.
3.4. Location of Omni Subsidiaries:OMNI Services Inc. was a holding company for 12 companies. Each of the subsidiaries was called Rental Uniform Service and was located in the eastern United States. The location of Omni Services Incorporated is given below:
State college
Allentown
Alliance
Hanover
Morgantown
Cumberland
22 | P a g e

Culpeper
Calhoun
Griffin
Birmingham
Auburn
Albany
3.5. Specialty of Omni Services INC:Omni was the first firm of any size in Virginia to offer anemployee stock ownership plan ( ESOP) a kind of profit sharingplan in which Omni stock was purchased and held in trust for eachemployee. None of Omni’s 600 employees belonged to a union.
23 | P a g e

Chapter 4 Analysis of
Industry: Textile lessor
Industry
24 | P a g e

4. Industry analysis:Firms like Omni were traditionally considered to be part of theindustrial laundry business, but the industry had recently becomeknown as textile lessors.
4.1. Market characteristics:In the case which was given to us by our course instructor the name of five Rental Uniform Service firms was highlighted. as we were instructed to fins the solution for the problem only with the help of case and not from any other sources the 5 Rental Uniform Service firms along with Omni Services INC was regarded as industry. We have studied the information available to us and have prepared “ market at a glance” diagram. The diagram is drawnbelow:
Market at a glance
Market at a glance
25 | P a g e
5.5 %

4.2. Porter five forces ModelThis model identifies and analyzes 5 competitive forces thatshape every industry, and helps determine an industry'sweaknesses and strengths. According to model the 5 forces thatshape our service industry is described below:
Figure: Porter’s Five Forces model26 | P a g e
Market at a

Threat of new entrants:
Threat of new entrants is high. More new companies may enter inthis market and imitate the products of Omni’s. Successfulbusiness ideas are imitated a lot. And the sales volume of theindustry is high so new companies can enter the market.
Bargaining power of suppliers:
Bargaining power of suppliers is high as thesuppliers are incorporated. Suppliers caninfluence the quality and price of the goodsand services.
Bargaining power of customers:
For a stable market bargaining power ofcustomers needs to be low. If the number ofcompetition is lower, customers might not haveany option but buy the particular product at ahigh price. Omni is not the only company in themarket. It has five more similar productproviding competitors. So if the switching cost is lower,customers will buy products from Omni’s competitors.
Threat of substitute:
Threat of substitute is high. There are five similar rentaluniform service firms in the market. The price is one of the mostimportant determining factors. If Omni charges the same or only abit higher than its competitors, customers will buy thesubstitute products.
Industry rivalry among the existingfirms:
27 | P a g e

There are five rental union service firms other than Omni in the market. These are: Unitog, Rentex, Means services, Servisco and National service industries. So the rivalry among them is high.
4.3. PESTEL analysis: A PESTEL analysis is a framework or tool used by marketers toanalyze and monitor the macro-environmental (external marketingenvironment) factors that have an impact on an organization. Theresult of which is used to identify threats and weaknesses whichis used in a SWOT analysis.
PESTEL stands for: P – Political E – Economic S – Social T – Technological E – Environmental L – Legal
28 | P a g e

Figure: The PESTEL Model
All the external environmental factors (PESTEL factors):
The external environmental factors of Textile lessor industrypreviously known as industrial laundry business are describedbelow:
Political Factors
These are all about how and to what degree a governmentintervenes in the economy. This can include – government policy,
29 | P a g e
EconomicSocialTechnologicalEnvironmentalLegalPolitical

political stability or instability in overseas markets, foreigntrade policy, tax policy, labor law, environmental law, traderestrictions and so on. It is clear from the list above thatpolitical factors often have an impact on organizations and howthey do business. Organizations need to be able to respond to thecurrent and anticipated future legislation, and adjust theirmarketing policy accordingly. Political and regulatory changes inboth USA & France will affect the decision of merger.
Economic Factors
Economic factors have a significant impact on how an organizationdoes business and also how profitable they are. Factors include –economic growth, interest rates, exchange rates, inflation,disposable income of consumers and businesses and so on. Thesefactors can further be broken down into macro-economical andmicro-economical factors. Macro-economical factors deal with themanagement of demand in any given economy. Governments useinterest rate control, taxation policy and government expenditureas their main mechanisms they use for this. Micro-economicfactors are all about the way people spend their incomes. In ourcase, two countries are involved, USA & France. Omni services incof USA and textile of France are interested in merger. So anyeconomical change in either country will affect the merger.
Social Factors
Also known as socio-cultural factors are the areas that involvethe shared belief and attitudes of the population. These factorsinclude – population growth, age distribution, healthconsciousness, and career attitudes and so on. These factors areof particular interest as they have a direct effect on howmarketers understand customers and what drives them. Textilewants to spread their business in USA. So they want to merger
30 | P a g e

with Omni. If the merger happens, customers of Omni will beaffected too.
Technological Factors
We all know how fast the technological landscape changes and howthis impacts the way we market our products. Technologicalfactors affect marketing and the management thereof in threedistinct ways:
New ways of producing goods and services
New ways of distributing goods and services
New ways of communicating with target markets
Both the companies will be able to use each other’s resources tomake good products.
Environmental Factors
These factors have only really come to the forefront in the lastfifteen years or so. They have become important due to theincreasing scarcity of raw materials, pollution targets, doingbusiness as an ethical and sustainable company, carbon footprinttargets set by governments (this is a good example were onefactor could be classes as political and environmental at thesame time). These are just some of the issues marketers arefacing within this factor. More and more consumers are demandingthat the products they buy are sourced ethically and if possiblefrom a sustainable source.
Legal Factors
Legal factors include - health and safety, equal opportunities,advertising standards, consumer rights and laws, product labelingand product safety. It is clear that companies need to know whatis and what is not legal in order to trade successfully. If anorganization trades globally this becomes a very tricky area to
31 | P a g e

get right as each country has its own set of rules andregulations.
4.4. Key Players: The company we are focusing on is Omni Services INC. we havelearned from the previous section that Omni Services INC is inindustrial laundry business. The industrial laundry business isfragmented. Now the industry is known as textile lessors. Asmultidivisional firms like Omni Services were in directcompetition with local businesses that bought their uniforms andserviced their customers in a limited geographical area. Many ofOmni’s major competition were closely held, and a littlefinancial information was available about those operations. Themajor competitors of Omni Services INC were:
32 | P a g e

A brief description of these companies is given below: Rentex:
Rentex provided laundry and rental services, linen-supplyservices and dust control services thought nine facilities.Rentals comprised 100 percent of revenues. There were 640stockholders and 950 employees. Headquarters in Philadelphia,Pennsylvania.
Servisco:Servisco manufactured, rented and laundered work clothes anduniforms, machine wiping clothes, fender covers and linens. Italso provides contract building maintenance, housekeepingconsultant services and guard security services. Its main officeas in Hillside, New Jersey and it operated through 27 full
33 | P a g e
Key Player 2ServiscoKey Player 3Means ServicesKey Player 4NSIKey Player 5Unitog

service panel plants. There were 1501 stockholders and 6300employees.
Means Services:Means Services provided textile maintenance services by rental to
businesses in mid western states, with a concentration on
providing work garments, industrial wiping clothes, dust control
textiles, bed and table linens, towels, aprons uniforms and
continuous towel cabinets. The rental business was 100 percent of
its revenues. It has 25 processing plants, 2718 stockholders and
3900 employees. Headquarters in Chicago, Illinois.
National Service Industries ( NSI):NSI obtained 26 percent of revenues from renting table linens,
bed linen, operating room packs, towels, uniforms and dust
control materials, but lighting equipment and chemical products
were also manufactured. NSI was further diversified into
insulation service, men’s apparel, envelopes, furniture marketing
services, safety products, furniture leasing and amusement parks.
NSI headquarters were in Atlanta, Georgia and it had 10,994
employees.
Unitog:Unitog manufactured, rented and sold heavy duty, soil resistant
uniforms for service station employees, route drivers and
salesme. Rental business operated out of nine locations and
comprised 38 percent of revenues. Headquarters in Kansas city
Missouri. Approximately 420 stockholders and 2189 employees.
34 | P a g e

4.5. Competitive Advantage:Despite this strong competition, Omni Services INC provides
superior value to its clients because of its competitive
advantage. The following include competitive advantage:
Superior service to clients:
35 | P a g e

Omni provides superior services to their clients. That is thereason Omni Services INC’s profit was almost double of industryaverage profit before taxes.
employee stock ownership plan:
Omni was the first firm of any size in Virginia to offer anemployee stock ownership plan ( ESOP) a kind of profit sharingplan in which Omni stock was purchased and held in trust for eachemployee. None of Omni’s 600 employees belonged to a union. Thisis the second competitive advantage of Omni Services.
Attracting dependable and productive employees:
Omni’s major shareholder Mr. Martin always believed that theirlocations allowed them to attract employees that were moredependable and productive than the transient and high paid cityworker. Omni’s Success ca from the edge loyal employees gave thefirm.
36 | P a g e

37 | P a g e
Chapter 5
Ratio AnalysisSWOT Analysis

5. Ratio AnalysisRatio Analysis is a form of Financial Statement Analysis that isused to obtain a quick indication of a firm's financialperformance in several key areas. So using the Balance Sheet andIncome statement information of Omni Services the Ratio Analysisis done as follows:
5.1. Liquidity ratio:Liquidity ratio’s measure your company’s ability to cover itsexpenses. The two most common liquidity ratios are the currentratio and the quick ratio. Both are based on balance sheet items.
Current Ratio:
The current ratio is a reflection of financial strength. It isthe number of times a company’s current assets exceed its currentliabilities, which is an indication of the solvency of thebusiness.
Here is the formula to compute the current ratio:
Current Ratio = Total current assets / Total currentliabilities.
The Current ratio of Omni services Inc. from the year 1973 -1979is shown in the table below and then graphically represented:
1973 1974 1975 1976 1977 1978 1979Current Ratio
1.721195
2.337458
1.622449
1.626731
1.605442
1.445102
1.475243
38 | P a g e

1972 1973 1974 1975 1976 1977 1978 1979 19800
0.5
1
1.5
2
2.5
Current Ratio
Current Ratio
Quick Ratio:
The quick ratio is also called the “acid test” ratio. That’sbecause the quick ratio looks only at a company’s most liquidassets and compares them to current liabilities. The quick ratiotests whether a business can meet its obligations even if adverseconditions occur.
Here is the formula for the quick ratio:
Quick Ratio = (Total Current Assets - Total Inventory) /Total Current Liabilities
The Quick ratio of Omni services Inc. from the year 1973 -1979 isshown in the table below and then graphically represented:
1973 1974 1975 1976 1977 1978 1979Quick Ratio
1.072546
1.791901
1.281341
1.128809
1.244218
1.012379
1.16165
39 | P a g e

1972 1973 1974 1975 1976 1977 1978 1979 19800
0.20.40.60.81
1.21.41.61.82
Quick Ratio
Quick Ratio
5.2. Solvency Ratio:Solvency ratios measure the stability of a company and itsability to repay debt. These ratios are of particular interest tobank loan officers. They should be of interest to us, too, sincesolvency ratios give a strong indication of the financial healthand viability of business. Some of the solvency ratio of OmniServices Inc. is analyzed below:
Debt-to-Worth ratio:
The Debt-to-Worth Ratio (or Leverage Ratio) is a measure of howdependent a company is on debt financing as compared to owner’s
40 | P a g e

equity. It shows how much of a business is owned and how much isowed.
The Debt-to-Worth Ratio is computed as follows:
Debt-to-Worth Ratio = Total Liabilities / Net Worth
The debt to worth ratio of Omni Services Inc. from the year 1973-1979 is listed and then presented graphically below:
1973 1974 1975 1976 1977 1978 1979 1973DebttoworthRatio 0.93 0.85 0.76 0.91 0.77 0.65 $0.69 0.93
1972 1973 1974 1975 1976 1977 1978 1979 1980$0.00 $0.10 $0.20 $0.30 $0.40 $0.50 $0.60 $0.70 $0.80 $0.90 $1.00
Debt to worth Ratio
Debt to worth Ratio
Working Capital:
Working capital is a measure of cash flow and is not a realratio. It represents the amount of capital invested in resourcesthat are subject to relatively rapid turnover (such as cash,
41 | P a g e

accounts receivable and inventories) less the amount provided byshort-term creditors.
Working capital should always be a positive number. Lenders useit to evaluate a company’s ability to weather hard times. Loanagreements often specify that the borrower must maintain aspecified level of working capital.
Working capital is computed as follows:
Working Capital = Total Current Assets - Total CurrentLiabilities
The working capital of Omni Services shows the following positionfrom the year 1973-1979:
1973 1974 1975 1976 1977 1978 1979WorkingCapital 507 1189 854 905 890 827 979
1973 1974 1975 1976 1977 1978 19790
200
400
600
800
1000
1200
1400
Working Capital
Working Capital
42 | P a g e

Net Sales to Working Capital:
The relationship between Net Sales and Working Capital is ameasurement of the efficiency in the way working capital is beingused by the business. It shows how working capital is supportingsales.
It is computed as follows:
Net Sales to Working Capital Ratio = Net Sales/Net WorkingCapital
The Omni Services Inc. possesses the following Net Sales toWorking Capital Position:
1973 1974 1975 1976 1977 1978 1979NetSalestoworkingCapital $13.90 $7.05 $12.00 $13.78 $16.86 $20.30 $20.61
43 | P a g e

1972 1973 1974 1975 1976 1977 1978 1979 1980$0.00
$5.00
$10.00
$15.00
$20.00
$25.00
Net sales to working capital
Net sales to working capital
5.3. Profitability Indicator Ratio:The profitability Indicator Ratio discusses the differentmeasures of corporate profitability and financial performance.These ratios, much like the operational performance ratios, giveus a good understanding of how well the company utilized itsresources in generating profit and shareholder value.
Operating profit Margin:
The objective of margin analysis is to detect consistency orpositive/negative trends in a company's earnings. Positive profitmargin analysis translates into positive investment quality. To alarge degree, it is the quality, and growth, of a company'searnings that drive its stock price. It is calculated as:
Operating Profit Margin = Operating profit / Net sales(revenue)
44 | P a g e

The operating profit margin of Omni Services shows the followingposition:
1973 1974 1975 1976 1977 1978 1979operating profitmargin $5.87 $8.89 $6.86 $8.12 $7.55 $7.56 $8.73
1972 1973 1974 1975 1976 1977 1978 1979 1980$0.00 $1.00 $2.00 $3.00 $4.00 $5.00 $6.00 $7.00 $8.00 $9.00
$10.00
Operating profit margin
Operating profit margin
Return on Equity:
This ratio indicates how profitable a company is by comparing itsnet income to its average shareholders' equity. The return onequity ratio (ROE) measures how much the shareholders earned fortheir investment in the company. The higher the ratio percentage,the more efficient management is in utilizing its equity base andthe better return is to investors.
It is calculated as follows:
45 | P a g e

Return on Equity = Net Income/ Average Shareholders’Equity
1973 1974 1975 1976 1977 1978 1979Returnon Equity 0.22 0.13 0.24 0.20 0.22 0.19 0.19
The ROE of Omni Service Inc From the 1973 to 1979 isfound to be in the following position:
1972 1973 1974 1975 1976 1977 1978 1979 1980$0.00
$0.05
$0.10
$0.15
$0.20
$0.25
Return on equity
Return on equity
Return on Assets:
This ratio indicates how profitable a company is relative to itstotal assets. The return on assets (ROA) ratio illustrates how
46 | P a g e

well management is employing the company's total assets to make aprofit. The higher the return, the more efficient management isin utilizing its asset base. The ROA ratio is calculated bycomparing net income to average total assets, and is expressed asa percentage.
Here is the Formula to calculate ROA:
Return On Assets (ROA) = Net Income/Average totalassets
The ROA position of Omni service from the year 1973 to 1979 is asfollows:
1973 1974 1975 1976 1977 1978 1979Return on Assets 0.22 0.12 0.23 0.18 0.20 0.21 0.18
1972 1973 1974 1975 1976 1977 1978 1979 1980$0.00
$0.05
$0.10
$0.15
$0.20
$0.25
Return on Assets
Return on Assets
47 | P a g e

5.4. Debt Ratios:These ratios give users a general idea of the company's overalldebt load as well as its mix of equity and debt. Debt ratios canbe used to determine the overall level of financial risk acompany and its shareholders face. In general, the greater theamount of debt held by a company the greater the financial riskof bankruptcy.
Debt Ratio:
The debt ratio compares a company's total debt to its totalassets, which is used to gain a general idea as to the amount ofleverage being used by a company. A low percentage means that thecompany is less dependent on leverage, i.e., money borrowed fromand/or owed to others. The lower the percentage, the lessleverage a company is using and the stronger its equity position.In general, the higher the ratio, the more risk that company isconsidered to have taken on.
It is calculated using the following formula:
Debt Ratio = Total liabilities / Total assets
The Debt ratio of Omni services Inc is as follows:
1973 1974 1975 1976 1977 1978 1979Debt Ratio 0.48 0.46 0.43 0.48 0.44 0.39 0.41
48 | P a g e

1972 1973 1974 1975 1976 1977 1978 1979 1980$0.00
$0.10
$0.20
$0.30
$0.40
$0.50
$0.60
Debt ratio
Debt ratio
Debt-Equity Ratio:
The debt-equity ratio is another leverage ratio that compares acompany's total liabilities to its total shareholders' equity.This is a measurement of how much suppliers, lenders, creditorsand obligors have committed to the company versus what theshareholders have committed.
It is calculated by the following formula:
Debt-Equity Ratio = Total Liabilities / ShareholdersEquity
The Debt -Equity Ratio of Omni services Inc. is asfollows:
1973 1974 1975 1976 1977 1978 1979Debt-EquityRatio
0.934276
0.853338
0.762311
0.908827
0.773414
0.649051
0.682208
49 | P a g e

1972 1973 1974 1975 1976 1977 1978 1979 19800
0.10.20.30.40.50.60.70.80.91
Debt equity Ratio
Debt equity Ratio
Capitalization Ratio:
The capitalization ratio measures the debt component of acompany's capital structure, or capitalization (i.e., the sum oflong-term debt liabilities and shareholders' equity) to support acompany's operations and growth.
Here is the formula:
Capitalization Ratio = Long-term Debt/Long-term debt +Shareholders’ Equity
The capitalization Ratio of Omni Services is as follows
50 | P a g e

1973 1974 1975 1976 1977 1978 1979Capitalization Ratio
0.399633
0.338898
0.25698
0.348511
0.311278
0.236684
0.262611
1972 1973 1974 1975 1976 1977 1978 1979 19800
0.050.1
0.150.2
0.250.3
0.350.4
0.45
Capitalization ratio
Capitalization ratio
5.5. Operating Performance Ratios:These ratios have differing inputs and measure different segmentsof a company's overall operational performance, but the ratios dogive users insight into the company's performance and managementduring the period being measured.
51 | P a g e

Fixed Assets Turnover Ratio:
This ratio is a rough measure of the productivity of a company'sfixed assets (property, plant and equipment or PP&E) with respectto generating sales.
Here is the formula:
Fixed Asset Turnover = Revenue / Property, Plant and Equipment
The fixed Asset Turnover of Omni Services Inc .for the years1973-1979 is as follows:
1973 1974 1975 1976 1977 1978 1979Fixed Asset Turnover 2.29 3.19 2.97 2.44 2.44 2.48 2.43
1972 1973 1974 1975 1976 1977 1978 1979 1980$0.00
$0.50
$1.00
$1.50
$2.00
$2.50
$3.00
$3.50
Fixed asset turnover ratio
Fixed asset turnover ratio
52 | P a g e

Sales/Revenue per employee:
As a gauge of personnel productivity, this indicator simplymeasures the amount of dollar sales, or revenue, generated peremployee.
It is calculated using the following formula:
Sales/Revenue per employee = Revenue / Number ofEmployees (average)
1973 1974 1975 1976 1977 1978 1979Sales / Revenue per employee 11.75 13.97 17.08 20.78 25.01 27.98 33.63
1972 1973 1974 1975 1976 1977 1978 1979 1980$0.00
$5.00
$10.00
$15.00
$20.00
$25.00
$30.00
$35.00
$40.00
sales/revenue per employee
sales/revenue per employee
53 | P a g e

5.6. Cash-Flow Indicator Ratios: These ratios are cash flow indicators, which focus on the cashbeing generated in terms of how much is being generated and thesafety net that it provides to the company. These ratios can giveusers another look at the financial health and performance of acompany.
Dividend payout Ratio:
This ratio identifies the percentage of earnings (net income) percommon share allocated to paying cash dividends to shareholders.The dividend payout ratio is an indicator of how well earningssupport the dividend payment.
It is calculated as follows:
Dividend Payout Ratio = Dividend per Common share /Earnings pershare
The Dividend payout Ratio of Omni Services is as follows:
1973 1974 1975 1976 1977 1978 1979Dividend PayoutRatio 0.16 0.26 0.18 0.19 0.15 0.16 0.16
54 | P a g e

1972 1973 1974 1975 1976 1977 1978 1979 1980$0.00
$0.05
$0.10
$0.15
$0.20
$0.25
$0.30
Dividend payout ratio
Dividend payout ratio
These are the key ratio analysis of Omni services which gives usa clearer view of their financial strength ability and position.
5.7. DuPont AnalysisDuPont analysis is an extended analysis of a company's return onequity. DuPont equation provides a broader picture of the returnthe company is earning on its equity. It tells where a company'sstrength lies and where there is a room for improvement. Itconcludes that a company can earn a high return on equity if:
It earns a high net profit margin; It uses its assets effectively to generate more sales;
and/or It has a high financial leverage
According to DuPont analysis:Return on Equity = Net Profit Margin × Asset Turnover × Financial Leverage
Return on Net Sales Total
55 | P a g e

Equity = Income
× × Assets
Sales TotalAssets
TotalEquity
The DuPont Analysis of Omni Services Inc. from the year 1973-1979the following results:
1973 1974 1975 1976 1977 1978 1979ROE 0.22277
40.12798
30.21463
10.18524
80.19738
20.17957
90.17864
9
When graphically represented it is as follows:
1972 1973 1974 1975 1976 1977 1978 1979 19800
0.05
0.1
0.15
0.2
0.25
ROE
ROE
5.8. SWOT Analysis of Omni Services:SWOT stands for Strengths, Weaknesses, Opportunities and Threats,and is an important tool often used to highlight where a businessor organization is, and where it could be in the future. It looksat internal factors, the strengths and weaknesses of a business,and external factors, the opportunities and threats facing thebusiness. The process can give you on overview of where the
56 | P a g e

business, and the environment it operates in, is strategically.This is an important, yet too simple to understand tool used bymany students, businesses and organizations for analysis.
The analysis shows Omni Services Inc. Strengths, Weaknesses,Opportunities and Threats. The SWOT analysis will give us a clearpicture of the business environment Oni services In. is operatingin.
Strengths:
The strengths of a business or organization are positive elements, something they do well and is under their control. The strengths of a company or group add value to it, and can be what gives it the edge in some areas over the competitors. The following section will outline main strengths of Omni services Inc. are:
Highly experienced owner-operator Very high gross margin A very loyal employee base Operates business in large Metropolitan areas Located on the fringes of large metropolitan areas Locations attracted employees that were more dependable and
productive than higher paid city worker First firm in Virginia to offer employee stock ownership
plan (ESOP) Innovative in managing employees
Weaknesses:
Weaknesses of a company or organization are things that need to be improved or performed better, which are under their control. Weaknesses are also things that place it behind competitors, or stop it from being able to meet objectives. The weaknesses of Omni services Inc. are:
57 | P a g e

Not located in the large metropolitan cities High transportation costs Very little flexibility in pricing Increased transportation time
Opportunities:
Opportunities are external changes, trends or needs that couldenhance the business or organization’s strategic position, orwhich could be of a benefit to them. This section will outlineopportunities that Omni services Inc was facing.. Theopportunities are:
Ability to develop additional RUS’s Affiliate relationships with vendors Development of proprietary products Development in expertise of linen towel sales Sale of a business for a significant P/E
Threats:
Threats are factors which may restrict damage or put areas of thebusiness or organization at risk. They are factors which areoutside of the company's control. Being aware of the threats andbeing able to prepare for them makes this section valuable whenconsidering contingency plans and strategies. This section willoutline main threats our Omni services Inc.
The increasing competition in industry The fragmented nature of industry Increase in the labor costs of the fringed areas New entrance in the uniform rental business that locate in
the Metropolitan areas Changes in regulations can impact the business
58 | P a g e

Financial Risks:
Financial Risks is the possibility that shareholders will losemoney when they invest in a company that has debt, if thecompany's cash flow proves inadequate to meet its financialobligations. Omni services inc. has a moderate level of businessrisk. These are the factors that may be considered to be risky infuture for Omni services Inc.
General economic factors may adversely affect theirfinancial performance.
Increased competition could adversely affect our financialperformance.
Risks associated with the suppliers from whom their productsare sourced could adversely affect their results ofoperations.
An inability to open new, cost effective operatingfacilities may adversely affect their expansion efforts.
Compliance with environmental laws and regulations couldresult in significant costs that adversely affect theirresults of operations.
Business Risk:
Business Risk is the possibility that a company will have lowerthan anticipated profits, or that it will experience a lossrather than a profit. Business risk is influenced by numerousfactors, including sales volume, per-unit price, input costs,competition, and overall economic climate and governmentregulations. In this case Omni services Inc. has a lower businessrisk because its sales growth are growing very significantly. Forexample the industry profit before taxes was about 5.5 percent,while Omni’s was almost double. Analyzing the financial
59 | P a g e

statements also gives evidence that Omni services Inc. is facinga lower level of business risk than the industry and competitors.
60 | P a g e

Chapter 6 Omni Service INC.
Comparison with Industry
61 | P a g e

6. Comparison of Omni Services INC withindustry:
In exhibit 3 some financial information regarding these 5companies are given. we have assumed that industrial laundrybusiness industry is comprised of these six companies. We usedthe financial information available to for calculating industryaverage and then we have posted the items in graphs for comparingOmni Services INS with the same of industry. We compared OmniServices ratio with Industry average to overlook how Omni isdoing in the relevant industry. These 5 are the major competitorsof Omni Services and with the financial information available tous we have done a comparison. The bases of the comparisons are:
5- Year Growth in After-Tax Net Profit
5- year growth in Revenues
Current ratio
1978-1979 Growth in net worth
Net Profit on sales
Debt to common Equity
EPS ( Earning per share)
Dividend Payout Ratio
Average Yield
Book value per share
Return on Common equity
Sales ( in millions):
P/E Ratio
Percent of Sales in Laundry
62 | P a g e

Now Omni Services performance in the industry is evaluated incomparison with the industry. Omni services information withIndustry average is plotted n graphs are the results are comparedto see the position Omni Services INC holds in the industry.
5- Year Growth in After-Tax Net Profit:
Net Profit After tax is a more accurate look at operatingefficiency for leveraged companies. It does not include the taxsavings many companies get because they have existing debt. Inthe following graph we have plotted the data of Omni’s 5 yeargrowth in after tax Net profit against the industry growth inafter tax net profit.
Net Profit After tax = Operating Income x (1 - Tax Rate)
63 | P a g e

10.00%
5.00%
10.00%
15.00%
20.00%
25.00%
30.00% 27.20%
12.23%
5 year growth in after tax Net Profit
Omni Industry average
Figure: comparison of Omni Services INC with industry
Analysis:
Growth in after tax net profit of Omni Services is higher
than industry by more than double, which is good that means
Omni Services will strive in the industry in the long run
There are many scopes of Omni Service’s in the future.
5- year growth in Revenues:Revenue growth illustrates sales increases/decreases over time.It is used to measure how fast a business is expanding. Morevaluable than a snapshot of revenue, revenue growth helps
64 | P a g e

investors identify trends in order to gauge revenue growth overtime.
Revenue Growth= (Revenue in Year 10 - Revenue in Year 1)/ Revenuein Year 1
10.00%
5.00%
10.00%
15.00%
20.00%
25.00%
19.20%
10.30%
5- year growth in Revenues
Omni Industry average
Figure: comparison of Omni Services INC with industry revenuegrowth
Analysis: Growth in revenue should be higher if one wishes to see
growth.
The industry growth rate is 10% as industrial laundry
service is a mature industry the growth is less than Omni
Service though Omni has started early it still has not
exhausted all its resources
The 5 year growth in revenue shows potential for Omni
Services.
65 | P a g e

For the revenue level ever so increasing Omni wants to
undertake a five year dividend growth plan.
Current ratio:The "current ratio' indicates the ability of a company to pay itscurrent liabilities from current assets, and, thus shows thestrength of a company's working capital position. The currentratio is significant to both short and long term creditors. Shortterm creditors are particularly interested in the current in thecurrent ratio since the conversion of inventories and accountsreceivable into cash is the primary source which the companyobtains the cash to pay short-term credits. Long-term creditorsare interested in the current ratio because a company that isunable to pay short term debts may be forced into bankruptcy.
Current ratio = Current assets ÷ Current liabilities
10.00
0.50
1.00
1.50
2.00
2.50
1.50
2.37
Current Ratio
Omni Industry average
66 | P a g e

Figure: comparison of Omni Services INC with industry Currentratio
Analysis: Generally, a current ratio of 2:1 is acceptable for most
firms Normally 1.5 is essential for industrial companies. So Omni
Services barely fits the marks. If we see industry averageit is higher than 2 which are moderately good.
This current ratio is capable of attracting long-termcreditors. So Omni should improve its Current Ratio.
1978-1979 Growth in net worth:The amount by which assets exceed liabilities. Net worth is a
concept applicable to individuals and businesses as a key measure
of how much an entity is worth. A consistent increase in net
worth indicates good financial health; conversely, net worth may
be depleted by annual operating losses or a substantial decrease
in asset values relative to liabilities. In the business context,
net worth is also known as book value or shareholders' equity.
Net Worth = Total Assets - Total Liabilities
67 | P a g e

10.00%2.00%4.00%6.00%8.00%
10.00%12.00%14.00%16.00%18.00%20.00% 17.80%
10.10%
1978-1979 Growth in net worth
Omni Industry average
Figure: Comparison of Omni Services INC with industry Net growthin 1978-1979
Analysis: As the growth in net worth of Omni Service is higher than
industry average it means the performance of Omni Service is
good.
In the graph the data used is for 1978-1979. This year’s
Omni’s total asset was greater than total liabilities which
are a good sign for the business and it increases industry
average which means the performance of the company exceeds
industry.
Net Profit on sales:
68 | P a g e

This ratio measures the ability of the revenue to sustain
expenses and give a positive net income. It is helpful in
identifying the proportion of sales units that remain after the
expenses.
Net Profit to net sales = Net Profit ÷ Net sales
10.00%
1.00%
2.00%
3.00%
4.00%
5.00%
6.00%
7.00%6.10%
4.13%
Net Profit on sales
Omni Industry average
Figure: comparison of Omni Services INC with industry Net Profiton sales
Analysis: A higher ratio indicates a more profitable company that has
better control over its costs compared to its competitors.
as we can see from the graph that Omni Service’s Net Profit
on sales ratio is higher than industry average meaning
Omni’s control over its cost compared to its competitors is
higher.
69 | P a g e

From the graph it can be easily depicted that Omni is a
profitable company as its net profit on sales is higher than
its competitors.
Debt to common Equity:The debt to equity ratio expresses the relative equities ofowners and creditors of a company. This ratio is important tocreditors because it shows how much more the stockholders havecontributed to the company than the creditors themselves.
Equity to debt ratio = Equity ÷ Total Debt
10.00%
5.00%
10.00%
15.00%
20.00%
25.00%
30.00%
35.00%
40.00% 35.60%
28.45%
Debt to common Equity
Omni Industry average
Figure: comparison of Omni Services INC with industry Debt tocommon equity
70 | P a g e

Analysis: Purpose is measurement of company financial leverage
as this ratio decreases , the company seems more attractive
to the creditors
Omni’s debt to common equity ratio seems to be greater than
the industry debt to equity ratios which means Omni must
take some steps to decrease its debt to equity ratios.
EPS ( Earning Per Share):EPS is the amount of net income per share of the company'soutstanding common stock .This is the most widely used index fora company's operations and is very important for both thepotential and the existing shareholders.
EPS = Earnings available to stockholders ÷ Average No.of shares outstanding
71 | P a g e

1$1.95
$2.00
$2.05
$2.10
$2.15
$2.20
$2.25
$2.30
$2.05
2.24
EPS
Omni Industry average
Figure: comparison of Omni Services INC with industry EPS
Analysis: EPS a popular measurement of profitability. As we can see
from the graph that the earning per share of Omni Services
is less than industry average which is not good.
Omni Service’s EPS is not far behind from the industry
average so Omni services should pay more attention to it as
the EPS can increase if more attention is given.
Dividend Payout Ratio:
72 | P a g e

The amount of earnings paid out in dividends to shareholders.Investors can use the payout ratio to determine what companiesare doing with their earnings. The part of the earnings not paidto investors is left for investment to provide forfuture earnings growth. Investors seeking high current income andlimited capital growth prefer companies with high Dividend payoutratio. However investors seeking capital growth may prefer lowerpayout ratio because capital gains are taxed at a lower rate.High growth firms in early life generally have low or zero payoutratios. As they mature, they tend to return more of the earningsback to investors.
Payout Ratio = (Dividends - Preferred Stock Dividends)/Net Income
10.00%
5.00%
10.00%
15.00%
20.00%
25.00%
30.00%
35.00%
15.60%
30.42%
Dividend Payout Ratio
Omni Industry average
Figure: comparison of Omni Services INC with industry DividendPayout ratio
Analysis: The payout ratio indicates how well earnings support the
dividend payments: the lower the ratio, the more secure the
dividend because smaller dividends are easier to pay out
than larger dividends.
73 | P a g e

We can clearly see that the dividend payout ratio of Omni
Service’s is lower than industry average which is a very
good sign for the company.
Average Yield:The average yield on an investment or a portfolio that results
from adding all interest, dividends or other income generated
from the investment, divided by the average of the investments
for the year. The average annual yield is a particularly useful
tool for floating-rate investments, in which the fund's balance
and/or the interest rate change frequently.
10.00%0.50%1.00%1.50%2.00%2.50%3.00%3.50%4.00%4.50%5.00%
0.00%
4.65%
Divident Payout Ratio
Omni Industry average
Figure: comparison of Omni Services INC with industry Averageyield
Analysis:74 | P a g e

Omni Service INC’s average yield is not present in the case so for that the comparison is not possible
Book value per share:The book value per share formula is used to calculate the per
share value of a company based on its equity available to common
shareholders. The term "book value" is a company's assets minus
its liabilities and is sometimes referred to as stockholder's
equity, owner's equity, shareholder's equity, or simply equity.
Book value per share = (total common equity/ average shares)
75 | P a g e

1$0.00 $2.00 $4.00 $6.00 $8.00
$10.00 $12.00 $14.00 $16.00 $18.00 $20.00
$11.48
18.36
Book value per share
Omni Industry average
Figure: comparison of Omni Services INC with industry book valueper share
Analysis:
If book value per share is higher than the currently traded
stock price, the company can be considered undervalued.
Should the company decide to dissolve, the book value per
common indicates the dollar value remaining for common
shareholders after all assets are liquidated and all debtors
are paid.
The book value per share is lower than industry average
which is not that good.
Return on Common equity:
76 | P a g e

The amount of net income returned as a percentage of shareholders
equity. Return on equity measures a corporation's profitability
by revealing how much profit a company generates with the money
shareholders have invested. ROE is expressed as a percentage and
calculated as:
Return on Equity = Net Income/Shareholder's Equity
10.00%2.00%4.00%6.00%8.00%
10.00%12.00%14.00%16.00%18.00%20.00% 17.90%
12.73%
Return on Common Equity
Omni Industry average
Figure: comparison of Omni Services INC with industry return onequity
Analysis: It is an important segment of DuPont analysis
ROE is a measure of profitability of stockholders'
investments. Higher values are generally favorable meaning
that the company is efficient in generating income on new
investment
Omni Service’s Return on equity is higher than industryaverage which is considered as a good sign for the company.
77 | P a g e

Sales ( in millions):The total sales of Omni Services INC against the industry average
are shown. the total sales of Omni in the year is plotted in the
graph and the industry average is also showed in the graph. the
industrial laundry business is very progressing business and that
can be proved by showing the sales which is shown in millions.
1$0
$20 $40 $60 $80
$100 $120 $140 $160 $180
$20
$170
Sales ( in million)
Omni Industry average
Figure: comparison of Omni Services INC with industry Sales (inmillions)
Analysis: Total sales of 1979 is 20 million which is a big amount for
Omni Services but in comparison to the industry the amount is not that big
78 | P a g e
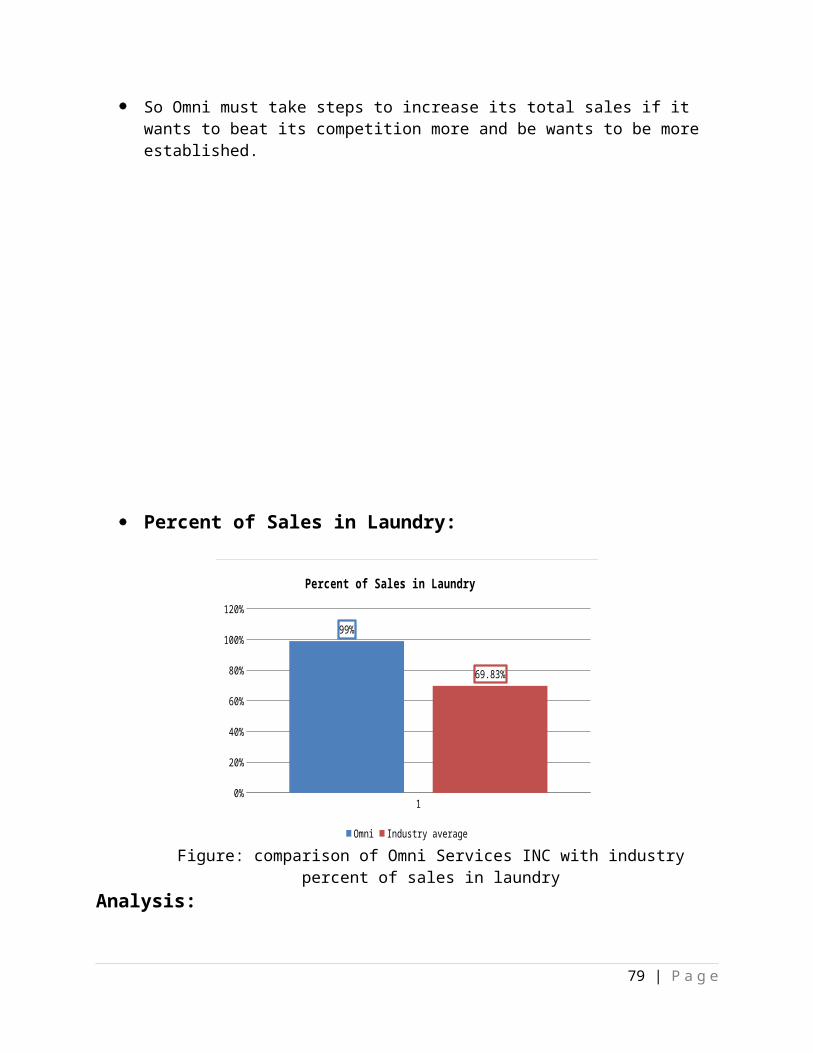
So Omni must take steps to increase its total sales if it wants to beat its competition more and be wants to be more established.
Percent of Sales in Laundry:
10%
20%
40%
60%
80%
100%
120%99%
69.83%
Percent of Sales in Laundry
Omni Industry average
Figure: comparison of Omni Services INC with industrypercent of sales in laundry
Analysis:
79 | P a g e

Omni has 99% of sales in laundry where as Omni’s major
competitors Rentex and Means Services has 100 percent of
sales in laundry.
In case of industry the percentage is low it terms of Omni
but other competitor’s use 100 percent so Omni must use the
100% as it wants to progress more and more in the future.
80 | P a g e

81 | P a g e
Chapter 7
Problem Statement

7. Problem Statement:Examining key information for each company involved in the mergeris a good idea. Looking over and analyzing the company anddetermining the information if it is a good investment decision.Decision should reflect a combination of the best interest forthe company and the outside world. With the right information andrelevant consideration of the facts, coming out ahead in the faceof a merger can be a realistic goal. After studying the wholecase again and again we the group members have found one majorproblems in the company and for the solution of that problem twonew problems have raised.
Mr Leducq was considering buying a majority interest in Omni,with his eventual ownership position to reach two-thirds orbetter. In 1979 he was in the midst of meeting the Omnimanagement and visiting the Culpeper plant and had engaged a NewYork firm to calculate the value of Omni’s closely relatedstocks. Mr. Leducq believed that the rental uniform market inFrance was where the U.S market had been in the early 1950s quitea different business from what is was today. At first the mergersoffer provided by Mr. Leducq, the owner The Societe Generale deLocation et Services Textiles (Textiles) to Omni ServicesIncorporation includes:
i. Mr. leducq considered uniform rental to hold great promise
in France furthermore, he believed Textile’s skill in the
roll towel business might be useful to Omni, which had
little expertise in linen towel sales.
ii. Mr. leducq has stated that if Textiles buy a majority of
Omni’s stock, they would want to set the maximum ESOP
ownership at 25 % of the stock.
82 | P a g e

iii. Mr. Leducq has also stated that he would want reassurance
that Mr. Martin and the rest of Omni management would stay.
iv. The owner of textile Mr. leducq wanted assurance that
martin would continue to operate the business as had been
planned seeking new business and making new plan and making
capital investment outlays and dividend payment detailed in
5 year plan.
v. Mr. Landucq had proposed that Textiles purchases 51 percent
of Omni’s share in 1980. In 1985, Textiles would make an
additional purchase of 90000 shares brining the ownership to
66 percent. Of the remaining shares, up to 170000 more could
be sold to Textiles in 1985 at the previously agreed price,
if any shareholder wished to sell.
vi. This agreement would spread the purchase over 5 years, sothe price of the shares in 1985 would be determined duringthe current negotiation. Mr. Martin wanted a floor priceset, below which 1985 price would not drop:
Should Omni accept the merger offer of the The Societe Generale de Location et Services Textiles (Textiles)?
Omni Services INC. is a multimillion dollar company. The majorproblem that Omni is facing now is whether they should merge witha French company named “The Societe Generale de Location etServices Textiles (Textiles)” a large strong French company thatwas also in rental linen business. Mr Leducq the owner of TheSociete Generale de Location et Services Textiles (Textiles) hadengaged a New York firm to value Omni’s closely held stock. With
83 | P a g e

this information Mr. Martin, Omni’s founder and President wassure that the Frenchman was serious about his proposal. Though MrMartin liked the idea of being the CEO of a $20 million business,having the company airplane at his disposal and being needed bythe business on the other hand selling some of the stock viamerger would provide him enough cash to allow him to pay off allhis debts including the mortgage in the new house building.After evaluating all the information and the share price for boththe year 1980 and 1985 the decision has to be made this willbenefit both the parties. So to determine whether Omni shouldaccept the merger offer we have to solve the following problems
What is the value of the company?
The value of the company should first be determined. Using theinformation provided in the Income statement, statement ofretained earnings and balance sheet the value of the companyshould be determined .To determine the value the differentvaluation techniques should be used i.e. FCF, DDM model etc.Using these techniques the value of the company will be foundout.
What should be the price per share at the time ofMerger?
After finding out the value of the firm the price per share willbe calculated. In the merger offer it is described that in 1980that Textile will purchase 51% shares (total 306000 shares ofOmni Services INC) and in 1985 Textile would make an additionalpurchase of 90000 shares. Because the agreement would spread over5 years, the French government required that Textile show theability to honor the contract by pledging stock or having a line
84 | P a g e

of credit for the full amount of contractual obligation. Theprice of the share of 1985 will be calculated so that Omni doesnot incur loss by setting a lower floor price. So the price pershare of 1985 would be determined during the current negotiation.Mr. Martin also wanted to determine a floor price set below which1985 price will not drop.
85 | P a g e

86 | P a g e
Chapter 8Solution to the Problems

8. Solution to problem no 1:The solution for the problem whether Omni should accept the merger offer of the The Societe Generale de Location et Services Textiles (Textiles) two new problems should be solved. The soltuin of those problems are given below:
8.1. Finding out the value of the firm: The value of the firm should be calculated to determine the priceof stock. Mr. Landucq and Mr. Martin both want to know the stockprice of both 1980 and 1985 so that both the parties of mergerwill not face loss. We have to find the value of share of Omni in1985 because
The information available to us is the income statement,statement of retained earnings and balance sheet statement forthe year 1973 to 1979. Textile proposed to buy the stocks of OmniService in 1980 and the offer stretches to 5 year. In 1985Textiles will buy additional shares. So we will have to find outthe value of stock of 1985. Hence we have to find out the valueof the firm for the year 1985. The information given in thisreport is the balance sheet up to 1979 and dividend plan up to1984. But information is given like Omni would double its saleand profits by 1984. So we had to prepare forecasted incomestatement, balance sheet for the year 1980 to 1984. So find thevalue of the firm and the stock for the year 1985.
We can find the value of the firm by using the following methods:
Free cash Flow to Firm method ( FCFF) Free cash flow to equity method (FCFE) Dividend discount model ( DDM)
i. FCFF (Free cash Flow to Firm) method:
87 | P a g e

This is a measurement of a company's profitability after all expenses and reinvestments. It's one of the many benchmarks used to compare and analyze financial health.
ii. FCFE (Free cash Flow to Equity) method:This is a measure of how much cash can be paid to the equity shareholders of the company after all expenses, reinvestment and debt repayment. FCFE determines the value of the firm’s equity.
iii. Dividend discount model ( DDM):A procedure for valuing the price of a stock by using predicted dividends and discounting them back to present value. The idea isthat if the value obtained from the DDM is higher than what the shares are currently trading at, then the stock is undervalued.
For both FCFF and FCFE method we need to find the growth rate andcost of equity. The growth rate and cost of equity calculation isgiven below:
Growth rate determination:
Growth rate of 1984
= RR (Retention rate)* ROE (Return on equity)
= (1- Dividend payout ratio) * ROE
= (1-.128)*.21
= 18.312%
88 | P a g e

Retention rate is calculated (1-dividend payout ratio) which is (1-.128) or .872 times the return on equity which is calculated by net income/total equity. The growth rate for 1984 is 18.312%.
Another way to calculate the growth rate is
Average Growth Rate=n√ DDo-1
=5√.56.36 -1
=.0923The dividend growth rate will be influenced by the age of theindustry life cycle, structural life cycle, industry competitionand economic trends. Information derived about management’s plan,to expand the firm, diversity into new areas or change dividendpolicy provides useful input. Averaging growth rate dividend(9.23%) and the implied sustainable growth estimate 18.321%indicates a value of 13%. Since the firm’s firms estimateddividend grows at reasonably constant growth we have used theaverage 13% as there is a huge difference between the twomethods.
Discount rate of equity= Risk free return + (β∗RiskPremium )
= Risk Free Return +β∗(Marketrisk−riskfreereturn)
=.1+.9*(.20-.1)
=.19
Cost of Capital = .19 or 19%
8.2. Finding out the value of Stock:
89 | P a g e

After finding out the value of the firm the price per share willbe calculated. We will calculate the per share price of both 1980and 1985 by using FCFF method, FCFE method and DDM model. In thecase Mr. Martin had put together a 5 year plan for Omni. Therewere 3 goals of the of the plan which helped us to calculate theshare price and firm’s value for the year 1985. We will regardthis plan even though it was taken before the Textile offerbecause Mr. Leducq wanted assurances that Mr. Martin wouldcontinue to operate the business as had planned: seeking newbusinesses and making the capital investment outlays and dividendpayments detailed in the 5 year plan.
The 5 year plan is given below:
1980 1981 1982 1983 1984total dividend 21600
024000
026400
028800
033600
0dividend per share
0.36 0.4 0.44 0.48 0.56
payout ratio(estimated)
14.80%
14.30%
13.50%
12.70%
12.80%
The goals of Omni Services are:
Double profits by 1984 Double sales by 1984 Reduce the debt-to-equity ratio substantially
These data had helped to prepare the forecasted income statement,balance sheet for the year 1980 to 1984. With these data andother data formed by estimation we have calculated the shareprice for 1985. Because as per merger offers the plan is spreadfor 5 year. In 1985 Textile will buy additional 90,000 shares ofOmni. The French government required that Textiles show theability to honor the contract by pledging stock or having a lineof credit for the full amount of the contractual obligation. Soit is necessary to know the price of shares of Omni Services in1985.
90 | P a g e

91 | P a g e

92 | P a g e
Chapter 9
Solution to the Problemsusing FCFF
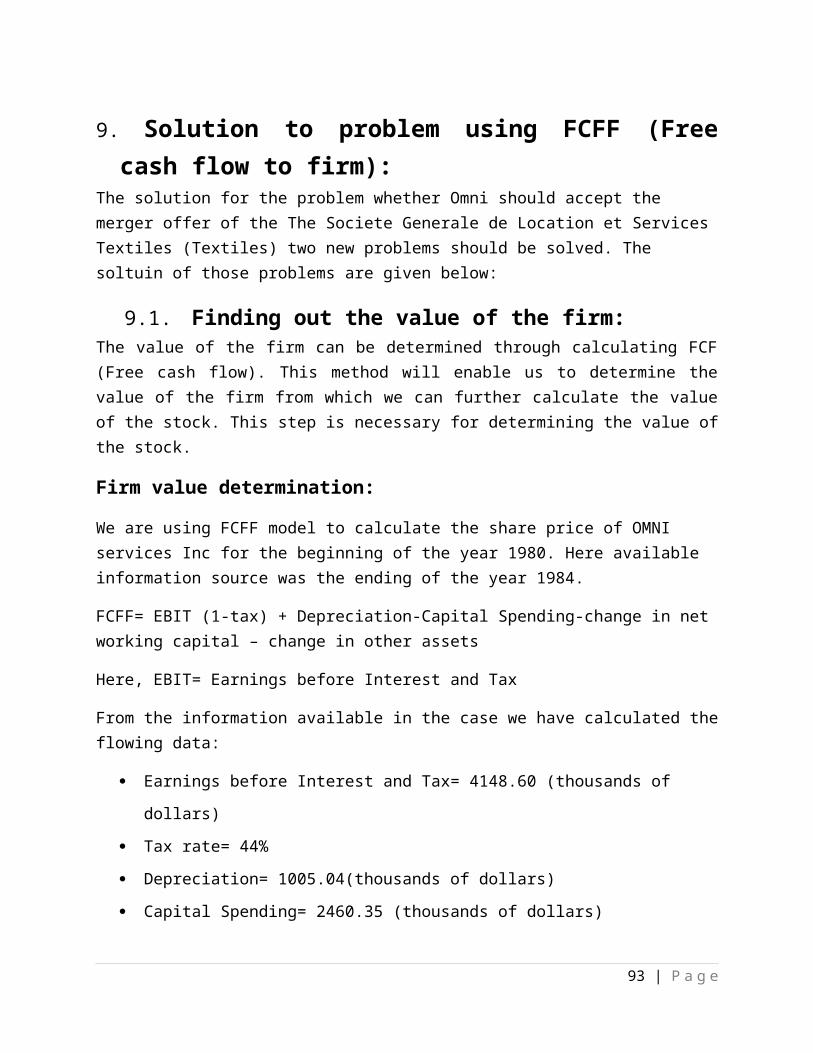
9. Solution to problem using FCFF (Freecash flow to firm):
The solution for the problem whether Omni should accept the merger offer of the The Societe Generale de Location et Services Textiles (Textiles) two new problems should be solved. The soltuin of those problems are given below:
9.1. Finding out the value of the firm: The value of the firm can be determined through calculating FCF(Free cash flow). This method will enable us to determine thevalue of the firm from which we can further calculate the valueof the stock. This step is necessary for determining the value ofthe stock.
Firm value determination:
We are using FCFF model to calculate the share price of OMNI services Inc for the beginning of the year 1980. Here available information source was the ending of the year 1984.
FCFF= EBIT (1-tax) + Depreciation-Capital Spending-change in net working capital – change in other assets
Here, EBIT= Earnings before Interest and Tax
From the information available in the case we have calculated theflowing data:
Earnings before Interest and Tax= 4148.60 (thousands of
dollars)
Tax rate= 44%
Depreciation= 1005.04(thousands of dollars)
Capital Spending= 2460.35 (thousands of dollars)
93 | P a g e

Change in net working capital= 480.0687077 (thousands of
dollars)
change in other assets= 0 ( As we have assumed that no
changes were made in other asset from 1980 to 1984)
FCFF1984= 4148.60*(1-.44) +1005.04-2460.35-480.0687077-0
= 387.833 (thousands of dollars)
Firm Value1985= FCFF019842(1+g)
WACC−g
For that we need to calculate the value of WACC and g( which means growth)
WACC=Equity
(Equity+Debt)∗Discountrateof equity+ Debt
(Equity+Debt)∗(1−taxrate)∗discountrateofdebt
= 13197(13197+6635)
∗.19+ 6635(13197+6635)
∗(1−.44)∗0.0809
= .14 or 14%
Here in finding the WACC the discount rate of equity is estimatedby using the risk free rate and market risk premium and beta. Weassumed the beta to .9 and the risk free rate 10% which is basedon the current returns of treasury bonds. Risk premium is thedifference between market risk and the risk free return which wehave assumed to be 15%.
The calculation of the discount rate of debt and discount rate ofequity is given below.
Discount rate of Debt = Interest rate *(1-.44)
= .1445*(1-.44)
94 | P a g e

= 8.092%
Discount rate of equity = Risk free return + (β∗RiskPremium)
= Risk Free Return +β∗(Marketrisk−riskfreereturn)
=.1+.9*(.20-.1)
=.19
Growth rate determination:
Growth rate of 1984
= RR (Retention rate)* ROE (Return on equity)
= (1- Dividend payout ratio) * ROE
= (1-.128)*.21
= 18.312%
Retention rate is calculated (1-dividend payout ratio) which is (1-.128) or .872 times the return on equity which is calculated by net income/total equity. The growth rate for 1984 is 18.312%.
Another way to calculate the growth rate is
Growth Rate=n√ DDo-1
=5√.56.36 -1
=.0923The dividend growth rate will be influenced by the age of theindustry life cycle, structural life cycle, industry competitionand economic trends. Information derived about management’s plan,to expand the firm, diversity into new areas or change dividend
95 | P a g e

policy provides useful input. Averaging growth rate dividend(9.23%) and the implied sustainable growth estimate 18.321%indicates a value of 13%. Since the firm’s firms estimateddividend grows at reasonably constant growth we have used theaverage 13% as there is a huge difference between the twomethods.
Firm Value1985 = FCFF019842(1+g)
WACC−g
=387.833(1+.13).14−.13
=387.8330.01688
= 43825 (thousands of dollars)
Determining PV (Present Value):As we have used free cash flow we will use WACC (weighted averagecost of capital) for calculating the present value of the firmwhich will help us determine the share price. The information is:
96 | P a g e

year Free cash flow Present value@14%
total
1980 154.57 0.885 136.7945
1981 143.52 0.769 110.3669
1982 141.12 0.675 95.2561983 216.02 0.592 127.883
81984 (387.83+43825)=
442130.529 23389
23859.3
So the value of the firm is $ 23859 (thousands of dollar)
Share price determination for 1980 and 1985:
For calculating the share price we need the free cash flow of thecompany. The formula for determining per stock price is:
Per share Price1980 = FirmValue
TotalOutstandingStock
In case of Omni Services Limited the information needed tocalculate per share price are:
Firm value= 23859 (thousands of dollars)
Total outstanding stock= 600
Per share Price1980 = 23859600
=$ 39
Per share Price1985 = 43825600
97 | P a g e

= $ 73.04 Total Share Price using FCFF method:
We have concluded from FCFF method the price of share in 1985 andhave applied NPV (Net Present Value) on that the price per shareof Omni is $39. And Textile will buy 306000 shares to purchase 51percent of Omni’s shares in 1980.
Total share price of 1980 = (Number of shares × Price per share)
= (306000 × $ 39)
= $ 1,19,34,000
Total share price of 1985 = (Number of shares × Price per share)
= (90000 × $ 73.04)
= $ 65,73,600
98 | P a g e

10. Alternative method (Using FCFE Method): The solution for the problem whether Omni should accept the merger offer of the The Societe Generale de Location et Services Textiles (Textiles) two new problems should be solved. The solutions of those problems are given below:
FCFE means free cash flow to equity. We will calculate the value of the share by using FCFE method as an alternative solution. Thedetermination of per share price is given below:
Firm value determination:
We are using FCFE model to calculate the share price of OMNI services Inc for the beginning of the year 1980. Here available information source was the ending of the year 1984.
FCFE= Net Income + Depreciation-Capital Spending-change in net working capital + Net Borrowing
Here, Net Income includes tax and interest
From the information available in the case we have
calculated the flowing data:
Net Income = 2781.37991540482 (thousands of dollars)
Depreciation= 1005.04 (thousands of dollars)
Capital Spending= 2460.35212707823 (thousands of dollars)
Change in net working capital=current assets -cash-current
liabilities 455.91 (thousands of dollars)
Borrowing Capital= Change in debts= 855.13
FCF1984= 2781.37991540482+1005.04-2460.35212707823-455.91+ 855.13
99 | P a g e

= 1725 (thousands of dollars)
Firm Value1985= FCFF019842(1+g)
k−g
Discount rate of equity= Risk free return + (β∗RiskPremium )
= Risk Free Return +β∗(Marketrisk−riskfreereturn)
=.1+.9*(.20-.1)
=.19
Firm Value1985 = FCFF019842(1+g)
k−g
=1725.29(1+.13).19−.13
=1950.06
= 32492 (thousands of dollars)
Determining PV (Present Value):As we have used free cash flow we will use WACC (weighted averagecost of capital) for calculating the present value of the firmwhich will help us determine the share price. The information is
year Free cash flow Present value @14%
Total
1980 1014 0.84 851.761981 1157 0.706 816.8421982 1321 0.593 783.353
100 | P a g e

1983 1509 0.499 752.9911984 (1950+ 32492)=
34225.290.419 14340.4
17545.34
So the value of the firm is $ 17545.34 (thousands of dollar)
Share price determination for 1980 and 1985:
For calculating the share price we need the free cash flow of thecompany. The formula for determining per stock price is:
Per share Price1980 = FirmValueTotalOutstandingStock
In case of Omni Services Limited the information needed tocalculate per share price are:
Firm value= 17545.34 (thousands of dollars)
Total outstanding stock= 600
Per share Price for the year 1980 = 17545.34600
=$ 29
Per share Price1985 = 32492600
= $ 54.15 Total Share Price using FCFE method:
We have concluded from FCFF method the price of share in 1985 andhave applied NPV (Net Present Value) on that the price per share
101 | P a g e

of Omni is $29. And Textile will buy 306000 shares to purchase 51percent of Omni’s shares in 1980.
Total share price of 1980 = (Number of shares × Price per share)
= (306000 × $ 29)
= $ 8874000
Total share price of 1985 = (Number of shares × Price per share)
= (90000 × $ 54.15)
= $ 4873500
102 | P a g e

11. Alternative method (Using DividendDiscount Model):
Multiple-year holding period:
Given investors can hold a common stock for over a year, it is useful to value a stock over the investor's expected holding period. In this case, the DDM model can be used.
The formula for multiple year holding periods is-
= D1(1+k)1
+D2
(1+k)2+…+ Dn
(1+k)n
= D1(1+k)1
+D2
(1+k)2+
D3
(1+k)3+
D4(1+k)4
+D5
(1+k)5+SharePrice5
(1+k)5
= .56(1.19) +
.401.192
+ .441.193
+ .481.194
+ .561.195
+73.041.195
= $ 32So, from DDM model we figured out the value of stock for the yearof 1980. And the price per share is $32.
Share Price Determination:
Total share price of 1980 = (Number of shares × Price per share)
= (306000 × $ 32)
= $ 9792000
103 | P a g e

104 | P a g e
Chapter 12 Recommendation

12. Recommendations:After calculating per share value with three different valuationtechniques FCFF, FCFE and DDM we found three different shareprices. As we know FCFF is used to calculate the value of thefirm and FCFE is calculated to find the value of the equity andDDM is used for minority shareholders. The owner of textile Mr.Leducq proposed to buy 51% of Omni’s shares so he could not beconsidered as the minor shareholder. Because selling some of thestock would provide enough cash to allow Mr. Martin to pay offall his debts including the mortgage of the new house he wasbuilding. The concern of one board member that the new ownerswill take in charge the management of the firm and will run thebusiness down but the owner of textile Mr. Leducq wantedassurance that martin would continue to operate the business ashad been planned seeking new business and making new plan andmaking capital investment outlays and dividend payment detailedtin 5 year plan.
For our merger we will consider all three valuation methods wherethe share prices for 1980 are $39, $29 and $32. As Textile willown 51% of Omni’s share, which are majority share we have decidedthe merger price will be between $29 and $39, it will be $35. Ifwe set the price for $35 then both the parties will benefit fromthis merger.
The number of the share is 306000 which Textile will buy to gain51% ownership of Omni.
So, the price of total share in 1980 = 306000*35
= $1,07,10,000
In 1985 the textile will purchase an additional 90000 shareswhich will bring the ownership position to 66% so as per share
105 | P a g e

price determined by FCFE model the payment in 1985 will be $54and In the FCFF model the payment in 1985 will be $ 73.04.
As French government required that textiles show the ability tohonor the contract by pledging stock or having a line of creditfor the full amount of the contractual obligation. Thus textileswould have to secure the current price plus whatever it agreed topay for additional share in 1985 before the initial purchase.
So, for the price of 90,000 shares the price will be negotiatedbetween $54 and $73.04. The negotiated price for 1985 will be$64.
So, the price of total share in 1985= 90000*64
= $5760000
Textiles will pay for the shares in 1980 $1,07,10,000 ( per shareprice $35) and in 1985 they will pay $5760000 (Per share price$64). This price was negotiated by Mr. Martin and Mr. Leducq.
After analyzing all the information we came to the conclusionthat the merger is profitable for both companies. The advantagesthat Mr. Martin will get are already highlighted. Mr. Leducqwould also earn profit from this merger and it would help theTextile Company too.
106 | P a g e

107 | P a g e
Chapter 13 &14Conclusion and References

13. Conclusion:Finding a value for a company is no easy task - but doing so isan essential component of effective management. The reason: it'seasy to destroy value with ill-judged merger, investments orfinancing methods. This report will take readers through theprocess of valuing a company, starting with simple financialstatements and the use of ratios, and going on to the FCFF, FCFE.After doing the valuation techniques we have come to a conclusionthat the merger will be amicable, the employees of Omni will alsobe satisfied and the business will operate the way it performedbefore.
108 | P a g e

14. References: Case Analysis Omni Services Incorporated
Reily Brown, Analysis of Investments & Management of Portfolios
-
109 | P a g e