Transient dynamics during stress overshoots in binary colloidal glasses
10
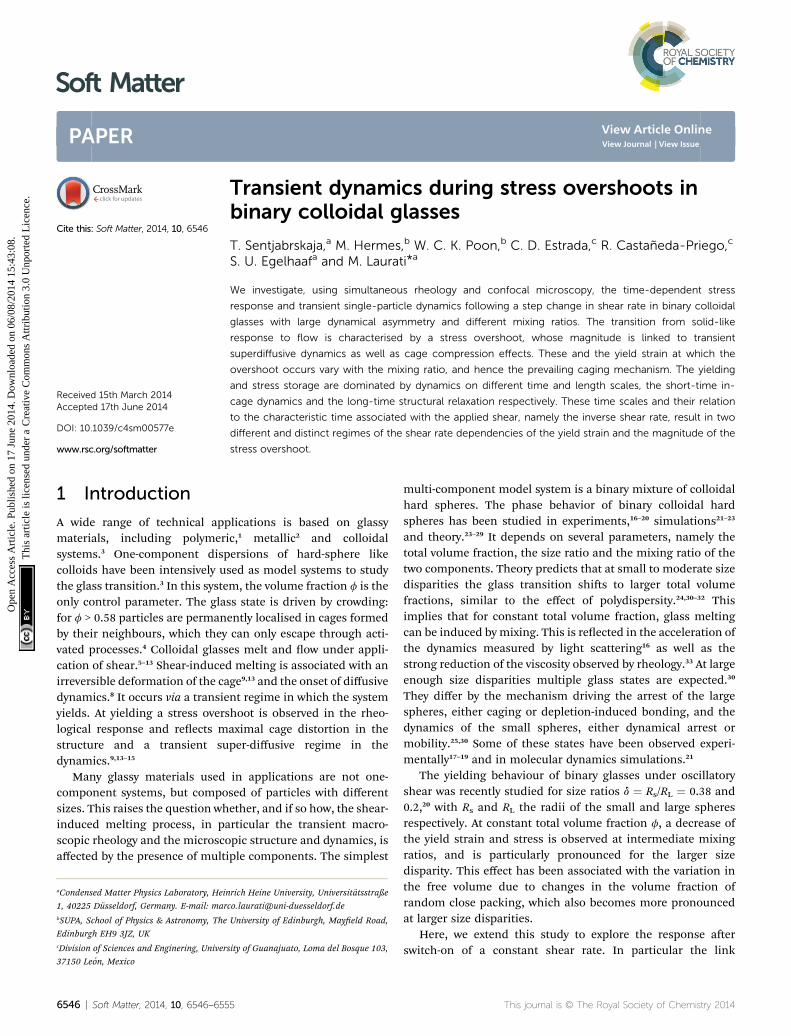
Transient dynamics during stress overshoots in binary colloidal glasses T. Sentjabrskaja, a M. Hermes, b W. C. K. Poon, b C. D. Estrada, c R. Casta ˜ neda-Priego, c S. U. Egelhaaf a and M. Laurati * a We investigate, using simultaneous rheology and confocal microscopy, the time-dependent stress response and transient single-particle dynamics following a step change in shear rate in binary colloidal glasses with large dynamical asymmetry and different mixing ratios. The transition from solid-like response to flow is characterised by a stress overshoot, whose magnitude is linked to transient superdiffusive dynamics as well as cage compression effects. These and the yield strain at which the overshoot occurs vary with the mixing ratio, and hence the prevailing caging mechanism. The yielding and stress storage are dominated by dynamics on different time and length scales, the short-time in- cage dynamics and the long-time structural relaxation respectively. These time scales and their relation to the characteristic time associated with the applied shear, namely the inverse shear rate, result in two different and distinct regimes of the shear rate dependencies of the yield strain and the magnitude of the stress overshoot. 1 Introduction A wide range of technical applications is based on glassy materials, including polymeric, 1 metallic 2 and colloidal systems. 3 One-component dispersions of hard-sphere like colloids have been intensively used as model systems to study the glass transition. 3 In this system, the volume fraction f is the only control parameter. The glass state is driven by crowding: for f > 0.58 particles are permanently localised in cages formed by their neighbours, which they can only escape through acti- vated processes. 4 Colloidal glasses melt and ow under appli- cation of shear. 5–13 Shear-induced melting is associated with an irreversible deformation of the cage 9,13 and the onset of diffusive dynamics. 8 It occurs via a transient regime in which the system yields. At yielding a stress overshoot is observed in the rheo- logical response and reects maximal cage distortion in the structure and a transient super-diffusive regime in the dynamics. 9,13–15 Many glassy materials used in applications are not one- component systems, but composed of particles with different sizes. This raises the question whether, and if so how, the shear- induced melting process, in particular the transient macro- scopic rheology and the microscopic structure and dynamics, is affected by the presence of multiple components. The simplest multi-component model system is a binary mixture of colloidal hard spheres. The phase behavior of binary colloidal hard spheres has been studied in experiments, 16–20 simulations 21–23 and theory. 23–29 It depends on several parameters, namely the total volume fraction, the size ratio and the mixing ratio of the two components. Theory predicts that at small to moderate size disparities the glass transition shis to larger total volume fractions, similar to the effect of polydispersity. 24,30–32 This implies that for constant total volume fraction, glass melting can be induced by mixing. This is reected in the acceleration of the dynamics measured by light scattering 16 as well as the strong reduction of the viscosity observed by rheology. 33 At large enough size disparities multiple glass states are expected. 30 They differ by the mechanism driving the arrest of the large spheres, either caging or depletion-induced bonding, and the dynamics of the small spheres, either dynamical arrest or mobility. 25,30 Some of these states have been observed experi- mentally 17–19 and in molecular dynamics simulations. 21 The yielding behaviour of binary glasses under oscillatory shear was recently studied for size ratios d ¼ R s /R L ¼ 0.38 and 0.2, 20 with R s and R L the radii of the small and large spheres respectively. At constant total volume fraction f, a decrease of the yield strain and stress is observed at intermediate mixing ratios, and is particularly pronounced for the larger size disparity. This effect has been associated with the variation in the free volume due to changes in the volume fraction of random close packing, which also becomes more pronounced at larger size disparities. Here, we extend this study to explore the response aer switch-on of a constant shear rate. In particular the link a Condensed Matter Physics Laboratory, Heinrich Heine University, Universit¨ atsstraße 1, 40225 D¨ usseldorf, Germany. E-mail: [email protected] b SUPA, School of Physics & Astronomy, The University of Edinburgh, Mayeld Road, Edinburgh EH9 3JZ, UK c Division of Sciences and Enginering, University of Guanajuato, Loma del Bosque 103, 37150 Le´ on, Mexico Cite this: Soft Matter, 2014, 10, 6546 Received 15th March 2014 Accepted 17th June 2014 DOI: 10.1039/c4sm00577e www.rsc.org/softmatter 6546 | Soft Matter, 2014, 10, 6546–6555 This journal is © The Royal Society of Chemistry 2014 Soft Matter PAPER Open Access Article. Published on 17 June 2014. Downloaded on 06/08/2014 15:43:08. This article is licensed under a Creative Commons Attribution 3.0 Unported Licence. View Article Online View Journal | View Issue
Transcript of Transient dynamics during stress overshoots in binary colloidal glasses
Soft Matter
PAPER
Ope
n A
cces
s A
rtic
le. P
ublis
hed
on 1
7 Ju
ne 2
014.
Dow
nloa
ded
on 0
6/08
/201
4 15
:43:
08.
Thi
s ar
ticle
is li
cens
ed u
nder
a C
reat
ive
Com
mon
s A
ttrib
utio
n 3.
0 U
npor
ted
Lic
ence
.
View Article OnlineView Journal | View Issue
Transient dynam
aCondensed Matter Physics Laboratory, Hein
1, 40225 Dusseldorf, Germany. E-mail: marbSUPA, School of Physics & Astronomy, The
Edinburgh EH9 3JZ, UKcDivision of Sciences and Enginering, Univer
37150 Leon, Mexico
Cite this: Soft Matter, 2014, 10, 6546
Received 15th March 2014Accepted 17th June 2014
DOI: 10.1039/c4sm00577e
www.rsc.org/softmatter
6546 | Soft Matter, 2014, 10, 6546–655
ics during stress overshoots inbinary colloidal glasses
T. Sentjabrskaja,a M. Hermes,b W. C. K. Poon,b C. D. Estrada,c R. Castaneda-Priego,c
S. U. Egelhaafa and M. Laurati*a
We investigate, using simultaneous rheology and confocal microscopy, the time-dependent stress
response and transient single-particle dynamics following a step change in shear rate in binary colloidal
glasses with large dynamical asymmetry and different mixing ratios. The transition from solid-like
response to flow is characterised by a stress overshoot, whose magnitude is linked to transient
superdiffusive dynamics as well as cage compression effects. These and the yield strain at which the
overshoot occurs vary with the mixing ratio, and hence the prevailing caging mechanism. The yielding
and stress storage are dominated by dynamics on different time and length scales, the short-time in-
cage dynamics and the long-time structural relaxation respectively. These time scales and their relation
to the characteristic time associated with the applied shear, namely the inverse shear rate, result in two
different and distinct regimes of the shear rate dependencies of the yield strain and the magnitude of the
stress overshoot.
1 Introduction
A wide range of technical applications is based on glassymaterials, including polymeric,1 metallic2 and colloidalsystems.3 One-component dispersions of hard-sphere likecolloids have been intensively used as model systems to studythe glass transition.3 In this system, the volume fraction f is theonly control parameter. The glass state is driven by crowding:for f > 0.58 particles are permanently localised in cages formedby their neighbours, which they can only escape through acti-vated processes.4 Colloidal glasses melt and ow under appli-cation of shear.5–13 Shear-induced melting is associated with anirreversible deformation of the cage9,13 and the onset of diffusivedynamics.8 It occurs via a transient regime in which the systemyields. At yielding a stress overshoot is observed in the rheo-logical response and reects maximal cage distortion in thestructure and a transient super-diffusive regime in thedynamics.9,13–15
Many glassy materials used in applications are not one-component systems, but composed of particles with differentsizes. This raises the question whether, and if so how, the shear-induced melting process, in particular the transient macro-scopic rheology and the microscopic structure and dynamics, isaffected by the presence of multiple components. The simplest
rich Heine University, Universitatsstraße
University of Edinburgh, Mayeld Road,
sity of Guanajuato, Loma del Bosque 103,
5
multi-component model system is a binary mixture of colloidalhard spheres. The phase behavior of binary colloidal hardspheres has been studied in experiments,16–20 simulations21–23
and theory.23–29 It depends on several parameters, namely thetotal volume fraction, the size ratio and the mixing ratio of thetwo components. Theory predicts that at small to moderate sizedisparities the glass transition shis to larger total volumefractions, similar to the effect of polydispersity.24,30–32 Thisimplies that for constant total volume fraction, glass meltingcan be induced by mixing. This is reected in the acceleration ofthe dynamics measured by light scattering16 as well as thestrong reduction of the viscosity observed by rheology.33 At largeenough size disparities multiple glass states are expected.30
They differ by the mechanism driving the arrest of the largespheres, either caging or depletion-induced bonding, and thedynamics of the small spheres, either dynamical arrest ormobility.25,30 Some of these states have been observed experi-mentally17–19 and in molecular dynamics simulations.21
The yielding behaviour of binary glasses under oscillatoryshear was recently studied for size ratios d ¼ Rs/RL ¼ 0.38 and0.2,20 with Rs and RL the radii of the small and large spheresrespectively. At constant total volume fraction f, a decrease ofthe yield strain and stress is observed at intermediate mixingratios, and is particularly pronounced for the larger sizedisparity. This effect has been associated with the variation inthe free volume due to changes in the volume fraction ofrandom close packing, which also becomes more pronouncedat larger size disparities.
Here, we extend this study to explore the response aerswitch-on of a constant shear rate. In particular the link
This journal is © The Royal Society of Chemistry 2014
Paper Soft Matter
Ope
n A
cces
s A
rtic
le. P
ublis
hed
on 1
7 Ju
ne 2
014.
Dow
nloa
ded
on 0
6/08
/201
4 15
:43:
08.
Thi
s ar
ticle
is li
cens
ed u
nder
a C
reat
ive
Com
mon
s A
ttrib
utio
n 3.
0 U
npor
ted
Lic
ence
.View Article Online
between the macroscopic non-linear rheology and the transientsingle-particle dynamics is investigated using confocal micros-copy. A stress overshoot and super-diffusive transient dynamicsis found to characterise yielding, similar to the behaviour ofone-component systems.9,13–15 However, in binary mixtures theyield strain and magnitude of the overshoot depend in acomplex and different way on the shear rate and show adependence on the composition of the mixture. The composi-tion determines the caging mechanism, localization length aswell as the short and long-time dynamics, including the degreeof super-diffusion.
The manuscript is structured as follows. Section 2 describesthe experimental systems and methods, namely simultaneousrheology and confocal microscopy, as well as the simulations. InSection 3 we rst present the equilibrium structure anddynamics of the large particles in the mixtures and a resume ofthe linear viscoelastic properties of the binary mixtures. Thenwe discuss the results of the non-linear rheology and thedynamics under shear before offering some conclusions inSection 4.
2 Methods2.1 Rheology
Rheological measurements are performed using an ARES G2strain controlled rheometer (TA instruments) with a cone-plategeometry (diameter 20 mm, cone angle 2�, truncation gap 0.054mm). A solvent trapminimizes solvent evaporation. Rheologicalmeasurements on colloidal glasses can be affected by loadingeffects, shear history and aging. Therefore, before each test arenjuvenation procedure is performed in order to obtain areproducible initial state. First, aer loading we perform adynamic strain sweep to estimate the yield strain gyield of thesystem. Oscillatory shear at strain amplitude g¼ 300%[ gyield
is applied to induce ow and maintained until the viscoelasticstorage, G0, and loss, G0 0, moduli reach a stationary state, typi-cally aer 200 s. Aerwards, oscillatory shear in the linearviscoelastic regime (0.05% < g < 0.1%, depending on sample) isapplied until G0 and G0 0 become stationary, typically for times200 s < t < 700 s, depending on the sample. The state charac-terised by the stationary values of G0 and G00 thus represents theinitial reproducible state. The absence of wall slip is veried bycomparison with measurements obtained with roughenedgeometries (data not shown).
2.2 Confocal microscopy under shear
Confocal microscopy measurements under shear are per-formed with a confocal rheoscope, which is a combination ofan MCR301 WSP rheometer (Anton Paar) and a fast-scanningVT-Eye confocal scanner (Visitech), mounted on a Nikon Ti-Uinverted microscope with a Nikon Plan Apo 60� objective (NA¼ 1.40). Details of the setup can be found in previous work.34
We use a cone-plate geometry with diameter 50 mm, coneangle 1� and truncation gap 0.10 mm. To minimise wall-slipthe cone is sandblasted, while the bottom plate, consisting of athin glass plate, is coated with PMMA particles of size
This journal is © The Royal Society of Chemistry 2014
0.885 mm and 0.174 mm.35 A solvent trap is used to reducesolvent evaporation. Images of the samples (512 � 512 pixels,corresponding to about 48 mm � 48 mm for samples with 0.3 <xs < 0.9, 51 mm � 51 mm for xs ¼ 0.0, and 53 mm � 53 mm forxs ¼ 0.1) are acquired at a depth of 30 mm from the bottomplate and at a distance of about 6 mm from the center. Timeseries of 2D images are taken at a rate of 31 or 67 frames persecond, depending on the sample. Particle coordinates andtrajectories are extracted from the pictures using previously-explained routines.36
2.3 Samples
We use suspensions of polymethylmethacrylate (PMMA)colloids, sterically stabilized with polyhydroxystearic acid (PHS)and dispersed in a solvent mixture of cis-decalin and cycloheptylbromide (CHB). The solvent mixture matches the density andalmost the refractive index of the particles. The charge that theparticles acquire in the CHB/decalin solvent is screened byadding 4 mM tetrabutylammoniumchloride (TBAC).37 Underthese conditions the interactions in the system are hard-sphere-like.38 For the most sensitive rheological measurements we useparticles with radii Rrheo
L ¼ 0.304 mm and Rrheos ¼ 0.063 mm, and
polydispersities of approximately 10% and 15%, respectively.The size ratio of the mixture is drheo ¼ 0.207. The high energydensity of these small particles leads to a strong rheologicalsignal. The sample set corresponding to these particles isreferred to as RH in the following. For measurements on theconfocal rheoscope, a mixture of PMMA particles with radiiRmicL ¼ 0.885 mm (6% polydispersity) and Rmic
s ¼ 0.174 mm (15%polydispersity) is prepared resulting in dmic ¼ 0.197. The largespheres with radius Rmic
L are uorescently labelled with nitro-benzoxadiazole (NBD) and can be observed with the confocalmicroscope using a solid state laser with wavelength l ¼ 488nm. This sample set is referred to as CO in the following. Theparticle radii and polydispersities are determined by static anddynamic light scattering with an uncertainty in the radius ofabout 2%.
The volume fraction of the sediment of the large spheres isdetermined by imaging the sample by confocal microscopy andusing the Voronoi construction to estimate the mean Voronoivolume per particle. The procedure of determining the volumefraction is described in detail in20 and leads to the estimatefRCPL z 0.68. A one-component sample with f ¼ 0.61 is
prepared by diluting the sediment. This sample is used as areference. The volume fractions of the samples containing thesmall particles are adjusted in order to obtain comparablelinear viscoelastic moduli in units of the energy density 3kBT/4pR3, where kB is the Boltzmann constant, T the temperatureand R the particles' radius, while multiplying the frequency bythe free-diffusion Brownian time s0 ¼ 6phR3/kBT, where h ¼2.2 mPa s is the solvent viscosity. In this way we obtain sampleswith comparable dynamics, according to the generalisedStokes–Einstein relation.39 Samples with constant total volumefraction f ¼ 0.61 and different compositions, namely fractionsof small particles xs ¼ fs/f, where fs is the volume fraction ofsmall particles, are prepared by mixing the stock solutions.
Soft Matter, 2014, 10, 6546–6555 | 6547
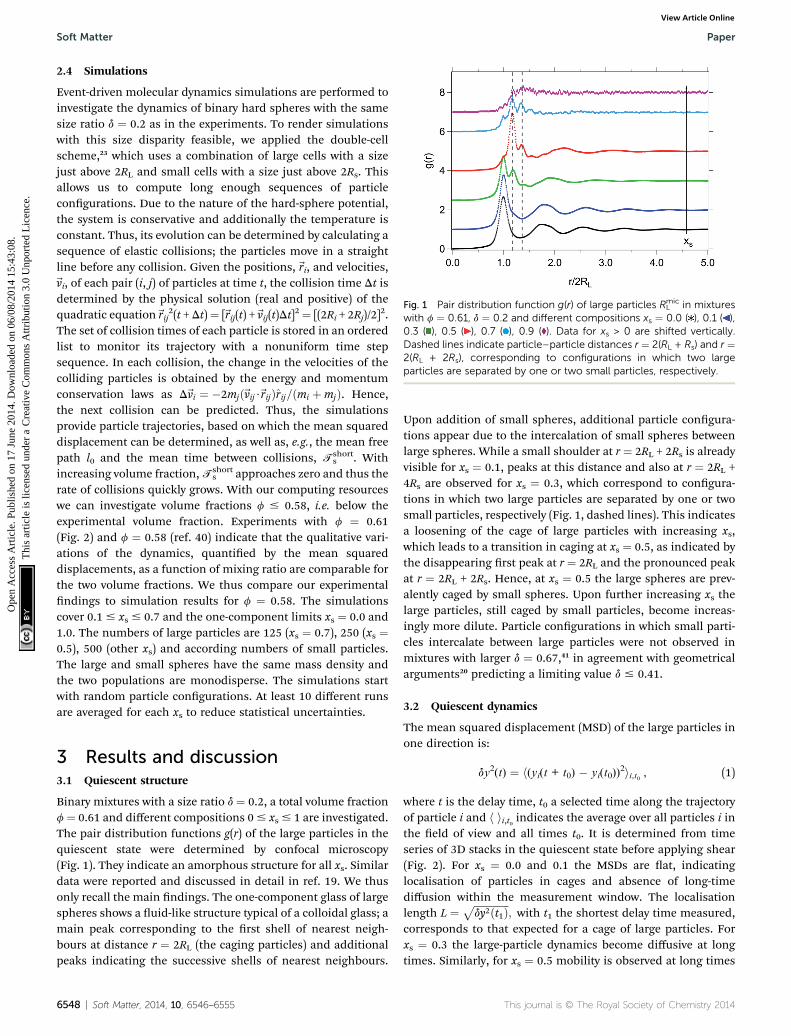
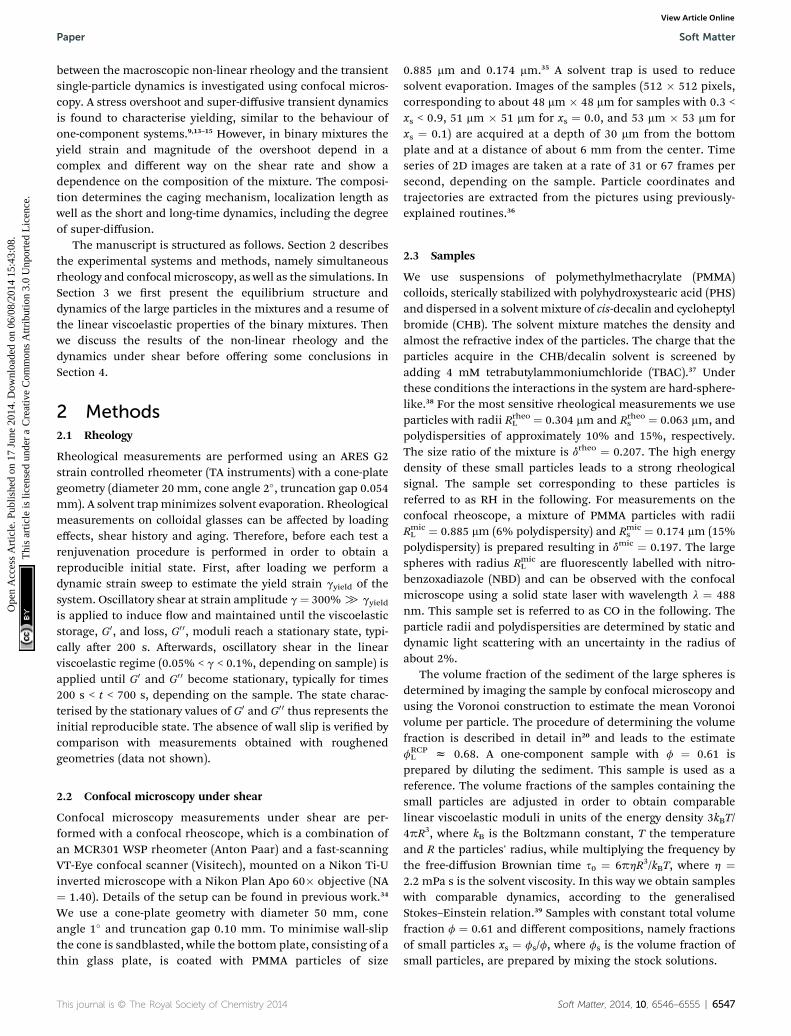
Fig. 1 Pair distribution function g(r) of large particles RmicL in mixtures
with f ¼ 0.61, d ¼ 0.2 and different compositions xs ¼ 0.0 ( ), 0.1 ( ),0.3 ( ), 0.5 ( ), 0.7 ( ), 0.9 ( ). Data for xs > 0 are shifted vertically.Dashed lines indicate particle–particle distances r ¼ 2(RL + Rs) and r ¼2(RL + 2Rs), corresponding to configurations in which two largeparticles are separated by one or two small particles, respectively.
Soft Matter Paper
Ope
n A
cces
s A
rtic
le. P
ublis
hed
on 1
7 Ju
ne 2
014.
Dow
nloa
ded
on 0
6/08
/201
4 15
:43:
08.
Thi
s ar
ticle
is li
cens
ed u
nder
a C
reat
ive
Com
mon
s A
ttrib
utio
n 3.
0 U
npor
ted
Lic
ence
.View Article Online
2.4 Simulations
Event-driven molecular dynamics simulations are performed toinvestigate the dynamics of binary hard spheres with the samesize ratio d ¼ 0.2 as in the experiments. To render simulationswith this size disparity feasible, we applied the double-cellscheme,23 which uses a combination of large cells with a sizejust above 2RL and small cells with a size just above 2Rs. Thisallows us to compute long enough sequences of particlecongurations. Due to the nature of the hard-sphere potential,the system is conservative and additionally the temperature isconstant. Thus, its evolution can be determined by calculating asequence of elastic collisions; the particles move in a straightline before any collision. Given the positions,~ri, and velocities,~vi, of each pair (i, j) of particles at time t, the collision time Dt isdetermined by the physical solution (real and positive) of thequadratic equation~rij
2(t + Dt)¼ [~rij(t) +~vij(t)Dt]2¼ [(2Ri + 2Rj)/2]
2.The set of collision times of each particle is stored in an orderedlist to monitor its trajectory with a nonuniform time stepsequence. In each collision, the change in the velocities of thecolliding particles is obtained by the energy and momentumconservation laws as D~vi ¼ �2mjð~vij$~rijÞrij=ðmi þmjÞ. Hence,the next collision can be predicted. Thus, the simulationsprovide particle trajectories, based on which the mean squareddisplacement can be determined, as well as, e.g., the mean freepath l0 and the mean time between collisions, T short
s . Withincreasing volume fraction, T short
s approaches zero and thus therate of collisions quickly grows. With our computing resourceswe can investigate volume fractions f # 0.58, i.e. below theexperimental volume fraction. Experiments with f ¼ 0.61(Fig. 2) and f ¼ 0.58 (ref. 40) indicate that the qualitative vari-ations of the dynamics, quantied by the mean squareddisplacements, as a function of mixing ratio are comparable forthe two volume fractions. We thus compare our experimentalndings to simulation results for f ¼ 0.58. The simulationscover 0.1# xs # 0.7 and the one-component limits xs ¼ 0.0 and1.0. The numbers of large particles are 125 (xs ¼ 0.7), 250 (xs ¼0.5), 500 (other xs) and according numbers of small particles.The large and small spheres have the same mass density andthe two populations are monodisperse. The simulations startwith random particle congurations. At least 10 different runsare averaged for each xs to reduce statistical uncertainties.
3 Results and discussion3.1 Quiescent structure
Binary mixtures with a size ratio d ¼ 0.2, a total volume fractionf¼ 0.61 and different compositions 0# xs # 1 are investigated.The pair distribution functions g(r) of the large particles in thequiescent state were determined by confocal microscopy(Fig. 1). They indicate an amorphous structure for all xs. Similardata were reported and discussed in detail in ref. 19. We thusonly recall the main ndings. The one-component glass of largespheres shows a uid-like structure typical of a colloidal glass; amain peak corresponding to the rst shell of nearest neigh-bours at distance r ¼ 2RL (the caging particles) and additionalpeaks indicating the successive shells of nearest neighbours.
6548 | Soft Matter, 2014, 10, 6546–6555
Upon addition of small spheres, additional particle congura-tions appear due to the intercalation of small spheres betweenlarge spheres. While a small shoulder at r ¼ 2RL + 2Rs is alreadyvisible for xs ¼ 0.1, peaks at this distance and also at r ¼ 2RL +4Rs are observed for xs ¼ 0.3, which correspond to congura-tions in which two large particles are separated by one or twosmall particles, respectively (Fig. 1, dashed lines). This indicatesa loosening of the cage of large particles with increasing xs,which leads to a transition in caging at xs ¼ 0.5, as indicated bythe disappearing rst peak at r ¼ 2RL and the pronounced peakat r ¼ 2RL + 2Rs. Hence, at xs ¼ 0.5 the large spheres are prev-alently caged by small spheres. Upon further increasing xs thelarge particles, still caged by small particles, become increas-ingly more dilute. Particle congurations in which small parti-cles intercalate between large particles were not observed inmixtures with larger d ¼ 0.67,41 in agreement with geometricalarguments20 predicting a limiting value d # 0.41.
3.2 Quiescent dynamics
The mean squared displacement (MSD) of the large particles inone direction is:
dy2(t) ¼ h(yi(t + t0) � yi(t0))2ii,t0 , (1)
where t is the delay time, t0 a selected time along the trajectoryof particle i and h ii,t0 indicates the average over all particles i inthe eld of view and all times t0. It is determined from timeseries of 3D stacks in the quiescent state before applying shear(Fig. 2). For xs ¼ 0.0 and 0.1 the MSDs are at, indicatinglocalisation of particles in cages and absence of long-timediffusion within the measurement window. The localisationlength L ¼ ffiffiffiffiffiffiffiffiffiffiffiffiffiffi
dy2ðt1Þp
; with t1 the shortest delay time measured,corresponds to that expected for a cage of large particles. Forxs ¼ 0.3 the large-particle dynamics become diffusive at longtimes. Similarly, for xs ¼ 0.5 mobility is observed at long times
This journal is © The Royal Society of Chemistry 2014
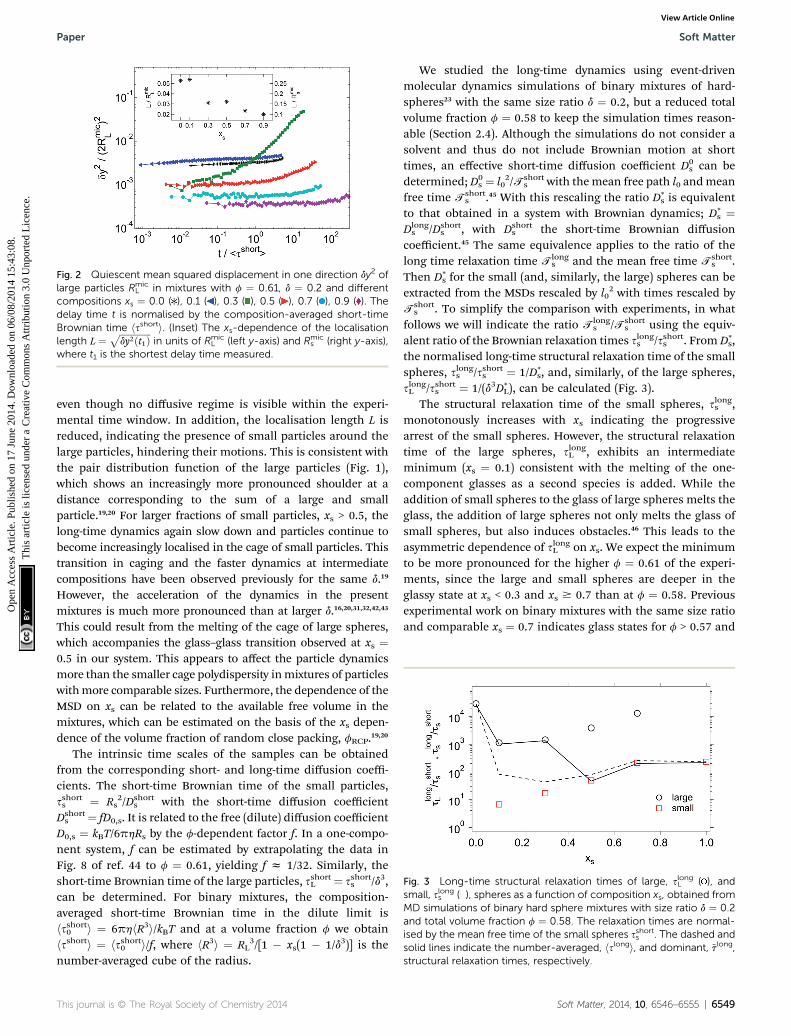
Fig. 2 Quiescent mean squared displacement in one direction dy2 oflarge particles Rmic
L in mixtures with f ¼ 0.61, d ¼ 0.2 and differentcompositions xs ¼ 0.0 ( ), 0.1 ( ), 0.3 ( ), 0.5 ( ), 0.7 ( ), 0.9 ( ). Thedelay time t is normalised by the composition-averaged short-timeBrownian time hsshorti. (Inset) The xs-dependence of the localisationlength L ¼ ffiffiffiffiffiffiffiffiffiffiffiffiffiffi
dy2ðt1Þp
in units of RmicL (left y-axis) and Rmic
s (right y-axis),where t1 is the shortest delay time measured.
Fig. 3 Long-time structural relaxation times of large, slongL ( ), andsmall, slongs ( ), spheres as a function of composition xs, obtained fromMD simulations of binary hard sphere mixtures with size ratio d ¼ 0.2and total volume fraction f ¼ 0.58. The relaxation times are normal-ised by the mean free time of the small spheres sshorts . The dashed andsolid lines indicate the number-averaged, hslongi, and dominant, ~tlong,structural relaxation times, respectively.
Paper Soft Matter
Ope
n A
cces
s A
rtic
le. P
ublis
hed
on 1
7 Ju
ne 2
014.
Dow
nloa
ded
on 0
6/08
/201
4 15
:43:
08.
Thi
s ar
ticle
is li
cens
ed u
nder
a C
reat
ive
Com
mon
s A
ttrib
utio
n 3.
0 U
npor
ted
Lic
ence
.View Article Online
even though no diffusive regime is visible within the experi-mental time window. In addition, the localisation length L isreduced, indicating the presence of small particles around thelarge particles, hindering their motions. This is consistent withthe pair distribution function of the large particles (Fig. 1),which shows an increasingly more pronounced shoulder at adistance corresponding to the sum of a large and smallparticle.19,20 For larger fractions of small particles, xs > 0.5, thelong-time dynamics again slow down and particles continue tobecome increasingly localised in the cage of small particles. Thistransition in caging and the faster dynamics at intermediatecompositions have been observed previously for the same d.19
However, the acceleration of the dynamics in the presentmixtures is much more pronounced than at larger d.16,20,31,32,42,43
This could result from the melting of the cage of large spheres,which accompanies the glass–glass transition observed at xs ¼0.5 in our system. This appears to affect the particle dynamicsmore than the smaller cage polydispersity inmixtures of particleswithmore comparable sizes. Furthermore, the dependence of theMSD on xs can be related to the available free volume in themixtures, which can be estimated on the basis of the xs depen-dence of the volume fraction of random close packing, fRCP.19,20
The intrinsic time scales of the samples can be obtainedfrom the corresponding short- and long-time diffusion coeffi-cients. The short-time Brownian time of the small particles,sshorts ¼ Rs
2/Dshorts with the short-time diffusion coefficient
Dshorts ¼ fD0,s. It is related to the free (dilute) diffusion coefficient
D0,s ¼ kBT/6phRs by the f-dependent factor f. In a one-compo-nent system, f can be estimated by extrapolating the data inFig. 8 of ref. 44 to f ¼ 0.61, yielding f z 1/32. Similarly, theshort-time Brownian time of the large particles, sshortL ¼ sshorts /d3,can be determined. For binary mixtures, the composition-averaged short-time Brownian time in the dilute limit ishsshort0 i ¼ 6phhR3i/kBT and at a volume fraction f we obtainhsshorti ¼ hsshort0 i/f, where hR3i ¼ RL
3/[1 � xs(1 � 1/d3)] is thenumber-averaged cube of the radius.
This journal is © The Royal Society of Chemistry 2014
We studied the long-time dynamics using event-drivenmolecular dynamics simulations of binary mixtures of hard-spheres23 with the same size ratio d ¼ 0.2, but a reduced totalvolume fraction f ¼ 0.58 to keep the simulation times reason-able (Section 2.4). Although the simulations do not consider asolvent and thus do not include Brownian motion at shorttimes, an effective short-time diffusion coefficient D0
s can bedetermined; D0
s ¼ l02/T short
s with themean free path l0 andmeanfree time T short
s .45 With this rescaling the ratio D*s is equivalent
to that obtained in a system with Brownian dynamics; D*s ¼
Dlongs /Dshort
s , with Dshorts the short-time Brownian diffusion
coefficient.45 The same equivalence applies to the ratio of thelong time relaxation time T long
s and the mean free time T shorts .
Then D*s for the small (and, similarly, the large) spheres can be
extracted from the MSDs rescaled by l02 with times rescaled by
T shorts . To simplify the comparison with experiments, in what
follows we will indicate the ratio T longs /T short
s using the equiv-alent ratio of the Brownian relaxation times slongs /sshorts . From D*
s,the normalised long-time structural relaxation time of the smallspheres, slongs /sshorts ¼ 1/D*
s, and, similarly, of the large spheres,slongL /sshorts ¼ 1/(d3D*
L), can be calculated (Fig. 3).The structural relaxation time of the small spheres, slongs ,
monotonously increases with xs indicating the progressivearrest of the small spheres. However, the structural relaxationtime of the large spheres, slongL , exhibits an intermediateminimum (xs ¼ 0.1) consistent with the melting of the one-component glasses as a second species is added. While theaddition of small spheres to the glass of large spheres melts theglass, the addition of large spheres not only melts the glass ofsmall spheres, but also induces obstacles.46 This leads to theasymmetric dependence of slongL on xs. We expect the minimumto be more pronounced for the higher f ¼ 0.61 of the experi-ments, since the large and small spheres are deeper in theglassy state at xs < 0.3 and xs $ 0.7 than at f ¼ 0.58. Previousexperimental work on binary mixtures with the same size ratioand comparable xs ¼ 0.7 indicates glass states for f > 0.57 and
Soft Matter, 2014, 10, 6546–6555 | 6549
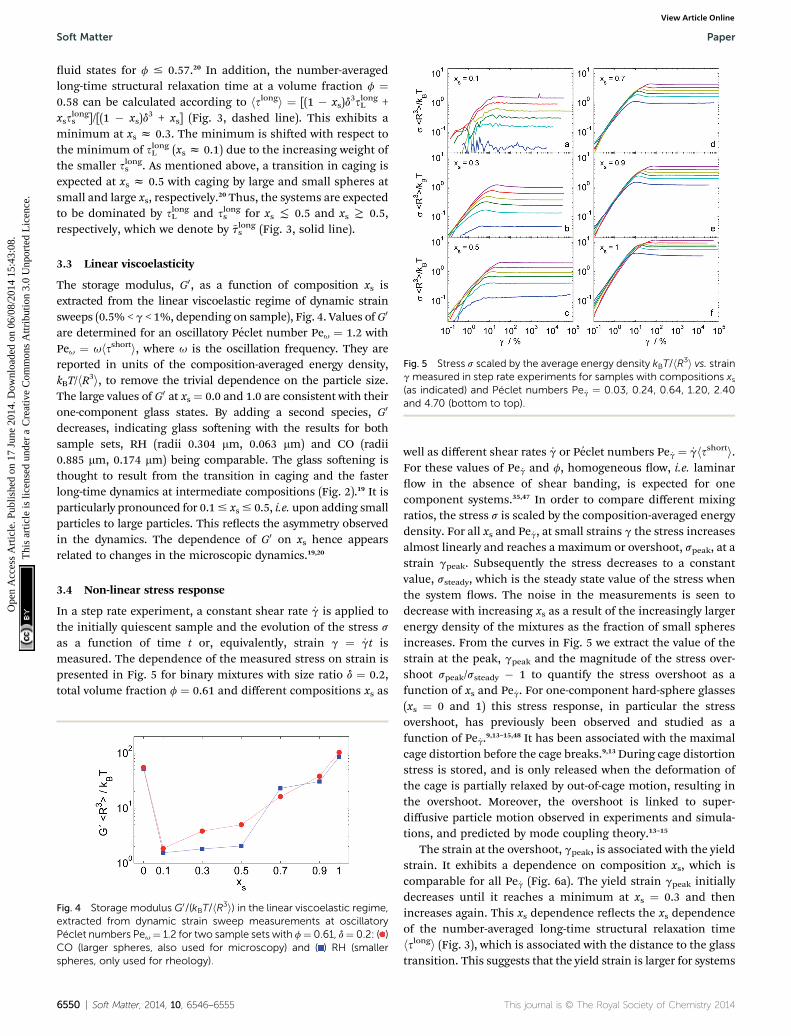
Fig. 5 Stress s scaled by the average energy density kBT/hR3i vs. straingmeasured in step rate experiments for samples with compositions xs(as indicated) and Peclet numbers Pe _g ¼ 0.03, 0.24, 0.64, 1.20, 2.40and 4.70 (bottom to top).
Soft Matter Paper
Ope
n A
cces
s A
rtic
le. P
ublis
hed
on 1
7 Ju
ne 2
014.
Dow
nloa
ded
on 0
6/08
/201
4 15
:43:
08.
Thi
s ar
ticle
is li
cens
ed u
nder
a C
reat
ive
Com
mon
s A
ttrib
utio
n 3.
0 U
npor
ted
Lic
ence
.View Article Online
uid states for f # 0.57.20 In addition, the number-averagedlong-time structural relaxation time at a volume fraction f ¼0.58 can be calculated according to hslongi ¼ [(1 � xs)d
3slongL +xss
longs ]/[(1 � xs)d
3 + xs] (Fig. 3, dashed line). This exhibits aminimum at xs z 0.3. The minimum is shied with respect tothe minimum of slongL (xs z 0.1) due to the increasing weight ofthe smaller slongs . As mentioned above, a transition in caging isexpected at xs z 0.5 with caging by large and small spheres atsmall and large xs, respectively.20 Thus, the systems are expectedto be dominated by slongL and slongs for xs ( 0.5 and xs T 0.5,respectively, which we denote by ~tlongs (Fig. 3, solid line).
3.3 Linear viscoelasticity
The storage modulus, G0, as a function of composition xs isextracted from the linear viscoelastic regime of dynamic strainsweeps (0.5% < g < 1%, depending on sample), Fig. 4. Values ofG0
are determined for an oscillatory Peclet number Peu ¼ 1.2 withPeu ¼ uhsshorti, where u is the oscillation frequency. They arereported in units of the composition-averaged energy density,kBT/hR3i, to remove the trivial dependence on the particle size.The large values of G0 at xs ¼ 0.0 and 1.0 are consistent with theirone-component glass states. By adding a second species, G0
decreases, indicating glass soening with the results for bothsample sets, RH (radii 0.304 mm, 0.063 mm) and CO (radii0.885 mm, 0.174 mm) being comparable. The glass soening isthought to result from the transition in caging and the fasterlong-time dynamics at intermediate compositions (Fig. 2).19 It isparticularly pronounced for 0.1# xs# 0.5, i.e. upon adding smallparticles to large particles. This reects the asymmetry observedin the dynamics. The dependence of G0 on xs hence appearsrelated to changes in the microscopic dynamics.19,20
3.4 Non-linear stress response
In a step rate experiment, a constant shear rate _g is applied tothe initially quiescent sample and the evolution of the stress sas a function of time t or, equivalently, strain g ¼ _gt ismeasured. The dependence of the measured stress on strain ispresented in Fig. 5 for binary mixtures with size ratio d ¼ 0.2,total volume fraction f ¼ 0.61 and different compositions xs as
Fig. 4 Storage modulus G0/(kBT/hR3i) in the linear viscoelastic regime,extracted from dynamic strain sweep measurements at oscillatoryPeclet numbers Peu¼ 1.2 for two sample sets with f¼ 0.61, d¼ 0.2: ( )CO (larger spheres, also used for microscopy) and ( ) RH (smallerspheres, only used for rheology).
6550 | Soft Matter, 2014, 10, 6546–6555
well as different shear rates _g or Peclet numbers Pe _g ¼ _ghsshorti.For these values of Pe _g and f, homogeneous ow, i.e. laminarow in the absence of shear banding, is expected for onecomponent systems.35,47 In order to compare different mixingratios, the stress s is scaled by the composition-averaged energydensity. For all xs and Pe _g, at small strains g the stress increasesalmost linearly and reaches a maximum or overshoot, speak, at astrain gpeak. Subsequently the stress decreases to a constantvalue, ssteady, which is the steady state value of the stress whenthe system ows. The noise in the measurements is seen todecrease with increasing xs as a result of the increasingly largerenergy density of the mixtures as the fraction of small spheresincreases. From the curves in Fig. 5 we extract the value of thestrain at the peak, gpeak and the magnitude of the stress over-shoot speak/ssteady � 1 to quantify the stress overshoot as afunction of xs and Pe _g. For one-component hard-sphere glasses(xs ¼ 0 and 1) this stress response, in particular the stressovershoot, has previously been observed and studied as afunction of Pe _g.9,13–15,48 It has been associated with the maximalcage distortion before the cage breaks.9,13During cage distortionstress is stored, and is only released when the deformation ofthe cage is partially relaxed by out-of-cage motion, resulting inthe overshoot. Moreover, the overshoot is linked to super-diffusive particle motion observed in experiments and simula-tions, and predicted by mode coupling theory.13–15
The strain at the overshoot, gpeak, is associated with the yieldstrain. It exhibits a dependence on composition xs, which iscomparable for all Pe _g (Fig. 6a). The yield strain gpeak initiallydecreases until it reaches a minimum at xs ¼ 0.3 and thenincreases again. This xs dependence reects the xs dependenceof the number-averaged long-time structural relaxation timehslongi (Fig. 3), which is associated with the distance to the glasstransition. This suggests that the yield strain is larger for systems
This journal is © The Royal Society of Chemistry 2014
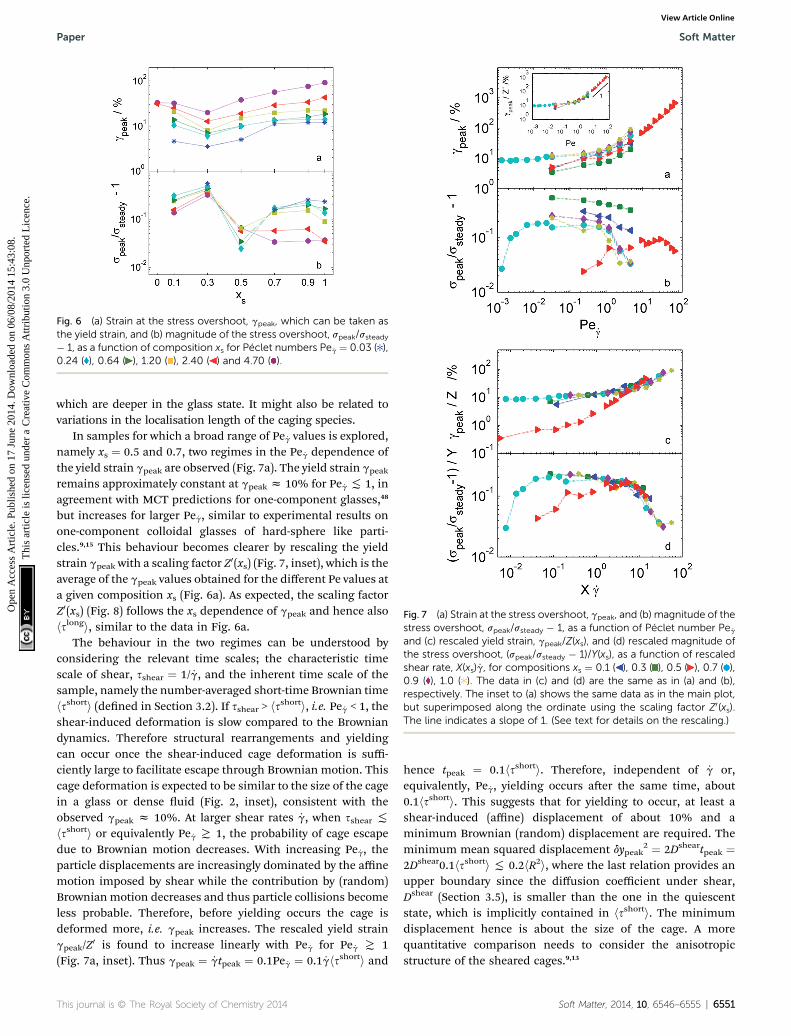
Fig. 6 (a) Strain at the stress overshoot, gpeak, which can be taken asthe yield strain, and (b) magnitude of the stress overshoot, speak/ssteady� 1, as a function of composition xs for Peclet numbers Pe _g ¼ 0.03 ( ),0.24 ( ), 0.64 ( ), 1.20 ( ), 2.40 ( ) and 4.70 ( ).
Fig. 7 (a) Strain at the stress overshoot, gpeak, and (b) magnitude of thestress overshoot, speak/ssteady � 1, as a function of Peclet number Pe _g
and (c) rescaled yield strain, gpeak/Z(xs), and (d) rescaled magnitude ofthe stress overshoot, (speak/ssteady � 1)/Y(xs), as a function of rescaledshear rate, X(xs) _g, for compositions xs ¼ 0.1 ( ), 0.3 ( ), 0.5 ( ), 0.7 ( ),0.9 ( ), 1.0 ( ). The data in (c) and (d) are the same as in (a) and (b),respectively. The inset to (a) shows the same data as in the main plot,but superimposed along the ordinate using the scaling factor Z0(xs).The line indicates a slope of 1. (See text for details on the rescaling.)
Paper Soft Matter
Ope
n A
cces
s A
rtic
le. P
ublis
hed
on 1
7 Ju
ne 2
014.
Dow
nloa
ded
on 0
6/08
/201
4 15
:43:
08.
Thi
s ar
ticle
is li
cens
ed u
nder
a C
reat
ive
Com
mon
s A
ttrib
utio
n 3.
0 U
npor
ted
Lic
ence
.View Article Online
which are deeper in the glass state. It might also be related tovariations in the localisation length of the caging species.
In samples for which a broad range of Pe _g values is explored,namely xs ¼ 0.5 and 0.7, two regimes in the Pe _g dependence ofthe yield strain gpeak are observed (Fig. 7a). The yield strain gpeak
remains approximately constant at gpeak z 10% for Pe _g ( 1, inagreement with MCT predictions for one-component glasses,48
but increases for larger Pe _g, similar to experimental results onone-component colloidal glasses of hard-sphere like parti-cles.9,15 This behaviour becomes clearer by rescaling the yieldstrain gpeak with a scaling factor Z0(xs) (Fig. 7, inset), which is theaverage of the gpeak values obtained for the different Pe values ata given composition xs (Fig. 6a). As expected, the scaling factorZ0(xs) (Fig. 8) follows the xs dependence of gpeak and hence alsohslongi, similar to the data in Fig. 6a.
The behaviour in the two regimes can be understood byconsidering the relevant time scales; the characteristic timescale of shear, sshear ¼ 1/ _g, and the inherent time scale of thesample, namely the number-averaged short-time Brownian timehsshorti (dened in Section 3.2). If sshear > hsshorti, i.e. Pe _g < 1, theshear-induced deformation is slow compared to the Browniandynamics. Therefore structural rearrangements and yieldingcan occur once the shear-induced cage deformation is suffi-ciently large to facilitate escape through Brownian motion. Thiscage deformation is expected to be similar to the size of the cagein a glass or dense uid (Fig. 2, inset), consistent with theobserved gpeak z 10%. At larger shear rates _g, when sshear (hsshorti or equivalently Pe _g T 1, the probability of cage escapedue to Brownian motion decreases. With increasing Pe _g, theparticle displacements are increasingly dominated by the affinemotion imposed by shear while the contribution by (random)Brownian motion decreases and thus particle collisions becomeless probable. Therefore, before yielding occurs the cage isdeformed more, i.e. gpeak increases. The rescaled yield straingpeak/Z0 is found to increase linearly with Pe _g for Pe _g T 1(Fig. 7a, inset). Thus gpeak ¼ _gtpeak ¼ 0.1Pe _g ¼ 0.1 _ghsshorti and
This journal is © The Royal Society of Chemistry 2014
hence tpeak ¼ 0.1hsshorti. Therefore, independent of _g or,equivalently, Pe _g, yielding occurs aer the same time, about0.1hsshorti. This suggests that for yielding to occur, at least ashear-induced (affine) displacement of about 10% and aminimum Brownian (random) displacement are required. Theminimum mean squared displacement dypeak
2 ¼ 2Dsheartpeak ¼2Dshear0.1hsshorti ( 0.2hR2i, where the last relation provides anupper boundary since the diffusion coefficient under shear,Dshear (Section 3.5), is smaller than the one in the quiescentstate, which is implicitly contained in hsshorti. The minimumdisplacement hence is about the size of the cage. A morequantitative comparison needs to consider the anisotropicstructure of the sheared cages.9,13
Soft Matter, 2014, 10, 6546–6555 | 6551
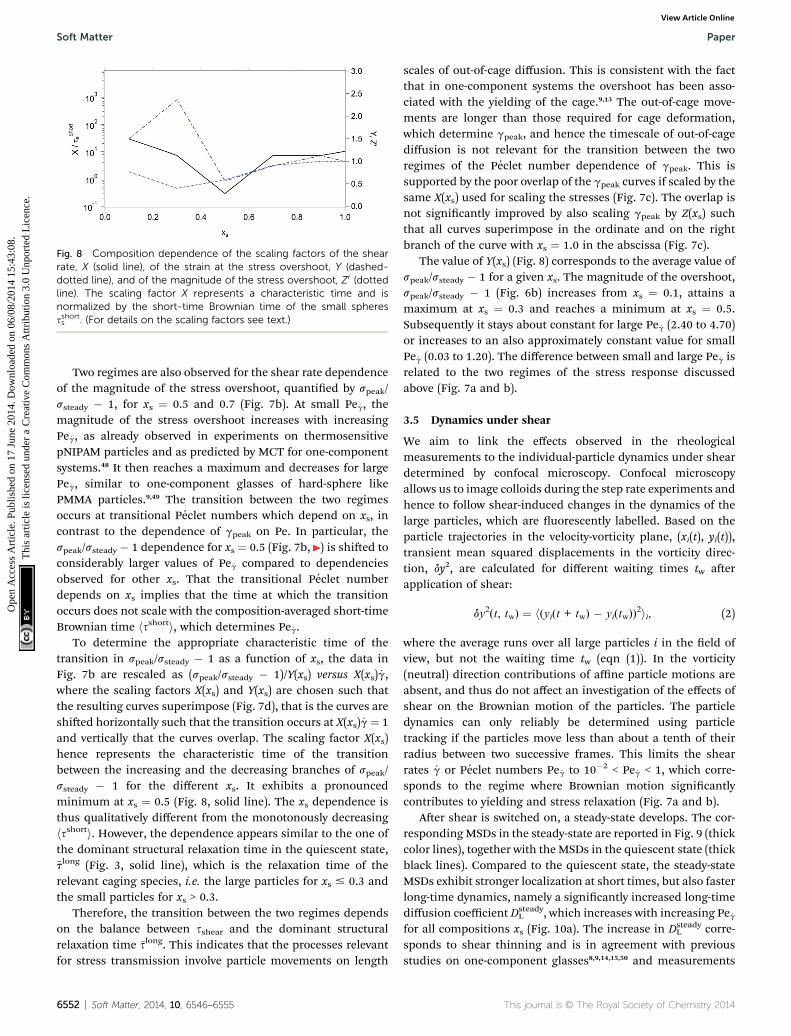
Fig. 8 Composition dependence of the scaling factors of the shearrate, X (solid line), of the strain at the stress overshoot, Y (dashed-dotted line), and of the magnitude of the stress overshoot, Z0 (dottedline). The scaling factor X represents a characteristic time and isnormalized by the short-time Brownian time of the small spheressshorts . (For details on the scaling factors see text.)
Soft Matter Paper
Ope
n A
cces
s A
rtic
le. P
ublis
hed
on 1
7 Ju
ne 2
014.
Dow
nloa
ded
on 0
6/08
/201
4 15
:43:
08.
Thi
s ar
ticle
is li
cens
ed u
nder
a C
reat
ive
Com
mon
s A
ttrib
utio
n 3.
0 U
npor
ted
Lic
ence
.View Article Online
Two regimes are also observed for the shear rate dependenceof the magnitude of the stress overshoot, quantied by speak/ssteady � 1, for xs ¼ 0.5 and 0.7 (Fig. 7b). At small Pe _g, themagnitude of the stress overshoot increases with increasingPe _g, as already observed in experiments on thermosensitivepNIPAM particles and as predicted by MCT for one-componentsystems.48 It then reaches a maximum and decreases for largePe _g, similar to one-component glasses of hard-sphere likePMMA particles.9,49 The transition between the two regimesoccurs at transitional Peclet numbers which depend on xs, incontrast to the dependence of gpeak on Pe. In particular, thespeak/ssteady � 1 dependence for xs ¼ 0.5 (Fig. 7b, ) is shied toconsiderably larger values of Pe _g compared to dependenciesobserved for other xs. That the transitional Peclet numberdepends on xs implies that the time at which the transitionoccurs does not scale with the composition-averaged short-timeBrownian time hsshorti, which determines Pe _g.
To determine the appropriate characteristic time of thetransition in speak/ssteady � 1 as a function of xs, the data inFig. 7b are rescaled as (speak/ssteady � 1)/Y(xs) versus X(xs) _g,where the scaling factors X(xs) and Y(xs) are chosen such thatthe resulting curves superimpose (Fig. 7d), that is the curves areshied horizontally such that the transition occurs at X(xs) _g¼ 1and vertically that the curves overlap. The scaling factor X(xs)hence represents the characteristic time of the transitionbetween the increasing and the decreasing branches of speak/ssteady � 1 for the different xs. It exhibits a pronouncedminimum at xs ¼ 0.5 (Fig. 8, solid line). The xs dependence isthus qualitatively different from the monotonously decreasinghsshorti. However, the dependence appears similar to the one ofthe dominant structural relaxation time in the quiescent state,~tlong (Fig. 3, solid line), which is the relaxation time of therelevant caging species, i.e. the large particles for xs # 0.3 andthe small particles for xs > 0.3.
Therefore, the transition between the two regimes dependson the balance between sshear and the dominant structuralrelaxation time �slong. This indicates that the processes relevantfor stress transmission involve particle movements on length
6552 | Soft Matter, 2014, 10, 6546–6555
scales of out-of-cage diffusion. This is consistent with the factthat in one-component systems the overshoot has been asso-ciated with the yielding of the cage.9,13 The out-of-cage move-ments are longer than those required for cage deformation,which determine gpeak, and hence the timescale of out-of-cagediffusion is not relevant for the transition between the tworegimes of the Peclet number dependence of gpeak. This issupported by the poor overlap of the gpeak curves if scaled by thesame X(xs) used for scaling the stresses (Fig. 7c). The overlap isnot signicantly improved by also scaling gpeak by Z(xs) suchthat all curves superimpose in the ordinate and on the rightbranch of the curve with xs ¼ 1.0 in the abscissa (Fig. 7c).
The value of Y(xs) (Fig. 8) corresponds to the average value ofspeak/ssteady � 1 for a given xs. The magnitude of the overshoot,speak/ssteady � 1 (Fig. 6b) increases from xs ¼ 0.1, attains amaximum at xs ¼ 0.3 and reaches a minimum at xs ¼ 0.5.Subsequently it stays about constant for large Pe _g (2.40 to 4.70)or increases to an also approximately constant value for smallPe _g (0.03 to 1.20). The difference between small and large Pe _g isrelated to the two regimes of the stress response discussedabove (Fig. 7a and b).
3.5 Dynamics under shear
We aim to link the effects observed in the rheologicalmeasurements to the individual-particle dynamics under sheardetermined by confocal microscopy. Confocal microscopyallows us to image colloids during the step rate experiments andhence to follow shear-induced changes in the dynamics of thelarge particles, which are uorescently labelled. Based on theparticle trajectories in the velocity-vorticity plane, (xi(t), yi(t)),transient mean squared displacements in the vorticity direc-tion, dy2, are calculated for different waiting times tw aerapplication of shear:
dy2(t, tw) ¼ h(yi(t + tw) � yi(tw))2ii, (2)
where the average runs over all large particles i in the eld ofview, but not the waiting time tw (eqn (1)). In the vorticity(neutral) direction contributions of affine particle motions areabsent, and thus do not affect an investigation of the effects ofshear on the Brownian motion of the particles. The particledynamics can only reliably be determined using particletracking if the particles move less than about a tenth of theirradius between two successive frames. This limits the shearrates _g or Peclet numbers Pe _g to 10�2 < Pe _g < 1, which corre-sponds to the regime where Brownian motion signicantlycontributes to yielding and stress relaxation (Fig. 7a and b).
Aer shear is switched on, a steady-state develops. The cor-respondingMSDs in the steady-state are reported in Fig. 9 (thickcolor lines), together with the MSDs in the quiescent state (thickblack lines). Compared to the quiescent state, the steady-stateMSDs exhibit stronger localization at short times, but also fasterlong-time dynamics, namely a signicantly increased long-timediffusion coefficient Dsteady
L , which increases with increasing Pe _g
for all compositions xs (Fig. 10a). The increase in DsteadyL corre-
sponds to shear thinning and is in agreement with previousstudies on one-component glasses8,9,14,15,50 and measurements
This journal is © The Royal Society of Chemistry 2014
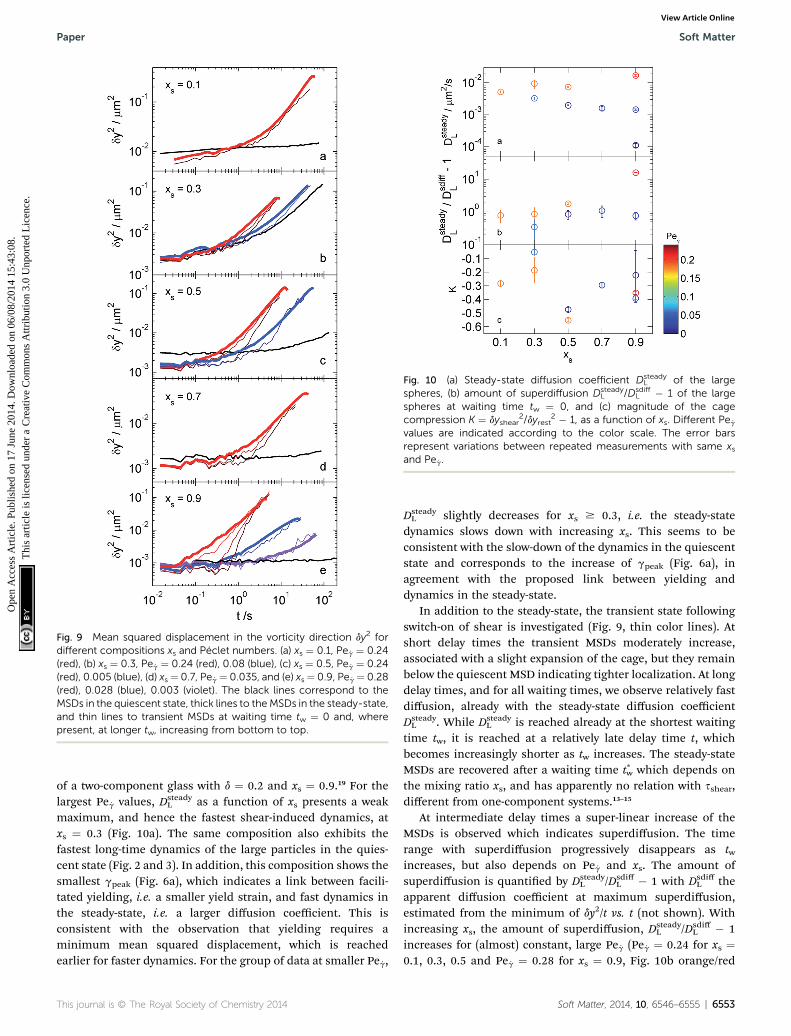
Fig. 9 Mean squared displacement in the vorticity direction dy2 fordifferent compositions xs and Peclet numbers. (a) xs ¼ 0.1, Pe _g ¼ 0.24(red), (b) xs ¼ 0.3, Pe _g ¼ 0.24 (red), 0.08 (blue), (c) xs ¼ 0.5, Pe _g ¼ 0.24(red), 0.005 (blue), (d) xs ¼ 0.7, Pe _g¼ 0.035, and (e) xs¼ 0.9, Pe _g¼ 0.28(red), 0.028 (blue), 0.003 (violet). The black lines correspond to theMSDs in the quiescent state, thick lines to theMSDs in the steady-state,and thin lines to transient MSDs at waiting time tw ¼ 0 and, wherepresent, at longer tw, increasing from bottom to top.
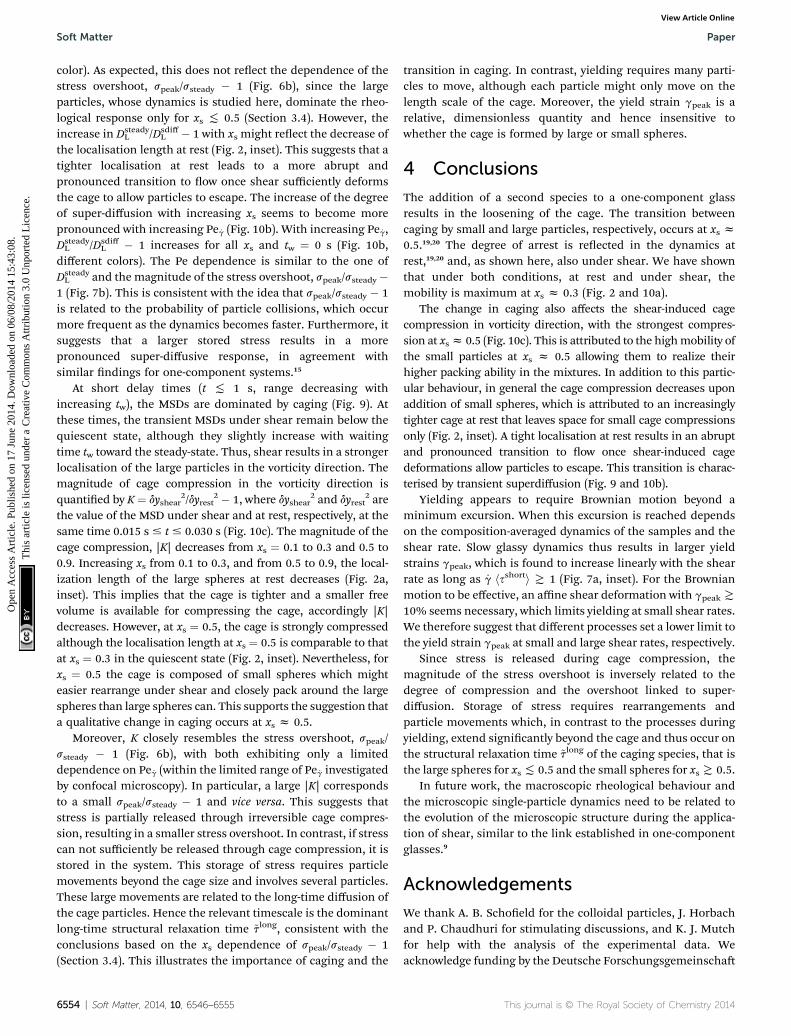
Fig. 10 (a) Steady-state diffusion coefficient DsteadyL of the large
spheres, (b) amount of superdiffusion DsteadyL /Dsdiff
L � 1 of the largespheres at waiting time tw ¼ 0, and (c) magnitude of the cagecompression K ¼ dyshear
2/dyrest2 � 1, as a function of xs. Different Pe _g
values are indicated according to the color scale. The error barsrepresent variations between repeated measurements with same xsand Pe _g.
Paper Soft Matter
Ope
n A
cces
s A
rtic
le. P
ublis
hed
on 1
7 Ju
ne 2
014.
Dow
nloa
ded
on 0
6/08
/201
4 15
:43:
08.
Thi
s ar
ticle
is li
cens
ed u
nder
a C
reat
ive
Com
mon
s A
ttrib
utio
n 3.
0 U
npor
ted
Lic
ence
.View Article Online
of a two-component glass with d ¼ 0.2 and xs ¼ 0.9.19 For thelargest Pe _g values, Dsteady
L as a function of xs presents a weakmaximum, and hence the fastest shear-induced dynamics, atxs ¼ 0.3 (Fig. 10a). The same composition also exhibits thefastest long-time dynamics of the large particles in the quies-cent state (Fig. 2 and 3). In addition, this composition shows thesmallest gpeak (Fig. 6a), which indicates a link between facili-tated yielding, i.e. a smaller yield strain, and fast dynamics inthe steady-state, i.e. a larger diffusion coefficient. This isconsistent with the observation that yielding requires aminimum mean squared displacement, which is reachedearlier for faster dynamics. For the group of data at smaller Pe _g,
This journal is © The Royal Society of Chemistry 2014
DsteadyL slightly decreases for xs $ 0.3, i.e. the steady-state
dynamics slows down with increasing xs. This seems to beconsistent with the slow-down of the dynamics in the quiescentstate and corresponds to the increase of gpeak (Fig. 6a), inagreement with the proposed link between yielding anddynamics in the steady-state.
In addition to the steady-state, the transient state followingswitch-on of shear is investigated (Fig. 9, thin color lines). Atshort delay times the transient MSDs moderately increase,associated with a slight expansion of the cage, but they remainbelow the quiescent MSD indicating tighter localization. At longdelay times, and for all waiting times, we observe relatively fastdiffusion, already with the steady-state diffusion coefficientDsteadyL . While Dsteady
L is reached already at the shortest waitingtime tw, it is reached at a relatively late delay time t, whichbecomes increasingly shorter as tw increases. The steady-stateMSDs are recovered aer a waiting time t*w which depends onthe mixing ratio xs, and has apparently no relation with sshear,different from one-component systems.13–15
At intermediate delay times a super-linear increase of theMSDs is observed which indicates superdiffusion. The timerange with superdiffusion progressively disappears as twincreases, but also depends on Pe _g and xs. The amount ofsuperdiffusion is quantied by Dsteady
L /DsdiffL � 1 with Dsdiff
L theapparent diffusion coefficient at maximum superdiffusion,estimated from the minimum of dy2/t vs. t (not shown). Withincreasing xs, the amount of superdiffusion, Dsteady
L /DsdiffL � 1
increases for (almost) constant, large Pe _g (Pe _g ¼ 0.24 for xs ¼0.1, 0.3, 0.5 and Pe _g ¼ 0.28 for xs ¼ 0.9, Fig. 10b orange/red
Soft Matter, 2014, 10, 6546–6555 | 6553
Soft Matter Paper
Ope
n A
cces
s A
rtic
le. P
ublis
hed
on 1
7 Ju
ne 2
014.
Dow
nloa
ded
on 0
6/08
/201
4 15
:43:
08.
Thi
s ar
ticle
is li
cens
ed u
nder
a C
reat
ive
Com
mon
s A
ttrib
utio
n 3.
0 U
npor
ted
Lic
ence
.View Article Online
color). As expected, this does not reect the dependence of thestress overshoot, speak/ssteady � 1 (Fig. 6b), since the largeparticles, whose dynamics is studied here, dominate the rheo-logical response only for xs ( 0.5 (Section 3.4). However, theincrease in Dsteady
L /DsdiffL � 1 with xs might reect the decrease of
the localisation length at rest (Fig. 2, inset). This suggests that atighter localisation at rest leads to a more abrupt andpronounced transition to ow once shear sufficiently deformsthe cage to allow particles to escape. The increase of the degreeof super-diffusion with increasing xs seems to become morepronounced with increasing Pe _g (Fig. 10b). With increasing Pe _g,DsteadyL /Dsdiff
L � 1 increases for all xs and tw ¼ 0 s (Fig. 10b,different colors). The Pe dependence is similar to the one ofDsteadyL and the magnitude of the stress overshoot, speak/ssteady�
1 (Fig. 7b). This is consistent with the idea that speak/ssteady � 1is related to the probability of particle collisions, which occurmore frequent as the dynamics becomes faster. Furthermore, itsuggests that a larger stored stress results in a morepronounced super-diffusive response, in agreement withsimilar ndings for one-component systems.15
At short delay times (t ( 1 s, range decreasing withincreasing tw), the MSDs are dominated by caging (Fig. 9). Atthese times, the transient MSDs under shear remain below thequiescent state, although they slightly increase with waitingtime tw toward the steady-state. Thus, shear results in a strongerlocalisation of the large particles in the vorticity direction. Themagnitude of cage compression in the vorticity direction isquantied by K¼ dyshear
2/dyrest2 � 1, where dyshear
2 and dyrest2 are
the value of the MSD under shear and at rest, respectively, at thesame time 0.015 s # t # 0.030 s (Fig. 10c). The magnitude of thecage compression, |K| decreases from xs ¼ 0.1 to 0.3 and 0.5 to0.9. Increasing xs from 0.1 to 0.3, and from 0.5 to 0.9, the local-ization length of the large spheres at rest decreases (Fig. 2a,inset). This implies that the cage is tighter and a smaller freevolume is available for compressing the cage, accordingly |K|decreases. However, at xs ¼ 0.5, the cage is strongly compressedalthough the localisation length at xs ¼ 0.5 is comparable to thatat xs ¼ 0.3 in the quiescent state (Fig. 2, inset). Nevertheless, forxs ¼ 0.5 the cage is composed of small spheres which mighteasier rearrange under shear and closely pack around the largespheres than large spheres can. This supports the suggestion thata qualitative change in caging occurs at xs z 0.5.
Moreover, K closely resembles the stress overshoot, speak/ssteady � 1 (Fig. 6b), with both exhibiting only a limiteddependence on Pe _g (within the limited range of Pe _g investigatedby confocal microscopy). In particular, a large |K| correspondsto a small speak/ssteady � 1 and vice versa. This suggests thatstress is partially released through irreversible cage compres-sion, resulting in a smaller stress overshoot. In contrast, if stresscan not sufficiently be released through cage compression, it isstored in the system. This storage of stress requires particlemovements beyond the cage size and involves several particles.These large movements are related to the long-time diffusion ofthe cage particles. Hence the relevant timescale is the dominantlong-time structural relaxation time ~tlong, consistent with theconclusions based on the xs dependence of speak/ssteady � 1(Section 3.4). This illustrates the importance of caging and the
6554 | Soft Matter, 2014, 10, 6546–6555
transition in caging. In contrast, yielding requires many parti-cles to move, although each particle might only move on thelength scale of the cage. Moreover, the yield strain gpeak is arelative, dimensionless quantity and hence insensitive towhether the cage is formed by large or small spheres.
4 Conclusions
The addition of a second species to a one-component glassresults in the loosening of the cage. The transition betweencaging by small and large particles, respectively, occurs at xs z0.5.19,20 The degree of arrest is reected in the dynamics atrest,19,20 and, as shown here, also under shear. We have shownthat under both conditions, at rest and under shear, themobility is maximum at xs z 0.3 (Fig. 2 and 10a).
The change in caging also affects the shear-induced cagecompression in vorticity direction, with the strongest compres-sion at xsz 0.5 (Fig. 10c). This is attributed to the highmobility ofthe small particles at xs z 0.5 allowing them to realize theirhigher packing ability in the mixtures. In addition to this partic-ular behaviour, in general the cage compression decreases uponaddition of small spheres, which is attributed to an increasinglytighter cage at rest that leaves space for small cage compressionsonly (Fig. 2, inset). A tight localisation at rest results in an abruptand pronounced transition to ow once shear-induced cagedeformations allow particles to escape. This transition is charac-terised by transient superdiffusion (Fig. 9 and 10b).
Yielding appears to require Brownian motion beyond aminimum excursion. When this excursion is reached dependson the composition-averaged dynamics of the samples and theshear rate. Slow glassy dynamics thus results in larger yieldstrains gpeak, which is found to increase linearly with the shearrate as long as _g hsshorti T 1 (Fig. 7a, inset). For the Brownianmotion to be effective, an affine shear deformation with gpeak T
10% seems necessary, which limits yielding at small shear rates.We therefore suggest that different processes set a lower limit tothe yield strain gpeak at small and large shear rates, respectively.
Since stress is released during cage compression, themagnitude of the stress overshoot is inversely related to thedegree of compression and the overshoot linked to super-diffusion. Storage of stress requires rearrangements andparticle movements which, in contrast to the processes duringyielding, extend signicantly beyond the cage and thus occur onthe structural relaxation time ~tlong of the caging species, that isthe large spheres for xs( 0.5 and the small spheres for xsT 0.5.
In future work, the macroscopic rheological behaviour andthe microscopic single-particle dynamics need to be related tothe evolution of the microscopic structure during the applica-tion of shear, similar to the link established in one-componentglasses.9
Acknowledgements
We thank A. B. Schoeld for the colloidal particles, J. Horbachand P. Chaudhuri for stimulating discussions, and K. J. Mutchfor help with the analysis of the experimental data. Weacknowledge funding by the Deutsche Forschungsgemeinscha
This journal is © The Royal Society of Chemistry 2014
Paper Soft Matter
Ope
n A
cces
s A
rtic
le. P
ublis
hed
on 1
7 Ju
ne 2
014.
Dow
nloa
ded
on 0
6/08
/201
4 15
:43:
08.
Thi
s ar
ticle
is li
cens
ed u
nder
a C
reat
ive
Com
mon
s A
ttrib
utio
n 3.
0 U
npor
ted
Lic
ence
.View Article Online
through the Research unit FOR1394 (Project P2), which alsosupported the visit of R.C.-P. to Dusseldorf, and EU fundingthrough the FP7-Infrastructures ESMI (CP&CSA-2010-262348).The Edinburgh work was supported by EPSRC grant EP/J007404/1.
References
1 E.-J. Donth, The Glass Transition: Relaxation Dynamics inLiquids and Disordered Materials, Springer-Verlag, BerlinHeidelberg, 2001.
2 C. Suryanarayana and A. Inoue, Bulk Metallic Glasses, CRCPress, Taylor and Francis Group, 2011.
3 P. N. Pusey and W. van Megen, Nature, 1986, 320, 340–342.4 G. Brambilla, D. El Masri, M. Pierno, L. Berthier, L. Cipelletti,G. Petekidis and A. B. Schoeld, Phys. Rev. Lett., 2009, 102,085703.
5 G. Petekidis, A. Moussaid and P. N. Pusey, Phys. Rev. E: Stat.,Nonlinear, So Matter Phys., 2002, 66, 051402.
6 K. N. Pham, G. Petekidis, D. Vlassopoulos, S. U. Egelhaaf,P. N. Pusey and W. C. K. Poon, Europhys. Lett., 2006, 75,624–630.
7 K. N. Pham, G. Petekidis, D. Vlassopoulos, S. U. Egelhaaf,W. C. K. Poon and P. N. Pusey, J. Rheol., 2008, 52, 649.
8 R. Besseling, E. R. Weeks, A. B. Schoeld and W. C. K. Poon,Phys. Rev. Lett., 2007, 99, 028301.
9 N. Koumakis, M. Laurati, S. U. Egelhaaf, J. F. Brady andG. Petekidis, Phys. Rev. Lett., 2012, 108, 098303.
10 C. Eisenmann, C. Kim, J. Mattsson and D. A. Weitz, Phys.Rev. Lett., 2010, 104, 035502.
11 M. Siebenburger, M. Fuchs and M. Ballauff, So Matter,2012, 8, 4014–4024.
12 C. Christopoulou, G. Petekidis, B. Erwin, M. Cloitre andD. Vlassopoulos, Philos. Trans. R. Soc., A, 2009, 367, 5051–5071.
13 K. J. Mutch, M. Laurati, C. P. Amann, M. Fuchs andS. U. Egelhaaf, Eur. Phys. J.: Spec. Top., 2013, 222, 2803.
14 J. Zausch, J. Horbach, M. Laurati, S. U. Egelhaaf,J. M. Brader, T. Voigtmann and M. Fuchs, J. Phys.:Condens. Matter, 2008, 20, 404210.
15 M. Laurati, K. J. Mutch, N. Koumakis, J. Zausch,C. P. Amann, A. B. Schoeld, G. Petekidis, J. F. Brady,J. Horbach, M. Fuchs and S. U. Egelhaaf, J. Phys.: Condens.Matter, 2012, 24, 431207.
16 S. Williams and W. van Megen, Phys. Rev. E: Stat., Nonlinear,So Matter Phys., 2001, 64, 041502.
17 A. Imhof and J. K. G. Dhont, Phys. Rev. E: Stat. Phys., Plasmas,Fluids, Relat. Interdiscip. Top., 1995, 52, 6344–6357.
18 A. Imhof and J. K. G. Dhont, Phys. Rev. Lett., 1995, 75, 1662–1665.
19 T. Sentjabrskaja, D. Guu, M. P. Lettinga, S. U. Egelhaaf andM. Laurati, AIP Conf. Proc., 2013, 1518, 206.
20 T. Sentjabrskaja, R. Babaliari, J. Hendricks, M. Laurati,G. Petekidis and S. U. Egelhaaf, So Matter, 2013, 9, 4524–4533.
21 A. Moreno and J. Colmenero, J. Chem. Phys., 2006, 125,164507.
This journal is © The Royal Society of Chemistry 2014
22 T. Voigtmann and J. Horbach, Phys. Rev. Lett., 2009, 103,205901.
23 E. Lopez-Sanchez, C. D. Estrada-Alvarez, G. Perez-Angel,J. M. Mendez-Alcaraz, P. Gonzalez-Mozuelos andR. Castaneda-Priego, J. Chem. Phys., 2013, 139, 104908.
24 W. Gotze and T. Voigtmann, Phys. Rev. E: Stat., Nonlinear,So Matter Phys., 2003, 67, 021502.
25 T. Voigtmann, Europhys. Lett., 2011, 96, 36006.26 J. Bosse and J. S. Thakur, Phys. Rev. Lett., 1987, 59, 998–1001.27 J. Bosse and Y. Kaneko, Phys. Rev. Lett., 1995, 74, 4023–4026.28 L. Sjogren, Phys. Rev. A, 1986, 33, 1254–1260.29 R. Seyboldt, D. Hajnal, F. Weysser and M. Fuchs, SoMatter,
2012, 8, 4132–4140.30 R. Juarez-Maldonado and M. Medina-Noyola, Phys. Rev. E:
Stat., Nonlinear, So Matter Phys., 2008, 77, 051503.31 S. R. Williams, I. K. Snook and W. van Megen, Phys. Rev. E:
Stat., Nonlinear, So Matter Phys., 2001, 64, 021506.32 G. Foffi, W. Gotze, F. Sciortino, P. Tartaglia and
T. Voigtmann, Phys. Rev. Lett., 2003, 91, 085701.33 B. E. Rodriguez, E. W. Kaler andM. S. Wolfe, Langmuir, 1992,
8, 2382.34 R. Besseling, L. Isa, E. R. Weeks and W. C. K. Poon, Adv.
Colloid Interface Sci., 2009, 146, 1–17.35 P. Ballesta, G. Petekidis, L. Isa, W. C. K. Poon and
R. Besseling, J. Rheol., 2012, 56, 1005–1037.36 J. C. Crocker and D. G. Grier, J. Colloid Interface Sci., 1996,
179, 298–310.37 A. Yethiraj and A. van Blaaderen, Nature, 2003, 421, 513–517.38 C. P. Royall, W. C. K. Poon and E. R. Weeks, SoMatter, 2013,
9, 17–27.39 T. G. Mason and D. A. Weitz, Phys. Rev. Lett., 1995, 75, 2770–
2773.40 T. Sentjabrskaja, M. Laurati, S. U. Egelhaaf and
Th. Voigtmann, in preparation.41 R. Higler, J. Appoel and J. Sprakel, So Matter, 2013, 9,
5372.42 T. Hamanaka and A. Onuki, Phys. Rev. E: Stat., Nonlinear, So
Matter Phys., 2007, 75, 041503.43 P. Yunker, Z. Zhang and A. G. Yodh, Phys. Rev. Lett., 2010,
104, 015701.44 W. van Megen, T. C. Mortensen, S. R. Williams and J. Muller,
Phys. Rev. E: Stat. Phys., Plasmas, Fluids, Relat. Interdiscip.Top., 1998, 58, 6073–6085.
45 L. Lopez-Flores, P. Mendoza-Mendez, L. E. Sanchez-Dıaz,L. L. Yeomans-Reyna, A. Vizcarra-Rendon, G. Perez-Angel,M. Chavez-Paez and M. Medina-Noyola, Europhys. Lett.,2012, 99, 46001.
46 T. O. E. Skinner, S. K. Schnyder, D. G. A. L. Aarts, J. Horbachand R. P. A. Dullens, Phys. Rev. Lett., 2013, 111, 128301.
47 R. Besseling, L. Isa, P. Ballesta, G. Petekidis, M. E. Cates andW. C. K. Poon, Phys. Rev. Lett., 2010, 105, 268301.
48 C. P. Amann, M. Siebenburger, M. Kruger, F. Weysser,M. Ballauff and M. Fuchs, J. Rheol., 2013, 57, 149–175.
49 N. Koumakis, M. Laurati, K. J. Mutch, J. F. Brady,S. U. Egelhaaf and G. Petekidis, in preparation.
50 N. Koumakis, J. F. Brady and G. Petekidis, Phys. Rev. Lett.,2013, 110, 178301.
Soft Matter, 2014, 10, 6546–6555 | 6555