Trans-eQTLs Reveal That Independent Genetic Variants Associated with a Complex Phenotype Converge on...
14
Trans-eQTLs Reveal That Independent Genetic Variants Associated with a Complex Phenotype Converge on Intermediate Genes, with a Major Role for the HLA Rudolf S. N. Fehrmann 1 , Ritsert C. Jansen 2. , Jan H. Veldink 3. , Harm-Jan Westra 1. , Danny Arends 2 , Marc Jan Bonder 1 , Jingyuan Fu 1 , Patrick Deelen 1 , Harry J. M. Groen 4 , Asia Smolonska 1 , Rinse K. Weersma 1,5 , Robert M. W. Hofstra 1 , Wim A. Buurman 6 , Sander Rensen 6 , Marcel G. M. Wolfs 7 , Mathieu Platteel 1 , Alexandra Zhernakova 8 , Clara C. Elbers 9 , Eleanora M. Festen 1 , Gosia Trynka 1 , Marten H. Hofker 7 , Christiaan G. J. Saris 3 , Roel A. Ophoff 3,10,11 , Leonard H. van den Berg 3 , David A. van Heel 12 , Cisca Wijmenga 1 , Gerard J. te Meerman 1" , Lude Franke 1,12 * " 1 Department of Genetics, University Medical Center Groningen and University of Groningen, Groningen, The Netherlands, 2 Groningen Bioinformatics Centre, Groningen Biomolecular Sciences and Biotechnology Institute, University of Groningen, Haren, The Netherlands, 3 Department of Neurology, Rudolf Magnus Institute of Neuroscience, University Medical Centre Utrecht, Utrecht, The Netherlands, 4 Department of Pulmonology, University Medical Center Groningen and University of Groningen, Groningen, The Netherlands, 5 Department of Gastroenterology and Hepatology, University Medical Centre Groningen and University of Groningen, Groningen, The Netherlands, 6 NUTRIM School for Nutrition, Toxicology, and Metabolism, Department of General Surgery, Maastricht University Medical Center, Maastricht, The Netherlands, 7 Department of Pathology and Medical Biology, Medical Biology Section, Molecular Genetics, University Medical Center Groningen and University of Groningen, Groningen, The Netherlands, 8 Department of Rheumatology, Leiden University Medical Center, Leiden, The Netherlands, 9 Departments of Genetics, University of Pennsylvania, Philadelphia, Pennsylvania, United States of America, 10 Department of Medical Genetics, University Medical Center Utrecht, Utrecht, The Netherlands, 11 Center for Neurobehavioral Genetics, University of California Los Angeles, Los Angeles, California, United States of America, 12 Blizard Institute of Cell and Molecular Science, Barts and The London School of Medicine and Dentistry, Queen Mary University of London, London, United Kingdom Abstract For many complex traits, genetic variants have been found associated. However, it is still mostly unclear through which downstream mechanism these variants cause these phenotypes. Knowledge of these intermediate steps is crucial to understand pathogenesis, while also providing leads for potential pharmacological intervention. Here we relied upon natural human genetic variation to identify effects of these variants on trans-gene expression (expression quantitative trait locus mapping, eQTL) in whole peripheral blood from 1,469 unrelated individuals. We looked at 1,167 published trait- or disease-associated SNPs and observed trans-eQTL effects on 113 different genes, of which we replicated 46 in monocytes of 1,490 different individuals and 18 in a smaller dataset that comprised subcutaneous adipose, visceral adipose, liver tissue, and muscle tissue. HLA single-nucleotide polymorphisms (SNPs) were 10-fold enriched for trans-eQTLs: 48% of the trans- acting SNPs map within the HLA, including ulcerative colitis susceptibility variants that affect plausible candidate genes AOAH and TRBV18 in trans. We identified 18 pairs of unlinked SNPs associated with the same phenotype and affecting expression of the same trans-gene (21 times more than expected, P,10 216 ). This was particularly pronounced for mean platelet volume (MPV): Two independent SNPs significantly affect the well-known blood coagulation genes GP9 and F13A1 but also C19orf33, SAMD14, VCL, and GNG11. Several of these SNPs have a substantially higher effect on the downstream trans-genes than on the eventual phenotypes, supporting the concept that the effects of these SNPs on expression seems to be much less multifactorial. Therefore, these trans-eQTLs could well represent some of the intermediate genes that connect genetic variants with their eventual complex phenotypic outcomes. Citation: Fehrmann RSN, Jansen RC, Veldink JH, Westra H-J, Arends D, et al. (2011) Trans-eQTLs Reveal That Independent Genetic Variants Associated with a Complex Phenotype Converge on Intermediate Genes, with a Major Role for the HLA. PLoS Genet 7(8): e1002197. doi:10.1371/journal.pgen.1002197 Editor: Vivian G. Cheung, University of Pennsylvania, United States of America Received February 24, 2011; Accepted June 6, 2011; Published August 4, 2011 Copyright: ß 2011 Fehrmann et al. This is an open-access article distributed under the terms of the Creative Commons Attribution License, which permits unrestricted use, distribution, and reproduction in any medium, provided the original author and source are credited. Funding: The genotype and gene expression generation was funded in part by COPACETIC (EU grant 201379), the Wellcome Trust (084743 to DAvH), and the Coeliac Disease Consortium, an Innovative Cluster approved by the Netherlands Genomics Initiative, as well as partially funded by the Dutch Government (BSIK03009 to CW) and by the Netherlands Organization for Scientific Research (NWO, VICI grant 918.66.620 to CW). LHvdB acknowledges funding from the Prinses Beatrix Fonds, the Adessium Foundation, and the Amyotrophic Lateral Sclerosis Association. JHV was supported by the Brain Foundation of the Netherlands. MHH received a grant from the Dutch Diabetes Foundation (2006.00.007) and IOP genomics (IGE05012A). LF received a Horizon Breakthrough grant from the Netherlands Genomics Initiative (93519031) and a VENI grant from NWO (ZonMW grant 916.10.135). GT received a Ter Meulen Fund grant from the Royal Netherlands Academy of Arts and Sciences (KNAW). JF received a VENI grant from NWO (ALW 863.09.007). RKW is supported by a clinical fellowship grant (90.700.281) from the Netherlands Organization for Scientific Research (NWO). We acknowledge funding from the NIH: NS058980 (to RAO). The research leading to these results has received funding from the European Community’s Health Seventh Framework Programme (FP7/2007–2013) under grant agreement 259867. This study was financed in part by the SIA-raakPRO subsidy for project BioCOMP. The funders had no role in study design, data collection and analysis, decision to publish, or preparation of the manuscript. Competing Interests: The authors have declared that no competing interests exist. * E-mail: [email protected] . These authors contributed equally to this work. " These authors also contributed equally to this work. PLoS Genetics | www.plosgenetics.org 1 August 2011 | Volume 7 | Issue 8 | e1002197
Transcript of Trans-eQTLs Reveal That Independent Genetic Variants Associated with a Complex Phenotype Converge on...

Trans-eQTLs Reveal That Independent Genetic VariantsAssociated with a Complex Phenotype Converge onIntermediate Genes, with a Major Role for the HLARudolf S. N. Fehrmann1, Ritsert C. Jansen2., Jan H. Veldink3., Harm-Jan Westra1., Danny Arends2, Marc
Jan Bonder1, Jingyuan Fu1, Patrick Deelen1, Harry J. M. Groen4, Asia Smolonska1, Rinse K. Weersma1,5,
Robert M. W. Hofstra1, Wim A. Buurman6, Sander Rensen6, Marcel G. M. Wolfs7, Mathieu Platteel1,
Alexandra Zhernakova8, Clara C. Elbers9, Eleanora M. Festen1, Gosia Trynka1, Marten H. Hofker7,
Christiaan G. J. Saris3, Roel A. Ophoff3,10,11, Leonard H. van den Berg3, David A. van Heel12, Cisca
Wijmenga1, Gerard J. te Meerman1", Lude Franke1,12*"
1 Department of Genetics, University Medical Center Groningen and University of Groningen, Groningen, The Netherlands, 2 Groningen Bioinformatics Centre, Groningen
Biomolecular Sciences and Biotechnology Institute, University of Groningen, Haren, The Netherlands, 3 Department of Neurology, Rudolf Magnus Institute of
Neuroscience, University Medical Centre Utrecht, Utrecht, The Netherlands, 4 Department of Pulmonology, University Medical Center Groningen and University of
Groningen, Groningen, The Netherlands, 5 Department of Gastroenterology and Hepatology, University Medical Centre Groningen and University of Groningen,
Groningen, The Netherlands, 6 NUTRIM School for Nutrition, Toxicology, and Metabolism, Department of General Surgery, Maastricht University Medical Center,
Maastricht, The Netherlands, 7 Department of Pathology and Medical Biology, Medical Biology Section, Molecular Genetics, University Medical Center Groningen and
University of Groningen, Groningen, The Netherlands, 8 Department of Rheumatology, Leiden University Medical Center, Leiden, The Netherlands, 9 Departments of
Genetics, University of Pennsylvania, Philadelphia, Pennsylvania, United States of America, 10 Department of Medical Genetics, University Medical Center Utrecht, Utrecht,
The Netherlands, 11 Center for Neurobehavioral Genetics, University of California Los Angeles, Los Angeles, California, United States of America, 12 Blizard Institute of Cell
and Molecular Science, Barts and The London School of Medicine and Dentistry, Queen Mary University of London, London, United Kingdom
Abstract
For many complex traits, genetic variants have been found associated. However, it is still mostly unclear through whichdownstream mechanism these variants cause these phenotypes. Knowledge of these intermediate steps is crucial tounderstand pathogenesis, while also providing leads for potential pharmacological intervention. Here we relied uponnatural human genetic variation to identify effects of these variants on trans-gene expression (expression quantitative traitlocus mapping, eQTL) in whole peripheral blood from 1,469 unrelated individuals. We looked at 1,167 published trait- ordisease-associated SNPs and observed trans-eQTL effects on 113 different genes, of which we replicated 46 in monocytes of1,490 different individuals and 18 in a smaller dataset that comprised subcutaneous adipose, visceral adipose, liver tissue,and muscle tissue. HLA single-nucleotide polymorphisms (SNPs) were 10-fold enriched for trans-eQTLs: 48% of the trans-acting SNPs map within the HLA, including ulcerative colitis susceptibility variants that affect plausible candidate genesAOAH and TRBV18 in trans. We identified 18 pairs of unlinked SNPs associated with the same phenotype and affectingexpression of the same trans-gene (21 times more than expected, P,10216). This was particularly pronounced for meanplatelet volume (MPV): Two independent SNPs significantly affect the well-known blood coagulation genes GP9 and F13A1but also C19orf33, SAMD14, VCL, and GNG11. Several of these SNPs have a substantially higher effect on the downstreamtrans-genes than on the eventual phenotypes, supporting the concept that the effects of these SNPs on expression seemsto be much less multifactorial. Therefore, these trans-eQTLs could well represent some of the intermediate genes thatconnect genetic variants with their eventual complex phenotypic outcomes.
Citation: Fehrmann RSN, Jansen RC, Veldink JH, Westra H-J, Arends D, et al. (2011) Trans-eQTLs Reveal That Independent Genetic Variants Associated with aComplex Phenotype Converge on Intermediate Genes, with a Major Role for the HLA. PLoS Genet 7(8): e1002197. doi:10.1371/journal.pgen.1002197
Editor: Vivian G. Cheung, University of Pennsylvania, United States of America
Received February 24, 2011; Accepted June 6, 2011; Published August 4, 2011
Copyright: � 2011 Fehrmann et al. This is an open-access article distributed under the terms of the Creative Commons Attribution License, which permitsunrestricted use, distribution, and reproduction in any medium, provided the original author and source are credited.
Funding: The genotype and gene expression generation was funded in part by COPACETIC (EU grant 201379), the Wellcome Trust (084743 to DAvH), and theCoeliac Disease Consortium, an Innovative Cluster approved by the Netherlands Genomics Initiative, as well as partially funded by the Dutch Government(BSIK03009 to CW) and by the Netherlands Organization for Scientific Research (NWO, VICI grant 918.66.620 to CW). LHvdB acknowledges funding from thePrinses Beatrix Fonds, the Adessium Foundation, and the Amyotrophic Lateral Sclerosis Association. JHV was supported by the Brain Foundation of theNetherlands. MHH received a grant from the Dutch Diabetes Foundation (2006.00.007) and IOP genomics (IGE05012A). LF received a Horizon Breakthrough grantfrom the Netherlands Genomics Initiative (93519031) and a VENI grant from NWO (ZonMW grant 916.10.135). GT received a Ter Meulen Fund grant from the RoyalNetherlands Academy of Arts and Sciences (KNAW). JF received a VENI grant from NWO (ALW 863.09.007). RKW is supported by a clinical fellowship grant(90.700.281) from the Netherlands Organization for Scientific Research (NWO). We acknowledge funding from the NIH: NS058980 (to RAO). The research leading tothese results has received funding from the European Community’s Health Seventh Framework Programme (FP7/2007–2013) under grant agreement 259867. Thisstudy was financed in part by the SIA-raakPRO subsidy for project BioCOMP. The funders had no role in study design, data collection and analysis, decision topublish, or preparation of the manuscript.
Competing Interests: The authors have declared that no competing interests exist.
* E-mail: [email protected]
. These authors contributed equally to this work.
" These authors also contributed equally to this work.
PLoS Genetics | www.plosgenetics.org 1 August 2011 | Volume 7 | Issue 8 | e1002197

Introduction
For many complex traits and diseases, numerous associated
single nucleotide polymorphisms (SNPs) have been identified
through genome-wide association studies (GWAS)through ge-
nome-wide association studies (GWAS) [1]. For many of these
identified variants it is still unclear through which mechanism the
association between the SNP and the trait or disease phenotype is
mediated. A complicating factor is that disease-associated variants
might not be the real causal variants, but are in linkage
disequilibrium (LD) with the true disease-causing variant, making
it difficult to accurately implicate the correct gene for a locus in
disease pathogenesis.
Within the major histocompatibility locus (MHC) on 6p, many
SNPs have been found to be associated with complex diseases such
as celiac disease, inflammatory bowel disease, psoriasis, rheuma-
toid arthritis, diabetes mellitus, schizophrenia, lung cancer and
follicular lymphoma [2–10]. An analysis of the Catalog of
Published Genome-Wide Association Studies [1] revealed that
out of 1,167 unique SNP associations with a reported p,561027,
82 (7.0%) were located within the MHC (Fisher’s Exact p,10230).
Except for celiac disease [11] it remains largely unclear how MHC
variants increase disease susceptibility.
However, common variants have been identified that might
exert their function by altering gene expression rather than by
altering protein structure [2,12–16] (expression quantitative trait
loci, eQTLs). Comprehensive eQTL mapping (or genetical
genomics [17]) will enable us to assess for every known disease-
associated variant if it significantly affects gene expression. Genetic
variants that affect expression of genes that map in their vicinity
(cis-eQTLs) can potentially pinpoint the true disease gene from an
associated locus. In addition, genetic variants may also affect
expression of genes that reside further away or are on different
chromosomes (trans-eQTLs) [18]. These trans-eQTLs are especially
interesting, since they allow us to identify downstream affected
disease genes which were not implicated by GWAS studies at all,
and thereby potentially having the ability to reveal previously
unknown (disease) pathways.
In this study we performed a comprehensive eQTL mapping to
explore the downstream effects of SNPs on gene expression by
analyzing genotype and expression data of 1,469 unrelated samples.
In addition to a genome-wide analysis, we also performed a focused
analysis for disease- and trait-associated SNPs and SNPs located
within the HLA. We replicated the identified trans-eQTLs in a
collection of monocyte expression data and expression data from
subcutaneous adipose, visceral adipose, muscle and liver tissue.
Principal component analysis (PCA) enabled us to remove non-
genetic expression variation [19,20], resulting in increased power to
detect eQTLs. A stringent probe-mapping strategy was used to filter
out false-positive cis-eQTLs due to primer-polymorphisms and
false-positive trans-eQTLs due to cross-hybridizations. Furthermore,
a permutation strategy was utilized that corrects for multiple-testing,
while preventing potential confounders such as non-even distribu-
tion of SNP markers and expression probe markers across the
genome, differences in minor allele frequency (MAF) between
SNPs, linkage disequilibrium (LD) within the genotype data, and
correlation between expression probes.
Results
Cis- and trans-eQTL mappingResults of a genome-wide eQTL analysis on 289,044 common
SNPs, present on the Illumina HumanHap300 platform in
peripheral blood expression data of 1,469 unrelated individuals,
are provided in Table 1, Table S1, Table S2, Figure S1
(controlling false discovery rate (FDR) at 0.05 using a permutation
strategy).
As reported before [21–25] we also observed that eQTLs are
strongly enriched for trait-associated SNPs (SNPs associated with a
trait or disease phenotype, as reported in the Catalog of Published
Genome-Wide Association Studies [1]): We therefore concentrat-
ed on these variants and imputed (Impute v2.0 [26]) additional
genotype data permitting us to test 1,167 trait-associated SNPs.
After removing false-positive eQTLs due to primer-polymor-
phisms and cross-hybridization 472 (40.4%) of these SNPs were
cis-eQTLs, affecting the expression of 679 different transcripts,
representing 538 genes (Figure 1, Table 1, Figure S2, Table S3).
67 (5.7%) SNPs were trans-acting on 130 different transcripts,
representing 113 genes (Table S4). Results on the number of
detected eQTLs per complex trait are provided in Table S5 and
Figure S3. For nearly all significant trans-eQTLs the effect was
present in each of the seven individual patient and controls
cohorts, making up the total dataset (Table S6).
These trans-eQTLs provide valuable insight on previously
unknown functional downstream consequences trait-associated
SNPs have, e.g. rs2395185 is the strongest susceptibility variant for
ulcerative colitis [27] (UC) but also the strongest SNP, trans-acting
on Acyloxyacyl hydrolase (AOAH, p = 1.0610236), an enzyme that
modulates host inflammatory responses to gram-negative bacterial
invasion. It is known that deficiencies in response mechanisms
against bacterial products like lipopolysaccharide, present on
gram-negative bacterial cell walls, play an important role in UC
disease pathogenesis [28]. Within the peripheral blood we
observed that AOAH is significantly co-expressed with colony
stimulating factor 1 receptor (CSF1R, r = 0.21) and major
histocompatibility complex class II DR alpha (HLA-DRA,
r = 0.19). Hyperstimulation of CSF1R has been implicated in UC
[29], while HLA-DRA is one of the positional UC candidate genes
mapping in very close proximity to rs2395185. Another UC HLA
variant, rs9268877, was trans-acting on T cell receptor beta
variable 18 (TRBV18), part of the TCRß locus at 7q34. It is known
that TCRß mutant mice develop chronic colitis [30].
For type 1 diabetes (T1D) we observed that 59% (30/51) of the
known and tested T1D associated SNPs are cis-acting (on in total
Author Summary
Many genetic variants have been found associated withdiseases. However, for many of these genetic variants, itremains unclear how they exert their effect on theeventual phenotype. We investigated genetic variants thatare known to be associated with diseases and complexphenotypes and assessed whether these variants were alsoassociated with gene expression levels in a set of 1,469unrelated whole blood samples. For several diseases, suchas type 1 diabetes and ulcerative colitis, we observed thatgenetic variants affect the expression of genes, notimplicated before. For complex traits, such as meanplatelet volume and mean corpuscular volume, weobserved that independent genetic variants on differentchromosomes influence the expression of exactly the samegenes. For mean platelet volume, these genes includewell-known blood coagulation genes but also genes withstill unknown functions. These results indicate that, bysystematically correlating genetic variation with geneexpression levels, it is possible to identify downstreamgenes, which provide important avenues for furtherresearch.
Convergence of Trans-eQTLS on Intermediate Genes
PLoS Genetics | www.plosgenetics.org 2 August 2011 | Volume 7 | Issue 8 | e1002197

Table 1. Detected eQTLs in 1,469 genetical genomics samples for 289,044 common SNPs and for 1,167 trait-associated SNPs.
eQTL analysis on 289,044 common SNPs
cis-eQTLs (FDR,0.05) trans-eQTLs (FDR,0.05)
Spearman’s correlation threshold P,1.7361023 P,3.661029
Number of tests performed 2,329,207 13,292,122,142
Number of unique eQTL probes 10,872 244
Number of unique eQTL genes 7,589 202
Number of unique eQTL SNPs 48,717 (16.9% of all tested SNPs) 467 (0.2% of all tested SNPs)
Number of unique MHC eQTL SNPs 1,586 (3.3% of cis-eQTL SNPs) 155 (33.2% of trans-eQTL SNPs)
eQTL analysis on 1,167 trait-associated SNPs
cis-eQTLs (FDR,0.05) trans-eQTLs (FDR,0.05) trans-eQTLs (FDR,0.50)
Spearman’s correlation threshold P,3.761023 P,2.061027 P,1.0261025
Number of tests performed 15,371 53,629,458 53,629,458
Number of unique eQTL probes 679 130 726
Number of unique eQTL genes 538 113 576
Number of unique eQTL SNPs 472 (40.4% of all tested SNPs) 67 (5.7% of all tested SNPs) 462 (39.6% of all tested SNPs)
Number of unique MHC eQTL SNPs 65 (13.8% of cis-eQTL SNPs) 32 (47.8% of trans-eQTL SNPs) 52 (11.3% of trans-eQTL SNPs)
For 289,044 SNPs, present on the commonly used Illumina HumanHap300 platform, the false discovery rate (FDR) was controlled at 0.05 for both cis- and trans-eQTLs.For the analysis of 1,167 successfully imputed SNPs that have been found associated with a quantitative trait or disease the FDR was controlled at 0.05 for the cis- andtrans-eQTLs. We also performed a trans-eQTL analysis for these SNPs while controlling the FDR at 0.50 to generate more hypotheses. The number of unique genes wasdetermined using Ensembl 52 (NCBI 36.3 release).doi:10.1371/journal.pgen.1002197.t001
Figure 1. Disease and trait-associated SNPs are enriched for both cis- and trans-eQTLs. 17% of SNPs, present on common SNP platforms,affect gene expression levels in cis or trans (at FDR of 0.05). This is substantially different from 1,167 SNPs that have been found associated with traitsor disease: 40.4% affect gene expression in cis, while 5.7% of these SNPs affect gene expression in trans. These eQTL SNPs significantly more oftenthan expected map within the HLA (13.8% of cis-eQTLs, 47.8% of trans-eQTLs, extreme value distribution p,1.1610216).doi:10.1371/journal.pgen.1002197.g001
Convergence of Trans-eQTLS on Intermediate Genes
PLoS Genetics | www.plosgenetics.org 3 August 2011 | Volume 7 | Issue 8 | e1002197

53 unique genes) and 17% (9/50) are trans-acting on 22 unique
genes (Figure 2). Potentially interesting trans-genes include CCL2,
CFB, CLN1, KRT19, OSR1 and RARRES1, all strongly co-
expressed with each other. CCL2 and CFB are known immune
response genes and have been implicated in T1D before [31–33].
For breast cancer we observed that rs3803662 [34] is trans-
acting on origin recognition complex subunit 6 (ORC6L). This
gene is involved in DNA replication and has been frequently used
as part of prognostic profiles for predicting the clinical outcome in
breast cancer [35,36].
We observed a marked enrichment for SNPs within the MHC
among the cis- and trans-acting trait-associated SNPs: 65 of 472 cis-
acting SNPs (13.8%, EVD p,1.0610216) and 32 of 67 trans-acting
SNPs (47.8%, EVD p,1.0610216) mapped within the MHC
(Figure 3). These SNPs all map to the Human Leukocyte Antigens
(HLA) locus: SNPs within the HLA class I region, class II region
and class III region affect 20, 7 and 2 different genes in trans,
respectively.
Biological convergence of cis- and trans-eQTLsWhile multiple associated SNPs have been identified for many
complex diseases, it often remains unclear what the intermediate
effects of these variants are that eventually lead to disease. It is
reasonable to assume that for a particular phenotype the different
associated SNPs eventually converge on the same downstream
gene(s) or pathways.
We identified 7 unique pairs of unlinked SNPs that are associated
with the same phenotype and that also affect the same downstream
genes in trans or cis (at FDR 0.05, Table 2, Figure 4a). In order to
establish whether this was more than expected by chance, we
repeated this analysis, while using a set of trans-eQTLs, equal in size
to the set of real trans-eQTLs, most significant after having
permuted the expression sample identifiers. We performed this
procedure 100 times, and observed on average only 0.15 unique
pairs of unlinked SNPs (range [0, 3], Figure 4b) that showed this
convergence, which indicates that the observed number of
converging pairs of SNPs is 47 times more than expected (EVD
p,1.0610216) and implies a false-positive rate of 0.021.
Due to this highly significant enrichment of converging pairs of
SNPs and its low estimated false-positive rate, we also ran an
analysis where we had relaxed the FDR for trans-eQTLs to 0.50
(Table S7). Here we observed 18 pairs of SNPs that converge on
the same genes, whereas in the 100 subsequent permutations we
observed this only on average for 0.84 SNP-pairs (range [0, 5], 21
times more expected by chance, EVD p,1.0610216, implying a
false-positive rate of 0.047, Table 2, Figure 4b).
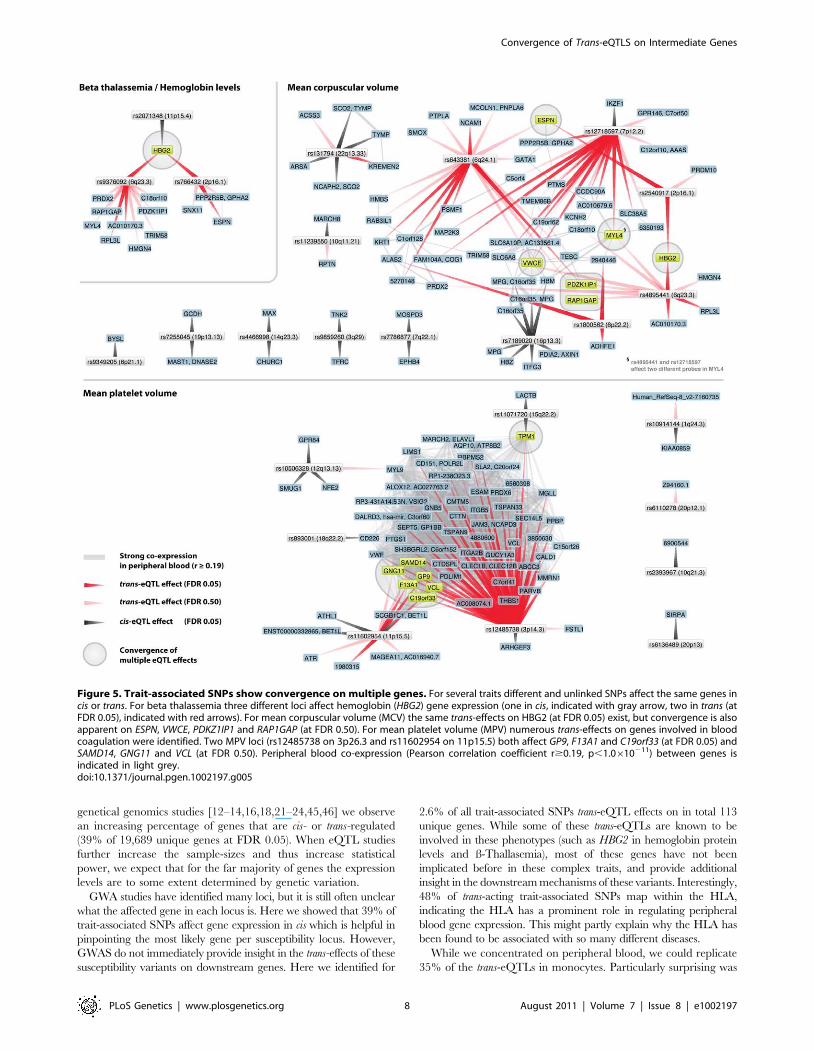
Many of these converging downstream genes make biological
sense: three independent loci, associated with hemoglobin protein
Figure 2. Type 1 diabetes associated SNPs both affect genes in cis and in trans.doi:10.1371/journal.pgen.1002197.g002
Convergence of Trans-eQTLS on Intermediate Genes
PLoS Genetics | www.plosgenetics.org 4 August 2011 | Volume 7 | Issue 8 | e1002197

levels [37–39] and ß thalassemia susceptibility [40], significantly
affect hemoglobin gamma G (HBG2) gene expression levels (each
with p,1.0610223, Figure 5). For mean corpuscular volume
(MCV, Figure 5) two unlinked MCV SNPs [41,42] also affect
HBG2 gene expression levels in trans (at FDR 0.05), while other
pairs of MCV SNPs converge on ESPN, VWCE, PDZK1IP1 and
RAP1GAP.
For mean platelet volume (MPV) we observed that MPV SNPs
rs12485738 on 3p26 and rs11602954 on 11p15 affect several
transcripts in trans. These two SNPs converge on GP9, F13A1,
C19orf33, SAMD14, VCL and GNG11. As GP9 and F13A1 are
known blood coagulation genes, C19orf33 is a potential candidate
gene, involved in coagulation as well. This is substantiated by
strong co-expression between GP9 and C19orf33 within peripheral
blood (Pearson r = 0.45, p = 7.0610263) and the fact these SNPs
independently also affect various other blood coagulation genes in
trans (including CD151, GP1BB, ITGA2B, MMRN1, THBS1 and
VWF, Figure 4). Many of these are specific to megakaryocytes that
are platelet precursor cells [43]. As expected, the Gene Ontology
term ‘blood coagulation’ is strongly overrepresented among all
these trans-genes, Fisher’s exact p = 1.0610210.
We observed that MPV SNP rs12485738 (on 3p14.3) was also
trans-acting on tropomyosin 1 (TPM1, 15q22.2, p = 9.761029), a
gene that is also regulated in cis by another MPV variant
(rs11071720 on 15q22.2, p = 1.4610213). We observed this for two
different expression probes that map within different locations of
the TPM1 transcript (probes 5560246 and 610519), and note
strong co-expression for these two TPM1 probes with 46 MPV
trans-genes (Pearson r.0.19, p,1.0610211, including five known
coagulation genes). Although several genes reside within the
rs11071720 MPV locus, these observations strongly implicate
TPM1 as the causal MPV gene.
For both MPV and MCV we observed that the identified cis-
and trans-eQTL probes generally were more strongly co-expressed
in peripheral blood than expected (Figure S4, MPV co-expression
Wilcoxon P,102200, MCV co-expression Wilcoxon P = 0.009),
Figure 3. Human leukocyte antigen (HLA) trait-associated SNPs affect gene expression levels in trans. Thirty-two trait-associated SNPsthat map within the HLA are trans-acting on other genes. Trans-genes are indicated in red. Peripheral blood co-expression (Pearson correlationcoefficient r$0.19, p,10211) between genes is indicated in light grey. Several trans-genes are co-expressed with HLA genes.doi:10.1371/journal.pgen.1002197.g003
Convergence of Trans-eQTLS on Intermediate Genes
PLoS Genetics | www.plosgenetics.org 5 August 2011 | Volume 7 | Issue 8 | e1002197

Ta
ble
2.
Tra
it-a
sso
ciat
ed
SNP
sco
nve
rge
on
the
sam
ed
ow
nst
ream
ge
ne
s.
Co
mp
lex
Tra
itU
nli
nk
ed
SN
P-p
air
Ex
pla
ine
dtr
ait
va
ria
nce
SN
P-p
air
con
ve
rge
nce
se
QT
Lsi
gn
ific
an
ceE
xp
lain
ed
ex
pre
ssio
nv
ari
an
ce
SNP
1SN
P2
SNP
1SN
P2
on
ge
ne
(pro
be
s)SN
P1
SNP
2SN
P1
SNP
2
Be
tath
alas
sem
iars
76
64
32
rs2
07
13
48
3.3
%[4
0]
3.0
%[4
0]
HB
G2
a(4
01
00
40
,4
50
53
7,
H8
v2-6
40
00
79
)2
.126
10
22
9,
7.6
761
02
37,
6.9
561
02
07
4.2
261
02
24,
6.4
661
02
24,
3.8
061
02
06
9.7
%,
10
.4%
,1
0.3
%8
.0%
,6
.7%
,9
.0%
rs9
37
60
92
rs7
66
43
21
0.5
%[4
0]
3.3
%[4
0]
HB
G2
a(4
01
00
40
,4
50
53
7)
1.7
361
02
32,
9.4
961
02
39
2.1
261
02
29,
7.6
761
02
37
10
.8%
,1
1.1
%9
.7%
,1
0.4
%
rs9
37
60
92
rs2
07
13
48
10
.5%
[40
]3
.0%
[40
]H
BG
2a
(40
10
04
0,
45
05
37
)1
.736
10
23
2,
9.4
961
02
39
4.2
261
02
24,
6.4
661
02
24
10
.8%
,1
1.1
%8
.0%
,6
.7%
F-ce
lld
istr
ibu
tio
nrs
14
27
40
7rs
93
99
13
71
3.1
%[3
8]
15
.8%
[38
]H
BG
2a
(40
10
04
0,
45
05
37
)1
.186
10
22
8,
1.2
161
02
36
1.7
061
02
26,
1.8
661
02
30
9.5
1%
,1
0.3
5%
8.7
4%
,8
.75
%
Syst
olic
blo
od
pre
ssu
rers
31
84
50
4rs
26
81
49
2N
/AN
/ALO
C33
8758
(66
50
03
5)
1.2
861
02
06
9.1
761
02
08
1.8
7%
2.2
7%
Dia
sto
licb
loo
dp
ress
ure
rs3
18
45
04
rs2
68
14
72
N/A
N/A
LOC
3387
58(6
65
00
35
)1
.286
10
20
62
.236
10
20
81
.87
%2
.49
%
rs6
53
17
8rs
26
81
47
2N
/AN
/ALO
C33
8758
(66
50
03
5)
1.5
461
02
06
2.2
361
02
08
1.8
5%
2.4
9%
Me
anco
rpu
scu
lar
volu
me
rs1
27
18
59
7rs
64
33
81
0.2
6%
[41
]0
.50
%[4
1]
VW
CE
(14
50
60
8)
3.3
961
02
10
1.7
461
02
06
2.6
5%
1.6
1%
rs2
54
09
17
rs6
43
38
10
.24
%[4
1]
0.5
0%
[41
]ES
PN
(34
40
63
0)
1.9
561
02
15
6.2
061
02
07
4.9
9%
1.9
9%
rs4
89
54
41
rs2
54
09
17
1.1
2%
[41
]0
.24
%[4
1]
HB
G2
a(4
01
00
40
,4
50
53
7)
2.7
461
02
32,
1.3
161
02
38
2.8
761
02
19,
3.1
961
02
18
10
.71
%,
10
.99
%6
.32
%,
5.2
9%
rs4
89
54
41
rs6
43
38
11
.12
%[4
1]
0.5
0%
[41
]R
AP
1GA
Pa
(48
90
18
1)
2.4
661
02
06
5.5
761
02
06
1.5
1%
1.4
1%
PD
ZK
1IP
1(3
17
02
70
)4
.276
10
20
67
.446
10
21
01
.45
%2
.55
%
Me
anco
rpu
scu
lar
he
mo
glo
bin
rs6
28
75
1rs
77
76
05
40
.34
%[4
1]
1.0
2%
[41
]P
DZ
K1I
P1
(31
70
27
0)
7.7
461
02
10
8.9
761
02
07
2.5
5%
1.6
5%
Me
anp
late
let
volu
me
rs1
24
85
73
8rs
11
60
29
54
0.9
3%
[42
]0
.41
%[4
2]
GP
9b(1
05
02
92
)3
.626
10
21
71
.146
10
20
74
.82
%1
.93
%
GN
G11
(15
80
02
5)
9.6
761
02
12
2.2
361
02
06
3.2
2%
1.5
2%
F13A
1(2
23
02
41
)5
.376
10
20
93
.136
10
20
92
.54
%2
.38
%
SAM
D14
b(5
56
02
80
)4
.086
10
21
83
.106
10
20
65
.05
%1
.47
%
C19
orf
33(6
30
47
0)
6.2
661
02
11
1.1
661
02
08
2.8
6%
2.3
7%
VC
Lb(7
05
92
)7
.496
10
20
76
.816
10
20
61
.72
%1
.39
%
rs1
24
85
73
8rs
11
07
17
20
0.9
3%
[42
]0
.18
%[4
2]
TPM
1(5
56
02
46
,6
10
51
9)
1.4
761
02
08,
1.4
561
02
06
1.3
861
02
13,
4.4
161
02
13
2.5
8%
,1
.60
%4
.32
%,
3.5
8%
Mu
ltip
lesc
lero
sis
rs2
52
33
93
rs9
27
13
66
N/A
N/A
TGFB
R2
(23
40
32
4)
5.1
561
02
07
1.0
761
02
06
2.0
1%
1.9
0%
Typ
e1
dia
be
tes
rs9
27
23
46
rs1
11
71
73
9N
/AN
/AK
RT1
8(6
58
02
70
)1
.876
10
20
64
.726
10
20
62
.06
%1
.70
%
rs9
27
23
46
rs1
70
17
04
N/A
N/A
KR
T18
(65
80
27
0)
1.8
761
02
06
9.4
061
02
06
2.0
6%
1.3
9%
He
igh
trs
91
03
16
rs1
09
46
80
8N
/AN
/AB
TN3A
2(4
61
06
74
)5
.426
10
20
69
.796
10
21
01
.40
%2
.60
%
Ind
icat
ed
are
18
pai
rso
fu
nlin
ked
SNP
sth
atar
eas
soci
ate
dw
ith
the
sam
eco
mp
lex
ph
en
oty
pe
and
that
also
affe
ctth
ee
xpre
ssio
nle
vels
of
the
sam
ed
ow
nst
ream
ge
ne
(s)
inci
s(F
DR
0.0
5)
or
tra
ns
(FD
R0
.50
).a
Eryt
hro
cyte
spe
cifi
cg
en
eac
cord
ing
toH
aem
Atl
as[4
3].
bM
eg
akar
yocy
tesp
eci
fic
ge
ne
acco
rdin
gto
Hae
mA
tlas
[43
].c
Exp
lain
ed
ph
en
oty
pic
vari
atio
nis
sho
wn
for
trai
tsw
he
nre
po
rte
din
the
ori
gin
alp
ape
rs(i
nd
icat
ed
insu
pe
rscr
ipt)
that
de
scri
be
the
seSN
P–
ph
en
oty
pe
asso
ciat
ion
.d
oi:1
0.1
37
1/j
ou
rnal
.pg
en
.10
02
19
7.t
00
2
Convergence of Trans-eQTLS on Intermediate Genes
PLoS Genetics | www.plosgenetics.org 6 August 2011 | Volume 7 | Issue 8 | e1002197

substantiating the likelihood these genes reflect coherent biological
sets. We repeated this co-expression analysis after we had
regressed out all cis- and trans-eQTL effects, and observed that
most of this co-expression was independent of the eQTL SNP-
effect on the expression of these genes, which further substantiates
that these genes are biologically related (MPV co-expression
Wilcoxon P,12200, MCV co-expression Wilcoxon P = 0.018).
Phenotypic bufferingAlthough the observed convergence provides insight into
downstream genes, it is not clear whether the MPV or MCV
phenotypes are eventually caused through these trans-genes, or
whether these trans-eQTLs emerged as a result of changes to the
volume of the platelets or the erythrocytes.
In order to gain insight into this, we analyzed the effect size of
these SNP variants on both the expression levels and the
phenotypes. While the effect sizes of these trait-associated SNPs
on eventual phenotypes were usually small, their intermediate
(molecular) effects was often substantially larger. This supports the
notion that the effect on e.g. MPV and MCV is through these
trans-genes, and suggests the presence of ‘phenotypic buffering’,
shown previously in plants [44], in humans (Table 2, Figure 4b):
the effects of the 18 converging pairs of SNPs on gene expression
levels were often substantially higher than the originally reported
effect sizes on the trait-phenotypes. For example, several MPV-
and MCV-associated SNPs explain between 1.41% and 10.99% of
trans-expression variation within the 1,469 unrelated samples,
whereas these SNPs only explain between 0.24% and 1.12% of the
MPV and MCV phenotype variation (and as such required over
13,000 samples [41,42] for identification, Figure 4b).
Replication of trans-eQTLs in monocytes and fouradditional primary tissues
We analyzed peripheral blood which is a mixture of different
hematopoetic cell types. In addition, we also assessed whether the
identified trait-associated trans-eQTLs (detected at FDR 0.05)
could be replicated in a single cell-type dataset. This is an
important question, as it is potentially possible that the trans-acting
SNP are able to alter the amount, volume or ratio of certain blood
cell types, which might as a consequence result in an indirect net
effect on the measured gene expression levels within the mix of the
cells that comprise whole blood.
We therefore analyzed monocyte expression data from 1,490
independent samples [45] and did not find evidence that this was a
widespread phenomenon as we could replicate 46 out of the 130
different trans-eQTLs (each of these with a nominal p,1.061025
in the monocyte data, Table S8). These replicated eQTLs include
the genes AOAH, HBG2, GP9, F13A1, SAMD14, CD151, ITGA2B,
MMRN1, THBS1, VWF and TPM1 mentioned above. Surprisingly
we could also replicate the trans-eQTL effects on various blood-
coagulation genes for mean platelet volume SNP rs12485738: One
might argue that rs12485738 primarily increases platelet volume,
resulting in a relatively higher volume of platelet-RNA when
assessing total peripheral blood RNA. If this were to be the case, a
measurable trans-effect is expected for platelet-specific (blood
coagulation) genes in whole blood. Such an effect would then not
actually be an expression-QTL, but rather a ‘cellular-QTL’.
However, the trans-eQTLs for rs12485738 were also present in
single cell-type monocyte datasets, indicating that the above
concerns do not apply. Clearly, trans-eQTL effects can manifest
themselves outside the primary cell-type, in which they are
expected to operate.
We also replicated 18 trait-associated trans-eQTLs (including
AOAH, detected at FDR 0.05) in an independent dataset
comprising four different non-blood tissues (subcutaneous adipose,
visceral adipose, liver and muscle, Figure S5, Table S9 and S10).
Since this dataset comprised only 90 samples, it is very
encouraging that 18 trans-eQTL could be replicated.
Discussion
Here we investigated gene expression in peripheral blood from
1,469 individuals to identify cis- and trans-effects of common
variants on gene expression levels. When comparing to other
Figure 4. Pairs of SNPs that cause the same phenotype more frequently than expected also affect the same downstream genes.Various pairs of unlinked SNPs cause the same phenotype but also converge on the same downstream genes. a) When using cis- and trans-eQTLs,identified when controlling FDR at 0.05, 7 unique pairs of SNPs cause the same phenotype but also affect the same downstream gene. Whencontrolling the FDR at 0.50 for the trans-eQTLs, 18 unique pairs of SNPs show this convergence. b) This is significantly higher than expected,determined using 100 permutations. c) The SNPs that affect these downstream genes in most instances explain a proportion of the downstream geneexpression variation that is substantially higher than what their effect is on the eventual phenotypes.doi:10.1371/journal.pgen.1002197.g004
Convergence of Trans-eQTLS on Intermediate Genes
PLoS Genetics | www.plosgenetics.org 7 August 2011 | Volume 7 | Issue 8 | e1002197
genetical genomics studies [12–14,16,18,21–24,45,46] we observe
an increasing percentage of genes that are cis- or trans-regulated
(39% of 19,689 unique genes at FDR 0.05). When eQTL studies
further increase the sample-sizes and thus increase statistical
power, we expect that for the far majority of genes the expression
levels are to some extent determined by genetic variation.
GWA studies have identified many loci, but it is still often unclear
what the affected gene in each locus is. Here we showed that 39% of
trait-associated SNPs affect gene expression in cis which is helpful in
pinpointing the most likely gene per susceptibility locus. However,
GWAS do not immediately provide insight in the trans-effects of these
susceptibility variants on downstream genes. Here we identified for
2.6% of all trait-associated SNPs trans-eQTL effects on in total 113
unique genes. While some of these trans-eQTLs are known to be
involved in these phenotypes (such as HBG2 in hemoglobin protein
levels and ß-Thallasemia), most of these genes have not been
implicated before in these complex traits, and provide additional
insight in the downstream mechanisms of these variants. Interestingly,
48% of trans-acting trait-associated SNPs map within the HLA,
indicating the HLA has a prominent role in regulating peripheral
blood gene expression. This might partly explain why the HLA has
been found to be associated with so many different diseases.
While we concentrated on peripheral blood, we could replicate
35% of the trans-eQTLs in monocytes. Particularly surprising was
Figure 5. Trait-associated SNPs show convergence on multiple genes. For several traits different and unlinked SNPs affect the same genes incis or trans. For beta thalassemia three different loci affect hemoglobin (HBG2) gene expression (one in cis, indicated with gray arrow, two in trans (atFDR 0.05), indicated with red arrows). For mean corpuscular volume (MCV) the same trans-effects on HBG2 (at FDR 0.05) exist, but convergence is alsoapparent on ESPN, VWCE, PDKZ1IP1 and RAP1GAP (at FDR 0.50). For mean platelet volume (MPV) numerous trans-effects on genes involved in bloodcoagulation were identified. Two MPV loci (rs12485738 on 3p26.3 and rs11602954 on 11p15.5) both affect GP9, F13A1 and C19orf33 (at FDR 0.05) andSAMD14, GNG11 and VCL (at FDR 0.50). Peripheral blood co-expression (Pearson correlation coefficient r$0.19, p,1.0610211) between genes isindicated in light grey.doi:10.1371/journal.pgen.1002197.g005
Convergence of Trans-eQTLS on Intermediate Genes
PLoS Genetics | www.plosgenetics.org 8 August 2011 | Volume 7 | Issue 8 | e1002197

the observation that for SNPs, known to affect the volume of
platelets or erythrocytes the identified trans-eQTL effects in whole
blood were also present in these monocytes. Among these
replicated genes are a considerable number of highly plausible
trans-genes. For example, for mean platelet volume SNP
rs12485738 we detected the same trans-eQTL effects on seven
well-known blood coagulation genes (F13A1, GP1BB, GP9,
ITGA2B, MMRN1, THBS1 and VWF) in both the peripheral
blood data and the monocyte data. Interestingly, in both datasets,
trans-effects for this SNP on another 31 genes were identified as
well, which suggests these genes play a role in blood coagulation. It
can thus be concluded that trans-eQTLs, identified in peripheral
blood, generally apply to monocytes as well. We assumed these
eQTLs might therefore also be present in other, non-blood tissues,
as previously observed for rodents [47–49]. Indeed we could
replicate some of these trans-eQTLs in a smaller dataset of four
non-blood tissues. Importantly, as mentioned before [46], the
allelic directions were nearly always identical to blood, which
implies that trans-eQTLs, if also present in another tissue, work in
the same way.
Our observation that sets of independent SNPs, associated with
the same complex phenotype sometimes also affect exactly the
same trans-gene, further substantiates the validity of our findings.
Based on the reported effect-sizes of these variants on these
complex phenotypes, we have shown here that the individual
effects of these SNPs on trans-gene expression can often be
stronger. This suggests that these down-stream gene expression
effects do not fully propagate to the eventual phenotype and are
somehow buffered. This ‘phenotypic buffering’ has been observed
before in plants [44] and suggests that additional compensatory
mechanisms exist that control these complex phenotypes.
However, we do realize that accurate estimates on this
phenomenon requires the availability of both gene-expression
and phenotype data for these traits. As we did not have these
phenotypes for our samples, we relied upon estimates from
literature. Future studies that have collected both genome-wide
genotype, expression and phenotype data from the same
individuals will permit answering the question what the extent of
this phenotypic buffering is. We should emphasize that the
number of converging pairs of SNPs that we identified must be a
very strong underestimate, and as such the false-negative rate from
this analysis is likely to be high: As we observed that on average
40.4% of the trait-associated SNPs affect gene expression levels in
cis, we expect that many of these SNPs will exert effects on gene
expression in trans. However, these effects are likely to be small and
due to multiple testing issues our current study identified only a
relatively small set of trans-eQTL effects. Likewise the number of
detected converging pairs of SNPs is even smaller. However, as we
observed this convergence for various pairs of SNPs, future
genetical genomics studies using larger sample sizes will likely
reveal many more pairs of converging SNPs, providing better
insight in the downstream molecular mechanisms that are affected
by these disorders.
The convergence and phenotypic buffering we observed might
also help uncover some of the missing heritability in complex
disease. As there are probably many SNPs with low marginal
phenotypic effects [50], GWAS currently lack power to detect
these. However, the effect of these trait-associated SNPs on
expression seems to be less multifactorial, leading to larger
expression effects. These numerous expression disturbances will
eventually converge to a phenotype, explaining the small
phenotypic effect of individual trait-associated SNPs.
Therefore, studying expression as intermediate phenotype will
be important for disease association studies trying to account for
the missing heritability of complex diseases. Disease SNPs, already
found to be disease-associated and marked as eQTL, lead to a set
of candidate downstream genes. Additional genetic variants that
also affect the expression of these genes will therefore be powerful
candidates for disease susceptibility.
Materials and Methods
Peripheral blood genetical genomics study populationsThe peripheral blood genetical genomics study population
contained 1,469 unrelated individuals from the United Kingdom
and the Netherlands. Some of these are healthy controls while
others are patient samples. The 49 ulcerative colitis (UC) cases in
this study are part of the inflammatory bowel disease (IBD) cohort
of the University Medical Centre Groningen. The 111 celiac
disease samples were collected within the Barts and the London
NHS Trust and the Oxford Radcliffe Hospitals NHS Trust. The
453 chronic obstructive pulmonary disease (COPD) samples were
collected within the NELSON study. The 856 amyotrophic lateral
sclerosis (ALS) cases and controls were collected in the University
Medical Centre Utrecht. All samples were collected after informed
consent and approved by local ethical review boards. Individual
sample information is provided in Table S11.
Peripheral blood (2.5 ml) for all samples was collected with the
PAXgene system (PreAnalytix GmbH, UK). PAXgene vials were
chosen to prevent density gradient centrifugation, immortalization
or in vitro cell culture artifacts changing mRNA profiles. PAXgene
tubes were mixed gently and incubated at room temperature for
two hours. After collection, tubes were frozen at 220uC for at least
24 hours followed by storage at 280uC. RNA was isolated using
the PAXgene Blood RNA isolation kit (PreAnalytix GmbH, UK).
RNA was quantified using the Nanodrop (Nanodrop Technolo-
gies, USA). Total RNA integrity was analyzed using an Agilent
Bioanalyzer (Agilent Technologies, USA).
Peripheral blood SNP genotypingPeripheral blood samples were either genotyped using the
Illumina (Illumina, San Diego, USA) HumanHap300, Human-
Hap370 or 610 Quad platform. Genotyping was performed
according to standard protocols from Illumina. Although the
different genotype oligonucleotide arrays differ, they share
294,757 SNPs, to which the analysis was confined. In addition,
SNPs with a minor allele frequency of ,5%, or a call-rate ,95%,
or deviating from Hardy-Weinberg equilibrium (exact p-value
,0.001) were excluded, resulting in 289,044 SNPs for further
analysis. Genotype calling for each SNP was performed by a
previously described algorithm [51].
Peripheral blood Illumina expression profilingAnti-sense RNA was synthesized, amplified and purified using
the Ambion Illumina TotalPrep Amplification Kit (Ambion, USA)
following the manufacturers’ protocol. Complementary RNA was
either hybridized to Illumina HumanRef-8 v2 arrays (229 samples,
further referred to as H8v2) or Illumina HumanHT-12 arrays
(1,240 samples, further referred to as HT12) and scanned on the
Illumina BeadArray Reader. Raw probe intensities were extracted
using Illumina’s BeadStudio Gene Expression module v3.2 (No
background correction was applied, nor did we remove probes
with low expression). The raw expression data of the 1,240 HT12
peripheral blood samples were combined with the raw expression
data of 296 replication samples (described in detail in paragraph
‘Trans-eQTL replication dataset’). Both datasets (H8v2 and HT12)
were quantile normalized separately to the median distribution
and expression values were subsequently log2 transformed.
Convergence of Trans-eQTLS on Intermediate Genes
PLoS Genetics | www.plosgenetics.org 9 August 2011 | Volume 7 | Issue 8 | e1002197

Subsequently, the probes were centered to zero and linearly scaled
such that each probe had a standard deviation of one.
Integration of the Illumina H8V2 and HT12 peripheralblood expression platform identifiers
The HT12 and H8v2 arrays share a considerable number of
probes with identical probe sequences. However, in a considerable
number of occasions the two platforms use different probe
identifiers for the same probe sequences. More importantly,
although probe identifiers are often identical, they sometimes
represent different probe sequences. In order to permit a meta-
analysis incorporating data from both arrays, we decided on the
following naming convention: if an H8v2 probe had the same
sequence as an HT12 probe, the HT12 ‘ArrayAddressID’ probe
identifier was used. If not, the original H8v2 probe identifier was
used, but with the prefix ‘‘Human_RefSeq-8_v2-’’ to prevent any
potential probe identifier ambiguity. A total of 52,061 unique
probes were used for further analysis, representing 19,609 unique
genes according to HUGO gene nomenclature.
Initial genomic mapping of Illumina expression probesequences
Various mapping strategies were used for the expression probes
to get a mapping location that was as unambiguous as possible: if
probes have been mapped incorrectly, or cross-hybridize to
multiple genomic loci, it might be that an eQTL will be
incorrectly deemed a trans-eQTL, while in fact it is a cis-eQTL
or primer polymorphisms. We used Ensembl database version 52
(NCBI 36.3 assembly) to obtain, for each annotated gene, the
transcript with the largest number of exons and included this main
spliced transcript in our reference set. Second, we added one
sequence per intron, extending intron boundaries 40 bp on each
side to allow mapping of the 50 bp probe sequences that
overlapping exon-intron junctions. Last, a version of the reference
DNA genome with masked annotated transcripts was included.
Probe sequences were mapped using NOVOALIGN V2.05.12 for
all the sequences (main transcript, introns, and non standard exon-
exon junctions) originating from the same transcript (parameters
2t 150 2v 20 20 200 [.]( [ˆ_]*)_). For each probe it was
determined whether it was mapping uniquely to one particular
genomic locus, or, if multiple hits were present whether all these
mappings resided in each other vicinity (,250 kb). Probes that did
not map at all, or mapped to multiple different loci were excluded
from further analyses. Using this approach, 43,202 of the 48,751
probes on the HT12 and 21,316 of the 22,185 probes on the H8v2
platform were eventually mapped to a single genomic location.
eQTL mappingIn order to detect cis-eQTLs, analysis was confined to those
probe-SNP combinations for which the distance from the probe
transcript midpoint to SNP genomic location was #250 kb. For
trans-eQTLs, analysis was confined to those probe-SNP combina-
tions for which the distance from probe transcript midpoint to
SNP genomic location was $5 Mb (to exclude the possibility of
accidentally detecting cis-eQTLs due to long ranging linkage
disequilibrium). Additionally, for the trans-eQTL analysis the
effects of the significant cis-eQTLs were removed from the
expression data by keeping the residual expression after linear
regression.
Association for cis- and trans-eQTL was tested with a non-
parametric Spearman’s rank correlation. For directly genotyped
SNPs we coded genotypes as 0, 1 or 2, while for imputed SNPs we
used SNP dosage values, ranging between 0 and 2. When a
particular probe-SNP pair was present in both the HT12 and
H8v2 datasets, an overall, joint p-value was calculated using a
weighted (square root of the dataset sample number) Z-method.
To correct for multiple testing, we controlled the false-discovery
rate (FDR) at 0.05: the distribution of observed p-values was used
to calculate the FDR, by comparison with the distribution
obtained from permuting expression phenotypes relative to
genotypes 100 times within the HT12 and H8v2 dataset for both
the cis- and trans- analyses [52].
In order to increase the number of detectable cis- and trans-
eQTLs we applied a principal component analysis (PCA) on the
sample correlation matrix. We, among others [19,20], argue that
the dominant PCs, capturing the larger part of the total variation,
will primarily capture sample differences in expression that reflect
physiological or environmental variation as well as systematic
experimental variation (e.g. batch and technical effects). Figure S6
shows for the 1,240 HT12 samples what per individual the PC
scores are. It is evident there are, especially among the first PCs,
strong batch effects are still present after proper quantile-quantile
normalization. By removing the variation captured by these PCs,
we expected that the residual expression is more strongly
determined by genetic variants and the number of significantly
detected cis- and trans-eQTLs will increase. An aspect to consider is
that with the removal of more PCs from the data, the degrees of
freedom of the data will decrease. Furthermore, it is not
immediately clear which PCs will actually capture physiological,
environmental, and systematic variation, which might lead to
removal of genetically determined expression variation as well.
Therefore a tradeoff has to be made on the number of PCs to
subtract from the data. We assessed this systematically, by
removing up to 100 PCs from the genetical genomics dataset (in
steps of 5).
Figure S7A shows that the number of significantly detected cis-
eQTL probes increases two-fold when 50 PCs were removed from
the expression data. There is a long plateau visible (around PC50),
where the number of detected cis-eQTLs probes remains
approximately constant, irrespective of removing for instance 10
fewer or 10 extra PCs (reported numbers in this figure also include
false-positive eQTLs due to potential primer polymorphisms, as
we here wanted to solely compare the performance of removing
different numbers of PCs). Figure S7B shows that of the initial
5,950 significantly detected cis-eQTL probes (no PCs removed),
4,965 (83.5%) were still detected with 50 PCs subtracted. The 985
initially detected cis-eQTLs probes, yet no longer detected when
50 PCs had been removed from the expression data, all had a low
significance (Figure S8). As we controlled the FDR at 0.05 in all
analyses it is therefore likely that a considerable amount of these
reflect false-positives. Figure S8C shows that for all the
overlapping 4,965 detected cis-eQTLs probes between the
different analyses, the allelic direction was identical, and effect
size on expression correlate well (Pearson r = 0.95) although these
were nearly always stronger after having subtracted 50 PCs.
We assessed this for trans-eQTLs as well. An important aspect to
consider is that trans-eQTL SNPs might affect multiple genes. If
these effects are substantial (either in effect size or the number of
affected genes), it is likely that a certain PC will capture this.
Removal of such PCs from the expression data will therefore
unintentionally result in the inability to detect these trans-eQTLs.
In order to avoid such false-negatives we first performed a QTL
analysis on the first 50 PCs (that had been removed from the
expression data for the cis-eQTL analysis) to assess whether some
of these PCs are under genetic control (genome-wide analysis,
controlling FDR at 0.05). We did this for the large HT12 and the
smaller H8v2 expression data separately, as PCA had been applied
Convergence of Trans-eQTLS on Intermediate Genes
PLoS Genetics | www.plosgenetics.org 10 August 2011 | Volume 7 | Issue 8 | e1002197

independently to these datasets. We observed that out of the first
25 PCs in the HT12 data three PCs and in the H8v2 two PCs
were to some extent genetically determined (r2.5%). This was
different for PCAs 26–50 in the HT12 data: 11 PCs were under
substantial genetic control (Figure S9a).
We therefore assumed that most trans-eQTLs could be detected
when removing approximately 25 PCs. We quantified this
systematically, by removing increasing amounts of PCs from the
expression data and conducting a full genome-wide trans-eQTL
mapping. Indeed, in these analyses at most 244 significant trans-
eQTLs could be detected (at FDR 0.05, with potential false-
positives due to cross-hybridizations removed), when removing
25 PCs (Figure S9b). The overlap with the expression with no PCs
removed was substantial: 62 of the 82 trans-eQTLs (77%), detected
in the original analysis were detected as well in the analysis with
25 PCs removed (Figure S9c), all with identical allelic directions
(Figure S9d).
Identification of false eQTLs due to primerpolymorphisms and cross-hybridization
One should be aware that sequence polymorphisms can cause
many false cis-eQTLs [53]. Such false cis-eQTLs do not reflect
actual expression differences caused by sequence polymorphisms
in cis-acting factors that affect mRNA levels. Instead they indicate
hybridization differences caused by sequence polymorphisms in
the mRNA region that is targeted by the microarray expression
probes. Therefore, SNP-probe combinations were excluded from
the cis-eQTL analysis when the 50 bp long expression probe
mapped to a genomic location that contained a known SNP that
was showing at least some LD (r2.0.1) with the cis-SNP. We used
SNP data from the 1000 Genomes Projects, as it contains LD
information for 9,633,115 SNPs (April 2009 release, based on 57
CEU samples of European descent).
Detected trans-eQTLs might also reflect false-positives, although
we initially had attempted to map the expression probes as
accurately as possible, by using the aforementioned three different
mapping strategies: it is still well possible that some of the
identified, putative trans-eQTLs in fact reflect very subtle cross-
hybridization (e.g. pertaining to only a small subsequence of the
probe). We therefore tried to falsify each of the putative trans-
eQTLs by attempting to map each trans-probe into the vicinity of
the SNP probe location, by using a highly relaxed mapping
approach. All putative Illumina trans-expression probes were
mapped using SHRiMP [54], which uses a global alignment
approach, to the human reference genome (NCBI 36.3 build). The
mapping settings were chosen very loosely to permit the
identification of nearly all potential hybridization locations: match
score was 10, the mismatch score was 0, the gap open penalty was
2250, the gap extension penalty was 2100, Smith and Waterman
minimum identical alignment threshold was 30.0%, while other
SHRiMP parameters were left at default. Using these settings all
mappings with a minimum overlap of 15 bases, or with 20 matches
with one mismatch, or 30 matches with 2 mismatches, or full-
length (50 bp) probe hybridizations with no more than 15
mismatches were accepted. Any trans-eQTL was discarded, if the
expression probe had a mapping that was within 2 Mb of the SNP
that showed the trans-eQTL effect. Once these potential false-
positive trans-eQTLs had been removed from the real, non-
permuted data, we repeated the multiple testing correction (again
controlling the FDR at 0.05).
Using this strategy we observed several instances where only 20
out the 50 bases of a probe sequence mapped in the vicinity of the
trans-SNP (data not shown). For these trans-eQTLs the Spearman’s
rank correlation p was often lower than 102100, which would
imply these SNPs explain over 25% of the total expression
variation of the corresponding trans-genes. Given the small amount
of trans-eQTLs we detected in total, such effect sizes are quite
unlikely and therefore provide circumstantial evidence these
indeed reflect cross-hybridization artifacts.
We also assessed whether any of the Illumina SNPs that
constitute trans-eQTLs might map to a different position than what
is reported in dbSNP. As such we mapped the 50 bp Illumina SNP
probe sequences to the genome assembly, permitting up to four
mismatches per 50 bp SNP probe sequence. We did not observe
any SNP that could map (with some mismatches) to the same
chromosome of the trans-probe.
It is still possible that some of the trans-eQTLs for which we did
not find any evidence of cross-hybridization, still are false positives,
e.g. by missing some cross-hybridizations due to imperfections in
the NCBI v36 assembly we used. Although we have identified
numerous occasions where a SNP affects two different probes
within the same gene in trans, substantiating the likelihood these
trans-eQTLs are real, providing unequivocal evidence that all our
reported trans-eQTLs are real is not straightforward.
Enrichment analysis of trait-associated SNPs and SNPslocated within the HLA region
To assess enrichment of trait-associated SNPs, we used a
collection of 1,262 unique SNPs from ’A Catalog of Published
Genome-Wide Association Studies’ (accessed 09 February 2010,
and each having at least one reported association p-value
,5.061027). We could successfully impute the genotypes for
1,167 of these SNPs and therefore confined all analyses to these
SNPs. Of these SNPs 572 had been directly genotyped on the
Illumina HumanHap300 platform, with a MAF.0.05, an HWE
exact p-value .0.0001 and call-rate .95%.
To ascertain whether these SNPs are more often constituting an
eQTL than expected, we used a methodology that is not affected
by the following potential confounders: non-even distribution of
SNP markers and expression probe markers across the genome,
differences in MAF between SNPs and LD structure within the
genotype date and correlation between probes in the expression
data. Additionally, this methodology is also not confounded by the
fact that for certain traits different SNPs in strong LD can have
been reported, due to differences in the platforms that were used to
identify these loci.
We first determined how many unique eQTL SNPs had been
identified in the original eQTL mapping (with an FDR,0.05) and
how many of these are trait-associated. Subsequently we permuted
the expression phenotypes relative to the genotypes (thus keeping
the correlation structure within the genotype data and the
correlation structure within the expression data intact, yet
assigning the genotypes of a sample to the expression data of a
randomly chosen sample) and reran the eQTL mapping, sorting
all tested eQTLs on highest significance. We then took an equal
number of top associated, but permuted, eQTL SNPs and
determined how many of these permuted eQTL SNPs are trait-
associated. By performing 100 permutations we obtained an
empiric distribution of the number of trait-associated SNPs
expected by chance. We subsequently fitted a generalized extreme
value distribution (EVD, using the EVD add-on package for R),
permitting us to estimate realistic enrichment significance
estimates (called EVD p throughout the manuscript).
For the MHC enrichment analysis the followed procedure was
identical, with the difference that we looked for enrichment for
SNPs within the MHC, defined as SNPs physically mapping
between 20 Mb and 40 Mb on chromosome 6 (NCBI 36
assembly).
Convergence of Trans-eQTLS on Intermediate Genes
PLoS Genetics | www.plosgenetics.org 11 August 2011 | Volume 7 | Issue 8 | e1002197

Trans-eQTL replication datasetsReplication of the detected eQTLs was performed in monocytes
from 1,490 different samples [45] and in an independent
population of 86 morbidly obese individuals that underwent
elective bariatric surgery (Department of general surgery,
Maastricht University Medical Centre, the Netherlands). Both
these datasets also used the same Illumina HumanHT-12
expression platform.
For the 1,490 monocyte samples eQTL P-Values summary
statistics were available for all monocyte trans-eQTLs with a
nominal p,1.061025. We ascertained how many of the trans-
eQTLs we had found in our peripheral blood data had a nominal
eQTL p,1.061025 in this monocyte dataset.
We also assessed trans-eQTLs in four different tissues from the
86 morbidly obese individuals that underwent bariatric surgery.
DNA was extracted from blood samples using the Chemagic
Magnetic Separation Module 1 (Chemagen) integrated with a
Multiprobe II Pipeting robot (PerkinElmer). All samples were
genotyped using both Illumina HumanCytoSNP-12 BeadChips
and Illumina HumanOmni1-Quad BeadChips (QC was identical
as was applied to the peripheral blood samples). We imputed
HapMap 2 genotypes using Impute version 2.0. In addition
expression profiling was performed for four different tissues for
each of these individuals using the Illumina HumanHT-12 arrays.
Wedge biopsies of liver, visceral adipose tissue (VAT, omentum
majus), subcutaneous adipose tissue (SAT, abdominal), and muscle
(musculus rectus abdominis) were taken during surgery. RNA was
isolated using the Qiagen Lipid Tissue Mini Kit (Qiagen, UK,
74804). Assessment of RNA quality and concentration was done
with an Agilent Bioanalyzer (Agilent Technologies USA). Starting
with 200 ng of RNA, the Ambion Illumina TotalPrep Amplifica-
tion Kit was used for anti-sense RNA synthesis, amplification, and
purification according to the protocol provided by the manufac-
turer (Ambion, USA). 750 ng of complementary RNA was
hybridized to Illumina HumanHT12 BeadChips and scanned on
the Illumina BeadArray Reader. Expression data preprocessing
was as mentioned before. We first attempted to replicate the trait-
associated trans-eQTLs per tissue, using an FDR of 0.05 and 100
permutations. Subsequently we conducted a meta-analysis,
combining the four tissues. Per trans-eQTL we used a weighted
Z-method to combine the four individual p-values. However, these
four datasets are not independent, as they reflect the same
individuals. We resolved this by conducting the permutations in
such a way that in every permutation round the samples were
permuted in exactly the same way for each of the four tissues. By
doing this we retained the correlations that exist between the
different tissues per sample, and were able to get a realistic empiric
(null-)distribution of expected test-statistics.
Convergence analysisPer trait we assessed all the SNPs that have been reported to be
associated with that particular trait. We analyzed per trait all
possible SNP-pairs. If a pair of SNPs was not in LD (r2,0.001) we
assessed whether they affected the same gene in cis or trans. When
using the trait-associated cis- and trans-eQTLs that had been
identified when controlling the FDR at 0.05, we identified 7
unique pairs of SNPs that caused both the same phenotype and
also affected the same gene(s). When using a somewhat more
relaxed set of trans-eQTLs, identified when controlling the FDR at
0.5, we identified 18 unique pairs of SNPs that affect the same
downstream gene.
We assessed whether these numbers were significantly higher
than expected, by using the same strategy that we had used to
assess the enrichment of trait-associated SNPs and the HLA; we
ran 100 permutations. We kept per permutation the cis-eQTL list
as it was, but generated a permuted set of trans-eQTLs, equal in
size to the original set of non-permuted trans-eQTLs. This enabled
us to determine per permutation round how many unique pairs of
SNPs converge on the same gene(s). We subsequently fitted a
generalized extreme value distribution, permitting us to estimate
realistic enrichment significance estimates.
Co-expression between genes, based on HT12 peripheralblood co-expression
If a particular SNP is cis- or trans-acting on multiple genes, it is
plausible that those genes are biologically related. Co-expression
between these genes provides circumstantial evidence this is the
case, strengthening the likelihood such cis- and trans-eQTLs are
real. We assessed this in the peripheral blood data, by using the
expression data of the 1,240 samples, run on the comprehensive
HT12 expression platform. As we had removed 25 PCs (to remove
physiological, environmental variation, and systematic experimen-
tal variation) for the trans-eQTL analyses, we decided to confine
co-expression analyses to this expression dataset. As there are
43,202 HT12 probes that we mapped to a known genomic
location, 43,202643,201/2 = 933,184,801 probe-pairs exist. Giv-
en 1,240 samples, a Pearson correlation coefficient r$0.19
corresponds to a p,0.05 when applying stringent Bonferroni
correction for these number of probe-pairs.
Accession numbersExpression data for both the peripheral blood and the four non-
blood datasets have been deposited in GEO with accession
numbers GSE20142 (1,240 peripheral blood samples, hybridized
to HT12 arrays), GSE20332 (229 peripheral blood samples,
hybridized to H8v2 arrays) and GSE22070 (subcutaneous adipose,
visceral adipose, muscle and liver samples).
Supporting Information
Figure S1 Detected cis- and trans-eQTLs in genome-wide
analysis.
(TIF)
Figure S2 Detected cis- and trans-eQTLs for 1,167 trait-
associated SNPs.
(TIF)
Figure S3 Detected cis- and trans-eQTLs per complex trait.
Immune-related and hematological associated SNPs often affect
gene expression in cis or trans.
(TIF)
Figure S4 Co-expression distribution between eQTL genes for
mean platelet volume and mean corpuscular volume.
(PDF)
Figure S5 Replication of trans-eQTLs in four non-blood tissues.
(TIF)
Figure S6 Principal components used as covariates in analyses.
(PDF)
Figure S7 Effect of removing principal components from
expression data on detect ability of cis-eQTLs
(TIF)
Figure S8 Significance of detected cis-eQTLs before and after
removal of principal components from expression data.
(TIF)
Convergence of Trans-eQTLS on Intermediate Genes
PLoS Genetics | www.plosgenetics.org 12 August 2011 | Volume 7 | Issue 8 | e1002197

Figure S9 Effect of removing principal components from
expression data on detect ability of trans-eQTLs.
(TIF)
Table S1 Detected cis-eQTLs (FDR 0.05) for all common SNPs.
(XLSX)
Table S2 Detected trans-eQTLs (FDR 0.05) for all common
SNPs.
(XLS)
Table S3 Detected cis-eQTLs (FDR 0.05) for 1,167 trait-
associated SNPs.
(XLS)
Table S4 Detected trans-eQTLs (FDR 0.05) for 1,167 trait-
associated SNPs.
(XLS)
Table S5 Detected cis- and trans-eQTLs (FDR 0.05) per complex
trait.
(XLS)
Table S6 Plots of detected trans-eQTLs for 1,167 trait-associated
SNPs for each of the seven individual cohorts of samples that make
up the total of 1,469 peripheral blood samples.
(PDF)
Table S7 Detected trans-eQTLs (FDR 0.50) for 1,167 trait-
associated SNPs.
(XLS)
Table S8 Replicated trans-eQTLs in monocyte eQTL dataset.
(XLS)
Table S9 Characteristics of subcutaneous adipose, visceral
adipose, muscle and liver datasets.
(XLS)
Table S10 Replicated trans-eQTLs in subcutaneous adipose,
visceral adipose, muscle and liver datasets.
(XLS)
Table S11 Characteristics of peripheral blood expression data.
(XLS)
Acknowledgments
We like to thank Jackie Senior for critically reading the manuscript.
Furthermore, we thank all individuals for participating in this study.
Author Contributions
Conceived and designed the experiments: LF GJtM. Performed the
experiments: MP AS CGJS MGMW HJMG LHvdB RAO RKW.
Analyzed the data: RSNF LF GJtM H-JW RCJ JHV AS. Contributed
reagents/materials/analysis tools: RSNF H-JW GJtM RCJ LF CW DAvH
LHvdB RAO RKW MHH DA MJB PD JF RMWH WAB SR AZ CCE
EMF GT. Wrote the paper: RSNF LF GJtM RCJ CW MHH DAvH.
References
1. Hindorff LA, Sethupathy P, Junkins HA, Ramos EM, Mehta JP, et al. (2009)
Potential etiologic and functional implications of genome-wide association loci
for human diseases and traits. Proc Natl Acad Sci U S A 106: 9362–9367.
2. Dubois PC, Trynka G, Franke L, Hunt KA, Romanos J, et al. (2010) Multiple
common variants for celiac disease influencing immune gene expression. Nat Genet.
3. Barrett JC, Clayton DG, Concannon P, Akolkar B, Cooper JD, et al. (2009)
Genome-wide association study and meta-analysis find that over 40 loci affect
risk of type 1 diabetes. Nat Genet.
4. Gregersen PK, Amos CI, Lee AT, Lu Y, Remmers EF, et al. (2009) REL,
encoding a member of the NF-kappaB family of transcription factors, is a newlydefined risk locus for rheumatoid arthritis. Nat Genet 41: 820–823.
5. Imielinski M, Baldassano RN, Griffiths A, Russell RK, Annese V, et al. (2009)
Common variants at five new loci associated with early-onset inflammatorybowel disease. Nat Genet 41: 1335–1340.
6. Kochi Y, Okada Y, Suzuki A, Ikari K, Terao C, et al. (2010) A regulatory
variant in CCR6 is associated with rheumatoid arthritis susceptibility. Nat Genet42: 515–519.
7. Nair RP, Duffin KC, Helms C, Ding J, Stuart PE, et al. (2009) Genome-widescan reveals association of psoriasis with IL-23 and NF-kappaB pathways. Nat
Genet 41: 199–204.
8. O’Donovan MC, Craddock N, Norton N, Williams H, Peirce T, et al. (2008)Identification of loci associated with schizophrenia by genome-wide association
and follow-up. Nat Genet 40: 1053–1055.
9. Skibola CF, Bracci PM, Halperin E, Conde L, Craig DW, et al. (2009) Geneticvariants at 6p21.33 are associated with susceptibility to follicular lymphoma. Nat
Genet 41: 873–875.
10. Wang Y, Broderick P, Webb E, Wu X, Vijayakrishnan J, et al. (2008) Common
5p15.33 and 6p21.33 variants influence lung cancer risk. Nat Genet 40: 1407–1409.
11. van Heel DA, West J (2006) Recent advances in coeliac disease. Gut 55:1037–1046.
12. Choy E, Yelensky R, Bonakdar S, Plenge RM, Saxena R, et al. (2008) Geneticanalysis of human traits in vitro: drug response and gene expression in
lymphoblastoid cell lines. PLoS Genet 4: e1000287. doi:0.1371/journal.
pgen.1000287.
13. Dixon AL, Liang L, Moffatt MF, Chen W, Heath S, et al. (2007) A genome-wide
association study of global gene expression. Nat Genet 39: 1202–1207.
14. Heap GA, Trynka G, Jansen RC, Bruinenberg M, Swertz MA, et al. (2009)Complex nature of SNP genotype effects on gene expression in primary human
leucocytes. BMC Med Genomics 2: 1.
15. Moffatt MF, Kabesch M, Liang L, Dixon AL, Strachan D, et al. (2007) Genetic
variants regulating ORMDL3 expression contribute to the risk of childhood
asthma. Nature 448: 470–473.
16. Stranger BE, Forrest MS, Dunning M, Ingle CE, Beazley C, et al. (2007)
Relative impact of nucleotide and copy number variation on gene expressionphenotypes. Science 315: 848–853.
17. Jansen RC, Nap JP (2001) Genetical genomics: the added value from
segregation. Trends Genet 17: 388–391.
18. Idaghdour Y, Czika W, Shianna KV, Lee SH, Visscher PM, et al. (2010)Geographical genomics of human leukocyte gene expression variation in
southern Morocco. Nat Genet 42: 62–67.
19. Biswas S, Storey JD, Akey JM (2008) Mapping gene expression quantitative trait
loci by singular value decomposition and independent component analysis.
BMC Bioinformatics 9: 244.
20. Leek JT, Storey JD (2007) Capturing heterogeneity in gene expression studies by
surrogate variable analysis. PLoS Genet 3: e161. doi:10.1371/journal.pgen.0030161.
21. Nica AC, Montgomery SB, Dimas AS, Stranger BE, Beazley C, et al. (2010)Candidate causal regulatory effects by integration of expression QTLs with
complex trait genetic associations. PLoS Genet 6: e1000895. doi:10.1371/journal.pgen.1000895.
22. Nicolae DL, Gamazon E, Zhang W, Duan S, Dolan ME, et al. (2010) Trait-
associated SNPs are more likely to be eQTLs: annotation to enhance discoveryfrom GWAS. PLoS Genet 6: e1000888. doi:10.1371/journal.pgen.1000888.
23. Emilsson V, Thorleifsson G, Zhang B, Leonardson AS, Zink F, et al. (2008)Genetics of gene expression and its effect on disease. Nature 452: 423–428.
24. Schadt EE, Molony C, Chudin E, Hao K, Yang X, et al. (2008) Mapping the
genetic architecture of gene expression in human liver. PLoS Biol 6: e107.doi:10.1371/journal.pbio.0060107.
25. Zhong H, Yang X, Kaplan LM, Molony C, Schadt EE (2010) Integrating
pathway analysis and genetics of gene expression for genome-wide associationstudies. Am J Hum Genet 86: 581–591.
26. Marchini J, Howie B, Myers S, McVean G, Donnelly P (2007) A new multipointmethod for genome-wide association studies by imputation of genotypes. Nat
Genet 39: 906–913.
27. Silverberg MS, Cho JH, Rioux JD, McGovern DP, Wu J, et al. (2009) Ulcerativecolitis-risk loci on chromosomes 1p36 and 12q15 found by genome-wide
association study. Nat Genet 41: 216–220.
28. Abraham C, Cho JH (2009) Inflammatory bowel disease. N Engl J Med 361:
2066–2078.
29. Huynh D, Dai XM, Nandi S, Lightowler S, Trivett M, et al. (2009) Colonystimulating factor-1 dependence of paneth cell development in the mouse small
intestine. Gastroenterology 137: 136-144, 144 e131-133.
30. Mombaerts P, Mizoguchi E, Grusby MJ, Glimcher LH, Bhan AK, et al. (1993)Spontaneous development of inflammatory bowel disease in T cell receptor
mutant mice. Cell 75: 274–282.
31. Eike MC, Olsson M, Undlien DE, Dahl-Jorgensen K, Joner G, et al. (2009) Genetic
variants of the HLA-A, HLA-B and AIF1 loci show independent associations with
type 1 diabetes in Norwegian families. Genes Immun 10: 141–150.
32. Valdes AM, Thomson G (2009) Several loci in the HLA class III region are
associated with T1D risk after adjusting for DRB1-DQB1. Diabetes Obes Metab11 Suppl 1: 46–52.
Convergence of Trans-eQTLS on Intermediate Genes
PLoS Genetics | www.plosgenetics.org 13 August 2011 | Volume 7 | Issue 8 | e1002197

33. Yang B, Houlberg K, Millward A, Demaine A (2004) Polymorphisms of
chemokine and chemokine receptor genes in Type 1 diabetes mellitus and itscomplications. Cytokine 26: 114–121.
34. Easton DF, Pooley KA, Dunning AM, Pharoah PD, Thompson D, et al. (2007)
Genome-wide association study identifies novel breast cancer susceptibility loci.Nature 447: 1087–1093.
35. van ’t Veer LJ, Dai H, van de Vijver MJ, He YD, Hart AA, et al. (2002) Geneexpression profiling predicts clinical outcome of breast cancer. Nature 415:
530–536.
36. Yu JX, Sieuwerts AM, Zhang Y, Martens JW, Smid M, et al. (2007) Pathwayanalysis of gene signatures predicting metastasis of node-negative primary breast
cancer. BMC Cancer 7: 182.37. Gilman JG, Huisman TH (1985) DNA sequence variation associated with
elevated fetal G gamma globin production. Blood 66: 783–787.38. Menzel S, Garner C, Gut I, Matsuda F, Yamaguchi M, et al. (2007) A QTL
influencing F cell production maps to a gene encoding a zinc-finger protein on
chromosome 2p15. Nat Genet 39: 1197–1199.39. Thein SL, Menzel S, Peng X, Best S, Jiang J, et al. (2007) Intergenic variants of
HBS1L-MYB are responsible for a major quantitative trait locus onchromosome 6q23 influencing fetal hemoglobin levels in adults. Proc Natl Acad
Sci U S A 104: 11346–11351.
40. Nuinoon M, Makarasara W, Mushiroda T, Setianingsih I, Wahidiyat PA, et al.(2010) A genome-wide association identified the common genetic variants
influence disease severity in beta0-thalassemia/hemoglobin E. Hum Genet 127:303–314.
41. Ganesh SK, Zakai NA, van Rooij FJ, Soranzo N, Smith AV, et al. (2009)Multiple loci influence erythrocyte phenotypes in the CHARGE Consortium.
Nat Genet 41: 1191–1198.
42. Soranzo N, Spector TD, Mangino M, Kuhnel B, Rendon A, et al. (2009) Agenome-wide meta-analysis identifies 22 loci associated with eight hematological
parameters in the HaemGen consortium. Nat Genet 41: 1182–1190.43. Watkins NA, Gusnanto A, de Bono B, De S, Miranda-Saavedra D, et al. (2009)
A HaemAtlas: characterizing gene expression in differentiated human blood
cells. Blood 113: e1–9.
44. Fu J, Keurentjes JJ, Bouwmeester H, America T, Verstappen FW, et al. (2009)
System-wide molecular evidence for phenotypic buffering in Arabidopsis. Nat
Genet 41: 166–167.
45. Zeller T, Wild P, Szymczak S, Rotival M, Schillert A, et al. (2010) Genetics and
beyond—the transcriptome of human monocytes and disease susceptibility.
PLoS ONE 5: e10693. doi:10.1371/journal.pone.0010693.
46. Dimas AS, Deutsch S, Stranger BE, Montgomery SB, Borel C, et al. (2009)
Common regulatory variation impacts gene expression in a cell type-dependent
manner. Science 325: 1246–1250.
47. Peirce JL, Li H, Wang J, Manly KF, Hitzemann RJ, et al. (2006) How replicable
are mRNA expression QTL? Mamm Genome 17: 643–656.
48. Petretto E, Bottolo L, Langley SR, Heinig M, McDermott-Roe C, et al. (2010) New
insights into the genetic control of gene expression using a Bayesian multi-tissue
approach. PLoS Comput Biol 6: e1000737. doi:10.1371/journal.pcbi.1000737.
49. Petretto E, Mangion J, Dickens NJ, Cook SA, Kumaran MK, et al. (2006)
Heritability and tissue specificity of expression quantitative trait loci. PLoS
Genet 2: e172. doi:10.1371/journal.pgen.0020172.
50. Yang J, Benyamin B, McEvoy BP, Gordon S, Henders AK, et al. (2010)
Common SNPs explain a large proportion of the heritability for human height.
Nat Genet 42: 565–569.
51. van Heel DA, Franke L, Hunt KA, Gwilliam R, Zhernakova A, et al. (2007) A
genome-wide association study for celiac disease identifies risk variants in the
region harboring IL2 and IL21. Nat Genet 39: 827–829.
52. Breitling R, Li Y, Tesson BM, Fu J, Wu C, et al. (2008) Genetical genomics:
spotlight on QTL hotspots. PLoS Genet 4: e1000232. doi:10.1371/journal.
pgen.1000232.
53. Alberts R, Terpstra P, Li Y, Breitling R, Nap JP, et al. (2007) Sequence
polymorphisms cause many false cis eQTLs. PLoS ONE 2: e622. doi:10.1371/
journal.pone.0000622.
54. Rumble SM, Lacroute P, Dalca AV, Fiume M, Sidow A, et al. (2009) SHRiMP:
accurate mapping of short color-space reads. PLoS Comput Biol 5: e1000386.
doi:10.1371/journal.pcbi.1000386.
Convergence of Trans-eQTLS on Intermediate Genes
PLoS Genetics | www.plosgenetics.org 14 August 2011 | Volume 7 | Issue 8 | e1002197