HLA-A, HLA-B, and HLA-DRB1 allele distribution in a large Armenian population sample
10
Tissue Antigens ISSN 0001-2815 HLA-A, HLA-B, and HLA-DRB1 allele distribution in a large Armenian population sample L. Matevosyan 1,2 , S. Chattopadhyay 3 , V. Madelian 4 , S. Avagyan 1 , M. Nazaretyan 1 , A. Hyussian 1 , E. Vardapetyan 2 , R. Arutunyan 2 & F. Jordan 4 1 Armenian Bone Marrow Donors Registry, Yerevan, Republic of Armenia 2 Department of Genetics and Cytology, State University, Yerevan, Republic of Armenia 3 Department of Microbiology, University of Washington, Seattle, WA 98195, USA 4 Armenian Bone Marrow Donor Registry, Los Angeles, CA 90039, USA Key words allele frequency; Armenian populations; DNA typing; genetic distances; human leukocyte antigen; population genetics Correspondence V. Madelian Armenian Bone Marrow Donor Registry 3111 Los Feliz Blvd Suite 206 Los Angeles CA 90039 USA Tel: +818 704 0072 Fax: 909-623-9306 e-mail: [email protected] Received 28 March 2010; revised 21 January 2011; accepted 27 February 2011 doi: 10.1111/j.1399-0039.2011.01668.x Abstract Human leukocyte antigen (HLA)-A, HLA-B, and HLA-DRB1 gene frequencies were investigated in 4279 unrelated Armenian bone marrow donors. HLA alleles were defined by using PCR amplification with sequence specific primers (PCR-SSP) high- and low-resolution kits. The aim of this study was to examine the HLA diversity at the high-resolution level in a large Armenian population sample, and to compare HLA allele group distribution in Armenian subpopulations. The most frequently observed alleles in the HLA class I were HLA-A*0201, A*0101, A*2402, A*0301, HLA-B*5101, HLA-B*3501, and B*4901. Among DRB1 alleles, high frequencies of DRB1*1104 and DRB1*1501 were observed, followed by DRB1*1101 and DRB1*1401. The most common three-locus haplotype found in the Armenian population was A*33-B*14- DRB1*01, followed by A*03-B*35-DRB1*01. Our results show a similar distribution of alleles in Armenian subpopulations from different countries, and from different regions of the Republics of Armenia and Karabagh. The low level of genetic distances between subpopulations indicates a high level of population homogeneity, and the genetic distances between Armenians and other populations show Armenians as a distinct ethnic group relative to others, reflecting the fact that Armenians have been an ‘isolated population’ throughout centuries. This study is the first comprehensive investigation of HLA–allele group distribution in a subset of Armenian populations, and the first to provide HLA–allele and haplotype frequencies at a high-resolution level. It is a valuable reference for organ transplantation and for future studies of HLA-associated diseases in Armenian populations. Introduction Human leukocyte antigen (HLA) polymorphism has been analyzed for several decades to investigate human genetic relationships (1). This study was undertaken to establish the Armenian HLA gene profile on a large population sample and to compare Armenian subpopulations by investigating HLA class I and class II polymorphisms. Armenia is one of the oldest countries in the world. It has a recorded history of about 3500 years. Over its history, it has seen many invasions, and it, in turn, has had its own periods of expansion, at times reaching and engulfing lands as far away as ancient Rome. Bordered by the Republic of Georgia, the Islamic Republic of Iran, and the Republics of Azerbaijan and Turkey, the present day Republic of Armenia and to its east, the Republic of Mountainous Karabagh are situated in the northeastern portion of the Armenian Highland (Figure 1), a region of jagged volcanic mountains, ravines and narrow passes, an austere climate, and a population comprising >95% ethnic Armenians (2). Through centuries, many factors have isolated Armenians from their neighboring populations. Chief among these have been its topography, language, and religion. Thus, in spite of repeated invasions, few invaders have braved its harsh weather and settled in permanently. Instead, once invaded, the land was annexed to the invading empire (Persian, Byzantine, Roman, and Ottoman), and was ruled by the locals. The Armenian language, an Indo–European language, and as such radically different from those of its historic and present day © 2011 John Wiley & Sons A/S · Tissue Antigens 78, 21–30 21
-
Upload
independent -
Category
Documents
-
view
0 -
download
0
Transcript of HLA-A, HLA-B, and HLA-DRB1 allele distribution in a large Armenian population sample

Tissue Antigens ISSN 0001-2815
HLA-A, HLA-B, and HLA-DRB1 allele distribution in a largeArmenian population sampleL. Matevosyan 1,2, S. Chattopadhyay3, V. Madelian4, S. Avagyan1, M. Nazaretyan1, A. Hyussian1,E. Vardapetyan2, R. Arutunyan2 & F. Jordan4
1 Armenian Bone Marrow Donors Registry, Yerevan, Republic of Armenia2 Department of Genetics and Cytology, State University, Yerevan, Republic of Armenia3 Department of Microbiology, University of Washington, Seattle, WA 98195, USA4 Armenian Bone Marrow Donor Registry, Los Angeles, CA 90039, USA
Key words
allele frequency; Armenian populations;DNA typing; genetic distances; humanleukocyte antigen; population genetics
Correspondence
V. MadelianArmenian Bone Marrow Donor Registry3111 Los Feliz BlvdSuite 206Los AngelesCA 90039USATel: +818 704 0072Fax: 909-623-9306e-mail: [email protected]
Received 28 March 2010; revised 21January 2011; accepted 27 February 2011
doi: 10.1111/j.1399-0039.2011.01668.x
Abstract
Human leukocyte antigen (HLA)-A, HLA-B, and HLA-DRB1 gene frequencies wereinvestigated in 4279 unrelated Armenian bone marrow donors. HLA alleles weredefined by using PCR amplification with sequence specific primers (PCR-SSP) high-and low-resolution kits. The aim of this study was to examine the HLA diversity atthe high-resolution level in a large Armenian population sample, and to compare HLAallele group distribution in Armenian subpopulations. The most frequently observedalleles in the HLA class I were HLA-A*0201, A*0101, A*2402, A*0301, HLA-B*5101,HLA-B*3501, and B*4901. Among DRB1 alleles, high frequencies of DRB1*1104and DRB1*1501 were observed, followed by DRB1*1101 and DRB1*1401. The mostcommon three-locus haplotype found in the Armenian population was A*33-B*14-DRB1*01, followed by A*03-B*35-DRB1*01. Our results show a similar distributionof alleles in Armenian subpopulations from different countries, and from differentregions of the Republics of Armenia and Karabagh. The low level of genetic distancesbetween subpopulations indicates a high level of population homogeneity, and thegenetic distances between Armenians and other populations show Armenians as adistinct ethnic group relative to others, reflecting the fact that Armenians have beenan ‘isolated population’ throughout centuries. This study is the first comprehensiveinvestigation of HLA–allele group distribution in a subset of Armenian populations,and the first to provide HLA–allele and haplotype frequencies at a high-resolutionlevel. It is a valuable reference for organ transplantation and for future studies ofHLA-associated diseases in Armenian populations.
Introduction
Human leukocyte antigen (HLA) polymorphism has beenanalyzed for several decades to investigate human geneticrelationships (1). This study was undertaken to establish theArmenian HLA gene profile on a large population sample andto compare Armenian subpopulations by investigating HLAclass I and class II polymorphisms.
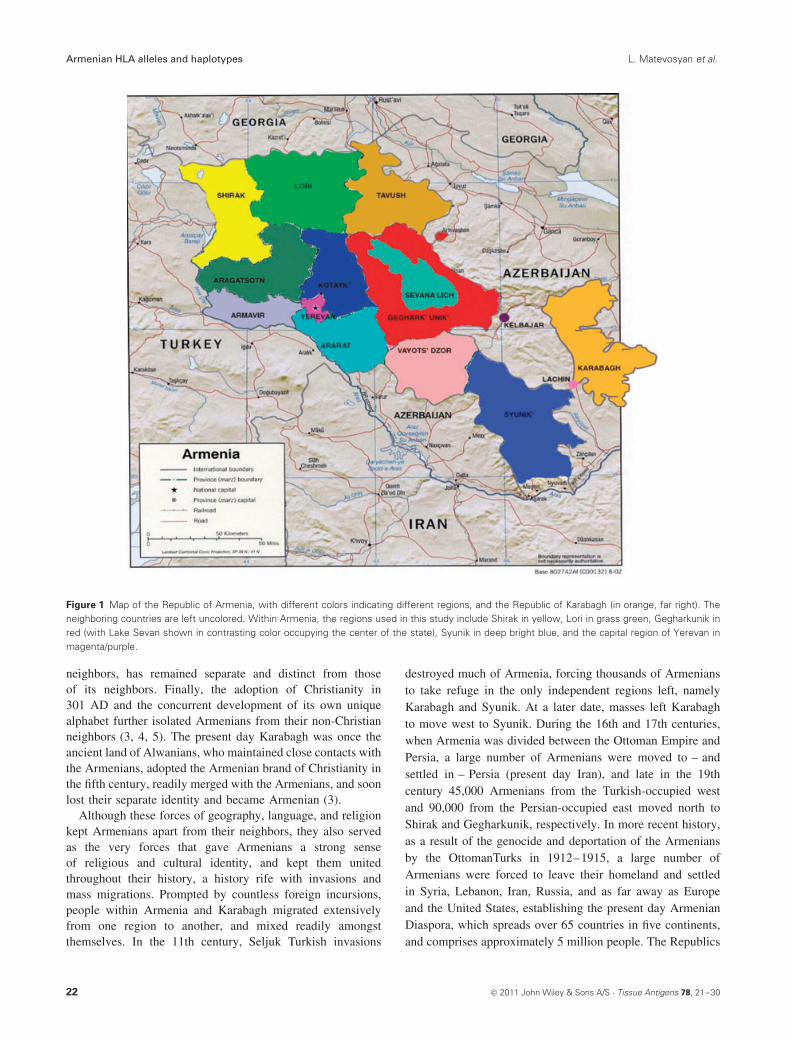
Armenia is one of the oldest countries in the world. It has arecorded history of about 3500 years. Over its history, it hasseen many invasions, and it, in turn, has had its own periodsof expansion, at times reaching and engulfing lands as faraway as ancient Rome. Bordered by the Republic of Georgia,the Islamic Republic of Iran, and the Republics of Azerbaijanand Turkey, the present day Republic of Armenia and to its
east, the Republic of Mountainous Karabagh are situated inthe northeastern portion of the Armenian Highland (Figure 1),a region of jagged volcanic mountains, ravines and narrowpasses, an austere climate, and a population comprising >95%ethnic Armenians (2).
Through centuries, many factors have isolated Armeniansfrom their neighboring populations. Chief among these havebeen its topography, language, and religion. Thus, in spiteof repeated invasions, few invaders have braved its harshweather and settled in permanently. Instead, once invaded, theland was annexed to the invading empire (Persian, Byzantine,Roman, and Ottoman), and was ruled by the locals. TheArmenian language, an Indo–European language, and as suchradically different from those of its historic and present day
© 2011 John Wiley & Sons A/S · Tissue Antigens 78, 21–30 21
Armenian HLA alleles and haplotypes L. Matevosyan et al.
Figure 1 Map of the Republic of Armenia, with different colors indicating different regions, and the Republic of Karabagh (in orange, far right). Theneighboring countries are left uncolored. Within Armenia, the regions used in this study include Shirak in yellow, Lori in grass green, Gegharkunik inred (with Lake Sevan shown in contrasting color occupying the center of the state), Syunik in deep bright blue, and the capital region of Yerevan inmagenta/purple.
neighbors, has remained separate and distinct from thoseof its neighbors. Finally, the adoption of Christianity in301 AD and the concurrent development of its own uniquealphabet further isolated Armenians from their non-Christianneighbors (3, 4, 5). The present day Karabagh was once theancient land of Alwanians, who maintained close contacts withthe Armenians, adopted the Armenian brand of Christianity inthe fifth century, readily merged with the Armenians, and soonlost their separate identity and became Armenian (3).
Although these forces of geography, language, and religionkept Armenians apart from their neighbors, they also servedas the very forces that gave Armenians a strong senseof religious and cultural identity, and kept them unitedthroughout their history, a history rife with invasions andmass migrations. Prompted by countless foreign incursions,people within Armenia and Karabagh migrated extensivelyfrom one region to another, and mixed readily amongstthemselves. In the 11th century, Seljuk Turkish invasions
destroyed much of Armenia, forcing thousands of Armeniansto take refuge in the only independent regions left, namelyKarabagh and Syunik. At a later date, masses left Karabaghto move west to Syunik. During the 16th and 17th centuries,when Armenia was divided between the Ottoman Empire andPersia, a large number of Armenians were moved to – andsettled in – Persia (present day Iran), and late in the 19thcentury 45,000 Armenians from the Turkish-occupied westand 90,000 from the Persian-occupied east moved north toShirak and Gegharkunik, respectively. In more recent history,as a result of the genocide and deportation of the Armeniansby the OttomanTurks in 1912–1915, a large number ofArmenians were forced to leave their homeland and settledin Syria, Lebanon, Iran, Russia, and as far away as Europeand the United States, establishing the present day ArmenianDiaspora, which spreads over 65 countries in five continents,and comprises approximately 5 million people. The Republics
22 © 2011 John Wiley & Sons A/S · Tissue Antigens 78, 21–30

L. Matevosyan et al. Armenian HLA alleles and haplotypes
of Armenia and Mountainous Karabagh combined, have, inturn, a population of <4 million, almost all Armenians (3).
In this study, we investigate genetic diversity of Armenianpopulations by performing HLA profiling on a large sampleof individuals from the Republic of Armenia, the Republic ofMountainous Karabagh, plus populations from Iran, Lebanon,and the United States, the latter three as representative samplesof the Armenian Diaspora.
Materials and methods
Population samples
HLA-A, HLA-B, and HLA-DRB1 typing were performed on4279 unrelated Armenian bone marrow donors, all healthy,randomly selected Armenians from different provinces of theRepublic of Armenia, the Republic of Karabagh, and threecountries of the Diaspora – Iran, Lebanon (all in Beirut), andthe United States (primarily in Los Angeles and Boston).Within this large general population, the genealogy of 2113donors could be established based on the birthplace of theancestors going back three generations. These donors weregrouped into nine subpopulations. Five were from within theRepublic of Armenia: Yerevan (n = 445), Lori (n = 102),Syunik (n = 117), Shirak (n = 76), and Gegharkunik (n =242), and the others from outside the Republic of Armenia:Karabagh (n = 445), Iran (n = 85), United States (n = 233),and Lebanon (n = 368). Donors whose ancestors came fromdifferent provinces or whose ancestry could not be traced tothe same region for three generations were included in thegeneral population studies, but were excluded from the sub-population comparison.
HLA typing
Genomic DNA was extracted from whole venous blood usingQIAamp DNA Blood Mini Kits (27220 Turnberry Lane,Valencia, CA). HLA class I (HLA-A and HLA-B) and HLAclass II (HLA-DRB1) alleles were typed using PCR–SSP low-and high-resolution kits (One Lambda, Canoga Park, CA andGenovision, West Chester, PA). For a group of 100 samplesselected at random from the 2113 individuals with properlytraced ancestry (total of all nine subpopulations), high-resolution typing was performed according to manufacturers’protocol (Genovision).
Statistical analysis
HLA-A, HLA-B and HLA-DRB1 allele frequencies were ana-lyzed using the ARLEQUIN software (Institute of Ecology andEvolution, University of Bern, Switzerland; http://cmpg.unibe.ch/software/arlequin35), to obtain maximum-likelihood esti-mates (6, 7). Standard deviations were calculated from 10bootstrap iterations. ARLEQUIN software was also used to calcu-late maximum-likelihood of three-locus haplotype frequencies
from genotyping data through an expectation–maximization(EM) algorithm. Linkage disequilibrium (LD) analysis forpairs of loci and Hardy–Weinberg equilibrium (HWE) foreach locus was performed using the same software.
The relationships between subpopulations were calculatedusing the principal coordinates analysis based on Reynoldsdistances (8) (number of permutations × 1000) using theNTSYS (Exeter software v.2.11, Setauket, NY 11733-2870,USA; http://www.exetersoftware.com/cat/ntsyspc/ntsyspc.html). High-resolution data for non-Armenian populationswere obtained using the New Allele Frequency database:(http://www.allelefrequencies.net.) (9).
PYPOP 0.6.0 (10) was used to perform Ewens–Wattersonhomozygosity (EWH) test of neutrality (11–14). The observed(Fobs) and expected (Fexp) homozygosity (under neutral selec-tion) were calculated respectively as sum of the squares ofhaplotype frequencies and through simulation, for the samesample size and number of unique haplotypes. The differencebetween Fobs and Fexp, divided by the square root of the vari-ance of Fexp provides the normalized deviate of the homozy-gosity (Fnd) (11–15). A significantly negative Fnd value withthe observed homozygosity level lower than the expected levelsuggests the presence of balancing selection, whereas a sig-nificantly positive value implies the presence of directionalselection. The probability of the observed sample populationto be obtained under neutrality is given by the P-value of F .As a two-tailed test of the null hypothesis of neutrality, theP values at either extreme of the distribution are consideredsignificant: P < 0.025 or >0.975 at 0.05 significance level,while P < 0.05 or >0.95 at 0.10 significance level.
Results and discussion
HLA diversity of the Armenian population
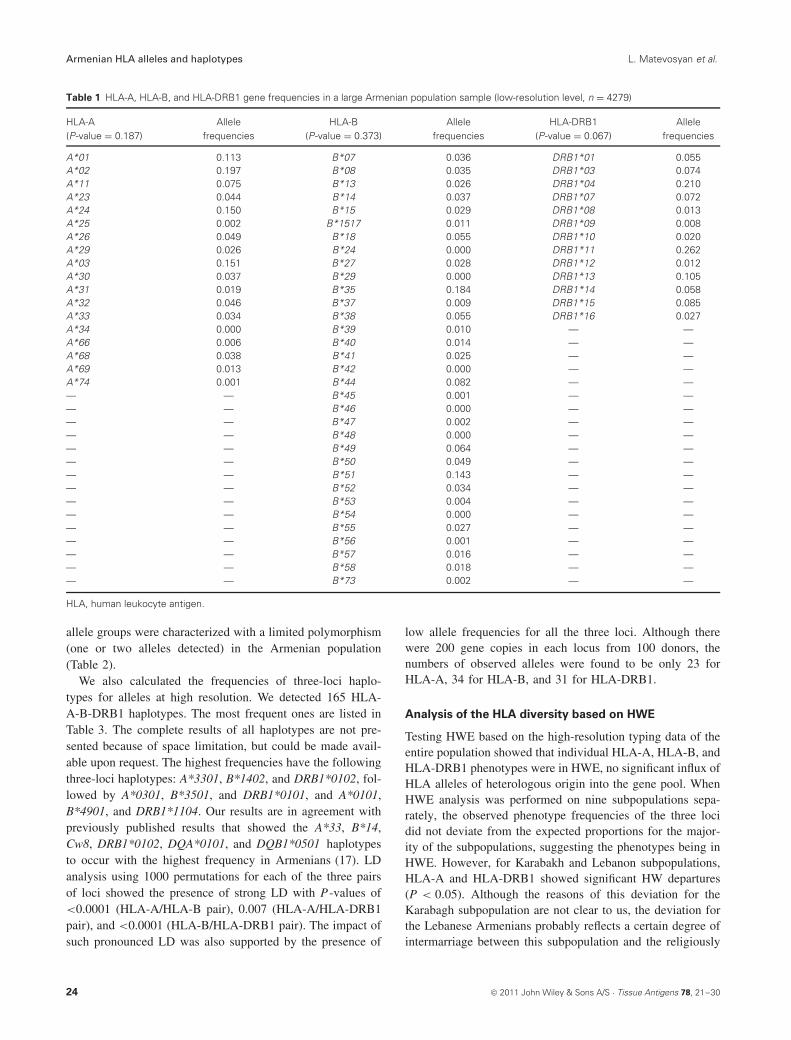
In the total Armenian population (n = 4279), the most fre-quent alleles (frequency > 0.04) for HLA-A, HLA-B, andHLA-DRB1 loci were *02, *03, *24, *01, *11, *26, *32,and *23 for the HLA-A locus; *35, *51, *44, *49, *18, *38,and *50 for the HLA-B locus; and *11, *04, *13, *15, *03,*07, *14, and *01 for the DRB1 locus (Table 1). In agree-ment with our results, an earlier study of a smaller sample (16)reported that the most frequent DRB1 alleles in Armenians asDRB1*11 and DRB1*04.
High-resolution typing of three loci in 100 unrelated donorsyielded 23 HLA-A, 33 HLA-B, and 31 HLA-DRB1 alle-les. The highest level of allelic heterogeneity was observedwithin HLA-A*02 (four alleles: 0201, 0205, 0206, and 0208),HLA-B*15 (four alleles: 1501, 1508, 1510, and 1517), HLA-B*35 (four alleles: 3501, 3502, 3503, and 3508), HLA-B*51(four alleles: 5101, 5102, 5105, and 5107), DRB1*04 (eightalleles: 0401, 0402, 0403, 0404, 0405, 0406, 0407, and 0408),DRB1*11 (four alleles: 1101, 1102, 1103, and 1104), andDRB1*13 (four alleles: 1301, 1302, 1303, and 1305). Other
© 2011 John Wiley & Sons A/S · Tissue Antigens 78, 21–30 23
Armenian HLA alleles and haplotypes L. Matevosyan et al.
Table 1 HLA-A, HLA-B, and HLA-DRB1 gene frequencies in a large Armenian population sample (low-resolution level, n = 4279)
HLA-A(P-value = 0.187)
Allelefrequencies
HLA-B(P-value = 0.373)
Allelefrequencies
HLA-DRB1(P-value = 0.067)
Allelefrequencies
A*01 0.113 B*07 0.036 DRB1*01 0.055A*02 0.197 B*08 0.035 DRB1*03 0.074A*11 0.075 B*13 0.026 DRB1*04 0.210A*23 0.044 B*14 0.037 DRB1*07 0.072A*24 0.150 B*15 0.029 DRB1*08 0.013A*25 0.002 B*1517 0.011 DRB1*09 0.008A*26 0.049 B*18 0.055 DRB1*10 0.020A*29 0.026 B*24 0.000 DRB1*11 0.262A*03 0.151 B*27 0.028 DRB1*12 0.012A*30 0.037 B*29 0.000 DRB1*13 0.105A*31 0.019 B*35 0.184 DRB1*14 0.058A*32 0.046 B*37 0.009 DRB1*15 0.085A*33 0.034 B*38 0.055 DRB1*16 0.027A*34 0.000 B*39 0.010 — —A*66 0.006 B*40 0.014 — —A*68 0.038 B*41 0.025 — —A*69 0.013 B*42 0.000 — —A*74 0.001 B*44 0.082 — —— — B*45 0.001 — —— — B*46 0.000 — —— — B*47 0.002 — —— — B*48 0.000 — —— — B*49 0.064 — —— — B*50 0.049 — —— — B*51 0.143 — —— — B*52 0.034 — —— — B*53 0.004 — —— — B*54 0.000 — —— — B*55 0.027 — —— — B*56 0.001 — —— — B*57 0.016 — —— — B*58 0.018 — —— — B*73 0.002 — —
HLA, human leukocyte antigen.
allele groups were characterized with a limited polymorphism(one or two alleles detected) in the Armenian population(Table 2).
We also calculated the frequencies of three-loci haplo-types for alleles at high resolution. We detected 165 HLA-A-B-DRB1 haplotypes. The most frequent ones are listed inTable 3. The complete results of all haplotypes are not pre-sented because of space limitation, but could be made avail-able upon request. The highest frequencies have the followingthree-loci haplotypes: A*3301, B*1402, and DRB1*0102, fol-lowed by A*0301, B*3501, and DRB1*0101, and A*0101,B*4901, and DRB1*1104. Our results are in agreement withpreviously published results that showed the A*33, B*14,Cw8, DRB1*0102, DQA*0101, and DQB1*0501 haplotypesto occur with the highest frequency in Armenians (17). LDanalysis using 1000 permutations for each of the three pairsof loci showed the presence of strong LD with P-values of<0.0001 (HLA-A/HLA-B pair), 0.007 (HLA-A/HLA-DRB1pair), and <0.0001 (HLA-B/HLA-DRB1 pair). The impact ofsuch pronounced LD was also supported by the presence of
low allele frequencies for all the three loci. Although therewere 200 gene copies in each locus from 100 donors, thenumbers of observed alleles were found to be only 23 forHLA-A, 34 for HLA-B, and 31 for HLA-DRB1.
Analysis of the HLA diversity based on HWE
Testing HWE based on the high-resolution typing data of theentire population showed that individual HLA-A, HLA-B, andHLA-DRB1 phenotypes were in HWE, no significant influx ofHLA alleles of heterologous origin into the gene pool. WhenHWE analysis was performed on nine subpopulations sepa-rately, the observed phenotype frequencies of the three locidid not deviate from the expected proportions for the major-ity of the subpopulations, suggesting the phenotypes being inHWE. However, for Karabakh and Lebanon subpopulations,HLA-A and HLA-DRB1 showed significant HW departures(P < 0.05). Although the reasons of this deviation for theKarabagh subpopulation are not clear to us, the deviation forthe Lebanese Armenians probably reflects a certain degree ofintermarriage between this subpopulation and the religiously
24 © 2011 John Wiley & Sons A/S · Tissue Antigens 78, 21–30

L. Matevosyan et al. Armenian HLA alleles and haplotypes
Table 2 HLA-A, HLA-B, and HLA-DRB1 alleles and their frequencies among Armenians – high resolution (n = 100)
HLA-A(P-value = 0.686)
Allelefrequencies
HLA-B(P-value = 0.402)
Allelefrequencies
HLA-DRB1(P-value = 0.554)
Allelefrequencies
A*0101 0.125 B*0702 0.030 DRB1*0101 0.045A*0201 0.155 B*0801 0.010 DRB1*0102 0.040A*0205 0.005 B*1302 0.035 DRB1*0301 0.035A*0206 0.005 B*1401 0.005 DRB1*0401 0.045A*0208 0.010 B*1402 0.060 DRB1*0402 0.045A*0301 0.105 B*1501 0.015 DRB1*0403 0.035A*0302 0.050 B*1508 0.005 DRB1*0404 0.045A*1101 0.080 B*1510 0.005 DRB1*0405 0.010A*2301 0.050 B*1517 0.020 DRB1*0406 0.005A*2402 0.120 B*1801 0.045 DRB1*0407 0.020A*2403 0.010 B*2702 0.015 DRB1*0408 0.010A*2601 0.040 B*2705 0.005 DRB1*0701 0.050A*2901 0.010 B*3501 0.095 DRB1*0803 0.015A*2902 0.025 B*3502 0.040 DRB1*0804 0.005A*3001 0.030 B*3503 0.035 DRB1*0901 0.010A*3101 0.035 B*3508 0.025 DRB1*1001 0.025A*3201 0.035 B*3801 0.040 DRB1*1101 0.080A*3301 0.045 B*3901 0.015 DRB1*1102 0.005A*3303 0.010 B*4001 0.005 DRB1*1103 0.010A*6601 0.005 B*4402 0.050 DRB1*1104 0.115A*6801 0.030 B*4403 0.010 DRB1*1201 0.005A*6901 0.015 B*4901 0.095 DRB1*1301 0.040A*7403 0.005 B*5001 0.045 DRB1*1302 0.015— — B*5101 0.175 DRB1*1303 0.010— — B*5102 0.010 DRB1*1305 0.015— — B*5105 0.005 DRB1*1401 0.080— — B*5107 0.005 DRB1*1404 0.005— — B*5201 0.030 DRB1*1501 0.115— — B*5501 0.020 DRB1*1502 0.035— — B*5701 0.015 DRB1*1601 0.020— — B*5806 0.015 DRB1*1602 0.010— — B*41XX 0.015 — —— — B*53XX 0.005 — —
HLA, human leukocyte antigen.
and culturally similar Lebanese. The only significant case ofhomogeneity was noticed in HLA-DRB1 locus of Gegharku-nik subpopulation, undoubtedly a case of assortative matingin this region (18).
Relatedness between different Armenian
subpopulations based on the Reynolds distances
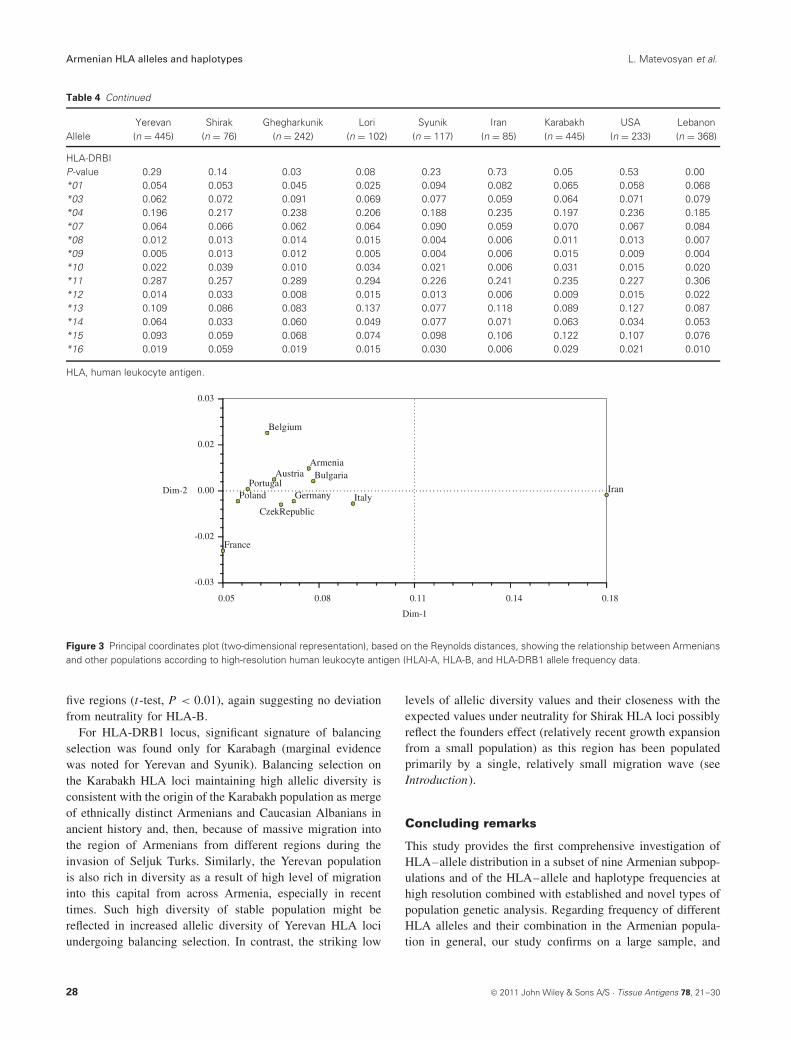
Comparison of HLA frequencies between the nine subpopu-lations of Armenians studied is presented in Table 4. Relat-edness between different Armenian subpopulations accordingto HLA-A, HLA-B, and HLA-DRB1 low-resolution allelefrequency data and based on the Reynolds distances is pre-sented through the principal coordinates plot (two-dimensionalrepresentation) in Figure 2. Using high-resolution data, asimilar plot showing the genetic distances between the generalArmenian population and several European populations basedon HLA-A, HLA-B, and HLA-DRB1 allele frequencies ispresented in Figure 3, and the genetic distances between the
general Armenian population and some ‘Mediterranean’ pop-ulations using high-resolution HLA-DRB1 allele frequencydata only is presented in Figure 4. The latter analysis was per-formed using HLA-DRB1 alone, because high-resolution datafor HLA-A and HLA-B were unavailable for some of the pop-ulations we wanted to include because of their reported close-ness to the Armenians. Results indicate that all nine Armeniansubpopulations studied, including those geographically iso-lated from the Republics of Armenia and Karabagh, fall withinthe same cluster (Figure 2). Not surprising, given the fact thatthese communities were formed by Armenians from practi-cally all of historic Armenia, and have only existed in theDiaspora for two to three generations at the most – not longenough to genetically differentiate significantly from the origi-nal population. Within the Armenian cluster, it was interestingto find the subpopulations of Karabagh and Syunik to bealmost identical, probably reflecting the fact that present daySyunik is populated almost entirely by descendents of Arme-nians who migrated from Karabagh (see Introduction). When
© 2011 John Wiley & Sons A/S · Tissue Antigens 78, 21–30 25

Armenian HLA alleles and haplotypes L. Matevosyan et al.
Table 3 HLA-A, HLA-B, and HLA-DRB1 haplotype frequencies amongArmenians (n = 100)
Haplotype Frequency SD′
A*3301 B*1402 DRB1*0102 0.030 0.013A*0301 B*3501 DRB1*0101 0.025 0.011A*0101 B*4901 DRB1*1104 0.020 0.012A*0201 B*0702 DRB1*1501 0.015 0.009A*0201 B*5101 DRB1*1501 0.015 0.011A*0302 B*4402 DRB1*0402 0.015 0.010A*2402 B*3801 DRB1*1401 0.015 0.009A*2402 B*5101 DRB1*0404 0.015 0.010A*2601 B*3801 DRB1*0301 0.015 0.009A*0101 B*1517 DRB1*1104 0.010 0.007A*0101 B*3508 DRB1*1101 0.010 0.007A*0101 B*5201 DRB1*1502 0.010 0.008A*0201 B*5001 DRB1*0701 0.010 0.009A*0201 B*5101 DRB1*1301 0.010 0.007A*0301 B*3503 DRB1*1401 0.010 0.007A*0301 B*5001 DRB1*0701 0.010 0.008A*0301 B*5101 DRB1*0101 0.010 0.009A*0302 B*1402 DRB1*1501 0.010 0.007A*1101 B*1801 DRB1*1501 0.010 0.007A*1101 B*4901 DRB1*0403 0.010 0.008A*2301 B*0702 DRB1*1501 0.010 0.007A*2301 B*4901 DRB1*1101 0.010 0.009A*2402 B*4402 DRB1*1104 0.010 0.008A*2402 B*5101 DRB1*1104 0.010 0.009A*3101 B*3501 DRB1*1104 0.010 0.009A*3101 B*5101 DRB1*1501 0.010 0.008A*6801 B*5101 DRB1*0404 0.010 0.008
HLA, human leukocyte antigen; SD′, standard deviation.
viewed in terms of other ethnic groups, our analysis confirmsprevious findings regarding the relationship of Armenians withvarious European populations (Figure 3), and their relativecloseness to Bulgarians (19, 20) and Italians (21, 22). Inaddition, based on HLA-DRB1 allele frequencies, our anal-ysis also agrees with previous reports that place Arme-nians within the ‘Mediterranean’ substratum (19–23), andshow them to be distinct from – but related to – Ashkenazi(24–26) and non-Ashkenazi (27) Jews, Turks (26, 28, 29),and Cretans (25, 26, 30).
EWH test of neutrality
Finally, we used EWH test of neutrality for comparativeanalysis of selective processes in Armenian subpopulationsbased on HLA alleles diversity. The EWH test compares theobserved homozygosity with the homozygosity expected withno selection. In cases when the difference between observedand expected homozygosity (Fnd) is significant, presenceof directional (Fnd > 0) or balancing (Fnd < 0) selection islikely.
All three loci have negative Fnd values for all subpopula-tions indicating an overall direction toward balancing selec-tion, i.e. selection for sustaining high diversity of the HLA
0.02
−0.010.02 0.06
Shirak
Yerevan
Lori
Gegharkunik
USAIran
Lebanon
Karabakh
Syunik
Dim-1
Dim-2
Figure 2 Principal coordinates plot (two-dimensional representation),based on the Reynolds distances, showing the relationship betweendifferent Armenian subpopulations according to low-resolution humanleukocyte antigen (HLA)-A, HLA-B, and HLA-DRB1 allele frequency data.
alleles in the populations (Table 5). It has been previouslyshown (15) that there is some evidence of balancing selectionin DRB1 locus from 23 human populations across the globethat was attributed to selection for variability in the aminoacid residues that form antigen-binding/presenting pocket. Ourdata confirm the previous observation and expand it to otherHLA alleles. However, the difference between the observedand expected homozygosity was not statistically significant inall of the populations (Table 5).
The evidence of balancing selection in three loci combined(as observed by the two-tailed P-values for corresponding Fnd
values) is most prominent for Karabagh and, then, Yerevanregions, whereas no deviation from neutral selection was notedin populations from Shirak, Iran, and Lori regions.
As we look at each locus separately, in case of HLA-A, four regions – Karabagh, Lebanon, Yerevan, and UnitedStates – showed strong evidence of balancing selection forHLA-A. On the other hand, in Ghegharkunik, Lori, Syunik,and Iran, HLA-A heterozygosity showed moderate, althoughinsignificant, deviations from neutrality, indicative of somebalancing selection pressures. However, in population fromShirak, the deviation from neutrality was found to be thelowest, and the Shirak HLA-A Fnd value was calculated to besignificantly lower than all other Fnd values (t-test, P < 0.01),suggesting a relatively homogeneous subpopulation.
In case of HLA-B, the regions showing footprints of balanc-ing selection were again Karabakh and Yerevan, along withGhegharkunik, whereas Syunik and US diversity suggestedmarginal evidence of similar selective forces. Iran, Shirak,Lori, and Lebanon subpopulations, on the contrary, were withsignificantly low Fnd values compared with that for the other
26 © 2011 John Wiley & Sons A/S · Tissue Antigens 78, 21–30

L. Matevosyan et al. Armenian HLA alleles and haplotypes
Table 4 HLA-A, HLA-B, and HLA-DRB1 allele frequencies in nine Armenian subpopulations
AlleleYerevan(n = 445)
Shirak(n = 76)
Ghegharkunik(n = 242)
Lori(n = 102)
Syunik(n = 117)
Iran(n = 85)
Karabakh(n = 445)
USA(n = 233)
Lebanon(n = 368)
HLA-AP-value 0.17 0.85 0.18 0.44 0.50 0.69 0.00 0.22 0.00*01 0.107 0.112 0.118 0.127 0.124 0.147 0.116 0.129 0.113*02 0.180 0.250 0.188 0.167 0.188 0.188 0.193 0.200 0.185*03 0.158 0.118 0.182 0.162 0.137 0.129 0.144 0.137 0.140*11 0.068 0.092 0.062 0.064 0.085 0.082 0.062 0.054 0.082*23 0.050 0.033 0.031 0.049 0.051 0.053 0.045 0.049 0.038*24 0.154 0.158 0.159 0.167 0.145 0.165 0.162 0.118 0.173*25 0.002 0.000 0.002 0.000 0.000 0.000 0.000 0.000 0.000*26 0.054 0.033 0.056 0.049 0.038 0.041 0.048 0.062 0.043*29 0.037 0.033 0.039 0.020 0.030 0.029 0.022 0.017 0.018*30 0.042 0.039 0.037 0.039 0.038 0.018 0.042 0.036 0.042*31 0.012 0.026 0.021 0.025 0.017 0.029 0.026 0.021 0.015*32 0.043 0.046 0.023 0.044 0.056 0.035 0.046 0.060 0.061*33 0.025 0.013 0.031 0.044 0.051 0.041 0.042 0.054 0.038*66 0.008 0.013 0.008 0.015 0.009 0.000 0.001 0.004 0.008*68 0.047 0.033 0.037 0.020 0.013 0.024 0.030 0.041 0.031*69 0.009 0.000 0.006 0.010 0.013 0.018 0.019 0.015 0.014*74 0.003 0.000 0.000 0.000 0.004 0.000 0.002 0.002 0.000
HLA-BP-value 0.07 0.21 0.20 0.09 0.65 0.37 0.23 0.97 0.19*07 0.033 0.039 0.033 0.015 0.038 0.035 0.039 0.041 0.045*08 0.031 0.039 0.054 0.049 0.030 0.029 0.028 0.032 0.030*13 0.037 0.013 0.027 0.025 0.017 0.024 0.011 0.036 0.037*14 0.030 0.026 0.039 0.044 0.051 0.071 0.040 0.071 0.038*15 0.039 0.039 0.025 0.025 0.034 0.018 0.036 0.030 0.020*16 0.000 0.000 0.000 0.000 0.000 0.000 0.000 0.000 0.001*18 0.051 0.066 0.066 0.054 0.060 0.012 0.044 0.047 0.067*27 0.028 0.033 0.033 0.015 0.030 0.024 0.036 0.024 0.012*35 0.189 0.171 0.165 0.191 0.175 0.159 0.165 0.161 0.198*37 0.008 0.007 0.010 0.025 0.009 0.000 0.004 0.015 0.008*38 0.064 0.079 0.048 0.054 0.043 0.065 0.058 0.079 0.056*39 0.012 0.013 0.010 0.025 0.000 0.012 0.010 0.015 0.007*40 0.016 0.013 0.008 0.005 0.017 0.006 0.015 0.006 0.038*41 0.026 0.020 0.017 0.039 0.034 0.024 0.025 0.019 0.045*44 0.075 0.112 0.093 0.093 0.073 0.071 0.078 0.064 0.084*45 0.003 0.000 0.000 0.000 0.000 0.000 0.000 0.000 0.000*46 0.000 0.007 0.000 0.000 0.000 0.000 0.000 0.000 0.000*47 0.000 0.000 0.000 0.005 0.000 0.006 0.002 0.000 0.003*48 0.000 0.000 0.000 0.000 0.000 0.071 0.000 0.002 0.001*49 0.068 0.066 0.058 0.059 0.073 0.065 0.069 0.069 0.048*50 0.043 0.059 0.052 0.064 0.056 0.182 0.047 0.054 0.052*51 0.144 0.092 0.110 0.113 0.141 0.041 0.161 0.137 0.121*52 0.037 0.033 0.029 0.020 0.038 0.000 0.049 0.028 0.031*53 0.003 0.000 0.002 0.000 0.000 0.000 0.007 0.002 0.001*54 0.000 0.000 0.002 0.000 0.000 0.000 0.000 0.000 0.000*55 0.022 0.013 0.050 0.039 0.030 0.024 0.025 0.030 0.015*56 0.002 0.007 0.000 0.000 0.000 0.000 0.000 0.002 0.003*57 0.016 0.000 0.012 0.015 0.017 0.018 0.011 0.013 0.016*58 0.017 0.026 0.041 0.015 0.013 0.012 0.025 0.006 0.007*63 0.006 0.026 0.014 0.015 0.021 0.029 0.013 0.015 0.014*67 0.000 0.000 0.000 0.000 0.000 0.000 0.000 0.000 0.001*73 0.000 0.000 0.002 0.000 0.000 0.006 0.001 0.000 0.001
© 2011 John Wiley & Sons A/S · Tissue Antigens 78, 21–30 27
Armenian HLA alleles and haplotypes L. Matevosyan et al.
Table 4 Continued
AlleleYerevan(n = 445)
Shirak(n = 76)
Ghegharkunik(n = 242)
Lori(n = 102)
Syunik(n = 117)
Iran(n = 85)
Karabakh(n = 445)
USA(n = 233)
Lebanon(n = 368)
HLA-DRBIP-value 0.29 0.14 0.03 0.08 0.23 0.73 0.05 0.53 0.00*01 0.054 0.053 0.045 0.025 0.094 0.082 0.065 0.058 0.068*03 0.062 0.072 0.091 0.069 0.077 0.059 0.064 0.071 0.079*04 0.196 0.217 0.238 0.206 0.188 0.235 0.197 0.236 0.185*07 0.064 0.066 0.062 0.064 0.090 0.059 0.070 0.067 0.084*08 0.012 0.013 0.014 0.015 0.004 0.006 0.011 0.013 0.007*09 0.005 0.013 0.012 0.005 0.004 0.006 0.015 0.009 0.004*10 0.022 0.039 0.010 0.034 0.021 0.006 0.031 0.015 0.020*11 0.287 0.257 0.289 0.294 0.226 0.241 0.235 0.227 0.306*12 0.014 0.033 0.008 0.015 0.013 0.006 0.009 0.015 0.022*13 0.109 0.086 0.083 0.137 0.077 0.118 0.089 0.127 0.087*14 0.064 0.033 0.060 0.049 0.077 0.071 0.063 0.034 0.053*15 0.093 0.059 0.068 0.074 0.098 0.106 0.122 0.107 0.076*16 0.019 0.059 0.019 0.015 0.030 0.006 0.029 0.021 0.010
HLA, human leukocyte antigen.
Dim-1
0.05 0.08 0.11 0.14 0.18
Dim-2
-0.03
-0.02
0.00
0.02
0.03
ArmeniaAustria
Belgium
Bulgaria
C ez kRepublic
France
GermanyIran
ItalyPolandPortugal
Figure 3 Principal coordinates plot (two-dimensional representation), based on the Reynolds distances, showing the relationship between Armeniansand other populations according to high-resolution human leukocyte antigen (HLA)-A, HLA-B, and HLA-DRB1 allele frequency data.
five regions (t-test, P < 0.01), again suggesting no deviationfrom neutrality for HLA-B.
For HLA-DRB1 locus, significant signature of balancingselection was found only for Karabagh (marginal evidencewas noted for Yerevan and Syunik). Balancing selection onthe Karabakh HLA loci maintaining high allelic diversity isconsistent with the origin of the Karabakh population as mergeof ethnically distinct Armenians and Caucasian Albanians inancient history and, then, because of massive migration intothe region of Armenians from different regions during theinvasion of Seljuk Turks. Similarly, the Yerevan populationis also rich in diversity as a result of high level of migrationinto this capital from across Armenia, especially in recenttimes. Such high diversity of stable population might bereflected in increased allelic diversity of Yerevan HLA lociundergoing balancing selection. In contrast, the striking low
levels of allelic diversity values and their closeness with theexpected values under neutrality for Shirak HLA loci possiblyreflect the founders effect (relatively recent growth expansionfrom a small population) as this region has been populatedprimarily by a single, relatively small migration wave (seeIntroduction).
Concluding remarks
This study provides the first comprehensive investigation ofHLA–allele distribution in a subset of nine Armenian subpop-ulations and of the HLA–allele and haplotype frequencies athigh resolution combined with established and novel types ofpopulation genetic analysis. Regarding frequency of differentHLA alleles and their combination in the Armenian popula-tion in general, our study confirms on a large sample, and
28 © 2011 John Wiley & Sons A/S · Tissue Antigens 78, 21–30
L. Matevosyan et al. Armenian HLA alleles and haplotypes
Dim-10.00 0.09 0.18 0.27 0.36
Dim-2
-0.10
-0.02
0.05
0.13
0.20
Armenians
Cretans
Bulgarians
BasquesJewish-AshkinaziJewish-Non Ashkiz
Italians
Turkish
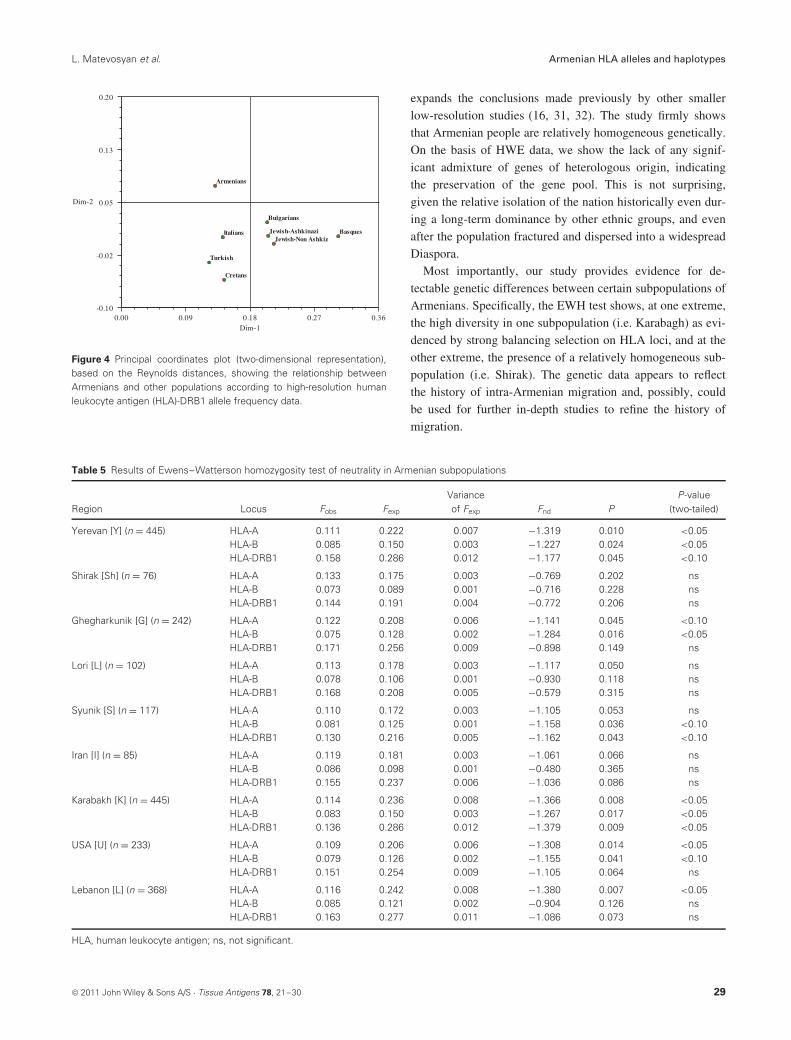
Figure 4 Principal coordinates plot (two-dimensional representation),based on the Reynolds distances, showing the relationship betweenArmenians and other populations according to high-resolution humanleukocyte antigen (HLA)-DRB1 allele frequency data.
expands the conclusions made previously by other smallerlow-resolution studies (16, 31, 32). The study firmly showsthat Armenian people are relatively homogeneous genetically.On the basis of HWE data, we show the lack of any signif-icant admixture of genes of heterologous origin, indicatingthe preservation of the gene pool. This is not surprising,given the relative isolation of the nation historically even dur-ing a long-term dominance by other ethnic groups, and evenafter the population fractured and dispersed into a widespreadDiaspora.
Most importantly, our study provides evidence for de-tectable genetic differences between certain subpopulations ofArmenians. Specifically, the EWH test shows, at one extreme,the high diversity in one subpopulation (i.e. Karabagh) as evi-denced by strong balancing selection on HLA loci, and at theother extreme, the presence of a relatively homogeneous sub-population (i.e. Shirak). The genetic data appears to reflectthe history of intra-Armenian migration and, possibly, couldbe used for further in-depth studies to refine the history ofmigration.
Table 5 Results of Ewens–Watterson homozygosity test of neutrality in Armenian subpopulations
Region Locus Fobs Fexp
Varianceof Fexp Fnd P
P-value(two-tailed)
Yerevan [Y] (n = 445) HLA-A 0.111 0.222 0.007 −1.319 0.010 <0.05HLA-B 0.085 0.150 0.003 −1.227 0.024 <0.05HLA-DRB1 0.158 0.286 0.012 −1.177 0.045 <0.10
Shirak [Sh] (n = 76) HLA-A 0.133 0.175 0.003 −0.769 0.202 nsHLA-B 0.073 0.089 0.001 −0.716 0.228 nsHLA-DRB1 0.144 0.191 0.004 −0.772 0.206 ns
Ghegharkunik [G] (n = 242) HLA-A 0.122 0.208 0.006 −1.141 0.045 <0.10HLA-B 0.075 0.128 0.002 −1.284 0.016 <0.05HLA-DRB1 0.171 0.256 0.009 −0.898 0.149 ns
Lori [L] (n = 102) HLA-A 0.113 0.178 0.003 −1.117 0.050 nsHLA-B 0.078 0.106 0.001 −0.930 0.118 nsHLA-DRB1 0.168 0.208 0.005 −0.579 0.315 ns
Syunik [S] (n = 117) HLA-A 0.110 0.172 0.003 −1.105 0.053 nsHLA-B 0.081 0.125 0.001 −1.158 0.036 <0.10HLA-DRB1 0.130 0.216 0.005 −1.162 0.043 <0.10
Iran [I] (n = 85) HLA-A 0.119 0.181 0.003 −1.061 0.066 nsHLA-B 0.086 0.098 0.001 −0.480 0.365 nsHLA-DRB1 0.155 0.237 0.006 −1.036 0.086 ns
Karabakh [K] (n = 445) HLA-A 0.114 0.236 0.008 −1.366 0.008 <0.05HLA-B 0.083 0.150 0.003 −1.267 0.017 <0.05HLA-DRB1 0.136 0.286 0.012 −1.379 0.009 <0.05
USA [U] (n = 233) HLA-A 0.109 0.206 0.006 −1.308 0.014 <0.05HLA-B 0.079 0.126 0.002 −1.155 0.041 <0.10HLA-DRB1 0.151 0.254 0.009 −1.105 0.064 ns
Lebanon [L] (n = 368) HLA-A 0.116 0.242 0.008 −1.380 0.007 <0.05HLA-B 0.085 0.121 0.002 −0.904 0.126 nsHLA-DRB1 0.163 0.277 0.011 −1.086 0.073 ns
HLA, human leukocyte antigen; ns, not significant.
© 2011 John Wiley & Sons A/S · Tissue Antigens 78, 21–30 29
Armenian HLA alleles and haplotypes L. Matevosyan et al.
Finally and most importantly, we expect that the currentdata would serve as a valuable reference for organ transplanta-tion and future HLA disease association studies in Armeniansin general and in the specific subpopulations, as well as ofArmenians in conjunction with other ethnic groups.
Conflict of interest
The authors have declared no conflicting interests.
References
1. Terasaki PI. Histocompatibility Testing. Copenhagen:Munksgaard, 1970.
2. Hewsen R. The Geography of Armenia. In: Hovanissian, RG.ed. The Armenian People from ancient to modern times,Vol. 1. New York: St. Martin’s Press, 1997, 1–18.
3. Russell J. The formation of the Armenian nation. In:Hovanissian, RG. ed. The Armenian People from ancient tomodern times, Vol. 1, New York: St. Martin’s Press, 1997,19–35.
4. Garsoian N. The emergence of Armenia. In: Hovanissian, RG.ed. The Armenian People from ancient to modern times,Vol. 1, New York: St. Martin’s Press, 1997, 36–62.
5. Garsoian N. The Arsakuni Dynasty. In: Hovanissian, RG. ed.The Armenian People from ancient to modern times, Vol. 1,New York: St. Martin’s Press, 1997, 63–94.
6. Excoffier L, Laval G, Schneider S. Arlequin (Version 3.0): andintegrated software package for population genetics dataanalysis. Evol Bioinform Online 2005: 1: 47–50.
7. Sanchez-Mazas A. HLA data analysis in anthropology: basis,theory and practice. 16th European HistocompatibilityConference, Strasbourg, March 19–22, 2002.
8. Reynolds J, Weir BS, Cockerham CC. Estimation forcoancestry coefficient: basis for a short term genetic distance.Genetics 1983: 105: 767–79.
9. Middleton D, Menchaca L, Rood H, Komerofsky R. Newallele frequency database: http://www.allelefrequencies.net.Tissue Antigens 2003: 61: 403–7.
10. Lancaster A, Nelson MP, Single RM, Meyer D, Thomson G.PyPop: a software framework for population genomics:analyzing large-scale multi-locus genotype data. In: AltmanRB, Dunker AK, Hunter L, Jung TA, Klien TE, eds. PacificSymposium on Biocomputing, Vol. 8. Singapore: WorldScientific, 2003, 514–25.
11. Ewens WJ. The sampling theory of selectively neutral alleles.Theor Popul Biol 1972: 3: 87–112.
12. Watterson GA. The homozygosity test of neutrality. Genetics1978: 88: 405–17.
13. Slatkin M. An exact test for neutrality based on the Ewenssampling distribution. Genet Res 1994: 64: 71–4.
14. Slatkin M. A correction to the exact test based on the Ewenssampling distribution. Genet Res 1996: 68: 259–60.
15. Salamon H, Klitz W, Easteal S et al. Evolution of HLA classII molecules: allelic and amino acid site variability acrosspopulations. Genetics 1999: 152: 393–400.
16. Alexeev LP, Patranji G. HLA in eight ethnic groups from theformer USSR. Proceedings of the Eleventh InternationalHistocompatibility Workshop and Conference, Yokohoma,
Japan, vol. 1, 1991, Oxford Science Publications. Vol. 1. 1991,666–7.
17. Imanishi T, Akaza T, Kimura A, Tokunaga K, Gojobori T.Allele and haplotype frequencies for HLA and complementloci in various ethnic groups. In: Tsuji K, Aizawa M,Sasazuki T, eds. HLA 1991. Oxford: Oxford University Press,1992, 1065–220.
18. Cavalli-Sforza LL, Menozzi P, Piazza A. The History andGeography of Human Genes. Princeton: Princeton UniversityPress, 1994.
19. Ivanova M, Rozemuller E, Tyufekchiev N, Michailova A,Tilanus A, Naumova E. HLA polymorphism in Bulgariansdefined by high resolution typing methods in comparison withother populations. Tissue Antigens 2002: 60: 496–504.
20. Ivanova M, Spassova P, Michailova A, Naumova E.Distributions of HLA class I alleles and haplotypes inBulgarians – contribution to understanding the origin of thepopulation. Tissue Antigens 2001: 57: 208–15.
21. Testi M, Mariani M. HLA-A, -B, -Cw, -DPB1, -DQA1,-DQB1 and DRB1 allele frequencies in a population fromRome, Italy. Hum Immunol 2004: 65: 987–91.
22. Sanchez-Velasco P, Leyva-Cobian F. The HLA class I andclass II allele frequencies studied at the DNA level in theSvanetian population (Upper Caucasus) and their relationshipsto Western European populations. Tissue Antigens 2001: 58:223–33.
23. Arnaiz-Villena A, Karin M, Bendikuze N et al. HLA allelesand haplotypes in the Turkish population: relatedness to Kurds,Armenians and other Mediterraneans. Tissue Antigens 2001:57: 308–17.
24. Martinez Laso J, Gazit E, Gomez-Casado E et al. HLA-DQA1,-DQB1 and – DRB1 Alleles in Ashkenazi Jews from Israel.Hum Immunol 2004: 65: 972.
25. Moscoso J, Crawford MH, Vicario JL et al. HLA genes ofAleutian Islanders living between Alaska (USA) andKamchaka (Russia) suggest a possible southern Siberia origin.Mol Immunol 2008: 45: 1018–102.
26. Arnaiz-Villena A, Reguera R, Ferri A et al. The peopling ofMadeira Archipelago (Portugal) according to HLA genes. IntJ Immunogenet 2008: 36: 9–14.
27. Martinez Laso J, Gazit E, Gomez-Casado E et al. HLA-DQA,-DQB and – DRB1 Alleles in a non-Ashkenazi populationfrom Israel. Hum Immunol 2004: 65: 972–3.
28. Saruhan-Direskeneli C, Ugar FA. HLA-A, -B, -Cw, -DQA1,-DQB1 and DRB1 allele frequencies in a population fromTurkey. Hum Immunol 2004: 65: 1183–5.
29. Musabak U, llikci Sagkan R, Misiroglu H et al. Regionaldistribution of HLA antigens in Turkey. Tissue Antigens 2009:73: 473. (P152)
30. Arnaiz-Villena A, Iliakis P, Gonzalez-Hevilla Met al. Theorigin of Cretan population as determined by characterizationof HLA alleles. Tissue Antigens 1999: 53: 213–26.
31. Bonne-Tamir B, Bodmer JG, Young D, Ashbel S. HLApolymorphism in Israel. 8. The Armenian community inJerusalem. Tissue Antigens 1978: 11: 230–4.
32. Nersisian VM, Martirosian IG. Frequency of gene andhaplotype occurrence of HLA system A and B loci inArmenians. Probl Gematol Pereliv Krovi 1982: 27: 31–3(in Russian).
30 © 2011 John Wiley & Sons A/S · Tissue Antigens 78, 21–30