Video sensor network for real-time traffic monitoring and surveillance
Upload
khangminh22Category
view
2download
0
Computer and Information Science; Vol. 13, No. 3; 2020
ISSN 1913-8989 E-ISSN 1913-8997
Published by Canadian Center of Science and Education
1
Traffic Analysis of a Congested and Uncongested Network in a
Sequential Server Model
Afsana Ahamed1, Hamid Vakilzadian2
1 Department of Electrical Engineering, Arkansas Tech University, USA
2 Department of Electrical and Computer Engineering, University of Nebraska-Lincoln, USA
Correspondence: Afsana Ahamed, Department of Electrical Engineering, Arkansas Tech University, USA.
Received: January 13, 2020 Accepted: June 1, 2020 Online Published: June 8, 2020
doi:10.5539/cis.v13n3p1 URL: https://doi.org/10.5539/cis.v13n3p1
Abstract
The efficient flow of messages in a communication network is crucial in today’s dynamic environment. These
networks are designed to transmit messages in the shortest amount of time. The source sends the messages to the
destination through single or multiple servers. Each server contains a buffer that queues the incoming messages
when it is busy. This study analyzed the traffic behavior of uncongested and congested wired communication
networks for limited and unlimited queue sizes in multiserver configurations with a sequential server model. The
performance of the network was measured using three cases: varying the packet length, adding an extra link, and
with a broken link connecting the two servers. The performance of the wired communication networks for these
three cases was measured based on packet drop rate, throughput, and average end-to-end delay using the
OMNeT++ network simulator. Limited and unlimited queue sizes for a sequential server in the network were
implemented and simulated to measure the interarrival rate and packet length for optimum performance. For
various interarrival rates, the optimum throughput was measured for different queue sizes. The performance with a
broken link or the addition of an extra link was assessed and compared with the sequential server model.
Keywords: traffic analysis, congested network, uncongested network, communication network, sequential server,
end-to-end delay, queuing model, throughput, packet drop rate
1. Introduction
The effective, efficient transfer of information requires a quite complex computer communication network with
communication infrastructure. This communication infrastructure is invisible to the end user and must be designed
and function properly based on user demand. Communication network infrastructure supports high-speed
transport mechanisms, such as Ethernet, Wi-Fi®, routers, etc. It provides advanced technology for a conference
meeting, live chats, online games, live television/data streaming, and much more. Due to the demand for more
bandwidth and increasing customer needs, current research is concentrated on the design and management of
high-performance networks, where design and management decisions are made to reduce congestion and to better
manage network resources. Analytical techniques, empirical methodologies, computer simulation, projections
based on experience, and experiments are used to evaluate network performance and compare it to other existing
state-of-the-art techniques. Design, evolution, and management decisions are made using information on
imminent user demand or on the basis of independent predictions in order to develop a system correctly in the
shortest amount of time possible.
Congestion in a communcation network degrades the quality of service (QoS), resulting in longer delays, loss of
data, and prevention of new incoming data messages (Hemlata & V.K. Pandey, 2015). In a communication
network, the transmission medium can be wired (such as Ethernet cable or optical fiber) or wireless. This medium
allows messages or packets to be transmitted between source nodes (or servers) and destination nodes (or servers).
The size of the messages varies from bytes to megabytes or gigabytes. To analyze the traffic behavior of these
communication networks, different performance parameters are considered, such as packet drop rate, throughput,
average end-to-end (E2E) delay, network utilization, and cost. A communication network is said to be in a
congested state when the data rate of incoming messages or packets is beyond the capacity of the server. A network
can be said to be in an uncongested state when the data rate is lower than the capacity of the servers (Sztrik, 2012).
In order to predict the performance of present and future communication networks for resource management,
http://cis.ccsenet.org Computer and Information Science Vol. 13, No. 3; 2020
2
various probabilistic models are used. Among them, the network of queues is most important. A study by C. Sutton
et al. (Sutton & Jordan, 2010) combined queueing network models and graphical models to evaluate the
performance of communication servers. They used a Markov chain with a Monte Carlo simulation for the
prediction of congestion. V. Bhaskar et al. (Bhaskar & Lallement, 2010) used a network of queues for developing
and analyzing the behavior of a supply chain model. Their queuing models helped to decide the average number of
products that can be delivered with a minimum response time. They determined the optimum capacity of the
queuing network using the least response time. They determined different performance measures, such as average
queue lengths, average wait time in the queue, response time, and steady-state probabilities for the network.
However, they did not analyze the performance of the queuing network in terms of packet drop rate, throughput, or
average end-to-end delay.
Z. Huang (Huang, 2010) developed a simulator that can be run on a parallel computer to find the network’s scale
invariants and demonstrated that network congestion (dynamical property) depends on network connectivity
(topological property). He found that there is an onset relationship between network congestion and network
topology. However, Huang’s results need to be evaluated for general topologies with different traffic conditions.
Mazraani et al. (Mazraani & Parulkar, 1992) analyzed the behavior of an Ethernet channel in terms of bursty traffic
with peak bandwidth, average bandwidth, and burst factor. Their study, however, did not include a critical analysis
of system capacity, packet capacity, or interarrival rates. Kadir (Kadir, 2015) modeled the different random entities
in an M/M/1 queue model using the MATLAB® simulator to find the similarity with theoretical assumptions. He
found that the M/M/1 model exactly predicted the distribution relations that are assumed in theoretical derivations.
However, network performance metrics were not investigated in terms of various performance parameters, such as
queue length, throughput, and interarrival rate. Atefi et al. (Atefi, Yahya, Rezaei, & Erfanian, 2016) evaluated the
M/M/1 queue model in a local area network (LAN). They used Poisson and exponential distributions and
compared the traffic behavior of these distributions in terms of some performance metrics, such as average E2E
delay, throughput, utilization, and network load. Their results were consistent with the mathematical relations of
the M/M/1 queue in a LAN. However, the throughput, as well as network utilization and cost, was not analyzed in
terms of interarrival rate and queue size.
Mabayoje et al. (Mabayoje, Ameen, Abikoye, Muhammed, & Olabiyisi, 2011) established an effective, fair
queuing model which was capable of decreasing network congestion by allocating network resources among the
users. Their proposed model allocated higher priority to real-time applications and achieved better performance
parameters, such as throughput and delay. However, the other performance metrics, such as network utilization and
packet drop rate, for example, were not examined.
The aforementioned studies did not focus on traffic analysis based on packet length and queue size and with burst
traffic packet loss due to the collision, packet delay, and queue size increases (Frost & Melamed, 1994). Simulation
of a small network can help the network analyst to understand the behavior of a large computer network, such as
the whole Internet, and to distribute the network resources accordingly on the basis of user demand. The objective
of this study was to observe the behavior and the performance characteristics of uncongested and congested data
communication queuing models with respect to interarrival rate, queue size, and packet length for optimum
throughput. In addition, the impact on network performance of adding or removing a link was investigated. Section
2 is a discussion of communication networks and networks of queues. In Section 3, the experimental setup is
introduced, followed by simulation steps to implement, modify, and experiment with the queueing models. In
Section 4, simulation results of the traffic behaviors of congested and uncongested sequential communication
networks are presented, followed by conclusions in Section 5.
2. Communication Networks and Queueing Models
Computer networks consist of network servers and transmission medium to share data and resources among the
nodes that originate, route, and terminate data packets or messages. Simulation of communication networks
involves executing a set of tasks simultaneously. These tasks include generation and transmission of packets and
queueing them with various queue theories with interarrival-rate and service-rate probabilities. A real-time
simulator is required to investigate the real-time traffic scenarios in a communication network. For this purpose,
different models were developed in OMNeT+ (Varga, OMNeT++, 2001).
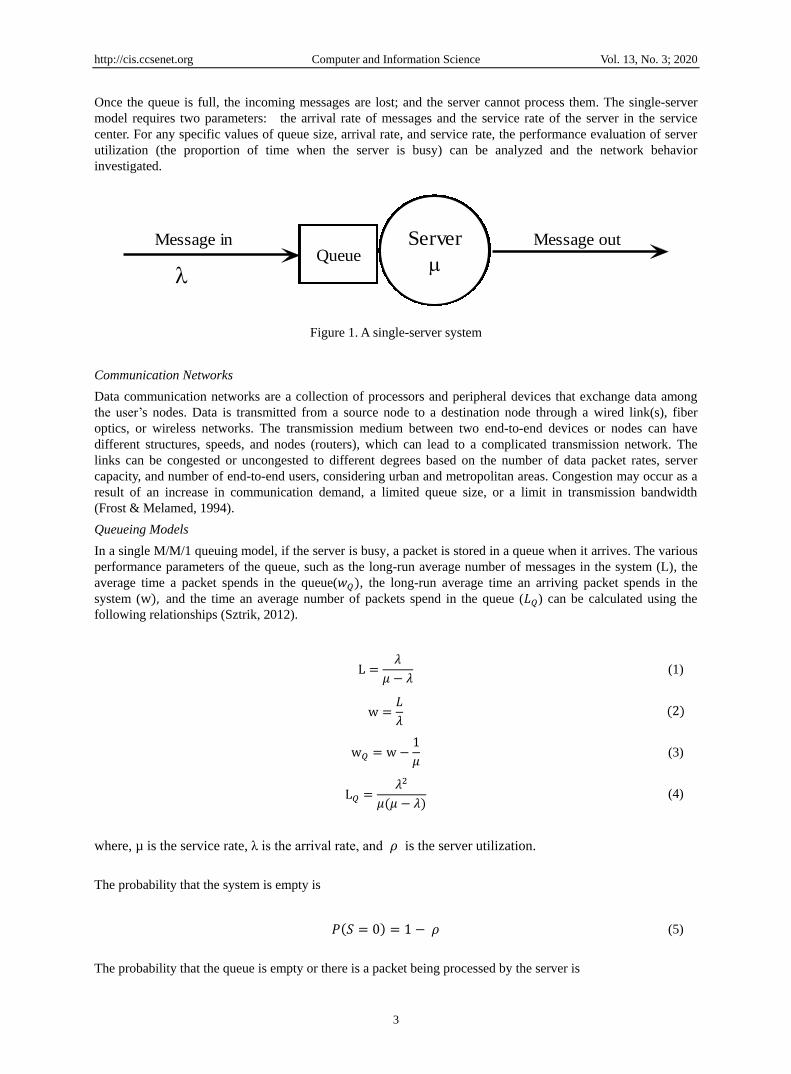
Figure 1 demonstrates a service center with a single server model. When a message arrives at the service center,
the server processes the message immediately if the server is free, provided that no messages are waiting in the
server. If the server is busy, then the incoming messages are stored in a queue. Those messages wait in the queue
until the server becomes available. When the server is available, the message is removed from the queue,
processed by the server, and then sent out. The size of the queue depends on the capacity of the service center.
http://cis.ccsenet.org Computer and Information Science Vol. 13, No. 3; 2020
3
Once the queue is full, the incoming messages are lost; and the server cannot process them. The single-server
model requires two parameters: the arrival rate of messages and the service rate of the server in the service
center. For any specific values of queue size, arrival rate, and service rate, the performance evaluation of server
utilization (the proportion of time when the server is busy) can be analyzed and the network behavior
investigated.
Figure 1. A single-server system
Communication Networks
Data communication networks are a collection of processors and peripheral devices that exchange data among
the user’s nodes. Data is transmitted from a source node to a destination node through a wired link(s), fiber
optics, or wireless networks. The transmission medium between two end-to-end devices or nodes can have
different structures, speeds, and nodes (routers), which can lead to a complicated transmission network. The
links can be congested or uncongested to different degrees based on the number of data packet rates, server
capacity, and number of end-to-end users, considering urban and metropolitan areas. Congestion may occur as a
result of an increase in communication demand, a limited queue size, or a limit in transmission bandwidth
(Frost & Melamed, 1994).
Queueing Models
In a single M/M/1 queuing model, if the server is busy, a packet is stored in a queue when it arrives. The various
performance parameters of the queue, such as the long-run average number of messages in the system (L), the
average time a packet spends in the queue( , the long-run average time an arriving packet spends in the
system ( and the time an average number of packets spend in the queue ( ) can be calculated using the
following relationships (Sztrik, 2012).
(1)
(3)
(4)
where, µ is the service rate, λ is the arrival rate, and 𝜌 is the server utilization.
The probability that the system is empty is
𝑃 𝑆 0 𝜌 (5)
The probability that the queue is empty or there is a packet being processed by the server is
QueueServer
Message in Message out
http://cis.ccsenet.org Computer and Information Science Vol. 13, No. 3; 2020
4
𝑃 𝑄 0 𝜌 + 𝜌 𝜌 = 𝜌 (6)
The probability that there are more than N packets in the system is
𝑃 𝑆 > 𝑁 ∑ 𝜌 𝜌𝑖𝑁𝑖=0 =𝜌𝑁 (7)
The abovementioned relationship provides insight into network performance in terms of network utilization
and the probabilistic nature of arrival and service rates. When sequential servers and the network topology
are included, they are not able to provide the perception of a complex communication network. Therefore,
the relationships are applicable only for single-server model cases and will not work with a sequential
server or more complex cases, such as the ones in computer communication networks.
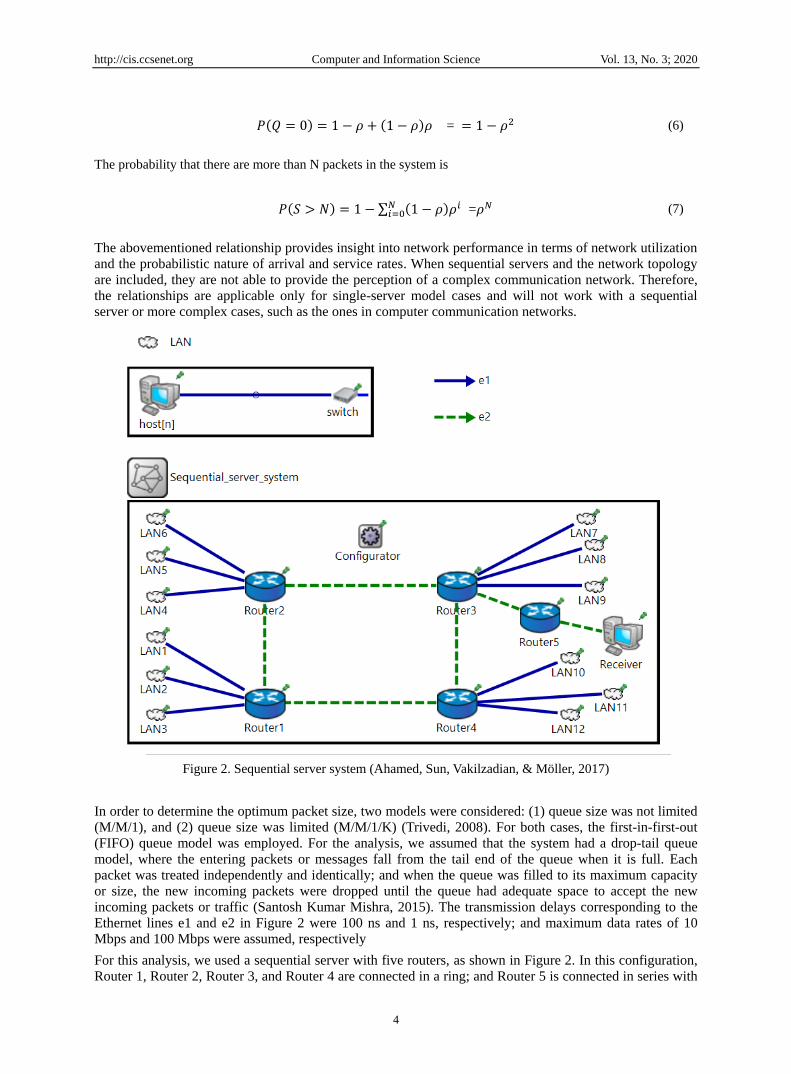
Figure 2. Sequential server system (Ahamed, Sun, Vakilzadian, & Möller, 2017)
In order to determine the optimum packet size, two models were considered: (1) queue size was not limited
(M/M/1), and (2) queue size was limited (M/M/1/K) (Trivedi, 2008). For both cases, the first-in-first-out
(FIFO) queue model was employed. For the analysis, we assumed that the system had a drop-tail queue
model, where the entering packets or messages fall from the tail end of the queue when it is full. Each
packet was treated independently and identically; and when the queue was filled to its maximum capacity
or size, the new incoming packets were dropped until the queue had adequate space to accept the new
incoming packets or traffic (Santosh Kumar Mishra, 2015). The transmission delays corresponding to the
Ethernet lines e1 and e2 in Figure 2 were 100 ns and 1 ns, respectively; and maximum data rates of 10
Mbps and 100 Mbps were assumed, respectively
For this analysis, we used a sequential server with five routers, as shown in Figure 2. In this configuration,
Router 1, Router 2, Router 3, and Router 4 are connected in a ring; and Router 5 is connected in series with
http://cis.ccsenet.org Computer and Information Science Vol. 13, No. 3; 2020
5
Router3. Each LAN consists of two hosts connected with a parallel Ethernet switch, shown in Figure 2.
Therefore, in this setup, the sequential server model has 24 hosts and 1 receiver that are connected in a star
topology. Three different options for analyzing congested and uncongested sequential server topology were
considered:
a. Varying packet length
b. Adding an extra link between two routers
c. Removing a link between two routers
For these items, it was assumed that the interarrival rate followed the exponential distribution or uniform
distribution and that the service rate followed the Poisson distribution.
In addition, two different alternatives were considered (limited and unlimited queue sizes) for items (a-c)
above. The FIFO queue discipline was used for both; and the server had a drop-tail queue model. Two
different types of transmission lines were used in this study, including Ethernet 10Base-T, with a processing
speed of 10 Mbps, and Ethernet 100Base-T, with a processing speed of 100 Mbps (Nikkel, 1997). The
service rate, µ, was assumed to be 1220.703 packets per sec and 12207.03 packets per sec with a packet
size of 1024 bytes. OMNeT++ (Varga, OMNeT++, 2001) was used in this simulation because it is a public
source, flexible, model-based, open architecture simulation environment with powerful graphical user
interface support with an embedded simulation kernel.
3. Results and Analysis
Case (a): Sequential server models with varying packet length
For the sequential server model in Figure 2, the packet drop rate, average E2E delay, and throughput were
studied using exponential distribution for λ. Both unlimited queue size and queue sizes with 5, 10, and 50
packets with a packet interarrival rate, λ, of 500 packets per sec were used.
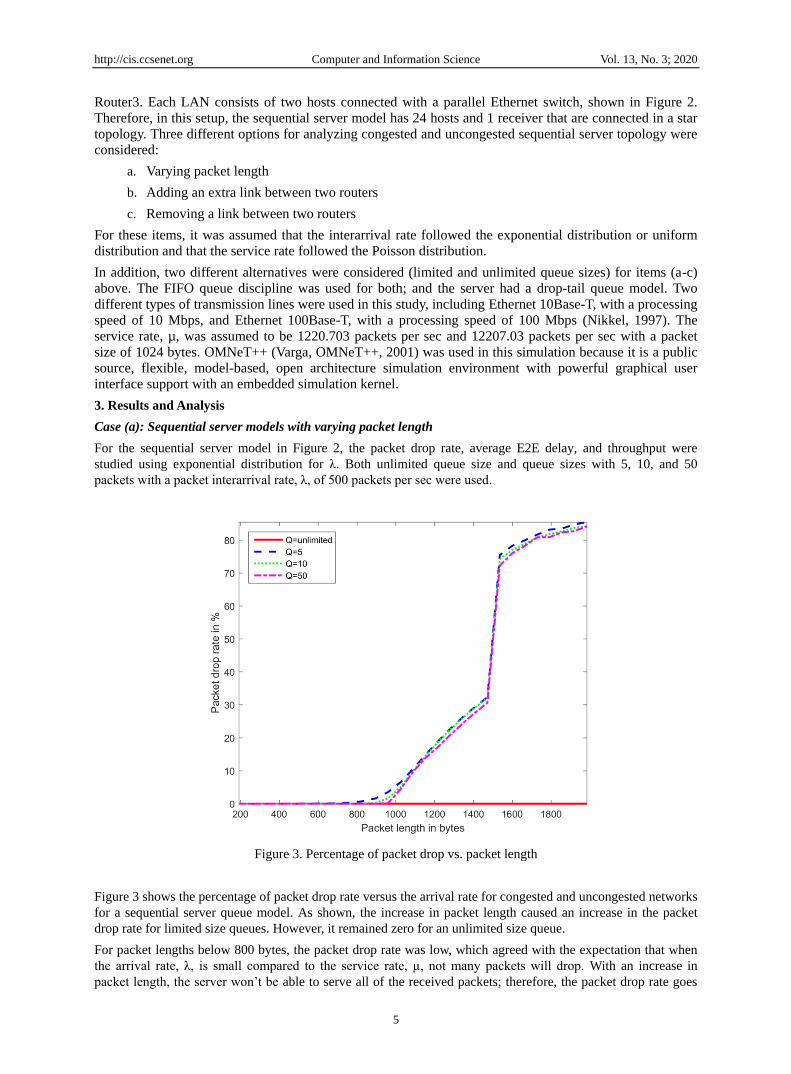
Figure 3. Percentage of packet drop vs. packet length
Figure 3 shows the percentage of packet drop rate versus the arrival rate for congested and uncongested networks
for a sequential server queue model. As shown, the increase in packet length caused an increase in the packet
drop rate for limited size queues. However, it remained zero for an unlimited size queue.
For packet lengths below 800 bytes, the packet drop rate was low, which agreed with the expectation that when
the arrival rate, λ, is small compared to the service rate, µ, not many packets will drop. With an increase in
packet length, the server won’t be able to serve all of the received packets; therefore, the packet drop rate goes
http://cis.ccsenet.org Computer and Information Science Vol. 13, No. 3; 2020
6
up. The packet drop rates remained almost the same for limited queue sizes of 5, 10, and 50 packets when λ > µ.
Moreover, the network became congested when the packet length was greater than 256 bytes (from the
numerical simulation results) with λ = 500 packets per sec. As shown in Figure 3, there was a sharp rise in the
drop rate after a packet length of 1472 bytes. This is because the switch and Router 3 had lower service rates
compared to the interarrival rate; and server utilization, ρ, was larger than 21, as shown in Tables 1 and 2 for the
switch and Router 3, respectively.
Table I. Utilization of the switch
Service Rate, µ
(Mbps)
Packet Size
(Bytes)
Arrival rate, λ
(Packets per Sec)
Number of
Hosts, n Server Utilization, ρ
10 1472 500 2 1.17760
10 1472 550 2 1.29536
10 1536 500 2 1.22880
10 1536 550 2 1.35168
Table II. Utilization of Router 3
Service Rate, µ
(Mbps)
Packet Size
(Bytes)
Arrival Rate, λ
(Packets per Sec)
Number of
hosts, n Utilization, ρ
100 1472 500 24 1.4131
100 1472 550 24 1.5544
100 1536 500 24 1.4746
100 1536 550 24 1.6220
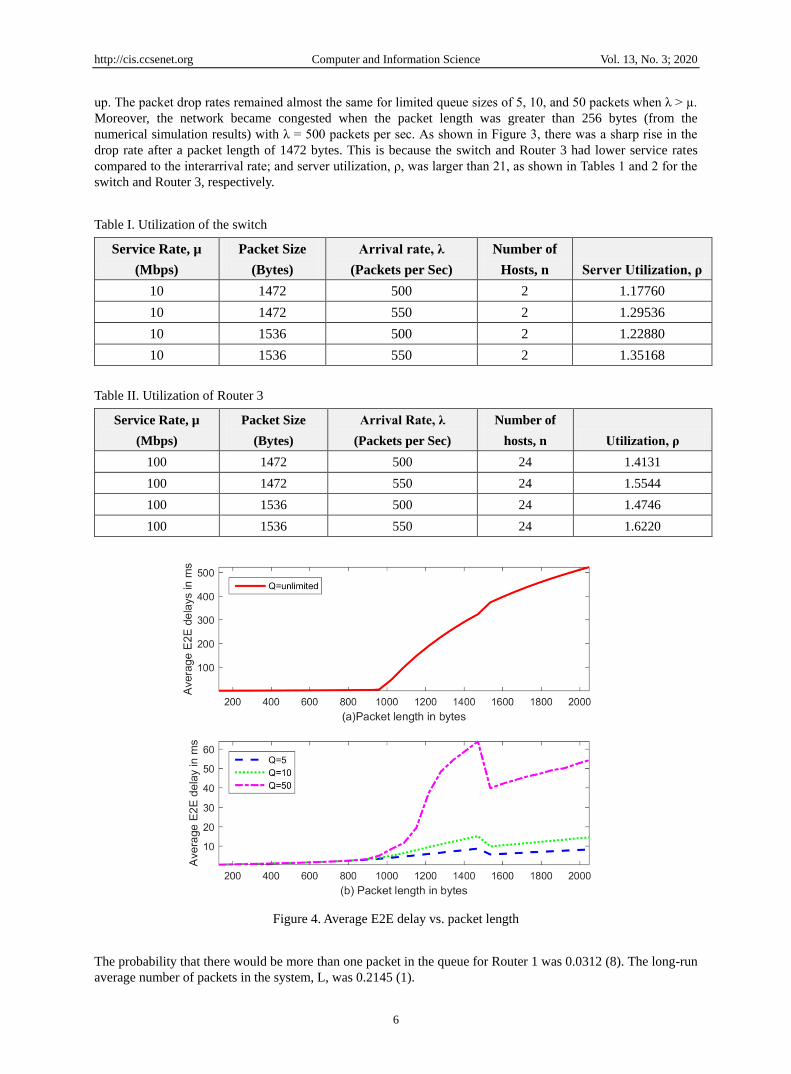
Figure 4. Average E2E delay vs. packet length
The probability that there would be more than one packet in the queue for Router 1 was 0.0312 (8). The long-run
average number of packets in the system, L, was 0.2145 (1).
http://cis.ccsenet.org Computer and Information Science Vol. 13, No. 3; 2020
7
Figure 4 shows the average E2E delay versus the packet length with λ = 500 packets per sec. The delay increased
as the packet length increased. The delay in an unlimited queue was higher compared to the average end-to-end
delay in a limited queue size model case. In an unlimited queue size model, more packets waited in the queue for
processing, which increased the queueing delay and led to an increase in the average E2E delay.
For a packet length of 1024 bytes, the average increase in E2E delay was 25.3% when the capacity of the queue
changed from 5 to 10 packets and 115.4% when the queue size changed from 5 to 50. It was observed that there
was a sharp drop in average E2E delays after the packet length = 1472 packets since the switch and router
dropped most of the packets. As a result, the average wait time in the queue decreased.
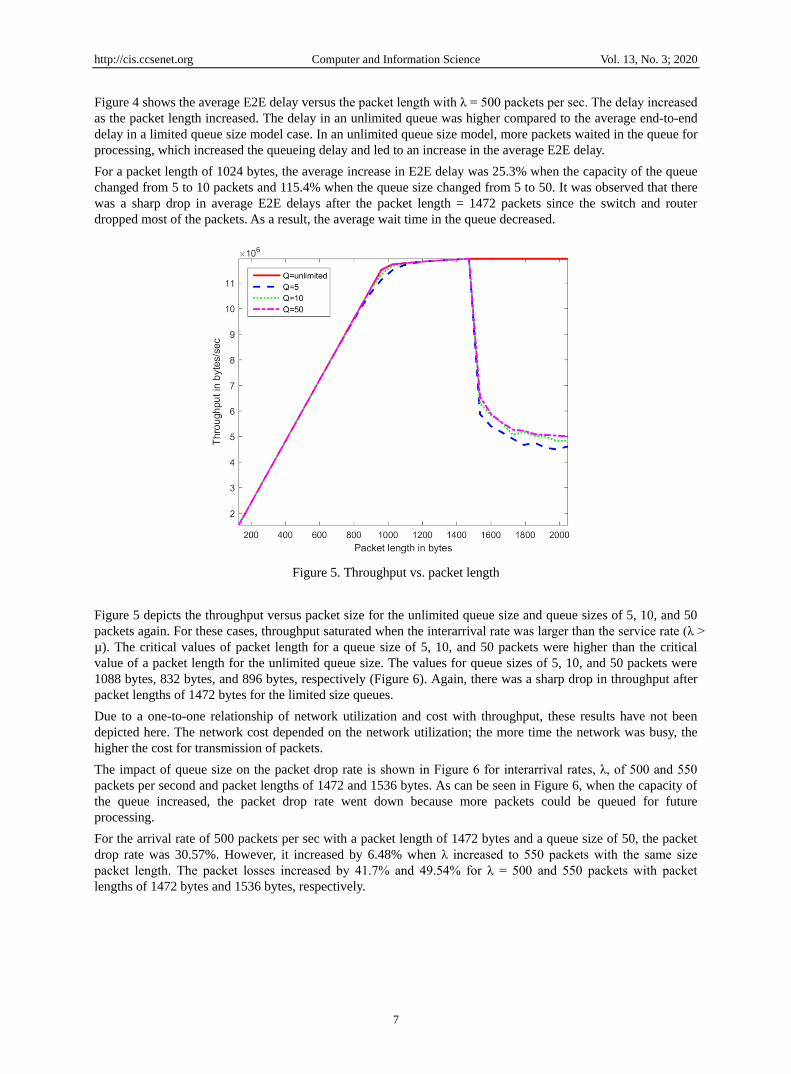
Figure 5. Throughput vs. packet length
Figure 5 depicts the throughput versus packet size for the unlimited queue size and queue sizes of 5, 10, and 50
packets again. For these cases, throughput saturated when the interarrival rate was larger than the service rate (λ >
µ). The critical values of packet length for a queue size of 5, 10, and 50 packets were higher than the critical
value of a packet length for the unlimited queue size. The values for queue sizes of 5, 10, and 50 packets were
1088 bytes, 832 bytes, and 896 bytes, respectively (Figure 6). Again, there was a sharp drop in throughput after
packet lengths of 1472 bytes for the limited size queues.
Due to a one-to-one relationship of network utilization and cost with throughput, these results have not been
depicted here. The network cost depended on the network utilization; the more time the network was busy, the
higher the cost for transmission of packets.
The impact of queue size on the packet drop rate is shown in Figure 6 for interarrival rates, λ, of 500 and 550
packets per second and packet lengths of 1472 and 1536 bytes. As can be seen in Figure 6, when the capacity of
the queue increased, the packet drop rate went down because more packets could be queued for future
processing.
For the arrival rate of 500 packets per sec with a packet length of 1472 bytes and a queue size of 50, the packet
drop rate was 30.57%. However, it increased by 6.48% when λ increased to 550 packets with the same size
packet length. The packet losses increased by 41.7% and 49.54% for λ = 500 and 550 packets with packet
lengths of 1472 bytes and 1536 bytes, respectively.

http://cis.ccsenet.org Computer and Information Science Vol. 13, No. 3; 2020
8
Figure 6. Percentage of packet drop vs. queue size
Figure 7. Average E2E delay vs. queue size
http://cis.ccsenet.org Computer and Information Science Vol. 13, No. 3; 2020
9
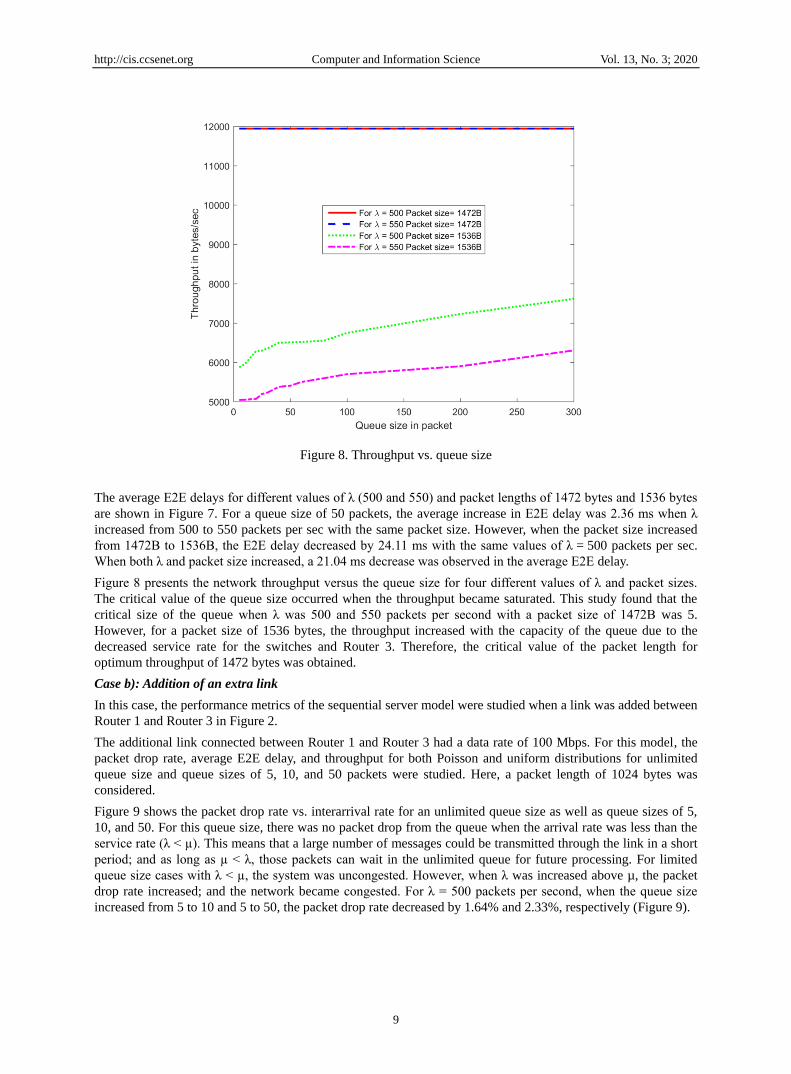
Figure 8. Throughput vs. queue size
The average E2E delays for different values of λ (500 and 550) and packet lengths of 1472 bytes and 1536 bytes
are shown in Figure 7. For a queue size of 50 packets, the average increase in E2E delay was 2.36 ms when λ
increased from 500 to 550 packets per sec with the same packet size. However, when the packet size increased
from 1472B to 1536B, the E2E delay decreased by 24.11 ms with the same values of λ = 500 packets per sec.
When both λ and packet size increased, a 21.04 ms decrease was observed in the average E2E delay.
Figure 8 presents the network throughput versus the queue size for four different values of λ and packet sizes.
The critical value of the queue size occurred when the throughput became saturated. This study found that the
critical size of the queue when λ was 500 and 550 packets per second with a packet size of 1472B was 5.
However, for a packet size of 1536 bytes, the throughput increased with the capacity of the queue due to the
decreased service rate for the switches and Router 3. Therefore, the critical value of the packet length for
optimum throughput of 1472 bytes was obtained.
Case b): Addition of an extra link
In this case, the performance metrics of the sequential server model were studied when a link was added between
Router 1 and Router 3 in Figure 2.
The additional link connected between Router 1 and Router 3 had a data rate of 100 Mbps. For this model, the
packet drop rate, average E2E delay, and throughput for both Poisson and uniform distributions for unlimited
queue size and queue sizes of 5, 10, and 50 packets were studied. Here, a packet length of 1024 bytes was
considered.
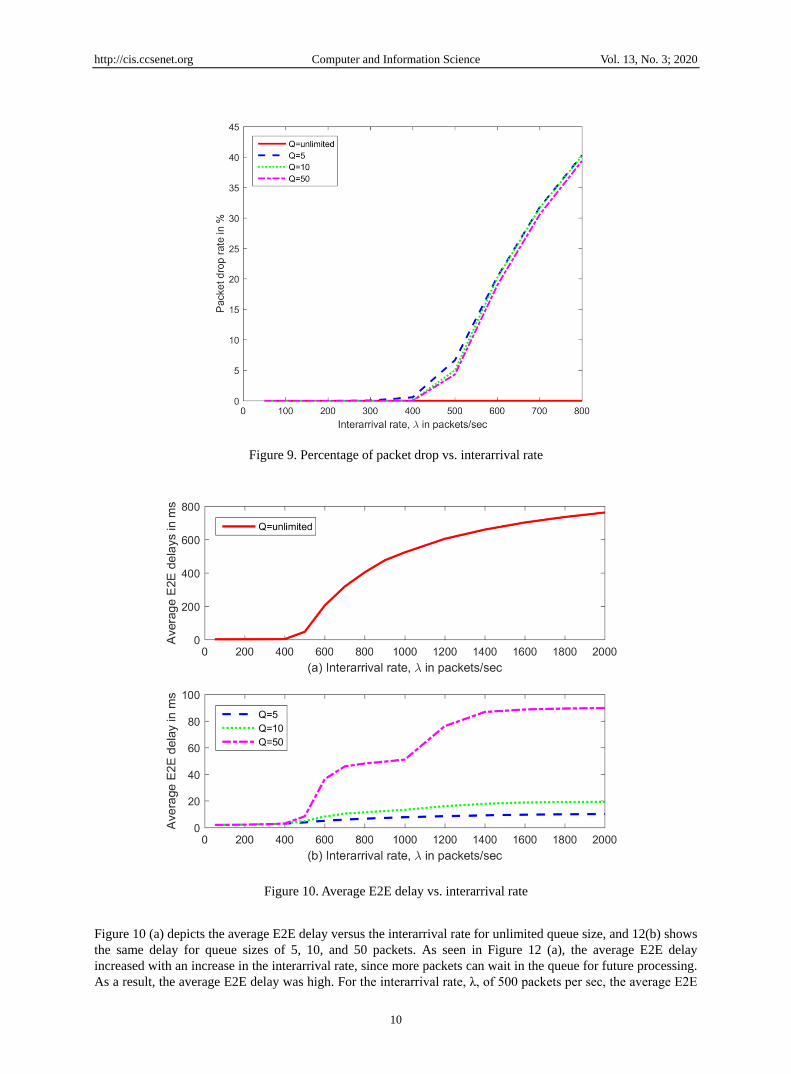
Figure 9 shows the packet drop rate vs. interarrival rate for an unlimited queue size as well as queue sizes of 5,
10, and 50. For this queue size, there was no packet drop from the queue when the arrival rate was less than the
service rate (λ < µ). This means that a large number of messages could be transmitted through the link in a short
period; and as long as µ < λ, those packets can wait in the unlimited queue for future processing. For limited
queue size cases with λ < µ, the system was uncongested. However, when λ was increased above µ, the packet
drop rate increased; and the network became congested. For λ = 500 packets per second, when the queue size
increased from 5 to 10 and 5 to 50, the packet drop rate decreased by 1.64% and 2.33%, respectively (Figure 9).
http://cis.ccsenet.org Computer and Information Science Vol. 13, No. 3; 2020
10
Figure 9. Percentage of packet drop vs. interarrival rate
Figure 10. Average E2E delay vs. interarrival rate
Figure 10 (a) depicts the average E2E delay versus the interarrival rate for unlimited queue size, and 12(b) shows
the same delay for queue sizes of 5, 10, and 50 packets. As seen in Figure 12 (a), the average E2E delay
increased with an increase in the interarrival rate, since more packets can wait in the queue for future processing.
As a result, the average E2E delay was high. For the interarrival rate, λ, of 500 packets per sec, the average E2E

http://cis.ccsenet.org Computer and Information Science Vol. 13, No. 3; 2020
11
delay increase was 26.23% and 116.5%, when the capacity of the queue changed from 5 to 10 and 5 to 50
packets, respectively.
Figure 11. Throughput vs. interarrival rate
Figure 11 represents the throughput versus interarrival rate. For all four cases, the throughput increased linearly
with λ when λ < 500; and it became saturated when λ > µ, which happened when the service rate, µ, went above
588 packets/sec. The network utilization and network cost for the sequential server system had similar results.
Figure 12. Packet drop rate in % vs. queue size

http://cis.ccsenet.org Computer and Information Science Vol. 13, No. 3; 2020
12
Figure 13. Average E2E delay vs. queue size
Figure 12 shows the change in packet drop rates vs. the queue size for the sequential model for the packet arrival
rates of 500 and 550 per second and packet size of 1024 bytes. In this case, the packet drop rate decreased as the
queue size increased. For a queue size of 50, the packet drop rate decreased by 8.5% when λ increased from 500
to 550 packets/sec. The average E2E delays for two different values of λ are provided in Figure 13. Here, the
average E2E delays increased with the increase in queue size. For a queue size of 50, the average E2E delay
increased by 8.5 ms with an increase in λ from 500 to 550 packets per sec.
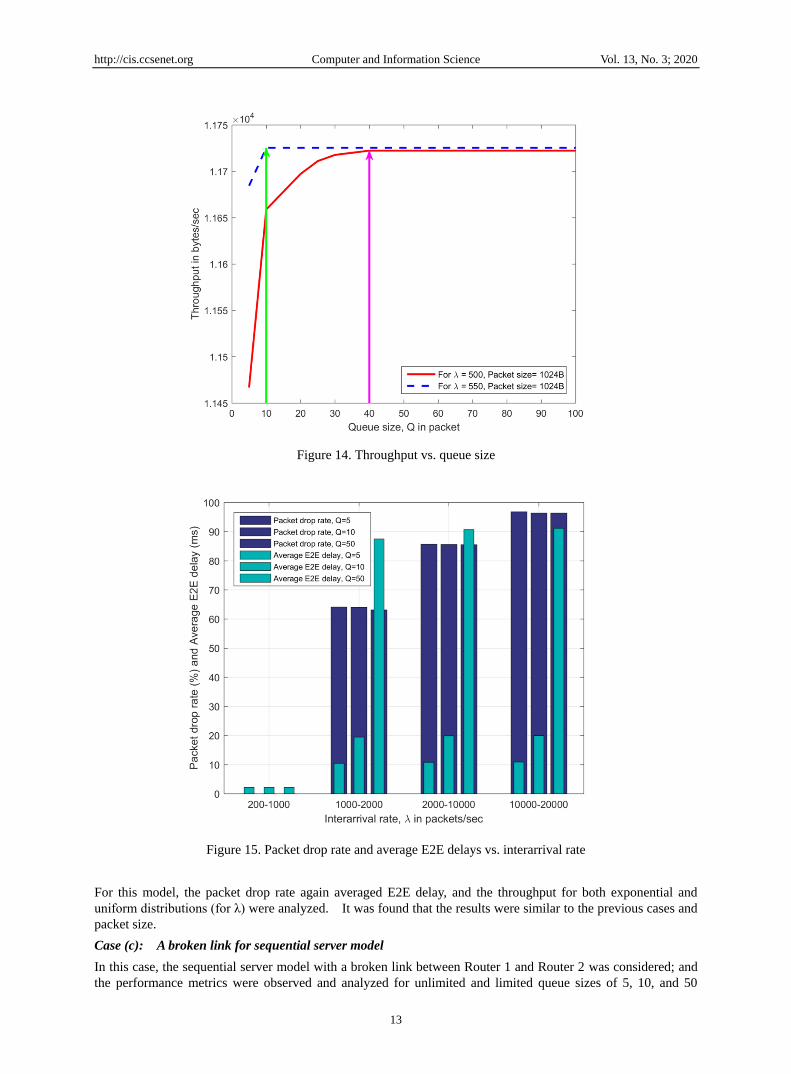
Figure 14 shows throughput vs. queue size for λ of 500 and 550 packets/sec. The throughput became saturated
when queue capacities were above 10 and 40 for interarrival rates of 500 and 550, respectively. Saturation
occurred since the drop rate depended only on the service rate. Since the overall service rate (588 packets/sec
from Figure 13) of this sequential server was greater than 500, saturation occurred early when λ was 500, as
compared to λ = 550.
In the second part of Case (b), this model, when λ followed the uniform distribution, was analyzed. Here, cases
similar to Poisson distribution were considered (unlimited queue and queues sizes of 5, 10, and 50 packets). The
results for unlimited queue size are shown in Table III. The packet drop rate for unlimited queue size for all of
the interarrival rates was zero. However, the system had a high average delay. In Figure 15, the packet drop rate
and average E2E delays vs. interarrival rate are depicted for queue sizes of 5,10, and 50 packets, respectively. It
can be seen that the packet drop rate decreased as the interarrival rate decreased. They remained the same for all
queue sizes. Nevertheless, the average E2E delay increased with increased queue sizes.
Table III. Sequential server model with unlimited queue size for uniform distribution
Interarrival Rate, λ Packet Drop Rate (%) Average E2E Delay (ms)
200-1000 0.000 002.202
1000-2000 0.000 642.699
2000-10000 0.000 857.512
10000-20000 0.000 965.217
http://cis.ccsenet.org Computer and Information Science Vol. 13, No. 3; 2020
13
Figure 14. Throughput vs. queue size
Figure 15. Packet drop rate and average E2E delays vs. interarrival rate
For this model, the packet drop rate again averaged E2E delay, and the throughput for both exponential and
uniform distributions (for λ) were analyzed. It was found that the results were similar to the previous cases and
packet size.
Case (c): A broken link for sequential server model
In this case, the sequential server model with a broken link between Router 1 and Router 2 was considered; and
the performance metrics were observed and analyzed for unlimited and limited queue sizes of 5, 10, and 50
http://cis.ccsenet.org Computer and Information Science Vol. 13, No. 3; 2020
14
packets. Two different distributions of the interarrival rate were also measured. For Poisson distribution of λ, the
resultant graphs of packet drop rate, average E2E delay, and throughput were similar to Case(b). Due to the
broken link, the packet drop rates and the average E2E delays were slightly higher; the throughput was slightly
lower, as compared to the Case(b) results shown in Figures 9-11.
The observation on the queue size also had the same results as shown in Figures 12-14 with a little bit of change
due to the broken link. Here, the throughput increased linearly with queue size and saturated when the queue size
became larger than the critical value.
The results of packet drop rate and E2E delay for various interarrival rates and unlimited queue size using
uniform distribution were the same as those shown in Table III. Also, the changes in packet drop rate and
average E2E delays vs. interarrival rate for uniform distribution for different queue sizes were similar to Figure
15. In other words, change in the distribution function (uniform distribution or Poisson distribution) did not
make any difference in the results.
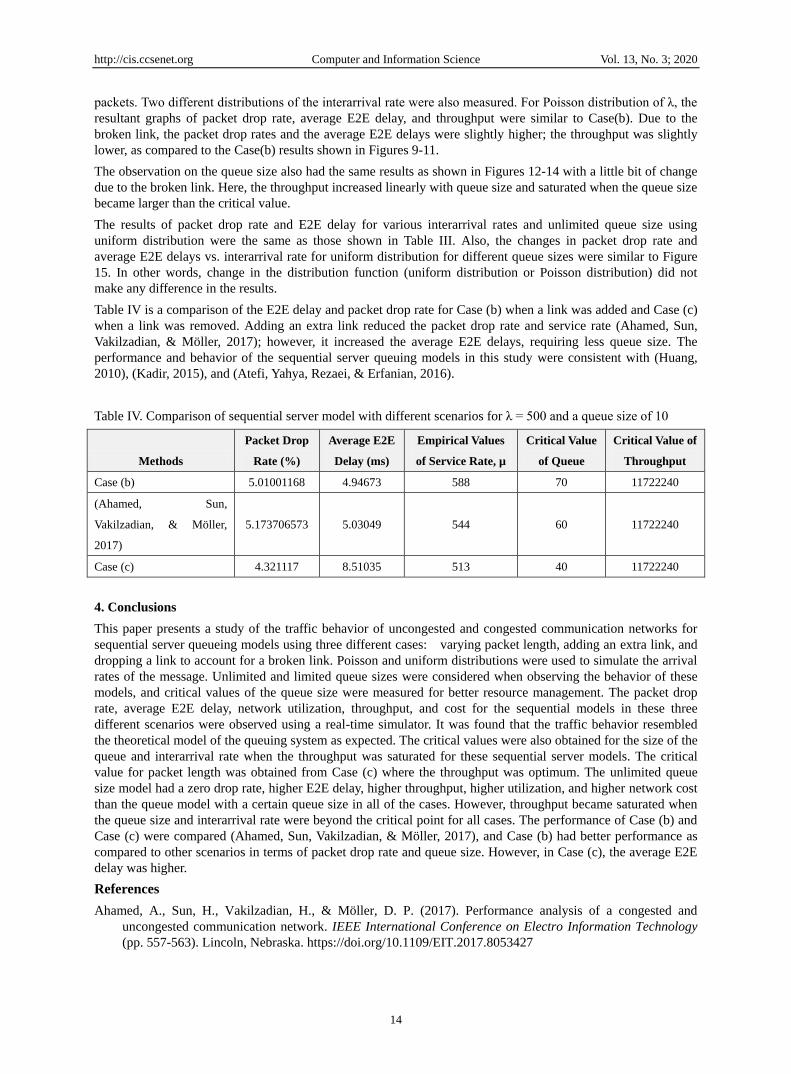
Table IV is a comparison of the E2E delay and packet drop rate for Case (b) when a link was added and Case (c)
when a link was removed. Adding an extra link reduced the packet drop rate and service rate (Ahamed, Sun,
Vakilzadian, & Möller, 2017); however, it increased the average E2E delays, requiring less queue size. The
performance and behavior of the sequential server queuing models in this study were consistent with (Huang,
2010), (Kadir, 2015), and (Atefi, Yahya, Rezaei, & Erfanian, 2016).
Table IV. Comparison of sequential server model with different scenarios for λ = 500 and a queue size of 10
Methods
Packet Drop
Rate (%)
Average E2E
Delay (ms)
Empirical Values
of Service Rate, µ
Critical Value
of Queue
Critical Value of
Throughput
Case (b) 5.01001168 4.94673 588 70 11722240
(Ahamed, Sun,
Vakilzadian, & Möller,
2017)
5.173706573 5.03049 544 60 11722240
Case (c) 4.321117 8.51035 513 40 11722240
4. Conclusions
This paper presents a study of the traffic behavior of uncongested and congested communication networks for
sequential server queueing models using three different cases: varying packet length, adding an extra link, and
dropping a link to account for a broken link. Poisson and uniform distributions were used to simulate the arrival
rates of the message. Unlimited and limited queue sizes were considered when observing the behavior of these
models, and critical values of the queue size were measured for better resource management. The packet drop
rate, average E2E delay, network utilization, throughput, and cost for the sequential models in these three
different scenarios were observed using a real-time simulator. It was found that the traffic behavior resembled
the theoretical model of the queuing system as expected. The critical values were also obtained for the size of the
queue and interarrival rate when the throughput was saturated for these sequential server models. The critical
value for packet length was obtained from Case (c) where the throughput was optimum. The unlimited queue
size model had a zero drop rate, higher E2E delay, higher throughput, higher utilization, and higher network cost
than the queue model with a certain queue size in all of the cases. However, throughput became saturated when
the queue size and interarrival rate were beyond the critical point for all cases. The performance of Case (b) and
Case (c) were compared (Ahamed, Sun, Vakilzadian, & Möller, 2017), and Case (b) had better performance as
compared to other scenarios in terms of packet drop rate and queue size. However, in Case (c), the average E2E
delay was higher.
References
Ahamed, A., Sun, H., Vakilzadian, H., & Möller, D. P. (2017). Performance analysis of a congested and
uncongested communication network. IEEE International Conference on Electro Information Technology
(pp. 557-563). Lincoln, Nebraska. https://doi.org/10.1109/EIT.2017.8053427

http://cis.ccsenet.org Computer and Information Science Vol. 13, No. 3; 2020
15
Atefi, K., Yahya, S., Rezaei, A., & Erfanian, A. (2016). Traffic behavior of Local Area Network based on
M/M/1 queuing model using poisson and exponential distribution. Region 10 Symposium (TENSYMP),
2016 IEEE, (pp. 19-23). https://doi.org/10.1109/TENCONSpring.2016.7519371
Bhaskar, V., & Lallement, P. (2010). Modeling a supply chain using a network of queues. Applied Mathematical
Modelling, 34, 2074-2088. https://doi.org/10.1016/j.apm.2009.10.019
Frost, V. S., & Melamed, B. (1994, March). Traffic modeling for telecommunications networks. IEEE
Communications Magazine, 32, 70-81. https://doi.org/10.1109/35.267444
Hemlata, & V.K. Pandey. (2015). Automatic Traffic Management and Congestion Avoidance. International
Journals of Advanced Research and Management.
Huang, Z. (2010). Topology and congestion invariant in global internet-scale networks. Ph.D. dissertation.
IEEE 802.3. (2017, Sep). Wikimedia Foundation. Retrieved from https://en.wikipedia.org/wiki/IEEE_802.3
Kadir, N. (2015). Observation of the common phenomena from a MATLAB model for M/M/1 queuing system.
Advances in Electrical Engineering (ICAEE), 2015 International Conference on, (pp. 210-212).
https://doi.org/10.1109/ICAEE.2015.7506833
Mabayoje, M. A., Ameen, A. O., Abikoye, O. C., Muhammed, R., & Olabiyisi, S. O. (2011). An efficient fair
queuing model for data communication networks. International Journal of Computer Science and
Information Security, 9, 206.
Mazraani, T. Y., & Parulkar, G. M. (1992, Dec). Performance analysis of the Ethernet under conditions of bursty
traffic. Global Telecommunications Conference, 1992. Conference Record., GLOBECOM '92.
Communication for Global Users., IEEE, (pp. 592-596 vol.1).
https://doi.org/10.1109/GLOCOM.1992.276446
Nikkel, S. (1997). Network connection speeds reference.
Santosh Kumar Mishra, B. A. (2015). Analysis of the Performance of Drop Tail-Aqm Techniques. International
Journal of Research Review in Engineering and Technology, 3(4).
Sutton, C. A., & Jordan, M. I. (2010). Inference and learning in networks of queues. International Conference on
Artificial Intelligence and Statistics, (pp. 796-803).
Sztrik, J. (2012). Basic Queuing Theory. University of Debrecen, Faculty of Informatics.
Trivedi, K. S. (2008). Probability & statistics with reliability, queuing and computer science applications. John
Wiley & Sons.
Varga, A. (2001). OMNeT++. Retrieved September 7, 2017, from https://omnetpp.org/
Varga, A., & Hornig, R. (2008). An Overview of the OMNeT++ Simulation Environment. Proceedings of the
1st International Conference on Simulation Tools and Techniques for Communications, Networks and
Systems \& Workshops (pp. 60:1--60:10). ICST, Brussels, Belgium, Belgium: ICST (Institute for Computer
Sciences, Social-Informatics and Telecommunications Engineering).
https://doi.org/10.4108/ICST.SIMUTOOLS2008.3027
Copyrights
Copyright for this article is retained by the author(s), with first publication rights granted to the journal.
This is an open-access article distributed under the terms and conditions of the Creative Commons Attribution
license (http://creativecommons.org/licenses/by/4.0/).
Copyright © 2022 FDOKUMEN