BotSniffer: Detecting Botnet Command and Control Channels in Network Traffic
18
BotSniffer: Detecting Botnet Command and Control Channels in Network Traffic Guofei Gu, Junjie Zhang, and Wenke Lee School of Computer Science, College of Computing Georgia Institute of Technology Atlanta, GA 30332 {guofei, jjzhang, wenke}@cc.gatech.edu Abstract Botnets are now recognized as one of the most serious security threats. In contrast to previous malware, botnets have the characteristic of a command and control (C&C) channel. Botnets also often use existing common protocols, e.g., IRC, HTTP, and in protocol-conforming manners. This makes the detection of botnet C&C a challenging problem. In this paper, we propose an approachthat uses network-based anomaly detection to identify botnet C&C channels in a local area network without any prior knowl- edge of signatures or C&C server addresses. This detection approach can identify both the C&C servers and infected hosts in the network. Our approach is based on the observa- tion that, because of the pre-programmed activities related to C&C, bots within the same botnet will likely demonstrate spatial-temporal correlation and similarity. For example, they engage in coordinated communication, propagation, and attack and fraudulent activities. Our prototype system, BotSniffer, can capture this spatial-temporal correlation in network traffic and utilize statistical algorithms to detect botnets with theoretical bounds on the false positive and false negative rates. We evaluated BotSniffer using many real-world network traces. The results show that BotSniffer can detect real-world botnets with high accuracy and has a very low false positive rate. 1 Introduction Botnets (or, networks of zombies) are recognized as one of the most serious security threats today. Botnets are different from other forms of malware such as worms in that they use command and control (C&C) channels. It is important to study this botnet characteristic so as to develop effective countermeasures. First, a botnet C&C channel is relatively stable and unlikely to change among bots and their variants. Second, it is the essential mechanism that allows a “botmaster” (who controls the botnet) to direct the actions of bots in a botnet. As such, the C&C channel can be considered the weakest link of a botnet. That is, if we can take down an active C&C or simply interrupt the communication to the C&C, the botmaster will not be able to control his botnet. Moreover, the detection of the C&C channel will reveal both the C&C servers and the bots in a monitored network. Therefore, understanding and detecting the C&Cs has great value in the battle against botnets. Many existing botnet C&Cs are based on IRC (Internet Relay Chat) protocol, which provides a centralized com- mand and control mechanism. The botmaster can interact with the bots (e.g., issuing commands and receiving re- sponses) in real-time by using IRC PRIVMSG messages. This simple IRC-based C&C mechanism has proven to be highly successful and has been adopted by many botnets. There are also a few botnets that use the HTTP protocol for C&C. HTTP-based C&C is still centralized, but the botmaster does not directly interact with the bots using chat- like mechanisms. Instead, the bots periodically contact the C&C server(s) to obtain their commands. Because of its proven effectiveness and efficiency, we expect that centralized C&C (e.g., using IRC or HTTP) will still be widely used by botnets in the near future. In this paper, we study the problem of detecting centralized botnet C&C channels using network anomaly detection techniques. In particular, we focus on the two commonly used botnet C&C mechanisms, namely, IRC and HTTP based C&C channels. Our goal is to develop a detection approach that does not require prior knowledge of a botnet, e.g., signatures of C&C patterns including the name or IP address of a C&C server. We leave the problem of detection of P2P botnets (e.g., Nugache [19], and Peacomm [14]) as our future work. Botnet C&C traffic is difficult to detect because: (1) it follows normal protocol usage and is similar to normal traffic, (2) the traffic volume is low, (3) there may be very
Transcript of BotSniffer: Detecting Botnet Command and Control Channels in Network Traffic
BotSniffer: Detecting Botnet Command and Control Channels
in Network Traffic
Guofei Gu, Junjie Zhang, and Wenke Lee
School of Computer Science, College of Computing
Georgia Institute of Technology
Atlanta, GA 30332
{guofei, jjzhang, wenke}@cc.gatech.edu
Abstract
Botnets are now recognized as one of the most serious
security threats. In contrast to previous malware, botnets
have the characteristic of a command and control (C&C)
channel. Botnets also often use existing common protocols,
e.g., IRC, HTTP, and in protocol-conforming manners.
This makes the detection of botnet C&C a challenging
problem. In this paper, we propose an approach that uses
network-based anomaly detection to identify botnet C&C
channels in a local area network without any prior knowl-
edge of signatures or C&C server addresses. This detection
approach can identify both the C&C servers and infected
hosts in the network. Our approach is based on the observa-
tion that, because of the pre-programmed activities related
to C&C, bots within the same botnet will likely demonstrate
spatial-temporal correlation and similarity. For example,
they engage in coordinated communication, propagation,
and attack and fraudulent activities. Our prototype system,
BotSniffer, can capture this spatial-temporal correlation in
network traffic and utilize statistical algorithms to detect
botnets with theoretical bounds on the false positive and
false negative rates. We evaluated BotSniffer using many
real-world network traces. The results show that BotSniffer
can detect real-world botnets with high accuracy and has a
very low false positive rate.
1 Introduction
Botnets (or, networks of zombies) are recognized as one
of the most serious security threats today. Botnets are
different from other forms of malware such as worms in
that they use command and control (C&C) channels. It is
important to study this botnet characteristic so as to develop
effective countermeasures. First, a botnet C&C channel is
relatively stable and unlikely to change among bots and
their variants. Second, it is the essential mechanism that
allows a “botmaster” (who controls the botnet) to direct
the actions of bots in a botnet. As such, the C&C channel
can be considered the weakest link of a botnet. That is, if
we can take down an active C&C or simply interrupt the
communication to the C&C, the botmaster will not be able
to control his botnet. Moreover, the detection of the C&C
channel will reveal both the C&C servers and the bots in a
monitored network. Therefore, understanding and detecting
the C&Cs has great value in the battle against botnets.
Many existing botnet C&Cs are based on IRC (Internet
Relay Chat) protocol, which provides a centralized com-
mand and control mechanism. The botmaster can interact
with the bots (e.g., issuing commands and receiving re-
sponses) in real-time by using IRC PRIVMSG messages.
This simple IRC-based C&C mechanism has proven to be
highly successful and has been adopted by many botnets.
There are also a few botnets that use the HTTP protocol
for C&C. HTTP-based C&C is still centralized, but the
botmaster does not directly interact with the bots using chat-
like mechanisms. Instead, the bots periodically contact
the C&C server(s) to obtain their commands. Because
of its proven effectiveness and efficiency, we expect that
centralized C&C (e.g., using IRC or HTTP) will still be
widely used by botnets in the near future. In this paper,
we study the problem of detecting centralized botnet C&C
channels using network anomaly detection techniques. In
particular, we focus on the two commonly used botnet C&C
mechanisms, namely, IRC and HTTP based C&C channels.
Our goal is to develop a detection approach that does not
require prior knowledge of a botnet, e.g., signatures of C&C
patterns including the name or IP address of a C&C server.
We leave the problem of detection of P2P botnets (e.g.,
Nugache [19], and Peacomm [14]) as our future work.
Botnet C&C traffic is difficult to detect because: (1)
it follows normal protocol usage and is similar to normal
traffic, (2) the traffic volume is low, (3) there may be very
few bots in the monitored network, and (4) may contain
encrypted communication. However, we observe that the
bots of a botnet demonstrate spatial-temporal correlation
and similarities due to the nature of their pre-programmed
response activities to control commands. This invariant
helps us identify C&C within network traffic. For in-
stance, at a similar time, the bots within a botnet will
execute the same command (e.g., obtain system informa-
tion, scan the network), and report to the C&C server with
the progress/result of the task (and these reports are likely
to be similar in structure and content). Normal network
activities are unlikely to demonstrate such a synchronized or
correlated behavior. Using a sequential hypothesis testing
algorithm, when we observe multiple instances of corre-
lated and similar behaviors, we can conclude that a botnet
is detected.
Our research makes several contributions. First, we
study two typical styles of control used in centralized botnet
C&C. The first is the “push” style, where commands are
pushed or sent to bots. IRC-based C&C is an example
of the push style. The second is the “pull” style, where
commands are pulled or downloaded by bots. HTTP-based
C&C is an example of the pull style. Observing the spatial-
temporal correlation and similarity nature of these botnet
C&Cs, we provide a set of heuristics that distinguish C&C
traffic from normal traffic.
Second, we propose anomaly-based detection algorithms
to identify both IRC and HTTP based C&Cs in a port-
independent manner. The advantages of our algorithms
include: (1) they do not require prior knowledge of C&C
servers or content signatures, (2) they are able to detect
encrypted C&C, (3) they do not require a large number of
bots to be present in the monitored network, and may even
be able to detect a botnet with just a single member in the
monitored network in some cases, (4) they have bounded
false positive and false negative rates, and do not require a
large number of C&C communication packets.
Third, we develop a system, BotSniffer, which is based
on our proposed anomaly detection algorithms and is im-
plemented as several plug-ins for the open-source Snort
[24]. We have evaluated BotSniffer using real-world net-
work traces. The results show that it has high accuracy in
detecting botnet C&Cs with a very low false positive rate.
The rest of the paper is organized as follows. In Section 2
we provide a background on botnet C&C and the motivation
of our botnet detection approach. In Section 3, we describe
the architecture of BotSniffer and describe in detail its
detection algorithms. In Section 4, we report our evalu-
ation of BotSniffer on various datasets. In Section 5, we
discuss possible evasions to BotSniffer, the corresponding
solutions, and future work. We review the related work in
Section 6 and conclude in Section 7.
2 Background and Motivation
In this section, we first use case studies to provide a
background on botnet C&C mechanisms. We then discuss
the intuitions behind our detection algorithms.
2.1 Case Study of Botnet C&C
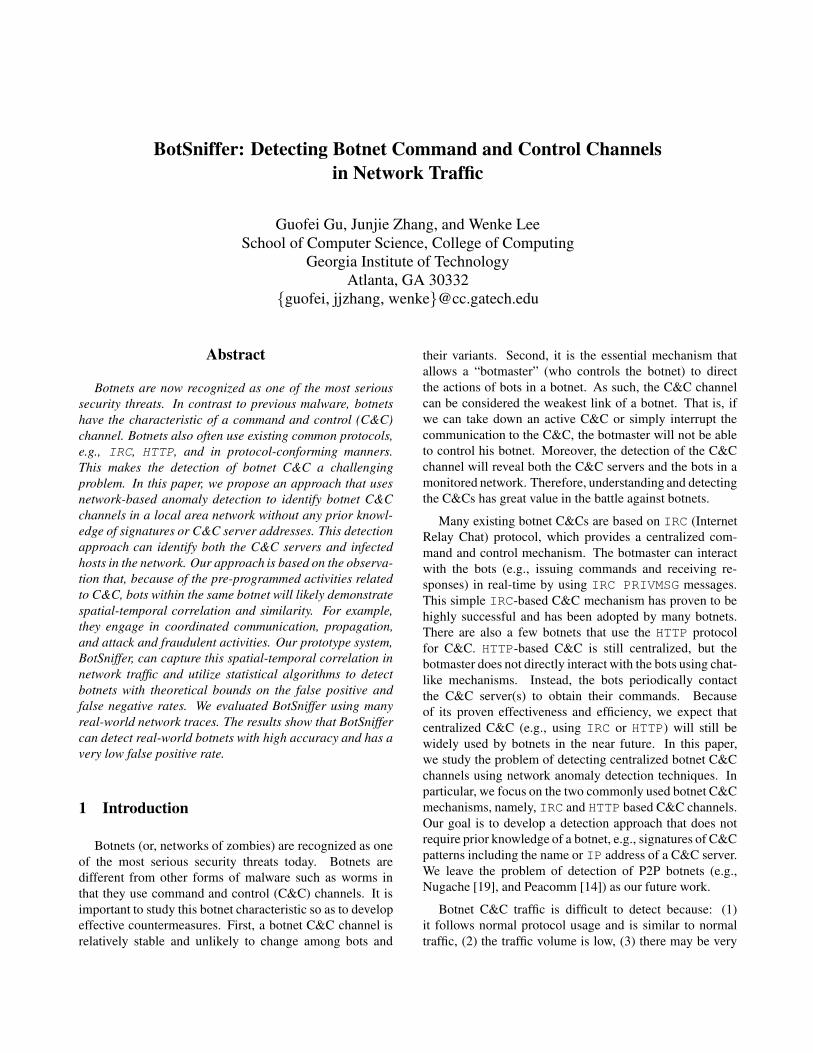
As shown in Figure 1(a), centralized C&C architecture
can be categorized into “push” or “pull” style, depending
on how a botmaster’s commands reach the bots.
In a push style C&C, the bots are connected to the
C&C server, e.g., IRC server, and wait for commands from
botmaster. The botmaster issues a command in the channel,
and all the bots connected to the channel can receive it
in real-time. That is, in a push style C&C the botmaster
has real-time control over the botnet. IRC-based C&C is
the representative example of push style. Many existing
botnets use IRC, including the most common bot fami-
lies such as Phatbot, Spybot, Sdbot, Rbot/Rxbot, GTBot
[5]. A botmaster sets up an (or a set of) IRC server(s) as
C&C hosts. After a bot is newly infected, it will connect
to the C&C server, join a certain IRC channel and wait
for commands from the botmaster. Commands will be
sent in IRC PRIVMSG messages (like a regular chatting
message) or a TOPIC message. The bots receive com-
mands, understand what the botmaster wants them to do,
and execute and then reply with the results. Figure 1(b)
shows a sample command and control session. The botmas-
ter first authenticates himself using a username/password.
Once the password is accepted, he can issue commands
to obtain some information from the bot. For example,
“.bot.about” gets some basic bot information such as
version. “.sysinfo” obtains the system information of
the bot infected machine, “.scan.start” instructs the
bots to begin scanning for other vulnerable machines. The
bots respond to the commands in pre-programmed fashions.
The botmaster has a rich command library to use [5], which
enables the botmaster to fully control and utilize the in-
fected machines.
In a pull style C&C, the botmaster simply sets the
command in a file at a C&C server (e.g., a HTTP server).
The bots frequently connect back to read the command
file. This style of command and control is relatively loose
in that the botmaster typically does not have real-time
control over the bots because there is a delay between the
time when he “issues” a command and the time when a
bot gets the command. There are several botnets using
HTTP protocol for C&C, for example, Bobax [25], which
is designed mainly to send spams. The bots of this botnet
periodically connect to the C&C server with an URL such as
http://hostname/reg?u=[8-digit-hex-id]
&v=114, and receive the command in a HTTP response.
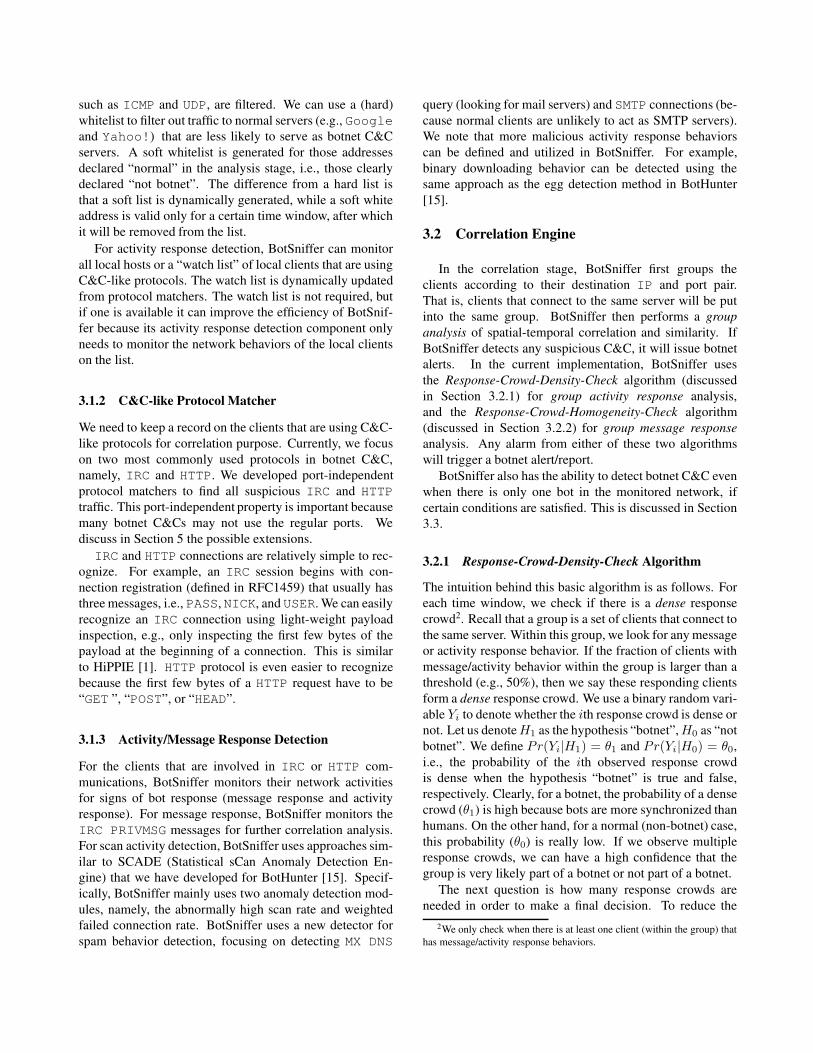
(a) Two styles of botnet C&C. (b) An IRC-based C&C communication example.
Figure 1. Botnet command and control.
The command is in one of the six types, e.g., prj (send
spams), scn (scan others), upd (update binary). Botnets
can have fairly frequent C&C traffic. For example, in a
CERT report [16], researchers report a Web based bot that
queries for the command file every 5 seconds and then
executes the commands.
2.2 Botnet C&C: SpatialTemporal Correlationand Similarity
There are several invariants in botnet C&C regardless of
the push or pull style.
First, bots need to connect to C&C servers in order to
obtain commands. They may either keep a long connection
or frequently connect back. In either case, we can consider
that there is a (virtually) long-lived session of C&C chan-
nel.1
Second, bots need to perform certain tasks and respond
to the received commands. We can define two types of
responses observable in network traffic, namely, message
response and activity response. A typical example of mes-
sage response is IRC-based PRIVMSG reply as shown in
Figure 1(b). When a bot receives a command, it will execute
and reply in the same IRC channel with the execution result
(or status/progress). The activity responses are the network
activities the bots exhibit when they perform the malicious
tasks (e.g., scanning, spamming, binary update) as directed
by the botmaster’s commands. According to [31], about
53% of botnet commands observed in thousands of real-
world IRC-based botnets are scan related (for spreading or
DDoS purpose), about 14.4% are binary download related
(for malware updating purpose). Also, many HTTP-based
1We consider a session live if the TCP connection is live, or within a
certain time window, there is at least one connection to the server.
botnets are mainly used to send spams [25]. Thus, we
will observe these malicious activity responses with a high
probability [8].
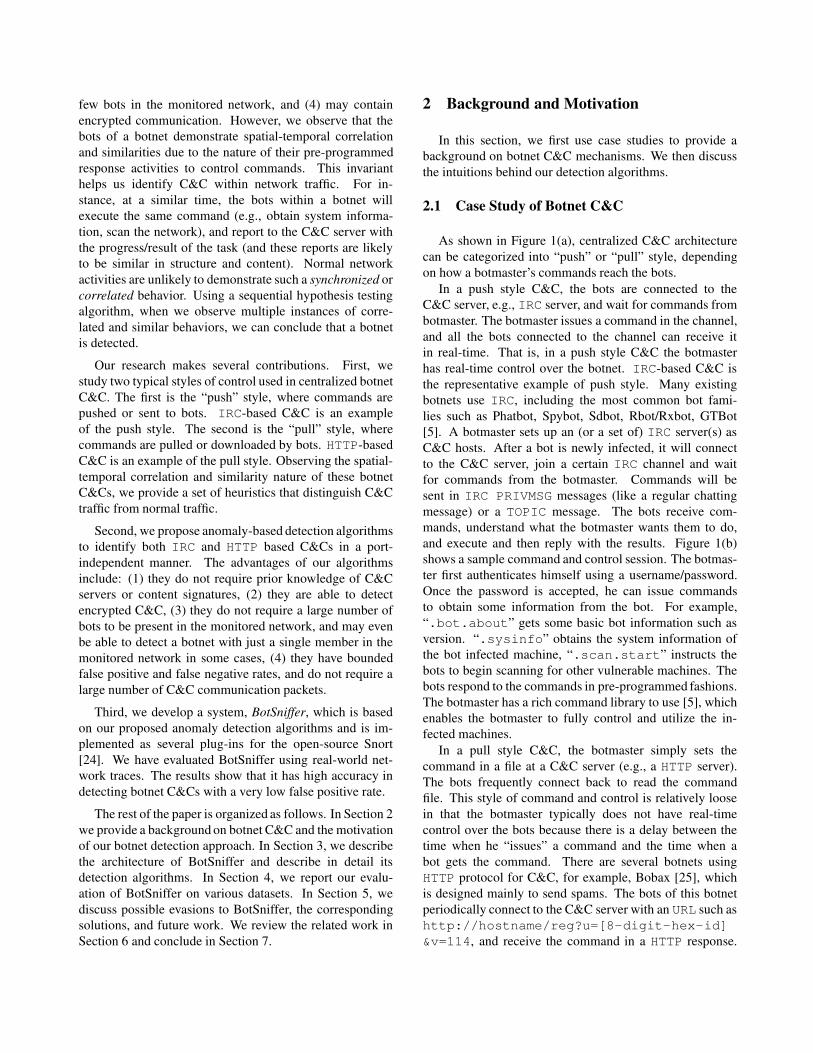
If there are multiple bots in the channel to respond to
commands, most of them are likely to respond in a similar
fashion. For example, the bots send similar message or
activity traffic at a similar time window, e.g., sending spam
as in [23]. Thus, we can observe a response crowd of
botnet members responding to a command, as shown in
Figure 2. Such crowd-like behaviors are consistent with all
botnet C&C commands and throughout the life-cycle of a
botnet. On the other hand, for a normal network service
(e.g., an IRC chatting channel), it is unlikely that many
clients consistently respond similarly and at a similar time.
That is, the bots have much stronger (and more consistent)
synchronization and correlation in their responses than nor-
mal (human) users do.
Based on the above observation, our botnet C&C detec-
tion approach is aimed at recognizing the spatial-temporal
correlation and similarities in bot responses. When monitor-
ing network traffic, as the detection system observes multi-
ple crowd-like behaviors, it can declare that the machines in
the crowd are bots of a botnet when the accumulated degree
of synchronization/correlation (and hence the likelihood of
bot traffic) is above a given threshold.
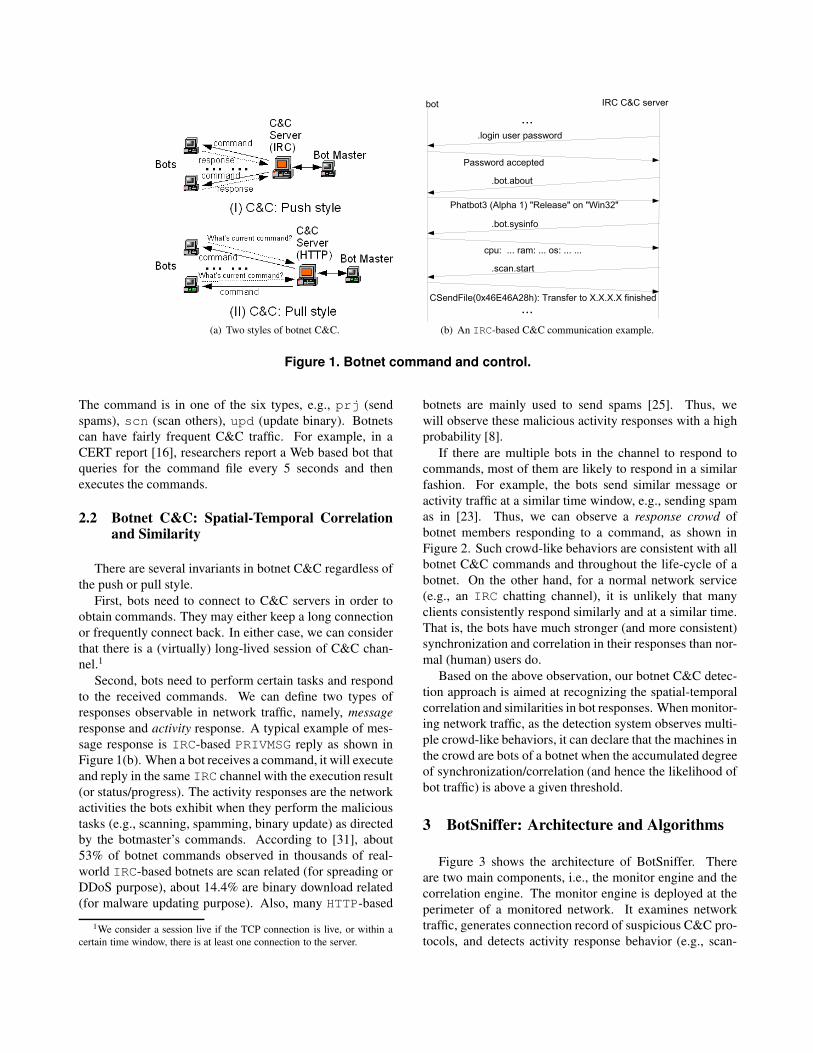
3 BotSniffer: Architecture and Algorithms
Figure 3 shows the architecture of BotSniffer. There
are two main components, i.e., the monitor engine and the
correlation engine. The monitor engine is deployed at the
perimeter of a monitored network. It examines network
traffic, generates connection record of suspicious C&C pro-
tocols, and detects activity response behavior (e.g., scan-
bot
bot
bot
Time
Time
Time
Message Response (e.g., IRC PRIVMSG)
(a) Message response crowd.
bot
bot
bot
Time
Time
Time
Activity Response (network scanning)
Activity Response (sending spam)
Activity Response (binary downloading)
(b) Activity response crowd.
Figure 2. Spatialtemporal correlation and similarity in bot responses (message response and activity
response).
Preprocessing
(WhiteList
WatchList)
HTTP
IRC
Protocol
Matcher
Scan
Spam
Activity
Response
Detection
Binary
Downloading
Incoming
PRIVMSG Analyzer
Message
Response
Detection
Outgoing
PRIVMSG Analyzer
Activity Log
Correlation
Engine
Reports
Reports
Network Traffic of
IRC PRIVMSG
Malicious Activity
Events
HTTP/IRC
Connection Records
Network
Traffic
Monitor Engine
Message Records
Figure 3. BotSniffer Architecture.
ning, spamming) and message response behavior (e.g., IRC
PRIVMSG) in the monitored network. The events observed
by the monitor engine are analyzed by the correlation en-
gine. It performs group analysis of spatial-temporal cor-
relation and similarity of activity or message response be-
haviors of the clients that connect to the same IRC or
HTTP server. We implemented the monitor engines as
several preprocessor plug-ins on top of the open-source
system Snort [24], and implemented the correlation engine
in Java. We also implemented a real-time message response
correlation engine (in C), which can be integrated in the
monitor engine. The monitor engines can be distributed
on several networks, and collect information to a central
repository to perform correlation analysis. We describe
each BotSniffer component in the following sections.
3.1 Monitor Engine
3.1.1 Preprocessing
When network traffic enters the BotSniffer monitor engine,
BotSniffer first performs preprocessing to filter out irrele-
vant traffic to reduce the traffic volume. Preprocessing is
not essential to the detection accuracy of BotSniffer but can
improve the efficiency of BotSniffer.
For C&C-like protocol matching, protocols that are un-
likely (or at least not yet) used for C&C communications,
such as ICMP and UDP, are filtered. We can use a (hard)
whitelist to filter out traffic to normal servers (e.g., Google
and Yahoo!) that are less likely to serve as botnet C&C
servers. A soft whitelist is generated for those addresses
declared “normal” in the analysis stage, i.e., those clearly
declared “not botnet”. The difference from a hard list is
that a soft list is dynamically generated, while a soft white
address is valid only for a certain time window, after which
it will be removed from the list.
For activity response detection, BotSniffer can monitor
all local hosts or a “watch list” of local clients that are using
C&C-like protocols. The watch list is dynamically updated
from protocol matchers. The watch list is not required, but
if one is available it can improve the efficiency of BotSnif-
fer because its activity response detection component only
needs to monitor the network behaviors of the local clients
on the list.
3.1.2 C&C-like Protocol Matcher
We need to keep a record on the clients that are using C&C-
like protocols for correlation purpose. Currently, we focus
on two most commonly used protocols in botnet C&C,
namely, IRC and HTTP. We developed port-independent
protocol matchers to find all suspicious IRC and HTTP
traffic. This port-independent property is important because
many botnet C&Cs may not use the regular ports. We
discuss in Section 5 the possible extensions.
IRC and HTTP connections are relatively simple to rec-
ognize. For example, an IRC session begins with con-
nection registration (defined in RFC1459) that usually has
three messages, i.e., PASS, NICK, and USER. We can easily
recognize an IRC connection using light-weight payload
inspection, e.g., only inspecting the first few bytes of the
payload at the beginning of a connection. This is similar
to HiPPIE [1]. HTTP protocol is even easier to recognize
because the first few bytes of a HTTP request have to be
“GET ”, “POST”, or “HEAD”.
3.1.3 Activity/Message Response Detection
For the clients that are involved in IRC or HTTP com-
munications, BotSniffer monitors their network activities
for signs of bot response (message response and activity
response). For message response, BotSniffer monitors the
IRC PRIVMSG messages for further correlation analysis.
For scan activity detection, BotSniffer uses approaches sim-
ilar to SCADE (Statistical sCan Anomaly Detection En-
gine) that we have developed for BotHunter [15]. Specif-
ically, BotSniffer mainly uses two anomaly detection mod-
ules, namely, the abnormally high scan rate and weighted
failed connection rate. BotSniffer uses a new detector for
spam behavior detection, focusing on detecting MX DNS
query (looking for mail servers) and SMTP connections (be-
cause normal clients are unlikely to act as SMTP servers).
We note that more malicious activity response behaviors
can be defined and utilized in BotSniffer. For example,
binary downloading behavior can be detected using the
same approach as the egg detection method in BotHunter
[15].
3.2 Correlation Engine
In the correlation stage, BotSniffer first groups the
clients according to their destination IP and port pair.
That is, clients that connect to the same server will be put
into the same group. BotSniffer then performs a group
analysis of spatial-temporal correlation and similarity. If
BotSniffer detects any suspicious C&C, it will issue botnet
alerts. In the current implementation, BotSniffer uses
the Response-Crowd-Density-Check algorithm (discussed
in Section 3.2.1) for group activity response analysis,
and the Response-Crowd-Homogeneity-Check algorithm
(discussed in Section 3.2.2) for group message response
analysis. Any alarm from either of these two algorithms
will trigger a botnet alert/report.
BotSniffer also has the ability to detect botnet C&C even
when there is only one bot in the monitored network, if
certain conditions are satisfied. This is discussed in Section
3.3.
3.2.1 Response-Crowd-Density-Check Algorithm
The intuition behind this basic algorithm is as follows. For
each time window, we check if there is a dense response
crowd2. Recall that a group is a set of clients that connect to
the same server. Within this group, we look for any message
or activity response behavior. If the fraction of clients with
message/activity behavior within the group is larger than a
threshold (e.g., 50%), then we say these responding clients
form a dense response crowd. We use a binary random vari-
able Yi to denote whether the ith response crowd is dense or
not. Let us denote H1 as the hypothesis “botnet”, H0 as “not
botnet”. We define Pr(Yi|H1) = θ1 and Pr(Yi|H0) = θ0,
i.e., the probability of the ith observed response crowd
is dense when the hypothesis “botnet” is true and false,
respectively. Clearly, for a botnet, the probability of a dense
crowd (θ1) is high because bots are more synchronized than
humans. On the other hand, for a normal (non-botnet) case,
this probability (θ0) is really low. If we observe multiple
response crowds, we can have a high confidence that the
group is very likely part of a botnet or not part of a botnet.
The next question is how many response crowds are
needed in order to make a final decision. To reduce the
2We only check when there is at least one client (within the group) that
has message/activity response behaviors.
number of crowds required, we utilize a SPRT (Sequential
Probability Ration Testing [27]) algorithm, which is also
known as TRW (Threshold Random Walk [17]), to calculate
a comprehensive anomaly score when observing a sequence
of crowds. TRW is a powerful tool in statistics and has
been used in port scan detection [17] and spam laundering
detection [29]. By using this technique, one can reach
a decision within a small number of rounds, and with a
bounded false positive rate and false negative rate.
TRW is essentially a hypothesis testing technique. That
is, we want to calculate the likelihood ratio Λn given a se-
quence of crowds observed Y1, ..., Yn. Assume the crowds
Yis’ are i.i.d. (independent and identically-distributed), we
have
Λn = lnPr(Y1, ..., Yn|H1)
Pr(Y1, ..., Yn|H0)= ln
∏
i Pr(Yi|H1)∏
iPr(Yi|H0)
=∑
i
lnPr(Yi|H1)
Pr(Yi|H0)
According to the TRW algorithm [17, 27], to calculate
this likelihood Λn, we are essentially performing a thresh-
old random walk. The walk starts from the origin (0), goes
up with step length ln θ1
θ0
when Yi = 1, and goes down with
step length ln 1−θ1
1−θ0
when Yi = 0. Let us denote α and β
the user-chosen false positive rate and false negative rate,
respectively. If the random walk goes up and reaches the
threshold B = ln 1−β
α, this is likely a botnet, and we accept
the hypothesis “botnet”, output an alert, and stop. If it goes
down and hits the threshold A = ln β
1−α, it is likely not a
botnet. Otherwise, it is pending and we just watch for the
next round of crowd.
There are some possible problems that may affect the
accuracy of this algorithm.
First, it requires observing multiple rounds of response
crowds. If there are only a few response behaviors, the
accuracy of the algorithm may suffer. In practice, we find
that many common commands will have a long lasting
effect on the activities of bots. For example, a single
scan command will cause the bots to scan for a long time,
and a spam-sending “campaign” can last for a long time
[8, 23]. Thus, at least for activity response detection, we
can expect to observe sufficient response behaviors to have
good detection accuracy.
Second, sometimes not all bots in the group will respond
within the similar time window, especially when there is a
relatively loose C&C. One solution is simply to increase the
time window for each round of TRW. Section 3.2.2 presents
an enhanced algorithm that solves this problem.
To conclude, in practice, we find this basic algorithm
works well, especially for activity response correlation. To
further address the possible limitations above, we next pro-
pose an enhanced algorithm.
3.2.2 Response-Crowd-Homogeneity-Check Algorithm
The intuition of this algorithm is that, instead of looking at
the density of response crowd, it is important to consider
the homogeneity of a crowd. A homogeneous crowd means
that within a crowd, most of the members have very similar
responses. For example, the members of a homogeneous
crowd have message response with similar structure and
content, or they have scan activities with similar IP address
distribution and port range. We note that we currently
implement this algorithm only for message response anal-
ysis. But activity response analysis can also utilize this
algorithm, as discussed in Section 5. In this section, we
use message response analysis as an example to describe
the algorithm.
In this enhanced algorithm, Yi denotes whether the ith
crowd is homogeneous or not. We use a clustering technique
to obtain the largest cluster of similar messages in the
crowd, and calculate the ratio of the size of the cluster over
the size of the crowd. If this ratio is greater than a certain
threshold, we say Yi = 1; otherwise Yi = 0.
There are several ways to measure the similarity between
two messages (strings) for clustering. For example, we can
use edit distance (or ED, which is defined as the minimum
number of elementary edit operations needed to transform
one string into another), longest common subsequence, and
DICE coefficient [7]. We require that the similarity metric
take into account the structure and context of messages.
Thus, we choose DICE coefficient (or DICE distance) [7]
as our similarity function. DICE coefficient is based on
n-gram analysis, which uses a sliding window of length n
to extract substrings from the entire string. For a string X
with length l, the number of n-grams is |ngrams(X)| =l − n + 1. Dice coefficient is defined as the ratio of the
number of n-grams that are shared by two strings over the
total number of n-grams in both strings:
Dice(X, Y ) =2|ngrams(X) ∩ ngrams(Y )|
|ngrams(X)| + |ngrams(Y )|
We choose n = 2 in our system, i.e., we use bi-gram
analysis. We also use a simple variant of hierarchical
clustering technique. If there are q clients in the crowd3,
we compare each of the(
q
2
)
unique pairs using DICE, and
calculate the percentage of DICE distances that are greater
than a threshold (i.e., the percentage of similar messages). If
this percentage is above a threshold (e.g., 50%), we say the
ith crowd is homogeneous, and Yi = 1; otherwise, Yi = 0.
Now we need to set θ1 and θ0. These probabilities
should vary with the number of clients (q) in the crowd.
Thus, we denote them θ1(q) and θ0(q), or more generally
3Within a certain time window, if a client sends more than one message,
the messages will be concatenated together.
θ(q). For example, for a homogeneous crowd with 100
clients sending similar messages, its probability of being
part of a botnet should be higher than that of a homogeneous
crowd of 10 clients. This is because with more clients,
it is less likely that by chance they form a homogeneous
crowd. Let us denote p = θ(2) as the basic probability
that two messages are similar. Now we have a crowd of
q clients, there are m =(
q2
)
distinct pairs, the probability
of having i similar pairs follows the Binomial distribution,
i.e., Pr(X = i) =(
mi
)
pi(1 − p)m−i. Then the probability
of having more than k similar pairs is Pr(X ≥ k) =∑m
i=k
(
m
i
)
pi(1 − p)m−i. If we pick k = mt where t is
the threshold to decide whether a crowd is homogeneous,
we obtain the probability θ(q) = Pr(X ≥ mt).
0 0.1 0.2 0.3 0.4 0.5 0.6 0.7 0.8 0.9 10
0.1
0.2
0.3
0.4
0.5
0.6
0.7
0.8
0.9
1
p
θ(q
)
q=2,t=0.5q=4,t=0.5q=6,t=0.5q=4,t=0.6q=6,t=0.6
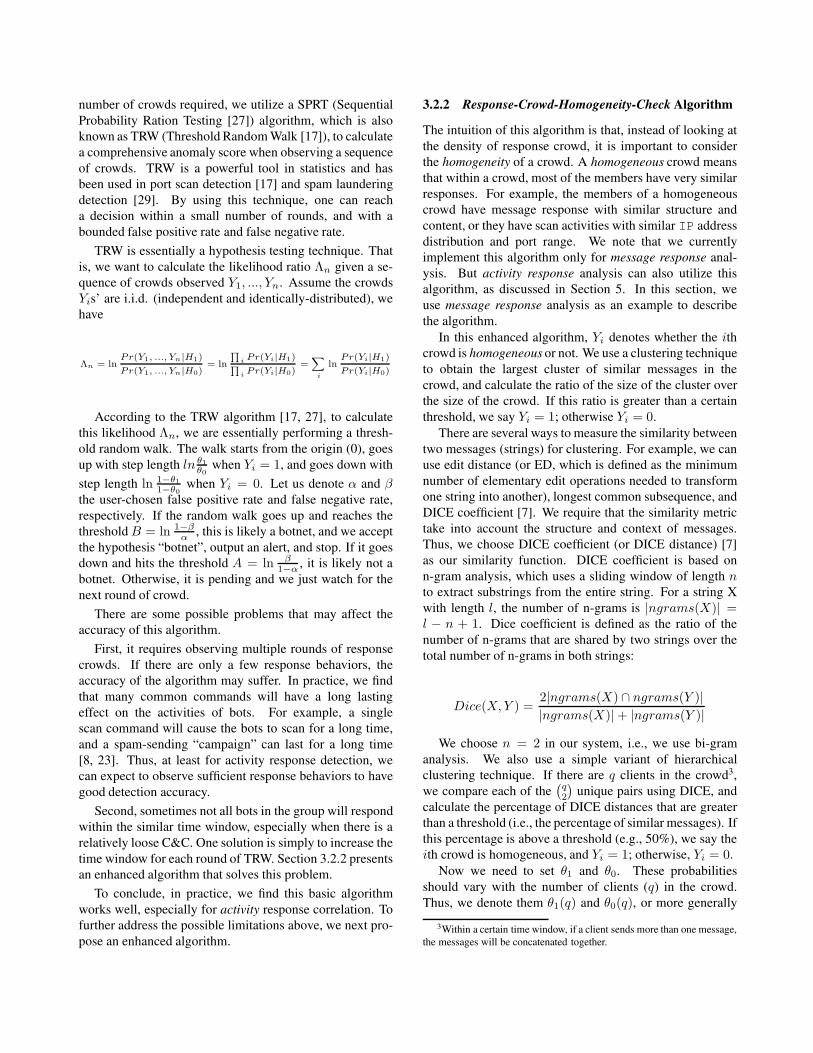
Figure 4. θ(q), the probability of crowd ho
mogeneity with q responding clients, and
threshold t.
As Figure 4 shows, when there are more than two mes-
sages in the crowd, and we pick p ≥ 0.6, the probability
θ(q) is above the diagonal line, indicating that the value
is larger than p. This suggests that when we use θ1(2) >
0.6, we have θ1(q) > θ1(2). That is, if there are more
messages, we will more likely have a higher probability
of θ1. This confirms our intuition that, if it is a botnet,
then having more clients (messages) is more likely to form
a clustered message group (homogeneous crowd). Also,
from the figure, if we pick a small p ≤ 0.3, we will have
θ(q) < p. This suggests that when choosing θ0(2) < 0.3,
we will have much lower probability θ0(q) when having
multiple messages. Again this confirms the intuition that,
for independent users (not a botnet), it is very unlikely for
them to send similar messages. If there are more users, then
it is less unlikely they will form a homogeneous crowd be-
cause essentially more users will involve more randomness
in the messages. In order to avoid calculating θ(q) all the
time, in practice one can pre-compute these probabilities for
different q values and store the probabilities in a table for
lookup. It may be sufficient to calculate the probabilities
for only a few q values (e.g., q = 3, . . . , 10). For q > 10,
we can conservatively use the probability with q = 10.
For the hypothesis “not botnet”, for a pair of users, the
probability of typing similar messages is very low. Ap-
pendix A provides an analysis of the probability of having
two similar length (size) messages from two users. Essen-
tially, the probability of having two similar length messages
is low, and the probability of having two similar content
is even much lower. In correlation analysis, we pick a
reasonable value (e.g., 0.15) for this probability. Even
though this value is not precise, the only effect is that
the TRW algorithm takes more rounds to make a decision
[17, 27].
In order to make a decision that a crowd is part of a
botnet, the expected number of crowd message response
rounds we need to observe is:
E[N |H1] =β ln β
1−α+ (1 − β) ln 1−β
α
θ1 ln θ1
θ0
+ (1 − θ1) ln 1−θ1
1−θ0
where α and β are user-chosen false positive and false
negative probabilities, respectively. Similarly, if the crowd
is not part of a botnet, the expected number of crowd
message response rounds to make a decision is:
E[N |H0] =(1 − α) ln β
1−α+ α ln 1−β
α
θ0 ln θ1
θ0
+ (1 − θ0) ln 1−θ1
1−θ0
These numbers are derived according to [27].
0.05 0.1 0.15 0.2 0.25 0.3 0.35 0.40
2
4
6
8
10
12
14
16
θ0(2)
E[N
|H1]
θ1(2)=0.8,q=2,α=0.005
θ1(2)=0.7,q=4,α=0.005
θ1(2)=0.8,q=4,α=0.005
θ1(2)=0.7,q=6,α=0.005
θ1(2)=0.8,q=6,α=0.005
θ1(2)=0.8,q=6,α=0.0001
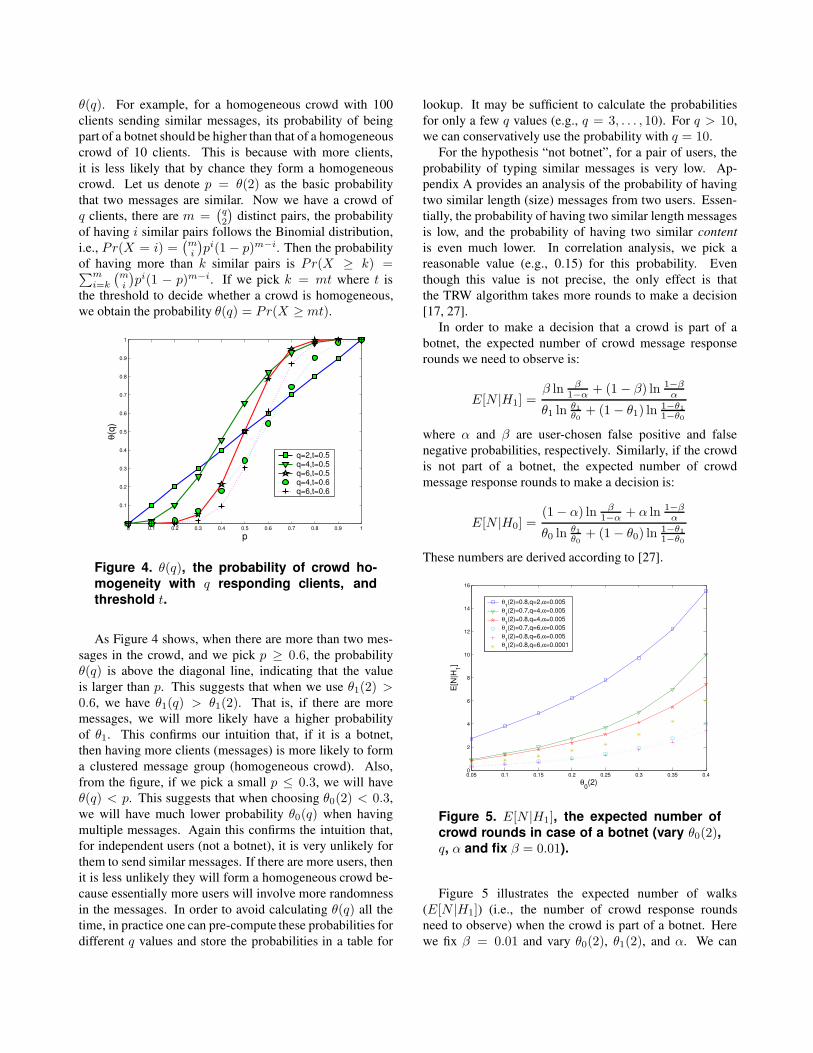
Figure 5. E[N |H1], the expected number of
crowd rounds in case of a botnet (vary θ0(2),q, α and fix β = 0.01).
Figure 5 illustrates the expected number of walks
(E[N |H1]) (i.e., the number of crowd response rounds
need to observe) when the crowd is part of a botnet. Here
we fix β = 0.01 and vary θ0(2), θ1(2), and α. We can
see that even when we have only two clients, and have a
conservative setting of θ0(2) = 0.2 and θ0(2) = 0.7, it
only takes around 6 walks to reach the decision. When we
increase θ1(2) and decrease θ0(2), we can achieve better
performance, i.e., fewer rounds of walks. If there are more
than two messages (clients), we can have shorter detection
time than the case of having only two messages. It is
obvious that having more clients in the botnet means that
we can make a decision quicker. For example, when q = 4,
θ1(2) = 0.7, and θ0(2) < 0.15, the expected number of
crowd rounds is less than two.
3.3 Single Client C&C Detection Under CertainConditions
Group correlation analysis typically requires having
multiple members in a group. In some cases, there is only
one client (e.g., the first infected victim) in the group. We
recommend a distributed deployment of BotSniffer (as
discussed in Section 5) to cover a larger network space, and
thus potentially have more clients in a group. Orthogonally,
we can use techniques that are effective even if there is only
one member in the group, if certain conditions are satisfied.
For IRC communication, a chatting message is usually
broadcast in the channel. That is, every client can see the
messages sent from other clients in the same channel (which
is the normal operation of IRC chatting service). Thus, ev-
ery bot should expect to receive the response messages from
all other clients. This is essentially similar to the case when
we can monitor multiple message responses from multiple
clients in the group. We can use the same TRW algorithm
here. The only difference is that, instead of estimating
the homogeneity of the outgoing message responses from
multiple clients, we estimate the homogeneity of incoming
messages (from different users) to a single client. We also
implemented BotSniffer to perform this analysis because it
complements the algorithms we described in Section 3.2.1
and Section 3.2.2, especially if there is only one client in
the monitored network. Of course, this will not work if
the botmaster uses a modified IRC softwares to disable
broadcasting messages to every clients in the channel.
For HTTP-based C&C, we notice that bots have strong
periodical visiting patterns (to connect back and retrieve
commands). Under this condition, we can include a new
signal encoding and autocorrelation (or self-correlation) ap-
proach in BotSniffer to detect such kind of C&C. Appendix
B describes this approach.
Finally, we note that although these two single client
detection schemes work well on existing botnet C&C, they
are not as robust (evasion-resilient) as the group analysis
algorithms discussed in Section 3.2.1 and Section 3.2.2.
4 Experimental Evaluation
To evaluate the performance of BotSniffer, we tested it
on several network traces.
4.1 Datasets
We have multiple network traces captured from our uni-
versity campus network. Among those, eight are just port
6667 IRC traffic captured in 2005, 2006, and 2007. Each
IRC trace lasts from several days to several months. The
total duration of these traces is about 189 days. They were
labeled as IRC-n (n = 1, . . . , 8). The other five traces are
complete packet captures of all network traffic. Two of them
were collected in 2004, each lasting about ten minutes. The
other three were captured in May and December 2007, each
lasting 1 to 5 hours. We labeled them as All-n (n = 1, . . . , 5).
The primary purpose of using these traces was to test the
false positive rate of BotSniffer. We list the basic statistics
(e.g., size, duration, number of packets) of these traces in
the left part of Table 1.
We also obtained several real-world IRC-based botnet
C&C traces from several different sources. One was cap-
tured at our honeynet in June 2006. This trace contains
about eight hours of traffic (mainly IRC). We labeled it as
B-IRC-G. The IRC channel has broadcast on and we can
observe the messages sent from other bots in the channel.
The trace does not contain the initial traffic, so we did not
have the command. From the replies of the clients, it seems
like a DDoS attack because bots reported current bandwidth
usage and total offered traffic. Besides B-IRC-G, we also
obtained two botnet IRC logs (not network traces) recorded
by an IRC tracker in 2006 [22]. In these logs, there are
two distinct IRC servers, so there are two different botnets.
We labeled them as B-IRC-J-n (n = 1, 2). In each log,
the tracker joined the channel, and sat there watching the
messages. Fortunately, the botmaster here did not disable
the broadcast, thus, all the messages sent by other bots in
the channel were observable.
In addition to these IRC botnet traces, we modified
the source codes of three common bots [5] (Rbot, Spybot,
Sdbot) and created our version of binaries (so that the bots
would only connect to our controlled IRC server). We
set up a virtual network environment using VMware and
launched the modified bots in several Windows XP/2K
virtual machines. We instructed the bots to connect our
controlled C&C server and captured the traces in the virtual
network. For Rbot, we used five Windows XP virtual
machines to generate the trace. For Spybot and Sdbot, we
used four clients. We labeled these three traces as V-Rbot,
V-Spybot, and V-Sdbot, respectively. These traces contain
both bot message responses and activity responses.
We also implemented two botnets with HTTP-based
Trace trace size duration Pkt TCP flows (IRC/Web) servers FP
IRC-1 54MB 171h 189,421 10,530 2,957 0
IRC-2 14MB 433h 33,320 4,061 335 0
IRC-3 516MB 1,626h 2,073,587 4,577 563 6
IRC-4 620MB 673h 4,071,707 24,837 228 3
IRC-5 3MB 30h 19,190 24 17 0
IRC-6 155MB 168h 1,033,318 6,981 85 1
IRC-7 60MB 429h 393,185 717 209 0
IRC-8 707MB 1,010h 2,818,315 28,366 2,454 1
All-1 4.2GB 10m 4,706,803 14,475 1,625 0
All-2 6.2GB 10m 6,769,915 28,359 1,576 0
All-3 7.6GB 1h 16,523,826 331,706 1,717 0
All-4 15GB 1.4h 21,312,841 110,852 2,140 0
All-5 24.5GB 5h 43,625,604 406,112 2,601 0
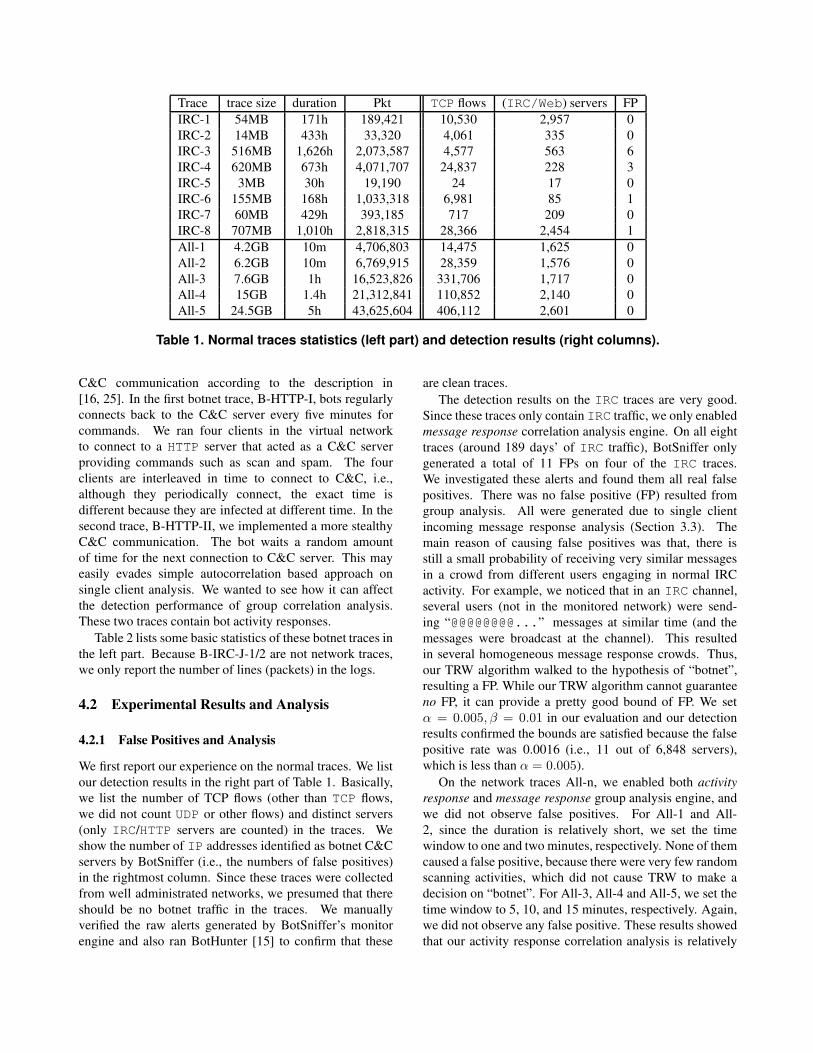
Table 1. Normal traces statistics (left part) and detection results (right columns).
C&C communication according to the description in
[16, 25]. In the first botnet trace, B-HTTP-I, bots regularly
connects back to the C&C server every five minutes for
commands. We ran four clients in the virtual network
to connect to a HTTP server that acted as a C&C server
providing commands such as scan and spam. The four
clients are interleaved in time to connect to C&C, i.e.,
although they periodically connect, the exact time is
different because they are infected at different time. In the
second trace, B-HTTP-II, we implemented a more stealthy
C&C communication. The bot waits a random amount
of time for the next connection to C&C server. This may
easily evades simple autocorrelation based approach on
single client analysis. We wanted to see how it can affect
the detection performance of group correlation analysis.
These two traces contain bot activity responses.
Table 2 lists some basic statistics of these botnet traces in
the left part. Because B-IRC-J-1/2 are not network traces,
we only report the number of lines (packets) in the logs.
4.2 Experimental Results and Analysis
4.2.1 False Positives and Analysis
We first report our experience on the normal traces. We list
our detection results in the right part of Table 1. Basically,
we list the number of TCP flows (other than TCP flows,
we did not count UDP or other flows) and distinct servers
(only IRC/HTTP servers are counted) in the traces. We
show the number of IP addresses identified as botnet C&C
servers by BotSniffer (i.e., the numbers of false positives)
in the rightmost column. Since these traces were collected
from well administrated networks, we presumed that there
should be no botnet traffic in the traces. We manually
verified the raw alerts generated by BotSniffer’s monitor
engine and also ran BotHunter [15] to confirm that these
are clean traces.
The detection results on the IRC traces are very good.
Since these traces only contain IRC traffic, we only enabled
message response correlation analysis engine. On all eight
traces (around 189 days’ of IRC traffic), BotSniffer only
generated a total of 11 FPs on four of the IRC traces.
We investigated these alerts and found them all real false
positives. There was no false positive (FP) resulted from
group analysis. All were generated due to single client
incoming message response analysis (Section 3.3). The
main reason of causing false positives was that, there is
still a small probability of receiving very similar messages
in a crowd from different users engaging in normal IRC
activity. For example, we noticed that in an IRC channel,
several users (not in the monitored network) were send-
ing “@@@@@@@@...” messages at similar time (and the
messages were broadcast at the channel). This resulted
in several homogeneous message response crowds. Thus,
our TRW algorithm walked to the hypothesis of “botnet”,
resulting a FP. While our TRW algorithm cannot guarantee
no FP, it can provide a pretty good bound of FP. We set
α = 0.005, β = 0.01 in our evaluation and our detection
results confirmed the bounds are satisfied because the false
positive rate was 0.0016 (i.e., 11 out of 6,848 servers),
which is less than α = 0.005).
On the network traces All-n, we enabled both activity
response and message response group analysis engine, and
we did not observe false positives. For All-1 and All-
2, since the duration is relatively short, we set the time
window to one and two minutes, respectively. None of them
caused a false positive, because there were very few random
scanning activities, which did not cause TRW to make a
decision on “botnet”. For All-3, All-4 and All-5, we set the
time window to 5, 10, and 15 minutes, respectively. Again,
we did not observe any false positive. These results showed
that our activity response correlation analysis is relatively
BotTrace trace size duration Pkt TCP flow Detected
B-IRC-G 950k 8h 4,447 189 Yes
B-IRC-J-1 - - 143,431 - Yes
B-IRC-J-2 - - 262,878 - Yes
V-Rbot 26MB 1,267s 347,153 103,425 Yes
V-Spybot 15MB 1,931s 180,822 147,921 Yes
V-Sdbot 66KB 533s 474 14 Yes
B-HTTP-I 6MB 3.6h 65,695 237 Yes
B-HTTP-II 37MB 19h 395,990 790 Yes
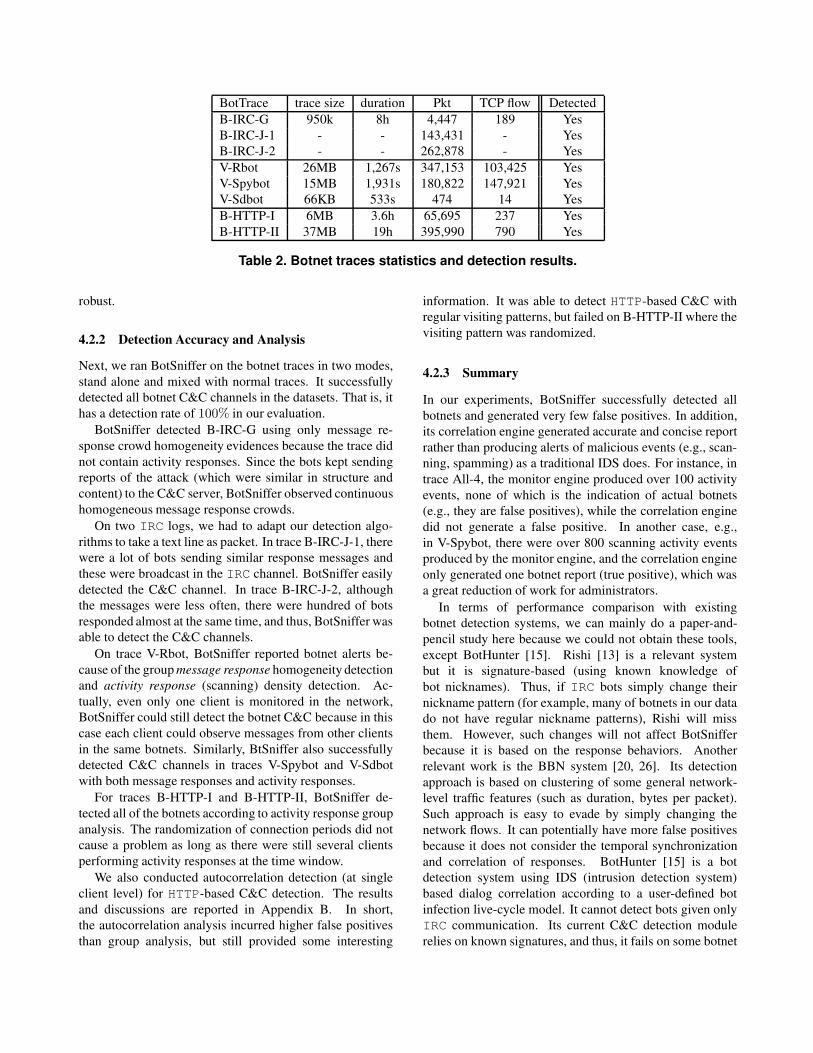
Table 2. Botnet traces statistics and detection results.
robust.
4.2.2 Detection Accuracy and Analysis
Next, we ran BotSniffer on the botnet traces in two modes,
stand alone and mixed with normal traces. It successfully
detected all botnet C&C channels in the datasets. That is, it
has a detection rate of 100% in our evaluation.
BotSniffer detected B-IRC-G using only message re-
sponse crowd homogeneity evidences because the trace did
not contain activity responses. Since the bots kept sending
reports of the attack (which were similar in structure and
content) to the C&C server, BotSniffer observed continuous
homogeneous message response crowds.
On two IRC logs, we had to adapt our detection algo-
rithms to take a text line as packet. In trace B-IRC-J-1, there
were a lot of bots sending similar response messages and
these were broadcast in the IRC channel. BotSniffer easily
detected the C&C channel. In trace B-IRC-J-2, although
the messages were less often, there were hundred of bots
responded almost at the same time, and thus, BotSniffer was
able to detect the C&C channels.
On trace V-Rbot, BotSniffer reported botnet alerts be-
cause of the group message response homogeneity detection
and activity response (scanning) density detection. Ac-
tually, even only one client is monitored in the network,
BotSniffer could still detect the botnet C&C because in this
case each client could observe messages from other clients
in the same botnets. Similarly, BtSniffer also successfully
detected C&C channels in traces V-Spybot and V-Sdbot
with both message responses and activity responses.
For traces B-HTTP-I and B-HTTP-II, BotSniffer de-
tected all of the botnets according to activity response group
analysis. The randomization of connection periods did not
cause a problem as long as there were still several clients
performing activity responses at the time window.
We also conducted autocorrelation detection (at single
client level) for HTTP-based C&C detection. The results
and discussions are reported in Appendix B. In short,
the autocorrelation analysis incurred higher false positives
than group analysis, but still provided some interesting
information. It was able to detect HTTP-based C&C with
regular visiting patterns, but failed on B-HTTP-II where the
visiting pattern was randomized.
4.2.3 Summary
In our experiments, BotSniffer successfully detected all
botnets and generated very few false positives. In addition,
its correlation engine generated accurate and concise report
rather than producing alerts of malicious events (e.g., scan-
ning, spamming) as a traditional IDS does. For instance, in
trace All-4, the monitor engine produced over 100 activity
events, none of which is the indication of actual botnets
(e.g., they are false positives), while the correlation engine
did not generate a false positive. In another case, e.g.,
in V-Spybot, there were over 800 scanning activity events
produced by the monitor engine, and the correlation engine
only generated one botnet report (true positive), which was
a great reduction of work for administrators.
In terms of performance comparison with existing
botnet detection systems, we can mainly do a paper-and-
pencil study here because we could not obtain these tools,
except BotHunter [15]. Rishi [13] is a relevant system
but it is signature-based (using known knowledge of
bot nicknames). Thus, if IRC bots simply change their
nickname pattern (for example, many of botnets in our data
do not have regular nickname patterns), Rishi will miss
them. However, such changes will not affect BotSniffer
because it is based on the response behaviors. Another
relevant work is the BBN system [20, 26]. Its detection
approach is based on clustering of some general network-
level traffic features (such as duration, bytes per packet).
Such approach is easy to evade by simply changing the
network flows. It can potentially have more false positives
because it does not consider the temporal synchronization
and correlation of responses. BotHunter [15] is a bot
detection system using IDS (intrusion detection system)
based dialog correlation according to a user-defined bot
infection live-cycle model. It cannot detect bots given only
IRC communication. Its current C&C detection module
relies on known signatures, and thus, it fails on some botnet
traces (e.g., B-IRC-G, B-HTTP-I). The anomaly based IRC
botnet detection system in [6] has the similar problem as
BotHunter. Without considering the group spatial-temporal
correlation and similarity, these systems may also have a
higher false positive rate than BotSniffer.
Although BotSniffer performed well in our evaluation, it
can fail to detect botnets in several cases. We next discuss
these issues and the possible solutions, as well as future
work on improving BotSniffer.
5 Discussion and Future Work
5.1 Possible Evasions and Solutions
Evasion by misusing the whitelist. If a botmaster knows
our hard whitelist, he may attempt to misuse these white
addresses. For example, he can use them as third-party
proxies for C&C purpose to bypass the detection of Bot-
Sniffer. However, as we discussed earlier, a whitelist is
not essential to BotSniffer and mainly serves to improve its
efficiency. Thus, whitelists can be removed to avoid such
evasions. In another evasion case, an adversary controlling
the C&C server may attempt to first behave normally and
trick BotSniffer to decide that the C&C server is a nor-
mal server and put the server address in the soft whitelist.
After that, the adversary begins to use the C&C server to
command the bots to perform real malicious activities. To
defeat this evasion, for each address being added to soft
whitelist, we can keep a random and short timer so that the
address will be removed when the timer expires. Thus, the
adversary’s evasion attempt will not succeed consistently.
Evasion by encryption. Botnets may still use known
protocols (IRC and HTTP) that BotSniffer can recognize,
but the botmasters can encrypt the communication content
to attempt to evade detection. First of all, this may only
mislead message response correlation analysis, but can-
not evade activity response correlation analysis. Second,
we can improve message response correlation analysis to
deal with encrypted traffic. For example, instead of using
simple DICE distance to calculate the similarity of two
messages, we can use information-theoretic metrics that
are relatively resilient to encryption, such as entropy, or
normalized compression distance (NCD [4, 28]), which is
based on Kolmogorov complexity.
Evading protocol matcher. Although botnets tend to
use existing common protocols to build their C&C, they
may use some obscure protocols or even create their own
protocols4. It is worth noting that “push” and “pull” are
4However, a brand new protocol itself is suspicious already. A botnet
could also exploit the implementation vulnerability of protocol matchers.
For example, if an IRC matcher only checks the first ten packets in a
connection to identify the existence of IRC keywords, the botmaster may
have these keywords occur after the first ten packets in order to evade this
the two representative C&C styles. Even when botnets use
other protocols, the spatial-temporal correlation and simi-
larity properties in “push” and “pull” will remain. Thus,
our detection algorithms can still be used after new pro-
tocol matchers are added. We are developing a generic
C&C-like protocol matcher that uses traffic features such
as BPP (bytes per packet), BPS (bytes per second), and
PPS (packet per second) [20, 26] instead of relying on
protocol keywords. This protocol matching approach is
based on the observation that there are generic patterns in
botnet C&C traffic regardless of the protocol being used.
For example, C&C traffic is typically low volume with
a just a few packets in a session and a few bytes in a
packet. Ultimately, to overcome the limitations of protocol
matching and protocol-specific detection techniques, we are
developing a next-generation botnet detection system that is
independent of the protocol and network structure used for
botnet C&C.
Evasion by using very long response delay. A botmaster
may command his bots to wait for a very long time (e.g.,
days or weeks) before performing message or malicious
activity response. In order to detect such bots using Bot-
Sniffer, we have to correlate IRC or HTTP connection
records and activity events within a relatively long time
window. In practice, we can perform correlation analysis
using multiple time windows (e.g., one hour, one day, one
week, etc.). However, we believe that if bots are forced
to use a very long response delay, the utility of the botnet
to botmaster is reduced or limited because the botmaster
can no longer command his bots promptly and reliably. For
example, the bot infected machines may be powered off or
disconnected from the Internet by the human users/owners
during the delay and become unavailable to the botmaster.
We can also use the analysis of activity response crowd
homogeneity (see Section 5.2) to defeat this evasion. For
example, if we can observe over a relatively long time
window that several clients are sending spam messages with
very similar contents, we may conclude that the clients are
part of a botnets.
Evasion by injecting random noise packet, injecting ran-
dom garbage in the packet, or using random response delay.
Injecting random noise packet and/or random garbage in a
packet may affect the analysis of message response crowd
homogeneity. However, it is unlikely to affect the activity
response crowd analysis as long as the bots still need to per-
form the required tasks. Using random message/activity re-
sponse delay may cause problems to the Response-Crowd-
Density-Check algorithm because there may not be suffi-
cient number of responses seen within a time window for
one round of TRW. However, the botmaster may lose the
reliability in controlling and coordinating the bots promptly
if random response delay is used. We can use a larger time
protocol matcher.
window to capture more responses. Similar to evasion by
long response delay discussed above, for evasion by random
response delay, a better solution is to use the analysis of
activity response crowd homogeneity (see Section 5.2).
In summary, although it is not perfect, BotSniffer greatly
enhances and complements the capabilities of existing bot-
net detection approaches. Further research is needed to
improve its effectiveness against the more advanced and
evasive botnets.
5.2 Improvements to BotSniffer
Activity response crowd homogeneity check. We have al-
ready discussed homogeneity analysis of message response
crowd in Section 3.2.2. We can perform similar check on
the homogeneity of activity response crowd. For instance,
for scanning activity, we consider two scans to be similar
if they have similar distribution or entropy of the target IP
addresses and similar ports. A similarity function of two
spam activities can be based on the number of common mail
servers being used, the number of spam messages being
sent, and the similarity of spam structure and content (e.g.,
the URLs in the messages). A similarity function of two bi-
nary downloading activities can be based on the byte value
distribution or entropy of the binary or binary string dis-
tance. By including Response-Crowd-Homogeneity-Check
on activity responses, in addition to the similar check on
message responses, we can improve the detection accuracy
of BotSniffer and its resilience to evasion.
Combine more features in analysis. As with other de-
tection problems, including more features can improve the
accuracy of a botnet detection algorithm. For example,
we can check whether there are any user-initiated queries,
e.g., WHO, WHOIS, LIST, and NAMES messages, in an IRC
channel. The intuition is that a bot is unlikely to use these
commands like a real user. To detect an IRC channel that
disables broadcast (as in the more recent botnets), we can
consider the message exchange ratio, defined as mi
mo, i.e.,
the ration between the number of incoming PRIVMSGmes-
sages (mi) and the number of outgoingPRIVMSGmessages
(mo). The intuition is that for a normal (broadcasting) IRC
channel, most likely there are multiple users/clients in the
chatting channel, and a user usually receives more messages
(from all other users) than he sends. On the other hand,
in the botnet case with broadcast disabled, the number of
incoming messages can be close to the number of outgoing
messages because a client cannot see/receive the messages
sent by other clients. The number of incoming messages
can also be smaller than the number of outgoing messages,
for example, when there are several packets/responses from
a bot corresponding to one botmaster command, or when
the botmaster is not currently on-line sending commands. In
addition, we can consider other group similarity measures
on traffic features, e.g., duration, bytes per second, and
packets per second.
Distributed deployment on Internet. Ideally, BotSniffer
deployment should be scalable, i.e., it should be able to
handle a large volume of traffic and cover a large range
of network addresses. We envision that BotSniffer can be
distributed in that many monitor sensors can be deployed in
distributed networks and report to a central repository that
also performs correlation and similarity analysis.
6 Related Work
Much of the research on botnets has been on gaining a
basic understanding of the botnet threats. Honeypot tech-
niques are widely used to collect and analyze bots [3, 22,
30]. Freiling et al. [30] used honeypots to study the problem
of botnets. Nepenthes [3] is a honeypot tool for auto-
matically harvesting malware samples directly from the
Internet. Rajab et al. [22] employed a longitudinal multi-
faceted approach to collect bots, track botnets, and provided
an in-depth study of botnet activities. Cooke et al. [9]
studied several basic dynamics of botnets. Dagon et al. [10]
studied the global diurnal behavior of botnets using DNS
based detection and sink-holing technique. Barford and
Yegneswaran [5] investigated the internals of bot instances
to examine the structural similarities, defense mechanisms,
and command and control capabilities of the major bot
families. Collins et al. [8] observed a relationship between
botnets and scanning/spamming activities.
There are also several very recent efforts on botnet de-
tection. Binkley and Singh [6] proposed to combine IRC
statistics and TCP work weight for detection of IRC-based
botnets. Rishi [13] is a signature-based IRC botnet detec-
tion system. Livadas et al. [20, 26] proposed a machine
learning based approach for botnet detection using some
general network-level traffic features. Karasaridis et al. [18]
studied network flow level detection of IRC botnet con-
trollers for backbone networks. SpamTracker[23] is a spam
filtering system using behavioral blacklisting to classify
email senders based on their sending behavior rather than
their identities. BotSniffer is different from all of the above
work. The novel idea in BotSniffer is to detect spatial-
temporal correlation and similarity patterns in network traf-
fic that are resulted from pre-programmed activities related
to botnet C&C. BotSniffer works for both IRC and HTTP
based botnets, and can be easily extended to include other
protocols; whereas previous systems mainly dealt with IRC
based botnets. Another recent work, BotHunter [15], is a
botnet detection system that uses IDS-driven dialog corre-
lation according to a user-defined bot infection live-cycle
model. Different from BotHunter’s “vertical” correlation
angle, which examines the behavior history of each distinct
host independently, BotSniffer provides a “horizontal” cor-
relation analysis across several hosts. In addition, BotSnif-
fer can be a very useful component, i.e., an anomaly based
C&C detector, for BotHunter.
7 Conclusion
Botnet detection is a relatively new and a very chal-
lenging research area. In this paper, we presented Bot-
Sniffer, a network anomaly based botnet detection system
that explores the spatial-temporal correlation and similarity
properties of botnet command and control activities. Our
detection approach is based on the intuition that since bots
of the same botnet run the same bot program, they are
likely to respond to the botmaster’s commands and conduct
attack/fraudulent activities in a similar fashion. BotSniffer
employs several correlation and similarity analysis algo-
rithms to examine network traffic, identifies the crowd of
hosts that exhibit very strong synchronization/correlation in
their responses/activities as bots of the same botnet. We
reported experimental evaluation of BotSniffer on many
real-world network traces, and showed that it has very
promising detection accuracy with very low false positive
rate. Our ongoing work involves improving the detection
accuracy of BotSniffer and its resilience to evasion, and
performing more evaluation and deploying BotSniffer in
the real-world. We are also developing a next-generation
detection system that is independent of the protocol and
network structure used for botnet C&C.
Acknowledgments
We would like to thank David Dagon, Fabian Monrose,
and Chris Lee for their help in providing some of the
evaluation data in our experiments. We also wish to thank
the anonymous reviewers for their insightful comments and
feedback. This material is based upon work supported in
part by the National Science Foundation under Grants CCR-
0133629, CNS-0627477, and CNS-0716570, and by the
U.S. Army Research Office under Grant W911NF0610042.
Any opinions, findings, and conclusions or recommenda-
tions expressed in this material are those of the author(s)
and do not necessarily reflect the views of the National
Science Foundation and the U.S. Army Research Office.
References
[1] Hi-performance protocol identification engine.
http://hippie.oofle.com/, 2007.
[2] Quick analysis of a proxy/zombie network. http://
lowkeysoft.com/proxy/client.php, 2007.
[3] P. Baecher, M. Koetter, T. Holz, M. Dornseif, and
F. Freiling. The nepenthes platform: An efficient
approach to collect malware. In Proceedings of Recent
Advances in Intrusion Detection, Hamburg, Septem-
ber 2006.
[4] M. Bailey, J. Oberheide, J. Andersen, M. Mao, F. Ja-
hanian, and J. Nazario. Automated classification and
analysis of internet malware. In Proceedings of Recent
Advances in Intrusion Detection (RAID’07), 2007.
[5] P. Barford and V. Yegneswaran. An Inside Look at
Botnets. Special Workshop on Malware Detection,
Advances in Information Security, Springer Verlag,
2006.
[6] J. R. Binkley and S. Singh. An algorithm for anomaly-
based botnet detection. In Proceedings of USENIX
Steps to Reducing Unwanted Traffic on the Internet
Workshop (SRUTI), pages 43–48, July 2006.
[7] C. Brew and D. McKelvie. Word-pair extraction for
lexicography, 1996.
[8] M. Collins, T. Shimeall, S. Faber, J. Janies, R. Weaver,
M. D. Shon, and J. Kadane. Using uncleanliness to
predict future botnet addresses,. In Proceedings of
the 2007 Internet MeasurementConference (IMC’07),
2007.
[9] E. Cooke, F. Jahanian, and D. McPherson. The zombie
roundup: Understanding, detecting, and disrupting
botnets. In Proceedings of Workshop on Steps to Re-
ducing Unwanted Traffic on the Internet (SRUTI’05),
2005.
[10] D. Dagon, C. Zou, and W. Lee. Modeling bot-
net propagation using timezones. In Proceedings of
Network and Distributed Security Symposium (NDSS
’06), January 2006.
[11] N. Daswani and M. Stoppelman. The anatomy of
clickbot.a. In USENIX Hotbots’07, 2007.
[12] M. H. Degroot and M. J. Schervish. Probability and
Statistics. Addison-Wesley, 2002.
[13] J. Goebel and T. Holz. Rishi: Identify bot contami-
nated hosts by irc nickname evaluation. In USENIX
Workshop on Hot Topics in Understanding Botnets
(HotBots’07), 2007.
[14] J. B. Grizzard, V. Sharma, C. Nunnery, B. B. Kang,
and D. Dagon. Peer-to-peer botnets: Overview and
case study. In USENIX Workshop on Hot Topics in
Understanding Botnets (HotBots’07), 2007.

[15] G. Gu, P. Porras, V. Yegneswaran, M. Fong, and
W. Lee. Bothunter: Detecting malware infection
through ids-driven dialog correlation. In 16th USENIX
Security Symposium (Security’07), 2007.
[16] N. Ianelli and A. Hackworth. Botnets as a vehi-
cle for online crime. http://www.cert.org/
archive/pdf/Botnets.pdf, 2005.
[17] J. Jung, V. Paxson, A. W. Berger, and H. Balakrishnan.
Fast Portscan Detection Using Sequential Hypothesis
Testing. In IEEE Symposium on Security and Privacy
2004, Oakland, CA, May 2004.
[18] A. Karasaridis, B. Rexroad, and D. Hoeflin. Wide-
scale botnet detection and characterization. In
USENIX Hotbots’07, 2007.
[19] R. Lemos. Bot software looks to improve
peerage. Http://www.securityfocus.com/
news/11390, 2006.
[20] C. Livadas, R. Walsh, D. Lapsley, and W. T. Strayer.
Using machine learning techniques to identify botnet
traffic. In 2nd IEEE LCN Workshop on Network
Security (WoNS’2006), 2006.
[21] M. Priestley. Spectral analysis and time series. Aca-
demic Press, 1982.
[22] M. Rajab, J. Zarfoss, F. Monrose, and A. Terzis.
A multi-faceted approach to understanding the bot-
net phenomenon. In Proceedings of ACM SIG-
COMM/USENIX Internet Measurement Conference,
Brazil, October 2006.
[23] A. Ramachandran, N. Feamster, and S. Vempala. Fil-
tering spam with behavioral blacklisting. In Proc.
ACM Conference on Computer and Communications
Security (CCS’07), 2007.
[24] M. Roesch. Snort - lightweight intrusion detection for
networks. In Proceedings of USENIX LISA’99, 1999.
[25] J. Stewart. Bobax trojan analysis. http:
//www.secureworks.com/research/
threats/bobax/, 2004.
[26] W. T. Strayer, R. Walsh, C. Livadas, and D. Lapsley.
Detecting botnets with tight command and control. In
31st IEEE Conference on Local Computer Networks
(LCN’06), 2006.
[27] A. Wald. Sequential Analysis. Dover Publications,
2004.
[28] S. Wehner. Analyzing worms and network traffic
using compression. Journal of Computer Security,
15(3):303–320, 2007.
[29] M. Xie, H. Yin, and H. Wang. An effective defense
against email spam laundering. In ACM Computer and
Communications Security (CCS’06), 2006.
[30] V. Yegneswaran, P. Barford, and V. Paxson. Using
honeynets for internet situational awareness. In Pro-
ceedings of the Fourth Workshop on Hot Topics in
Networks (HotNets IV), College Park, MD, November
2005.
[31] J. Zhuge, T. Holz, X. Han, J. Guo, and W. Zou. Char-
acterizing the irc-based botnet phenomenon. Peking
University & University of Mannheim Technical Re-
port, 2007.

A Analysis of the Similarity Probability of
Typing Similar Length Messages
In this section, we show the probability of typing twosimilar length (size) messages from two chatting users. Letus use the common assumption of Poisson distribution forthe length of messages typed by the user [12] at duration
T, P (X = i) = e−λ1T (λ1T )i
i! . Then for two independentusers, their joint distribution
P (X = i, Y = j) = P (x = i)P (y = j) = e−λ1T−λ2T (λ1T )i(λ1T )j
i!j!
And
P (|X − Y | <= δ)=
∑
i P (i, i) +∑
i P (i, i + 1)+... +
∑
i P (i, i + δ)+
∑
i P (i, i − 1) + ... +∑
i P (i, i − δ)
(1)
For example,
P (|X − Y | <= 1)=
∑
i P (i, i) +∑
i P (i, i + 1) +∑
i P (i, i − 1)
= e−λ1T−λ2T∑
i(λ1T )i(λ2T )i
(i!)2 (1 + λ2Ti+1 + i
λ2T)
(2)
Figure 6 illustrates the probability of having two sim-
ilar length messages from two different users at different
settings of λT , the average length of message a user types
during T . Figures 6(a) and (b) show the probabilities when
two messages have length difference within one character
and two characters, respectively. In general, this probability
will decrease quickly if the difference between λ1 and λ2
increases. Even if two users have the same λ, the probability
will also decrease (but slower than the previous case) with
the increase of λ. Since two independent users are likely
to have different λ values, the probability of typing similar
length messages for them is low. For example, if λ1T = 5and λ2T = 10, the probability P (|X − Y | <= 2) is only
around 0.24. If λ1T = 5 and λ2T = 20, this probability
will further decrease to 0.0044.
B HTTP-Based C&C AutoCorrelation Anal-
ysis (for a Single Client)
HTTP-based C&C does not require that the botmaster
directly interact with the bots. That is, the botmaster does
not need to be on-line all the time to instruct the bots.
Instead, the bots only need to periodically check the com-
mand file (or perform a set of inquiries) that is prepared and
maintained by the botmaster. We can identify such kind of
C&C by detecting a repeating and regular visiting pattern.
A simple approach is to count the variance of inter-arrival
time of outgoing packets. If the variance is small (i.e., close
to zero), we have a repeating and regular pattern. However,
this method is only suitable for the simplest case (i.e.,
with only one request per period). It cannot handle more
complex scenarios, e.g., when there are a set of queries per
period, or there are some noise packets sent (e.g., users
randomly visit the target by chance). In this section, we
introduce a new signal encoding and autocorrelation (or
self-correlation) approach that is able to handle the general
and complex scenarios.
B.1 Autocorrelation Analysis
A packet stream from a client to a target service
(identified by < ClientIP, ServerIP, ServerPort >)
is ~P = {P1, P2, ..., Pi, ...}, and each packet Pi can be
denoted as < ti, si >5, where ti is the timestamp when
the packet is sent, si is the packet payload size with a
direction sign (positive or negative, positive ”+” indicates
outgoing packet, negative ”-” indicates incoming packet).
Further more, we use a time window to abstract packet
stream within the window into a four-element vector
< OutPkt#, OutPktTotalSize, InPkt#, InPktTotalSize >, we
can get a time series signal Xi for every client i. To
illustrate the encoding scheme, we show an example.
Assume the client is silent in the first time window, and
in the second time window the client sends one packet
with payload size 70 and received two packets with a
total payload size of 100, and then becomes silent again
in the third time window. We can encode this series as
X = [0, 0, 0, 0, 1, 70,−2,−100, 0, 0, 0, 0].
Before introducing autocorrelation, we first introduce the
concept of correlation. In probability theory and statistics
[12], correlation, also called correlation coefficient, is an
indication of the strength of a linear relationship between
two random variables. For any pair of two random variables
Xi and Xj , the covariance is defined as cov(Xi, Xj) =E[(Xi−µi)(Xj−µj)] where µi and µj are the means of Xi
and Xj , respectively. The covariance measures how much
two random variables vary from each other. It is symmet-
rical, i.e., cov(Xi, Xj) = cov(Xj , Xi). The magnitude of
a covariance also depends on the standard deviation. Thus,
we can scale covariance to obtain a normalized correlation,
i.e., correlation coefficient, which serves as a more direct
indication of how two components co-vary. Denote σ as the
standard deviations (σ2 = E(X−µ)2 = E(X2)−E2(X)),we can calculate the correlation coefficient of two random
variables Xi, Xj as:
ρi,j =cov(Xi, Xj)
σiσj
=
∑
[(Xi − µi)(Xj − µj)]√
∑
(Xi − µi)2√
∑
(Xj − µj)2
5For simplicity, here we ignore the detailed payload content, and ignore
those packets without actual payload such as an ACK packet.
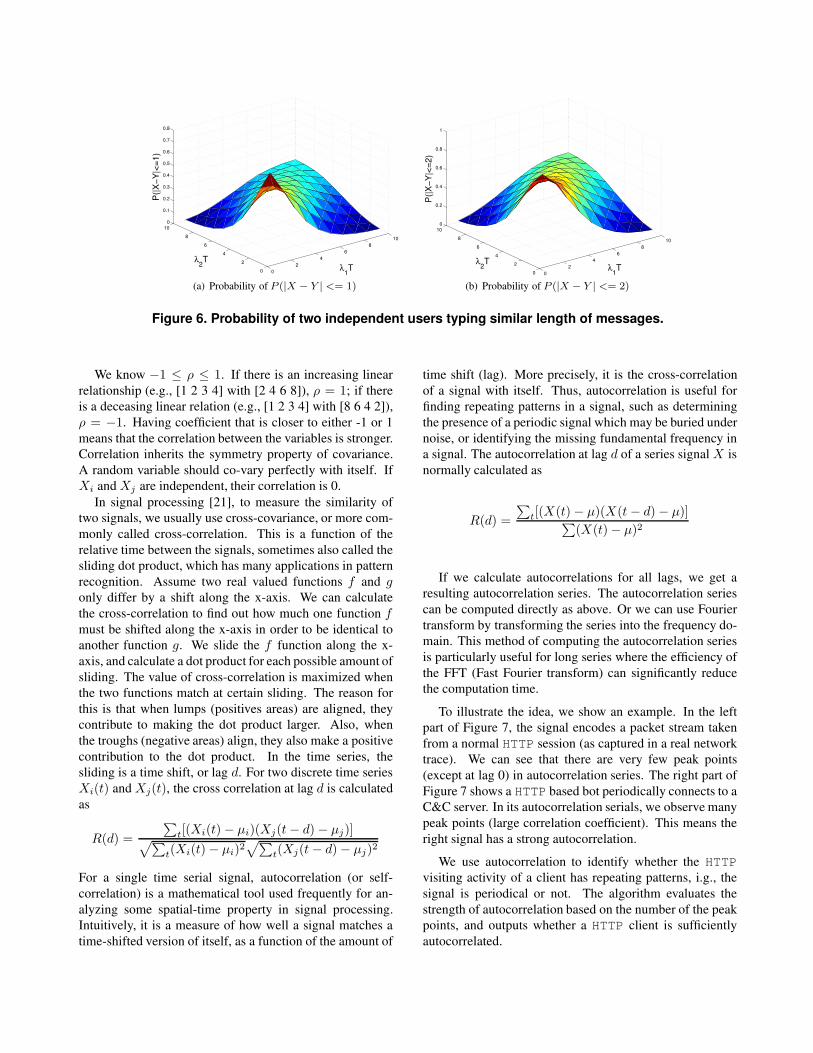
0
2
4
6
8
10
0
2
4
6
8
10
0
0.1
0.2
0.3
0.4
0.5
0.6
0.7
0.8
λ1T
λ2T
P(|
X−
Y|<
=1
)
(a) Probability of P (|X − Y | <= 1)
0
2
4
6
8
10
0
2
4
6
8
10
0
0.2
0.4
0.6
0.8
1
λ1T
λ2T
P(|
X−
Y|<
=2
)
(b) Probability of P (|X − Y | <= 2)
Figure 6. Probability of two independent users typing similar length of messages.
We know −1 ≤ ρ ≤ 1. If there is an increasing linear
relationship (e.g., [1 2 3 4] with [2 4 6 8]), ρ = 1; if there
is a deceasing linear relation (e.g., [1 2 3 4] with [8 6 4 2]),
ρ = −1. Having coefficient that is closer to either -1 or 1
means that the correlation between the variables is stronger.
Correlation inherits the symmetry property of covariance.
A random variable should co-vary perfectly with itself. If
Xi and Xj are independent, their correlation is 0.
In signal processing [21], to measure the similarity of
two signals, we usually use cross-covariance, or more com-
monly called cross-correlation. This is a function of the
relative time between the signals, sometimes also called the
sliding dot product, which has many applications in pattern
recognition. Assume two real valued functions f and g
only differ by a shift along the x-axis. We can calculate
the cross-correlation to find out how much one function f
must be shifted along the x-axis in order to be identical to
another function g. We slide the f function along the x-
axis, and calculate a dot product for each possible amount of
sliding. The value of cross-correlation is maximized when
the two functions match at certain sliding. The reason for
this is that when lumps (positives areas) are aligned, they
contribute to making the dot product larger. Also, when
the troughs (negative areas) align, they also make a positive
contribution to the dot product. In the time series, the
sliding is a time shift, or lag d. For two discrete time series
Xi(t) and Xj(t), the cross correlation at lag d is calculated
as
R(d) =
∑
t[(Xi(t) − µi)(Xj(t − d) − µj)]√
∑
t(Xi(t) − µi)2√
∑
t(Xj(t − d) − µj)2
For a single time serial signal, autocorrelation (or self-
correlation) is a mathematical tool used frequently for an-
alyzing some spatial-time property in signal processing.
Intuitively, it is a measure of how well a signal matches a
time-shifted version of itself, as a function of the amount of
time shift (lag). More precisely, it is the cross-correlation
of a signal with itself. Thus, autocorrelation is useful for
finding repeating patterns in a signal, such as determining
the presence of a periodic signal which may be buried under
noise, or identifying the missing fundamental frequency in
a signal. The autocorrelation at lag d of a series signal X is
normally calculated as
R(d) =
∑
t[(X(t) − µ)(X(t − d) − µ)]∑
(X(t) − µ)2
If we calculate autocorrelations for all lags, we get a
resulting autocorrelation series. The autocorrelation series
can be computed directly as above. Or we can use Fourier
transform by transforming the series into the frequency do-
main. This method of computing the autocorrelation series
is particularly useful for long series where the efficiency of
the FFT (Fast Fourier transform) can significantly reduce
the computation time.
To illustrate the idea, we show an example. In the left
part of Figure 7, the signal encodes a packet stream taken
from a normal HTTP session (as captured in a real network
trace). We can see that there are very few peak points
(except at lag 0) in autocorrelation series. The right part of
Figure 7 shows a HTTP based bot periodically connects to a
C&C server. In its autocorrelation serials, we observe many
peak points (large correlation coefficient). This means the
right signal has a strong autocorrelation.
We use autocorrelation to identify whether the HTTP
visiting activity of a client has repeating patterns, i.g., the
signal is periodical or not. The algorithm evaluates the
strength of autocorrelation based on the number of the peak
points, and outputs whether a HTTP client is sufficiently
autocorrelated.
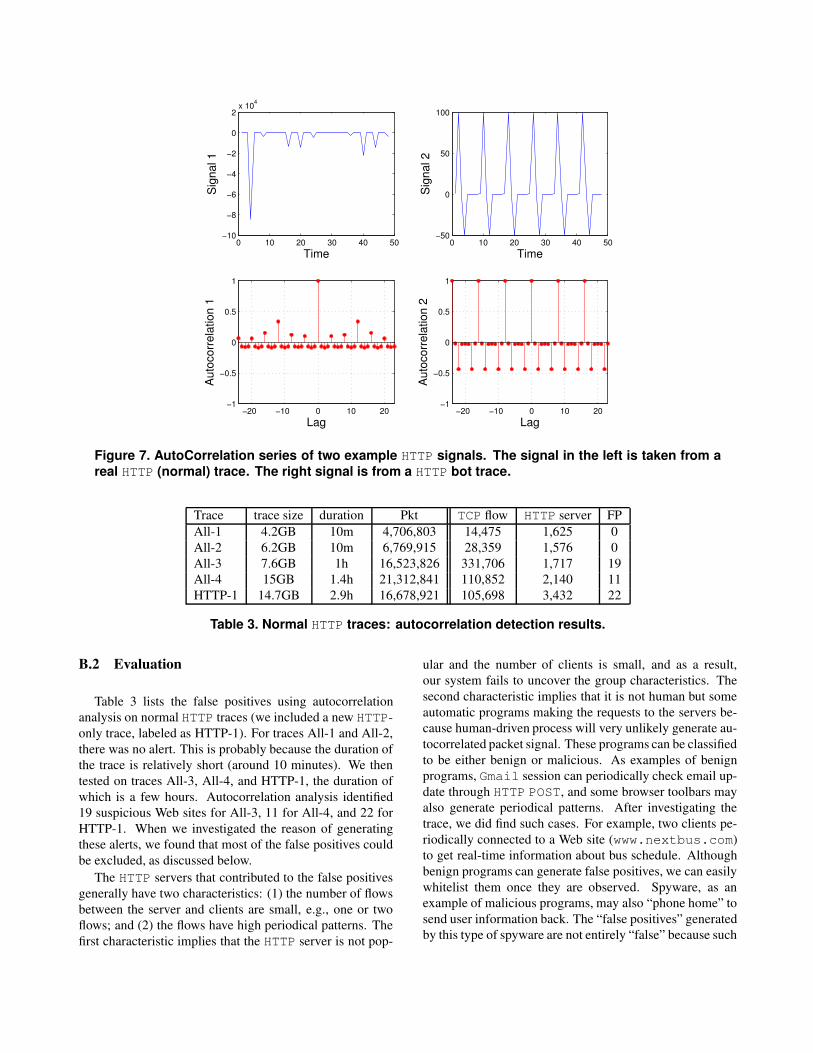
0 10 20 30 40 50−10
−8
−6
−4
−2
0
2x 10
4
Time
Sig
na
l 1
−20 −10 0 10 20−1
−0.5
0
0.5
1
Lag
Au
toco
rre
latio
n 1
0 10 20 30 40 50−50
0
50
100
Time
Sig
na
l 2
−20 −10 0 10 20−1
−0.5
0
0.5
1
LagA
uto
co
rre
latio
n 2
Figure 7. AutoCorrelation series of two example HTTP signals. The signal in the left is taken from a
real HTTP (normal) trace. The right signal is from a HTTP bot trace.
Trace trace size duration Pkt TCP flow HTTP server FP
All-1 4.2GB 10m 4,706,803 14,475 1,625 0
All-2 6.2GB 10m 6,769,915 28,359 1,576 0
All-3 7.6GB 1h 16,523,826 331,706 1,717 19
All-4 15GB 1.4h 21,312,841 110,852 2,140 11
HTTP-1 14.7GB 2.9h 16,678,921 105,698 3,432 22
Table 3. Normal HTTP traces: autocorrelation detection results.
B.2 Evaluation
Table 3 lists the false positives using autocorrelation
analysis on normal HTTP traces (we included a new HTTP-
only trace, labeled as HTTP-1). For traces All-1 and All-2,
there was no alert. This is probably because the duration of
the trace is relatively short (around 10 minutes). We then
tested on traces All-3, All-4, and HTTP-1, the duration of
which is a few hours. Autocorrelation analysis identified
19 suspicious Web sites for All-3, 11 for All-4, and 22 for
HTTP-1. When we investigated the reason of generating
these alerts, we found that most of the false positives could
be excluded, as discussed below.
The HTTP servers that contributed to the false positives
generally have two characteristics: (1) the number of flows
between the server and clients are small, e.g., one or two
flows; and (2) the flows have high periodical patterns. The
first characteristic implies that the HTTP server is not pop-
ular and the number of clients is small, and as a result,
our system fails to uncover the group characteristics. The
second characteristic implies that it is not human but some
automatic programs making the requests to the servers be-
cause human-driven process will very unlikely generate au-
tocorrelated packet signal. These programs can be classified
to be either benign or malicious. As examples of benign
programs, Gmail session can periodically check email up-
date through HTTP POST, and some browser toolbars may
also generate periodical patterns. After investigating the
trace, we did find such cases. For example, two clients pe-
riodically connected to a Web site (www.nextbus.com)
to get real-time information about bus schedule. Although
benign programs can generate false positives, we can easily
whitelist them once they are observed. Spyware, as an
example of malicious programs, may also “phone home” to
send user information back. The “false positives” generated
by this type of spyware are not entirely “false” because such
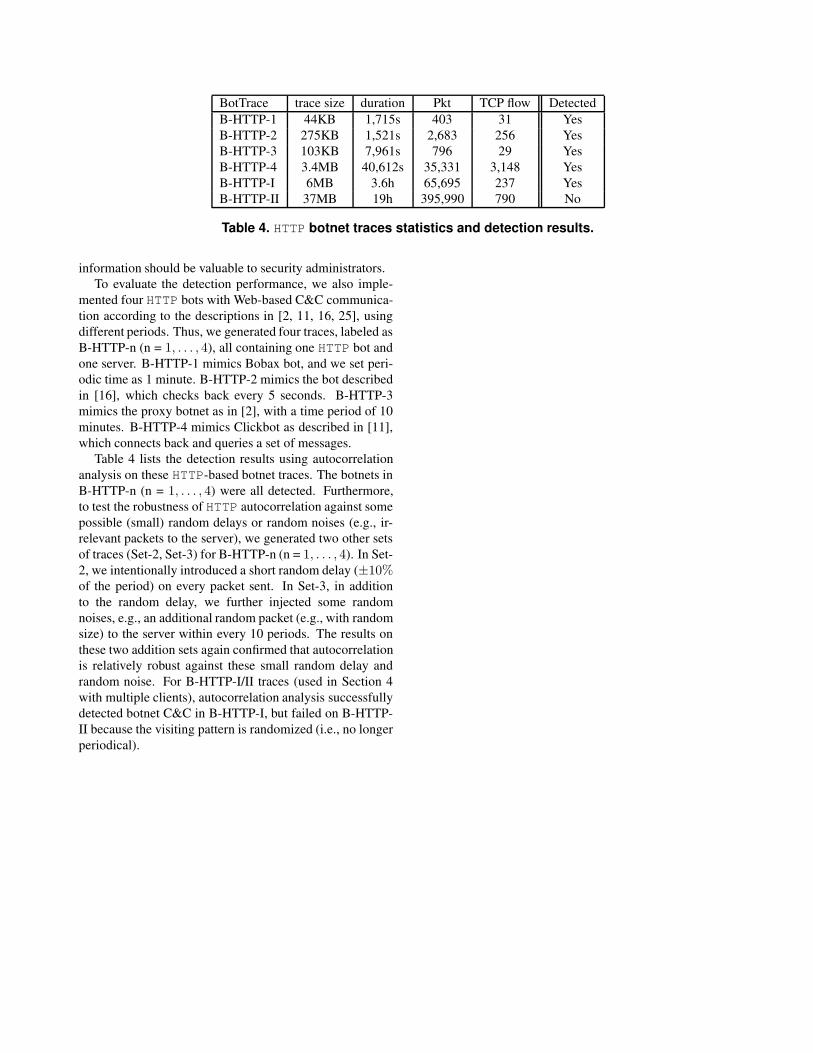
BotTrace trace size duration Pkt TCP flow Detected
B-HTTP-1 44KB 1,715s 403 31 Yes
B-HTTP-2 275KB 1,521s 2,683 256 Yes
B-HTTP-3 103KB 7,961s 796 29 Yes
B-HTTP-4 3.4MB 40,612s 35,331 3,148 Yes
B-HTTP-I 6MB 3.6h 65,695 237 Yes
B-HTTP-II 37MB 19h 395,990 790 No
Table 4. HTTP botnet traces statistics and detection results.
information should be valuable to security administrators.
To evaluate the detection performance, we also imple-
mented four HTTP bots with Web-based C&C communica-
tion according to the descriptions in [2, 11, 16, 25], using
different periods. Thus, we generated four traces, labeled as
B-HTTP-n (n = 1, . . . , 4), all containing one HTTP bot and
one server. B-HTTP-1 mimics Bobax bot, and we set peri-
odic time as 1 minute. B-HTTP-2 mimics the bot described
in [16], which checks back every 5 seconds. B-HTTP-3
mimics the proxy botnet as in [2], with a time period of 10
minutes. B-HTTP-4 mimics Clickbot as described in [11],
which connects back and queries a set of messages.
Table 4 lists the detection results using autocorrelation
analysis on these HTTP-based botnet traces. The botnets in
B-HTTP-n (n = 1, . . . , 4) were all detected. Furthermore,
to test the robustness of HTTP autocorrelation against some
possible (small) random delays or random noises (e.g., ir-
relevant packets to the server), we generated two other sets
of traces (Set-2, Set-3) for B-HTTP-n (n = 1, . . . , 4). In Set-
2, we intentionally introduced a short random delay (±10%of the period) on every packet sent. In Set-3, in addition
to the random delay, we further injected some random
noises, e.g., an additional random packet (e.g., with random
size) to the server within every 10 periods. The results on
these two addition sets again confirmed that autocorrelation
is relatively robust against these small random delay and
random noise. For B-HTTP-I/II traces (used in Section 4
with multiple clients), autocorrelation analysis successfully
detected botnet C&C in B-HTTP-I, but failed on B-HTTP-
II because the visiting pattern is randomized (i.e., no longer
periodical).